

CapitalWraith
79 Beiträge

CapitalWraith
Melden
Nutzer blockieren
Systematic Crypto Trader on Binance Futures & Spot. Quantifying macro trends via technical analysis. Risk management over hype. NFA. DYOR.
43 Following
10 Follower
7 Like gegeben
Beiträge
Übersetzung ansehen
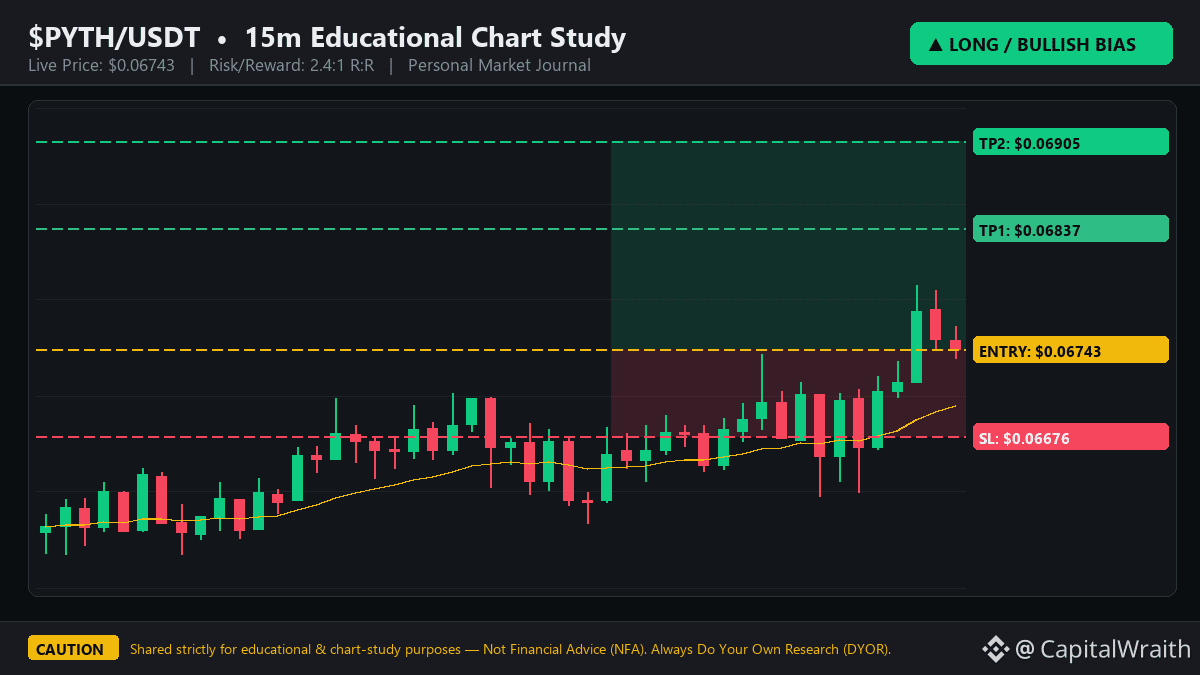
$PYTH is showing some life with a quick 5.4% pop, currently sitting at $0.06748. We are bumping our heads against resistance at $0.0685, and the floor is holding at $0.06647.
Here is the breakdown:
1. The Move: $PYTH is attempting a breakout, but volume needs to sustain to clear that $0.0685 ceiling.
2. Impact Severity: 4/10. It’s a decent scalp setup, but not a trend-reversal event yet.
3. Trade Caution: Don't get caught in the FOMO trap. Chasing green candles into liquidity pools is how accounts get liquidated. I’m staying patient.
4. Educational Suggestion: Instead of market buying, set a limit order near the $0.06647 support level. Let the market come to you rather than chasing the price.
5. Community Vote:
A) Buying the breakout now
B) Waiting for the $0.06647 retest
C) Staying on the sidelines
D) Shorting the resistance
⚠️ Caution: Educational price-action analysis only — Not Financial Advice (NFA). Always Do Your Own Research (DYOR).
#PYTH #DYOR #CryptoEducation #BinanceSquare
4
$BNB-Update:
Wir kennen alle die Geschichte: Laszlo Hanyecz tauschte 2010 10.000 $BTC gegen zwei Pizzen. Es ist eine legendäre warnende Geschichte, aber die meisten Trader übersehen die eigentliche Lektion. Es geht nicht nur ums „Halten“ – es geht um die psychologischen Kosten, die entstehen, wenn man auf Volatilität reagiert. Die Geschichte erinnert uns daran, den Blick aufs große Ganze zu richten, aber dein Gewinn und Verlust hängen davon ab, wie du mit dem Blick ins Detail umgehst.
Stellen wir deine Disziplin auf die Probe. Hier ist das heutige Handelsszenario:
Was ist der häufigste Fehler, den Kleinanleger bei einem plötzlichen Marktrückgang von 5 % machen?
A) Panikverkäufe genau am unteren Unterstützungsniveau und anschließend zu einem höheren Kurs beim grünen Rebound zurückkaufen
B) Geduldig auf die Bestätigung durch den Schluss einer 15-Minuten-Kerze warten und dabei eine enge Invalidierung festlegen
C) Den Wochenchart prüfen und die Positionsgrößen angemessen halten
D) Trailing-Stops setzen, um nicht realisierte Gewinne zu schützen
Schreib deine Wahl unten in die Kommentare. Mal sehen, wer tatsächlich einen Handelsplan hat und wer einfach nur zockt.
Achtung: Dieser Beitrag dient ausschließlich Bildungszwecken und stellt keine Finanzberatung dar. Die Märkte sind volatil; informiere dich immer selbst.
#BNB #DYOR #KryptoBildung #BinanceSquare
A) Panic-selling at the exac
B) Patiently waiting for a 1
C) Checking the weekly chart
D) Setting trailing stops to
23 Stunde(n) übrig
1
102
Übersetzung ansehen
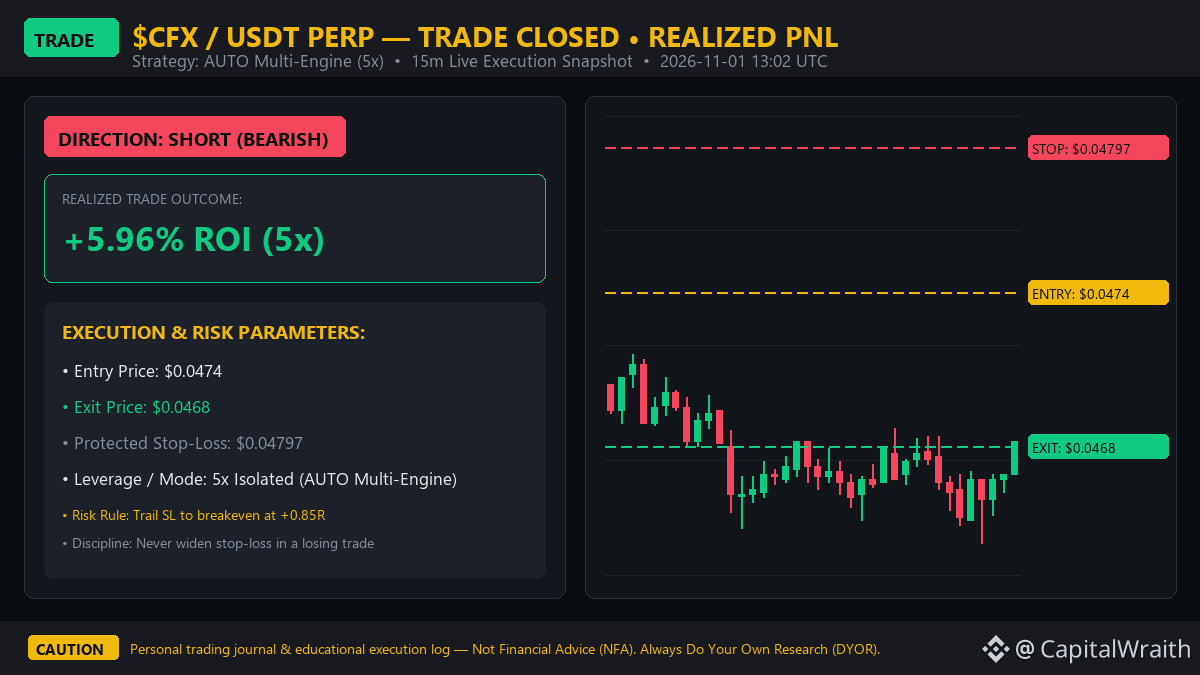
Trade Closed Recap — Locked in +5.96% ROI on $CFX SHORT (5x).
Just wrapped up the $CFX short. Entered at $0.0474 and took profit at $0.0468. The key here wasn't just the entry; it was trailing the stop-loss to $0.04797 once the momentum shifted in our favor. It’s easy to get greedy, but securing the win when the setup hits the target is what keeps the account growing.
Completed Trade Summary ($CFX):
• Action: TRADE CLOSED (SHORT 5x)
• Entry Price: $0.0474
• Exit Price: $0.0468
• Realized Result: +5.96% ROI
• Protected Stop-Loss Used: $0.04797
Educational Takeaway: Don't let a winning trade turn into a headache. Stick to your predefined exit levels. If the market gives you the move you anticipated, take the profit and reset. Greed is the fastest way to turn a green day into a red one.
Vote below — Did you catch this $CFX move today?
A) Caught the move & booked profit
B) Still holding for higher targets
C) Missed it — waiting for next setup
D) Watching another coin today
⚠️ Caution: Shared strictly as an educational trading journal recap — Not Financial Advice (NFA). Past performance does not guarantee future results; always Do Your Own Research (DYOR).
#CFX #DYOR #CryptoEducation #BinanceSquare
22
Hits TP2 ($0.004738) first
Hits TP1 ($0.004813) then ra
Retests SL ($0.005001)
Waiting on sidelines
22 Stunde(n) übrig
Übersetzung ansehen
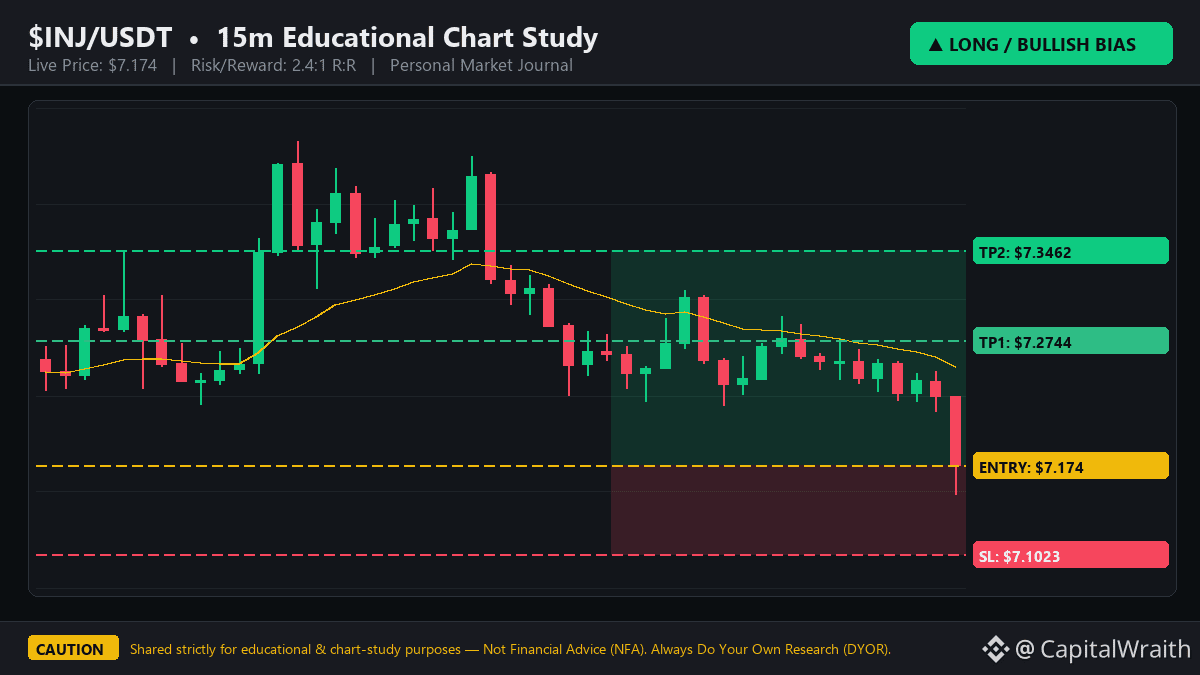
Stop trying to force a trade on $INJ right now.
I’m sitting on my hands, and here is why: While the top trader long ratio on Binance is sitting at 71.0%, the broader market is gripped by 'Fear.' This disconnect is exactly why we’re seeing this messy, sideways chop instead of a clean trend.
In this environment, the biggest risk isn't missing a pump—it’s getting chopped to pieces by overtrading in the middle of a range. I’m ignoring the noise and waiting for a definitive test of key support before I even consider deploying fresh capital.
Are you playing the range, or are you waiting for the dust to settle on a real breakout? Drop your gameplan below.
⚠️ Caution: For educational purposes only (NFA). Always Do Your Own Research (DYOR) before trading.
#INJ #DYOR #CryptoEducation #BinanceSquare
70
Übersetzung ansehen
Closed out a quick SHORT trade on $CFX: entered at $0.0474 and exited at $0.0465 (+8.96% ROI).
I was feeling bullish on this setup as buyers defended the support zone. Always prioritizing capital preservation and trailing stops into profit.
How are you trading $CFX today? What are your key levels? Let's discuss below.
⚠️ Caution: Personal trade journal shared for educational purposes only — Not Financial Advice (NFA). Always Do Your Own Research (DYOR).
#CFX #DYOR #CryptoEducation #BinanceSquare
Closed out a quick SHORT trade on $CFX : entered at $0.0474 and exited at $0.0465 (+8.96% ROI).
I was feeling bullish on this setup as buyers defended the support zone. Always prioritizing capital preservation and trailing stops into profit.
How are you trading $CFX today? What are your key levels? Let's discuss below.
⚠️ Caution: Personal trade journal shared for educational purposes only — Not Financial Advice (NFA). Always Do Your Own Research (DYOR).
#CFX #DYOR #CryptoEducation #BinanceSquare
28
Übersetzung ansehen
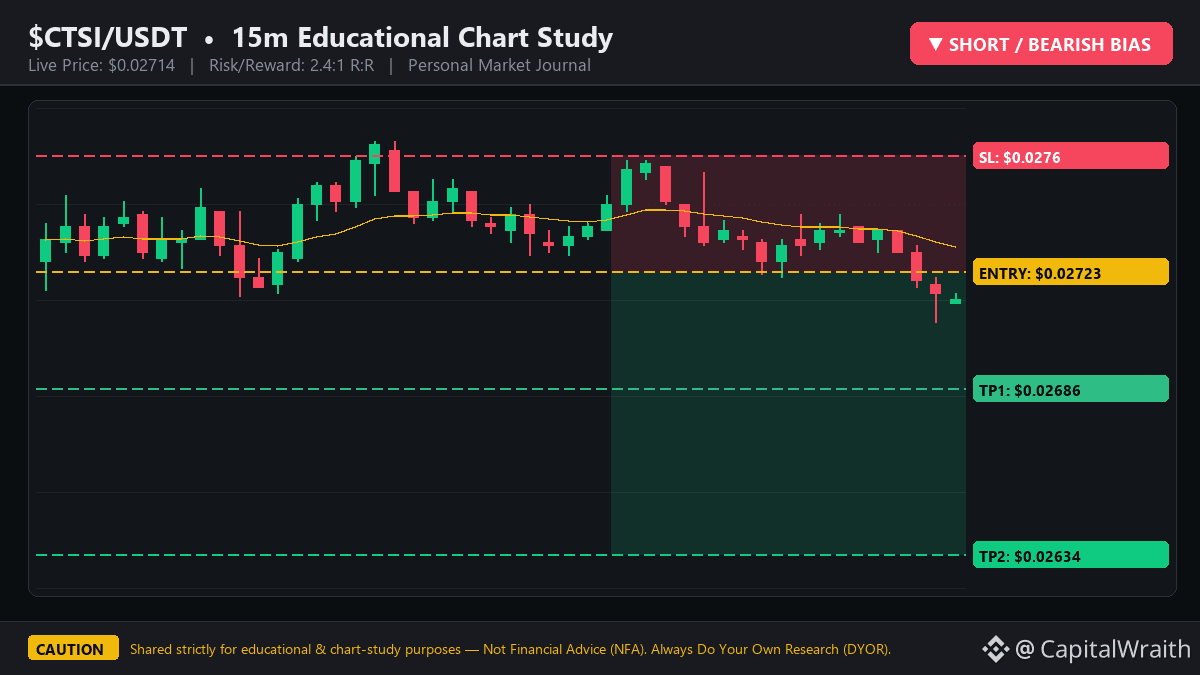
I’ve been watching $CTSI closely today, and the order flow is starting to look heavy. I’m currently eyeing a short setup at $0.02723.
Why? We’re seeing liquidity building up near $0.02756, and with support holding at $0.02707, a breakdown here could trigger a clean move to the downside. I’m keeping my risk tight with an invalidation point at $0.0276.
Here is how I’m mapping out the trade:
• Entry Zone: $0.02723
• Target 1: $0.02686
• Target 2: $0.02634
• Stop-Loss: $0.0276
This gives us a solid 2.4:1 reward-to-risk ratio if the momentum holds. I’m treating this as a pure technical study to see if the support level can actually hold under pressure.
Are you looking at $CTSI from the long side, or do you see the same weakness I do? Drop your thoughts below—let’s compare notes.
⚠️ Caution: Strictly for educational purposes — Not Financial Advice (NFA). Market conditions change rapidly; always Do Your Own Research (DYOR).
#CTSI #DYOR #CryptoEducation #BinanceSquare
6
Übersetzung ansehen
Breaking News & Trade Impact Breakdown on $BTC:
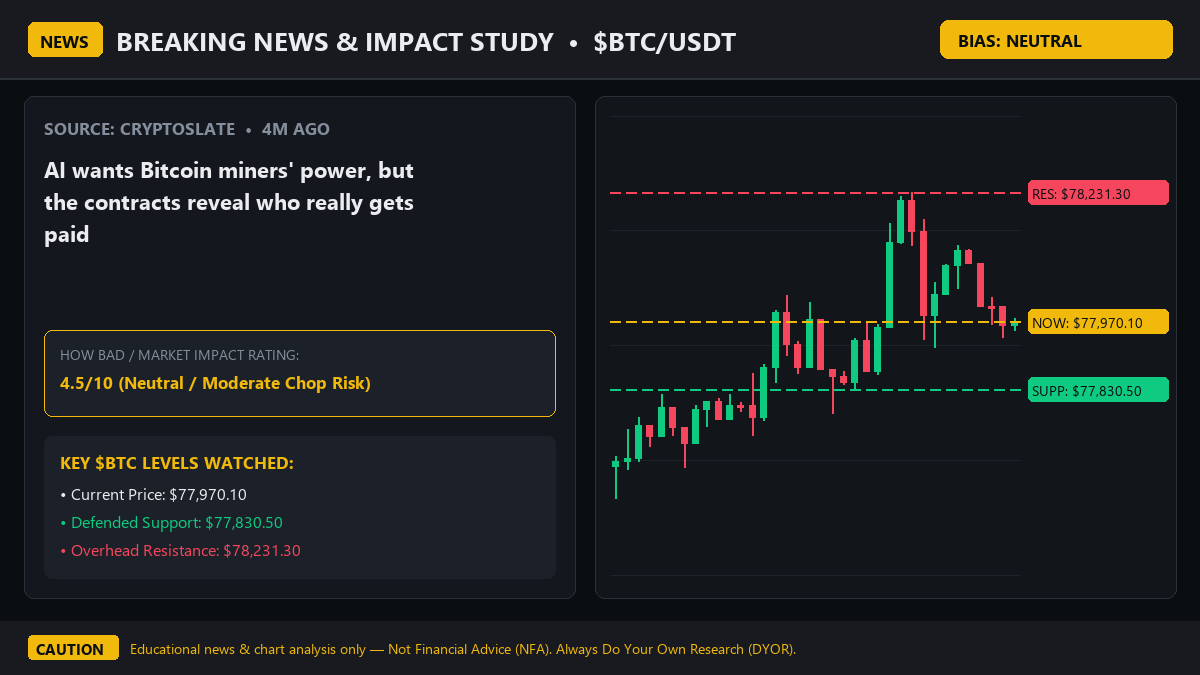
• What is the News: "AI wants Bitcoin miners' power, but the contracts reveal who really gets paid" (Source: CryptoSlate, 4m ago)
• How Bad Is It (Impact Rating): 4.5/10 (Neutral / Moderate Chop Risk)
Don't let the headlines rattle your conviction. This narrative is mostly noise—it’s adding friction to the order book without shifting the macro trend. Expect some volatility as the market hunts for liquidity on both sides of the range.
• Conclusion & Trade Caution:
I’m sitting on my hands for now. With $BTC hovering at $77,970.10, we are stuck in a tight squeeze between support at $77,830.50 and resistance at $78,231.30. Patience is the only edge that pays in this environment.
• Educational Suggestion:
Avoid the 'no-man's land' in the middle of this range. If you’re looking to enter, wait for a clean test of the $77,830.50 support or the $78,231.30 resistance. Keep your invalidation stop tight near $78,387.76 to protect your capital from a sudden breakout or fake-out.
Community Vote — How will $BTC react from $77,970.10?
A) Bearish — Drops to test lower support below $77,830.50
B) Priced in — Holds $77,830.50 and rebounds toward $78,231.30
C) Sideways chop & stop-hunt in both directions
D) Staying in cash until the chart confirms
Drop your vote (A, B, C, or D) in the comments and follow for daily real-time news & educational setups!
⚠️ Caution: Shared strictly for educational & informational purposes — Not Financial Advice (NFA). Always Do Your Own Research (DYOR) and manage your own risk.
#BTC #DYOR #CryptoEducation #BinanceSquare
Breaking News & Trade Impact Breakdown on $BTC :
• What is the News: "AI wants Bitcoin miners' power, but the contracts reveal who really gets paid" (Source: CryptoSlate, 4m ago)
• How Bad Is It (Impact Rating): 4.5/10 (Neutral / Moderate Chop Risk)
Don't let the headlines rattle your conviction. This narrative is mostly noise—it’s adding friction to the order book without shifting the macro trend. Expect some volatility as the market hunts for liquidity on both sides of the range.
• Conclusion & Trade Caution:
I’m sitting on my hands for now. With $BTC hovering at $77,970.10, we are stuck in a tight squeeze between support at $77,830.50 and resistance at $78,231.30. Patience is the only edge that pays in this environment.
• Educational Suggestion:
Avoid the 'no-man's land' in the middle of this range. If you’re looking to enter, wait for a clean test of the $77,830.50 support or the $78,231.30 resistance. Keep your invalidation stop tight near $78,387.76 to protect your capital from a sudden breakout or fake-out.
Community Vote — How will $BTC react from $77,970.10?
A) Bearish — Drops to test lower support below $77,830.50
B) Priced in — Holds $77,830.50 and rebounds toward $78,231.30
C) Sideways chop & stop-hunt in both directions
D) Staying in cash until the chart confirms
Drop your vote (A, B, C, or D) in the comments and follow for daily real-time news & educational setups!
⚠️ Caution: Shared strictly for educational & informational purposes — Not Financial Advice (NFA). Always Do Your Own Research (DYOR) and manage your own risk.
#BTC #DYOR #CryptoEducation #BinanceSquare
4
Übersetzung ansehen
I’ve been tracking $TIA closely today, and the price action is finally hitting a zone I’ve been watching. We’re seeing a reaction right around $0.48124, with a clear ceiling at $0.4827 and some solid defense at the $0.4758 support level.
I’m looking at a 2.4:1 risk-to-reward LONG setup here. Here is how I’m mapping it out:
• Entry Zone: $0.48124
• TP1: $0.48683
• TP2: $0.49483
• Stop Loss (SL): $0.47565
Trading discipline is everything: if we break below $0.47565, I’m out immediately to preserve capital. If we tag $0.48683, I’ll be moving my stop to breakeven to lock in a risk-free trade.
What’s your take? Do we push for $0.49483 first, or are we heading back to retest that $0.47565 support? Drop your chart analysis in the comments—I’m curious to see how you’re playing this.
⚠️ Caution: For educational & informational purposes only — Not Financial Advice (NFA). Always Do Your Own Research (DYOR) before making any trading decisions.
#TIA #DYOR #CryptoEducation #BinanceSquare
96
Übersetzung ansehen
$PUMP LONG Chart Breakdown — Key Levels & Risk Plan:
I’ve been scanning the charts today and $PUMP is showing a clean structural setup right around the $0.00426 mark. Instead of FOMOing into random candles, I’m looking at this 2.4R trade with a disciplined approach:
• Structure Bias: LONG near $0.00426
• TP1 Zone: $0.00429 (taking partials here to lock in gains)
• TP2 Zone: $0.00434 (targeting the upper liquidity sweep)
• Invalidation (SL): $0.00422 (strict stop—if we lose this, the setup is dead)
Trading is all about patience and waiting for the right confluence. It’s wild to think back to the early days of crypto—like when Dogecoin started as a 3-hour joke in 2013 and eventually hit an $80 billion market cap. It’s a reminder that market sentiment can shift faster than any technical indicator.
Which coin should I break down next? Drop your favorite ticker in the comments and let’s look at the charts together. Make sure to follow for daily trade setups and technical breakdowns.
⚠️ Caution: This post is a personal chart study for educational purposes only — Not Financial Advice (NFA). Always Do Your Own Research (DYOR) and trade responsibly.
#PUMP #DYOR #CryptoEducation #BinanceSquare
145
Übersetzung ansehen
Trading is 90% waiting for the right confluence. I’m currently tracking $AGT with a close eye on the $0.03075 level. With support holding firm at $0.03022 and a clear liquidity pocket forming near $0.03173, the setup is shaping up to be a clean 2.4:1 R/R play.
Here is how I’m mapping the levels in my journal:
• Entry Zone: $0.03075
• Target 1: $0.03182
• Target 2: $0.03335
• Stop-Loss / Invalidation: $0.02968
Save this study to see how price action respects these zones as the session progresses. I’m posting 1–10 setups like this daily—follow along if you’re looking to sharpen your technical execution. How does your chart look for $AGT right now? Drop your thoughts in the comments.
⚠️ Caution: Strictly for educational purposes — Not Financial Advice (NFA). Market conditions change rapidly; always Do Your Own Research (DYOR).
#AGT #DYOR #CryptoEducation #BinanceSquare
1
260
Ich beobachte $OP in letzter Zeit genau, und die Kursentwicklung beginnt endlich, meiner These zu entsprechen. Ich tendiere hier zu einer pessimistischen Einschätzung – das Setup entwickelt sich zu einem sauberen Chance-Risiko-Verhältnis von 2,4:1, sofern die Kursmarken halten.
So plane ich den Trade:
• Einstiegszone: $0.11431
• Ziel 1: $0.11298
• Ziel 2: $0.11199
• Stop-Loss: $0.1153
Ich beobachte die Unterstützung bei $0.11369 genau und behalte gleichzeitig den Liquiditätscluster bei etwa $0.11608 im Blick. Wenn wir die Unterstützung durchbrechen, rechne ich mit einer schnellen Bewegung in Richtung meiner Ziele. Wenn wir die Liquiditätszone zurückerobern, ist die Short-These hinfällig.
Wie handelt ihr $OP heute? Rechnet ihr mit einem Durchbruch nach unten oder wartet ihr auf eine Erholung? Lasst uns den Chart in den Kommentaren analysieren.
⚠️ Achtung: Ausschließlich zu Bildungszwecken – keine Finanzberatung (NFA). Die Marktbedingungen ändern sich schnell; betreibt immer eure eigene Recherche (DYOR).
#OP #DYOR #CryptoEducation #BinanceSquare
1
117
Übersetzung ansehen
Closed out a quick LONG trade on $OGN: entered at $0.0244 and exited at $0.0251 (+14.41% ROI).
I was feeling bullish on this setup as buyers defended the support zone. Always prioritizing capital preservation and trailing stops into profit.
How are you trading $OGN today? What are your key levels? Let's discuss below.
#OGN #CryptoTrading #Futures #BinanceSquare
Closed out a quick LONG trade on $OGN : entered at $0.0244 and exited at $0.0251 (+14.41% ROI).
I was feeling bullish on this setup as buyers defended the support zone. Always prioritizing capital preservation and trailing stops into profit.
How are you trading $OGN today? What are your key levels? Let's discuss below.
#OGN #CryptoTrading #Futures #BinanceSquare
I was feeling bullish on this setup as buyers defended the support zone. Always prioritizing capital preservation and trailing stops into profit.
How are you trading $OGN today? What are your key levels? Let's discuss below.
#OGN #CryptoTrading #Futures #BinanceSquare
Übersetzung ansehen
Two things keeping me glued to $ETH right now:
1. The L2 divergence: Base and Arbitrum are hitting absolute transaction ATHs, yet mainnet gas fees are staying eerily flat. Usually, that kind of activity forces a spike in base layer costs, but the current efficiency is keeping the ecosystem healthy.
2. Market structure: I’m leaning bullish. Every time we dip into local demand, the bids are getting swept up immediately. The market is currently in that 'boredom phase' where everyone is over-analyzing the macro, while the price is quietly building a base for the next leg up.
How are you playing the $ETH range this week? Accumulating or waiting for a breakout? Let’s hear it.
#ETH #TradingThoughts #BinanceSquare #Crypto
1
15
Übersetzung ansehen
Closed out a quick LONG trade on $OGN: entered at $0.0244 and exited at $0.0252 (+15.08% ROI).
I was feeling bullish on this setup as buyers defended the support zone. Always prioritizing capital preservation and trailing stops into profit.
How are you trading $OGN today? What are your key levels? Let's discuss below.
#OGN #CryptoTrading #Futures #BinanceSquare
Closed out a quick LONG trade on $OGN : entered at $0.0244 and exited at $0.0252 (+15.08% ROI).
I was feeling bullish on this setup as buyers defended the support zone. Always prioritizing capital preservation and trailing stops into profit.
How are you trading $OGN today? What are your key levels? Let's discuss below.
#OGN #CryptoTrading #Futures #BinanceSquare
I was feeling bullish on this setup as buyers defended the support zone. Always prioritizing capital preservation and trailing stops into profit.
How are you trading $OGN today? What are your key levels? Let's discuss below.
#OGN #CryptoTrading #Futures #BinanceSquare
4
Übersetzung ansehen
It’s wild to think Binance went from zero to the world’s largest exchange in under 180 days back in 2017. That kind of speed is rare, but it reminds me of how fast sentiment shifts in these markets. Speaking of speed, $ARB is testing my patience today. I’m seeing a bit of momentum building, but the weekend chop is real. I’m leaning bullish with a tight stop, but I’m curious if the market is just setting up a liquidity hunt before the real move. What’s your take? A) Continuation higher, B) Sideways snooze, C) Liquidity hunt, or D) Breakdown? Let’s hear it. #ARB #BinanceSquare #CryptoTrading
It’s wild to think Binance went from zero to the world’s largest exchange in under 180 days back in 2017. That kind of speed is rare, but it reminds me of how fast sentiment shifts in these markets. Speaking of speed, $ARB is testing my patience today. I’m seeing a bit of momentum building, but the weekend chop is real. I’m leaning bullish with a tight stop, but I’m curious if the market is just setting up a liquidity hunt before the real move. What’s your take? A) Continuation higher, B) Sideways snooze, C) Liquidity hunt, or D) Breakdown? Let’s hear it. #ARB #BinanceSquare #CryptoTrading
89
Einen schnellen LONG-Trade mit $OGN abgeschlossen: Einstieg bei $0.0244 und Ausstieg bei $0.0247 (+5.91 % ROI).
Bei diesem Setup war ich optimistisch, da die Käufer die Unterstützungszone verteidigten. Kapitalerhalt hat immer Priorität, und ich ziehe Stopps in den Gewinn nach.
Wie handelt ihr $OGN heute? Was sind eure wichtigen Kursmarken? Diskutiert unten mit.
#OGN #CryptoTrading #Futures #BinanceSquare
Bei diesem Setup war ich optimistisch, da die Käufer die Unterstützungszone verteidigten. Kapitalerhalt hat immer Priorität, und ich ziehe Stopps in den Gewinn nach.
Wie handelt ihr $OGN heute? Was sind eure wichtigen Kursmarken? Diskutiert unten mit.
#OGN #CryptoTrading #Futures #BinanceSquare
139
Übersetzung ansehen
Closed out a quick LONG trade on $PYTH: entered at $0.0660 and exited at $0.0670 (+7.53% ROI).
I was feeling bullish on this setup as buyers defended the support zone. Always prioritizing capital preservation and trailing stops into profit.
How are you trading $PYTH today? What are your key levels? Let's discuss below.
#PYTH #CryptoTrading #Futures #BinanceSquare
Closed out a quick LONG trade on $PYTH : entered at $0.0660 and exited at $0.0670 (+7.53% ROI).
I was feeling bullish on this setup as buyers defended the support zone. Always prioritizing capital preservation and trailing stops into profit.
How are you trading $PYTH today? What are your key levels? Let's discuss below.
#PYTH #CryptoTrading #Futures #BinanceSquare
I was feeling bullish on this setup as buyers defended the support zone. Always prioritizing capital preservation and trailing stops into profit.
How are you trading $PYTH today? What are your key levels? Let's discuss below.
#PYTH #CryptoTrading #Futures #BinanceSquare
121
Meine ehrliche Einschätzung zu $SOL aktuell: Ich bin vorsichtig optimistisch, obwohl die Retail-Echokammer auf X schreit, dass wir auf null zusteuern.
Schau dir die Divergenz an: Der Fear-&-Greed-Index liegt bei 34/100, während die Top-Trader-Konten auf Binance aktuell zu 72,9 % long positioniert sind. Das ist das klassische Setup: Wenn die Panik im Retail-Bereich ihren Höhepunkt erreicht, sammelt Smart Money an Unterstützungen meist gerade günstige Liquidität ein.
Lustigerweise schrieb Vitalik Buterin das Ethereum-Whitepaper mit 19, weil Blizzard seinen Lieblingszauber für den Hexenmeister in WoW abgeschwächt hatte. Trotz ist wirklich einer der am meisten unterschätzten Innovationstreiber in diesem Bereich.
Was mein Setup angeht, halte ich meine Invalidierungs-Stopps knapp unter den lokalen Swing-Tiefs. Verlieb dich nie in eine Position; wenn die These nicht mehr aufgeht, bin ich raus.
Was sagt dir dein Bauchgefühl zu $SOL , wenn wir auf den Handelsschluss zusteuern? Setzt du gegen die Angst oder wartest du auf tiefere Kurse? Zerreiß meine Einschätzung oder nenn unten deine Kursziele.
#SOL #Bitcoin #BinanceSquare #CryptoMarket
9
Übersetzung ansehen
Closed out a quick LONG trade on $LUMIA: entered at $0.0786 and exited at $0.0794 (+4.31% ROI).
I was feeling bullish on this setup as buyers defended the support zone. Always prioritizing capital preservation and trailing stops into profit.
How are you trading $LUMIA today? What are your key levels? Let's discuss below.
#LUMIA #CryptoTrading #Futures #BinanceSquare
Closed out a quick LONG trade on $LUMIA : entered at $0.0786 and exited at $0.0794 (+4.31% ROI).
I was feeling bullish on this setup as buyers defended the support zone. Always prioritizing capital preservation and trailing stops into profit.
How are you trading $LUMIA today? What are your key levels? Let's discuss below.
#LUMIA #CryptoTrading #Futures #BinanceSquare
I was feeling bullish on this setup as buyers defended the support zone. Always prioritizing capital preservation and trailing stops into profit.
How are you trading $LUMIA today? What are your key levels? Let's discuss below.
#LUMIA #CryptoTrading #Futures #BinanceSquare
1
Anmelden und weiter Inhalte entdecken
Krypto-Nutzer weltweit auf Binance Square kennenlernen
⚡️ Bleib in Sachen Krypto stets am Puls.
💬 Die weltgrößte Kryptobörse vertraut darauf.
👍 Erhalte verlässliche Einblicke von verifizierten Creators.
E-Mail-Adresse/Telefonnummer
Trendthemen
WithdrawalsBack: 15 networks live
202 Aufrufe
17 Kommentare
Binance News Update | Binance gibt Auszahlungen für BTC, ETH, USDT und weitere Assets auf 15 Netzwerken wieder frei und erreicht damit das Sonntagsziel
Binance News
·18 Likes
·8.1k Aufrufe
BinanceUpdatesProofofReservesAddresses
30,464 Aufrufe
703 Kommentare
BinanceToResumePhaseOneOfWithdrawals
62,317 Aufrufe
971 Kommentare