Binance Square

HM Hanip Mahmud

Crypto Market Analyst BTC • ETH • BNB Market Structure | Liquidity | Volatility Crypto News & Market Insights Learn • Analyze • Grow DYOR | Not
Trade eröffnen
Regelmäßiger Trader
1.9 Jahre
131 Following
102 Follower
64 Like gegeben
Beiträge
Portfolio
·
--
Übersetzung ansehen
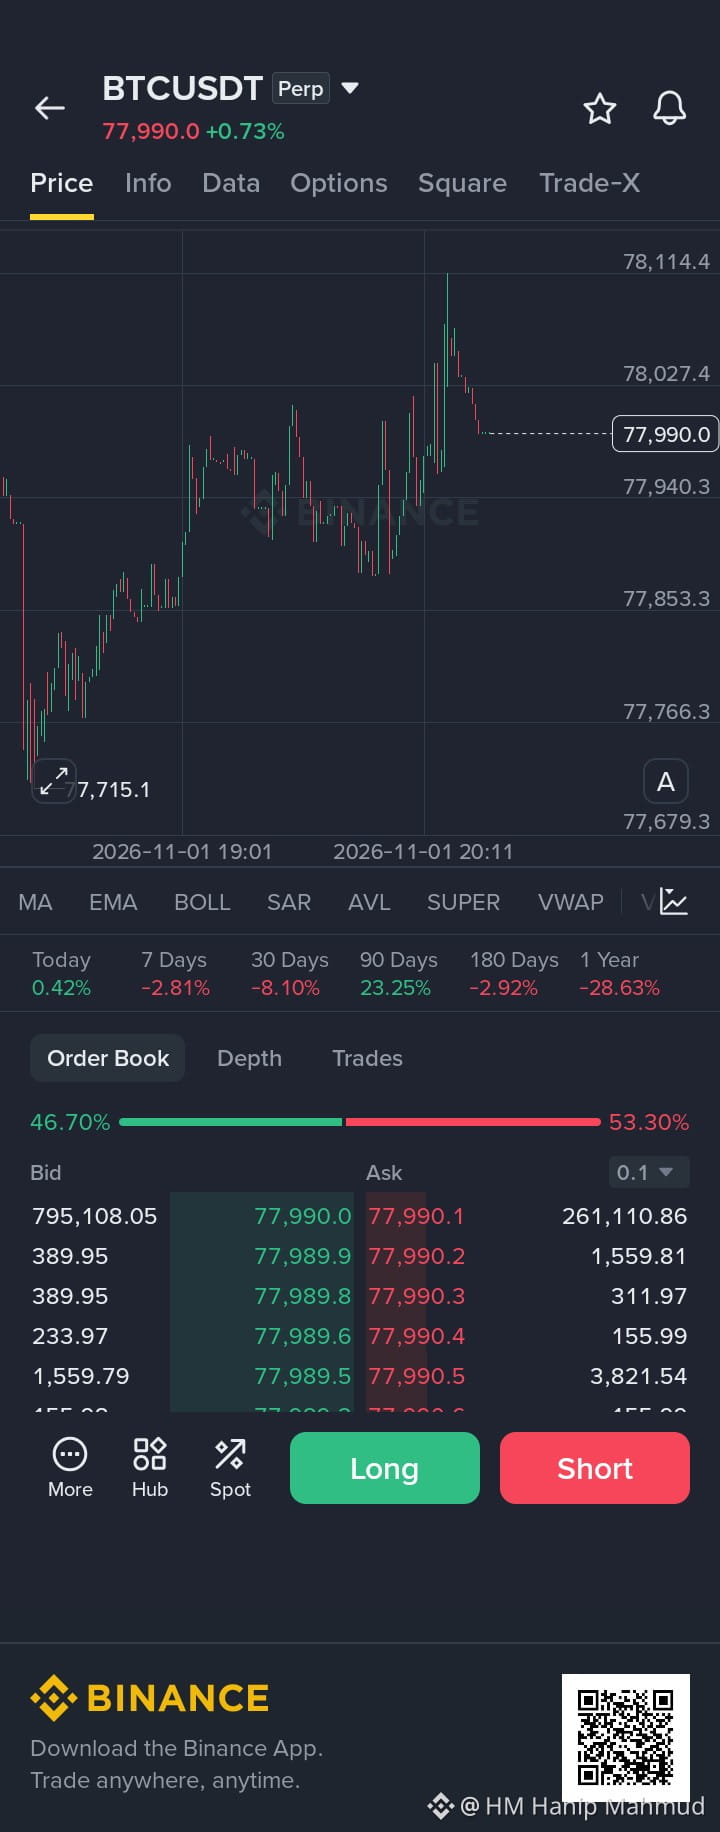
BTCUSDT – SELL Analysis 📉🙄🙄🙄🙄🙄🙄🙄
HM Hanip Mahmud
·
--
BTCUSDT – SELL-Analyse 📉
$BTC

Take-Profit 3 77,736
Erweitertes Ziel 77,450
Technische Analyse
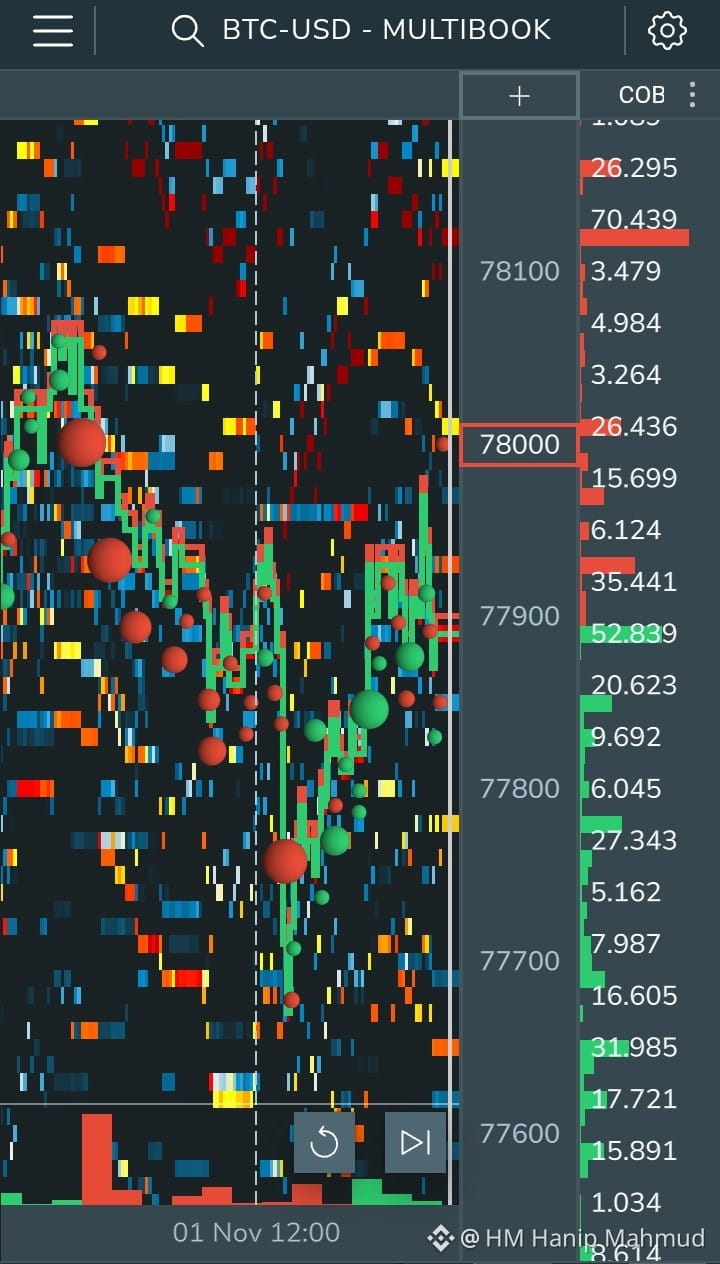
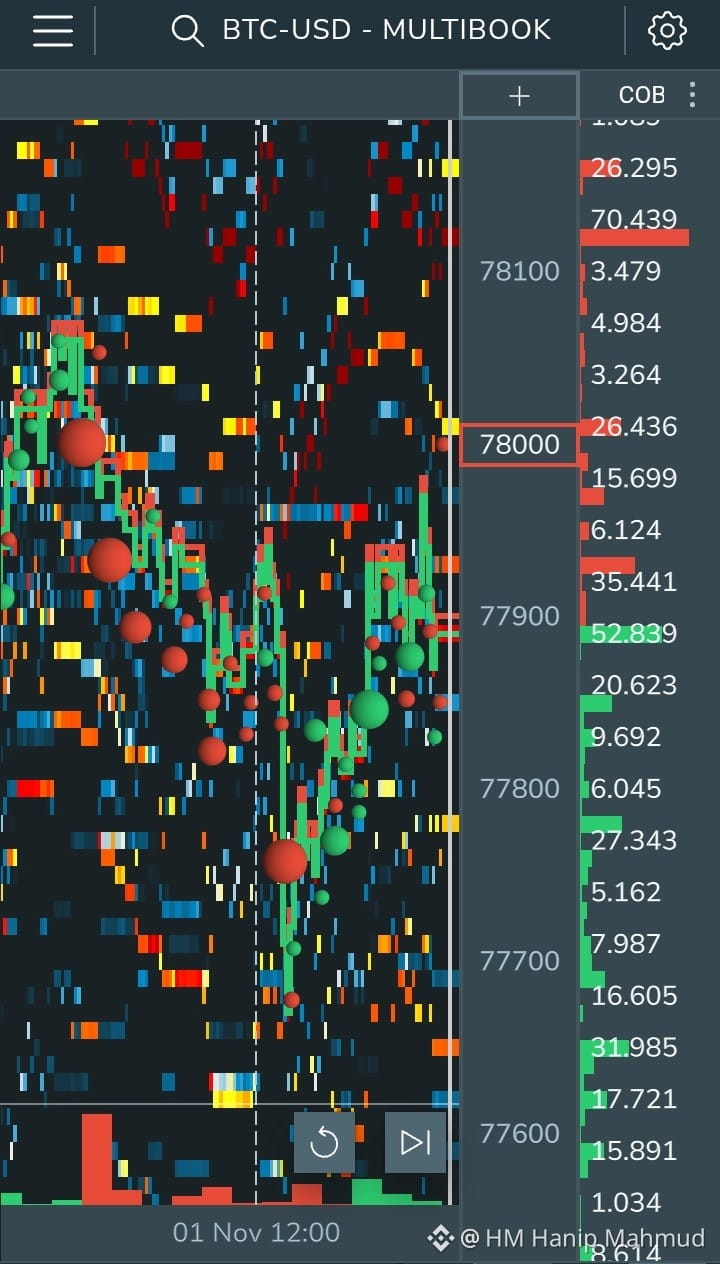
Der Kurs wurde an der Widerstandszone bei 78,000 abgewiesen.
Die Verkäufer üben in der Nähe des Widerstands Druck aus.
Ein Durchbruch unter 77,950 könnte die Abwärtsdynamik verstärken.
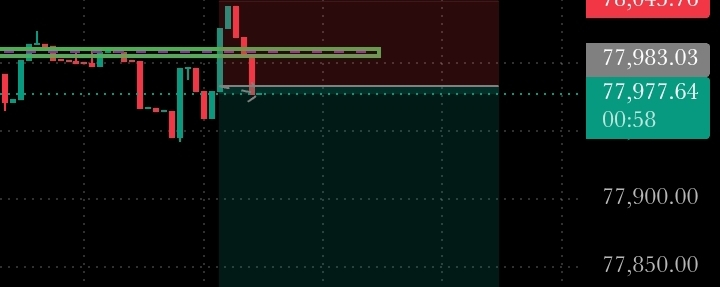
Ein starker Kerzenschluss über 78,046 macht dieses Short-Setup ungültig.
Handelsstrategie
Warte auf die Bestätigung durch eine bärische Kerze.
Steige im Bereich von 77,970–77,985 mit einer SELL-Position ein.
Setze den SL auf 78,046.
Ziehe bei jedem Ziel einen Teilgewinn in Betracht.
Dies ist ein 1-Minuten-Scalp-Setup. Warte auf eine Kerzenbestätigung und steige nicht unüberlegt ein.
Übersetzung ansehen
BTCUSDT – SELL Analysis 📉
HM Hanip Mahmud
·
--
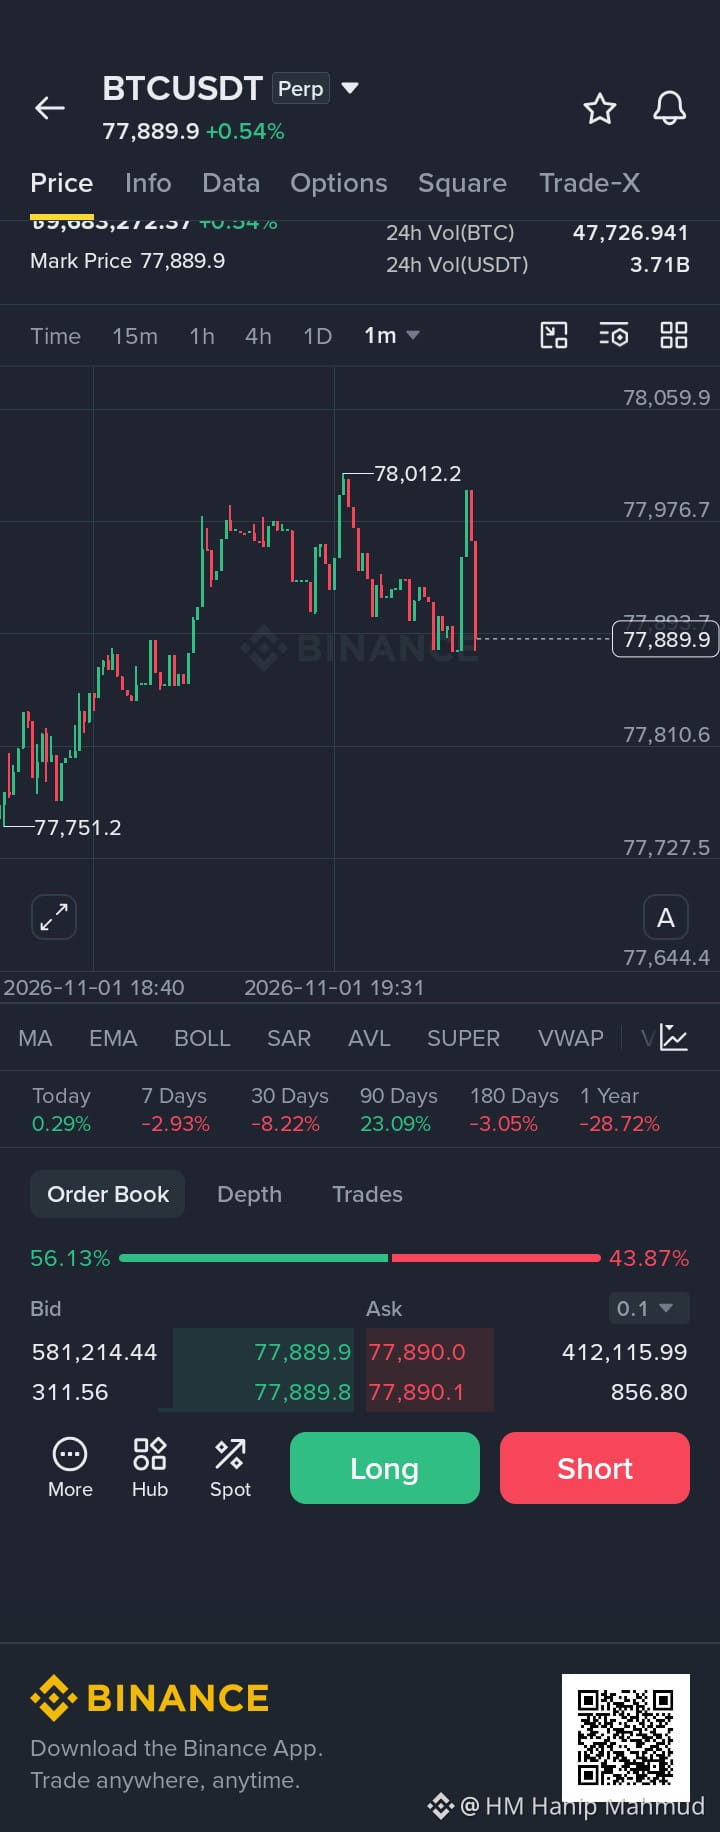
BTCUSDT – SELL-Analyse 📉
$BTC

Take-Profit 3 77,736
Erweitertes Ziel 77,450
Technische Analyse
Der Kurs wurde an der Widerstandszone bei 78,000 abgewiesen.
Die Verkäufer üben in der Nähe des Widerstands Druck aus.
Ein Durchbruch unter 77,950 könnte die Abwärtsdynamik verstärken.
Ein starker Kerzenschluss über 78,046 macht dieses Short-Setup ungültig.
Handelsstrategie
Warte auf die Bestätigung durch eine bärische Kerze.
Steige im Bereich von 77,970–77,985 mit einer SELL-Position ein.
Setze den SL auf 78,046.
Ziehe bei jedem Ziel einen Teilgewinn in Betracht.
Dies ist ein 1-Minuten-Scalp-Setup. Warte auf eine Kerzenbestätigung und steige nicht unüberlegt ein.
·
--
Bärisch
Übersetzung ansehen
HM Hanip Mahmud
·
--
BTCUSDT – SELL-Analyse 📉
$BTC

Take-Profit 3 77,736
Erweitertes Ziel 77,450
Technische Analyse
Der Kurs wurde an der Widerstandszone bei 78,000 abgewiesen.
Die Verkäufer üben in der Nähe des Widerstands Druck aus.
Ein Durchbruch unter 77,950 könnte die Abwärtsdynamik verstärken.
Ein starker Kerzenschluss über 78,046 macht dieses Short-Setup ungültig.
Handelsstrategie
Warte auf die Bestätigung durch eine bärische Kerze.
Steige im Bereich von 77,970–77,985 mit einer SELL-Position ein.
Setze den SL auf 78,046.
Ziehe bei jedem Ziel einen Teilgewinn in Betracht.
Dies ist ein 1-Minuten-Scalp-Setup. Warte auf eine Kerzenbestätigung und steige nicht unüberlegt ein.
·
--
Bärisch
Übersetzung ansehen
HM Hanip Mahmud
·
--
BTCUSDT – SELL-Analyse 📉
$BTC

Take-Profit 3 77,736
Erweitertes Ziel 77,450
Technische Analyse
Der Kurs wurde an der Widerstandszone bei 78,000 abgewiesen.
Die Verkäufer üben in der Nähe des Widerstands Druck aus.
Ein Durchbruch unter 77,950 könnte die Abwärtsdynamik verstärken.
Ein starker Kerzenschluss über 78,046 macht dieses Short-Setup ungültig.
Handelsstrategie
Warte auf die Bestätigung durch eine bärische Kerze.
Steige im Bereich von 77,970–77,985 mit einer SELL-Position ein.
Setze den SL auf 78,046.
Ziehe bei jedem Ziel einen Teilgewinn in Betracht.
Dies ist ein 1-Minuten-Scalp-Setup. Warte auf eine Kerzenbestätigung und steige nicht unüberlegt ein.
·
--
Artikel
BTCUSDT – SELL-Analyse 📉$BTC Take-Profit 3 77,736 Erweitertes Ziel 77,450 Technische Analyse Der Kurs wurde an der Widerstandszone bei 78,000 abgewiesen. Die Verkäufer üben in der Nähe des Widerstands Druck aus. Ein Durchbruch unter 77,950 könnte die Abwärtsdynamik verstärken. Ein starker Kerzenschluss über 78,046 macht dieses Short-Setup ungültig. Handelsstrategie Warte auf die Bestätigung durch eine bärische Kerze. Steige im Bereich von 77,970–77,985 mit einer SELL-Position ein. Setze den SL auf 78,046. Ziehe bei jedem Ziel einen Teilgewinn in Betracht. Dies ist ein 1-Minuten-Scalp-Setup. Warte auf eine Kerzenbestätigung und steige nicht unüberlegt ein.

BTCUSDT – SELL-Analyse 📉

$BTC

Take-Profit 3 77,736
Erweitertes Ziel 77,450
Technische Analyse
Der Kurs wurde an der Widerstandszone bei 78,000 abgewiesen.
Die Verkäufer üben in der Nähe des Widerstands Druck aus.
Ein Durchbruch unter 77,950 könnte die Abwärtsdynamik verstärken.
Ein starker Kerzenschluss über 78,046 macht dieses Short-Setup ungültig.
Handelsstrategie
Warte auf die Bestätigung durch eine bärische Kerze.
Steige im Bereich von 77,970–77,985 mit einer SELL-Position ein.
Setze den SL auf 78,046.
Ziehe bei jedem Ziel einen Teilgewinn in Betracht.
Dies ist ein 1-Minuten-Scalp-Setup. Warte auf eine Kerzenbestätigung und steige nicht unüberlegt ein.
Übersetzung ansehen
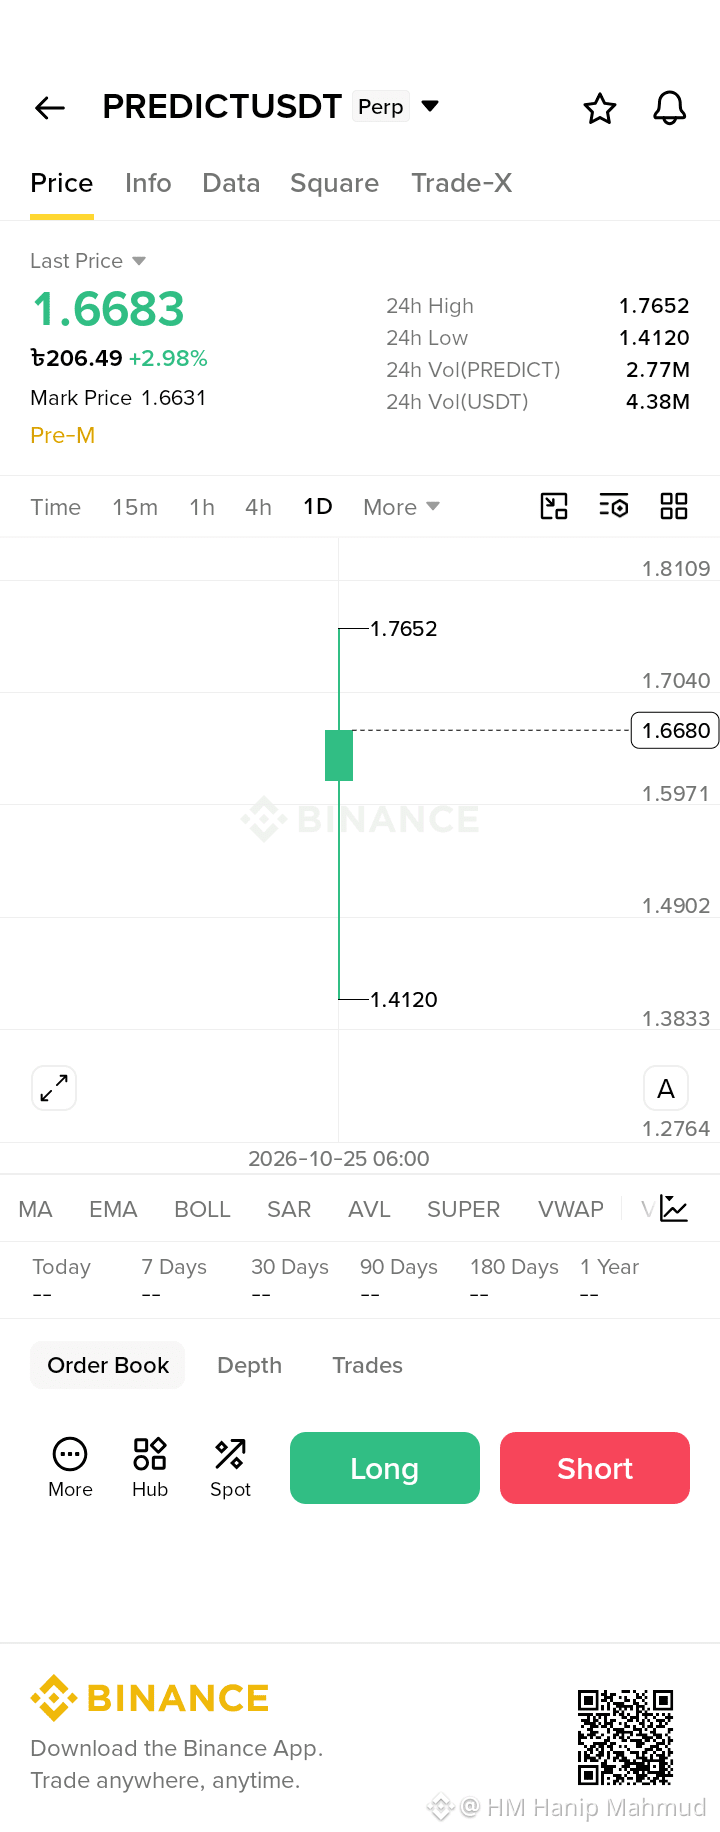
PREDICTUSDT⚠️⚠️ Short Analysis$PREDICT {future}(PREDICTUSDT) 📉 PREDICTUSDT Short Analysis Current Price: 1.6683 USDT 🔴 Resistance: 1.7000–1.7652 🎯 TP1: 1.6000 🎯 TP2: 1.5500 🎯 TP3: 1.4900 🛑 Stop-Loss: 1.7700 Trading Plan: Wait for bearish confirmation near resistance before considering a short position. A breakout above 1.7652 could invalidate the setup. ⚠️ Risk management is essential. This is a technical scenario, not a guaranteed prediction. Always do your own research. #PREDICT #CryptoAnalysis #BinanceSquare #TrendingTopic radingStrategy

PREDICTUSDT⚠️⚠️ Short Analysis

$PREDICT
📉 PREDICTUSDT Short Analysis
Current Price: 1.6683 USDT
🔴 Resistance: 1.7000–1.7652
🎯 TP1: 1.6000
🎯 TP2: 1.5500
🎯 TP3: 1.4900
🛑 Stop-Loss: 1.7700
Trading Plan: Wait for bearish confirmation near resistance before considering a short position. A breakout above 1.7652 could invalidate the setup.
⚠️ Risk management is essential. This is a technical scenario, not a guaranteed prediction. Always do your own research.
#PREDICT #CryptoAnalysis #BinanceSquare #TrendingTopic radingStrategy
Übersetzung ansehen
HM Hanip Mahmud
·
--
🔥 BTC Market Analysis: Is Bitcoin Preparing for a Rebound or Another Drop?
$BTC
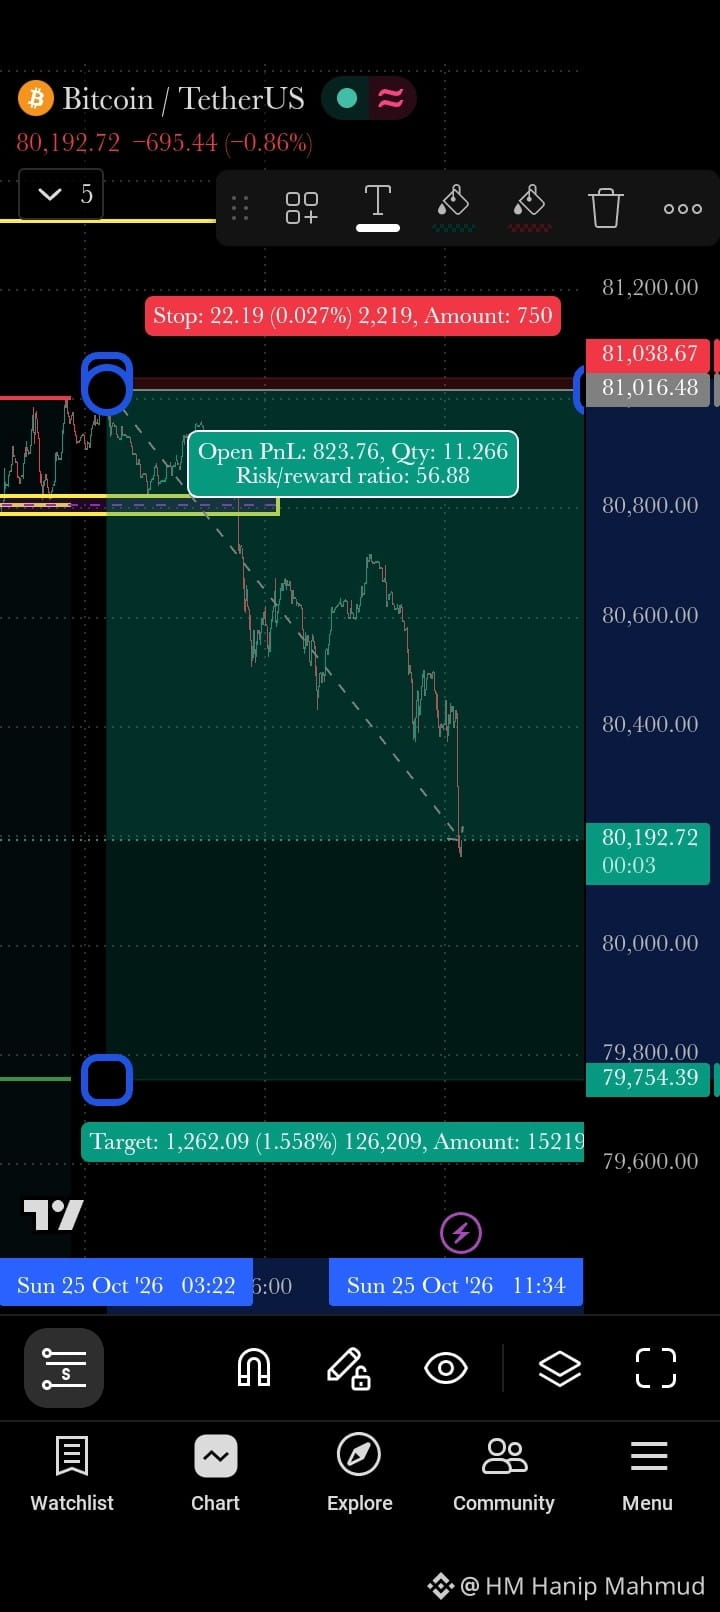
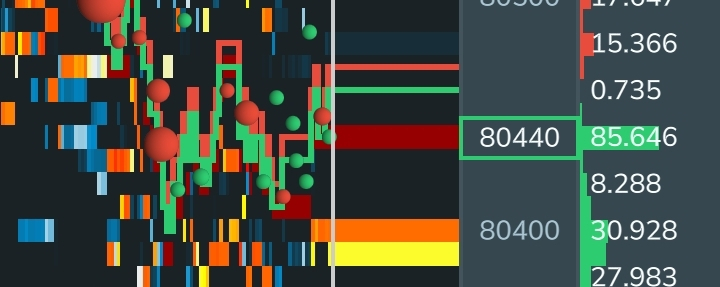
Bitcoin’s short-term price action is showing strong selling pressure, with recent movements highlighting a battle between buyers and sellers. The current order-flow chart provides useful clues about potential support and resistance zones.

📊 Key Market Observations

🔴 1. Selling Pressure
The chart shows a short-term downward move from higher price levels toward the 80,400 area. This suggests that sellers have recently maintained control, although a reversal is not confirmed.

🟢 2. Potential Support Zone
The 80,400–80,450 region is worth watching for signs of buying interest. If buyers defend this area and price forms a strong bullish reaction, BTC could attempt a short-term recovery.

🟡 3. Resistance to Watch
The 80,500–80,600 zone may act as an important resistance area. A strong move above this region, supported by buying volume, could improve the short-term bullish outlook.

📈 Bullish Scenario
If BTC holds support and breaks above nearby resistance with strong buying pressure, a recovery toward higher levels may develop.

📉 Bearish Scenario
If the price breaks below 80,400 and fails to reclaim the level, selling pressure could continue. Traders should watch for confirmation rather than entering based on a single candle.

🎯 My Trading View

For now, BTC requires confirmation before choosing a direction. I would monitor price reactions around support and resistance, along with volume and order-flow changes, before considering a trade.

⚠️ Risk Management: Always use a well-defined stop-loss, manage position size carefully, and avoid emotional trading. This analysis is based on the provided chart screenshot, not live market data.

💬 **What do you think? Will BTC bounce from support or continue moving downward? Share your analysis in the comments!

#Bitcoin #BTC #CryptoAnalysis #BinanceSquare #tradingStrategy
Übersetzung ansehen
🔥 BTC Market Analysis: Is Bitcoin Preparing for a Rebound or Another Drop? $BTC #EarningsSeason
🔥 BTC Market Analysis: Is Bitcoin Preparing for a Rebound or Another Drop?

$BTC #EarningsSeason
Artikel
Übersetzung ansehen
🔥 BTC Market Analysis: Is Bitcoin Preparing for a Rebound or Another Drop?$BTC Bitcoin’s short-term price action is showing strong selling pressure, with recent movements highlighting a battle between buyers and sellers. The current order-flow chart provides useful clues about potential support and resistance zones. 📊 Key Market Observations 🔴 1. Selling Pressure The chart shows a short-term downward move from higher price levels toward the 80,400 area. This suggests that sellers have recently maintained control, although a reversal is not confirmed. 🟢 2. Potential Support Zone The 80,400–80,450 region is worth watching for signs of buying interest. If buyers defend this area and price forms a strong bullish reaction, BTC could attempt a short-term recovery. 🟡 3. Resistance to Watch The 80,500–80,600 zone may act as an important resistance area. A strong move above this region, supported by buying volume, could improve the short-term bullish outlook. 📈 Bullish Scenario If BTC holds support and breaks above nearby resistance with strong buying pressure, a recovery toward higher levels may develop. 📉 Bearish Scenario If the price breaks below 80,400 and fails to reclaim the level, selling pressure could continue. Traders should watch for confirmation rather than entering based on a single candle. 🎯 My Trading View For now, BTC requires confirmation before choosing a direction. I would monitor price reactions around support and resistance, along with volume and order-flow changes, before considering a trade. ⚠️ Risk Management: Always use a well-defined stop-loss, manage position size carefully, and avoid emotional trading. This analysis is based on the provided chart screenshot, not live market data. 💬 **What do you think? Will BTC bounce from support or continue moving downward? Share your analysis in the comments! #Bitcoin #BTC #CryptoAnalysis #BinanceSquare #tradingStrategy

🔥 BTC Market Analysis: Is Bitcoin Preparing for a Rebound or Another Drop?

$BTC
Bitcoin’s short-term price action is showing strong selling pressure, with recent movements highlighting a battle between buyers and sellers. The current order-flow chart provides useful clues about potential support and resistance zones.
📊 Key Market Observations
🔴 1. Selling Pressure
The chart shows a short-term downward move from higher price levels toward the 80,400 area. This suggests that sellers have recently maintained control, although a reversal is not confirmed.
🟢 2. Potential Support Zone
The 80,400–80,450 region is worth watching for signs of buying interest. If buyers defend this area and price forms a strong bullish reaction, BTC could attempt a short-term recovery.
🟡 3. Resistance to Watch
The 80,500–80,600 zone may act as an important resistance area. A strong move above this region, supported by buying volume, could improve the short-term bullish outlook.
📈 Bullish Scenario
If BTC holds support and breaks above nearby resistance with strong buying pressure, a recovery toward higher levels may develop.
📉 Bearish Scenario
If the price breaks below 80,400 and fails to reclaim the level, selling pressure could continue. Traders should watch for confirmation rather than entering based on a single candle.
🎯 My Trading View
For now, BTC requires confirmation before choosing a direction. I would monitor price reactions around support and resistance, along with volume and order-flow changes, before considering a trade.
⚠️ Risk Management: Always use a well-defined stop-loss, manage position size carefully, and avoid emotional trading. This analysis is based on the provided chart screenshot, not live market data.
💬 **What do you think? Will BTC bounce from support or continue moving downward? Share your analysis in the comments!
#Bitcoin #BTC #CryptoAnalysis #BinanceSquare #tradingStrategy
BOTB/USDT — Verkaufsanalyse#Botb/Usd Basierend auf deinem Binance-Screenshot • 1-Minuten-Chart Aktueller Preis $23.11 24-Stunden-Hoch $23.45 24-Stunden-Tief $22.46 Kurzfristiger Trend Einstiegsplan für den Verkauf Kursniveau Verkaufseinstieg $23.08–$23.00, nach Bestätigung des Durchbruchs nach unten Stop-Loss (SL) $23.25–$23.32 Kursziel 1 (TP1) $22.90 Kursziel 2 (TP2) $22.71

BOTB/USDT — Verkaufsanalyse

#Botb/Usd
Basierend auf deinem Binance-Screenshot • 1-Minuten-Chart
Aktueller Preis $23.11
24-Stunden-Hoch $23.45
24-Stunden-Tief $22.46
Kurzfristiger Trend
Einstiegsplan für den Verkauf
Kursniveau
Verkaufseinstieg $23.08–$23.00, nach Bestätigung des Durchbruchs nach unten
Stop-Loss (SL) $23.25–$23.32
Kursziel 1 (TP1) $22.90
Kursziel 2 (TP2) $22.71
Übersetzung ansehen
🚀 The Future of Crypto: Why Blockchain Knowledge MattersThe cryptocurrency market is evolving rapidly, and blockchain technology is changing how people think about finance, digital ownership, and global transactions. 💡 Why Is Blockchain Important? Blockchain is a digital ledger that records transactions across a distributed network. It can help improve transparency, support secure recordkeeping, and enable innovative applications such as decentralized finance (DeFi) and smart contracts. 📈 3 Things Every Crypto Beginner Should Know 1️⃣ Education Comes First Before investing in any cryptocurrency, understand its purpose, technology, risks, and market conditions. 2️⃣ Risk Management Matters Crypto prices can be extremely volatile. Never invest money you cannot afford to lose, and avoid making decisions based only on hype. 3️⃣ Think Beyond Short-Term Prices Explore the real-world utility of blockchain projects, their development progress, and the problems they aim to solve. 🔥 My Vision as a Binance Square Creator I believe that sharing knowledge is one of the best ways to build a stronger crypto community. My goal is to publish educational content, explore blockchain innovations, and encourage meaningful discussions with fellow crypto enthusiasts. Remember: Knowledge builds confidence, research supports better decisions, and responsible investing helps manage risk. Let's learn, share, and grow together in the crypto world! 🌍 Follow HM Hanip Mahmud for more crypto insights and educational content. #BinanceSquare #Crypto #blockchain ain #CryptoEducation #Web3 #DeFi

🚀 The Future of Crypto: Why Blockchain Knowledge Matters

The cryptocurrency market is evolving rapidly, and blockchain technology is changing how people think about finance, digital ownership, and global transactions.
💡 Why Is Blockchain Important?
Blockchain is a digital ledger that records transactions across a distributed network. It can help improve transparency, support secure recordkeeping, and enable innovative applications such as decentralized finance (DeFi) and smart contracts.
📈 3 Things Every Crypto Beginner Should Know
1️⃣ Education Comes First
Before investing in any cryptocurrency, understand its purpose, technology, risks, and market conditions.
2️⃣ Risk Management Matters
Crypto prices can be extremely volatile. Never invest money you cannot afford to lose, and avoid making decisions based only on hype.
3️⃣ Think Beyond Short-Term Prices
Explore the real-world utility of blockchain projects, their development progress, and the problems they aim to solve.
🔥 My Vision as a Binance Square Creator
I believe that sharing knowledge is one of the best ways to build a stronger crypto community. My goal is to publish educational content, explore blockchain innovations, and encourage meaningful discussions with fellow crypto enthusiasts.
Remember: Knowledge builds confidence, research supports better decisions, and responsible investing helps manage risk.
Let's learn, share, and grow together in the crypto world! 🌍
Follow HM Hanip Mahmud for more crypto insights and educational content.
#BinanceSquare #Crypto #blockchain ain #CryptoEducation #Web3 #DeFi
Übersetzung ansehen
Let's Talk Crypto! 🚀#BTC走势分析 #BNB_Market_Update If you could hold only ONE cryptocurrency for the next 5 years, which would you choose? 🟠 BTC — Bitcoin 🔵 ETH — Ethereum 🟡 BNB — BNB 🟣 SOL — Solana 👇 Comment your choice and tell us WHY! Let's learn from each other and grow together as a crypto community. 🤝 ⚠️ This is a discussion, not financial advice. #Crypto #Bitcoin #Ethereum #BNB #Solana #BinanceSquare

Let's Talk Crypto! 🚀

#BTC走势分析 #BNB_Market_Update
If you could hold only ONE cryptocurrency for the next 5 years, which would you choose?
🟠 BTC — Bitcoin
🔵 ETH — Ethereum
🟡 BNB — BNB
🟣 SOL — Solana
👇 Comment your choice and tell us WHY!
Let's learn from each other and grow together as a crypto community. 🤝
⚠️ This is a discussion, not financial advice.
#Crypto #Bitcoin #Ethereum #BNB #Solana #BinanceSquare
Übersetzung ansehen
🌍 The Future of Crypto: What Comes Next?Blockchain technology continues to evolve, opening new possibilities in digital payments, decentralized finance, and tokenized assets. But which trend will have the biggest impact over the next few years? 🔹 Bitcoin adoption 🔹 AI + Blockchain 🔹 DeFi 🔹 Real-World Asset Tokenization 👇 Choose ONE trend and explain your opinion in the comments! Let's have a meaningful discussion. 🚀 #CryptoTrends #Blockchain #Bitcoin #DeFi #AI #BinanceSquare

🌍 The Future of Crypto: What Comes Next?

Blockchain technology continues to evolve, opening new possibilities in digital payments, decentralized finance, and tokenized assets.
But which trend will have the biggest impact over the next few years?
🔹 Bitcoin adoption
🔹 AI + Blockchain
🔹 DeFi
🔹 Real-World Asset Tokenization
👇 Choose ONE trend and explain your opinion in the comments!
Let's have a meaningful discussion. 🚀
#CryptoTrends #Blockchain #Bitcoin #DeFi #AI #BinanceSquare
Übersetzung ansehen
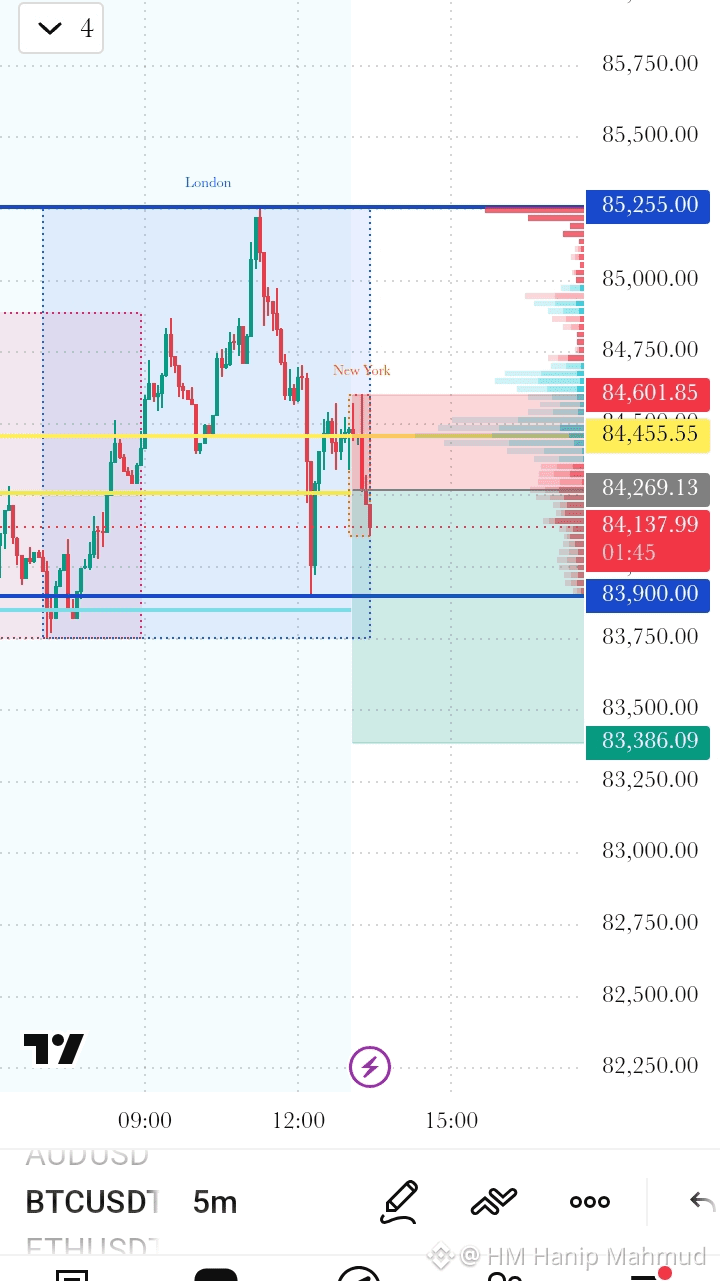
🔻 BTCUSDT — SELL SETUP Sell Entry: 84,250 – 84,450 Stop Loss: 84,650 TP1: 83,900 TP2: 83,600 TP3: 83,386 Entry Confirmation Price retests the 84,250–84,450 resistance zone Look for a 5M bearish rejection / bearish engulfing Enter SELL after confirmation ❌ Invalidation A strong 5M candle close above 84,600–84,650 invalidates the short setup. Risk: Max 1% per trade.$BTC {future}(BTCUSDT)
🔻 BTCUSDT — SELL SETUP
Sell Entry: 84,250 – 84,450
Stop Loss: 84,650
TP1: 83,900
TP2: 83,600
TP3: 83,386
Entry Confirmation
Price retests the 84,250–84,450 resistance zone
Look for a 5M bearish rejection / bearish engulfing
Enter SELL after confirmation
❌ Invalidation
A strong 5M candle close above 84,600–84,650 invalidates the short setup.
Risk: Max 1% per trade.$BTC
Artikel
Übersetzung ansehen
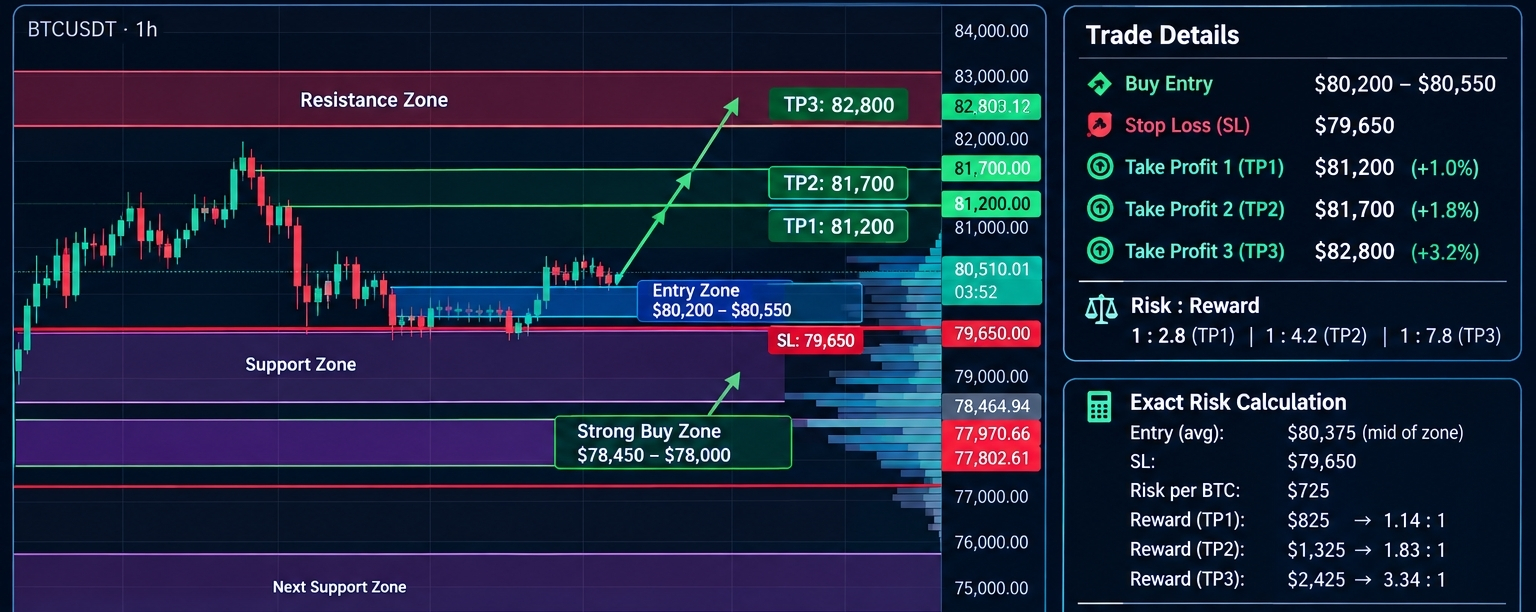
BTCUSDT 1H — BUY Setup 📈$BTC {future}(BTCUSDT) $ETH {future}(ETHUSDT) $SOL {future}(SOLUSDT) Current Price: ~$80,510 🟢 Buy Entry: $80,200 – $80,550 🛑 Stop Loss: $79,650 🎯 Take Profit: TP1: $81,200 TP2: $81,700 TP3: $82,800 🔥 Strong Buy Zone: $78,450 – $78,000 Look for a liquidity sweep + bullish reversal before entering. Confirmation: 1H bullish rejection / engulfing candle around the entry zone. ⚠️ Invalidation: 1H close below $79,650 → cancel the BUY setup. Risk: Keep risk around 1% per trade.

BTCUSDT 1H — BUY Setup 📈

$BTC
$ETH
$SOL

Current Price: ~$80,510
🟢 Buy Entry: $80,200 – $80,550
🛑 Stop Loss: $79,650
🎯 Take Profit:
TP1: $81,200
TP2: $81,700
TP3: $82,800
🔥 Strong Buy Zone: $78,450 – $78,000
Look for a liquidity sweep + bullish reversal before entering.
Confirmation: 1H bullish rejection / engulfing candle around the entry zone.
⚠️ Invalidation: 1H close below $79,650 → cancel the BUY setup.
Risk: Keep risk around 1% per trade.
Artikel
Übersetzung ansehen
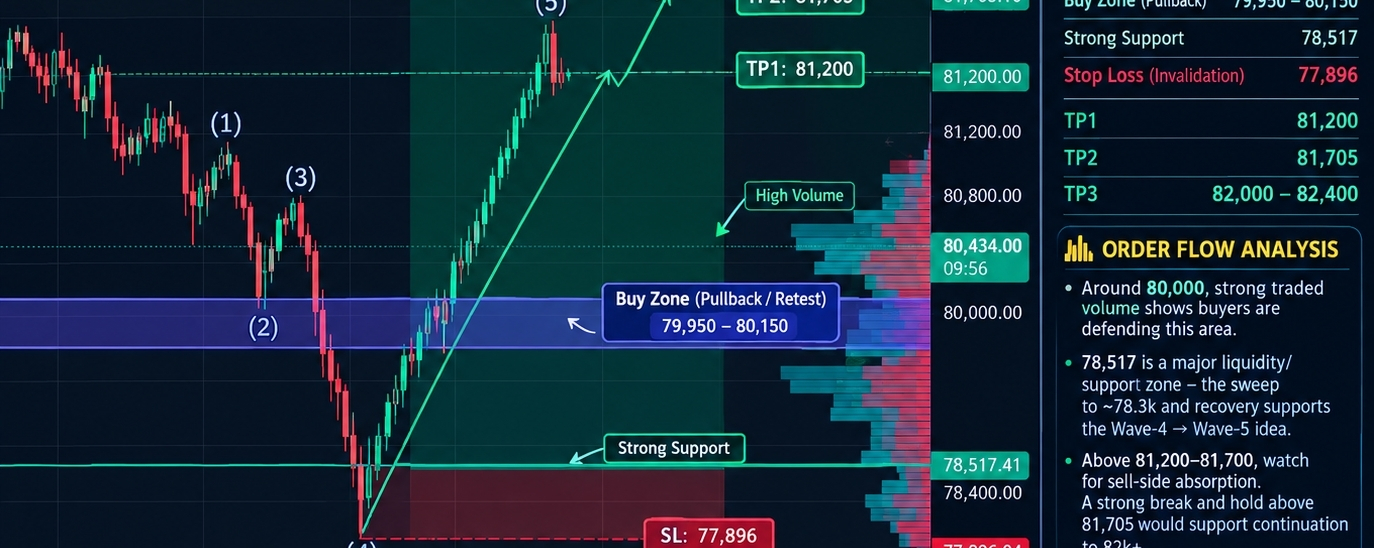
BTCUSDT 15M — BUY + Order Flow Analysis$BTC #BOJRaisesRatesTo31YearHigh Conditional BUY 🟢 Current: ~80,434 Buy zone: 79,950–80,150 on pullback/retest Strong support: 78,517 Invalidation / SL: 77,896 TP1: 81,200 TP2: 81,705 TP3: 82,000–82,400 Order Flow: Around 80,000, the chart shows strong traded volume, suggesting buyers are defending this area. The 78,517 area is the major liquidity/support zone; the sweep toward ~78.3k followed by recovery supports the Wave-4 → Wave-5 idea. Above 81,200–81,700, watch for sell-side absorption. A strong break and hold above 81,705 would support continuation toward 82k+. If 78,517 breaks decisively, the buy setup becomes weak; below 77,896 the shown setup is invalid. BTC is currently around the $81k area in live market data, while your screenshot shows ~$80.4k, so use your exchange's live order book/CVD for execution. � TradingView +1 Entry confirmation: 15M bullish engulfing / strong rejection + positive delta/CVD near the buy zone. Don't enter solely because price touches the level.$

BTCUSDT 15M — BUY + Order Flow Analysis

$BTC
#BOJRaisesRatesTo31YearHigh Conditional BUY 🟢
Current: ~80,434
Buy zone: 79,950–80,150 on pullback/retest
Strong support: 78,517
Invalidation / SL: 77,896
TP1: 81,200
TP2: 81,705
TP3: 82,000–82,400
Order Flow:
Around 80,000, the chart shows strong traded volume, suggesting buyers are defending this area.
The 78,517 area is the major liquidity/support zone; the sweep toward ~78.3k followed by recovery supports the Wave-4 → Wave-5 idea.
Above 81,200–81,700, watch for sell-side absorption. A strong break and hold above 81,705 would support continuation toward 82k+.
If 78,517 breaks decisively, the buy setup becomes weak; below 77,896 the shown setup is invalid.
BTC is currently around the $81k area in live market data, while your screenshot shows ~$80.4k, so use your exchange's live order book/CVD for execution. �
TradingView +1
Entry confirmation: 15M bullish engulfing / strong rejection + positive delta/CVD near the buy zone. Don't enter solely because price touches the level.$
Übersetzung ansehen
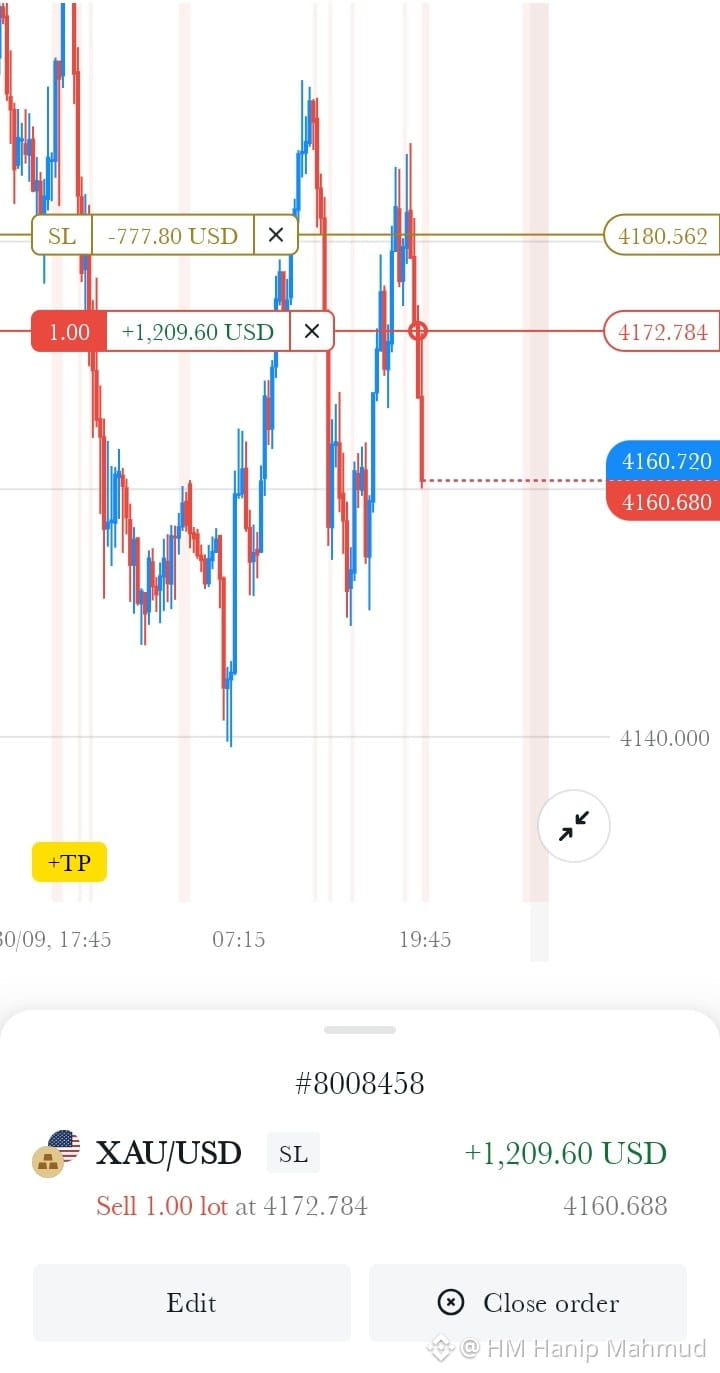
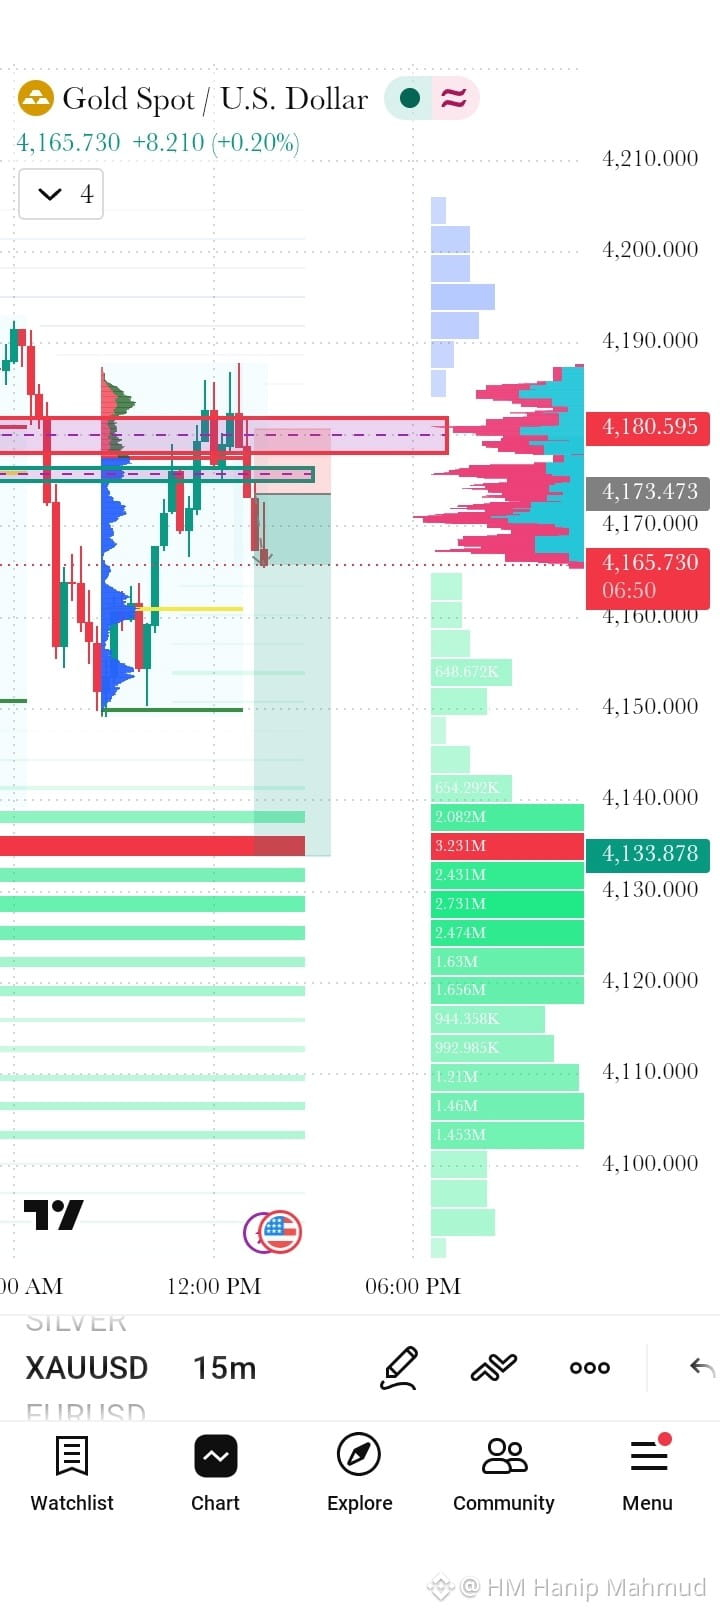
⚠️XauUsd15m Tp complete
HM Hanip Mahmud
·
--
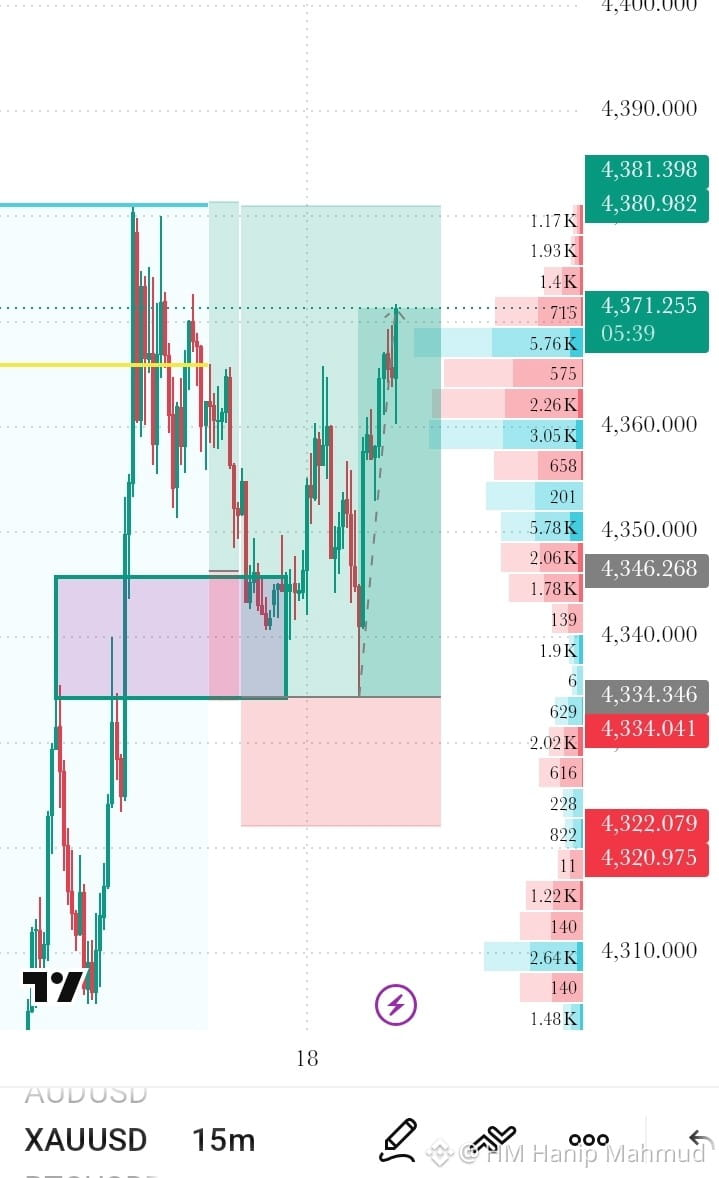
XAUUSD 15M — Buy-Setup
$XAUT

Aktueller Preis: 4364.125
🟢 Buy-Zone: 4350–4356
🟢 Starker Support: 4346
🔴 Stop Loss: 4334
🎯 TP1: 4370
🎯 TP2: 4381
🎯 TP3: 4390
Einstieg: Warte, bis der Preis auf 4350–4356 zurückläuft, und suche dann vor dem Einstieg nach einer bullischen Ablehnung oder einer bullischen Engulfing-Kerze.
Alternativer Einstieg: Wenn der Preis bricht und auf dem 15M-Chart über 4370 schließt, warte auf einen Retest und erwäge einen Fortsetzungs-Buy.
⚠️ Invalidierung: Ein starkes 15M-Close unter 4346 schwächt das Buy-Setup.
Risiko: Halte das Risiko bei etwa 1% pro Trade.
Anmelden und weiter Inhalte entdecken
Krypto-Nutzer weltweit auf Binance Square kennenlernen
⚡️ Bleib in Sachen Krypto stets am Puls.
💬 Die weltgrößte Kryptobörse vertraut darauf.
👍 Erhalte verlässliche Einblicke von verifizierten Creators.
E-Mail-Adresse/Telefonnummer
Sitemap
Cookie-Präferenzen
Nutzungsbedingungen der Plattform