

The Blaze
65 Beiträge

The Blaze
Melden
Nutzer blockieren
Лети ночью, говори о крипте с рассвета.
Trade eröffnen
Gelegenheitstrader
3.6 Jahre
51 Following
45 Follower
51 Like gegeben
Beiträge
Portfolio
Alle
Zitierungen
Videos
PINNED
·
--
⚠️ Warnung: $ETH gerät in eine massive Liquiditätsfalle! 🌪️🚨
Wale fälschen Kaufaufträge auf Binance, um Privatanleger in Long-Positionen zu locken, aber der tatsächliche Verkaufsdruck baut sich im Hintergrund auf. Ein MACD-CROSSOVER hat gerade auf dem 4H-Zeitrahmen ein brutales bärisches Signal ausgelöst, und das Volumen stirbt bei jedem kleinen Bounce komplett ab. Das ist eine klassische Falle, die darauf ausgelegt ist, späte Käufer auf dem falschen Fuß zu erwischen und einen massiven DUMP auszulösen.
Sobald wir einen bestätigten SUPPORT-BRUCH sehen, wird der Boden vollständig wegfallen. Sei nicht die Exit-Liquidität für den bevorstehenden CRASH! 🛑📉
Hältst du deine Bags oder gehst du short gegen die Falle? Teile deine Strategie unten! 👇💬
⚠️ Warnung: $ETH gerät in eine massive Liquiditätsfalle! 🌪️🚨
Wale fälschen Kaufaufträge auf Binance, um Privatanleger in Long-Positionen zu locken, aber der tatsächliche Verkaufsdruck baut sich im Hintergrund auf. Ein MACD-CROSSOVER hat gerade auf dem 4H-Zeitrahmen ein brutales bärisches Signal ausgelöst, und das Volumen stirbt bei jedem kleinen Bounce komplett ab. Das ist eine klassische Falle, die darauf ausgelegt ist, späte Käufer auf dem falschen Fuß zu erwischen und einen massiven DUMP auszulösen.
Sobald wir einen bestätigten SUPPORT-BRUCH sehen, wird der Boden vollständig wegfallen. Sei nicht die Exit-Liquidität für den bevorstehenden CRASH! 🛑📉
Hältst du deine Bags oder gehst du short gegen die Falle? Teile deine Strategie unten! 👇💬
Wale fälschen Kaufaufträge auf Binance, um Privatanleger in Long-Positionen zu locken, aber der tatsächliche Verkaufsdruck baut sich im Hintergrund auf. Ein MACD-CROSSOVER hat gerade auf dem 4H-Zeitrahmen ein brutales bärisches Signal ausgelöst, und das Volumen stirbt bei jedem kleinen Bounce komplett ab. Das ist eine klassische Falle, die darauf ausgelegt ist, späte Käufer auf dem falschen Fuß zu erwischen und einen massiven DUMP auszulösen.
Sobald wir einen bestätigten SUPPORT-BRUCH sehen, wird der Boden vollständig wegfallen. Sei nicht die Exit-Liquidität für den bevorstehenden CRASH! 🛑📉
Hältst du deine Bags oder gehst du short gegen die Falle? Teile deine Strategie unten! 👇💬
19
21
19.4k
·
--
Übersetzung ansehen
The Perp DEX sector is evolving fast, and it's impossible to ignore the massive on-chain volume and TVL that Hyperliquid is capturing. When a protocol builds this much organic traction, user retention, and fee revenue, Tier-1 exchanges naturally take notice. The decentralized perp narrative is stronger than ever.
#BinanceWillListHyperliquid(HYPE)
What is your realistic price target for $HYPE if the rumors are true? 👇 #BinanceWillListHyperliquid(HYPE)
The Perp DEX sector is evolving fast, and it's impossible to ignore the massive on-chain volume and TVL that Hyperliquid is capturing. When a protocol builds this much organic traction, user retention, and fee revenue, Tier-1 exchanges naturally take notice. The decentralized perp narrative is stronger than ever.
#BinanceWillListHyperliquid(HYPE)
What is your realistic price target for $HYPE if the rumors are true? 👇 #BinanceWillListHyperliquid(HYPE)
#BinanceWillListHyperliquid(HYPE)
What is your realistic price target for $HYPE if the rumors are true? 👇 #BinanceWillListHyperliquid(HYPE)
130
·
--
🐋 Wale jagen keine grünen Kerzen — sie beobachten diese Levels bei $BTC und $ETH
$BTC konsolidiert sich nahe $84.331 nach einem starken Wochenanstieg von +10,66 %. $ETH hält sich nahe $2.685, ist über 7 Tage um +11,03 % gestiegen und zeigt ein stärkeres Zufluss-Volumen großer Orders als BTC.
$BTC: Die tägliche Struktur bleibt bullisch: MA7/25/99 sind nach oben ausgerichtet und MACD ist weiterhin bullisch. Doch der Whale-Flow in der Größenordnung großer Akteure ist aktuell negativ (-572 BTC), während der Kurs weiterhin unter dem $87,4K-Wochenhoch notiert.
Support: $83,5K, dann $79,6K
Widerstand: $85K, dann $87,4K
Ein sauberes Reclaim von $85K würde die Hochs wieder in den Fokus rücken; der Verlust von $83,5K würde niedrigere Long-Liquidität freilegen.
$ETH: ETH hält seine MA7 nahe $2.684 und zeigt einen positiven Large-Order-Flow von ungefähr +10.989 ETH. Die relative Dynamik ist stärker als bei BTC, aber ETH bleibt das höher-betaserische Asset.
Support: $2.680, dann $2.528
Widerstand: $2.706, dann $2.807
Solange $2.680 gehalten wird, bleibt das lokale Kaufinteresse intakt; ein Scheitern dort könnte den Fokus auf die Liquiditätszone um $2,5K verlagern.
Das Whale-Playbook ist simpel: Abwarten, bis der Kurs zeigt, ob er das Angebot nahe dem Widerstand absorbieren kann — oder ob hoch gehebelte Longs unterhalb des Supports herausgespült werden. Aktuell bleiben $87,4K bei $BTC und $2,8K bei $ETH die sichtbaren Upside-Magnete — aber der Markt könnte das Abgreifen der Downside-Liquidität dennoch zuerst erledigen.
Wale: Beobachtet ihr den Ausbruch über dem Widerstand — oder wartet ihr auf einen tieferen Liquiditätssweep?
#BTC☀ #ETH🔥🔥🔥🔥🔥🔥 #CryptoAnalysis #liquidation #BinanceSquare
🐋 Wale jagen keine grünen Kerzen — sie beobachten diese Levels bei $BTC und $ETH
$BTC konsolidiert sich nahe $84.331 nach einem starken Wochenanstieg von +10,66 %. $ETH hält sich nahe $2.685, ist über 7 Tage um +11,03 % gestiegen und zeigt ein stärkeres Zufluss-Volumen großer Orders als BTC.
$BTC: Die tägliche Struktur bleibt bullisch: MA7/25/99 sind nach oben ausgerichtet und MACD ist weiterhin bullisch. Doch der Whale-Flow in der Größenordnung großer Akteure ist aktuell negativ (-572 BTC), während der Kurs weiterhin unter dem $87,4K-Wochenhoch notiert.
Support: $83,5K, dann $79,6K
Widerstand: $85K, dann $87,4K
Ein sauberes Reclaim von $85K würde die Hochs wieder in den Fokus rücken; der Verlust von $83,5K würde niedrigere Long-Liquidität freilegen.
$ETH: ETH hält seine MA7 nahe $2.684 und zeigt einen positiven Large-Order-Flow von ungefähr +10.989 ETH. Die relative Dynamik ist stärker als bei BTC, aber ETH bleibt das höher-betaserische Asset.
Support: $2.680, dann $2.528
Widerstand: $2.706, dann $2.807
Solange $2.680 gehalten wird, bleibt das lokale Kaufinteresse intakt; ein Scheitern dort könnte den Fokus auf die Liquiditätszone um $2,5K verlagern.
Das Whale-Playbook ist simpel: Abwarten, bis der Kurs zeigt, ob er das Angebot nahe dem Widerstand absorbieren kann — oder ob hoch gehebelte Longs unterhalb des Supports herausgespült werden. Aktuell bleiben $87,4K bei $BTC und $2,8K bei $ETH die sichtbaren Upside-Magnete — aber der Markt könnte das Abgreifen der Downside-Liquidität dennoch zuerst erledigen.
Wale: Beobachtet ihr den Ausbruch über dem Widerstand — oder wartet ihr auf einen tieferen Liquiditätssweep?
#BTC☀ #ETH🔥🔥🔥🔥🔥🔥 #CryptoAnalysis #liquidation #BinanceSquare
$BTC konsolidiert sich nahe $84.331 nach einem starken Wochenanstieg von +10,66 %. $ETH hält sich nahe $2.685, ist über 7 Tage um +11,03 % gestiegen und zeigt ein stärkeres Zufluss-Volumen großer Orders als BTC.
$BTC: Die tägliche Struktur bleibt bullisch: MA7/25/99 sind nach oben ausgerichtet und MACD ist weiterhin bullisch. Doch der Whale-Flow in der Größenordnung großer Akteure ist aktuell negativ (-572 BTC), während der Kurs weiterhin unter dem $87,4K-Wochenhoch notiert.
Support: $83,5K, dann $79,6K
Widerstand: $85K, dann $87,4K
Ein sauberes Reclaim von $85K würde die Hochs wieder in den Fokus rücken; der Verlust von $83,5K würde niedrigere Long-Liquidität freilegen.
$ETH: ETH hält seine MA7 nahe $2.684 und zeigt einen positiven Large-Order-Flow von ungefähr +10.989 ETH. Die relative Dynamik ist stärker als bei BTC, aber ETH bleibt das höher-betaserische Asset.
Support: $2.680, dann $2.528
Widerstand: $2.706, dann $2.807
Solange $2.680 gehalten wird, bleibt das lokale Kaufinteresse intakt; ein Scheitern dort könnte den Fokus auf die Liquiditätszone um $2,5K verlagern.
Das Whale-Playbook ist simpel: Abwarten, bis der Kurs zeigt, ob er das Angebot nahe dem Widerstand absorbieren kann — oder ob hoch gehebelte Longs unterhalb des Supports herausgespült werden. Aktuell bleiben $87,4K bei $BTC und $2,8K bei $ETH die sichtbaren Upside-Magnete — aber der Markt könnte das Abgreifen der Downside-Liquidität dennoch zuerst erledigen.
Wale: Beobachtet ihr den Ausbruch über dem Widerstand — oder wartet ihr auf einen tieferen Liquiditätssweep?
#BTC☀ #ETH🔥🔥🔥🔥🔥🔥 #CryptoAnalysis #liquidation #BinanceSquare
116
·
--
Übersetzung ansehen
⚡ $BTC vs $ETH: Trend Is Still Bullish — But Momentum Is Cooling
$BTC is trading near $84.3K, while $ETH is near $2.68K. Both remain in a bullish daily structure, but price is consolidating below recent highs — a zone where liquidity grabs often decide the next move.
$BTC
Support: $83.5K, then $79.6K
Resistance: $85K, then $87.4K
RSI: 66.16; MACD remains bullish, but momentum is fading.
Large-order flow: -572 BTC — some net sell pressure during consolidation.
$ETH
Support: $2,680, then $2,528
Resistance: $2,706, then $2,807
RSI: 61.73; MACD remains bullish.
Large-order flow: +10,989 ETH — ETH is attracting stronger buy-side flow than BTC.
What matters now:
BTC needs to defend $83.5K to keep the local structure intact. ETH is holding relative strength, but it remains more volatile if BTC breaks lower.
Two scenarios:
A move above $85K BTC and $2,706 ETH could pull price toward the recent highs.
A loss of $83.5K BTC could trigger a liquidity sweep toward the $80K area, with ETH potentially retesting $2,528.
Which one reaches its recent high first: $BTC at $87.4K or $ETH at $2.8K?
#BTC #ETH #CryptoAnalysis #Liquidation #BinanceSquare
⚡ $BTC vs $ETH: Trend Is Still Bullish — But Momentum Is Cooling
$BTC is trading near $84.3K, while $ETH is near $2.68K. Both remain in a bullish daily structure, but price is consolidating below recent highs — a zone where liquidity grabs often decide the next move.
$BTC
Support: $83.5K, then $79.6K
Resistance: $85K, then $87.4K
RSI: 66.16; MACD remains bullish, but momentum is fading.
Large-order flow: -572 BTC — some net sell pressure during consolidation.
$ETH
Support: $2,680, then $2,528
Resistance: $2,706, then $2,807
RSI: 61.73; MACD remains bullish.
Large-order flow: +10,989 ETH — ETH is attracting stronger buy-side flow than BTC.
What matters now:
BTC needs to defend $83.5K to keep the local structure intact. ETH is holding relative strength, but it remains more volatile if BTC breaks lower.
Two scenarios:
A move above $85K BTC and $2,706 ETH could pull price toward the recent highs.
A loss of $83.5K BTC could trigger a liquidity sweep toward the $80K area, with ETH potentially retesting $2,528.
Which one reaches its recent high first: $BTC at $87.4K or $ETH at $2.8K?
#BTC #ETH #CryptoAnalysis #Liquidation #BinanceSquare
$BTC is trading near $84.3K, while $ETH is near $2.68K. Both remain in a bullish daily structure, but price is consolidating below recent highs — a zone where liquidity grabs often decide the next move.
$BTC
Support: $83.5K, then $79.6K
Resistance: $85K, then $87.4K
RSI: 66.16; MACD remains bullish, but momentum is fading.
Large-order flow: -572 BTC — some net sell pressure during consolidation.
$ETH
Support: $2,680, then $2,528
Resistance: $2,706, then $2,807
RSI: 61.73; MACD remains bullish.
Large-order flow: +10,989 ETH — ETH is attracting stronger buy-side flow than BTC.
What matters now:
BTC needs to defend $83.5K to keep the local structure intact. ETH is holding relative strength, but it remains more volatile if BTC breaks lower.
Two scenarios:
A move above $85K BTC and $2,706 ETH could pull price toward the recent highs.
A loss of $83.5K BTC could trigger a liquidity sweep toward the $80K area, with ETH potentially retesting $2,528.
Which one reaches its recent high first: $BTC at $87.4K or $ETH at $2.8K?
#BTC #ETH #CryptoAnalysis #Liquidation #BinanceSquare
100
·
--
Übersetzung ansehen
🔥 $BTC & $ETH: Liquidity Hunt Before the Next Move?
$BTC is consolidating below the recent $87.4K high, while $ETH is holding near the $2.7K area. The daily structure remains constructive, but momentum is cooling — a typical setup for a liquidity sweep before the next directional move.
$BTC key levels
Support: $83.5K, then $79.5K–$80K
Resistance: $85K, then $87.4K
Liquidity: stops likely sit above the recent high, while late longs are vulnerable below $83.5K.
$ETH key levels
Support: $2,680, then $2,525
Resistance: $2,710, then $2,800
ETH has shown better relative momentum than BTC recently, but it is also more sensitive if Bitcoin loses support.
Scenarios
If BTC reclaims $85K and ETH breaks $2,710, upside liquidity near $87.4K / $2.8K may become the next magnet.
If BTC loses $83.5K, a long-liquidation move toward $80K could pressure ETH toward $2,525.
The market is stuck between shorts above resistance and longs below support. The first clean break should reveal which side gets squeezed.
Which liquidity pool gets taken first: $87.4K on $BTC or the longs below $83.5K?
BTC#FedOctoberRateHikeOddsRiseTo69.7% #BinanceWillListHyperliquid(HYPE) #ETH🔥🔥🔥🔥🔥🔥 #CryptoAnalysis #Liquidation #BinanceSquare
🔥 $BTC & $ETH: Liquidity Hunt Before the Next Move?
$BTC is consolidating below the recent $87.4K high, while $ETH is holding near the $2.7K area. The daily structure remains constructive, but momentum is cooling — a typical setup for a liquidity sweep before the next directional move.
$BTC key levels
Support: $83.5K, then $79.5K–$80K
Resistance: $85K, then $87.4K
Liquidity: stops likely sit above the recent high, while late longs are vulnerable below $83.5K.
$ETH key levels
Support: $2,680, then $2,525
Resistance: $2,710, then $2,800
ETH has shown better relative momentum than BTC recently, but it is also more sensitive if Bitcoin loses support.
Scenarios
If BTC reclaims $85K and ETH breaks $2,710, upside liquidity near $87.4K / $2.8K may become the next magnet.
If BTC loses $83.5K, a long-liquidation move toward $80K could pressure ETH toward $2,525.
The market is stuck between shorts above resistance and longs below support. The first clean break should reveal which side gets squeezed.
Which liquidity pool gets taken first: $87.4K on $BTC or the longs below $83.5K?
BTC#FedOctoberRateHikeOddsRiseTo69.7% #BinanceWillListHyperliquid(HYPE) #ETH🔥🔥🔥🔥🔥🔥 #CryptoAnalysis #Liquidation #BinanceSquare
$BTC is consolidating below the recent $87.4K high, while $ETH is holding near the $2.7K area. The daily structure remains constructive, but momentum is cooling — a typical setup for a liquidity sweep before the next directional move.
$BTC key levels
Support: $83.5K, then $79.5K–$80K
Resistance: $85K, then $87.4K
Liquidity: stops likely sit above the recent high, while late longs are vulnerable below $83.5K.
$ETH key levels
Support: $2,680, then $2,525
Resistance: $2,710, then $2,800
ETH has shown better relative momentum than BTC recently, but it is also more sensitive if Bitcoin loses support.
Scenarios
If BTC reclaims $85K and ETH breaks $2,710, upside liquidity near $87.4K / $2.8K may become the next magnet.
If BTC loses $83.5K, a long-liquidation move toward $80K could pressure ETH toward $2,525.
The market is stuck between shorts above resistance and longs below support. The first clean break should reveal which side gets squeezed.
Which liquidity pool gets taken first: $87.4K on $BTC or the longs below $83.5K?
BTC#FedOctoberRateHikeOddsRiseTo69.7% #BinanceWillListHyperliquid(HYPE) #ETH🔥🔥🔥🔥🔥🔥 #CryptoAnalysis #Liquidation #BinanceSquare
137
·
--
Übersetzung ansehen
With the expiration of BTC and ETH options on September 25th, totaling approximately $18 billion, this could create conditions for high volatility. BTC is currently around $84,5K, while the estimated "maximum pain" zone is in the $75K–$76K range. However, "max pain" is just a theoretical calculation and doesn't necessarily mean that BTC will automatically be pushed there. There is also a significant concentration of call options on BTC around $85K, $90K, and $95K, which means that hedging by dealers around these strike prices could amplify movements as the expiration date approaches. The key point is that the market is not simply a "dump to maximum pain" scenario: both long and short liquidations can fuel the next move.
If BTC breaks down, accumulated long positions could be liquidated, potentially triggering a cascading sell-off and accelerating the move towards areas of lower liquidity. However, if BTC returns above $85K and starts to rise, short liquidations could work in the opposite direction, forcing short sellers to cover their positions and adding fuel to an upward surge. Therefore, with positions heavily concentrated around the main strike prices, the expiration date could turn into a "hunt for liquidity" game on both sides: longs are liquidated on a downward move, while shorts are squeezed on an upward move. The figure of $18 billion represents the notional value (outstanding amount), not $18 billion worth of BTC that must be sold. Therefore, the actual impact depends heavily on positioning, dealer hedging, and how BTC will be trading by the time of expiration.
With the expiration of BTC and ETH options on September 25th, totaling approximately $18 billion, this could create conditions for high volatility. BTC is currently around $84,5K, while the estimated "maximum pain" zone is in the $75K–$76K range. However, "max pain" is just a theoretical calculation and doesn't necessarily mean that BTC will automatically be pushed there. There is also a significant concentration of call options on BTC around $85K, $90K, and $95K, which means that hedging by dealers around these strike prices could amplify movements as the expiration date approaches. The key point is that the market is not simply a "dump to maximum pain" scenario: both long and short liquidations can fuel the next move.
If BTC breaks down, accumulated long positions could be liquidated, potentially triggering a cascading sell-off and accelerating the move towards areas of lower liquidity. However, if BTC returns above $85K and starts to rise, short liquidations could work in the opposite direction, forcing short sellers to cover their positions and adding fuel to an upward surge. Therefore, with positions heavily concentrated around the main strike prices, the expiration date could turn into a "hunt for liquidity" game on both sides: longs are liquidated on a downward move, while shorts are squeezed on an upward move. The figure of $18 billion represents the notional value (outstanding amount), not $18 billion worth of BTC that must be sold. Therefore, the actual impact depends heavily on positioning, dealer hedging, and how BTC will be trading by the time of expiration.
If BTC breaks down, accumulated long positions could be liquidated, potentially triggering a cascading sell-off and accelerating the move towards areas of lower liquidity. However, if BTC returns above $85K and starts to rise, short liquidations could work in the opposite direction, forcing short sellers to cover their positions and adding fuel to an upward surge. Therefore, with positions heavily concentrated around the main strike prices, the expiration date could turn into a "hunt for liquidity" game on both sides: longs are liquidated on a downward move, while shorts are squeezed on an upward move. The figure of $18 billion represents the notional value (outstanding amount), not $18 billion worth of BTC that must be sold. Therefore, the actual impact depends heavily on positioning, dealer hedging, and how BTC will be trading by the time of expiration.
162
·
--
Übersetzung ansehen
$ETH is stabilizing fast following the market-wide leverage flush! Funding rates have completely normalized as a clean bullish divergence prints on the 4H RSI. Algorithmic buyers are defending $2,400 with $18.4M in bid walls. A breakout past $2,465 unlocks a direct run toward $2,550 - $2,600. Are you accumulating ETH here or waiting for $2,465 confirmation?
$ETH is stabilizing fast following the market-wide leverage flush! Funding rates have completely normalized as a clean bullish divergence prints on the 4H RSI. Algorithmic buyers are defending $2,400 with $18.4M in bid walls. A breakout past $2,465 unlocks a direct run toward $2,550 - $2,600. Are you accumulating ETH here or waiting for $2,465 confirmation?
1
1
725
·
--
Übersetzung ansehen
CORRELATION CALCULATION:
Funding rate normalized (-0.0035%), L/S Ratio (0.94) indicates reduced long leverage imbalance. RSI (44.5) is forming a local bullish divergence on the 4H timeframe. Limit bid density ($18.4M) is concentrated in the $2,400–$2,420 zone. Correlation with BTC = 0.92.
=========================================
SCENARIO A: [IMPULSE BREAKOUT TO $2,550]
TRIGGER: Price consolidation above $2,465 with rising spot CVD.
MECHANICS: Excess leverage flushed out. Seller absorption in the $2,450–$2,480 range triggers a technical bounce following BTC recovery.
TARGET: Order execution zone $2,550 - $2,600.
PROBABILITY: 65% (Assuming BTC holds $78,500 support).
SCENARIO B: [SECONDARY LIQUIDITY SWEEP]
TRIGGER: Breakdown of local $2,400 level on elevated sell volume.
MECHANICS: Price pushed down to lower liquidity cluster ($2,350 - $2,380) to sweep remaining stop-losses prior to final reversal.
TARGET: Flush to $2,350 - $2,380 followed by aggressive absorption.
PROBABILITY: 35%.
=========================================
[!] SYSTEM CONCLUSION: ETH IS PREPARED TO EXECUTE SCENARIO 'A'. KEY SUPPORT LEVEL AT $2,400 IS BEING HELD BY ALGORITHMIC BUYERS.
CORRELATION CALCULATION:
Funding rate normalized (-0.0035%), L/S Ratio (0.94) indicates reduced long leverage imbalance. RSI (44.5) is forming a local bullish divergence on the 4H timeframe. Limit bid density ($18.4M) is concentrated in the $2,400–$2,420 zone. Correlation with BTC = 0.92.
=========================================
SCENARIO A: [IMPULSE BREAKOUT TO $2,550]
TRIGGER: Price consolidation above $2,465 with rising spot CVD.
MECHANICS: Excess leverage flushed out. Seller absorption in the $2,450–$2,480 range triggers a technical bounce following BTC recovery.
TARGET: Order execution zone $2,550 - $2,600.
PROBABILITY: 65% (Assuming BTC holds $78,500 support).
SCENARIO B: [SECONDARY LIQUIDITY SWEEP]
TRIGGER: Breakdown of local $2,400 level on elevated sell volume.
MECHANICS: Price pushed down to lower liquidity cluster ($2,350 - $2,380) to sweep remaining stop-losses prior to final reversal.
TARGET: Flush to $2,350 - $2,380 followed by aggressive absorption.
PROBABILITY: 35%.
=========================================
[!] SYSTEM CONCLUSION: ETH IS PREPARED TO EXECUTE SCENARIO 'A'. KEY SUPPORT LEVEL AT $2,400 IS BEING HELD BY ALGORITHMIC BUYERS.
Funding rate normalized (-0.0035%), L/S Ratio (0.94) indicates reduced long leverage imbalance. RSI (44.5) is forming a local bullish divergence on the 4H timeframe. Limit bid density ($18.4M) is concentrated in the $2,400–$2,420 zone. Correlation with BTC = 0.92.
=========================================
SCENARIO A: [IMPULSE BREAKOUT TO $2,550]
TRIGGER: Price consolidation above $2,465 with rising spot CVD.
MECHANICS: Excess leverage flushed out. Seller absorption in the $2,450–$2,480 range triggers a technical bounce following BTC recovery.
TARGET: Order execution zone $2,550 - $2,600.
PROBABILITY: 65% (Assuming BTC holds $78,500 support).
SCENARIO B: [SECONDARY LIQUIDITY SWEEP]
TRIGGER: Breakdown of local $2,400 level on elevated sell volume.
MECHANICS: Price pushed down to lower liquidity cluster ($2,350 - $2,380) to sweep remaining stop-losses prior to final reversal.
TARGET: Flush to $2,350 - $2,380 followed by aggressive absorption.
PROBABILITY: 35%.
=========================================
[!] SYSTEM CONCLUSION: ETH IS PREPARED TO EXECUTE SCENARIO 'A'. KEY SUPPORT LEVEL AT $2,400 IS BEING HELD BY ALGORITHMIC BUYERS.
65
·
--
Übersetzung ansehen
Market dynamics shifting! As $BTC firmly holds the $78.5K liquidity absorption zone,$ETH is stabilizing at $2,442 after flushing out weak long leverage. Order book depth shows aggressive spot buying delta returning across top exchanges with RSI bullish divergence forming. Target trajectory locked on $2,550 for ETH. Are you positioned for this breakout or watching from cash?
Market dynamics shifting! As $BTC firmly holds the $78.5K liquidity absorption zone,$ETH is stabilizing at $2,442 after flushing out weak long leverage. Order book depth shows aggressive spot buying delta returning across top exchanges with RSI bullish divergence forming. Target trajectory locked on $2,550 for ETH. Are you positioned for this breakout or watching from cash?
94
·
--
Übersetzung ansehen
⚠️ LIQUIDATION TRAP ACTIVE: $ETH is trapped in a classic whale liquidity siphon! 🌪️🚨
Market makers are spoofing buy orders across depth books to bait retail traders into high-leverage long positions while massive distribution continues behind the scenes. MACD just confirmed a textbook bearish crossover on the 4H timeframe, and buying volume declines on every weak relief bounce. This is a deliberate setup designed to turn late buyers into exit liquidity. Do not take the bait! 🛑📉
Who's standing on the sidelines, and who's taking short entries? Tell me where you see the real bottom! 🎯👇💬
⚠️ LIQUIDATION TRAP ACTIVE: $ETH is trapped in a classic whale liquidity siphon! 🌪️🚨
Market makers are spoofing buy orders across depth books to bait retail traders into high-leverage long positions while massive distribution continues behind the scenes. MACD just confirmed a textbook bearish crossover on the 4H timeframe, and buying volume declines on every weak relief bounce. This is a deliberate setup designed to turn late buyers into exit liquidity. Do not take the bait! 🛑📉
Who's standing on the sidelines, and who's taking short entries? Tell me where you see the real bottom! 🎯👇💬
Market makers are spoofing buy orders across depth books to bait retail traders into high-leverage long positions while massive distribution continues behind the scenes. MACD just confirmed a textbook bearish crossover on the 4H timeframe, and buying volume declines on every weak relief bounce. This is a deliberate setup designed to turn late buyers into exit liquidity. Do not take the bait! 🛑📉
Who's standing on the sidelines, and who's taking short entries? Tell me where you see the real bottom! 🎯👇💬
46
·
--
Übersetzung ansehen
#USAugustPPIRisesLessThanExpected Caution on $ETH! Funding rates are dangerously overheated while price dips to $2,442. Derivatives market looks extremely heavy, signaling an imminent liquidity hunt. Main order book bid clusters are stacked lower between $2,350 - $2,380. Expecting a rapid flush to clear late long leverage before any sustainable bounce toward $2,550. Manage your risk tightly. What is your ETH target for this week?
#USAugustPPIRisesLessThanExpected Caution on $ETH! Funding rates are dangerously overheated while price dips to $2,442. Derivatives market looks extremely heavy, signaling an imminent liquidity hunt. Main order book bid clusters are stacked lower between $2,350 - $2,380. Expecting a rapid flush to clear late long leverage before any sustainable bounce toward $2,550. Manage your risk tightly. What is your ETH target for this week?
37
·
--
Übersetzung ansehen
Caution on $ETH! Funding rates are dangerously overheated while price dips to $2,442. Derivatives market looks extremely heavy, signaling an imminent liquidity hunt. Main order book bid clusters are stacked lower between $2,350 - $2,380. Expecting a rapid flush to clear late long leverage before any sustainable bounce toward $2,550. Manage your risk tightly. What is your ETH target for this week?
Caution on $ETH! Funding rates are dangerously overheated while price dips to $2,442. Derivatives market looks extremely heavy, signaling an imminent liquidity hunt. Main order book bid clusters are stacked lower between $2,350 - $2,380. Expecting a rapid flush to clear late long leverage before any sustainable bounce toward $2,550. Manage your risk tightly. What is your ETH target for this week?
93
·
--
Übersetzung ansehen
$BTC liquidity sweep at $78.5K confirmed! CVD (delta) just flipped bullish as heavy iceberg limit orders absorbed the panic selling. Our automated agent has executed a market long. Market dynamics are shifting fast. Did you catch the wick, or are you still trapped in a short?
$BTC liquidity sweep at $78.5K confirmed! CVD (delta) just flipped bullish as heavy iceberg limit orders absorbed the panic selling. Our automated agent has executed a market long. Market dynamics are shifting fast. Did you catch the wick, or are you still trapped in a short?
71
·
--
Übersetzung ansehen
$BTC is officially entering the $78.5K kill zone. Live data shows market makers pulling upper bids while dark pool accumulation spikes at support. Simultaneously, $ETH is testing its critical $3,610 liquidity block. The macro sweep is unfolding exactly as modeled. Extreme volatility inbound. Are your limit orders placed for the bounce?
$BTC is officially entering the $78.5K kill zone. Live data shows market makers pulling upper bids while dark pool accumulation spikes at support. Simultaneously, $ETH is testing its critical $3,610 liquidity block. The macro sweep is unfolding exactly as modeled. Extreme volatility inbound. Are your limit orders placed for the bounce?
90
·
--
🥂
🥂


Kripto Kurdu
·
--
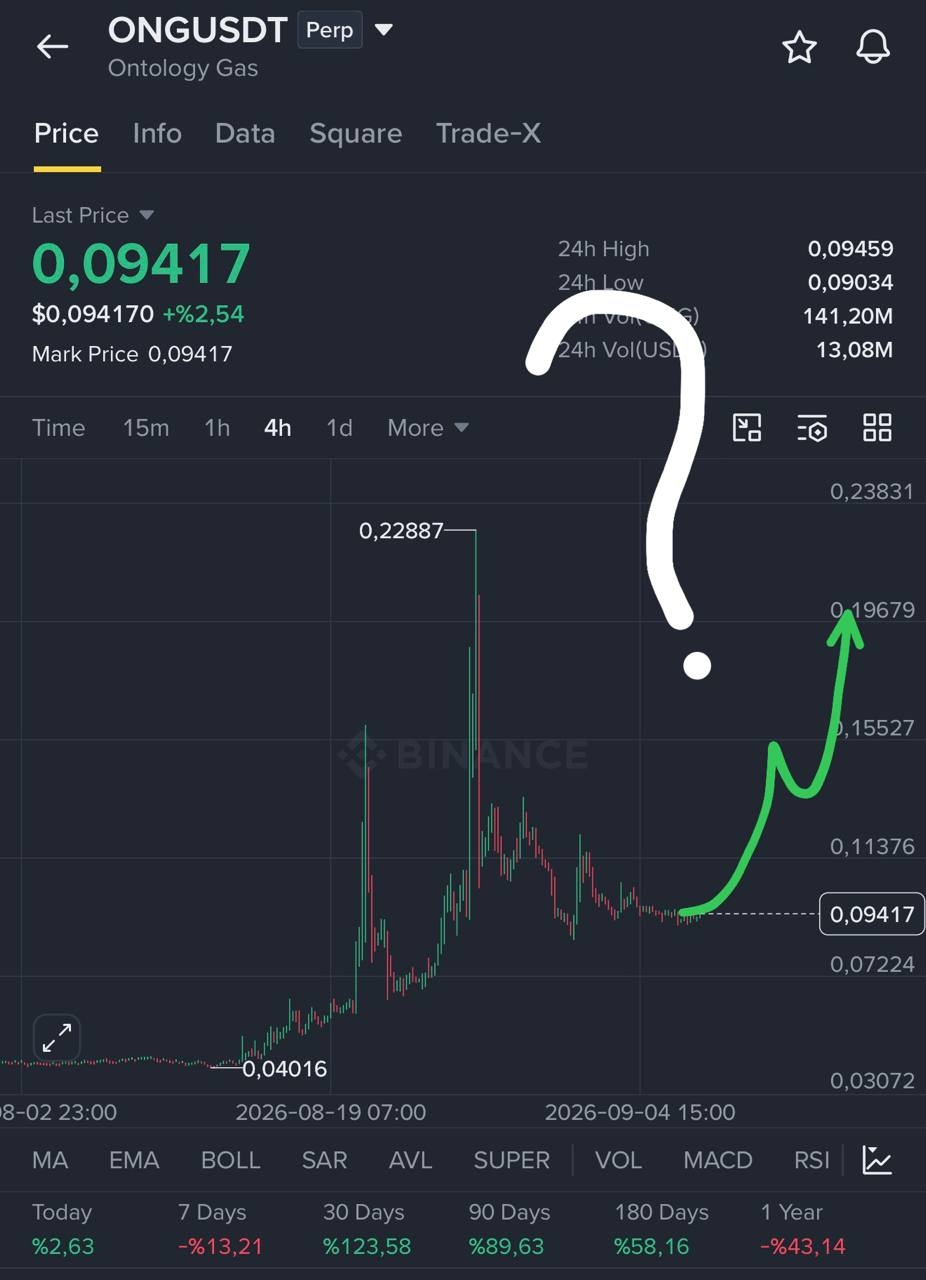
Heute ist Tag 12 des HOLDING $ONG !
Ich halte diese Position immer noch, und als ich die Daten analysiert habe, ist mir aufgefallen, dass der Momentum jetzt langsam anzieht.
Sie generiert weiterhin in 1-Stunden-Intervallen Finanzierung und erzielt dabei weiterhin einen wirklich beachtlichen Gewinn.
Das ist für mich zu einer passiven Einkommensmaschine geworden. Denk nur daran: Nicht nur, dass ich für 12 Tage Finanzierungserlöse erhalten habe, sondern ich werde die Position auch mit einem noch größeren Gewinn schließen, da sie bereits im Plus ist. Ich werde sie weiter halten.
Ich halte diese Position immer noch, und als ich die Daten analysiert habe, ist mir aufgefallen, dass der Momentum jetzt langsam anzieht.
Sie generiert weiterhin in 1-Stunden-Intervallen Finanzierung und erzielt dabei weiterhin einen wirklich beachtlichen Gewinn.
Das ist für mich zu einer passiven Einkommensmaschine geworden. Denk nur daran: Nicht nur, dass ich für 12 Tage Finanzierungserlöse erhalten habe, sondern ich werde die Position auch mit einem noch größeren Gewinn schließen, da sie bereits im Plus ist. Ich werde sie weiter halten.
·
--
Übersetzung ansehen
$ETH: Overheated Leverage & 2 Primary Scenarios 📉🟢🔴 (Part 2)
In Part 1, we covered $BTC and the massive $2.77B short liquidation magnet. Now let's dive into $ETH and global market scenarios.
📉 $ETH Analysis: Leverage Risk
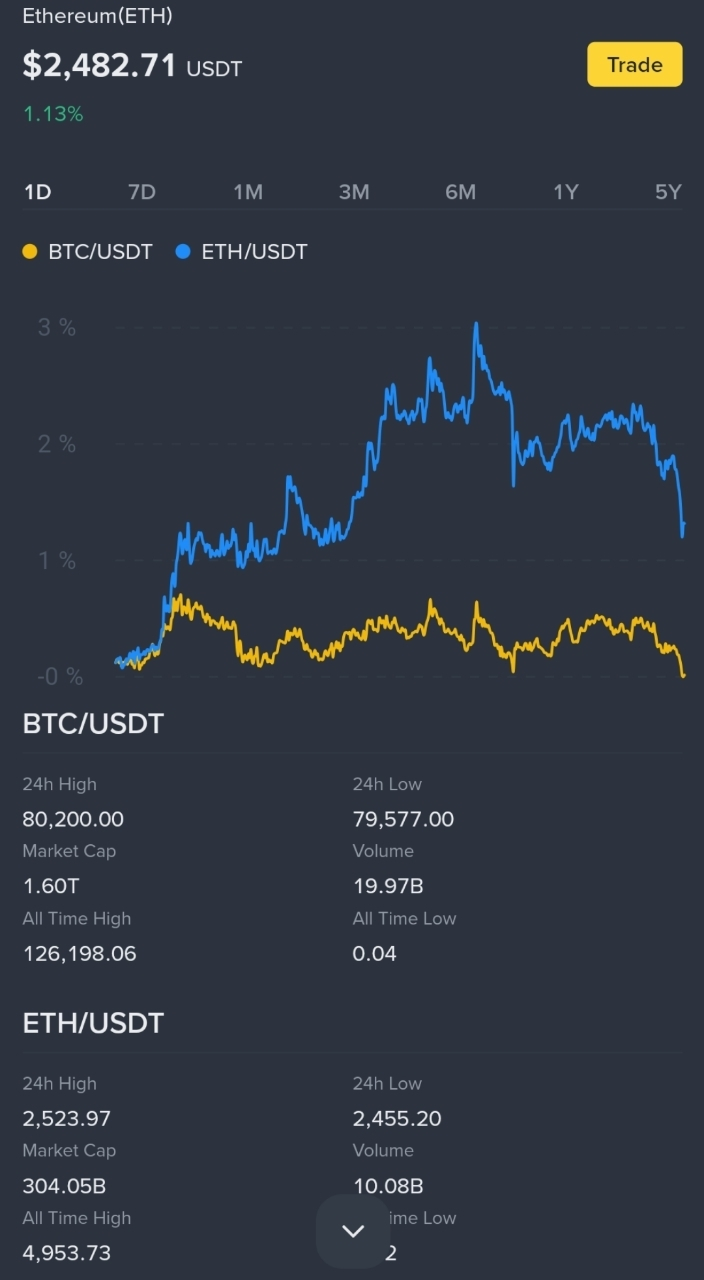
$ETH is trading around $2,482 (24h range $2,455–2,524). Over the past 30 days, Ethereum gained +30.36\% compared to +23.83\% forBTC, but its derivatives market is currently more overheated.
Key $ETH Zones:
• Immediate Support: $2,450–$2,460 (intraday balance)
• Next Support: $2,380–$2,400 (demand order block)
• Resistance: $2,520–$2,525 (local barrier)
• Major Resistance: $2,600 (psychological level)
Derivatives: $ETH funding rate is elevated (+0.0071%), with long positions reaching 69.4%. If $2,450 fails to hold, high long density could spark a sharp correction.
🔮 Two Primary Scenarios:
🟢 Bullish: $BTC holds $79.5K and breaks above $80.2K on rising volume ➔ targets $83.0K–$83.5K. $ETH confirms by breaking above $2,525.
🔴 Bearish: $BTC loses $79.5K ➔ stop-hunt drives prices downward. $ETH, weighted by elevated funding, breaks $2,450 to test $2,380–$2,400.
💬 Discussion Corner:
Will $ETH hold the 2,450 support before the nextBTC impulse? Drop your predictions below! 👇
#BTC #ETH #CryptoAnalysis #liquidation #BİNANCESQUARE
$ETH: Overheated Leverage & 2 Primary Scenarios 📉🟢🔴 (Part 2)
In Part 1, we covered $BTC and the massive $2.77B short liquidation magnet. Now let's dive into $ETH and global market scenarios.
📉 $ETH Analysis: Leverage Risk
$ETH is trading around $2,482 (24h range $2,455–2,524). Over the past 30 days, Ethereum gained +30.36\% compared to +23.83\% forBTC, but its derivatives market is currently more overheated.
Key $ETH Zones:
• Immediate Support: $2,450–$2,460 (intraday balance)
• Next Support: $2,380–$2,400 (demand order block)
• Resistance: $2,520–$2,525 (local barrier)
• Major Resistance: $2,600 (psychological level)
Derivatives: $ETH funding rate is elevated (+0.0071%), with long positions reaching 69.4%. If $2,450 fails to hold, high long density could spark a sharp correction.
🔮 Two Primary Scenarios:
🟢 Bullish: $BTC holds $79.5K and breaks above $80.2K on rising volume ➔ targets $83.0K–$83.5K. $ETH confirms by breaking above $2,525.
🔴 Bearish: $BTC loses $79.5K ➔ stop-hunt drives prices downward. $ETH, weighted by elevated funding, breaks $2,450 to test $2,380–$2,400.
💬 Discussion Corner:
Will $ETH hold the 2,450 support before the nextBTC impulse? Drop your predictions below! 👇
#BTC #ETH #CryptoAnalysis #liquidation #BİNANCESQUARE
In Part 1, we covered $BTC and the massive $2.77B short liquidation magnet. Now let's dive into $ETH and global market scenarios.
📉 $ETH Analysis: Leverage Risk
$ETH is trading around $2,482 (24h range $2,455–2,524). Over the past 30 days, Ethereum gained +30.36\% compared to +23.83\% forBTC, but its derivatives market is currently more overheated.
Key $ETH Zones:
• Immediate Support: $2,450–$2,460 (intraday balance)
• Next Support: $2,380–$2,400 (demand order block)
• Resistance: $2,520–$2,525 (local barrier)
• Major Resistance: $2,600 (psychological level)
Derivatives: $ETH funding rate is elevated (+0.0071%), with long positions reaching 69.4%. If $2,450 fails to hold, high long density could spark a sharp correction.
🔮 Two Primary Scenarios:
🟢 Bullish: $BTC holds $79.5K and breaks above $80.2K on rising volume ➔ targets $83.0K–$83.5K. $ETH confirms by breaking above $2,525.
🔴 Bearish: $BTC loses $79.5K ➔ stop-hunt drives prices downward. $ETH, weighted by elevated funding, breaks $2,450 to test $2,380–$2,400.
💬 Discussion Corner:
Will $ETH hold the 2,450 support before the nextBTC impulse? Drop your predictions below! 👇
#BTC #ETH #CryptoAnalysis #liquidation #BİNANCESQUARE
37
·
--
⚠️ $BTC an der Widerstandszone: $2.77B an Short-Liquidationen in Sicht! ⚡ (Teil 1)
Der Markt ist in eine Squeeze-Phase eingetreten: Die $BTC-Preise halten sich in einer engen Spanne, das Open Interest steigt nicht stark an, aber auf beiden Seiten bauen sich gehebelte Positionen auf. In solchen Bedingungen beginnen Bewegungen oft mit einer Liquidationsjagd statt mit einem sauberen Ausbruch.
📌 News Trigger:
Oberhalb von 83,482 fürBTC hat sich ein massiver Short-Liquidationsbereich von etwa $2.77B gebildet. Dies dient als starkes Ziel für den Markt: Ein Anstieg über die lokalen Hochs könnte eine Kaskade erzwungener Short-Eindeckungen auslösen.
Positive Funding-Raten zeigen, dass Long-Halter Shorts bezahlen. Treibstoff für einen Short Squeeze ist vorhanden, aber das starke Long-Segment bleibt anfällig für Rücksetzer.
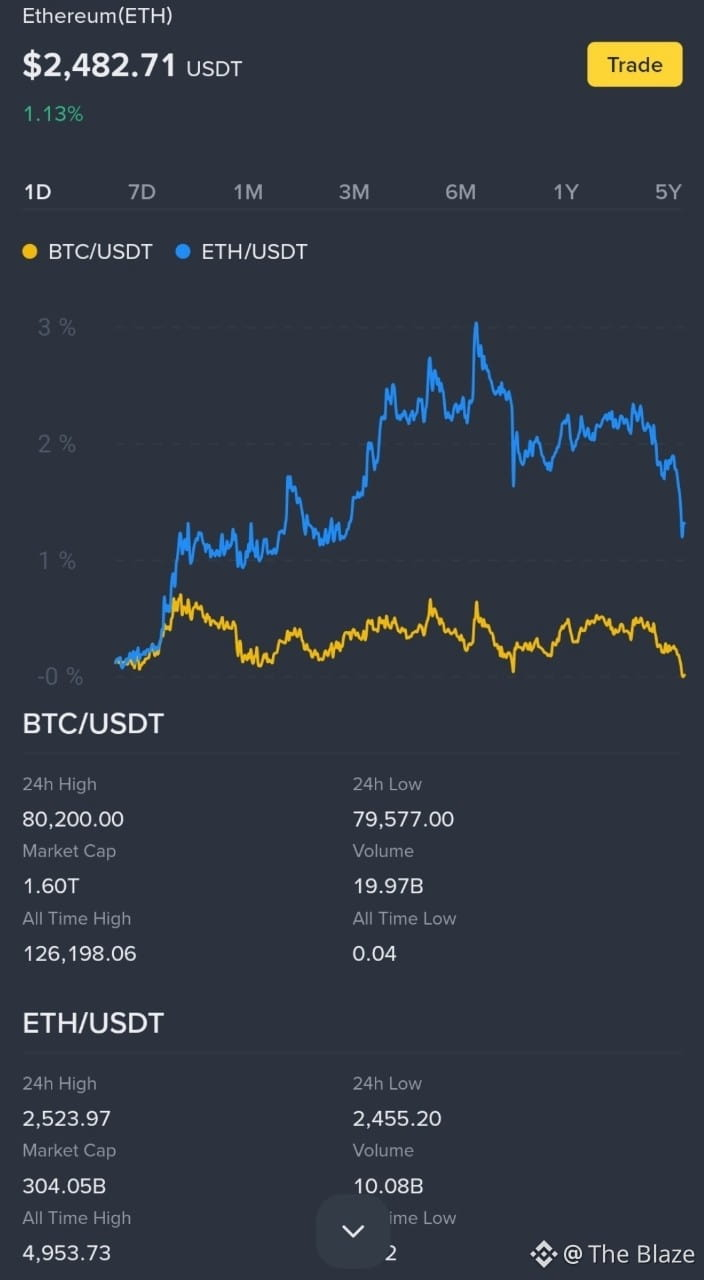
📊 $BTC Analyse:$BTC handelt bei etwa $79,655 (24h-Spanne $79,577–$80,200). Der 1H-Zeitrahmen bildete ein bärisches MACD-Cross, obwohl die gleitenden Durchschnitte weiterhin bullisch ausgerichtet sind.
Wichtige $BTC-Zonen:
• Sofortige Unterstützung: $79.5K–$79.6K (lokale Nachfrage)
• Untere Unterstützung: $78.8K–$79.0K (Imbalance-Zone)
• Widerstand: $80.15K–$80.25K (Spannendeckel)
• Liquiditätsmagnet: $83.0K–$83.5K (Short-Cluster)
Derivate: Die Funding-Rate liegt bei +0.0023 %, wobei 66.8% der Top-Trader Long-Positionen halten. Ein Fall unter $79.5K öffnet die Tür für Long-Stop-Hunts, doch solange diese Unterstützung hält, bleibt die obere Liquidität der primäre Magnet.
💬 Diskussions-Ecke:
Wird $BTC zuerst Shorts bei $83.5K abräumen oder in einen Long-Squeeze unter $79K fallen? Teile deine Gedanken unten! 👇
(Lies Teil 2 mit der $ETH-Analyse und zwei Marktszenarien im nächsten Beitrag!)
#BTC #ETH #CryptoAnalysis #Liquidation #BinanceSquare
⚠️ $BTC an der Widerstandszone: $2.77B an Short-Liquidationen in Sicht! ⚡ (Teil 1)
Der Markt ist in eine Squeeze-Phase eingetreten: Die $BTC-Preise halten sich in einer engen Spanne, das Open Interest steigt nicht stark an, aber auf beiden Seiten bauen sich gehebelte Positionen auf. In solchen Bedingungen beginnen Bewegungen oft mit einer Liquidationsjagd statt mit einem sauberen Ausbruch.
📌 News Trigger:
Oberhalb von 83,482 fürBTC hat sich ein massiver Short-Liquidationsbereich von etwa $2.77B gebildet. Dies dient als starkes Ziel für den Markt: Ein Anstieg über die lokalen Hochs könnte eine Kaskade erzwungener Short-Eindeckungen auslösen.
Positive Funding-Raten zeigen, dass Long-Halter Shorts bezahlen. Treibstoff für einen Short Squeeze ist vorhanden, aber das starke Long-Segment bleibt anfällig für Rücksetzer.
📊 $BTC Analyse:$BTC handelt bei etwa $79,655 (24h-Spanne $79,577–$80,200). Der 1H-Zeitrahmen bildete ein bärisches MACD-Cross, obwohl die gleitenden Durchschnitte weiterhin bullisch ausgerichtet sind.
Wichtige $BTC-Zonen:
• Sofortige Unterstützung: $79.5K–$79.6K (lokale Nachfrage)
• Untere Unterstützung: $78.8K–$79.0K (Imbalance-Zone)
• Widerstand: $80.15K–$80.25K (Spannendeckel)
• Liquiditätsmagnet: $83.0K–$83.5K (Short-Cluster)
Derivate: Die Funding-Rate liegt bei +0.0023 %, wobei 66.8% der Top-Trader Long-Positionen halten. Ein Fall unter $79.5K öffnet die Tür für Long-Stop-Hunts, doch solange diese Unterstützung hält, bleibt die obere Liquidität der primäre Magnet.
💬 Diskussions-Ecke:
Wird $BTC zuerst Shorts bei $83.5K abräumen oder in einen Long-Squeeze unter $79K fallen? Teile deine Gedanken unten! 👇
(Lies Teil 2 mit der $ETH-Analyse und zwei Marktszenarien im nächsten Beitrag!)
#BTC #ETH #CryptoAnalysis #Liquidation #BinanceSquare
Der Markt ist in eine Squeeze-Phase eingetreten: Die $BTC-Preise halten sich in einer engen Spanne, das Open Interest steigt nicht stark an, aber auf beiden Seiten bauen sich gehebelte Positionen auf. In solchen Bedingungen beginnen Bewegungen oft mit einer Liquidationsjagd statt mit einem sauberen Ausbruch.
📌 News Trigger:
Oberhalb von 83,482 fürBTC hat sich ein massiver Short-Liquidationsbereich von etwa $2.77B gebildet. Dies dient als starkes Ziel für den Markt: Ein Anstieg über die lokalen Hochs könnte eine Kaskade erzwungener Short-Eindeckungen auslösen.
Positive Funding-Raten zeigen, dass Long-Halter Shorts bezahlen. Treibstoff für einen Short Squeeze ist vorhanden, aber das starke Long-Segment bleibt anfällig für Rücksetzer.
📊 $BTC Analyse:$BTC handelt bei etwa $79,655 (24h-Spanne $79,577–$80,200). Der 1H-Zeitrahmen bildete ein bärisches MACD-Cross, obwohl die gleitenden Durchschnitte weiterhin bullisch ausgerichtet sind.
Wichtige $BTC-Zonen:
• Sofortige Unterstützung: $79.5K–$79.6K (lokale Nachfrage)
• Untere Unterstützung: $78.8K–$79.0K (Imbalance-Zone)
• Widerstand: $80.15K–$80.25K (Spannendeckel)
• Liquiditätsmagnet: $83.0K–$83.5K (Short-Cluster)
Derivate: Die Funding-Rate liegt bei +0.0023 %, wobei 66.8% der Top-Trader Long-Positionen halten. Ein Fall unter $79.5K öffnet die Tür für Long-Stop-Hunts, doch solange diese Unterstützung hält, bleibt die obere Liquidität der primäre Magnet.
💬 Diskussions-Ecke:
Wird $BTC zuerst Shorts bei $83.5K abräumen oder in einen Long-Squeeze unter $79K fallen? Teile deine Gedanken unten! 👇
(Lies Teil 2 mit der $ETH-Analyse und zwei Marktszenarien im nächsten Beitrag!)
#BTC #ETH #CryptoAnalysis #Liquidation #BinanceSquare
2
38
·
--
ETH überhitzt, aber stärker als BTC? 2 Marktszenarien 📉🟢🔴 (Teil 2)
In Teil 1 haben wir $BTC und den massiven Liquidationsmagneten von 2,77 Mrd. $ behandelt. Jetzt tauchen wir in $ETH und globale Marktszenarien ein.
📉 $ETH-Analyse: Outperformance & Leverage-Risiko
$ETH wird um $2.489 gehandelt (+30,8 % in 30 Tagen). Ethereum übertrifft Bitcoin weiterhin auf monatlicher Basis, aber sein Derivatemarkt ist deutlich überhitzter.
Wichtige $ETH-Zonen:
• Sofortige Unterstützung: $2.455–$2.480 (Intraday-Balance)
• Nächste Unterstützung: $2.356–$2.400 (Nachfrage-Orderblock)
• Globale Unterstützung: $2.217–$2.312 (SuperTrend + MA25)
• Widerstand: $2.524–$2.547 (Wochenhochs)
• Hauptwiderstand: $2.566+ (30-Tage-Hoch)
Derivate: Die $ETH-Finanzierungsrate ist hoch (+0,0071 %), wobei Long-Positionen 69,4 % erreichen. Der Bereich $2.455–$2.400 dient als wichtiger Stresstest für Käufer während eines Rücksetzers.
🔮 Zwei Hauptszenarien:
🟢 Bullisch: $BTC hält $79,1K–$79,5K und bricht bei steigendem Volumen über $80,2K aus ➔ Ziele $82,3K und $83,5K+.$ETH bestätigt dies, indem es über $2.547 bleibt.
🔴 Bärisch: $BTC verliert $79K ➔ Stop-Hunt drückt die Preise in Richtung $76,3K–$77K. $ETH, belastet durch hohe Funding-Raten, fällt zurück, um $2.400–$2.356 zu testen.
💬 Diskussionsrunde:
Glaubst du, dass $ETH 2.455 halten wird, wennBTC einen lokalen Rücksetzer erlebt? Teile deine Prognosen unten! 👇
#ETH #CryptoAnalysis #Liquidation #BinanceSquare
Binance Spot- und Futures-Daten wurden am 2026-09-06 aktualisiert. Dieser Inhalt dient nur zu Informationszwecken und stellt keine Finanzberatung dar.
ETH überhitzt, aber stärker als BTC? 2 Marktszenarien 📉🟢🔴 (Teil 2)
In Teil 1 haben wir $BTC und den massiven Liquidationsmagneten von 2,77 Mrd. $ behandelt. Jetzt tauchen wir in $ETH und globale Marktszenarien ein.
📉 $ETH-Analyse: Outperformance & Leverage-Risiko
$ETH wird um $2.489 gehandelt (+30,8 % in 30 Tagen). Ethereum übertrifft Bitcoin weiterhin auf monatlicher Basis, aber sein Derivatemarkt ist deutlich überhitzter.
Wichtige $ETH-Zonen:
• Sofortige Unterstützung: $2.455–$2.480 (Intraday-Balance)
• Nächste Unterstützung: $2.356–$2.400 (Nachfrage-Orderblock)
• Globale Unterstützung: $2.217–$2.312 (SuperTrend + MA25)
• Widerstand: $2.524–$2.547 (Wochenhochs)
• Hauptwiderstand: $2.566+ (30-Tage-Hoch)
Derivate: Die $ETH-Finanzierungsrate ist hoch (+0,0071 %), wobei Long-Positionen 69,4 % erreichen. Der Bereich $2.455–$2.400 dient als wichtiger Stresstest für Käufer während eines Rücksetzers.
🔮 Zwei Hauptszenarien:
🟢 Bullisch: $BTC hält $79,1K–$79,5K und bricht bei steigendem Volumen über $80,2K aus ➔ Ziele $82,3K und $83,5K+.$ETH bestätigt dies, indem es über $2.547 bleibt.
🔴 Bärisch: $BTC verliert $79K ➔ Stop-Hunt drückt die Preise in Richtung $76,3K–$77K. $ETH, belastet durch hohe Funding-Raten, fällt zurück, um $2.400–$2.356 zu testen.
💬 Diskussionsrunde:
Glaubst du, dass $ETH 2.455 halten wird, wennBTC einen lokalen Rücksetzer erlebt? Teile deine Prognosen unten! 👇
#ETH #CryptoAnalysis #Liquidation #BinanceSquare
Binance Spot- und Futures-Daten wurden am 2026-09-06 aktualisiert. Dieser Inhalt dient nur zu Informationszwecken und stellt keine Finanzberatung dar.
In Teil 1 haben wir $BTC und den massiven Liquidationsmagneten von 2,77 Mrd. $ behandelt. Jetzt tauchen wir in $ETH und globale Marktszenarien ein.
📉 $ETH-Analyse: Outperformance & Leverage-Risiko
$ETH wird um $2.489 gehandelt (+30,8 % in 30 Tagen). Ethereum übertrifft Bitcoin weiterhin auf monatlicher Basis, aber sein Derivatemarkt ist deutlich überhitzter.
Wichtige $ETH-Zonen:
• Sofortige Unterstützung: $2.455–$2.480 (Intraday-Balance)
• Nächste Unterstützung: $2.356–$2.400 (Nachfrage-Orderblock)
• Globale Unterstützung: $2.217–$2.312 (SuperTrend + MA25)
• Widerstand: $2.524–$2.547 (Wochenhochs)
• Hauptwiderstand: $2.566+ (30-Tage-Hoch)
Derivate: Die $ETH-Finanzierungsrate ist hoch (+0,0071 %), wobei Long-Positionen 69,4 % erreichen. Der Bereich $2.455–$2.400 dient als wichtiger Stresstest für Käufer während eines Rücksetzers.
🔮 Zwei Hauptszenarien:
🟢 Bullisch: $BTC hält $79,1K–$79,5K und bricht bei steigendem Volumen über $80,2K aus ➔ Ziele $82,3K und $83,5K+.$ETH bestätigt dies, indem es über $2.547 bleibt.
🔴 Bärisch: $BTC verliert $79K ➔ Stop-Hunt drückt die Preise in Richtung $76,3K–$77K. $ETH, belastet durch hohe Funding-Raten, fällt zurück, um $2.400–$2.356 zu testen.
💬 Diskussionsrunde:
Glaubst du, dass $ETH 2.455 halten wird, wennBTC einen lokalen Rücksetzer erlebt? Teile deine Prognosen unten! 👇
#ETH #CryptoAnalysis #Liquidation #BinanceSquare
Binance Spot- und Futures-Daten wurden am 2026-09-06 aktualisiert. Dieser Inhalt dient nur zu Informationszwecken und stellt keine Finanzberatung dar.
1
146
·
--
$BTC an Widerstand: $2.77B Short-Liquidationen in Sicht! ⚡ (Teil 1)
Der Kryptomarkt ist in eine Squeeze-Phase eingetreten: Die $BTC-Preise halten sich nahe lokaler Widerstandsniveaus, während Derivate eine moderate Long-Tendenz zeigen. Dies ist ein klassisches Setup für eine volatile Bewegung.
📌 Auslöser:
In den letzten 48 Stunden hat sich oberhalb von $83,482 ein massiver Pool an Short-Liquidationen gebildet (geschätzt auf ca. $2.77B). Dies wirkt als starker "Magnet" für die Kursentwicklung. Ein Anstieg über die lokalen Hochs könnte eine Kaskade von Short-Squeezes auslösen.
📊 $BTC Analyse:
Zum Zeitpunkt der Analyse wird $BTC bei etwa $79,776 gehandelt (+24.0% über 30 Tage). Das tägliche MACD hat ein bärisches Kreuz gebildet — ein Signal für nachlassendes Momentum statt einer Trendwende.
Wichtige $BTC-Zonen:
• Sofortige Unterstützung: $79.1K–$79.5K (Tägliche MA7)
• Nächste Unterstützung: $76.3K–$77.0K (Wöchentliche Tiefs)
• Globale Unterstützung: $72.9K–$74.5K (SuperTrend + MA25)
• Widerstand: $80.2K–$82.3K (Lokale Decke)
• Größerer Liquiditätspool: $83.5K+ (Short-Cluster)
Derivate: Die Funding Rate bleibt positiv (+0.0023%), wobei 66.8% der Top-Trader Long-Positionen halten. Ein Ausbruch über $82.3K könnte einen Squeeze nach oben entfachen, aber schwaches Volumen birgt das Risiko eines Long-Stop-Hunts bis in die $79K–$76K-Zone.
💬 Diskussionsrunde:
Wird $BTC zuerst die Short-Liquidationen oberhalb von $83.5K abräumen, oder sehen wir zuerst einen Long-Squeeze nach unten bis $76K? Teilt eure Gedanken unten! 👇
(Lest Teil 2 mit der $ETH-Analyse und zwei Marktszenarien im nächsten Beitrag!)
#BTC #CryptoAnalysis #Liquidation #BinanceSquare
Binance Spot- und Futures-Daten wurden am 2026-09-06 aktualisiert. Dieser Inhalt dient nur zu Informationszwecken und stellt keine Finanzberatung dar.
$BTC an Widerstand: $2.77B Short-Liquidationen in Sicht! ⚡ (Teil 1)
Der Kryptomarkt ist in eine Squeeze-Phase eingetreten: Die $BTC-Preise halten sich nahe lokaler Widerstandsniveaus, während Derivate eine moderate Long-Tendenz zeigen. Dies ist ein klassisches Setup für eine volatile Bewegung.
📌 Auslöser:
In den letzten 48 Stunden hat sich oberhalb von $83,482 ein massiver Pool an Short-Liquidationen gebildet (geschätzt auf ca. $2.77B). Dies wirkt als starker "Magnet" für die Kursentwicklung. Ein Anstieg über die lokalen Hochs könnte eine Kaskade von Short-Squeezes auslösen.
📊 $BTC Analyse:
Zum Zeitpunkt der Analyse wird $BTC bei etwa $79,776 gehandelt (+24.0% über 30 Tage). Das tägliche MACD hat ein bärisches Kreuz gebildet — ein Signal für nachlassendes Momentum statt einer Trendwende.
Wichtige $BTC-Zonen:
• Sofortige Unterstützung: $79.1K–$79.5K (Tägliche MA7)
• Nächste Unterstützung: $76.3K–$77.0K (Wöchentliche Tiefs)
• Globale Unterstützung: $72.9K–$74.5K (SuperTrend + MA25)
• Widerstand: $80.2K–$82.3K (Lokale Decke)
• Größerer Liquiditätspool: $83.5K+ (Short-Cluster)
Derivate: Die Funding Rate bleibt positiv (+0.0023%), wobei 66.8% der Top-Trader Long-Positionen halten. Ein Ausbruch über $82.3K könnte einen Squeeze nach oben entfachen, aber schwaches Volumen birgt das Risiko eines Long-Stop-Hunts bis in die $79K–$76K-Zone.
💬 Diskussionsrunde:
Wird $BTC zuerst die Short-Liquidationen oberhalb von $83.5K abräumen, oder sehen wir zuerst einen Long-Squeeze nach unten bis $76K? Teilt eure Gedanken unten! 👇
(Lest Teil 2 mit der $ETH-Analyse und zwei Marktszenarien im nächsten Beitrag!)
#BTC #CryptoAnalysis #Liquidation #BinanceSquare
Binance Spot- und Futures-Daten wurden am 2026-09-06 aktualisiert. Dieser Inhalt dient nur zu Informationszwecken und stellt keine Finanzberatung dar.
Der Kryptomarkt ist in eine Squeeze-Phase eingetreten: Die $BTC-Preise halten sich nahe lokaler Widerstandsniveaus, während Derivate eine moderate Long-Tendenz zeigen. Dies ist ein klassisches Setup für eine volatile Bewegung.
📌 Auslöser:
In den letzten 48 Stunden hat sich oberhalb von $83,482 ein massiver Pool an Short-Liquidationen gebildet (geschätzt auf ca. $2.77B). Dies wirkt als starker "Magnet" für die Kursentwicklung. Ein Anstieg über die lokalen Hochs könnte eine Kaskade von Short-Squeezes auslösen.
📊 $BTC Analyse:
Zum Zeitpunkt der Analyse wird $BTC bei etwa $79,776 gehandelt (+24.0% über 30 Tage). Das tägliche MACD hat ein bärisches Kreuz gebildet — ein Signal für nachlassendes Momentum statt einer Trendwende.
Wichtige $BTC-Zonen:
• Sofortige Unterstützung: $79.1K–$79.5K (Tägliche MA7)
• Nächste Unterstützung: $76.3K–$77.0K (Wöchentliche Tiefs)
• Globale Unterstützung: $72.9K–$74.5K (SuperTrend + MA25)
• Widerstand: $80.2K–$82.3K (Lokale Decke)
• Größerer Liquiditätspool: $83.5K+ (Short-Cluster)
Derivate: Die Funding Rate bleibt positiv (+0.0023%), wobei 66.8% der Top-Trader Long-Positionen halten. Ein Ausbruch über $82.3K könnte einen Squeeze nach oben entfachen, aber schwaches Volumen birgt das Risiko eines Long-Stop-Hunts bis in die $79K–$76K-Zone.
💬 Diskussionsrunde:
Wird $BTC zuerst die Short-Liquidationen oberhalb von $83.5K abräumen, oder sehen wir zuerst einen Long-Squeeze nach unten bis $76K? Teilt eure Gedanken unten! 👇
(Lest Teil 2 mit der $ETH-Analyse und zwei Marktszenarien im nächsten Beitrag!)
#BTC #CryptoAnalysis #Liquidation #BinanceSquare
Binance Spot- und Futures-Daten wurden am 2026-09-06 aktualisiert. Dieser Inhalt dient nur zu Informationszwecken und stellt keine Finanzberatung dar.
1
110
·
--
🚨 BTCUSDT ECHT
→ ECHTER BID-DRUCK | Imb: 6.04x | KaufVol: 20.203
Preis: 79795.02
Aktion: 🟢 KAUFEN
📍 Einstieg: 79795.0545
TP: 1.5% | SL: 0.7%
Max. Haltedauer: 3600s
⏱ 16:35:02 UTC
🚨 BTCUSDT ECHT
→ ECHTER BID-DRUCK | Imb: 6.04x | KaufVol: 20.203
Preis: 79795.02
Aktion: 🟢 KAUFEN
📍 Einstieg: 79795.0545
TP: 1.5% | SL: 0.7%
Max. Haltedauer: 3600s
⏱ 16:35:02 UTC
→ ECHTER BID-DRUCK | Imb: 6.04x | KaufVol: 20.203
Preis: 79795.02
Aktion: 🟢 KAUFEN
📍 Einstieg: 79795.0545
TP: 1.5% | SL: 0.7%
Max. Haltedauer: 3600s
⏱ 16:35:02 UTC
70
Anmelden und weiter Inhalte entdecken
Krypto-Nutzer weltweit auf Binance Square kennenlernen
⚡️ Bleib in Sachen Krypto stets am Puls.
💬 Die weltgrößte Kryptobörse vertraut darauf.
👍 Erhalte verlässliche Einblicke von verifizierten Creators.
E-Mail-Adresse/Telefonnummer
Trendthemen
CFTCUpdatesGuidanceOnTokenizedAssets
1,010 Aufrufe
72 Kommentare
#CFTCUpdatesGuidanceOnTokenizedAssets CFTC aktualisiert Leitlinien zu tokenisierten Vermögenswerten!
Die US-amerikanische Commodity Futures Trading Commission (CFTC) hat aktualisierte Leitlinien und FAQs zu tokenisierten Vermögenswerten und Blockchain-Aufzeichnungen veröffentlicht:
Zugelassene tokenisierte Anlagen: Autorisierte Unternehmen können die Kundengelder nun in tokenisierte Formen von Vermögenswerten investieren, sofern die tokenisierten Versionen identische oder funktional gleichwertige rechtliche und wirtschaftliche Rechte wie herkömmliche Vermögenswerte bieten.
Blockchain-Aufzeichnungen: Der Regulierer erhebt keinen Einwand dagegen, dass autorisierte Unternehmen Blockchain-Technologie nutzen, um die erforderlichen Aufzeichnungen zu führen.
Das größere Bild: Diese Aktualisierungen stellen einen bedeutenden Schritt dar, um regulatorische Klarheit im Bereich digitaler Vermögenswerte zu schaffen, da Finanzinstitute zunehmend die Brücke zwischen traditionellem Finanzwesen und Blockchain-Infrastruktur schlagen.
#CryptoRegulations #Tokenization #Blockchain #Web3 $BTC $BNB $USDC
kabiraa15RR
·0 Likes
·8 Aufrufe
BitgetSays$352MAffectedInHack
78 Aufrufe
5 Kommentare
BinanceWillListHyperliquid(HYPE)
158,429 Aufrufe
2,639 Kommentare