

Crypto Trader 343
275 Beiträge

Crypto Trader 343
Melden
Nutzer blockieren
Thanks for Sporting Me. and Follow me For More.....
1 Following
25 Follower
260 Like gegeben
Beiträge
Artikel
Übersetzung ansehen
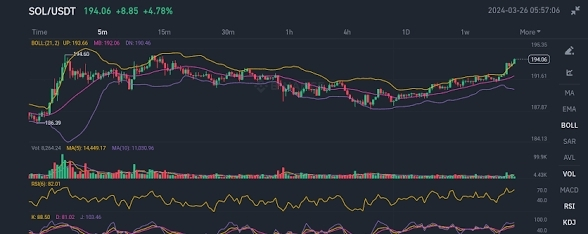
SOL/USD Technical Analysis📊 $SOL /USD Technical Analysis
{spot}(SOLUSDT)
Solana ($SOL ) vs US Dollar — October 28, 2026
1. Current Market Overview
Solana (SOL) is showing short-term bullish momentum, but the price is approaching resistance where a pullback could occur.
Current price: Approximately $102.90
24-hour change: Approximately +1.6% to +3.3%, depending on the data source and timestamp.
Short-term trend: Bullish
Market condition: Potentially overbought on shorter timeframes.
Overall bias: Bullish, but confirmation is needed before entering a trade.
2. Important Support and Resistance Levels
Level Price (USD) Significance
Resistance 3 $112.79 Major upside target
Resistance 2 $106.28 Secondary resistance
Resistance 1 $103.56 Immediate resistance
Current Price $102.90 Current market area
Support 1 $99.13 Immediate support
Support 2 $96.72 Secondary support
Support 3 $91.07 Major support
These levels are based on published daily technical analysis and may change as the market moves.
3. Technical Indicator Analysis
Moving averages: Shorter-term moving averages are generally indicating bullish momentum.
RSI: Some intraday readings are above 70, suggesting overbought conditions and the possibility of a short-term pullback.
MACD: Positive readings on several intraday analyses support the current bullish momentum.
Trend strength: ADX readings above 25 in the cited intraday analysis indicate a relatively strong trend, although ADX alone does not establish direction.
4. Trading Scenarios
🟢 Scenario A: Bullish Trade (BUY)
Entry condition:
Wait for a confirmed breakout above $103.56.
Look for a successful retest of the breakout level.
Potential targets:
TP1: $106.28
TP2: $110.00
TP3: $112.79
Stop-loss idea: Below the confirmed retest low.
Risk: A breakout without strong buying volume could turn into a false breakout.
🔴 Scenario B: Bearish Trade (SELL)
Entry condition:
Watch for rejection near $103.50–$104.00.
Look for a break below $99.13 for stronger bearish confirmation.
Potential targets:
TP1: $96.72
TP2: $94.00
TP3: $91.07
Stop-loss idea: Above the rejection high.
Risk: Strong buying pressure could invalidate the bearish setup.
These are conditional scenarios, not guaranteed price predictions.
5. My Trading Recommendation
Trading Factor Assessment
Short-term direction Bullish
Immediate resistance $103.56
Immediate support $99.13
Buying immediately Risky near resistance
Buying after breakout confirmation Potential opportunity
Selling Wait for bearish confirmation
My preferred approach
I would wait for confirmation rather than enter immediately.
BUY: If SOL breaks above $103.56 and successfully retests the level.
SELL: If SOL fails at resistance and bearish momentum develops.
NO TRADE: If the price continues moving sideways between support and resistance.
The market can move sharply in either direction, so use a stop-loss and avoid excessive leverage.
Note: The analysis uses published market data available on October 28, 2026. Verify the live price and chart before trading.
---
📈 Let me know your trading timeframe
Which timeframe do you trade?
1. 5-minute chart (scalping)
2. 15-minute chart
3. 1-hour chart
4. 4-hour chart
5. Daily chart (long-term)
Tell me your timeframe, and I can provide a more focused SOL/USD entry, stop-loss, and take-profit setup.
#EarningsSeason #solana
SOL/USD Technical Analysis
📊 $SOL /USD Technical Analysis
Solana ($SOL ) vs US Dollar — October 28, 2026
1. Current Market Overview
Solana (SOL) is showing short-term bullish momentum, but the price is approaching resistance where a pullback could occur.
Current price: Approximately $102.90
24-hour change: Approximately +1.6% to +3.3%, depending on the data source and timestamp.
Short-term trend: Bullish
Market condition: Potentially overbought on shorter timeframes.
Overall bias: Bullish, but confirmation is needed before entering a trade.
2. Important Support and Resistance Levels
Level Price (USD) Significance
Resistance 3 $112.79 Major upside target
Resistance 2 $106.28 Secondary resistance
Resistance 1 $103.56 Immediate resistance
Current Price $102.90 Current market area
Support 1 $99.13 Immediate support
Support 2 $96.72 Secondary support
Support 3 $91.07 Major support
These levels are based on published daily technical analysis and may change as the market moves.
3. Technical Indicator Analysis
Moving averages: Shorter-term moving averages are generally indicating bullish momentum.
RSI: Some intraday readings are above 70, suggesting overbought conditions and the possibility of a short-term pullback.
MACD: Positive readings on several intraday analyses support the current bullish momentum.
Trend strength: ADX readings above 25 in the cited intraday analysis indicate a relatively strong trend, although ADX alone does not establish direction.
4. Trading Scenarios
🟢 Scenario A: Bullish Trade (BUY)
Entry condition:
Wait for a confirmed breakout above $103.56.
Look for a successful retest of the breakout level.
Potential targets:
TP1: $106.28
TP2: $110.00
TP3: $112.79
Stop-loss idea: Below the confirmed retest low.
Risk: A breakout without strong buying volume could turn into a false breakout.
🔴 Scenario B: Bearish Trade (SELL)
Entry condition:
Watch for rejection near $103.50–$104.00.
Look for a break below $99.13 for stronger bearish confirmation.
Potential targets:
TP1: $96.72
TP2: $94.00
TP3: $91.07
Stop-loss idea: Above the rejection high.
Risk: Strong buying pressure could invalidate the bearish setup.
These are conditional scenarios, not guaranteed price predictions.
5. My Trading Recommendation
Trading Factor Assessment
Short-term direction Bullish
Immediate resistance $103.56
Immediate support $99.13
Buying immediately Risky near resistance
Buying after breakout confirmation Potential opportunity
Selling Wait for bearish confirmation
My preferred approach
I would wait for confirmation rather than enter immediately.
BUY: If SOL breaks above $103.56 and successfully retests the level.
SELL: If SOL fails at resistance and bearish momentum develops.
NO TRADE: If the price continues moving sideways between support and resistance.
The market can move sharply in either direction, so use a stop-loss and avoid excessive leverage.
Note: The analysis uses published market data available on October 28, 2026. Verify the live price and chart before trading.
---
📈 Let me know your trading timeframe
Which timeframe do you trade?
1. 5-minute chart (scalping)
2. 15-minute chart
3. 1-hour chart
4. 4-hour chart
5. Daily chart (long-term)
Tell me your timeframe, and I can provide a more focused SOL/USD entry, stop-loss, and take-profit setup.
#EarningsSeason #solana
27
Artikel
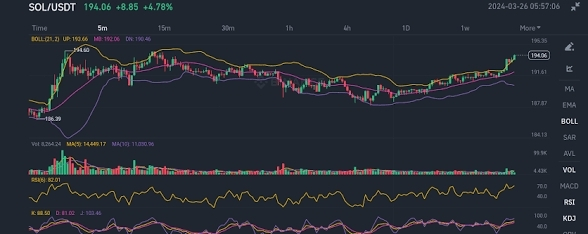
Technische Analyse von SOL/USD📊 $SOL /USD – Technische Analyse
Solana (SOL) vs. US-Dollar — 28. Oktober 2026
1. Aktueller Marktüberblick
Solana ($SOL ) zeigt kurzfristig eine bullische Dynamik, doch der Kurs nähert sich einem Widerstand, an dem es zu einem Rücksetzer kommen könnte.
Aktueller Kurs: etwa 102,90 $
Veränderung innerhalb von 24 Stunden: etwa +1,6 % bis +3,3 %, abhängig von Datenquelle und Zeitstempel.
Kurzfristiger Trend: Bullisch
Marktlage: Auf kürzeren Zeitebenen möglicherweise überkauft.
Allgemeine Tendenz: Bullisch, aber vor einem Einstieg in einen Trade ist eine Bestätigung erforderlich.
Technische Analyse von SOL/USD
📊 $SOL /USD – Technische Analyse
Solana (SOL) vs. US-Dollar — 28. Oktober 2026
1. Aktueller Marktüberblick
Solana ($SOL ) zeigt kurzfristig eine bullische Dynamik, doch der Kurs nähert sich einem Widerstand, an dem es zu einem Rücksetzer kommen könnte.
Aktueller Kurs: etwa 102,90 $
Veränderung innerhalb von 24 Stunden: etwa +1,6 % bis +3,3 %, abhängig von Datenquelle und Zeitstempel.
Kurzfristiger Trend: Bullisch
Marktlage: Auf kürzeren Zeitebenen möglicherweise überkauft.
Allgemeine Tendenz: Bullisch, aber vor einem Einstieg in einen Trade ist eine Bestätigung erforderlich.
35
Artikel
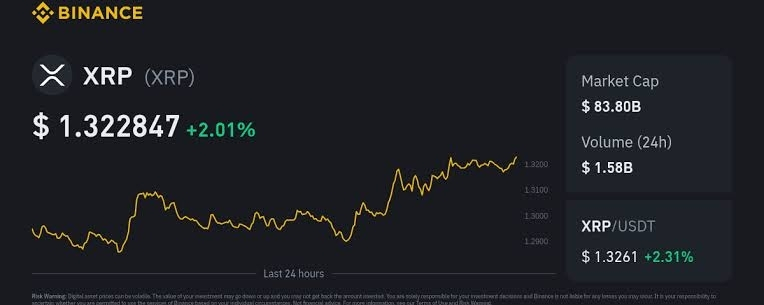
Technische Analyse von XRP/USD📊 $XRP /USD – Technische Analyse
Datum: 28. Oktober 2026
1. Aktueller Marktüberblick
Den neuesten verfügbaren technischen Daten zufolge wird $XRP /USD bei etwa 1,32–1,33 $ gehandelt. Der kurzfristige Ausblick ist vorsichtig bullisch, obwohl der mittelfristige Trend weiterhin unter Druck steht.
Indikator Aktuelle Analyse
Aktueller Kurs Etwa 1,33 $
Kurzfristiger Trend Bullisch
Mittelfristiger Trend Bärisch
Täglicher RSI Etwa 45
Unmittelbare Unterstützung 1,3145 $
Unmittelbarer Widerstand 1,345 $
Gesamteinschätzung Vorsichtig bullisch
Der tägliche RSI liegt bei etwa 45 und deutet darauf hin, dass die Dynamik eher neutral ist und weder stark bullisch noch bärisch ausfällt.
Technische Analyse von XRP/USD
📊 $XRP /USD – Technische Analyse
Datum: 28. Oktober 2026
1. Aktueller Marktüberblick
Den neuesten verfügbaren technischen Daten zufolge wird $XRP /USD bei etwa 1,32–1,33 $ gehandelt. Der kurzfristige Ausblick ist vorsichtig bullisch, obwohl der mittelfristige Trend weiterhin unter Druck steht.
Indikator Aktuelle Analyse
Aktueller Kurs Etwa 1,33 $
Kurzfristiger Trend Bullisch
Mittelfristiger Trend Bärisch
Täglicher RSI Etwa 45
Unmittelbare Unterstützung 1,3145 $
Unmittelbarer Widerstand 1,345 $
Gesamteinschätzung Vorsichtig bullisch
Der tägliche RSI liegt bei etwa 45 und deutet darauf hin, dass die Dynamik eher neutral ist und weder stark bullisch noch bärisch ausfällt.
62
Artikel
Übersetzung ansehen
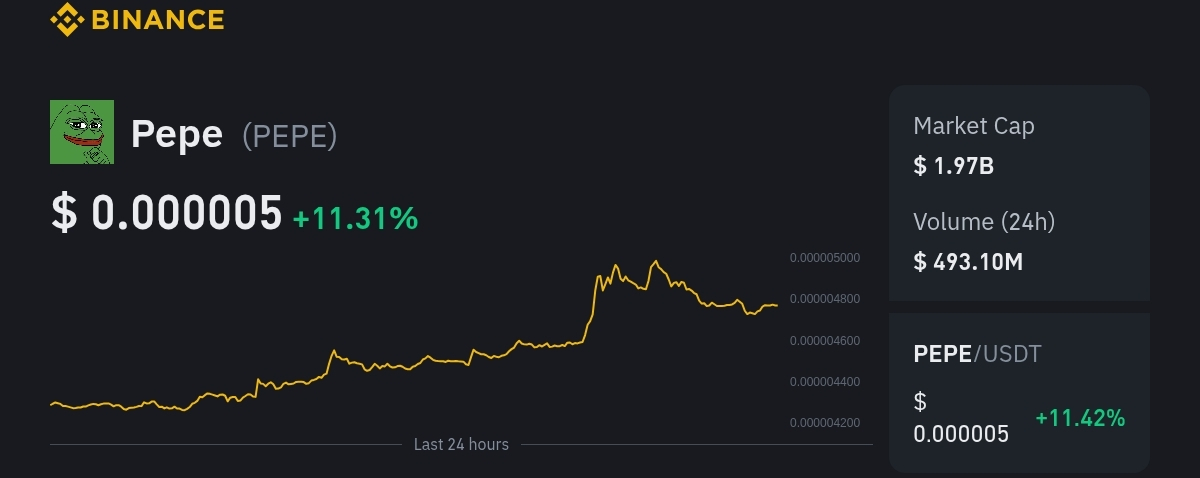
PEPE/USD Technical Analysis📊 $PEPE /USD Technical Analysis
{spot}(PEPEUSDT)
Date: October 28, 2026
1. Market Overview
PEPE/USD is showing a potentially bullish trend, but a short-term pullback remains possible.
Indicator Analysis
Market Trend Bullish bias
Market Type High-volatility meme coin
Trading Risk High
Strategy Wait for breakout confirmation
2. Important Support and Resistance Levels
Level Price (USD) Significance
Resistance 3 $0.00000568 Major resistance
Resistance 2 $0.00000532 Secondary resistance
Resistance 1 $0.00000509 Immediate resistance
Current Price Reference $0.00000490 Previous analysis reference
Support 1 $0.00000446 Important support
Support 2 $0.00000421 Secondary support
Support 3 $0.00000400 Major support
These are reference levels from the previous analysis, not verified live prices.
3. BUY Setup 🟢
Potential entry: Only after a confirmed breakout above $0.00000509.
Entry: Around $0.00000510 after confirmation
Take Profit 1: $0.00000532
Take Profit 2: $0.00000568
Stop Loss: Below the breakout level, depending on your risk tolerance
Confirmation signals:
A candle closes above resistance.
Trading volume increases.
The price successfully retests the breakout level.
Avoid buying immediately after a sharp price increase without confirmation.
4. SELL Setup 🔴
A bearish setup may develop if PEPE breaks below $0.00000446.
Entry: After a confirmed breakdown
Take Profit 1: $0.00000421
Take Profit 2: $0.00000400
Stop Loss: Above the broken support level, adjusted for volatility
Wait for confirmation to reduce the risk of entering during a false breakdown.
5. Bullish vs. Bearish Scenarios
Scenario Confirmation Potential Target
Bullish Break above $0.00000509 $0.00000532
Strong Bullish Break above $0.00000532 $0.00000568
Bearish Break below $0.00000446 $0.00000421
Strong Bearish Break below $0.00000421 $0.00000400
6. My Trading Strategy
My preferred approach would be to wait for confirmation rather than entering immediately.
BUY: If resistance breaks and the price holds above it.
SELL: If support breaks and the price remains below it.
WAIT: If the price stays between support and resistance without a clear direction.
Use a stop-loss and avoid excessive leverage because PEPE can experience sudden price movements.
Which timeframe do you use for PEPE/USD?
1. 15-minute chart — Scalping
2. 1-hour chart — Intraday trading
3. 4-hour chart — Swing trading
4. Daily chart — Long-term trend
PEPE/USD Technical Analysis
📊 $PEPE /USD Technical Analysis
Date: October 28, 2026
1. Market Overview
PEPE/USD is showing a potentially bullish trend, but a short-term pullback remains possible.
Indicator Analysis
Market Trend Bullish bias
Market Type High-volatility meme coin
Trading Risk High
Strategy Wait for breakout confirmation
2. Important Support and Resistance Levels
Level Price (USD) Significance
Resistance 3 $0.00000568 Major resistance
Resistance 2 $0.00000532 Secondary resistance
Resistance 1 $0.00000509 Immediate resistance
Current Price Reference $0.00000490 Previous analysis reference
Support 1 $0.00000446 Important support
Support 2 $0.00000421 Secondary support
Support 3 $0.00000400 Major support
These are reference levels from the previous analysis, not verified live prices.
3. BUY Setup 🟢
Potential entry: Only after a confirmed breakout above $0.00000509.
Entry: Around $0.00000510 after confirmation
Take Profit 1: $0.00000532
Take Profit 2: $0.00000568
Stop Loss: Below the breakout level, depending on your risk tolerance
Confirmation signals:
A candle closes above resistance.
Trading volume increases.
The price successfully retests the breakout level.
Avoid buying immediately after a sharp price increase without confirmation.
4. SELL Setup 🔴
A bearish setup may develop if PEPE breaks below $0.00000446.
Entry: After a confirmed breakdown
Take Profit 1: $0.00000421
Take Profit 2: $0.00000400
Stop Loss: Above the broken support level, adjusted for volatility
Wait for confirmation to reduce the risk of entering during a false breakdown.
5. Bullish vs. Bearish Scenarios
Scenario Confirmation Potential Target
Bullish Break above $0.00000509 $0.00000532
Strong Bullish Break above $0.00000532 $0.00000568
Bearish Break below $0.00000446 $0.00000421
Strong Bearish Break below $0.00000421 $0.00000400
6. My Trading Strategy
My preferred approach would be to wait for confirmation rather than entering immediately.
BUY: If resistance breaks and the price holds above it.
SELL: If support breaks and the price remains below it.
WAIT: If the price stays between support and resistance without a clear direction.
Use a stop-loss and avoid excessive leverage because PEPE can experience sudden price movements.
Which timeframe do you use for PEPE/USD?
1. 15-minute chart — Scalping
2. 1-hour chart — Intraday trading
3. 4-hour chart — Swing trading
4. Daily chart — Long-term trend
1
71
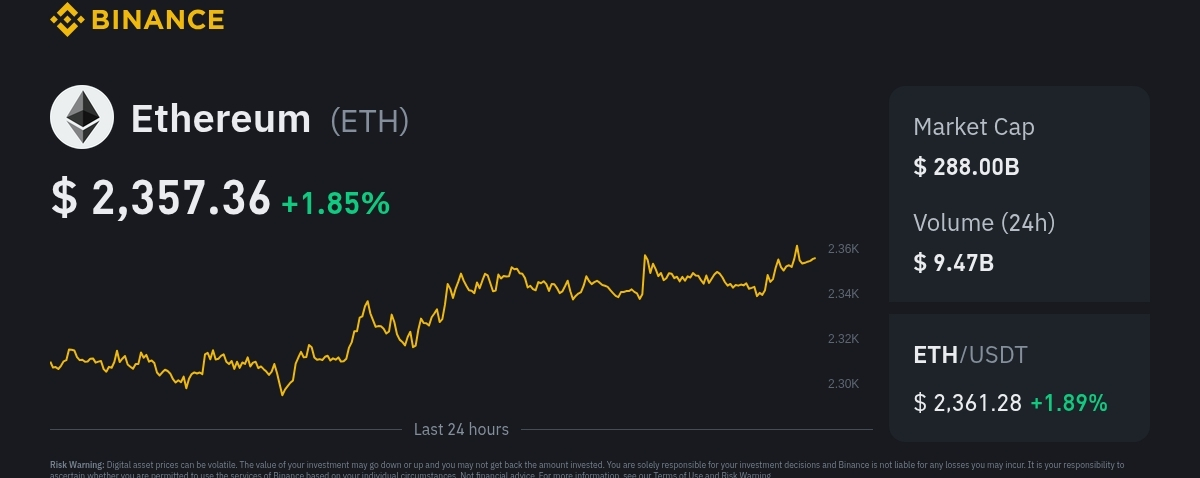
Artikel
Übersetzung ansehen
ETH/USDT Technical Analysis📊 $ETH /USDT Technical Analysis
Date: October 28, 2026
Trading pair: Ethereum / Tether (ETH/USDT)
{spot}(ETHUSDT)
1. Current Market Situation
Ethereum is trading around $2,340–$2,350 based on the latest available market analysis. ETH is showing a short-term recovery, but the overall daily trend remains weak.
Indicator Analysis
Current price Around $2,345
Short-term trend Bearish to neutral
Daily trend Bearish
RSI (Daily) Around 37
Immediate support $2,300–$2,315
Immediate resistance $2,370–$2,400
Market sentiment Cautious / bearish
2. Important Support and Resistance Levels
🟢 Support Levels
These are areas where buyers might enter the market.
S1: $2,315 — Immediate support
S2: $2,287 — Secondary support
S3: $2,270 — Additional downside support
Major support: $2,200 — Important lower level
A decisive break below $2,287 could increase selling pressure toward $2,200.
🔴 Resistance Levels
These are areas where selling pressure might appear.
R1: $2,370 — First resistance
R2: $2,382 — Important resistance
R3: $2,400 — Stronger resistance
Major resistance: $2,423–$2,450 — Potential recovery barrier
A breakout above $2,400, supported by strong buying volume, could open the way toward $2,423–$2,450.
---
3. ETH/USDT Trading Scenarios
📉 Scenario A: SELL Setup
My preferred bias: Sell on a confirmed breakdown or a failed resistance test.
Parameter Price
Entry zone $2,350–$2,370
Stop loss $2,405
Take profit 1 $2,315
Take profit 2 $2,287
Take profit 3 $2,270
Confirmation required:
Price fails to break above $2,370.
A bearish candle forms on the 15-minute or 1-hour chart.
Selling volume increases.
⚠️ Avoid entering a short position without confirmation, especially if ETH is recovering strongly.
📈 Scenario B: BUY Setup
A buy becomes more attractive if ETH breaks above resistance and holds it.
Parameter Price
Entry zone $2,385–$2,400 after confirmation
Stop loss $2,360
Take profit 1 $2,423
Take profit 2 $2,450
Take profit 3 $2,480
Confirmation required:
ETH breaks above $2,382.
A 15-minute or 1-hour candle closes above resistance.
Buying volume increases.
This bullish setup is invalidated if price falls back below the breakout zone.
These are illustrative trading scenarios, not guaranteed signals. Verify the levels against your exchange's live chart before entering.
---
4. RSI and Momentum Analysis
The daily RSI is approximately 37, indicating relatively weak momentum. It is approaching oversold territory but is not yet deeply oversold.
This suggests:
Sellers have had the advantage recently.
A short-term bounce remains possible.
A bullish reversal is not confirmed.
Further downside is possible if support breaks.
5. My ETH/USDT Forecast
Timeframe Outlook Key Level
Next 15 minutes Neutral / volatile $2,340–$2,370
Next 1–4 hours Neutral to bearish $2,315
Next 24 hours Bearish unless resistance breaks $2,287–$2,400
Bullish reversal Above $2,400 $2,423–$2,450
Bearish continuation Below $2,287 $2,200
These ranges are scenario estimates based on available technical levels, not guaranteed price predictions.
🎯 Final Trading Opinion
Current bias: BEARISH, but watch for a short-term bounce.
🔴 Below $2,315: Selling pressure may increase.
🔴 Below $2,287: Potential continuation toward $2,200.
🟢 Above $2,382: Short-term bullish momentum may strengthen.
🟢 Above $2,400: A recovery toward $2,423–$2,450 becomes more plausible.
My recommendation: Avoid chasing the market. Wait for a confirmed breakout or breakdown before entering a trade.
For risk management, consider risking no more than 1% of your trading capital on a single trade, and be particularly careful with leverage.
---
One question for you:
Which type of ETH/USDT analysis do you need?
1. Scalping — 1-minute and 5-minute charts.
2. Intraday trading — 15-minute and 1-hour charts.
3. Swing trading — 4-hour and daily charts.
#EthereumDropsBelow$2300 #Ethereum
ETH/USDT Technical Analysis
📊 $ETH /USDT Technical Analysis
Date: October 28, 2026
Trading pair: Ethereum / Tether (ETH/USDT)
1. Current Market Situation
Ethereum is trading around $2,340–$2,350 based on the latest available market analysis. ETH is showing a short-term recovery, but the overall daily trend remains weak.
Indicator Analysis
Current price Around $2,345
Short-term trend Bearish to neutral
Daily trend Bearish
RSI (Daily) Around 37
Immediate support $2,300–$2,315
Immediate resistance $2,370–$2,400
Market sentiment Cautious / bearish
2. Important Support and Resistance Levels
🟢 Support Levels
These are areas where buyers might enter the market.
S1: $2,315 — Immediate support
S2: $2,287 — Secondary support
S3: $2,270 — Additional downside support
Major support: $2,200 — Important lower level
A decisive break below $2,287 could increase selling pressure toward $2,200.
🔴 Resistance Levels
These are areas where selling pressure might appear.
R1: $2,370 — First resistance
R2: $2,382 — Important resistance
R3: $2,400 — Stronger resistance
Major resistance: $2,423–$2,450 — Potential recovery barrier
A breakout above $2,400, supported by strong buying volume, could open the way toward $2,423–$2,450.
---
3. ETH/USDT Trading Scenarios
📉 Scenario A: SELL Setup
My preferred bias: Sell on a confirmed breakdown or a failed resistance test.
Parameter Price
Entry zone $2,350–$2,370
Stop loss $2,405
Take profit 1 $2,315
Take profit 2 $2,287
Take profit 3 $2,270
Confirmation required:
Price fails to break above $2,370.
A bearish candle forms on the 15-minute or 1-hour chart.
Selling volume increases.
⚠️ Avoid entering a short position without confirmation, especially if ETH is recovering strongly.
📈 Scenario B: BUY Setup
A buy becomes more attractive if ETH breaks above resistance and holds it.
Parameter Price
Entry zone $2,385–$2,400 after confirmation
Stop loss $2,360
Take profit 1 $2,423
Take profit 2 $2,450
Take profit 3 $2,480
Confirmation required:
ETH breaks above $2,382.
A 15-minute or 1-hour candle closes above resistance.
Buying volume increases.
This bullish setup is invalidated if price falls back below the breakout zone.
These are illustrative trading scenarios, not guaranteed signals. Verify the levels against your exchange's live chart before entering.
---
4. RSI and Momentum Analysis
The daily RSI is approximately 37, indicating relatively weak momentum. It is approaching oversold territory but is not yet deeply oversold.
This suggests:
Sellers have had the advantage recently.
A short-term bounce remains possible.
A bullish reversal is not confirmed.
Further downside is possible if support breaks.
5. My ETH/USDT Forecast
Timeframe Outlook Key Level
Next 15 minutes Neutral / volatile $2,340–$2,370
Next 1–4 hours Neutral to bearish $2,315
Next 24 hours Bearish unless resistance breaks $2,287–$2,400
Bullish reversal Above $2,400 $2,423–$2,450
Bearish continuation Below $2,287 $2,200
These ranges are scenario estimates based on available technical levels, not guaranteed price predictions.
🎯 Final Trading Opinion
Current bias: BEARISH, but watch for a short-term bounce.
🔴 Below $2,315: Selling pressure may increase.
🔴 Below $2,287: Potential continuation toward $2,200.
🟢 Above $2,382: Short-term bullish momentum may strengthen.
🟢 Above $2,400: A recovery toward $2,423–$2,450 becomes more plausible.
My recommendation: Avoid chasing the market. Wait for a confirmed breakout or breakdown before entering a trade.
For risk management, consider risking no more than 1% of your trading capital on a single trade, and be particularly careful with leverage.
---
One question for you:
Which type of ETH/USDT analysis do you need?
1. Scalping — 1-minute and 5-minute charts.
2. Intraday trading — 15-minute and 1-hour charts.
3. Swing trading — 4-hour and daily charts.
#EthereumDropsBelow$2300 #Ethereum
73
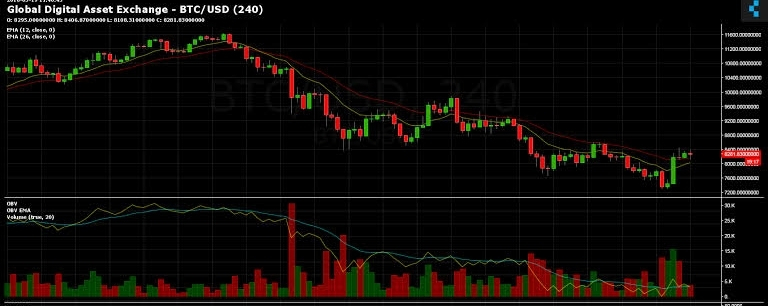
Artikel
Übersetzung ansehen
BTC/USD Technical Analysis — October 27, 2026📊 $BTC /USD Technical Analysis — October 27, 2026
{spot}(BTCUSDT)
Current market bias: 🐻 Bearish (Short-term)
Bitcoin is facing selling pressure and is trading around $79,400–$79,600 according to the latest available market data. The price has fallen below the important $80,000 psychological level, and technical indicators suggest that further downside is possible.
1. Current Market Overview
Indicator Current Analysis
Trading Pair BTC/USD
Current Price Around $79,500
Short-Term Trend 🔴 Bearish
RSI (14) Around 40
MACD Bearish
Immediate Support $79,300
Stronger Support $78,600
Immediate Resistance $80,000–$80,700
Next Resistance $81,400
Market Sentiment Sellers have the advantage
Prices are approximate and may change rapidly.
2. Important Support and Resistance Levels
🟢 Support Levels
These are the levels where buyers might attempt to enter the market.
Support 1: $79,300
Support 2: $78,600
Support 3: $77,100–$77,800
If BTC breaks below $79,300 with strong selling volume, the price could move toward $78,600.
If $78,600 also fails to hold, the next downside area could be $77,800 or lower.
🔴 Resistance Levels
These are the levels where selling pressure could emerge.
Resistance 1: $80,000
Resistance 2: $80,700
Resistance 3: $81,400
Major Resistance: $81,800–$82,000
BTC needs to recover above $80,700 and sustain that level to improve its short-term bullish outlook.
A break above $81,400 could open the door to a stronger recovery.
3. Technical Indicator Analysis
RSI (14): Around 40
Momentum is weak.
Sellers currently have the advantage.
RSI is approaching oversold territory but does not, by itself, confirm a reversal.
MACD: Bearish
Momentum remains negative.
Downside pressure could continue unless momentum starts improving.
Moving Averages: Bearish
BTC is trading below its short-term moving averages.
The $80,700–$81,800 area could act as resistance during a recovery.
---
4. BTC/USD Trading Scenarios
🔴 Scenario A: SELL Setup
Preferred direction: Short, subject to confirmation.
Parameter Potential Level
Entry Zone $79,250–$79,400
Stop Loss $79,950
Take Profit 1 $78,900
Take Profit 2 $78,600
Take Profit 3 $77,800
Confirmation required:
BTC breaks below $79,300.
A 15-minute candle closes below support.
A retest of $79,300 fails.
⚠️ Avoid entering a short trade immediately after a sharp drop without confirmation. Price could rebound from support.
🟢 Scenario B: BUY Setup
A buy trade becomes more attractive if BTC reclaims important resistance levels.
Parameter Potential Level
Entry Zone $80,050–$80,200
Stop Loss $79,600
Take Profit 1 $80,700
Take Profit 2 $81,000
Take Profit 3 $81,400
Confirmation required:
BTC breaks above $80,000.
A 15-minute candle closes above resistance.
Price successfully retests the breakout area.
This bullish setup becomes invalid if BTC fails to hold the breakout and falls back below support.
These are illustrative trading scenarios, not confirmed live entry signals.
---
5. My Final BTC/USD Prediction
Based on the available technical data:
Market Condition Possible Direction
BTC stays below $80,000 Bearish
BTC breaks below $79,300 Potential move toward $78,600
BTC breaks below $78,600 Further downside risk
BTC reclaims $80,700 Recovery becomes more likely
BTC breaks above $81,400 Bullish momentum may strengthen
🎯 My Trading Bias
Short-term: Bearish.
The more cautious approach is to wait for confirmation around $79,300 support or $80,000 resistance rather than entering a trade based on price alone.
Risk management: Risk no more than 1% of your trading capital on a single trade, and be especially careful with leverage during volatile market conditions.
---
📈 Would you like a more precise trading setup?
I can analyze BTC/USD using one of these timeframes:
1. ⚡ 5-minute chart — scalping 2. 📊 15-minute chart — short-term trading 3. 📈 1-hour chart — intraday trading 4. 🌎 4-hour chart — swing trading
#BTC #FOMCWatch
BTC/USD Technical Analysis — October 27, 2026
📊 $BTC /USD Technical Analysis — October 27, 2026
Current market bias: 🐻 Bearish (Short-term)
Bitcoin is facing selling pressure and is trading around $79,400–$79,600 according to the latest available market data. The price has fallen below the important $80,000 psychological level, and technical indicators suggest that further downside is possible.
1. Current Market Overview
Indicator Current Analysis
Trading Pair BTC/USD
Current Price Around $79,500
Short-Term Trend 🔴 Bearish
RSI (14) Around 40
MACD Bearish
Immediate Support $79,300
Stronger Support $78,600
Immediate Resistance $80,000–$80,700
Next Resistance $81,400
Market Sentiment Sellers have the advantage
Prices are approximate and may change rapidly.
2. Important Support and Resistance Levels
🟢 Support Levels
These are the levels where buyers might attempt to enter the market.
Support 1: $79,300
Support 2: $78,600
Support 3: $77,100–$77,800
If BTC breaks below $79,300 with strong selling volume, the price could move toward $78,600.
If $78,600 also fails to hold, the next downside area could be $77,800 or lower.
🔴 Resistance Levels
These are the levels where selling pressure could emerge.
Resistance 1: $80,000
Resistance 2: $80,700
Resistance 3: $81,400
Major Resistance: $81,800–$82,000
BTC needs to recover above $80,700 and sustain that level to improve its short-term bullish outlook.
A break above $81,400 could open the door to a stronger recovery.
3. Technical Indicator Analysis
RSI (14): Around 40
Momentum is weak.
Sellers currently have the advantage.
RSI is approaching oversold territory but does not, by itself, confirm a reversal.
MACD: Bearish
Momentum remains negative.
Downside pressure could continue unless momentum starts improving.
Moving Averages: Bearish
BTC is trading below its short-term moving averages.
The $80,700–$81,800 area could act as resistance during a recovery.
---
4. BTC/USD Trading Scenarios
🔴 Scenario A: SELL Setup
Preferred direction: Short, subject to confirmation.
Parameter Potential Level
Entry Zone $79,250–$79,400
Stop Loss $79,950
Take Profit 1 $78,900
Take Profit 2 $78,600
Take Profit 3 $77,800
Confirmation required:
BTC breaks below $79,300.
A 15-minute candle closes below support.
A retest of $79,300 fails.
⚠️ Avoid entering a short trade immediately after a sharp drop without confirmation. Price could rebound from support.
🟢 Scenario B: BUY Setup
A buy trade becomes more attractive if BTC reclaims important resistance levels.
Parameter Potential Level
Entry Zone $80,050–$80,200
Stop Loss $79,600
Take Profit 1 $80,700
Take Profit 2 $81,000
Take Profit 3 $81,400
Confirmation required:
BTC breaks above $80,000.
A 15-minute candle closes above resistance.
Price successfully retests the breakout area.
This bullish setup becomes invalid if BTC fails to hold the breakout and falls back below support.
These are illustrative trading scenarios, not confirmed live entry signals.
---
5. My Final BTC/USD Prediction
Based on the available technical data:
Market Condition Possible Direction
BTC stays below $80,000 Bearish
BTC breaks below $79,300 Potential move toward $78,600
BTC breaks below $78,600 Further downside risk
BTC reclaims $80,700 Recovery becomes more likely
BTC breaks above $81,400 Bullish momentum may strengthen
🎯 My Trading Bias
Short-term: Bearish.
The more cautious approach is to wait for confirmation around $79,300 support or $80,000 resistance rather than entering a trade based on price alone.
Risk management: Risk no more than 1% of your trading capital on a single trade, and be especially careful with leverage during volatile market conditions.
---
📈 Would you like a more precise trading setup?
I can analyze BTC/USD using one of these timeframes:
1. ⚡ 5-minute chart — scalping 2. 📊 15-minute chart — short-term trading 3. 📈 1-hour chart — intraday trading 4. 🌎 4-hour chart — swing trading
#BTC #FOMCWatch
59

Artikel
Übersetzung ansehen
LTC/USD Analysis — October 27, 2026📊 $LTC /USD Analysis — October 27, 2026
{spot}(LTCUSDT)
Current market bias: Bearish 📉
Litecoin (LTC/USD) is trading around $56.20–$56.50. Recent price action shows selling pressure, with technical indicators favoring further downside unless buyers reclaim nearby resistance levels.
Litecoin
1. Current Market Overview
Indicator Current reading
LTC/USD price $56.20–$56.50
24-hour high $57.11–$57.15
24-hour low $55.92–$56.01
Market trend Bearish
RSI (14) Approximately 36–46, depending on source
MACD Bearish
Moving averages Bearish
Overall bias Sell rallies until reversal confirmation
Sources:
2. Important Support and Resistance Levels
🟢 Support levels
Support Price Significance
S1 $56.00 Immediate support
S2 $55.50 Potential buying reaction
S3 $54.00 Deeper support zone
S4 $52.00 Potential downside target
🔴 Resistance levels
Resistance Price Significance
R1 $56.80 Immediate resistance
R2 $57.15 Short-term breakout level
R3 $58.00 Stronger resistance
R4 $59.00 Potential bullish reversal area
Note: The levels outside the recent trading range are indicative technical zones, not confirmed support or resistance levels.
---
3. Trading Scenarios
📉 Scenario A: SELL Setup
Preferred direction: Bearish, subject to confirmation.
Possible entry:
Entry zone: $56.70–$57.00, following rejection.
Stop-loss: $57.40.
Take-profit 1: $56.00.
Take-profit 2: $55.50.
Take-profit 3: $54.50.
Confirmation required: Look for bearish rejection near resistance on the 15-minute or 1-hour chart.
Avoid entering a short position simply because the price is falling. Wait for a retracement or a confirmed support breakdown.
📈 Scenario B: BUY Setup
A bullish trade becomes more attractive if LTC/USD breaks above nearby resistance.
Possible entry:
Entry zone: Above $57.20 after a confirmed breakout.
Stop-loss: Around $56.50.
Take-profit 1: $58.00.
Take-profit 2: $58.80.
Take-profit 3: $59.50.
Confirmation required: A strong candle close above resistance, preferably supported by increased trading volume.
This is a countertrend setup until the broader bearish structure improves.
---
4. What Do the Technical Indicators Suggest?
RSI: Recent readings are below the neutral 50 level, indicating weak momentum. Some indicators are approaching oversold territory, so a temporary bounce remains possible.
MACD: Bearish readings suggest sellers still have the advantage.
Moving averages: The available technical analysis shows price below several moving averages, reinforcing the bearish bias.
Overall interpretation: The market favors caution on long positions until price reclaims resistance and confirms a reversal.
5. My Trading Plan
Condition Potential action
Price rejects $56.80–$57.00 Watch for a short setup
Price breaks below $55.90 Watch for bearish continuation
Price breaks above $57.15–$57.20 Watch for a bullish recovery
Price remains between $56.00 and $57.00 Wait for a clearer setup
My conclusion
Short-term bias: Bearish.
LTC/USD is under selling pressure around $56.20–$56.50. The $56.00 area is an important nearby support zone, while $57.00–$57.20 is the first resistance area to watch.
I would favor waiting for a confirmed rejection before considering a short trade, rather than selling directly into support.
Remember that these are technical scenarios, not guaranteed outcomes. Cryptocurrency prices can move sharply, so use appropriate position sizing and stop-losses.
---
Tell me your preferred trading timeframe.
Which chart do you trade?
1. 5-minute chart (scalping)
2. 15-minute chart (short-term trading)
3. 1-hour chart (intraday trading)
4. 4-hour chart (swing trading)
5. Daily chart (long-term trend)
Choose a number, and I'll provide a more focused LTC/USD entry, stop-loss, take-profit, and trend analysis for that timeframe.
LTC/USD Analysis — October 27, 2026
📊 $LTC /USD Analysis — October 27, 2026
Current market bias: Bearish 📉
Litecoin (LTC/USD) is trading around $56.20–$56.50. Recent price action shows selling pressure, with technical indicators favoring further downside unless buyers reclaim nearby resistance levels.
Litecoin
1. Current Market Overview
Indicator Current reading
LTC/USD price $56.20–$56.50
24-hour high $57.11–$57.15
24-hour low $55.92–$56.01
Market trend Bearish
RSI (14) Approximately 36–46, depending on source
MACD Bearish
Moving averages Bearish
Overall bias Sell rallies until reversal confirmation
Sources:
2. Important Support and Resistance Levels
🟢 Support levels
Support Price Significance
S1 $56.00 Immediate support
S2 $55.50 Potential buying reaction
S3 $54.00 Deeper support zone
S4 $52.00 Potential downside target
🔴 Resistance levels
Resistance Price Significance
R1 $56.80 Immediate resistance
R2 $57.15 Short-term breakout level
R3 $58.00 Stronger resistance
R4 $59.00 Potential bullish reversal area
Note: The levels outside the recent trading range are indicative technical zones, not confirmed support or resistance levels.
---
3. Trading Scenarios
📉 Scenario A: SELL Setup
Preferred direction: Bearish, subject to confirmation.
Possible entry:
Entry zone: $56.70–$57.00, following rejection.
Stop-loss: $57.40.
Take-profit 1: $56.00.
Take-profit 2: $55.50.
Take-profit 3: $54.50.
Confirmation required: Look for bearish rejection near resistance on the 15-minute or 1-hour chart.
Avoid entering a short position simply because the price is falling. Wait for a retracement or a confirmed support breakdown.
📈 Scenario B: BUY Setup
A bullish trade becomes more attractive if LTC/USD breaks above nearby resistance.
Possible entry:
Entry zone: Above $57.20 after a confirmed breakout.
Stop-loss: Around $56.50.
Take-profit 1: $58.00.
Take-profit 2: $58.80.
Take-profit 3: $59.50.
Confirmation required: A strong candle close above resistance, preferably supported by increased trading volume.
This is a countertrend setup until the broader bearish structure improves.
---
4. What Do the Technical Indicators Suggest?
RSI: Recent readings are below the neutral 50 level, indicating weak momentum. Some indicators are approaching oversold territory, so a temporary bounce remains possible.
MACD: Bearish readings suggest sellers still have the advantage.
Moving averages: The available technical analysis shows price below several moving averages, reinforcing the bearish bias.
Overall interpretation: The market favors caution on long positions until price reclaims resistance and confirms a reversal.
5. My Trading Plan
Condition Potential action
Price rejects $56.80–$57.00 Watch for a short setup
Price breaks below $55.90 Watch for bearish continuation
Price breaks above $57.15–$57.20 Watch for a bullish recovery
Price remains between $56.00 and $57.00 Wait for a clearer setup
My conclusion
Short-term bias: Bearish.
LTC/USD is under selling pressure around $56.20–$56.50. The $56.00 area is an important nearby support zone, while $57.00–$57.20 is the first resistance area to watch.
I would favor waiting for a confirmed rejection before considering a short trade, rather than selling directly into support.
Remember that these are technical scenarios, not guaranteed outcomes. Cryptocurrency prices can move sharply, so use appropriate position sizing and stop-losses.
---
Tell me your preferred trading timeframe.
Which chart do you trade?
1. 5-minute chart (scalping)
2. 15-minute chart (short-term trading)
3. 1-hour chart (intraday trading)
4. 4-hour chart (swing trading)
5. Daily chart (long-term trend)
Choose a number, and I'll provide a more focused LTC/USD entry, stop-loss, take-profit, and trend analysis for that timeframe.
92
Übersetzung ansehen
📊 $BTC /USD Technical Analysis — October 27, 2026
{future}(BTCUSDT)
Bitcoin (BTC/USD) is trading near $79,800–$80,000, based on the latest available market data. The short-term trend looks weak, while the daily and weekly outlooks show some bullish potential. This creates a mixed market, so confirmation is important before entering a trade.
1. Current Market Overview
Indicator Analysis
$BTC /USD Price ~$79,800–$80,000
Short-term trend Bearish
Daily trend Mixed / potentially bullish
Weekly trend Bullish bias
Immediate Support $79,400
Stronger Support $78,100
Immediate Resistance $81,200
Major Resistance $82,600
Market Condition Consolidation
These levels are approximate and based on the latest available technical readings.
2. Important Support and Resistance
🟢 Support Levels
Watch these levels if BTC/USD moves lower.
$79,400: Immediate support.
$78,100: Next important support.
$77,800: Additional downside level.
$75,000: Lower support zone if selling pressure increases.
A break below $79,400 could increase the possibility of a move toward $78,100. A breakdown below that level could expose lower support zones.
🔴 Resistance Levels
Watch these levels if BTC/USD moves higher.
$80,800: Near-term resistance zone.
$81,200: Important breakout level.
$82,600: Next major resistance.
$84,500: Higher resistance zone.
A sustained move above $81,200 could improve the bullish outlook, particularly if supported by strong trading volume.
---
3. BTC/USD Trading Scenarios
🟢 Scenario A: BUY Setup
Consider a potential long setup if Bitcoin shows bullish confirmation.
Conditions:
BTC breaks above $81,200.
A 15-minute or 1-hour candle closes above resistance.
Price retests the breakout level and holds it.
Illustrative trading plan:
Parameter Level
Entry $81,250–$81,500 after confirmation
Stop-loss $80,700
Target 1 $82,000
Target 2 $82,600
Target 3 $84,000
These are hypothetical levels, not a live trading signal. Wait for price confirmation rather than buying simply because the price rises.
#BinancePick #EarningsSeason
📊 $BTC /USD Technical Analysis — October 27, 2026
Bitcoin (BTC/USD) is trading near $79,800–$80,000, based on the latest available market data. The short-term trend looks weak, while the daily and weekly outlooks show some bullish potential. This creates a mixed market, so confirmation is important before entering a trade.
1. Current Market Overview
Indicator Analysis
$BTC /USD Price ~$79,800–$80,000
Short-term trend Bearish
Daily trend Mixed / potentially bullish
Weekly trend Bullish bias
Immediate Support $79,400
Stronger Support $78,100
Immediate Resistance $81,200
Major Resistance $82,600
Market Condition Consolidation
These levels are approximate and based on the latest available technical readings.
2. Important Support and Resistance
🟢 Support Levels
Watch these levels if BTC/USD moves lower.
$79,400: Immediate support.
$78,100: Next important support.
$77,800: Additional downside level.
$75,000: Lower support zone if selling pressure increases.
A break below $79,400 could increase the possibility of a move toward $78,100. A breakdown below that level could expose lower support zones.
🔴 Resistance Levels
Watch these levels if BTC/USD moves higher.
$80,800: Near-term resistance zone.
$81,200: Important breakout level.
$82,600: Next major resistance.
$84,500: Higher resistance zone.
A sustained move above $81,200 could improve the bullish outlook, particularly if supported by strong trading volume.
---
3. BTC/USD Trading Scenarios
🟢 Scenario A: BUY Setup
Consider a potential long setup if Bitcoin shows bullish confirmation.
Conditions:
BTC breaks above $81,200.
A 15-minute or 1-hour candle closes above resistance.
Price retests the breakout level and holds it.
Illustrative trading plan:
Parameter Level
Entry $81,250–$81,500 after confirmation
Stop-loss $80,700
Target 1 $82,000
Target 2 $82,600
Target 3 $84,000
These are hypothetical levels, not a live trading signal. Wait for price confirmation rather than buying simply because the price rises.
#BinancePick #EarningsSeason
69
Übersetzung ansehen
📊 $ETH /USDT Technical Analysis
Date: October 26, 2026
{future}(ETHUSDT)
Let's analyze Ethereum (ETH/USDT) for potential LONG and SHORT trading opportunities.
Important: I don't have a verified live ETH/USDT price feed in this chat, so I can't confirm the current price or today's exact support and resistance levels. The setups below are conditional strategies, not live trading signals.
1. 🟢 LONG Setup (Buy)
Consider a LONG setup if Ethereum shows bullish momentum and breaks above resistance.
Confirmation signals:
A 15-minute or 1-hour candle closes above resistance.
Trading volume increases during the breakout.
The price successfully retests resistance as support.
RSI moves above 50, supporting bullish momentum.
Potential entry: After a confirmed breakout and successful retest.
Take-profit levels:
TP1: Entry + 1%
TP2: Entry + 2%
TP3: Entry + 3%
Stop-loss: Below the retest low or the relevant support level.
2. 🔴 SHORT Setup (Sell)
Consider a SHORT setup if Ethereum breaks below support and selling pressure increases.
Confirmation signals:
A 15-minute or 1-hour candle closes below support.
Selling volume increases.
The price retests support but fails to move above it.
RSI falls below 50, supporting bearish momentum.
Potential entry: After a confirmed breakdown and failed retest.
Take-profit levels:
TP1: Entry − 1%
TP2: Entry − 2%
TP3: Entry − 3%
Stop-loss: Above the retest high or the relevant resistance level.
3. ETH/USDT Trading Decision
Market Condition Potential Action
Price breaks above resistance Consider LONG
Price breaks below support Consider SHORT
Price moves sideways Wait for confirmation
False breakout or breakdown Avoid chasing the price
Risk Management
Risk no more than 1% of your trading capital on a single trade.
Aim for a risk-to-reward ratio of at least 1:2.
Avoid excessive leverage.
Always use a stop-loss.
📊 $ETH /USDT Technical Analysis
Date: October 26, 2026
Let's analyze Ethereum (ETH/USDT) for potential LONG and SHORT trading opportunities.
Important: I don't have a verified live ETH/USDT price feed in this chat, so I can't confirm the current price or today's exact support and resistance levels. The setups below are conditional strategies, not live trading signals.
1. 🟢 LONG Setup (Buy)
Consider a LONG setup if Ethereum shows bullish momentum and breaks above resistance.
Confirmation signals:
A 15-minute or 1-hour candle closes above resistance.
Trading volume increases during the breakout.
The price successfully retests resistance as support.
RSI moves above 50, supporting bullish momentum.
Potential entry: After a confirmed breakout and successful retest.
Take-profit levels:
TP1: Entry + 1%
TP2: Entry + 2%
TP3: Entry + 3%
Stop-loss: Below the retest low or the relevant support level.
2. 🔴 SHORT Setup (Sell)
Consider a SHORT setup if Ethereum breaks below support and selling pressure increases.
Confirmation signals:
A 15-minute or 1-hour candle closes below support.
Selling volume increases.
The price retests support but fails to move above it.
RSI falls below 50, supporting bearish momentum.
Potential entry: After a confirmed breakdown and failed retest.
Take-profit levels:
TP1: Entry − 1%
TP2: Entry − 2%
TP3: Entry − 3%
Stop-loss: Above the retest high or the relevant resistance level.
3. ETH/USDT Trading Decision
Market Condition Potential Action
Price breaks above resistance Consider LONG
Price breaks below support Consider SHORT
Price moves sideways Wait for confirmation
False breakout or breakdown Avoid chasing the price
Risk Management
Risk no more than 1% of your trading capital on a single trade.
Aim for a risk-to-reward ratio of at least 1:2.
Avoid excessive leverage.
Always use a stop-loss.
60
Übersetzung ansehen
📊 $BTC /USDT Technical Analysis — October 26, 2026
{future}(BTCUSDT)
Bitcoin (BTC/USDT) technical analysis for short-term trading.
Important: I don't have a verified live BTC/USDT price feed in this chat. The price levels below are illustrative levels from the previous analysis, not confirmed current market prices. Please verify them on your exchange before trading.
1. Key Support and Resistance Levels
LevelPrice (USDT)SignificanceResistance 3$84,000Major resistanceResistance 2$82,500Secondary resistanceResistance 1$81,000Short-term breakout levelMarket Zone$80,000Potential decision areaSupport 1$79,000Immediate supportSupport 2$78,000Potential downside targetSupport 3$76,000Major support zone
2. 🔴 SHORT Scenario
A short setup could develop if Bitcoin breaks below $79,000 and confirms the breakdown.
Potential trade setup:
Entry: Below $79,000 after confirmation and a successful retest
Take Profit 1: $78,000
Take Profit 2: $77,000
Take Profit 3: $76,000–$76,500
Stop Loss: Above the relevant resistance or retest high
Confirmation signals:
A 15-minute or 1-hour candle closes below support.
Selling volume increases.
The price retests $79,000 and fails to reclaim it.
Avoid entering immediately after a sudden price drop without confirmation.
3. 🟢 LONG Scenario
A potential long setup could develop if Bitcoin breaks above $81,000 and successfully retests that level as support.
Potential trade setup:
Entry: Above $81,000 after a confirmed breakout and retest
Take Profit 1: $82,000
Take Profit 2: $82,500
Take Profit 3: $84,000
Stop Loss: Below the retest low or relevant support
Confirmation signals:
A 1-hour candle closes above resistance.
Buying volume increases.
The price holds above $81,000 after the breakout.
A brief wick above resistance is not sufficient confirmation of a breakout.
4. 📈 Trading Strategy
BTC/USDT ConditionPossible ActionPrice breaks below $79,000Look for a SHORT setupPrice remains between $79,000 and $81,000Wait for confirmationPrice breaks above $81,000Look for a LONG setupPrice shows a false
📊 $BTC /USDT Technical Analysis — October 26, 2026
Bitcoin (BTC/USDT) technical analysis for short-term trading.
Important: I don't have a verified live BTC/USDT price feed in this chat. The price levels below are illustrative levels from the previous analysis, not confirmed current market prices. Please verify them on your exchange before trading.
1. Key Support and Resistance Levels
LevelPrice (USDT)SignificanceResistance 3$84,000Major resistanceResistance 2$82,500Secondary resistanceResistance 1$81,000Short-term breakout levelMarket Zone$80,000Potential decision areaSupport 1$79,000Immediate supportSupport 2$78,000Potential downside targetSupport 3$76,000Major support zone
2. 🔴 SHORT Scenario
A short setup could develop if Bitcoin breaks below $79,000 and confirms the breakdown.
Potential trade setup:
Entry: Below $79,000 after confirmation and a successful retest
Take Profit 1: $78,000
Take Profit 2: $77,000
Take Profit 3: $76,000–$76,500
Stop Loss: Above the relevant resistance or retest high
Confirmation signals:
A 15-minute or 1-hour candle closes below support.
Selling volume increases.
The price retests $79,000 and fails to reclaim it.
Avoid entering immediately after a sudden price drop without confirmation.
3. 🟢 LONG Scenario
A potential long setup could develop if Bitcoin breaks above $81,000 and successfully retests that level as support.
Potential trade setup:
Entry: Above $81,000 after a confirmed breakout and retest
Take Profit 1: $82,000
Take Profit 2: $82,500
Take Profit 3: $84,000
Stop Loss: Below the retest low or relevant support
Confirmation signals:
A 1-hour candle closes above resistance.
Buying volume increases.
The price holds above $81,000 after the breakout.
A brief wick above resistance is not sufficient confirmation of a breakout.
4. 📈 Trading Strategy
BTC/USDT ConditionPossible ActionPrice breaks below $79,000Look for a SHORT setupPrice remains between $79,000 and $81,000Wait for confirmationPrice breaks above $81,000Look for a LONG setupPrice shows a false
74
·
--
Bullisch
Der Preis für Gold hat heute wieder einen starken Rückgang verzeichnet.
Der Preis für eine Tola Gold ist um 12.489 Rupien gefallen und liegt jetzt bei 455.327 Rupien, 10 Gramm Gold sind um 11.240 Rupien günstiger geworden.
#GOLD #GOLD_UPDATE
Der Preis für Gold hat heute wieder einen starken Rückgang verzeichnet.
Der Preis für eine Tola Gold ist um 12.489 Rupien gefallen und liegt jetzt bei 455.327 Rupien, 10 Gramm Gold sind um 11.240 Rupien günstiger geworden.
#GOLD #GOLD_UPDATE
Der Preis für eine Tola Gold ist um 12.489 Rupien gefallen und liegt jetzt bei 455.327 Rupien, 10 Gramm Gold sind um 11.240 Rupien günstiger geworden.
#GOLD #GOLD_UPDATE

166
Großer Rückgang des Goldpreises auf dem Weltmarkt
Der Goldpreis ist um 157 Dollar auf 5023 Dollar pro Unze gefallen
#GOLD #GOLD_UPDATE
Großer Rückgang des Goldpreises auf dem Weltmarkt
Der Goldpreis ist um 157 Dollar auf 5023 Dollar pro Unze gefallen
#GOLD #GOLD_UPDATE
Der Goldpreis ist um 157 Dollar auf 5023 Dollar pro Unze gefallen
#GOLD #GOLD_UPDATE

123
Der Preis für Gold in Pakistan ist erneut gefallen
Am 6. März 2026 wurde ein erneuter Rückgang des Goldpreises in Pakistan verzeichnet, der dem Trend des Rückgangs auf dem Weltmarkt entspricht.
Laut der All Pakistan Gems and Jewelers Association ist der Goldpreis pro Tola um 3.400 Rupien gesunken, sodass der neue Preis 533.762 Rupien pro Tola beträgt.
Ebenso ist Gold von 10 Gramm um 2.915 Rupien günstiger geworden und wird nun für 457.614 Rupien verkauft. Zuvor war der Goldpreis pro Tola am Donnerstag auf 537.162 Rupien gestiegen, was an diesem Tag einen Rückgang um 2.800 Rupien bedeutete.
Auf dem Weltmarkt ist der Goldpreis ebenfalls um 34 Dollar auf 5.110 Dollar pro Unze gefallen, wobei auch ein Aufschlag von 20 Dollar zu berücksichtigen ist.
Andererseits gab es einen leichten Anstieg des Silberpreises, und der Preis für Silber pro Tola stieg um 104 Rupien auf 8.914 Rupien.
#GOLD #GOLD_UPDATE #GoldenOpportunity

3
194
Wenn die Straße von Hormuz geschlossen bleibt, wird der Ölpreis in 2 bis 3 Wochen auf 150 Dollar pro Barrel steigen, warnte der Energieminister von Katar
#oil #OilMarket #OilPrice
Wenn die Straße von Hormuz geschlossen bleibt, wird der Ölpreis in 2 bis 3 Wochen auf 150 Dollar pro Barrel steigen, warnte der Energieminister von Katar
#oil #OilMarket #OilPrice
#oil #OilMarket #OilPrice

2
250
Nach den Angriffen auf den Iran ist der Preis für Rohöl auf 84 Dollar pro Barrel gestiegen
China hat auch den großen Raffinerien des Landes befohlen, die Exporte von Diesel und Benzin einzustellen
#OilMarket #OilAlert
Nach den Angriffen auf den Iran ist der Preis für Rohöl auf 84 Dollar pro Barrel gestiegen
China hat auch den großen Raffinerien des Landes befohlen, die Exporte von Diesel und Benzin einzustellen
#OilMarket #OilAlert
China hat auch den großen Raffinerien des Landes befohlen, die Exporte von Diesel und Benzin einzustellen
#OilMarket #OilAlert

2
154
Nach dem Rückgang der Preise auf dem Weltmarkt ist Gold auch in Pakistan günstiger geworden
Nach einem Rückgang um 3400 Rupien liegt der Preis für eine Tola bei 5.33.762 Rupien, 10 Gramm Gold sind um 2915 Rupien günstiger geworden
#GOLD #GOLD_UPDATE
Nach dem Rückgang der Preise auf dem Weltmarkt ist Gold auch in Pakistan günstiger geworden
Nach einem Rückgang um 3400 Rupien liegt der Preis für eine Tola bei 5.33.762 Rupien, 10 Gramm Gold sind um 2915 Rupien günstiger geworden
#GOLD #GOLD_UPDATE
Nach einem Rückgang um 3400 Rupien liegt der Preis für eine Tola bei 5.33.762 Rupien, 10 Gramm Gold sind um 2915 Rupien günstiger geworden
#GOLD #GOLD_UPDATE

8
Gold in Pakistan ist um 10.000 Rupien pro Tola günstiger geworden
Der Preis beträgt 539.962 Rupien, 10 Gramm Gold sind um 8.573 Rupien günstiger geworden
#GOLD #GOLD_UPDATE
Gold in Pakistan ist um 10.000 Rupien pro Tola günstiger geworden
Der Preis beträgt 539.962 Rupien, 10 Gramm Gold sind um 8.573 Rupien günstiger geworden
#GOLD #GOLD_UPDATE
Der Preis beträgt 539.962 Rupien, 10 Gramm Gold sind um 8.573 Rupien günstiger geworden
#GOLD #GOLD_UPDATE

2
341
7 Tage kontinuierlicher Steigerung, nach der der Goldpreis gesunken ist
Gold ist um 700 Rupien und liegt jetzt bei 540.562 Rupien pro Tola,
auf dem internationalen Markt ist Gold um 7 Dollar gesunken und liegt jetzt bei 5178 Dollar pro Unze
#GOLD #GOLD_UPDATE
7 Tage kontinuierlicher Steigerung, nach der der Goldpreis gesunken ist
Gold ist um 700 Rupien und liegt jetzt bei 540.562 Rupien pro Tola,
auf dem internationalen Markt ist Gold um 7 Dollar gesunken und liegt jetzt bei 5178 Dollar pro Unze
#GOLD #GOLD_UPDATE
Gold ist um 700 Rupien und liegt jetzt bei 540.562 Rupien pro Tola,
auf dem internationalen Markt ist Gold um 7 Dollar gesunken und liegt jetzt bei 5178 Dollar pro Unze
#GOLD #GOLD_UPDATE

3
359
Der Preis von Gold pro Tola ist um 1300 Rupien gestiegen und beträgt nun 541262 Rupien.
Der Preis für 10 Gramm Gold ist ebenfalls um 1114 Rupien gestiegen, der Preis für Silber pro Tola beträgt 9554 Rupien.
#GOLD #GOLD_UPDATE
Der Preis von Gold pro Tola ist um 1300 Rupien gestiegen und beträgt nun 541262 Rupien.
Der Preis für 10 Gramm Gold ist ebenfalls um 1114 Rupien gestiegen, der Preis für Silber pro Tola beträgt 9554 Rupien.
#GOLD #GOLD_UPDATE
Der Preis für 10 Gramm Gold ist ebenfalls um 1114 Rupien gestiegen, der Preis für Silber pro Tola beträgt 9554 Rupien.
#GOLD #GOLD_UPDATE

3
380
Ein großer Anstieg des Goldpreises
Der Goldpreis pro Tola ist um 3000 Rupien gestiegen und liegt jetzt bei 536.562 Rupien
Auf dem internationalen Markt ist Gold um 30 Dollar teurer geworden und erreicht 5138 Dollar pro Unze
#GOLD #GoldRate #GOLD_UPDATE
Ein großer Anstieg des Goldpreises
Der Goldpreis pro Tola ist um 3000 Rupien gestiegen und liegt jetzt bei 536.562 Rupien
Auf dem internationalen Markt ist Gold um 30 Dollar teurer geworden und erreicht 5138 Dollar pro Unze
#GOLD #GoldRate #GOLD_UPDATE
Der Goldpreis pro Tola ist um 3000 Rupien gestiegen und liegt jetzt bei 536.562 Rupien
Auf dem internationalen Markt ist Gold um 30 Dollar teurer geworden und erreicht 5138 Dollar pro Unze
#GOLD #GoldRate #GOLD_UPDATE

2
212
Anmelden und weiter Inhalte entdecken
Krypto-Nutzer weltweit auf Binance Square kennenlernen
⚡️ Bleib in Sachen Krypto stets am Puls.
💬 Die weltgrößte Kryptobörse vertraut darauf.
👍 Erhalte verlässliche Einblicke von verifizierten Creators.
E-Mail-Adresse/Telefonnummer
Trendthemen
CanMicrosoftDeliverOnAI
404,225 Aufrufe
3,150 Kommentare
Berichtssaison, Session 3: Übertreffen Google und Microsoft die Gewinnerwartungen?
Binance Square Official
·143 Likes
·76.1k Aufrufe
CanGoogleDefindItsCore
247,428 Aufrufe
2,234 Kommentare
EarningsSeason
5.9M Aufrufe
29,239 Kommentare