

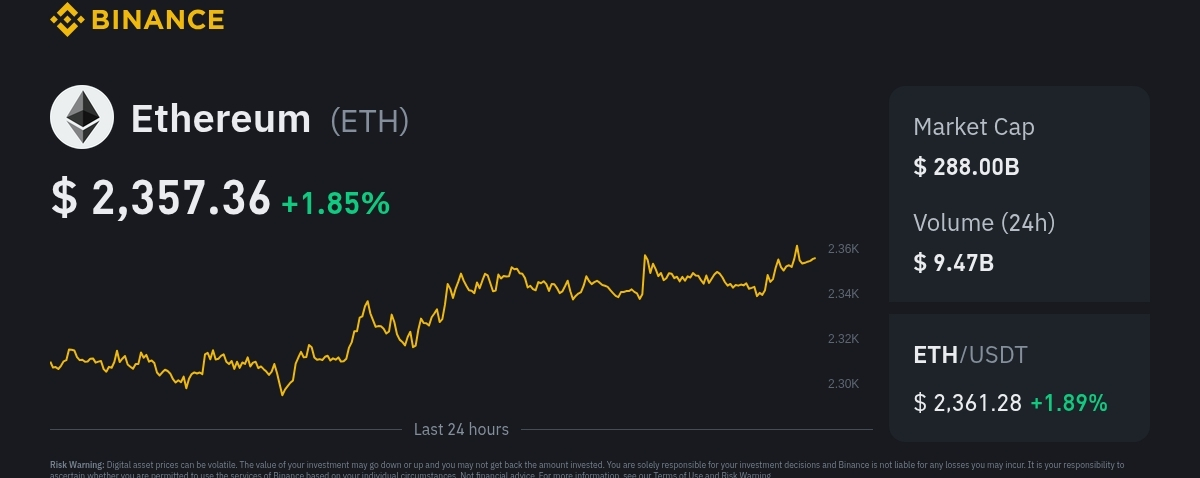

📊 $ETH /USDT Technical Analysis
Date: October 28, 2026
Trading pair: Ethereum / Tether (ETH/USDT)

1. Current Market Situation
Ethereum is trading around $2,340–$2,350 based on the latest available market analysis. ETH is showing a short-term recovery, but the overall daily trend remains weak.
Indicator Analysis
Current price Around $2,345
Short-term trend Bearish to neutral
Daily trend Bearish
RSI (Daily) Around 37
Immediate support $2,300–$2,315
Immediate resistance $2,370–$2,400
Market sentiment Cautious / bearish
2. Important Support and Resistance Levels
🟢 Support Levels
These are areas where buyers might enter the market.
S1: $2,315 — Immediate support
S2: $2,287 — Secondary support
S3: $2,270 — Additional downside support
Major support: $2,200 — Important lower level
A decisive break below $2,287 could increase selling pressure toward $2,200.
🔴 Resistance Levels
These are areas where selling pressure might appear.
R1: $2,370 — First resistance
R2: $2,382 — Important resistance
R3: $2,400 — Stronger resistance
Major resistance: $2,423–$2,450 — Potential recovery barrier
A breakout above $2,400, supported by strong buying volume, could open the way toward $2,423–$2,450.
---
3. ETH/USDT Trading Scenarios
📉 Scenario A: SELL Setup
My preferred bias: Sell on a confirmed breakdown or a failed resistance test.
Parameter Price
Entry zone $2,350–$2,370
Stop loss $2,405
Take profit 1 $2,315
Take profit 2 $2,287
Take profit 3 $2,270
Confirmation required:
Price fails to break above $2,370.
A bearish candle forms on the 15-minute or 1-hour chart.
Selling volume increases.
⚠️ Avoid entering a short position without confirmation, especially if ETH is recovering strongly.
📈 Scenario B: BUY Setup
A buy becomes more attractive if ETH breaks above resistance and holds it.
Parameter Price
Entry zone $2,385–$2,400 after confirmation
Stop loss $2,360
Take profit 1 $2,423
Take profit 2 $2,450
Take profit 3 $2,480
Confirmation required:
ETH breaks above $2,382.
A 15-minute or 1-hour candle closes above resistance.
Buying volume increases.
This bullish setup is invalidated if price falls back below the breakout zone.
These are illustrative trading scenarios, not guaranteed signals. Verify the levels against your exchange's live chart before entering.
---
4. RSI and Momentum Analysis
The daily RSI is approximately 37, indicating relatively weak momentum. It is approaching oversold territory but is not yet deeply oversold.
This suggests:
Sellers have had the advantage recently.
A short-term bounce remains possible.
A bullish reversal is not confirmed.
Further downside is possible if support breaks.
5. My ETH/USDT Forecast
Timeframe Outlook Key Level
Next 15 minutes Neutral / volatile $2,340–$2,370
Next 1–4 hours Neutral to bearish $2,315
Next 24 hours Bearish unless resistance breaks $2,287–$2,400
Bullish reversal Above $2,400 $2,423–$2,450
Bearish continuation Below $2,287 $2,200
These ranges are scenario estimates based on available technical levels, not guaranteed price predictions.
🎯 Final Trading Opinion
Current bias: BEARISH, but watch for a short-term bounce.
🔴 Below $2,315: Selling pressure may increase.
🔴 Below $2,287: Potential continuation toward $2,200.
🟢 Above $2,382: Short-term bullish momentum may strengthen.
🟢 Above $2,400: A recovery toward $2,423–$2,450 becomes more plausible.
My recommendation: Avoid chasing the market. Wait for a confirmed breakout or breakdown before entering a trade.
For risk management, consider risking no more than 1% of your trading capital on a single trade, and be particularly careful with leverage.
---
One question for you:
Which type of ETH/USDT analysis do you need?
1. Scalping — 1-minute and 5-minute charts.
2. Intraday trading — 15-minute and 1-hour charts.
3. Swing trading — 4-hour and daily charts.