


📊 $XRP /USD Technical Analysis

Date: October 28, 2026
1. Current Market Overview
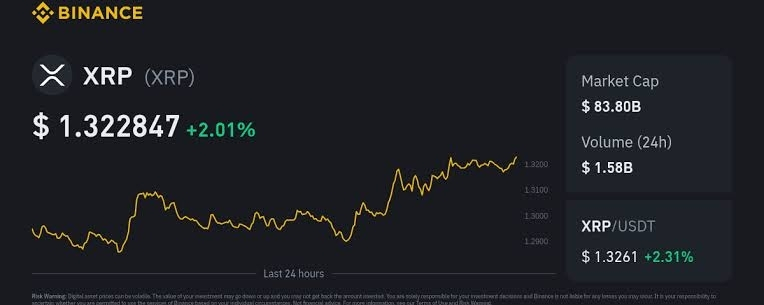
According to the latest available technical data, $XRP /USD is trading around $1.32–$1.33. The short-term outlook is cautiously bullish, although the medium-term trend remains under pressure.
Indicator Current Analysis
Current Price Approximately $1.33
Short-Term Trend Bullish
Medium-Term Trend Bearish
Daily RSI Approximately 45
Immediate Support $1.3145
Immediate Resistance $1.345
Overall Bias Cautiously Bullish
The daily RSI is near 45, suggesting momentum is relatively neutral rather than strongly bullish or bearish.
2. Important Support and Resistance Levels
These levels are based on technical data available on October 28, 2026.
Level Price (USD) Significance
Resistance 3 $1.399 Major resistance
Resistance 2 $1.366 Strong resistance
Resistance 1 $1.345 Immediate resistance
Current Price $1.328 Approximate market price
Support 1 $1.3145 Immediate support
Support 2 $1.2925 Secondary support
Support 3 $1.2579 Major support
Source:
3. BUY Setup 🟢
A potential buying opportunity could develop if XRP breaks above resistance.
Possible entry conditions:
XRP breaks above $1.345.
A 1-hour candle closes above resistance.
Buying volume increases.
Price successfully retests the breakout level.
Potential targets:
Trading Parameter Price
Entry Above $1.345 after confirmation
Take Profit 1 $1.366
Take Profit 2 $1.399
Stop Loss Below the breakout structure
My view: Avoid buying immediately before a breakout is confirmed. A false breakout could quickly reverse the price.
4. SELL Setup 🔴
A bearish setup could develop if XRP loses its immediate support.
Possible entry conditions:
XRP breaks below $1.3145.
A 1-hour candle closes below support.
Selling pressure increases.
Trading Parameter Price
Entry Below $1.3145 after confirmation
Take Profit 1 $1.2925
Take Profit 2 $1.2579
Stop Loss Above the breakdown structure
These are potential trading scenarios, not guaranteed price movements.
5. Bullish vs. Bearish Scenarios
🟢 Bullish Scenario
If XRP breaks above $1.345 and holds that level, the next potential targets are:
Target 1: $1.366
Target 2: $1.399
A breakout accompanied by increased volume would strengthen the bullish case.
🔴 Bearish Scenario
If XRP breaks below $1.3145, the next potential support levels are:
Target 1: $1.2925
Target 2: $1.2579
A sustained move below support would weaken the short-term bullish outlook.
🟡 Neutral Scenario
If XRP remains between $1.3145 and $1.345, the market may continue consolidating.
In that situation, waiting for a confirmed breakout or breakdown may be preferable.
6. My Trading Recommendation 🎯
Based on the available technical data, I would focus on these two levels:
BUY signal: A confirmed breakout above $1.345.
SELL signal: A confirmed breakdown below $1.3145.
WAIT: If XRP remains between these levels without clear momentum.
Remember that cryptocurrency prices can change rapidly. Always verify the current price on your exchange, use a stop-loss, and avoid excessive leverage.
---
📈 Which XRP/USD Trading Timeframe Do You Use?
Choose one option:
1. 15-minute chart — Scalping
2. 1-hour chart — Intraday trading
3. 4-hour chart — Swing trading
4. Daily chart — Long-term trend
Reply with 1, 2, 3, or 4, and I will provide a more focused XRP/USD trading plan with entry, stop-loss, and take-profit levels.