

TheChartQueen
4.2k Beiträge

TheChartQueen
Melden
Nutzer blockieren
Trading raw data so you don't have to 📊 A girl, her charts & daily setups. Tips are never expected, but they fuel my 3AM analysis!
Hochfrequenz-Trader
5 Jahre
12 Following
565 Follower
742 Like gegeben
Beiträge
Alle
Zitierungen
Übersetzung ansehen
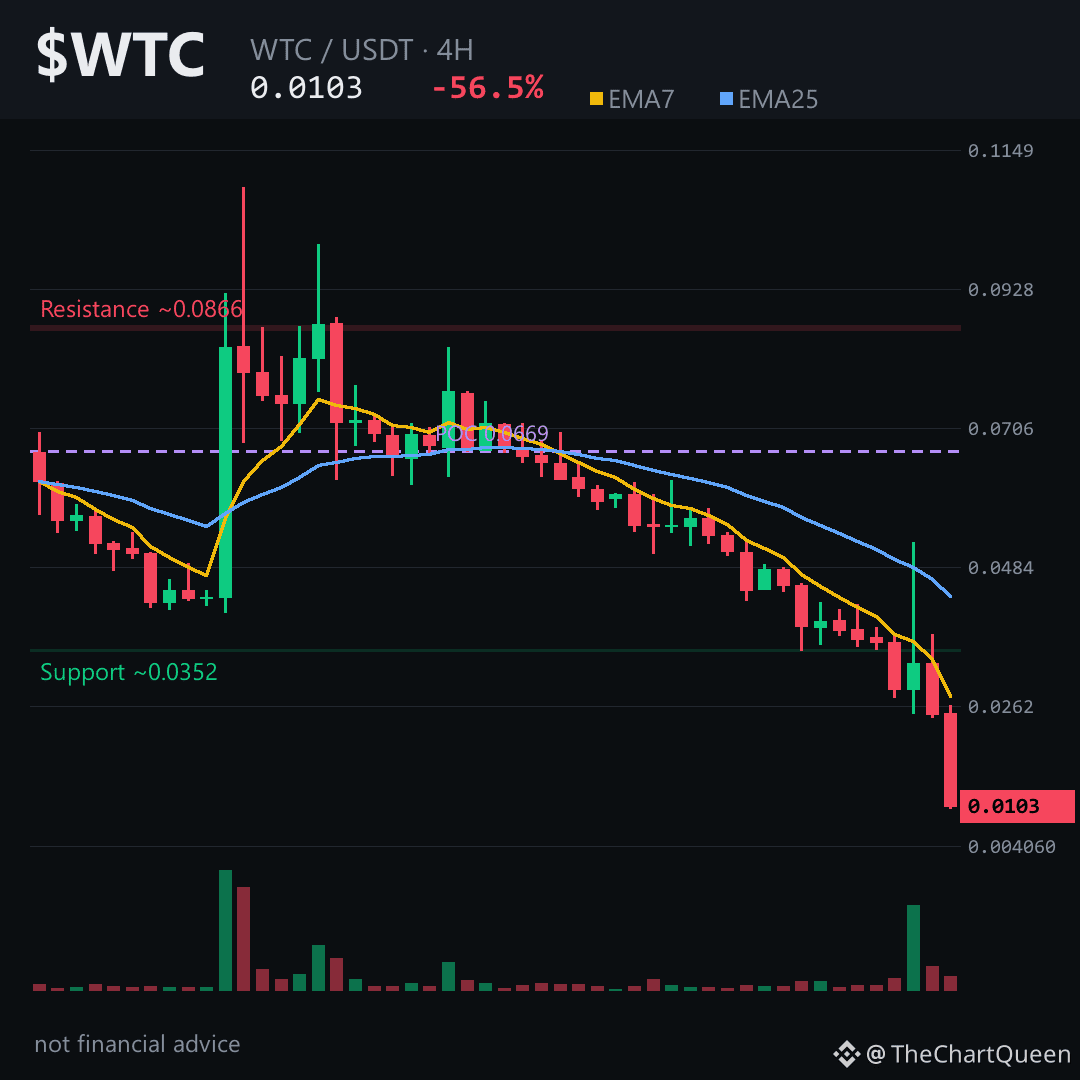
That last 4H candle is a 59% body slam into the 1-cent floor.
And when a chart loses over half its value in a single candle, the old support levels stop meaning what they used to. 🔻
Here's the raw picture on $WTC: the 4H EMA7 is way below the EMA25 — 0.028 versus 0.043. Daily is even steeper. RSI pinned under 21 on both timeframes. That's a market that has completely lost its bid.
The volume profile tells the real story. The point of control sits around 0.067. Price is nowhere near it. Nearly everyone who traded this over the last several weeks is underwater, and the path back up is thick with trapped supply.
The levels that matter right now are brutally simple. The current pivot zone is around 0.0103, with the invalidation sitting just above at roughly 0.0109. If sellers stay in control, the next objective is the 0.0094 zone. Lose that and the macro picture points toward the mid-0.006s.
But here's the catch: funding is flat and open interest is zero. No leveraged crowd to squeeze. This is a spot-driven liquidation event, not a derivatives unwind. That often means the washout is genuine — a slow, grinding bleed rather than a violent snap-back.
My read: respect the downtrend until the 0.0109 zone is reclaimed on a 4H close. Until then, bounces are suspect, not opportunities.
Tap $WTC to pull up the chart and check these levels yourself — the 1-cent floor is the whole ballgame right now.
Follow me for the update if that floor cracks or holds. What's the one level you're watching on $WTC right now? 👇
⚠️ Not financial advice. DYOR.
#WTC #Crypto #BinanceSquare
That last 4H candle is a 59% body slam into the 1-cent floor.
And when a chart loses over half its value in a single candle, the old support levels stop meaning what they used to. 🔻
Here's the raw picture on $WTC: the 4H EMA7 is way below the EMA25 — 0.028 versus 0.043. Daily is even steeper. RSI pinned under 21 on both timeframes. That's a market that has completely lost its bid.
The volume profile tells the real story. The point of control sits around 0.067. Price is nowhere near it. Nearly everyone who traded this over the last several weeks is underwater, and the path back up is thick with trapped supply.
The levels that matter right now are brutally simple. The current pivot zone is around 0.0103, with the invalidation sitting just above at roughly 0.0109. If sellers stay in control, the next objective is the 0.0094 zone. Lose that and the macro picture points toward the mid-0.006s.
But here's the catch: funding is flat and open interest is zero. No leveraged crowd to squeeze. This is a spot-driven liquidation event, not a derivatives unwind. That often means the washout is genuine — a slow, grinding bleed rather than a violent snap-back.
My read: respect the downtrend until the 0.0109 zone is reclaimed on a 4H close. Until then, bounces are suspect, not opportunities.
Tap $WTC to pull up the chart and check these levels yourself — the 1-cent floor is the whole ballgame right now.
Follow me for the update if that floor cracks or holds. What's the one level you're watching on $WTC right now? 👇
⚠️ Not financial advice. DYOR.
#WTC #Crypto #BinanceSquare
And when a chart loses over half its value in a single candle, the old support levels stop meaning what they used to. 🔻
Here's the raw picture on $WTC: the 4H EMA7 is way below the EMA25 — 0.028 versus 0.043. Daily is even steeper. RSI pinned under 21 on both timeframes. That's a market that has completely lost its bid.
The volume profile tells the real story. The point of control sits around 0.067. Price is nowhere near it. Nearly everyone who traded this over the last several weeks is underwater, and the path back up is thick with trapped supply.
The levels that matter right now are brutally simple. The current pivot zone is around 0.0103, with the invalidation sitting just above at roughly 0.0109. If sellers stay in control, the next objective is the 0.0094 zone. Lose that and the macro picture points toward the mid-0.006s.
But here's the catch: funding is flat and open interest is zero. No leveraged crowd to squeeze. This is a spot-driven liquidation event, not a derivatives unwind. That often means the washout is genuine — a slow, grinding bleed rather than a violent snap-back.
My read: respect the downtrend until the 0.0109 zone is reclaimed on a 4H close. Until then, bounces are suspect, not opportunities.
Tap $WTC to pull up the chart and check these levels yourself — the 1-cent floor is the whole ballgame right now.
Follow me for the update if that floor cracks or holds. What's the one level you're watching on $WTC right now? 👇
⚠️ Not financial advice. DYOR.
#WTC #Crypto #BinanceSquare
1
Übersetzung ansehen
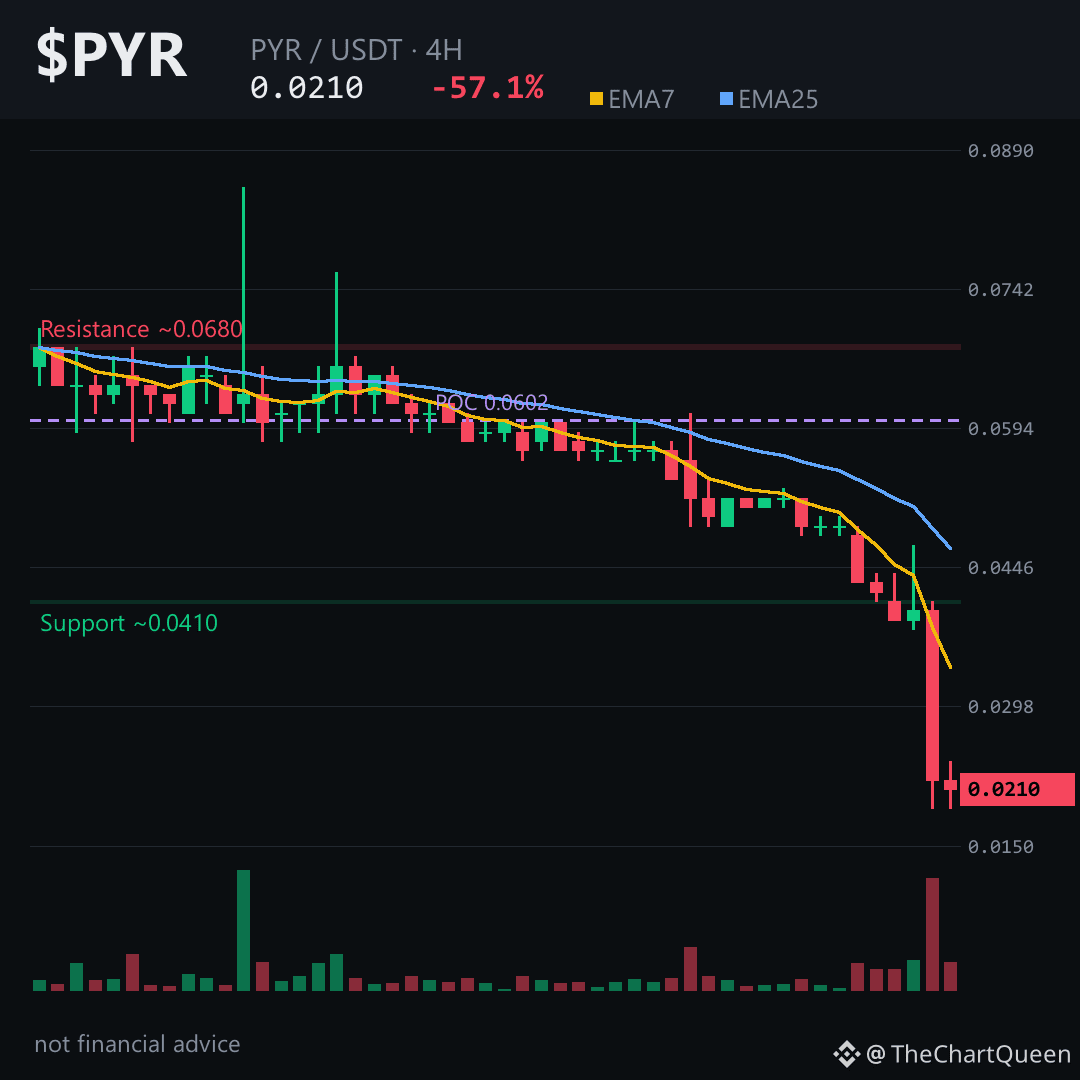
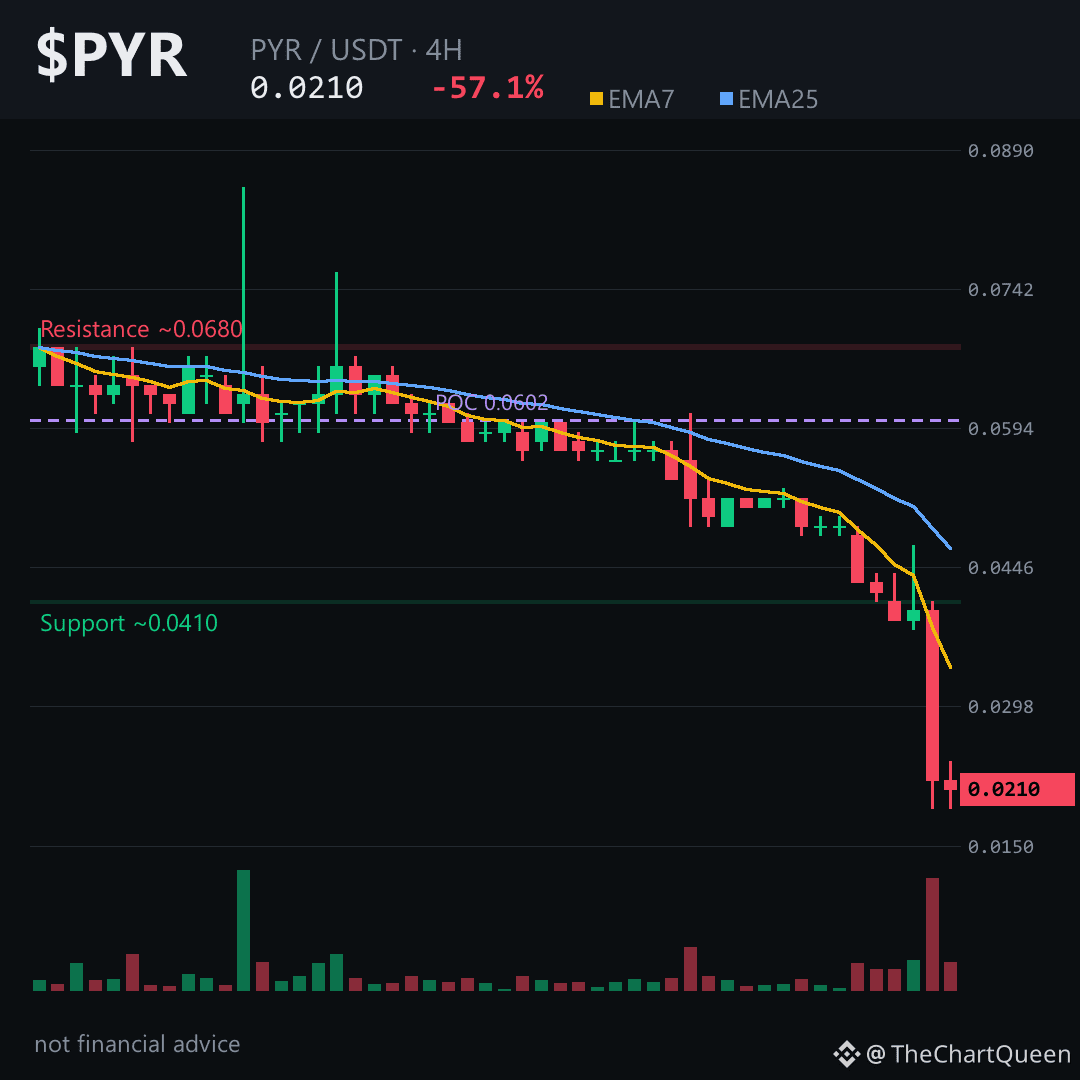
Imagine a stock you liked at 60 cents suddenly trading at 2 cents in a single session. That’s the kind of waterfall $PYR just went through, and the dust is still settling.
A 57% drop in one day isn’t a correction — it’s a structural break. Price collapsed through the 4-cent floor and now sits near 2.1 cents, with RSI off a cliff. There’s an unfilled bearish gap between roughly 4.4 and 4.8 cents — that zone now acts as a ceiling. As long as $PYR stays under it, bounces will likely be sold. Most buyers from recent weeks are underwater, making a quick recovery very hard.
The key 4-hour invalidation is near 2.2 cents. If price can’t reclaim that, the path points toward 1.9 cents, with a deeper macro target near 1.3 cents if selling persists. Losing 2.2 cents on a 4-hour close confirms the downtrend.
My read: a falling knife with no futures positioning to cushion it — funding flat, open interest near zero. No short squeeze coming, just spot sellers and fading confidence.
I’m watching whether $PYR holds 1.9 cents or drifts toward the macro objective. Follow along for the next update. What’s your read — are you watching 1.9 or 2.2 more closely? 👇
⚠️ Not financial advice. DYOR.
#PYR #Crypto #BinanceSquare #Altcoins
Imagine a stock you liked at 60 cents suddenly trading at 2 cents in a single session. That’s the kind of waterfall $PYR just went through, and the dust is still settling.
A 57% drop in one day isn’t a correction — it’s a structural break. Price collapsed through the 4-cent floor and now sits near 2.1 cents, with RSI off a cliff. There’s an unfilled bearish gap between roughly 4.4 and 4.8 cents — that zone now acts as a ceiling. As long as $PYR stays under it, bounces will likely be sold. Most buyers from recent weeks are underwater, making a quick recovery very hard.
The key 4-hour invalidation is near 2.2 cents. If price can’t reclaim that, the path points toward 1.9 cents, with a deeper macro target near 1.3 cents if selling persists. Losing 2.2 cents on a 4-hour close confirms the downtrend.
My read: a falling knife with no futures positioning to cushion it — funding flat, open interest near zero. No short squeeze coming, just spot sellers and fading confidence.
I’m watching whether $PYR holds 1.9 cents or drifts toward the macro objective. Follow along for the next update. What’s your read — are you watching 1.9 or 2.2 more closely? 👇
⚠️ Not financial advice. DYOR.
#PYR #Crypto #BinanceSquare #Altcoins
A 57% drop in one day isn’t a correction — it’s a structural break. Price collapsed through the 4-cent floor and now sits near 2.1 cents, with RSI off a cliff. There’s an unfilled bearish gap between roughly 4.4 and 4.8 cents — that zone now acts as a ceiling. As long as $PYR stays under it, bounces will likely be sold. Most buyers from recent weeks are underwater, making a quick recovery very hard.
The key 4-hour invalidation is near 2.2 cents. If price can’t reclaim that, the path points toward 1.9 cents, with a deeper macro target near 1.3 cents if selling persists. Losing 2.2 cents on a 4-hour close confirms the downtrend.
My read: a falling knife with no futures positioning to cushion it — funding flat, open interest near zero. No short squeeze coming, just spot sellers and fading confidence.
I’m watching whether $PYR holds 1.9 cents or drifts toward the macro objective. Follow along for the next update. What’s your read — are you watching 1.9 or 2.2 more closely? 👇
⚠️ Not financial advice. DYOR.
#PYR #Crypto #BinanceSquare #Altcoins
2
Übersetzung ansehen
Why does $VIB keep making lower lows while every bounce dies within hours?
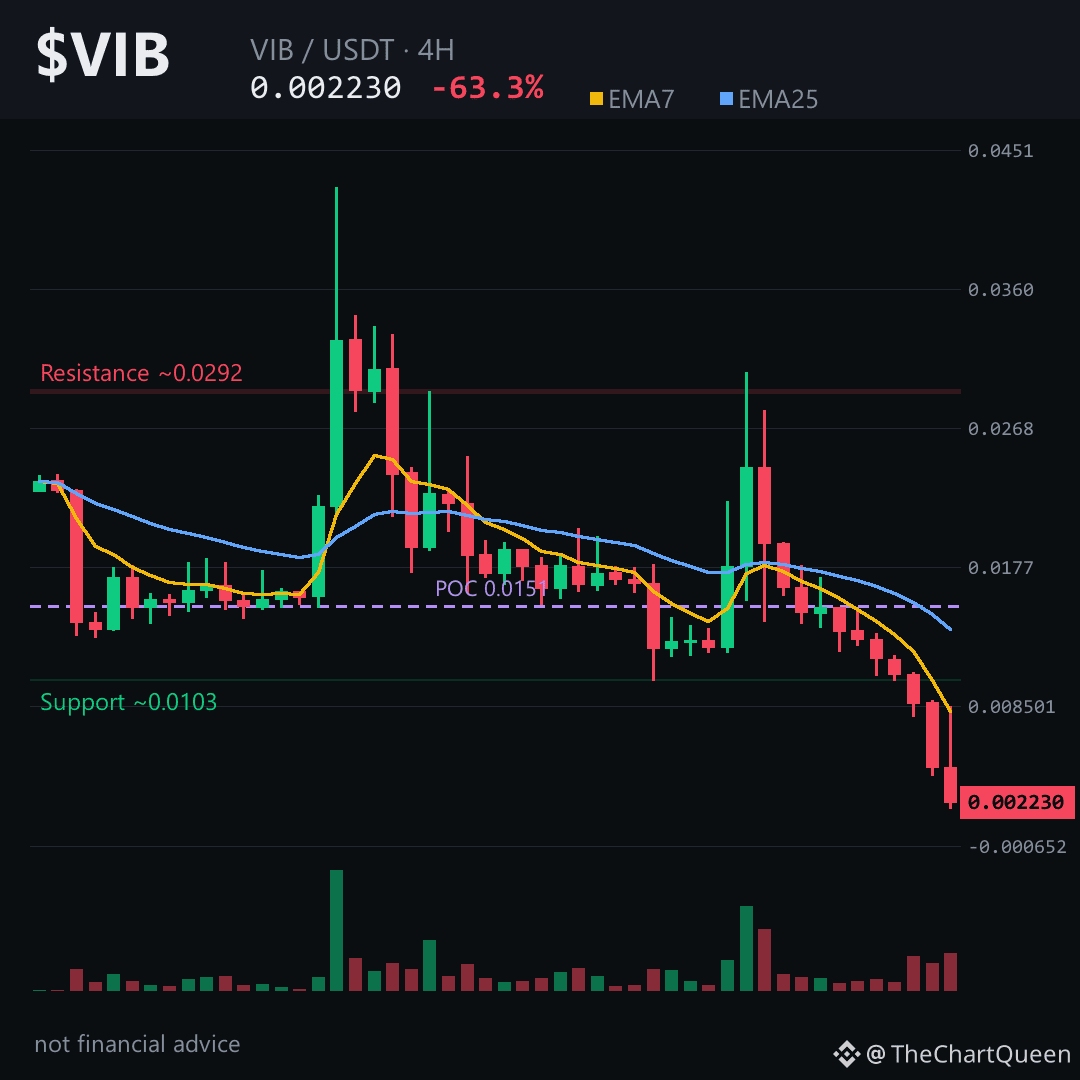
Look closer — the 4-hour chart isn't just falling. It's falling with structure.
That massive red candle sliced through a bearish fair value gap around 0.009–0.010 and never looked back.
Now price sits near 0.0022, and every rally toward 0.00235 gets rejected. That's the line in the sand.
The 4-hour trend is clearly down. RSI is deep in oversold territory at ~28 — but oversold in a downtrend often stays oversold longer than logic suggests.
The point of control sits much higher, near 0.015. Most participants are underwater, and any bounce toward that area would face heavy selling pressure.
Translation: rallies are likely to be sold, not celebrated.
The levels that matter:
Support around 0.0020 is the immediate floor. If that gives way, the next logical destination sits near 0.0019.
Invalidation is clean: if $VIB reclaims the 0.00235 area on a 4-hour close, the immediate bearish read weakens. Until then, the path of least resistance stays lower.
Tap $VIB to pull up the chart and trace these zones yourself.
My read: this is a falling knife with weak hands trapped above. The risk isn't missing a bounce — it's catching one too early.
Follow me for the updated read if the 0.0020 floor breaks or 0.00235 gets reclaimed — I'll map the next move.
What level are you watching on VIB right now? 👇
Not financial advice. DYOR.
#VIB #Crypto #Altcoins #BinanceSquare
Why does $VIB keep making lower lows while every bounce dies within hours?
Look closer — the 4-hour chart isn't just falling. It's falling with structure.
That massive red candle sliced through a bearish fair value gap around 0.009–0.010 and never looked back.
Now price sits near 0.0022, and every rally toward 0.00235 gets rejected. That's the line in the sand.
The 4-hour trend is clearly down. RSI is deep in oversold territory at ~28 — but oversold in a downtrend often stays oversold longer than logic suggests.
The point of control sits much higher, near 0.015. Most participants are underwater, and any bounce toward that area would face heavy selling pressure.
Translation: rallies are likely to be sold, not celebrated.
The levels that matter:
Support around 0.0020 is the immediate floor. If that gives way, the next logical destination sits near 0.0019.
Invalidation is clean: if $VIB reclaims the 0.00235 area on a 4-hour close, the immediate bearish read weakens. Until then, the path of least resistance stays lower.
Tap $VIB to pull up the chart and trace these zones yourself.
My read: this is a falling knife with weak hands trapped above. The risk isn't missing a bounce — it's catching one too early.
Follow me for the updated read if the 0.0020 floor breaks or 0.00235 gets reclaimed — I'll map the next move.
What level are you watching on VIB right now? 👇
Not financial advice. DYOR.
#VIB #Crypto #Altcoins #BinanceSquare
Look closer — the 4-hour chart isn't just falling. It's falling with structure.
That massive red candle sliced through a bearish fair value gap around 0.009–0.010 and never looked back.
Now price sits near 0.0022, and every rally toward 0.00235 gets rejected. That's the line in the sand.
The 4-hour trend is clearly down. RSI is deep in oversold territory at ~28 — but oversold in a downtrend often stays oversold longer than logic suggests.
The point of control sits much higher, near 0.015. Most participants are underwater, and any bounce toward that area would face heavy selling pressure.
Translation: rallies are likely to be sold, not celebrated.
The levels that matter:
Support around 0.0020 is the immediate floor. If that gives way, the next logical destination sits near 0.0019.
Invalidation is clean: if $VIB reclaims the 0.00235 area on a 4-hour close, the immediate bearish read weakens. Until then, the path of least resistance stays lower.
Tap $VIB to pull up the chart and trace these zones yourself.
My read: this is a falling knife with weak hands trapped above. The risk isn't missing a bounce — it's catching one too early.
Follow me for the updated read if the 0.0020 floor breaks or 0.00235 gets reclaimed — I'll map the next move.
What level are you watching on VIB right now? 👇
Not financial advice. DYOR.
#VIB #Crypto #Altcoins #BinanceSquare
4
Übersetzung ansehen
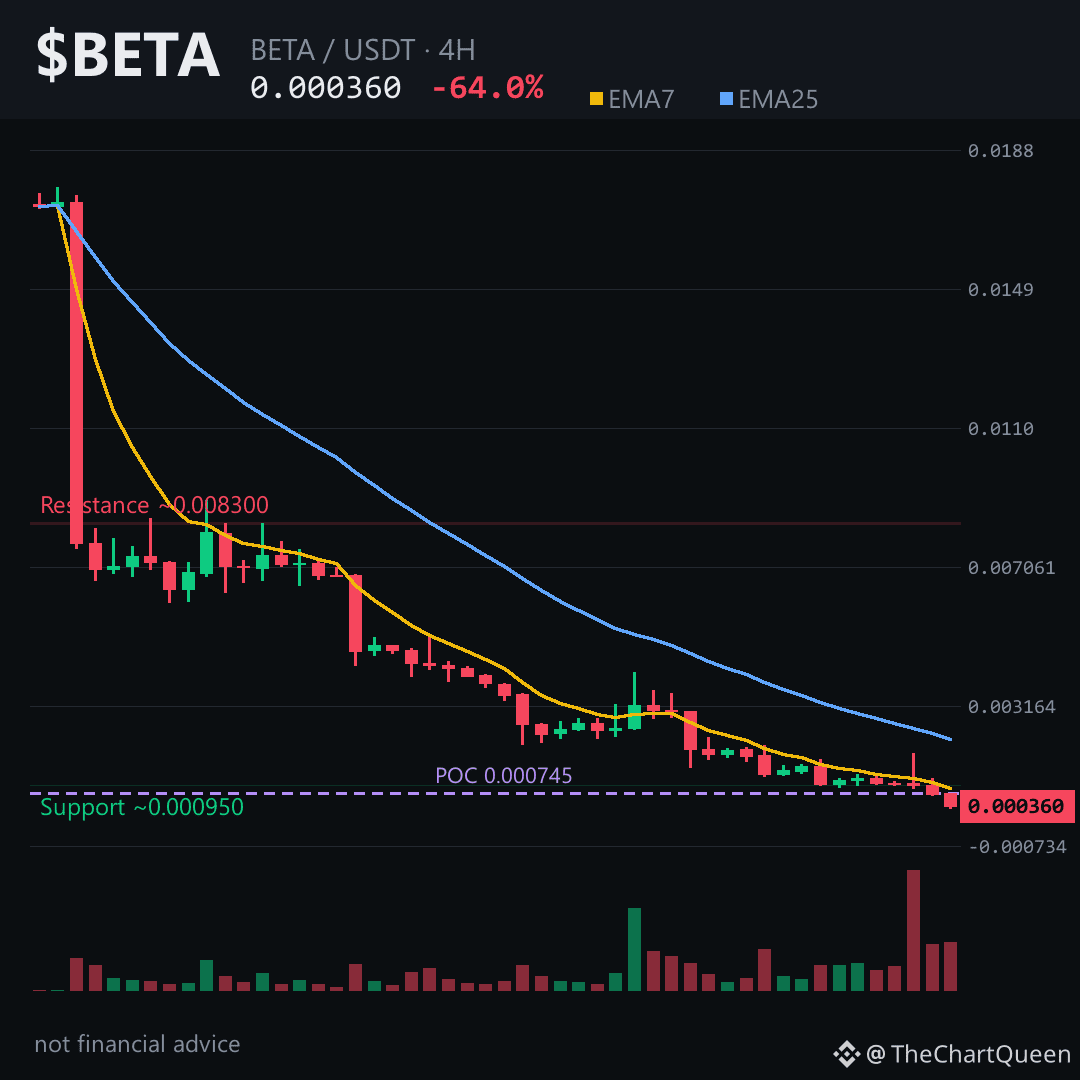
You don't need a chart to know what -64% in one day means. That's not a dip. That's an exodus.
But the last 4H candle deserves a second look. It printed a 51% range bar with a close near the lows. That's a flush, and flushes this violent usually leave something behind.
RSI on the 4H is at 17.5. At this level, with ATR expanded to 0.00065, any bounce gets violent too.
The bearish FVG between 0.00230 and 0.00286 is miles above now. It's a ceiling, not a target. The volume profile POC at 0.000745 is also above. Anyone who bought there is underwater. That's overhead supply, and it's heavy.
The 4H structure is the only one worth reading. Trend alignment is bearish. Current pivot around 0.000361. If that level holds as resistance, the path of least resistance points toward 0.000329.
Lose the 0.000380 area on a 4H close and this read is off the table.
My read: a falling knife with no visible floor yet, but the oversold extreme and the sheer size of the last candle suggest a bounce attempt is statistically near. The risk isn't missing the bounce — it's catching a dead cat with zero futures liquidity to cushion it.
Tap $BETA to pull up the chart and check these levels yourself. I'll be watching whether 0.000360 flips or rejects.
Where do you see the next real support on $BETA — lower than 0.000310, or is that the bottom? 👇
Follow for the next read on this chart.
⚠️ Not financial advice. DYOR.
#BETA #Crypto #Altcoins #BinanceSquare
You don't need a chart to know what -64% in one day means. That's not a dip. That's an exodus.
But the last 4H candle deserves a second look. It printed a 51% range bar with a close near the lows. That's a flush, and flushes this violent usually leave something behind.
RSI on the 4H is at 17.5. At this level, with ATR expanded to 0.00065, any bounce gets violent too.
The bearish FVG between 0.00230 and 0.00286 is miles above now. It's a ceiling, not a target. The volume profile POC at 0.000745 is also above. Anyone who bought there is underwater. That's overhead supply, and it's heavy.
The 4H structure is the only one worth reading. Trend alignment is bearish. Current pivot around 0.000361. If that level holds as resistance, the path of least resistance points toward 0.000329.
Lose the 0.000380 area on a 4H close and this read is off the table.
My read: a falling knife with no visible floor yet, but the oversold extreme and the sheer size of the last candle suggest a bounce attempt is statistically near. The risk isn't missing the bounce — it's catching a dead cat with zero futures liquidity to cushion it.
Tap $BETA to pull up the chart and check these levels yourself. I'll be watching whether 0.000360 flips or rejects.
Where do you see the next real support on $BETA — lower than 0.000310, or is that the bottom? 👇
Follow for the next read on this chart.
⚠️ Not financial advice. DYOR.
#BETA #Crypto #Altcoins #BinanceSquare
But the last 4H candle deserves a second look. It printed a 51% range bar with a close near the lows. That's a flush, and flushes this violent usually leave something behind.
RSI on the 4H is at 17.5. At this level, with ATR expanded to 0.00065, any bounce gets violent too.
The bearish FVG between 0.00230 and 0.00286 is miles above now. It's a ceiling, not a target. The volume profile POC at 0.000745 is also above. Anyone who bought there is underwater. That's overhead supply, and it's heavy.
The 4H structure is the only one worth reading. Trend alignment is bearish. Current pivot around 0.000361. If that level holds as resistance, the path of least resistance points toward 0.000329.
Lose the 0.000380 area on a 4H close and this read is off the table.
My read: a falling knife with no visible floor yet, but the oversold extreme and the sheer size of the last candle suggest a bounce attempt is statistically near. The risk isn't missing the bounce — it's catching a dead cat with zero futures liquidity to cushion it.
Tap $BETA to pull up the chart and check these levels yourself. I'll be watching whether 0.000360 flips or rejects.
Where do you see the next real support on $BETA — lower than 0.000310, or is that the bottom? 👇
Follow for the next read on this chart.
⚠️ Not financial advice. DYOR.
#BETA #Crypto #Altcoins #BinanceSquare
6
Übersetzung ansehen
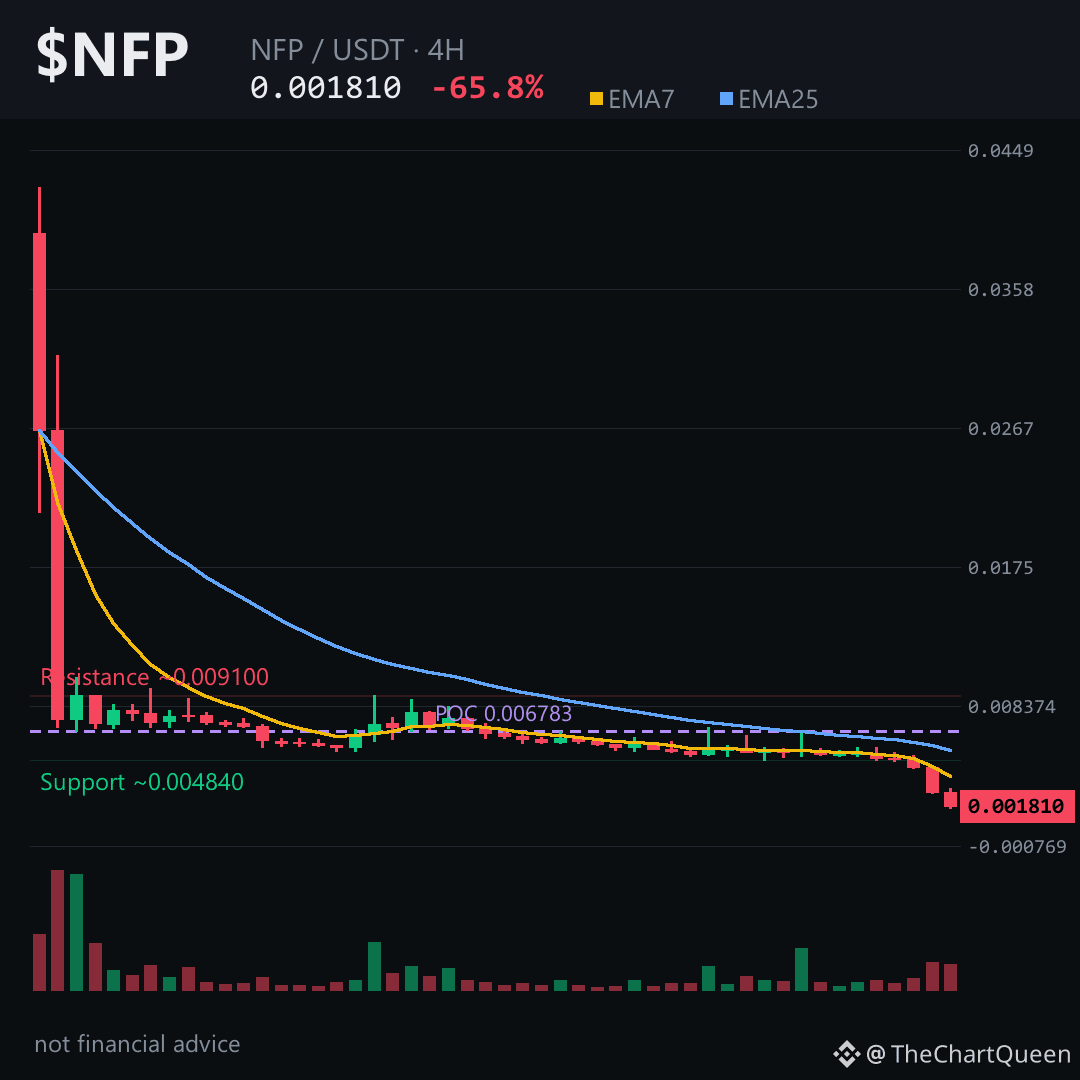
A 65% single-day collapse isn't a dip. That's a structural break.
$NFP just printed the kind of candle that ends projects, not the kind you buy. And there's a hidden tell in the volume data most won't notice until it's too late.
Here's the read.
Price sits at 0.00181, down from 0.00570 just 24 hours ago. RSI on the 4H is 12.89 — that's not oversold, that's a corpse with a pulse. The 7 EMA at 0.00378 is miles above price. This is vertical capitulation.
The real story is that unfilled bearish gap between 0.00479 and 0.00445. Price gapped down through it and never looked back. Until that zone is reclaimed, every rally is a short opportunity wearing a bull costume.
Futures metrics are empty. Zero funding, zero open interest. Smart money has already left the building. No OI to squeeze, no funding to flip — no fuel for a reversal.
The level that matters on $NFP: 0.00191 is the line in the sand. A 4H close above that and this read is off the table. Below, the path points toward 0.00165, then possibly 0.00114. Tap $NFP to pull up the chart.
My read: this is a falling knife with no hands catching it. The first bounce after a 239% range day is usually a bull trap, not a bottom.
I'll post an update when 0.00191 gets tested or fails — follow so you see it.
What's your read on NFP's support zone — 0.00165 or lower? 👇
Not financial advice. DYOR.
#NFP #Crypto #BinanceSquare #Altcoins
A 65% single-day collapse isn't a dip. That's a structural break.
$NFP just printed the kind of candle that ends projects, not the kind you buy. And there's a hidden tell in the volume data most won't notice until it's too late.
Here's the read.
Price sits at 0.00181, down from 0.00570 just 24 hours ago. RSI on the 4H is 12.89 — that's not oversold, that's a corpse with a pulse. The 7 EMA at 0.00378 is miles above price. This is vertical capitulation.
The real story is that unfilled bearish gap between 0.00479 and 0.00445. Price gapped down through it and never looked back. Until that zone is reclaimed, every rally is a short opportunity wearing a bull costume.
Futures metrics are empty. Zero funding, zero open interest. Smart money has already left the building. No OI to squeeze, no funding to flip — no fuel for a reversal.
The level that matters on $NFP: 0.00191 is the line in the sand. A 4H close above that and this read is off the table. Below, the path points toward 0.00165, then possibly 0.00114. Tap $NFP to pull up the chart.
My read: this is a falling knife with no hands catching it. The first bounce after a 239% range day is usually a bull trap, not a bottom.
I'll post an update when 0.00191 gets tested or fails — follow so you see it.
What's your read on NFP's support zone — 0.00165 or lower? 👇
Not financial advice. DYOR.
#NFP #Crypto #BinanceSquare #Altcoins
$NFP just printed the kind of candle that ends projects, not the kind you buy. And there's a hidden tell in the volume data most won't notice until it's too late.
Here's the read.
Price sits at 0.00181, down from 0.00570 just 24 hours ago. RSI on the 4H is 12.89 — that's not oversold, that's a corpse with a pulse. The 7 EMA at 0.00378 is miles above price. This is vertical capitulation.
The real story is that unfilled bearish gap between 0.00479 and 0.00445. Price gapped down through it and never looked back. Until that zone is reclaimed, every rally is a short opportunity wearing a bull costume.
Futures metrics are empty. Zero funding, zero open interest. Smart money has already left the building. No OI to squeeze, no funding to flip — no fuel for a reversal.
The level that matters on $NFP: 0.00191 is the line in the sand. A 4H close above that and this read is off the table. Below, the path points toward 0.00165, then possibly 0.00114. Tap $NFP to pull up the chart.
My read: this is a falling knife with no hands catching it. The first bounce after a 239% range day is usually a bull trap, not a bottom.
I'll post an update when 0.00191 gets tested or fails — follow so you see it.
What's your read on NFP's support zone — 0.00165 or lower? 👇
Not financial advice. DYOR.
#NFP #Crypto #BinanceSquare #Altcoins
2
Übersetzung ansehen
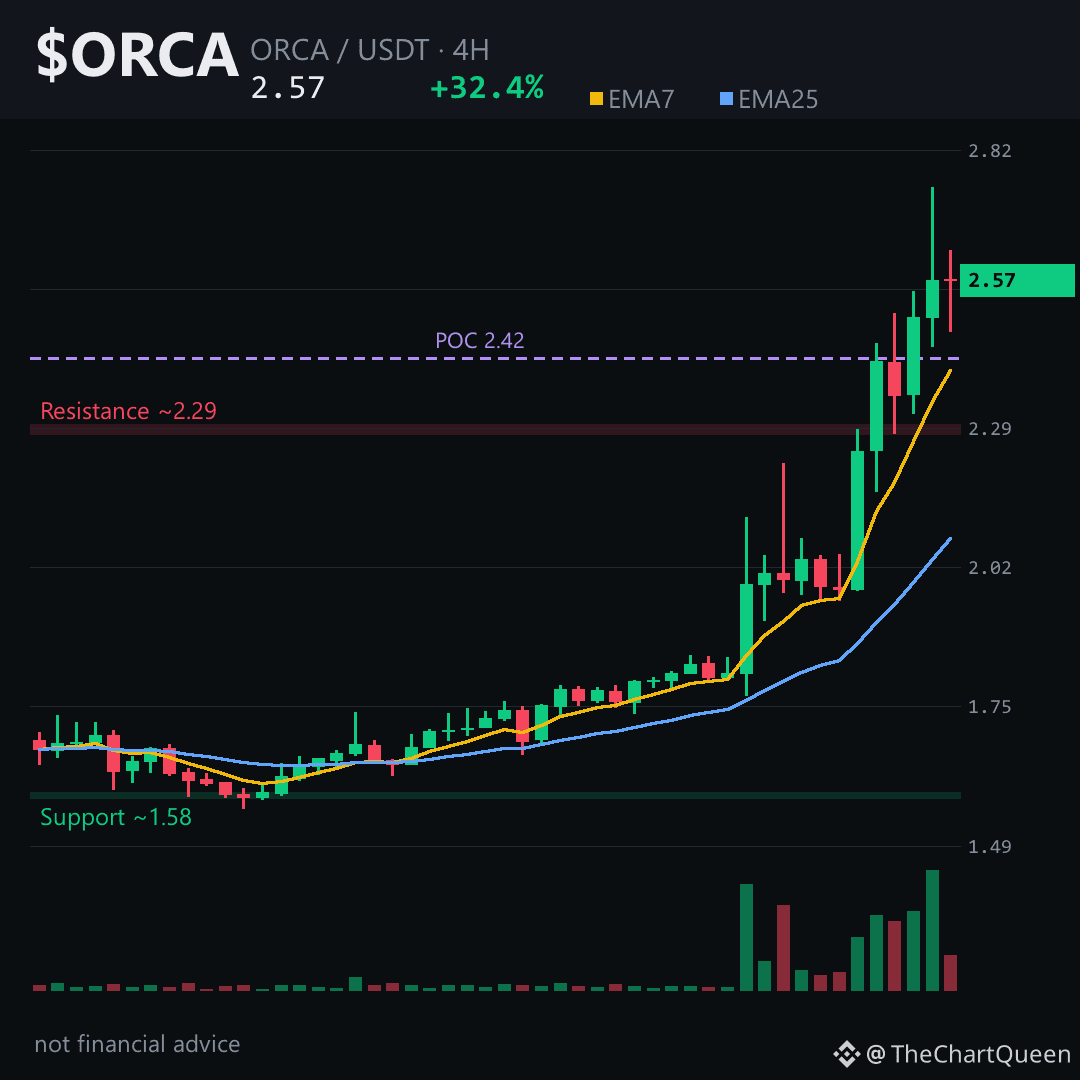
Why is $ORCA up 32% in a day, and is the move already finished?
The answer sits in one number that most people skip: the volume shelf at 2.42.
Price swept from 1.95 to 2.75 in less than two days, then pulled back to 2.47 and bounced. That pullback didn't break structure — it kissed the old resistance and got rejected upward. That's a textbook reclaim.
Funding is negative right now. Short-sellers are paying long-holders to keep positions open. When price is rising but funding is negative, the move isn't crowded yet. The fuel hasn't been burned.
The level that matters is around 2.47. If $ORCA holds that zone on a 4-hour close, the path toward 2.83 looks open. Lose it, and the whole read shifts — the next meaningful floor is down near 2.17, where the unfilled gap sits.
Tap $ORCA to pull up the chart and see that reclaim for yourself.
My read: the structure is bullish, but the real risk is buying too far from the invalidation. This is a momentum move that needs to prove it can hold the 2.47 area before the next leg makes sense.
Follow me if you want the updated read when price either holds 2.47 or loses it — that's where the next decision lives.
Which level are you trusting more on ORCA right now, the 2.47 reclaim or the 2.83 objective? 👇
⚠️ Not financial advice. DYOR.
#ORCA #Crypto #TopGainer #BinanceSquare
Why is $ORCA up 32% in a day, and is the move already finished?
The answer sits in one number that most people skip: the volume shelf at 2.42.
Price swept from 1.95 to 2.75 in less than two days, then pulled back to 2.47 and bounced. That pullback didn't break structure — it kissed the old resistance and got rejected upward. That's a textbook reclaim.
Funding is negative right now. Short-sellers are paying long-holders to keep positions open. When price is rising but funding is negative, the move isn't crowded yet. The fuel hasn't been burned.
The level that matters is around 2.47. If $ORCA holds that zone on a 4-hour close, the path toward 2.83 looks open. Lose it, and the whole read shifts — the next meaningful floor is down near 2.17, where the unfilled gap sits.
Tap $ORCA to pull up the chart and see that reclaim for yourself.
My read: the structure is bullish, but the real risk is buying too far from the invalidation. This is a momentum move that needs to prove it can hold the 2.47 area before the next leg makes sense.
Follow me if you want the updated read when price either holds 2.47 or loses it — that's where the next decision lives.
Which level are you trusting more on ORCA right now, the 2.47 reclaim or the 2.83 objective? 👇
⚠️ Not financial advice. DYOR.
#ORCA #Crypto #TopGainer #BinanceSquare
The answer sits in one number that most people skip: the volume shelf at 2.42.
Price swept from 1.95 to 2.75 in less than two days, then pulled back to 2.47 and bounced. That pullback didn't break structure — it kissed the old resistance and got rejected upward. That's a textbook reclaim.
Funding is negative right now. Short-sellers are paying long-holders to keep positions open. When price is rising but funding is negative, the move isn't crowded yet. The fuel hasn't been burned.
The level that matters is around 2.47. If $ORCA holds that zone on a 4-hour close, the path toward 2.83 looks open. Lose it, and the whole read shifts — the next meaningful floor is down near 2.17, where the unfilled gap sits.
Tap $ORCA to pull up the chart and see that reclaim for yourself.
My read: the structure is bullish, but the real risk is buying too far from the invalidation. This is a momentum move that needs to prove it can hold the 2.47 area before the next leg makes sense.
Follow me if you want the updated read when price either holds 2.47 or loses it — that's where the next decision lives.
Which level are you trusting more on ORCA right now, the 2.47 reclaim or the 2.83 objective? 👇
⚠️ Not financial advice. DYOR.
#ORCA #Crypto #TopGainer #BinanceSquare
74
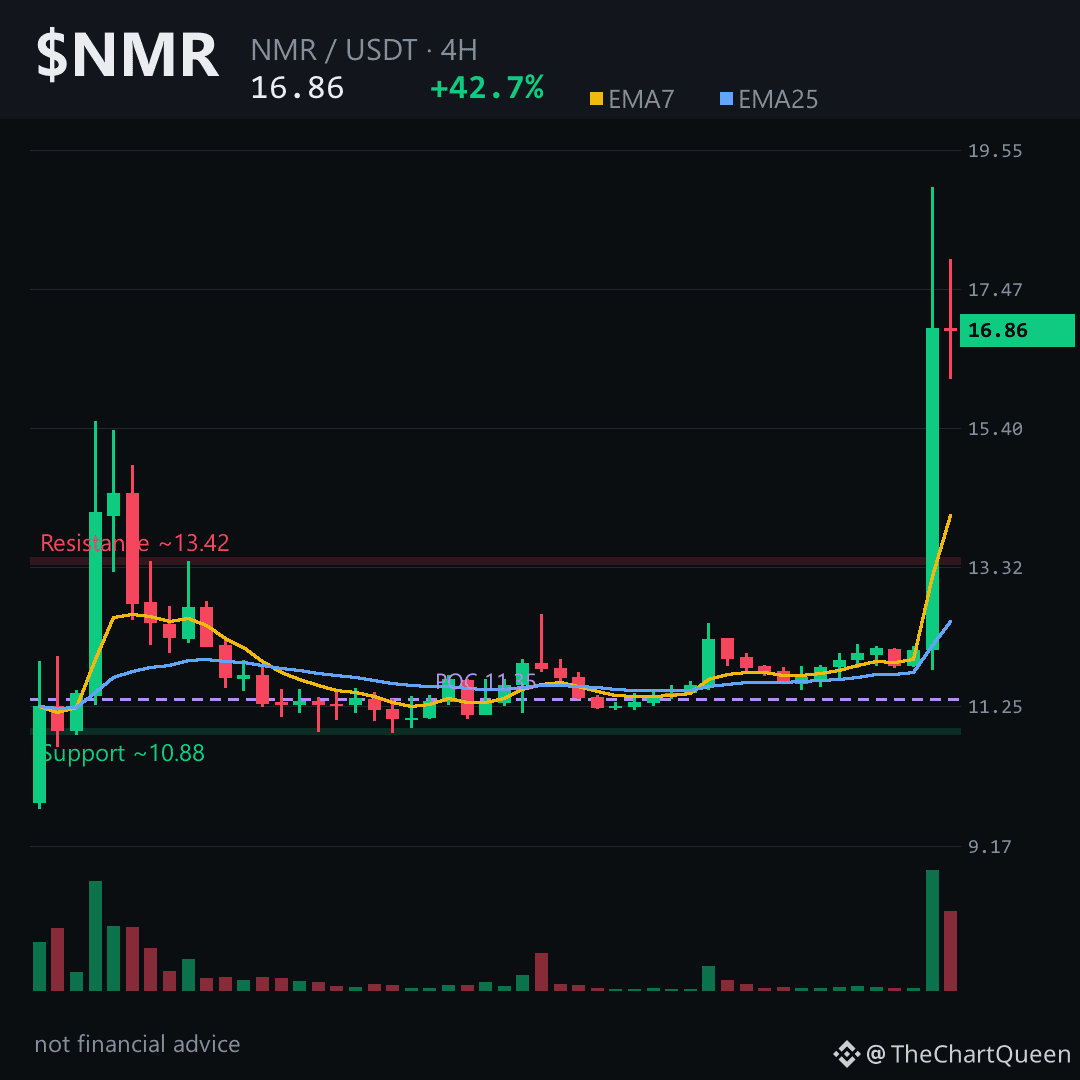
+42,72 % in 24 Stunden. Die 4-Stunden-Kerze mit einer Bewegung von 39 % innerhalb von vier Stunden ist genau die Art von Zahl, die entweder einen Trend einleitet oder beendet.
$NMR schoss in einer einzigen Sitzung von 11,70 auf fast 17 und hinterließ im Tageschart ein massives bullisches Ungleichgewicht – eine Zone, die vor dem nächsten echten Schub oft erneut getestet wird.
Die Funding-Rate ist stark negativ, während das Long/Short-Verhältnis unter 0,8 liegt. Shorts zahlen drauf, um in einem rasanten Aufwärtstrend short zu bleiben. Das sind gefangen sitzende Positionen. Der Short Squeeze ist noch nicht vollständig abgeklungen.
Die 4-Stunden-Struktur ist am klarsten zu lesen. Der Kurs hält sich über 15,85 – das ist die entscheidende Marke. Fällt der Kurs bei einem 4-Stunden-Schlusskurs darunter, ist diese Momentum-These vom Tisch. Darüber liegt das Ziel bei etwa 18,20, direkt unter dem 24-Stunden-Hoch.
Die Bewegung ist real, aber bereits weit gelaufen. Ein RSI von 84 bedeutet, dass das schnelle Geld mit der ersten Kerze gemacht wurde. Jetzt geht es darum, ob 15,85 als Unterstützung hält, während die negative Funding-Rate Shorts dazu zwingt, jeden Rücksetzer einzudecken.
Tippe auf $NMR und prüfe, ob 15,85 die Abkühlphase übersteht.
Auf welches Niveau achtest du bei diesem Chart? 👇
Folge mir für die nächste Analyse dieses Charts.
⚠️ Keine Finanzberatung. Informiere dich selbst (DYOR).
#NMR #Numeraire #Crypto #BinanceSquare
+42,72 % in 24 Stunden. Die 4-Stunden-Kerze mit einer Bewegung von 39 % innerhalb von vier Stunden ist genau die Art von Zahl, die entweder einen Trend einleitet oder beendet.
$NMR schoss in einer einzigen Sitzung von 11,70 auf fast 17 und hinterließ im Tageschart ein massives bullisches Ungleichgewicht – eine Zone, die vor dem nächsten echten Schub oft erneut getestet wird.
Die Funding-Rate ist stark negativ, während das Long/Short-Verhältnis unter 0,8 liegt. Shorts zahlen drauf, um in einem rasanten Aufwärtstrend short zu bleiben. Das sind gefangen sitzende Positionen. Der Short Squeeze ist noch nicht vollständig abgeklungen.
Die 4-Stunden-Struktur ist am klarsten zu lesen. Der Kurs hält sich über 15,85 – das ist die entscheidende Marke. Fällt der Kurs bei einem 4-Stunden-Schlusskurs darunter, ist diese Momentum-These vom Tisch. Darüber liegt das Ziel bei etwa 18,20, direkt unter dem 24-Stunden-Hoch.
Die Bewegung ist real, aber bereits weit gelaufen. Ein RSI von 84 bedeutet, dass das schnelle Geld mit der ersten Kerze gemacht wurde. Jetzt geht es darum, ob 15,85 als Unterstützung hält, während die negative Funding-Rate Shorts dazu zwingt, jeden Rücksetzer einzudecken.
Tippe auf $NMR und prüfe, ob 15,85 die Abkühlphase übersteht.
Auf welches Niveau achtest du bei diesem Chart? 👇
Folge mir für die nächste Analyse dieses Charts.
⚠️ Keine Finanzberatung. Informiere dich selbst (DYOR).
#NMR #Numeraire #Crypto #BinanceSquare
$NMR schoss in einer einzigen Sitzung von 11,70 auf fast 17 und hinterließ im Tageschart ein massives bullisches Ungleichgewicht – eine Zone, die vor dem nächsten echten Schub oft erneut getestet wird.
Die Funding-Rate ist stark negativ, während das Long/Short-Verhältnis unter 0,8 liegt. Shorts zahlen drauf, um in einem rasanten Aufwärtstrend short zu bleiben. Das sind gefangen sitzende Positionen. Der Short Squeeze ist noch nicht vollständig abgeklungen.
Die 4-Stunden-Struktur ist am klarsten zu lesen. Der Kurs hält sich über 15,85 – das ist die entscheidende Marke. Fällt der Kurs bei einem 4-Stunden-Schlusskurs darunter, ist diese Momentum-These vom Tisch. Darüber liegt das Ziel bei etwa 18,20, direkt unter dem 24-Stunden-Hoch.
Die Bewegung ist real, aber bereits weit gelaufen. Ein RSI von 84 bedeutet, dass das schnelle Geld mit der ersten Kerze gemacht wurde. Jetzt geht es darum, ob 15,85 als Unterstützung hält, während die negative Funding-Rate Shorts dazu zwingt, jeden Rücksetzer einzudecken.
Tippe auf $NMR und prüfe, ob 15,85 die Abkühlphase übersteht.
Auf welches Niveau achtest du bei diesem Chart? 👇
Folge mir für die nächste Analyse dieses Charts.
⚠️ Keine Finanzberatung. Informiere dich selbst (DYOR).
#NMR #Numeraire #Crypto #BinanceSquare
131
Übersetzung ansehen
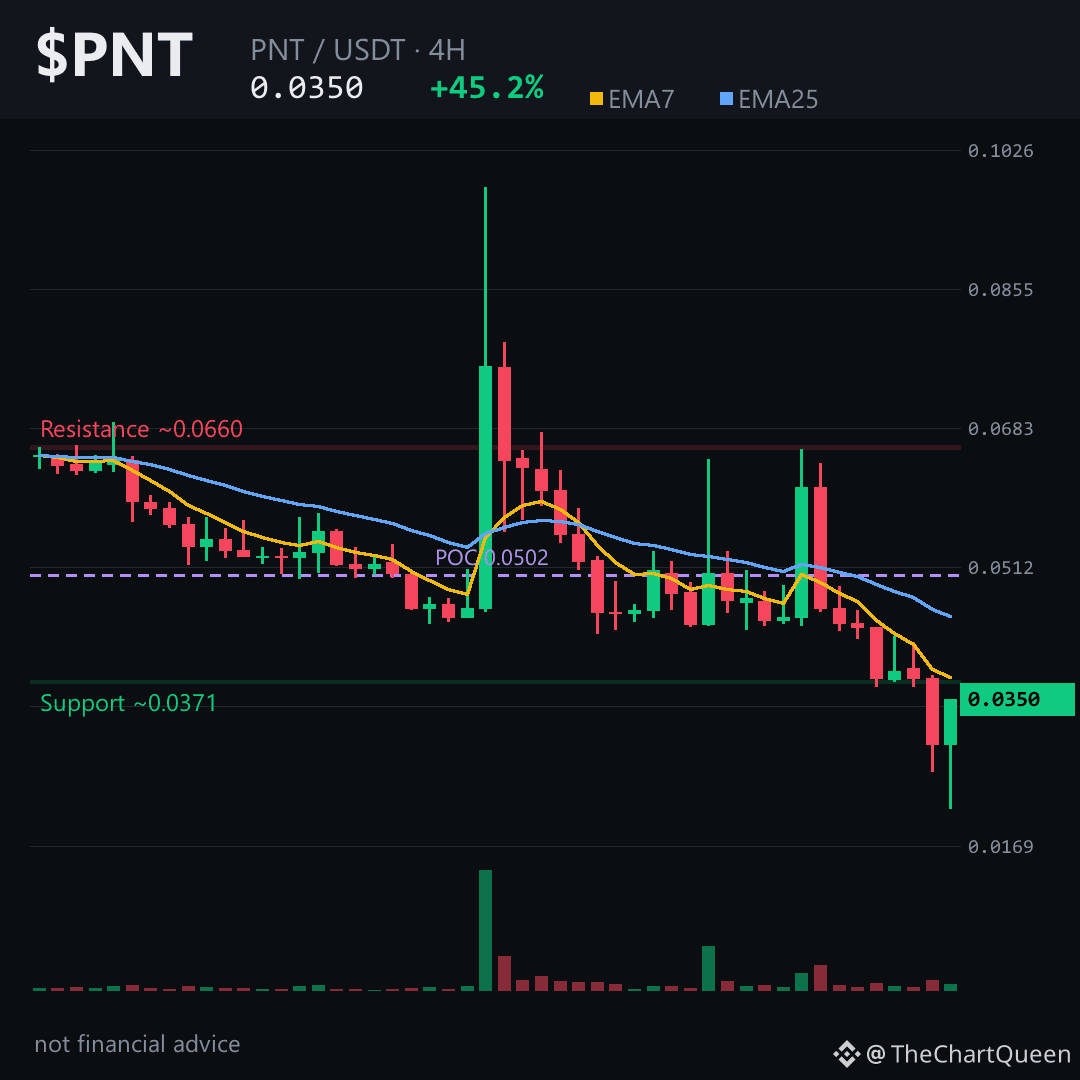
It is up 45 percent on the day and still trading 40 percent below the weekly open. That is not a pump. That is a dead-cat bounce inside a liquidation cascade, and the chart is screaming it.
Daily RSI is buried near 27, 4-hour EMAs in freefall. Price printed a 35 percent green candle, then gave back 24 percent in the next. That whipsaw is trapped sellers exiting at any bid — not accumulation. Weekly EMA7 sits near 0.108 while price fights to hold 0.035. A 70 percent gap.
The only timeframe that matters is the 4-hour. The invalidation is clean: if $PNT cannot reclaim the 0.037 area, the path of least resistance stays down toward the 0.032 zone. Lose that and the next shelf is the 24-hour low near 0.0215. Volume profile point of control sits up at 0.050 — most of the last two days of trading happened at levels price is nowhere near. Textbook overhang. Every bounce into 0.037–0.038 is likely to get sold until that changes.
My read: a falling knife with a short-term oversold bounce attached. The 45 percent gain looks impressive on a screener, but the structure underneath is broken. The real risk is not missing the next leg up — it is catching a bounce that fails at the first resistance zone.
I will post an updated read if $PNT starts holding above the 0.037 area on a 4-hour close — follow so it lands on your feed. What level are you watching on this one? 👇
Not financial advice. DYOR.
#PNT #Crypto #BinanceSquare
It is up 45 percent on the day and still trading 40 percent below the weekly open. That is not a pump. That is a dead-cat bounce inside a liquidation cascade, and the chart is screaming it.
Daily RSI is buried near 27, 4-hour EMAs in freefall. Price printed a 35 percent green candle, then gave back 24 percent in the next. That whipsaw is trapped sellers exiting at any bid — not accumulation. Weekly EMA7 sits near 0.108 while price fights to hold 0.035. A 70 percent gap.
The only timeframe that matters is the 4-hour. The invalidation is clean: if $PNT cannot reclaim the 0.037 area, the path of least resistance stays down toward the 0.032 zone. Lose that and the next shelf is the 24-hour low near 0.0215. Volume profile point of control sits up at 0.050 — most of the last two days of trading happened at levels price is nowhere near. Textbook overhang. Every bounce into 0.037–0.038 is likely to get sold until that changes.
My read: a falling knife with a short-term oversold bounce attached. The 45 percent gain looks impressive on a screener, but the structure underneath is broken. The real risk is not missing the next leg up — it is catching a bounce that fails at the first resistance zone.
I will post an updated read if $PNT starts holding above the 0.037 area on a 4-hour close — follow so it lands on your feed. What level are you watching on this one? 👇
Not financial advice. DYOR.
#PNT #Crypto #BinanceSquare
Daily RSI is buried near 27, 4-hour EMAs in freefall. Price printed a 35 percent green candle, then gave back 24 percent in the next. That whipsaw is trapped sellers exiting at any bid — not accumulation. Weekly EMA7 sits near 0.108 while price fights to hold 0.035. A 70 percent gap.
The only timeframe that matters is the 4-hour. The invalidation is clean: if $PNT cannot reclaim the 0.037 area, the path of least resistance stays down toward the 0.032 zone. Lose that and the next shelf is the 24-hour low near 0.0215. Volume profile point of control sits up at 0.050 — most of the last two days of trading happened at levels price is nowhere near. Textbook overhang. Every bounce into 0.037–0.038 is likely to get sold until that changes.
My read: a falling knife with a short-term oversold bounce attached. The 45 percent gain looks impressive on a screener, but the structure underneath is broken. The real risk is not missing the next leg up — it is catching a bounce that fails at the first resistance zone.
I will post an updated read if $PNT starts holding above the 0.037 area on a 4-hour close — follow so it lands on your feed. What level are you watching on this one? 👇
Not financial advice. DYOR.
#PNT #Crypto #BinanceSquare
Übersetzung ansehen
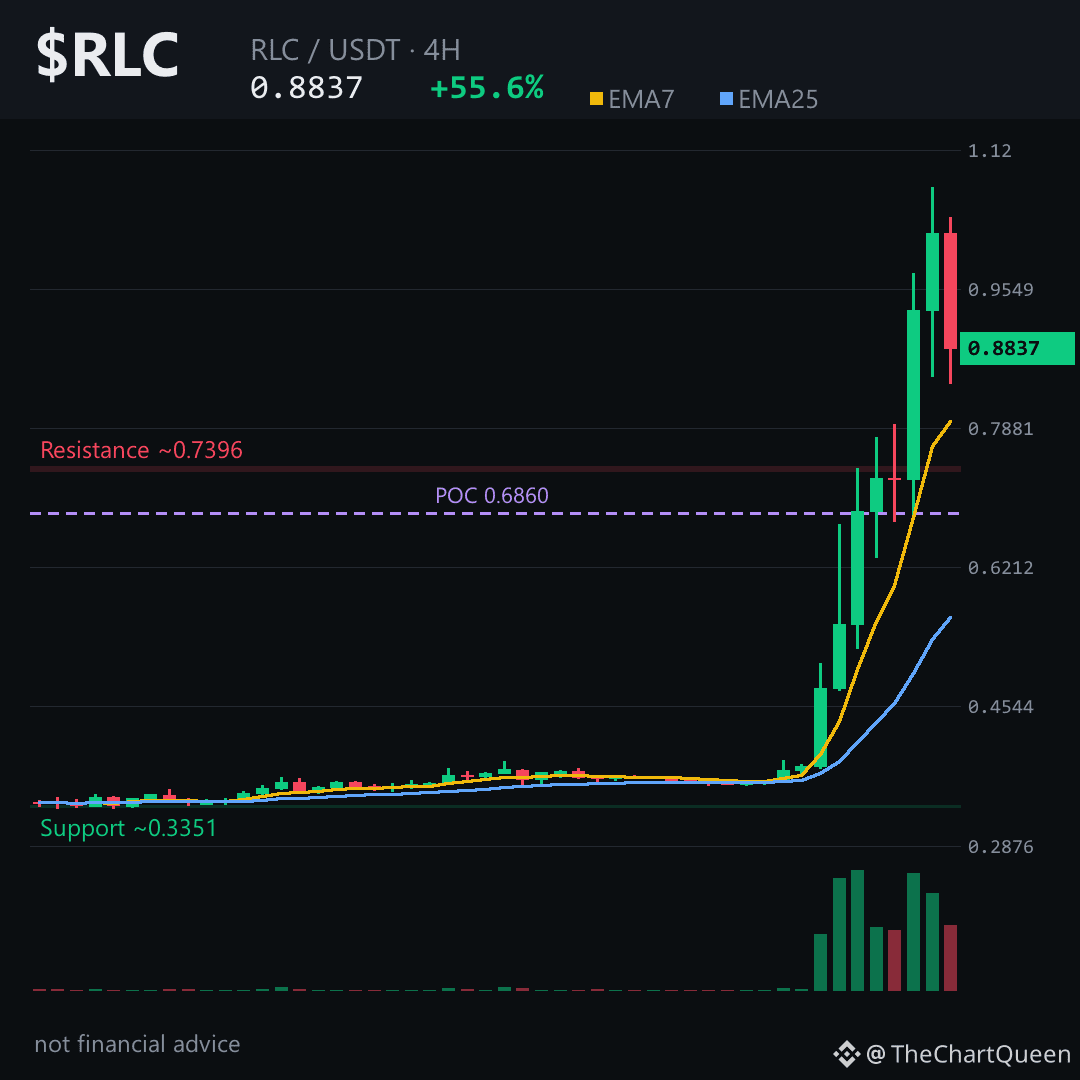
+55.62% in 24 hours has a way of making everything else on the chart look irrelevant.
Until you see the last 4H candle: a 13% rejection from the $1.07 high — right after the first red candle in 48 hours. Momentum is real, but the extension is stretched.
Structure is still bullish: 10 of the last 12 candles are green, EMA7 stacked above EMA25, RSI at 77 — hot but not diverging. Price ran from $0.36 to $0.88 in two days without a real pullback.
Futures internals whisper: funding negative at -0.03%, long/short ratio 0.58 — shorts paying to stay short while the crowd is net short. Classic squeeze fuel, but also a sign spot buyers are driving, not leveraged longs.
The level I'm watching on 4H: ~$0.84. That's the top of the unfilled bullish FVG and near the 0.382 Fib retracement. If $RLC holds above $0.84 on a 4H close, the next objective sits near $0.96 — just under the psychological $1.00.
Lose $0.84, and this read is off. Next support: $0.79–$0.80 pocket.
My read: trend intact, but the easy money's made. Risk-reward at $0.88 favors patience — consolidation above $0.84 or a deeper retest of $0.79 before the next leg.
Tap $RLC to pull up the chart and check these zones yourself. Which level are you watching more closely — $0.84 or the $1.00 area? 👇
Follow for the next read on this chart.
⚠️ Not financial advice. DYOR.
#RLC #iExec #Crypto #BinanceSquare
+55.62% in 24 hours has a way of making everything else on the chart look irrelevant.
Until you see the last 4H candle: a 13% rejection from the $1.07 high — right after the first red candle in 48 hours. Momentum is real, but the extension is stretched.
Structure is still bullish: 10 of the last 12 candles are green, EMA7 stacked above EMA25, RSI at 77 — hot but not diverging. Price ran from $0.36 to $0.88 in two days without a real pullback.
Futures internals whisper: funding negative at -0.03%, long/short ratio 0.58 — shorts paying to stay short while the crowd is net short. Classic squeeze fuel, but also a sign spot buyers are driving, not leveraged longs.
The level I'm watching on 4H: ~$0.84. That's the top of the unfilled bullish FVG and near the 0.382 Fib retracement. If $RLC holds above $0.84 on a 4H close, the next objective sits near $0.96 — just under the psychological $1.00.
Lose $0.84, and this read is off. Next support: $0.79–$0.80 pocket.
My read: trend intact, but the easy money's made. Risk-reward at $0.88 favors patience — consolidation above $0.84 or a deeper retest of $0.79 before the next leg.
Tap $RLC to pull up the chart and check these zones yourself. Which level are you watching more closely — $0.84 or the $1.00 area? 👇
Follow for the next read on this chart.
⚠️ Not financial advice. DYOR.
#RLC #iExec #Crypto #BinanceSquare
Until you see the last 4H candle: a 13% rejection from the $1.07 high — right after the first red candle in 48 hours. Momentum is real, but the extension is stretched.
Structure is still bullish: 10 of the last 12 candles are green, EMA7 stacked above EMA25, RSI at 77 — hot but not diverging. Price ran from $0.36 to $0.88 in two days without a real pullback.
Futures internals whisper: funding negative at -0.03%, long/short ratio 0.58 — shorts paying to stay short while the crowd is net short. Classic squeeze fuel, but also a sign spot buyers are driving, not leveraged longs.
The level I'm watching on 4H: ~$0.84. That's the top of the unfilled bullish FVG and near the 0.382 Fib retracement. If $RLC holds above $0.84 on a 4H close, the next objective sits near $0.96 — just under the psychological $1.00.
Lose $0.84, and this read is off. Next support: $0.79–$0.80 pocket.
My read: trend intact, but the easy money's made. Risk-reward at $0.88 favors patience — consolidation above $0.84 or a deeper retest of $0.79 before the next leg.
Tap $RLC to pull up the chart and check these zones yourself. Which level are you watching more closely — $0.84 or the $1.00 area? 👇
Follow for the next read on this chart.
⚠️ Not financial advice. DYOR.
#RLC #iExec #Crypto #BinanceSquare
82
Übersetzung ansehen
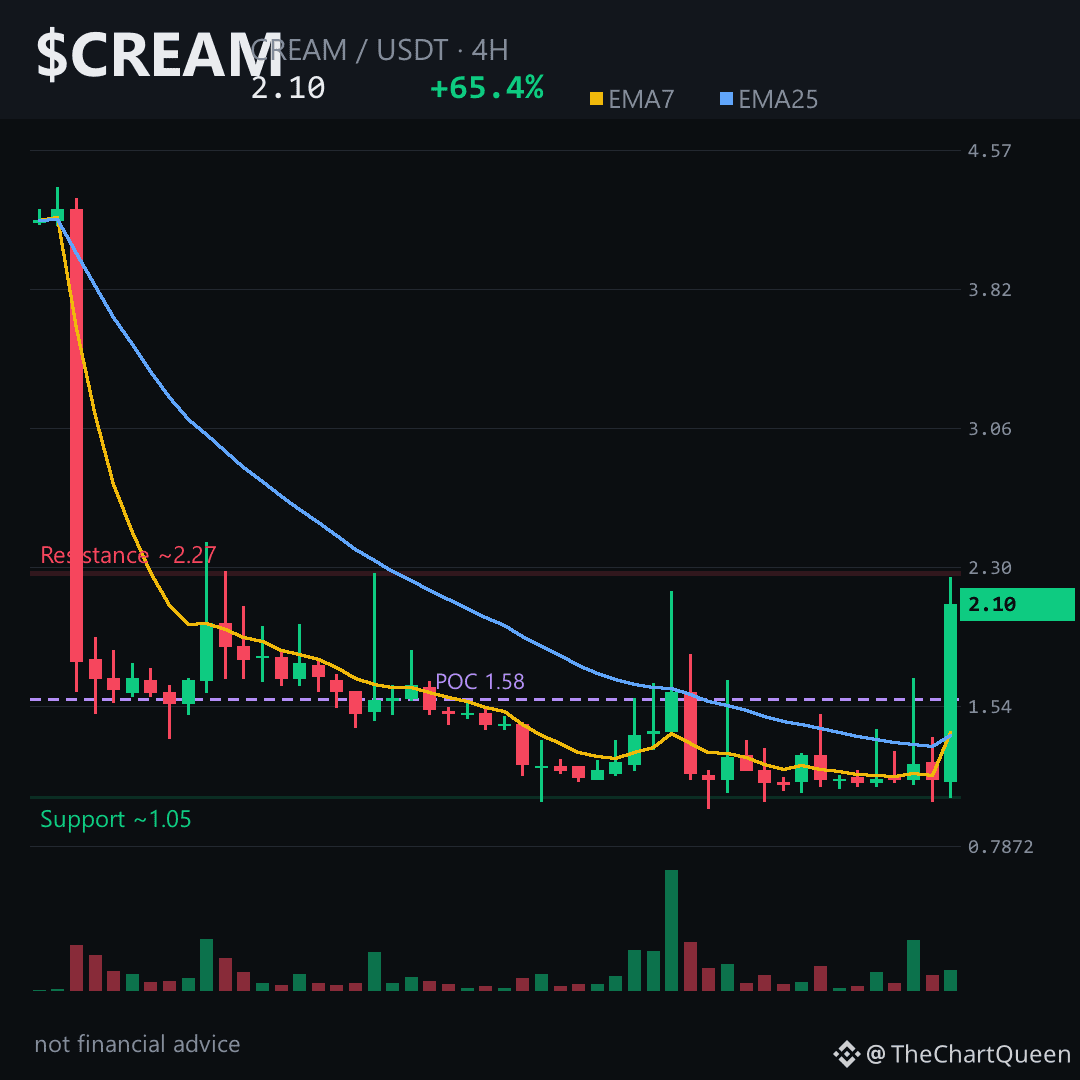
A +65% candle in 4 hours, and the funding rate sits flat at zero. That’s not euphoria — that’s a vacuum.
Everyone sees “Top Gainer” and thinks the move is exhausted. I see a chart that just repriced itself without leverage chasing it. No futures crowd, no overheated funding — just spot flow ripping price from the low 1.20s to 2.25 in one violent push.
Short-term EMAs crossed upward, momentum stretched but not broken, and volume dwarfed the prior 48 hours. This is a re-rating candle, holding above the prior range instead of fading it.
The pivot zone sits around 2.09. If $CREAM can defend 1.98–2.00 on a 4H close, the path of least resistance points toward 2.28. Lose 1.98, and the bullish thesis unravels fast — the move was too sharp to trust without a higher low forming first.
My read: strength is real, but unconfirmed. No futures positioning means this can extend without a squeeze — or stall without fuel. I’m not calling a top; I’m watching whether 2.00 holds as support.
Follow me — I’ll break down whether this level survives or folds. Which zone are you watching on $CREAM right now 👇
⚠️ Not financial advice. DYOR.
#CREAM #DeFi #Crypto #BinanceSquare
A +65% candle in 4 hours, and the funding rate sits flat at zero. That’s not euphoria — that’s a vacuum.
Everyone sees “Top Gainer” and thinks the move is exhausted. I see a chart that just repriced itself without leverage chasing it. No futures crowd, no overheated funding — just spot flow ripping price from the low 1.20s to 2.25 in one violent push.
Short-term EMAs crossed upward, momentum stretched but not broken, and volume dwarfed the prior 48 hours. This is a re-rating candle, holding above the prior range instead of fading it.
The pivot zone sits around 2.09. If $CREAM can defend 1.98–2.00 on a 4H close, the path of least resistance points toward 2.28. Lose 1.98, and the bullish thesis unravels fast — the move was too sharp to trust without a higher low forming first.
My read: strength is real, but unconfirmed. No futures positioning means this can extend without a squeeze — or stall without fuel. I’m not calling a top; I’m watching whether 2.00 holds as support.
Follow me — I’ll break down whether this level survives or folds. Which zone are you watching on $CREAM right now 👇
⚠️ Not financial advice. DYOR.
#CREAM #DeFi #Crypto #BinanceSquare
Everyone sees “Top Gainer” and thinks the move is exhausted. I see a chart that just repriced itself without leverage chasing it. No futures crowd, no overheated funding — just spot flow ripping price from the low 1.20s to 2.25 in one violent push.
Short-term EMAs crossed upward, momentum stretched but not broken, and volume dwarfed the prior 48 hours. This is a re-rating candle, holding above the prior range instead of fading it.
The pivot zone sits around 2.09. If $CREAM can defend 1.98–2.00 on a 4H close, the path of least resistance points toward 2.28. Lose 1.98, and the bullish thesis unravels fast — the move was too sharp to trust without a higher low forming first.
My read: strength is real, but unconfirmed. No futures positioning means this can extend without a squeeze — or stall without fuel. I’m not calling a top; I’m watching whether 2.00 holds as support.
Follow me — I’ll break down whether this level survives or folds. Which zone are you watching on $CREAM right now 👇
⚠️ Not financial advice. DYOR.
#CREAM #DeFi #Crypto #BinanceSquare
1
Alle glauben, dass dieser Pump auf dem letzten Loch pfeift.
Sie irren sich.
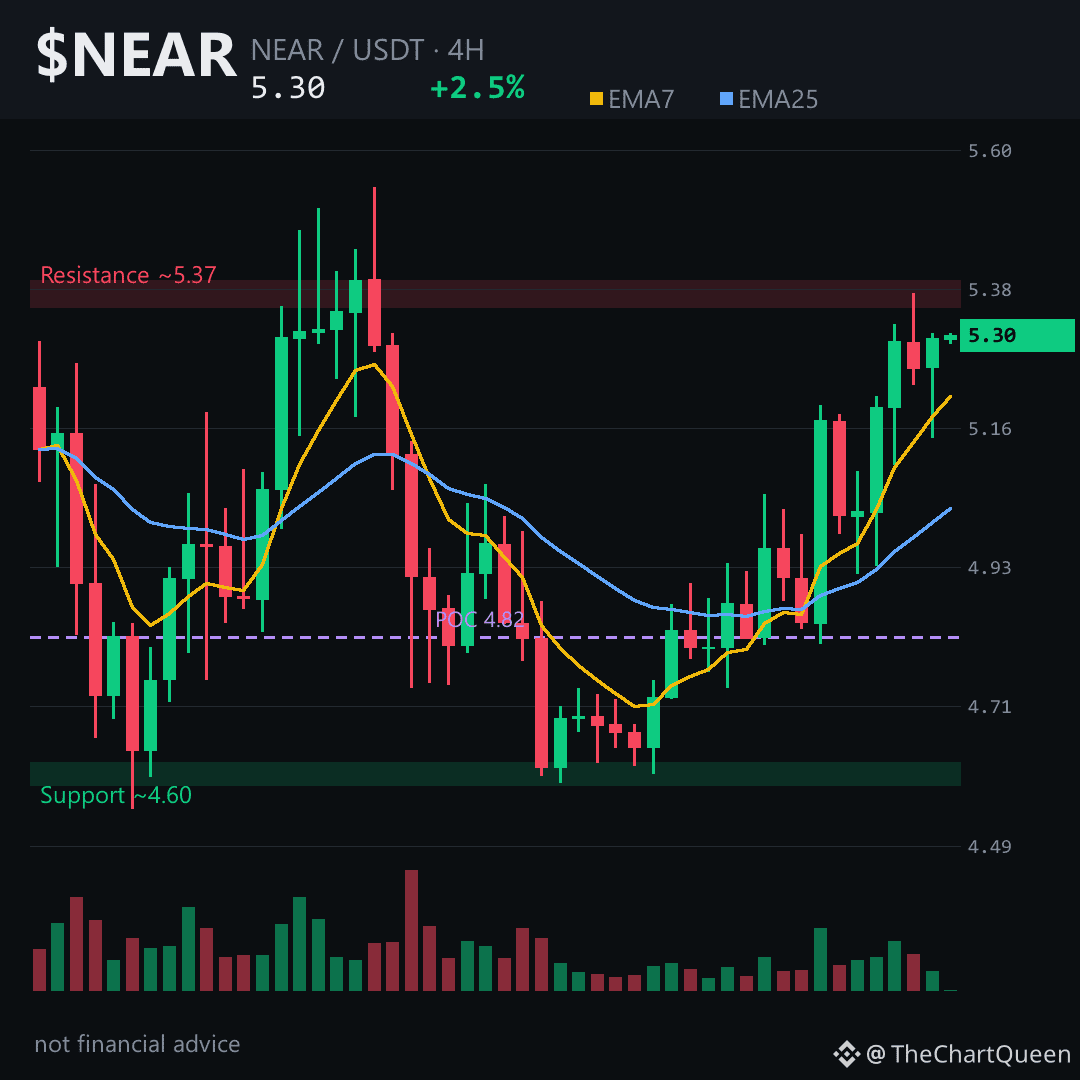
Die 4H-Kerze um 04:00 Uhr ist nicht einfach nur nach oben ausgeschlagen — sie hat eine bullische Kurslücke von etwa 5.086 bis 5.097 hinterlassen, die der Kurs noch nicht wieder angelaufen hat. Ein ungefülltes FVG: Die Käufer waren so schnell, dass kaum echter Handel stattfand. Oft bewegt sich der Kurs zurück, um die Lücke zu schließen, bevor er weiter steigt. Dass das bisher nicht passiert ist? Das ist stille Stärke, keine Schwäche.
Die Funding-Rate ist kaum positiv, das Open Interest moderat. Das ist kein überhebelter Blow-off-Top — es sieht eher nach echter Spot-Akkumulation aus, während Futures-Trader noch zögern. Der Kurs verteidigt weiterhin 5.10, die EMA7 dreht über die EMA25, der RSI liegt im niedrigen 60er-Bereich — Momentum ohne Manie.
Die wichtigste Marke auf $NEAR ist 5.00–5.01. Dort bricht die Struktur. Ein 4H-Schlusskurs darunter würde die gesamte bullische These zunichtemachen. Bis dahin deutet der Weg des geringsten Widerstands auf 5.74 hin, wobei der Point of Control des Volumenprofils nahe 4.82 als tiefere Unterstützung dient. Tippe auf $NEAR , um den Chart aufzurufen und zu sehen, wie sauber der Kurs diese Zonen respektiert.
Meine Einschätzung: ein Fortsetzungsszenario nach oben, das gesünder aussieht als bei den meisten aktuell volumenstarken Gewinnern. Das Risiko liegt nicht im Aufwärtspotenzial — sondern darin, sich von einem flachen Rücksetzer in diese Lücke täuschen zu lassen und ihn fälschlich als Trendwende zu deuten.
Wenn diese Marke durchbrochen wird oder hält, aktualisiere ich meine Einschätzung — folge mir, damit du dann schon hier bist.
Welche Zone beobachtest du bei $NEAR genauer — die Lücke nahe 5.09 oder die Invalidierungsmarke um 5.00? 👇
⚠️ Keine Finanzberatung. Informiere dich selbst (DYOR).
#NEAR #NEARProtocol #Crypto #BinanceSquare
Alle glauben, dass dieser Pump auf dem letzten Loch pfeift.
Sie irren sich.
Die 4H-Kerze um 04:00 Uhr ist nicht einfach nur nach oben ausgeschlagen — sie hat eine bullische Kurslücke von etwa 5.086 bis 5.097 hinterlassen, die der Kurs noch nicht wieder angelaufen hat. Ein ungefülltes FVG: Die Käufer waren so schnell, dass kaum echter Handel stattfand. Oft bewegt sich der Kurs zurück, um die Lücke zu schließen, bevor er weiter steigt. Dass das bisher nicht passiert ist? Das ist stille Stärke, keine Schwäche.
Die Funding-Rate ist kaum positiv, das Open Interest moderat. Das ist kein überhebelter Blow-off-Top — es sieht eher nach echter Spot-Akkumulation aus, während Futures-Trader noch zögern. Der Kurs verteidigt weiterhin 5.10, die EMA7 dreht über die EMA25, der RSI liegt im niedrigen 60er-Bereich — Momentum ohne Manie.
Die wichtigste Marke auf $NEAR ist 5.00–5.01. Dort bricht die Struktur. Ein 4H-Schlusskurs darunter würde die gesamte bullische These zunichtemachen. Bis dahin deutet der Weg des geringsten Widerstands auf 5.74 hin, wobei der Point of Control des Volumenprofils nahe 4.82 als tiefere Unterstützung dient. Tippe auf $NEAR , um den Chart aufzurufen und zu sehen, wie sauber der Kurs diese Zonen respektiert.
Meine Einschätzung: ein Fortsetzungsszenario nach oben, das gesünder aussieht als bei den meisten aktuell volumenstarken Gewinnern. Das Risiko liegt nicht im Aufwärtspotenzial — sondern darin, sich von einem flachen Rücksetzer in diese Lücke täuschen zu lassen und ihn fälschlich als Trendwende zu deuten.
Wenn diese Marke durchbrochen wird oder hält, aktualisiere ich meine Einschätzung — folge mir, damit du dann schon hier bist.
Welche Zone beobachtest du bei $NEAR genauer — die Lücke nahe 5.09 oder die Invalidierungsmarke um 5.00? 👇
⚠️ Keine Finanzberatung. Informiere dich selbst (DYOR).
#NEAR #NEARProtocol #Crypto #BinanceSquare
Sie irren sich.
Die 4H-Kerze um 04:00 Uhr ist nicht einfach nur nach oben ausgeschlagen — sie hat eine bullische Kurslücke von etwa 5.086 bis 5.097 hinterlassen, die der Kurs noch nicht wieder angelaufen hat. Ein ungefülltes FVG: Die Käufer waren so schnell, dass kaum echter Handel stattfand. Oft bewegt sich der Kurs zurück, um die Lücke zu schließen, bevor er weiter steigt. Dass das bisher nicht passiert ist? Das ist stille Stärke, keine Schwäche.
Die Funding-Rate ist kaum positiv, das Open Interest moderat. Das ist kein überhebelter Blow-off-Top — es sieht eher nach echter Spot-Akkumulation aus, während Futures-Trader noch zögern. Der Kurs verteidigt weiterhin 5.10, die EMA7 dreht über die EMA25, der RSI liegt im niedrigen 60er-Bereich — Momentum ohne Manie.
Die wichtigste Marke auf $NEAR ist 5.00–5.01. Dort bricht die Struktur. Ein 4H-Schlusskurs darunter würde die gesamte bullische These zunichtemachen. Bis dahin deutet der Weg des geringsten Widerstands auf 5.74 hin, wobei der Point of Control des Volumenprofils nahe 4.82 als tiefere Unterstützung dient. Tippe auf $NEAR , um den Chart aufzurufen und zu sehen, wie sauber der Kurs diese Zonen respektiert.
Meine Einschätzung: ein Fortsetzungsszenario nach oben, das gesünder aussieht als bei den meisten aktuell volumenstarken Gewinnern. Das Risiko liegt nicht im Aufwärtspotenzial — sondern darin, sich von einem flachen Rücksetzer in diese Lücke täuschen zu lassen und ihn fälschlich als Trendwende zu deuten.
Wenn diese Marke durchbrochen wird oder hält, aktualisiere ich meine Einschätzung — folge mir, damit du dann schon hier bist.
Welche Zone beobachtest du bei $NEAR genauer — die Lücke nahe 5.09 oder die Invalidierungsmarke um 5.00? 👇
⚠️ Keine Finanzberatung. Informiere dich selbst (DYOR).
#NEAR #NEARProtocol #Crypto #BinanceSquare
1
92
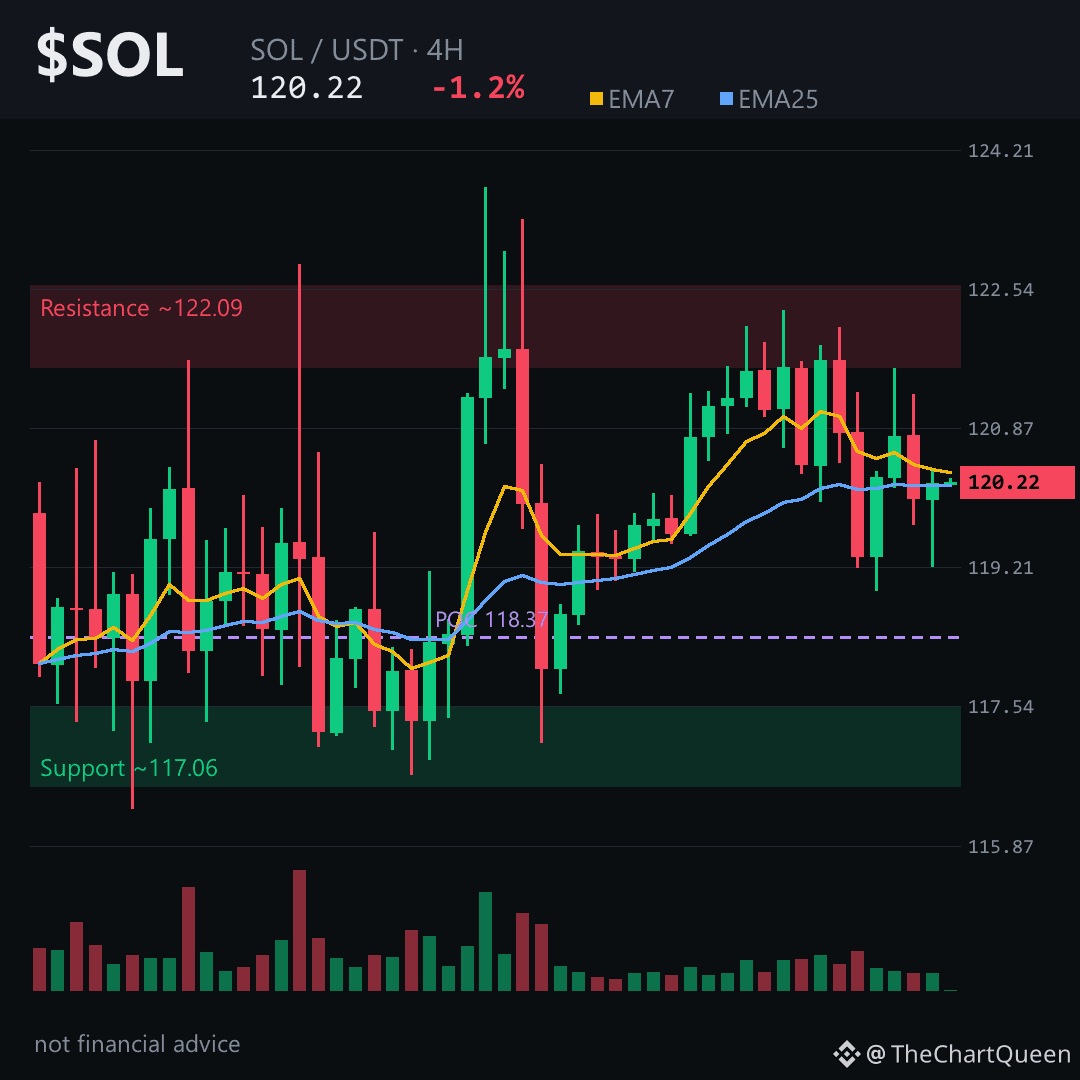
Stell dir vor, du sitzt in einem Café und beobachtest, wie eine Coin sechs Stunden lang in einer Spanne von 3 Dollar gehandelt wird — genau das passiert gerade bei $SOL , und die Ruhe erzählt eine lautere Geschichte als jeder Pump.
Der Preis bewegt sich um 120, aber im Tageschart klafft eine bullische Kurslücke zwischen etwa 111 und 115, die nie geschlossen wurde. Im 4-Stunden-Chart liegt der 7-Perioden-Durchschnitt knapp über dem 25-Perioden-Durchschnitt — das Momentum ist technisch gesehen positiv, aber nur um ein paar Cent. Der RSI liegt nahe 50: Niemand hat die Kontrolle.
Die Funding-Rate ist leicht negativ — Shorts zahlen an Longs — während das Long/Short-Verhältnis über 1 liegt. Die Überzeugung ist gering. Für einen Squeeze in die eine oder andere Richtung wäre nicht viel Treibstoff nötig.
Die wichtigste Marke ist 118. Das ist die Unterstützung der letzten 24 Stunden und sie liegt auf Höhe der oberen Kante der Kurslücke. Sollte $SOL die Zone zwischen 117 und 118 bei einem soliden 4-Stunden-Schlusskurs verlieren, wird die Kurslücke zum nächsten Ziel. Ein Anstieg über 122 eröffnet den Weg Richtung 125 — dem letzten lokalen Hoch.
Dieser Markt steht unter Spannung und wartet auf einen Auslöser. Der Tagestrend spricht für steigende Kurse, aber die Erschöpfung im 4-Stunden-Chart nahe 122 ist real. Fällt 117, ändert sich das Bild schnell.
Tippe auf $SOL , um den Chart aufzurufen und selbst zu sehen, wie diese Marken zusammenpassen.
Welcher Zone vertraust du gerade mehr — dem Boden bei 118 oder der Decke bei 125? 👇
Keine Finanzberatung. Recherchiere selbst.
Folge mir für die nächste Analyse dieses Charts.
#SOL #Solana #Crypto #BinanceSquare
Stell dir vor, du sitzt in einem Café und beobachtest, wie eine Coin sechs Stunden lang in einer Spanne von 3 Dollar gehandelt wird — genau das passiert gerade bei $SOL , und die Ruhe erzählt eine lautere Geschichte als jeder Pump.
Der Preis bewegt sich um 120, aber im Tageschart klafft eine bullische Kurslücke zwischen etwa 111 und 115, die nie geschlossen wurde. Im 4-Stunden-Chart liegt der 7-Perioden-Durchschnitt knapp über dem 25-Perioden-Durchschnitt — das Momentum ist technisch gesehen positiv, aber nur um ein paar Cent. Der RSI liegt nahe 50: Niemand hat die Kontrolle.
Die Funding-Rate ist leicht negativ — Shorts zahlen an Longs — während das Long/Short-Verhältnis über 1 liegt. Die Überzeugung ist gering. Für einen Squeeze in die eine oder andere Richtung wäre nicht viel Treibstoff nötig.
Die wichtigste Marke ist 118. Das ist die Unterstützung der letzten 24 Stunden und sie liegt auf Höhe der oberen Kante der Kurslücke. Sollte $SOL die Zone zwischen 117 und 118 bei einem soliden 4-Stunden-Schlusskurs verlieren, wird die Kurslücke zum nächsten Ziel. Ein Anstieg über 122 eröffnet den Weg Richtung 125 — dem letzten lokalen Hoch.
Dieser Markt steht unter Spannung und wartet auf einen Auslöser. Der Tagestrend spricht für steigende Kurse, aber die Erschöpfung im 4-Stunden-Chart nahe 122 ist real. Fällt 117, ändert sich das Bild schnell.
Tippe auf $SOL , um den Chart aufzurufen und selbst zu sehen, wie diese Marken zusammenpassen.
Welcher Zone vertraust du gerade mehr — dem Boden bei 118 oder der Decke bei 125? 👇
Keine Finanzberatung. Recherchiere selbst.
Folge mir für die nächste Analyse dieses Charts.
#SOL #Solana #Crypto #BinanceSquare
Der Preis bewegt sich um 120, aber im Tageschart klafft eine bullische Kurslücke zwischen etwa 111 und 115, die nie geschlossen wurde. Im 4-Stunden-Chart liegt der 7-Perioden-Durchschnitt knapp über dem 25-Perioden-Durchschnitt — das Momentum ist technisch gesehen positiv, aber nur um ein paar Cent. Der RSI liegt nahe 50: Niemand hat die Kontrolle.
Die Funding-Rate ist leicht negativ — Shorts zahlen an Longs — während das Long/Short-Verhältnis über 1 liegt. Die Überzeugung ist gering. Für einen Squeeze in die eine oder andere Richtung wäre nicht viel Treibstoff nötig.
Die wichtigste Marke ist 118. Das ist die Unterstützung der letzten 24 Stunden und sie liegt auf Höhe der oberen Kante der Kurslücke. Sollte $SOL die Zone zwischen 117 und 118 bei einem soliden 4-Stunden-Schlusskurs verlieren, wird die Kurslücke zum nächsten Ziel. Ein Anstieg über 122 eröffnet den Weg Richtung 125 — dem letzten lokalen Hoch.
Dieser Markt steht unter Spannung und wartet auf einen Auslöser. Der Tagestrend spricht für steigende Kurse, aber die Erschöpfung im 4-Stunden-Chart nahe 122 ist real. Fällt 117, ändert sich das Bild schnell.
Tippe auf $SOL , um den Chart aufzurufen und selbst zu sehen, wie diese Marken zusammenpassen.
Welcher Zone vertraust du gerade mehr — dem Boden bei 118 oder der Decke bei 125? 👇
Keine Finanzberatung. Recherchiere selbst.
Folge mir für die nächste Analyse dieses Charts.
#SOL #Solana #Crypto #BinanceSquare
2
2
95
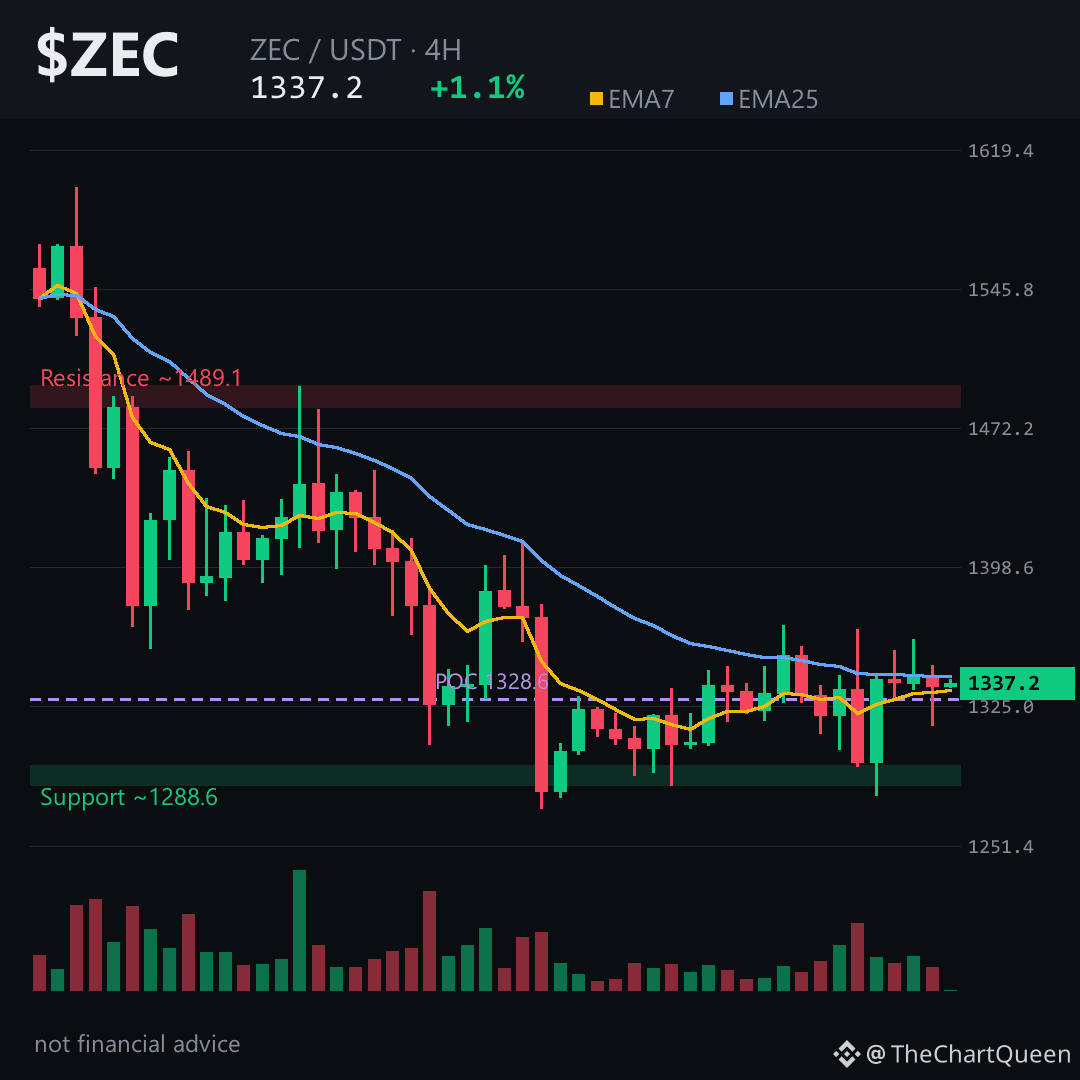
Alle sind überzeugt, dass der Abprall bei $1278 den Tiefpunkt markiert.
Dreh es um.
Der 4H-Chart steckt unter seinem eigenen 25-Perioden-Durchschnitt nahe $1341 fest – der Kurs berührt ihn immer wieder und wird zurückgewiesen. Das ist keine Stärke, sondern ein Widerstand, der von unten getestet wird.
Die Futures zeigen die Falle deutlich: Die Masse setzt auf fallende Kurse, doch das Funding ist positiv. Leerverkäufer zahlen dafür, short zu bleiben, während der Kurs seitwärts tendiert – oft der Treibstoff für einen weiteren falschen Anstieg, bevor der echte Rückgang einsetzt.
Das größere Bild spricht dagegen: Der Tagestrend ist weiterhin bullish, der 7-Tage-Durchschnitt liegt über dem 25-Tage-Durchschnitt, nahe $1360 gegenüber $1337.
Der Kampf ist also real – kurzfristige Erschöpfung gegen einen mittelfristigen Aufwärtstrend.
Meine Marken für $ZEC: Der 4H-Ausblick bleibt bearish, solange der Kurs den Bereich um $1408 nicht per Schlusskurs zurückerobert. Darunter öffnet sich der Weg in Richtung der Zone um $1220 – dort wird der Tagesaufwärtstrend ernsthaft auf die Probe gestellt.
Fällt $1220, rückt der makroökonomische Boden nahe $1018 in den Fokus. Erobert der Kurs $1408 zurück, ist diese bearishe Einschätzung schlicht falsch.
Der Chart zieht sich zusammen. Tippe auf $ZEC und beobachte, wie sich der Kurs um $1341 verhält – das ist der entscheidende Hinweis.
Meine Einschätzung: Die 4H-Struktur spricht dafür, Stärke im Bereich von $1341–$1360 zu verkaufen, bis das Gegenteil bewiesen ist. Das echte Risiko ist ein Short Squeeze über $1408, der das gesamte Setup kippt.
Folge mir – sobald sich die Spanne bei $ZEC auflöst, analysiere ich, welche Seite tatsächlich gewonnen hat, bevor die Bewegung offensichtlich wird.
Auf welches Niveau achtest du genauer – $1341 oder $1220? 👇
⚠️ Keine Finanzberatung. DYOR.
#ZEC #Zcash #Crypto #BinanceSquare
Alle sind überzeugt, dass der Abprall bei $1278 den Tiefpunkt markiert.
Dreh es um.
Der 4H-Chart steckt unter seinem eigenen 25-Perioden-Durchschnitt nahe $1341 fest – der Kurs berührt ihn immer wieder und wird zurückgewiesen. Das ist keine Stärke, sondern ein Widerstand, der von unten getestet wird.
Die Futures zeigen die Falle deutlich: Die Masse setzt auf fallende Kurse, doch das Funding ist positiv. Leerverkäufer zahlen dafür, short zu bleiben, während der Kurs seitwärts tendiert – oft der Treibstoff für einen weiteren falschen Anstieg, bevor der echte Rückgang einsetzt.
Das größere Bild spricht dagegen: Der Tagestrend ist weiterhin bullish, der 7-Tage-Durchschnitt liegt über dem 25-Tage-Durchschnitt, nahe $1360 gegenüber $1337.
Der Kampf ist also real – kurzfristige Erschöpfung gegen einen mittelfristigen Aufwärtstrend.
Meine Marken für $ZEC : Der 4H-Ausblick bleibt bearish, solange der Kurs den Bereich um $1408 nicht per Schlusskurs zurückerobert. Darunter öffnet sich der Weg in Richtung der Zone um $1220 – dort wird der Tagesaufwärtstrend ernsthaft auf die Probe gestellt.
Fällt $1220, rückt der makroökonomische Boden nahe $1018 in den Fokus. Erobert der Kurs $1408 zurück, ist diese bearishe Einschätzung schlicht falsch.
Der Chart zieht sich zusammen. Tippe auf $ZEC und beobachte, wie sich der Kurs um $1341 verhält – das ist der entscheidende Hinweis.
Meine Einschätzung: Die 4H-Struktur spricht dafür, Stärke im Bereich von $1341–$1360 zu verkaufen, bis das Gegenteil bewiesen ist. Das echte Risiko ist ein Short Squeeze über $1408, der das gesamte Setup kippt.
Folge mir – sobald sich die Spanne bei $ZEC auflöst, analysiere ich, welche Seite tatsächlich gewonnen hat, bevor die Bewegung offensichtlich wird.
Auf welches Niveau achtest du genauer – $1341 oder $1220? 👇
⚠️ Keine Finanzberatung. DYOR.
#ZEC #Zcash #Crypto #BinanceSquare
Dreh es um.
Der 4H-Chart steckt unter seinem eigenen 25-Perioden-Durchschnitt nahe $1341 fest – der Kurs berührt ihn immer wieder und wird zurückgewiesen. Das ist keine Stärke, sondern ein Widerstand, der von unten getestet wird.
Die Futures zeigen die Falle deutlich: Die Masse setzt auf fallende Kurse, doch das Funding ist positiv. Leerverkäufer zahlen dafür, short zu bleiben, während der Kurs seitwärts tendiert – oft der Treibstoff für einen weiteren falschen Anstieg, bevor der echte Rückgang einsetzt.
Das größere Bild spricht dagegen: Der Tagestrend ist weiterhin bullish, der 7-Tage-Durchschnitt liegt über dem 25-Tage-Durchschnitt, nahe $1360 gegenüber $1337.
Der Kampf ist also real – kurzfristige Erschöpfung gegen einen mittelfristigen Aufwärtstrend.
Meine Marken für $ZEC : Der 4H-Ausblick bleibt bearish, solange der Kurs den Bereich um $1408 nicht per Schlusskurs zurückerobert. Darunter öffnet sich der Weg in Richtung der Zone um $1220 – dort wird der Tagesaufwärtstrend ernsthaft auf die Probe gestellt.
Fällt $1220, rückt der makroökonomische Boden nahe $1018 in den Fokus. Erobert der Kurs $1408 zurück, ist diese bearishe Einschätzung schlicht falsch.
Der Chart zieht sich zusammen. Tippe auf $ZEC und beobachte, wie sich der Kurs um $1341 verhält – das ist der entscheidende Hinweis.
Meine Einschätzung: Die 4H-Struktur spricht dafür, Stärke im Bereich von $1341–$1360 zu verkaufen, bis das Gegenteil bewiesen ist. Das echte Risiko ist ein Short Squeeze über $1408, der das gesamte Setup kippt.
Folge mir – sobald sich die Spanne bei $ZEC auflöst, analysiere ich, welche Seite tatsächlich gewonnen hat, bevor die Bewegung offensichtlich wird.
Auf welches Niveau achtest du genauer – $1341 oder $1220? 👇
⚠️ Keine Finanzberatung. DYOR.
#ZEC #Zcash #Crypto #BinanceSquare
197
Übersetzung ansehen
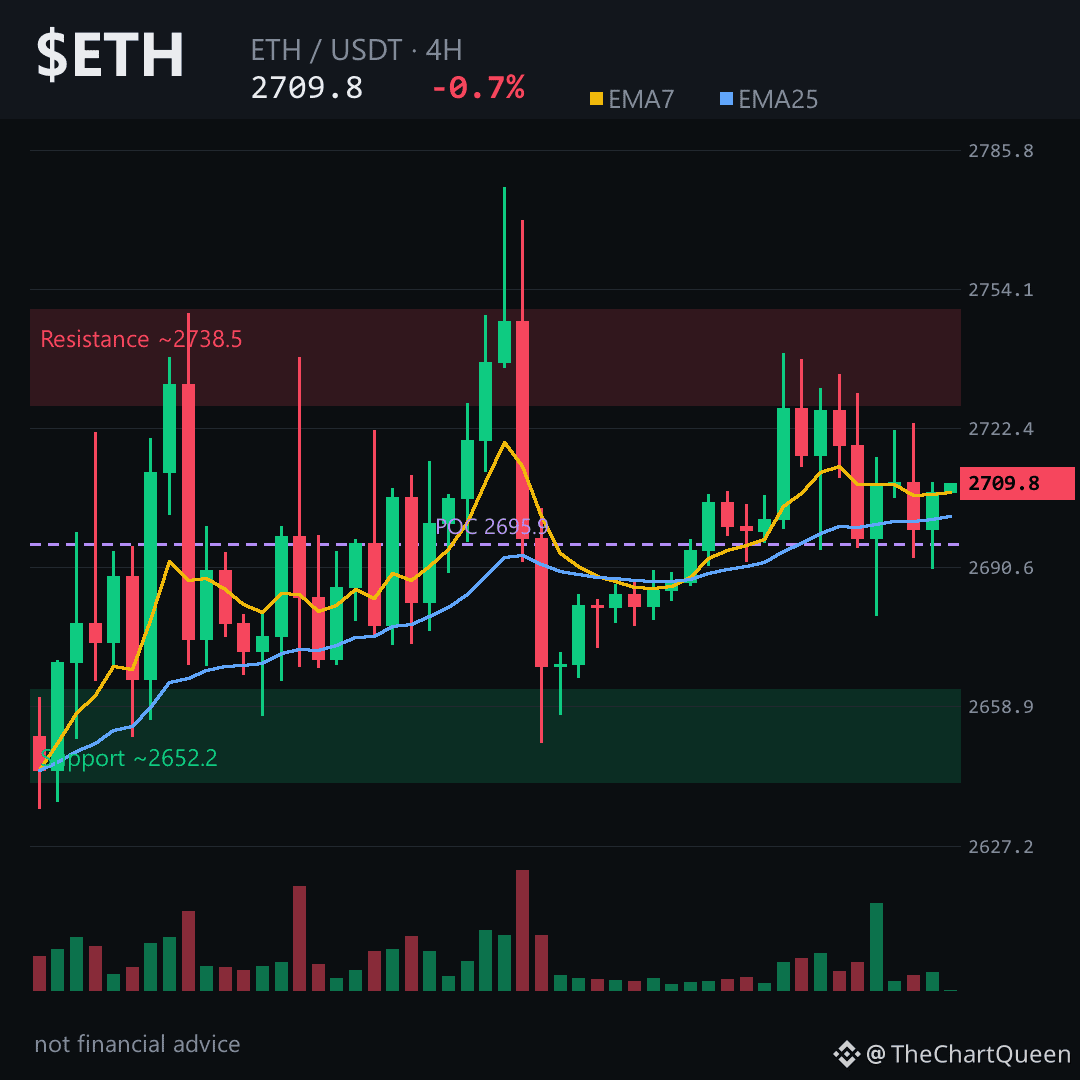
The question every holder is quietly asking right now: is $ETH just coiling, or is this the calm before a real move?
Here's the uncomfortable truth: the 4H chart shows price pinned between two short-term averages — the faster one (EMA7) and the slower one (EMA25) — separated by only a few dollars. That kind of squeeze often resolves with a sharp push, not a gentle drift. And right now, the slight upward tilt of both averages suggests the easier path may be higher.
But there’s a hidden tension worth noting. Funding is negative — meaning shorts are paying longs to stay in their positions. That’s unusual when price is holding near local highs. Open interest also looks thin. Translation: the move may come from spot buyers stepping in, not leveraged traders chasing. That tends to be healthier and slower, but also less explosive.
The level that matters most on the 4H picture is the ~2700 area. As long as $ETH holds above that zone — think of it as the market’s current “fair value” shelf — the path toward the ~2790 area stays open. Lose the ~2650 area on a 4H close, however, and the short-term bull case is simply wrong.
My read: the structure leans bullish, but it’s a patient, low-leverage kind of bullish. The real risk is chop, not a crash.
Where’s the one level you’re watching on $ETH right now? 👇
#ETH #Ethereum #Crypto #BinanceSquare
Follow for the next read on this chart.
⚠️ Not financial advice. DYOR.
The question every holder is quietly asking right now: is $ETH just coiling, or is this the calm before a real move?
Here's the uncomfortable truth: the 4H chart shows price pinned between two short-term averages — the faster one (EMA7) and the slower one (EMA25) — separated by only a few dollars. That kind of squeeze often resolves with a sharp push, not a gentle drift. And right now, the slight upward tilt of both averages suggests the easier path may be higher.
But there’s a hidden tension worth noting. Funding is negative — meaning shorts are paying longs to stay in their positions. That’s unusual when price is holding near local highs. Open interest also looks thin. Translation: the move may come from spot buyers stepping in, not leveraged traders chasing. That tends to be healthier and slower, but also less explosive.
The level that matters most on the 4H picture is the ~2700 area. As long as $ETH holds above that zone — think of it as the market’s current “fair value” shelf — the path toward the ~2790 area stays open. Lose the ~2650 area on a 4H close, however, and the short-term bull case is simply wrong.
My read: the structure leans bullish, but it’s a patient, low-leverage kind of bullish. The real risk is chop, not a crash.
Where’s the one level you’re watching on $ETH right now? 👇
#ETH #Ethereum #Crypto #BinanceSquare
Follow for the next read on this chart.
⚠️ Not financial advice. DYOR.
Here's the uncomfortable truth: the 4H chart shows price pinned between two short-term averages — the faster one (EMA7) and the slower one (EMA25) — separated by only a few dollars. That kind of squeeze often resolves with a sharp push, not a gentle drift. And right now, the slight upward tilt of both averages suggests the easier path may be higher.
But there’s a hidden tension worth noting. Funding is negative — meaning shorts are paying longs to stay in their positions. That’s unusual when price is holding near local highs. Open interest also looks thin. Translation: the move may come from spot buyers stepping in, not leveraged traders chasing. That tends to be healthier and slower, but also less explosive.
The level that matters most on the 4H picture is the ~2700 area. As long as $ETH holds above that zone — think of it as the market’s current “fair value” shelf — the path toward the ~2790 area stays open. Lose the ~2650 area on a 4H close, however, and the short-term bull case is simply wrong.
My read: the structure leans bullish, but it’s a patient, low-leverage kind of bullish. The real risk is chop, not a crash.
Where’s the one level you’re watching on $ETH right now? 👇
#ETH #Ethereum #Crypto #BinanceSquare
Follow for the next read on this chart.
⚠️ Not financial advice. DYOR.
1
1
63
Übersetzung ansehen
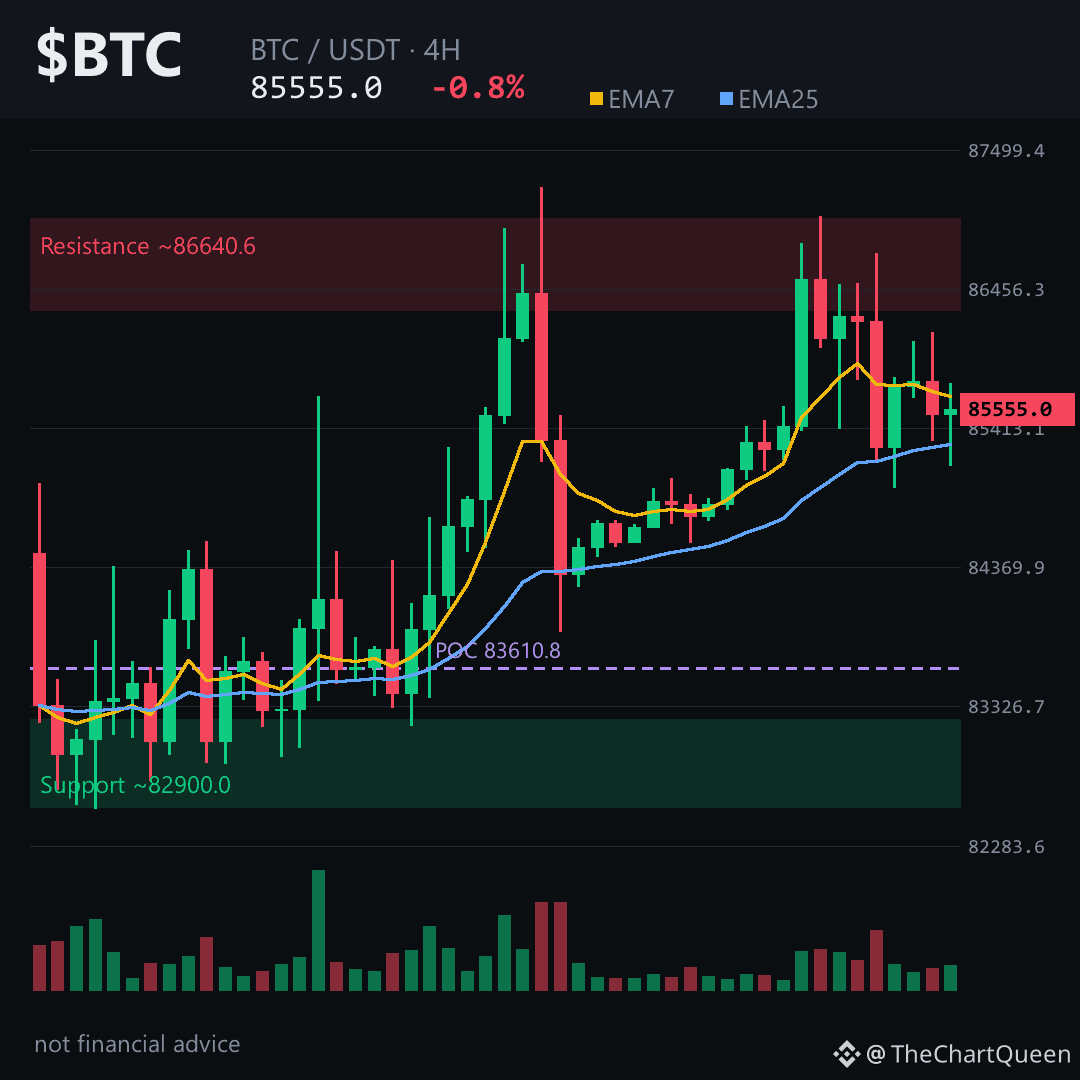
Everyone’s convinced $BTC is coiling for a breakout. Flip it: the chart says it’s building a floor one brick at a time — and the real story is the gap sitting just below price.
Funding is barely negative — shorts pay a tiny fee while most lean long. Open interest is quiet: no leverage powder keg. 4H candles show higher lows defended around 85K, with a bullish gap unfilled between roughly 84.9K and 85.0K. That zone is the magnet.
The level that matters: $BTC holding 85K keeps 4H structure intact. The read leans bullish while price stays above invalidation near 83.8K — lose that on a 4H close and the thesis breaks. If momentum resumes, the objective sits around 88.0K, where the last impulse stalled. Tap $BTC to pull up the chart and see how clean that gap aligns with the 4H pivot.
My read: the 4H trend is rotating from sideways into accumulation — the risk isn’t a sudden crash, it’s getting chopped out before the expansion. The gap below is either support or a trap, and the 85K floor keeps absorbing every dip.
Follow me for the follow-up when the 85K floor either holds or folds — this is the level that decides the next leg.
Which zone are you watching more closely — the unfilled gap near 84.9K or the 88K ceiling on BTC? 👇
⚠️ Not financial advice. DYOR.
#BTC #Bitcoin #Crypto #BinanceSquare
Everyone’s convinced $BTC is coiling for a breakout. Flip it: the chart says it’s building a floor one brick at a time — and the real story is the gap sitting just below price.
Funding is barely negative — shorts pay a tiny fee while most lean long. Open interest is quiet: no leverage powder keg. 4H candles show higher lows defended around 85K, with a bullish gap unfilled between roughly 84.9K and 85.0K. That zone is the magnet.
The level that matters: $BTC holding 85K keeps 4H structure intact. The read leans bullish while price stays above invalidation near 83.8K — lose that on a 4H close and the thesis breaks. If momentum resumes, the objective sits around 88.0K, where the last impulse stalled. Tap $BTC to pull up the chart and see how clean that gap aligns with the 4H pivot.
My read: the 4H trend is rotating from sideways into accumulation — the risk isn’t a sudden crash, it’s getting chopped out before the expansion. The gap below is either support or a trap, and the 85K floor keeps absorbing every dip.
Follow me for the follow-up when the 85K floor either holds or folds — this is the level that decides the next leg.
Which zone are you watching more closely — the unfilled gap near 84.9K or the 88K ceiling on BTC? 👇
⚠️ Not financial advice. DYOR.
#BTC #Bitcoin #Crypto #BinanceSquare
Funding is barely negative — shorts pay a tiny fee while most lean long. Open interest is quiet: no leverage powder keg. 4H candles show higher lows defended around 85K, with a bullish gap unfilled between roughly 84.9K and 85.0K. That zone is the magnet.
The level that matters: $BTC holding 85K keeps 4H structure intact. The read leans bullish while price stays above invalidation near 83.8K — lose that on a 4H close and the thesis breaks. If momentum resumes, the objective sits around 88.0K, where the last impulse stalled. Tap $BTC to pull up the chart and see how clean that gap aligns with the 4H pivot.
My read: the 4H trend is rotating from sideways into accumulation — the risk isn’t a sudden crash, it’s getting chopped out before the expansion. The gap below is either support or a trap, and the 85K floor keeps absorbing every dip.
Follow me for the follow-up when the 85K floor either holds or folds — this is the level that decides the next leg.
Which zone are you watching more closely — the unfilled gap near 84.9K or the 88K ceiling on BTC? 👇
⚠️ Not financial advice. DYOR.
#BTC #Bitcoin #Crypto #BinanceSquare
88
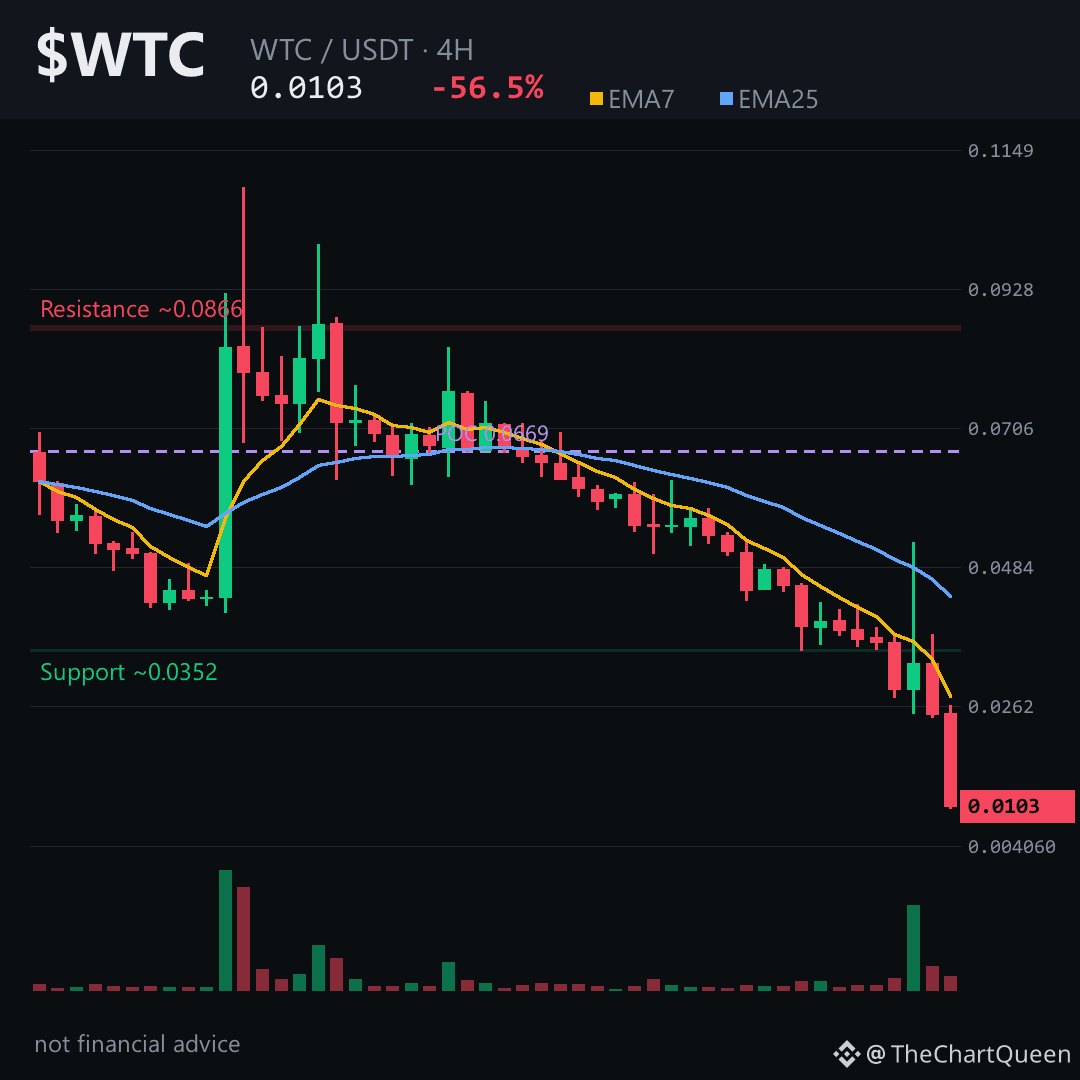
-56.54%.
Das ist kein Rücksetzer. Das ist ein struktureller Bruch.
$WTC hat gerade den niedrigsten 4-Stunden-Schlusskurs aller Zeiten verzeichnet — der Kurs liegt unter jedem historischen Anker. Im Tageschart ist darüber eine noch nicht geschlossene bearishe Kurslücke bei etwa 0.054–0.058 zu sehen. Das ist kein Widerstand. Das ist eine Obergrenze.
Der RSI im 4-Stunden-Chart verharrt nahe 20. Überverkauft bedeutet nicht, dass eine Erholung bevorsteht — es bedeutet, dass der Trend weiterhin den Ton angibt. Die EMA7 liegt bei fast der Hälfte der EMA25. Der Kurs schafft es nicht einmal, den kurzfristigen Durchschnitt zu berühren. Das ist anhaltende Distribution, kein Ausverkauf.
Das entscheidende Niveau im 4-Stunden-Chart liegt bei etwa 0.0108. Solange $WTC darunter bleibt, deutet der Weg auf 0.0094 — ein Niveau, das nie eine Unterstützung war, sondern nur die nächste Leere. Ein 4-Stunden-Schlusskurs zurück über 0.0108 würde die Einschätzung ändern. Bis dahin fällt der Chart weiter durch den luftleeren Raum.
Meine Einschätzung: Erholungsversuche fallen immer schwächer aus und werden schneller verkauft. Das ist keine Bodenbildung — der Markt sucht noch immer danach, wo der tatsächliche Wert liegt. Tippe auf $WTC, um den Chart aufzurufen und die 4-Stunden-Struktur selbst zu prüfen.
Folge mir — wenn dieser Boden endlich hält, zeige ich dir, wo das nächste echte Niveau liegt.
Welches eine Niveau beobachtest du bei WTC gerade? 👇
⚠️ Keine Finanzberatung. DYOR.
#WTC #Crypto #BinanceSquare #Altcoins
-56.54%.
Das ist kein Rücksetzer. Das ist ein struktureller Bruch.
$WTC hat gerade den niedrigsten 4-Stunden-Schlusskurs aller Zeiten verzeichnet — der Kurs liegt unter jedem historischen Anker. Im Tageschart ist darüber eine noch nicht geschlossene bearishe Kurslücke bei etwa 0.054–0.058 zu sehen. Das ist kein Widerstand. Das ist eine Obergrenze.
Der RSI im 4-Stunden-Chart verharrt nahe 20. Überverkauft bedeutet nicht, dass eine Erholung bevorsteht — es bedeutet, dass der Trend weiterhin den Ton angibt. Die EMA7 liegt bei fast der Hälfte der EMA25. Der Kurs schafft es nicht einmal, den kurzfristigen Durchschnitt zu berühren. Das ist anhaltende Distribution, kein Ausverkauf.
Das entscheidende Niveau im 4-Stunden-Chart liegt bei etwa 0.0108. Solange $WTC darunter bleibt, deutet der Weg auf 0.0094 — ein Niveau, das nie eine Unterstützung war, sondern nur die nächste Leere. Ein 4-Stunden-Schlusskurs zurück über 0.0108 würde die Einschätzung ändern. Bis dahin fällt der Chart weiter durch den luftleeren Raum.
Meine Einschätzung: Erholungsversuche fallen immer schwächer aus und werden schneller verkauft. Das ist keine Bodenbildung — der Markt sucht noch immer danach, wo der tatsächliche Wert liegt. Tippe auf $WTC, um den Chart aufzurufen und die 4-Stunden-Struktur selbst zu prüfen.
Folge mir — wenn dieser Boden endlich hält, zeige ich dir, wo das nächste echte Niveau liegt.
Welches eine Niveau beobachtest du bei WTC gerade? 👇
⚠️ Keine Finanzberatung. DYOR.
#WTC #Crypto #BinanceSquare #Altcoins
Das ist kein Rücksetzer. Das ist ein struktureller Bruch.
$WTC hat gerade den niedrigsten 4-Stunden-Schlusskurs aller Zeiten verzeichnet — der Kurs liegt unter jedem historischen Anker. Im Tageschart ist darüber eine noch nicht geschlossene bearishe Kurslücke bei etwa 0.054–0.058 zu sehen. Das ist kein Widerstand. Das ist eine Obergrenze.
Der RSI im 4-Stunden-Chart verharrt nahe 20. Überverkauft bedeutet nicht, dass eine Erholung bevorsteht — es bedeutet, dass der Trend weiterhin den Ton angibt. Die EMA7 liegt bei fast der Hälfte der EMA25. Der Kurs schafft es nicht einmal, den kurzfristigen Durchschnitt zu berühren. Das ist anhaltende Distribution, kein Ausverkauf.
Das entscheidende Niveau im 4-Stunden-Chart liegt bei etwa 0.0108. Solange $WTC darunter bleibt, deutet der Weg auf 0.0094 — ein Niveau, das nie eine Unterstützung war, sondern nur die nächste Leere. Ein 4-Stunden-Schlusskurs zurück über 0.0108 würde die Einschätzung ändern. Bis dahin fällt der Chart weiter durch den luftleeren Raum.
Meine Einschätzung: Erholungsversuche fallen immer schwächer aus und werden schneller verkauft. Das ist keine Bodenbildung — der Markt sucht noch immer danach, wo der tatsächliche Wert liegt. Tippe auf $WTC, um den Chart aufzurufen und die 4-Stunden-Struktur selbst zu prüfen.
Folge mir — wenn dieser Boden endlich hält, zeige ich dir, wo das nächste echte Niveau liegt.
Welches eine Niveau beobachtest du bei WTC gerade? 👇
⚠️ Keine Finanzberatung. DYOR.
#WTC #Crypto #BinanceSquare #Altcoins
3
Was wie ein Rabatt aussieht, entpuppt sich meist als fallendes Messer – warum ist PYR also an einem einzigen Tag um 57 % gefallen?
Hier die Einschätzung, ganz einfach und klar.
Der 4-Stunden-Chart von $PYR: Kaum Momentum. Der RSI liegt tief im einstelligen Bereich – ein Zeichen für extremen Verkaufsdruck. Eine solche Erschöpfung führt jedoch meist nur zu einer Pause und nicht zu einer echten Trendwende. Der Trendfilter zeigt weiterhin deutlich nach unten.
Das einzige entscheidende Zeitfenster liegt derzeit bei der noch offenen Kurslücke zwischen etwa 0,044 und 0,048. Solange dieser Bereich nicht zurückerobert wird, dürfte jeder Anstieg auf Verkaufsinteresse stoßen.
Der aktuelle Bereich um 0,021 ist der Dreh- und Angelpunkt. Können die Käufer diese Zone nicht halten, liegt das nächste natürliche Ziel im Bereich der Tiefs bei 0,019. Die Einschätzung ändert sich nur, wenn $PYR wieder über den Bereich von 0,022 steigt und sich dort hält – andernfalls zeigt der Weg des geringsten Widerstands weiter nach unten.
Meine Einschätzung: Die Struktur ist gebrochen, ein Boden ist aber noch nicht erreicht. Das eigentliche Risiko besteht darin, einem Anstieg hinterherzulaufen, der keine bestätigte Unterstützung hat.
Ich teile ein Update, falls sich in dieser Zone eine echte Nachfrage aufbaut – folge mir, um auf dem Laufenden zu bleiben.
Auf welches Niveau bei $PYR achtest du am genauesten? 👇
⚠️ Keine Finanzberatung. Recherchiere selbst (DYOR).
#PYR #VulcanForged #Crypto #BinanceSquare
Was wie ein Rabatt aussieht, entpuppt sich meist als fallendes Messer – warum ist PYR also an einem einzigen Tag um 57 % gefallen?
Hier die Einschätzung, ganz einfach und klar.
Der 4-Stunden-Chart von $PYR: Kaum Momentum. Der RSI liegt tief im einstelligen Bereich – ein Zeichen für extremen Verkaufsdruck. Eine solche Erschöpfung führt jedoch meist nur zu einer Pause und nicht zu einer echten Trendwende. Der Trendfilter zeigt weiterhin deutlich nach unten.
Das einzige entscheidende Zeitfenster liegt derzeit bei der noch offenen Kurslücke zwischen etwa 0,044 und 0,048. Solange dieser Bereich nicht zurückerobert wird, dürfte jeder Anstieg auf Verkaufsinteresse stoßen.
Der aktuelle Bereich um 0,021 ist der Dreh- und Angelpunkt. Können die Käufer diese Zone nicht halten, liegt das nächste natürliche Ziel im Bereich der Tiefs bei 0,019. Die Einschätzung ändert sich nur, wenn $PYR wieder über den Bereich von 0,022 steigt und sich dort hält – andernfalls zeigt der Weg des geringsten Widerstands weiter nach unten.
Meine Einschätzung: Die Struktur ist gebrochen, ein Boden ist aber noch nicht erreicht. Das eigentliche Risiko besteht darin, einem Anstieg hinterherzulaufen, der keine bestätigte Unterstützung hat.
Ich teile ein Update, falls sich in dieser Zone eine echte Nachfrage aufbaut – folge mir, um auf dem Laufenden zu bleiben.
Auf welches Niveau bei $PYR achtest du am genauesten? 👇
⚠️ Keine Finanzberatung. Recherchiere selbst (DYOR).
#PYR #VulcanForged #Crypto #BinanceSquare
Hier die Einschätzung, ganz einfach und klar.
Der 4-Stunden-Chart von $PYR: Kaum Momentum. Der RSI liegt tief im einstelligen Bereich – ein Zeichen für extremen Verkaufsdruck. Eine solche Erschöpfung führt jedoch meist nur zu einer Pause und nicht zu einer echten Trendwende. Der Trendfilter zeigt weiterhin deutlich nach unten.
Das einzige entscheidende Zeitfenster liegt derzeit bei der noch offenen Kurslücke zwischen etwa 0,044 und 0,048. Solange dieser Bereich nicht zurückerobert wird, dürfte jeder Anstieg auf Verkaufsinteresse stoßen.
Der aktuelle Bereich um 0,021 ist der Dreh- und Angelpunkt. Können die Käufer diese Zone nicht halten, liegt das nächste natürliche Ziel im Bereich der Tiefs bei 0,019. Die Einschätzung ändert sich nur, wenn $PYR wieder über den Bereich von 0,022 steigt und sich dort hält – andernfalls zeigt der Weg des geringsten Widerstands weiter nach unten.
Meine Einschätzung: Die Struktur ist gebrochen, ein Boden ist aber noch nicht erreicht. Das eigentliche Risiko besteht darin, einem Anstieg hinterherzulaufen, der keine bestätigte Unterstützung hat.
Ich teile ein Update, falls sich in dieser Zone eine echte Nachfrage aufbaut – folge mir, um auf dem Laufenden zu bleiben.
Auf welches Niveau bei $PYR achtest du am genauesten? 👇
⚠️ Keine Finanzberatung. Recherchiere selbst (DYOR).
#PYR #VulcanForged #Crypto #BinanceSquare
3
Jeder sieht eine Kerze mit -63 % und denkt, der Boden sei erreicht.
Dreh es um: Die letzten beiden Kerzen verzeichneten -49 % und -50 % — das ist keine Kapitulation, sondern ein fallendes Messer, das immer schneller wird.
Der 4-Stunden-Chart von $VIB zeigt einen senkrechten Absturz. Nur zwei von zwölf Kerzen sind grün. Der RSI liegt tief bei etwa 28. Das Momentum ist nicht schwach — es ist gebrochen.
Zwischen ungefähr 0.0102 und 0.0089 gibt es eine ungefüllte bearishe Kurslücke. Der Kurs ist regelrecht hindurchgesackt und hat nicht zurückgeblickt. Solche Lücken wirken oft wie ein Magnet, sobald eine Erholung einsetzt — aber gerade versucht sich nicht einmal eine Erholung.
Entscheidend ist dieses Niveau: Wenn $VIB den Bereich um 0.00235 bei einem 4-Stunden-Schlusskurs nicht zurückerobern kann, bleibt der Weg des geringsten Widerstands in Richtung der Zone um 0.00204 gerichtet. Wird diese Unterstützung durchbrochen, gibt es bis zum Bereich um 0.0018 — dem 24-Stunden-Tief — kaum noch strukturellen Halt. Tippe auf $VIB, um den Chart aufzurufen und zu sehen, wie sauber dieser Einbruch ist.
Meine Einschätzung: Das ist kein Rücksetzer zum Kaufen. Es ist ein Liquiditätsvakuum — geringes Volumen, kein offenes Futures-Interesse und ein Chart, der auf Aufgabe statt auf Umkehr hindeutet.
Wenn sich hier eine Bodenbildung abzeichnet und der Kurs den Bereich über 0.00235 deutlich zurückerobert, werde ich die bearishe Kurslücke als nächsten Magneten neu bewerten. Folge mir für das Update — eine echte Umkehr wird hier nicht unauffällig sein.
Welchem Niveau vertraust du bei VIB derzeit mehr — 0.00235 oder 0.0018? 👇
⚠️ Keine Finanzberatung. DYOR.
#VIB #Crypto #MarketAnalysis #BinanceSquare
Jeder sieht eine Kerze mit -63 % und denkt, der Boden sei erreicht.
Dreh es um: Die letzten beiden Kerzen verzeichneten -49 % und -50 % — das ist keine Kapitulation, sondern ein fallendes Messer, das immer schneller wird.
Der 4-Stunden-Chart von $VIB zeigt einen senkrechten Absturz. Nur zwei von zwölf Kerzen sind grün. Der RSI liegt tief bei etwa 28. Das Momentum ist nicht schwach — es ist gebrochen.
Zwischen ungefähr 0.0102 und 0.0089 gibt es eine ungefüllte bearishe Kurslücke. Der Kurs ist regelrecht hindurchgesackt und hat nicht zurückgeblickt. Solche Lücken wirken oft wie ein Magnet, sobald eine Erholung einsetzt — aber gerade versucht sich nicht einmal eine Erholung.
Entscheidend ist dieses Niveau: Wenn $VIB den Bereich um 0.00235 bei einem 4-Stunden-Schlusskurs nicht zurückerobern kann, bleibt der Weg des geringsten Widerstands in Richtung der Zone um 0.00204 gerichtet. Wird diese Unterstützung durchbrochen, gibt es bis zum Bereich um 0.0018 — dem 24-Stunden-Tief — kaum noch strukturellen Halt. Tippe auf $VIB, um den Chart aufzurufen und zu sehen, wie sauber dieser Einbruch ist.
Meine Einschätzung: Das ist kein Rücksetzer zum Kaufen. Es ist ein Liquiditätsvakuum — geringes Volumen, kein offenes Futures-Interesse und ein Chart, der auf Aufgabe statt auf Umkehr hindeutet.
Wenn sich hier eine Bodenbildung abzeichnet und der Kurs den Bereich über 0.00235 deutlich zurückerobert, werde ich die bearishe Kurslücke als nächsten Magneten neu bewerten. Folge mir für das Update — eine echte Umkehr wird hier nicht unauffällig sein.
Welchem Niveau vertraust du bei VIB derzeit mehr — 0.00235 oder 0.0018? 👇
⚠️ Keine Finanzberatung. DYOR.
#VIB #Crypto #MarketAnalysis #BinanceSquare
Dreh es um: Die letzten beiden Kerzen verzeichneten -49 % und -50 % — das ist keine Kapitulation, sondern ein fallendes Messer, das immer schneller wird.
Der 4-Stunden-Chart von $VIB zeigt einen senkrechten Absturz. Nur zwei von zwölf Kerzen sind grün. Der RSI liegt tief bei etwa 28. Das Momentum ist nicht schwach — es ist gebrochen.
Zwischen ungefähr 0.0102 und 0.0089 gibt es eine ungefüllte bearishe Kurslücke. Der Kurs ist regelrecht hindurchgesackt und hat nicht zurückgeblickt. Solche Lücken wirken oft wie ein Magnet, sobald eine Erholung einsetzt — aber gerade versucht sich nicht einmal eine Erholung.
Entscheidend ist dieses Niveau: Wenn $VIB den Bereich um 0.00235 bei einem 4-Stunden-Schlusskurs nicht zurückerobern kann, bleibt der Weg des geringsten Widerstands in Richtung der Zone um 0.00204 gerichtet. Wird diese Unterstützung durchbrochen, gibt es bis zum Bereich um 0.0018 — dem 24-Stunden-Tief — kaum noch strukturellen Halt. Tippe auf $VIB, um den Chart aufzurufen und zu sehen, wie sauber dieser Einbruch ist.
Meine Einschätzung: Das ist kein Rücksetzer zum Kaufen. Es ist ein Liquiditätsvakuum — geringes Volumen, kein offenes Futures-Interesse und ein Chart, der auf Aufgabe statt auf Umkehr hindeutet.
Wenn sich hier eine Bodenbildung abzeichnet und der Kurs den Bereich über 0.00235 deutlich zurückerobert, werde ich die bearishe Kurslücke als nächsten Magneten neu bewerten. Folge mir für das Update — eine echte Umkehr wird hier nicht unauffällig sein.
Welchem Niveau vertraust du bei VIB derzeit mehr — 0.00235 oder 0.0018? 👇
⚠️ Keine Finanzberatung. DYOR.
#VIB #Crypto #MarketAnalysis #BinanceSquare
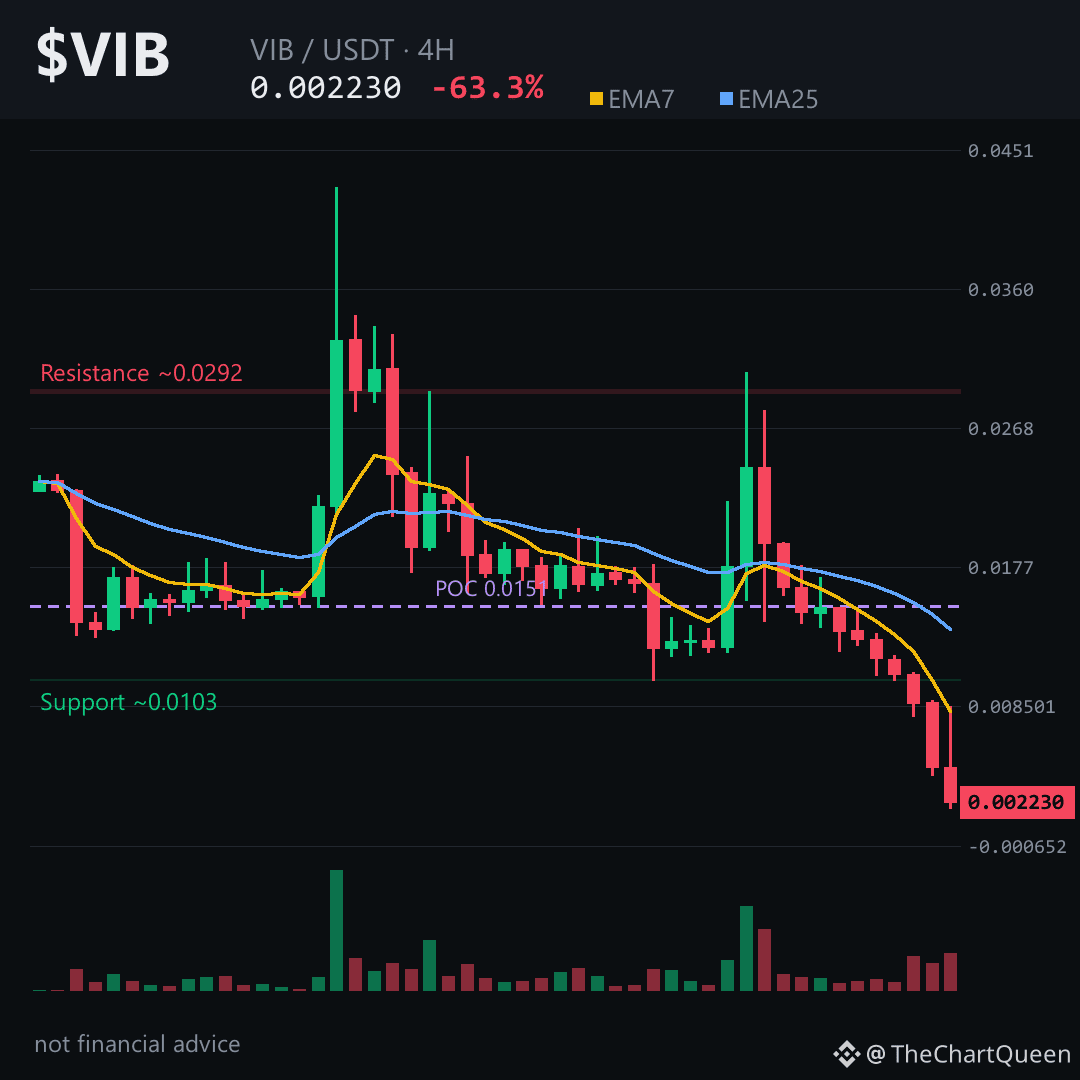
2
Ein Tagesrückgang von 64 %. Die eigentliche Frage ist nicht: „Fällt der Kurs?“ – sondern: „Wie tief fällt ein Coin ohne Futures-Markt eigentlich?“
Keine Funding Rate, kein Open Interest. Keine gehebelten Long-Positionen, die liquidiert werden könnten, kein Treibstoff für einen Short Squeeze. Reiner Spot-Verkaufsdruck – und reine Spot-Abverkäufe ziehen sich oft langsamer, aber länger hin.
4-Stunden-Chart: Der Kurs liegt bei etwa 0,00036, nachdem er jede nahegelegene Unterstützung durchbrochen hat. Der Point of Control des Volumenprofils liegt deutlich höher bei 0,000745. Fast alle, die in den letzten zwei Tagen gekauft haben, sitzen im Minus. Es gibt keinen natürlichen Magneten, der den Kurs wieder nach oben zieht.
Über uns liegt eine bearishe Kurslücke: 0,0023–0,0029. Solange der Kurs diese nicht erneut erreicht, zeigt der Weg des geringsten Widerstands weiter nach unten.
Wenn $BETA bei einem 4-Stunden-Schlusskurs 0,00038 nicht zurückerobern kann, ist das nächste Ziel der Bereich um 0,00033, danach die Zone bei 0,00031 (Tief der letzten 24 Stunden). Wird diese Untergrenze bei hohem Volumen unterschritten, öffnet sich der Weg zu neuen Tiefs.
Meine Einschätzung: ein fallendes Messer ohne Sicherheitsnetz. Hier gibt es kein Kapitulations-Reversal mit langem unteren Docht und anschließendem Short Squeeze. Auf unverfälschten Verkaufsdruck trifft eine dünne Nachfrage – das dreht sich selten ohne eine lange, langweilige Bodenbildungsphase.
Ich beobachte, ob der Kurs bis zum nächsten Tagesschluss über 0,00031 bleibt – das wäre ein erstes Anzeichen für einen Boden, nicht für eine Erholung. Folgt mir, ich gebe ein Update, sobald sich die Marktstruktur ändert. Auf welches Niveau achtet ihr bei $BETA gerade? 👇
⚠️ Keine Finanzberatung. Informiert euch selbst (DYOR).
#BETA #Crypto #BinanceSquare #Altcoins #MarketAnalysis
Ein Tagesrückgang von 64 %. Die eigentliche Frage ist nicht: „Fällt der Kurs?“ – sondern: „Wie tief fällt ein Coin ohne Futures-Markt eigentlich?“
Keine Funding Rate, kein Open Interest. Keine gehebelten Long-Positionen, die liquidiert werden könnten, kein Treibstoff für einen Short Squeeze. Reiner Spot-Verkaufsdruck – und reine Spot-Abverkäufe ziehen sich oft langsamer, aber länger hin.
4-Stunden-Chart: Der Kurs liegt bei etwa 0,00036, nachdem er jede nahegelegene Unterstützung durchbrochen hat. Der Point of Control des Volumenprofils liegt deutlich höher bei 0,000745. Fast alle, die in den letzten zwei Tagen gekauft haben, sitzen im Minus. Es gibt keinen natürlichen Magneten, der den Kurs wieder nach oben zieht.
Über uns liegt eine bearishe Kurslücke: 0,0023–0,0029. Solange der Kurs diese nicht erneut erreicht, zeigt der Weg des geringsten Widerstands weiter nach unten.
Wenn $BETA bei einem 4-Stunden-Schlusskurs 0,00038 nicht zurückerobern kann, ist das nächste Ziel der Bereich um 0,00033, danach die Zone bei 0,00031 (Tief der letzten 24 Stunden). Wird diese Untergrenze bei hohem Volumen unterschritten, öffnet sich der Weg zu neuen Tiefs.
Meine Einschätzung: ein fallendes Messer ohne Sicherheitsnetz. Hier gibt es kein Kapitulations-Reversal mit langem unteren Docht und anschließendem Short Squeeze. Auf unverfälschten Verkaufsdruck trifft eine dünne Nachfrage – das dreht sich selten ohne eine lange, langweilige Bodenbildungsphase.
Ich beobachte, ob der Kurs bis zum nächsten Tagesschluss über 0,00031 bleibt – das wäre ein erstes Anzeichen für einen Boden, nicht für eine Erholung. Folgt mir, ich gebe ein Update, sobald sich die Marktstruktur ändert. Auf welches Niveau achtet ihr bei $BETA gerade? 👇
⚠️ Keine Finanzberatung. Informiert euch selbst (DYOR).
#BETA #Crypto #BinanceSquare #Altcoins #MarketAnalysis
Keine Funding Rate, kein Open Interest. Keine gehebelten Long-Positionen, die liquidiert werden könnten, kein Treibstoff für einen Short Squeeze. Reiner Spot-Verkaufsdruck – und reine Spot-Abverkäufe ziehen sich oft langsamer, aber länger hin.
4-Stunden-Chart: Der Kurs liegt bei etwa 0,00036, nachdem er jede nahegelegene Unterstützung durchbrochen hat. Der Point of Control des Volumenprofils liegt deutlich höher bei 0,000745. Fast alle, die in den letzten zwei Tagen gekauft haben, sitzen im Minus. Es gibt keinen natürlichen Magneten, der den Kurs wieder nach oben zieht.
Über uns liegt eine bearishe Kurslücke: 0,0023–0,0029. Solange der Kurs diese nicht erneut erreicht, zeigt der Weg des geringsten Widerstands weiter nach unten.
Wenn $BETA bei einem 4-Stunden-Schlusskurs 0,00038 nicht zurückerobern kann, ist das nächste Ziel der Bereich um 0,00033, danach die Zone bei 0,00031 (Tief der letzten 24 Stunden). Wird diese Untergrenze bei hohem Volumen unterschritten, öffnet sich der Weg zu neuen Tiefs.
Meine Einschätzung: ein fallendes Messer ohne Sicherheitsnetz. Hier gibt es kein Kapitulations-Reversal mit langem unteren Docht und anschließendem Short Squeeze. Auf unverfälschten Verkaufsdruck trifft eine dünne Nachfrage – das dreht sich selten ohne eine lange, langweilige Bodenbildungsphase.
Ich beobachte, ob der Kurs bis zum nächsten Tagesschluss über 0,00031 bleibt – das wäre ein erstes Anzeichen für einen Boden, nicht für eine Erholung. Folgt mir, ich gebe ein Update, sobald sich die Marktstruktur ändert. Auf welches Niveau achtet ihr bei $BETA gerade? 👇
⚠️ Keine Finanzberatung. Informiert euch selbst (DYOR).
#BETA #Crypto #BinanceSquare #Altcoins #MarketAnalysis
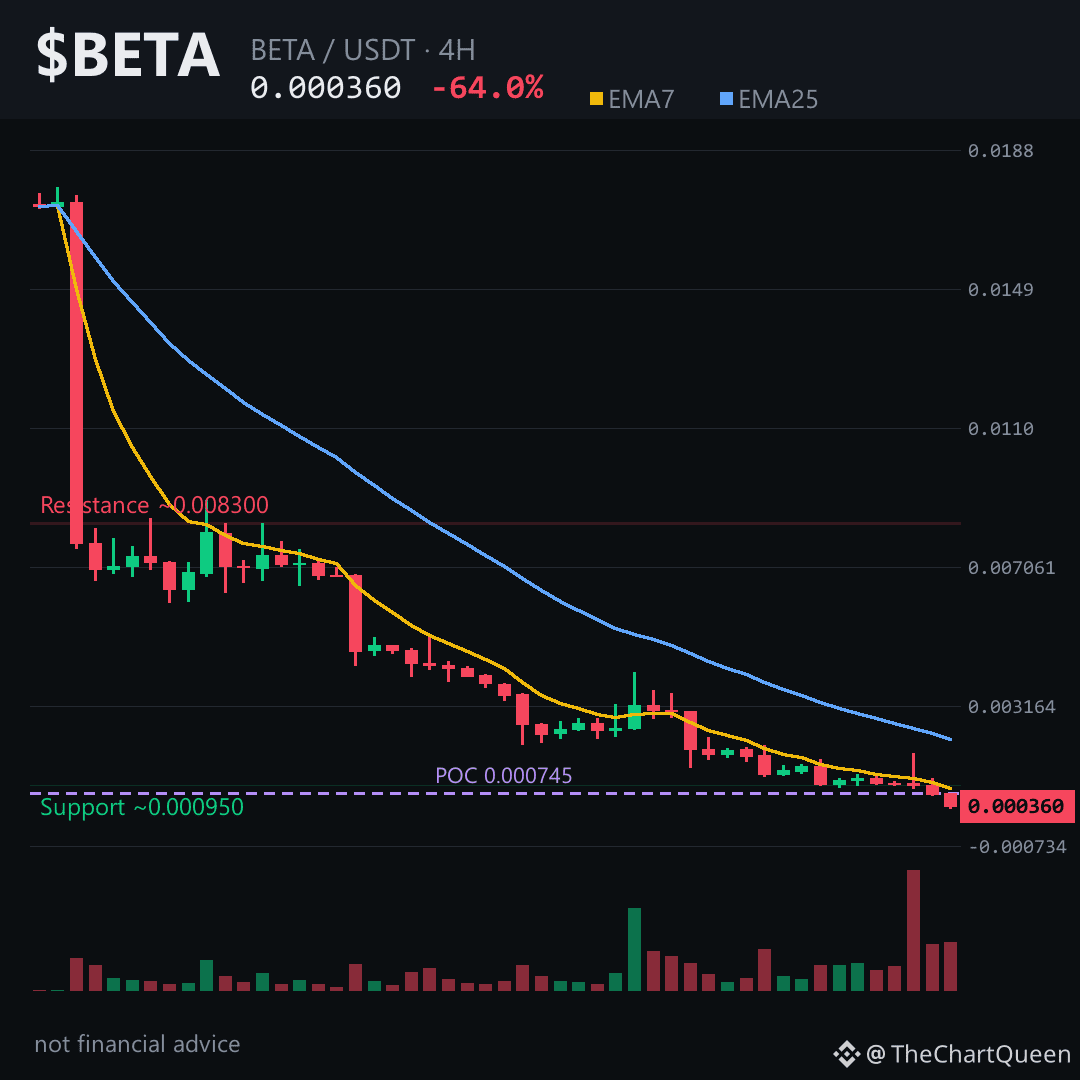
-65.85 % in 24 Stunden ist kein Dip – das ist eine Liquidationskaskade. Und der 4H-Chart zeigt ein derart extremes Signal, dass es fast kaputt aussieht: RSI bei 12.89, während der Kurs jetzt in einer frischen bearishen Kurslücke zwischen 0.00479 und 0.00445 liegt.
$NFP ist nicht einfach abgerutscht – der Kurs ist in zwei 4H-Kerzen eingebrochen, die innerhalb von acht Stunden rund 60 % seines Werts zunichtemachten. EMA7 liegt auf jedem Zeithorizont deutlich unter EMA25. Das Funding ist flach und das Open Interest praktisch nicht vorhanden – niemand ist mehr da, um einen Bounce zu verteidigen. Das ist nicht bullish. Das ist Apathie.
Der Kurs klammert sich knapp über dem Tief bei 0.00168 fest, das beim heftigen nächtlichen Ausverkauf erreicht wurde. Die Marke, die das Szenario ungültig machen würde, liegt bei etwa 0.00191 – gewinnt $NFP diese Zone bei einem 4H-Schlusskurs zurück, kommt der freie Fall zum Stillstand. Bis dahin zeigt der Weg des geringsten Widerstands in Richtung 0.00165, und darunter wird es im Chart sehr ruhig. Tippe auf $NFP, um den Chart aufzurufen und diese Marken selbst abzulesen.
Bounce-Versuche sind hier eine Erleichterung, keine Trendwende. Das eigentliche Risiko besteht darin, ein fallendes Messer auffangen zu wollen, wenn hinter den Kaufgeboten kein Volumen steckt.
Ich werde beobachten, ob die Obergrenze bei 0.00191 getestet oder klar abgewiesen wird – folge mir, wenn du meine Einschätzung dazu mitbekommen möchtest. Auf welche Marke achtest du gerade bei NFP? 👇
⚠️ Keine Finanzberatung. DYOR.
#NFP #Crypto #BinanceSquare
-65.85 % in 24 Stunden ist kein Dip – das ist eine Liquidationskaskade. Und der 4H-Chart zeigt ein derart extremes Signal, dass es fast kaputt aussieht: RSI bei 12.89, während der Kurs jetzt in einer frischen bearishen Kurslücke zwischen 0.00479 und 0.00445 liegt.
$NFP ist nicht einfach abgerutscht – der Kurs ist in zwei 4H-Kerzen eingebrochen, die innerhalb von acht Stunden rund 60 % seines Werts zunichtemachten. EMA7 liegt auf jedem Zeithorizont deutlich unter EMA25. Das Funding ist flach und das Open Interest praktisch nicht vorhanden – niemand ist mehr da, um einen Bounce zu verteidigen. Das ist nicht bullish. Das ist Apathie.
Der Kurs klammert sich knapp über dem Tief bei 0.00168 fest, das beim heftigen nächtlichen Ausverkauf erreicht wurde. Die Marke, die das Szenario ungültig machen würde, liegt bei etwa 0.00191 – gewinnt $NFP diese Zone bei einem 4H-Schlusskurs zurück, kommt der freie Fall zum Stillstand. Bis dahin zeigt der Weg des geringsten Widerstands in Richtung 0.00165, und darunter wird es im Chart sehr ruhig. Tippe auf $NFP, um den Chart aufzurufen und diese Marken selbst abzulesen.
Bounce-Versuche sind hier eine Erleichterung, keine Trendwende. Das eigentliche Risiko besteht darin, ein fallendes Messer auffangen zu wollen, wenn hinter den Kaufgeboten kein Volumen steckt.
Ich werde beobachten, ob die Obergrenze bei 0.00191 getestet oder klar abgewiesen wird – folge mir, wenn du meine Einschätzung dazu mitbekommen möchtest. Auf welche Marke achtest du gerade bei NFP? 👇
⚠️ Keine Finanzberatung. DYOR.
#NFP #Crypto #BinanceSquare
$NFP ist nicht einfach abgerutscht – der Kurs ist in zwei 4H-Kerzen eingebrochen, die innerhalb von acht Stunden rund 60 % seines Werts zunichtemachten. EMA7 liegt auf jedem Zeithorizont deutlich unter EMA25. Das Funding ist flach und das Open Interest praktisch nicht vorhanden – niemand ist mehr da, um einen Bounce zu verteidigen. Das ist nicht bullish. Das ist Apathie.
Der Kurs klammert sich knapp über dem Tief bei 0.00168 fest, das beim heftigen nächtlichen Ausverkauf erreicht wurde. Die Marke, die das Szenario ungültig machen würde, liegt bei etwa 0.00191 – gewinnt $NFP diese Zone bei einem 4H-Schlusskurs zurück, kommt der freie Fall zum Stillstand. Bis dahin zeigt der Weg des geringsten Widerstands in Richtung 0.00165, und darunter wird es im Chart sehr ruhig. Tippe auf $NFP, um den Chart aufzurufen und diese Marken selbst abzulesen.
Bounce-Versuche sind hier eine Erleichterung, keine Trendwende. Das eigentliche Risiko besteht darin, ein fallendes Messer auffangen zu wollen, wenn hinter den Kaufgeboten kein Volumen steckt.
Ich werde beobachten, ob die Obergrenze bei 0.00191 getestet oder klar abgewiesen wird – folge mir, wenn du meine Einschätzung dazu mitbekommen möchtest. Auf welche Marke achtest du gerade bei NFP? 👇
⚠️ Keine Finanzberatung. DYOR.
#NFP #Crypto #BinanceSquare
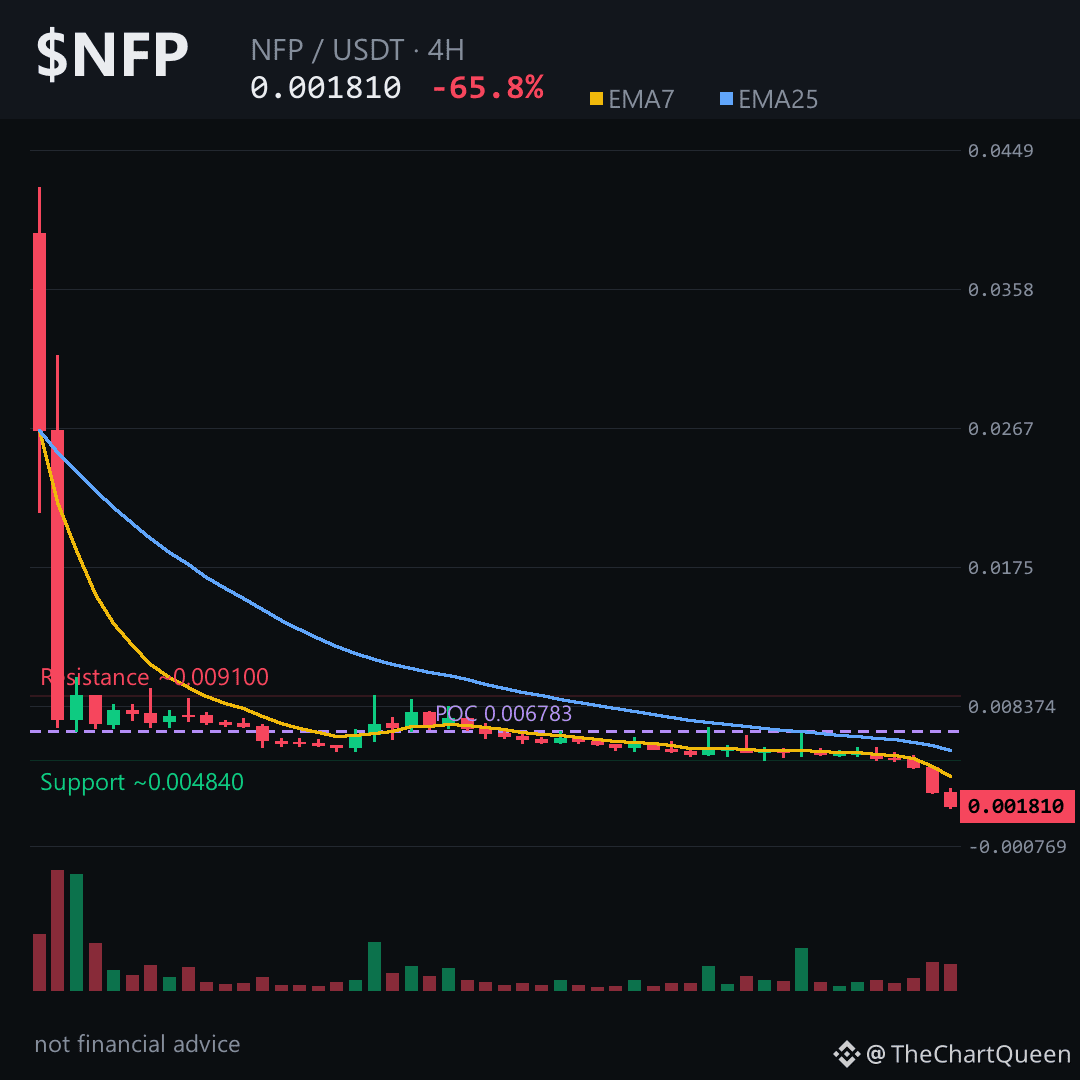
Anmelden und weiter Inhalte entdecken
Krypto-Nutzer weltweit auf Binance Square kennenlernen
⚡️ Bleib in Sachen Krypto stets am Puls.
💬 Die weltgrößte Kryptobörse vertraut darauf.
👍 Erhalte verlässliche Einblicke von verifizierten Creators.
E-Mail-Adresse/Telefonnummer
Trendthemen
BinanceLaunchesBinanceIntelligence
658,588 Aufrufe
4,032 Kommentare
🧠 Traden wie ein erfahrener Investmentfonds? Jetzt übernimmt die KI das kostenlos für dich! 🤖📈
Wilsontrader97
·10 Likes
·11.4k Aufrufe
BTCFallsBelow$84K
12,738 Aufrufe
49 Kommentare
DubaiVARAIssuesReserveAssetAuditCircular
438 Aufrufe
81 Kommentare