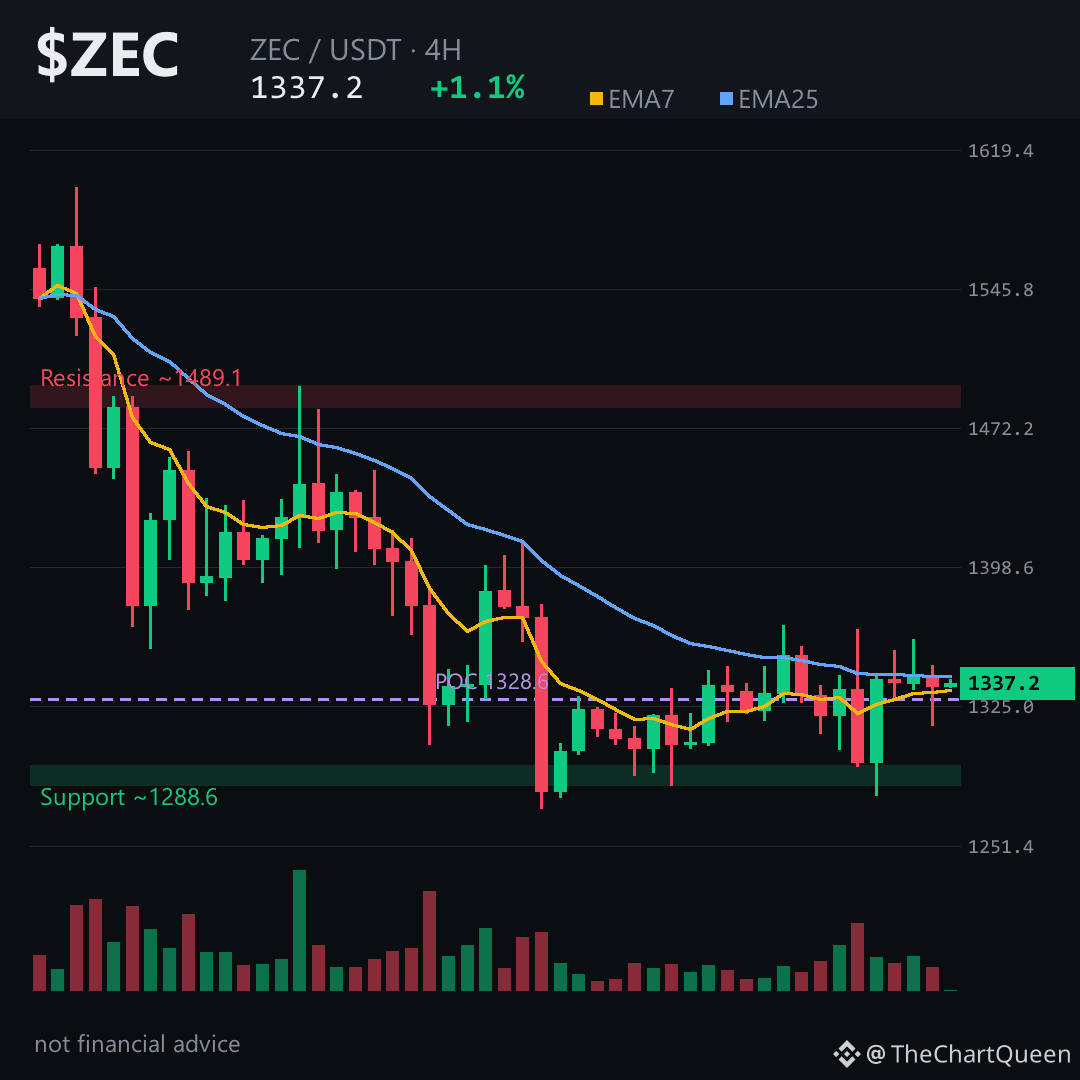
Everyone’s convinced this bounce off $1278 is the bottom.
Flip it.
The 4H chart is stuck under its own 25-period average near $1341 — price keeps kissing it and getting rejected. That’s not strength, that’s a ceiling being tested from below.
Futures paint the trap clearly: the crowd is leaning short, yet funding is positive. Shorts are paying to stay short while price grinds sideways — often the fuel for one more fake push higher before the real drop.
The bigger picture says otherwise: the daily trend is still bullish, with the 7-day average above the 25-day near $1360 vs $1337.
So the fight is real — short-term exhaustion against a medium-term uptrend.
My levels on $ZEC: the 4H read stays bearish unless price reclaims the $1408 area on a close. Below, the path opens toward the $1220 zone — that’s where the daily uptrend gets seriously tested.
Lose $1220 and the macro floor near $1018 becomes the conversation. Reclaim $1408 and this bearish read is simply wrong.
The chart is coiling. Tap $ZEC and watch how price behaves around $1341 — that’s the tell.
My read: the 4H structure favors fade strength into $1341–$1360 until proven otherwise. The real risk is a squeeze through $1408 that flips the whole setup.
Follow me — when $ZEC resolves this range, I’ll break down which side actually won before the move becomes obvious.
What level are you watching more closely — $1341 or $1220? 👇
⚠️ Not financial advice. DYOR.
#ZEC #Zcash #Crypto #BinanceSquare
Flip it.
The 4H chart is stuck under its own 25-period average near $1341 — price keeps kissing it and getting rejected. That’s not strength, that’s a ceiling being tested from below.
Futures paint the trap clearly: the crowd is leaning short, yet funding is positive. Shorts are paying to stay short while price grinds sideways — often the fuel for one more fake push higher before the real drop.
The bigger picture says otherwise: the daily trend is still bullish, with the 7-day average above the 25-day near $1360 vs $1337.
So the fight is real — short-term exhaustion against a medium-term uptrend.
My levels on $ZEC: the 4H read stays bearish unless price reclaims the $1408 area on a close. Below, the path opens toward the $1220 zone — that’s where the daily uptrend gets seriously tested.
Lose $1220 and the macro floor near $1018 becomes the conversation. Reclaim $1408 and this bearish read is simply wrong.
The chart is coiling. Tap $ZEC and watch how price behaves around $1341 — that’s the tell.
My read: the 4H structure favors fade strength into $1341–$1360 until proven otherwise. The real risk is a squeeze through $1408 that flips the whole setup.
Follow me — when $ZEC resolves this range, I’ll break down which side actually won before the move becomes obvious.
What level are you watching more closely — $1341 or $1220? 👇
⚠️ Not financial advice. DYOR.
#ZEC #Zcash #Crypto #BinanceSquare