
GK-ARONNO
14.2k Beiträge

GK-ARONNO
Melden
Nutzer blockieren
👉 Spot Trader 📊 | Guiding Traders to Stay Disciplined, Avoid FOMO & Trade with Confidence | X: @GkAronno ✅
Trade eröffnen

LUNA Halter
Regelmäßiger Trader
4.4 Jahre
5 Following
32.4K+ Follower
98.4K+ Like gegeben
Beiträge
Portfolio
Alle
Zitierungen
Videos
Live
·
--
Artikel
Übersetzung ansehen
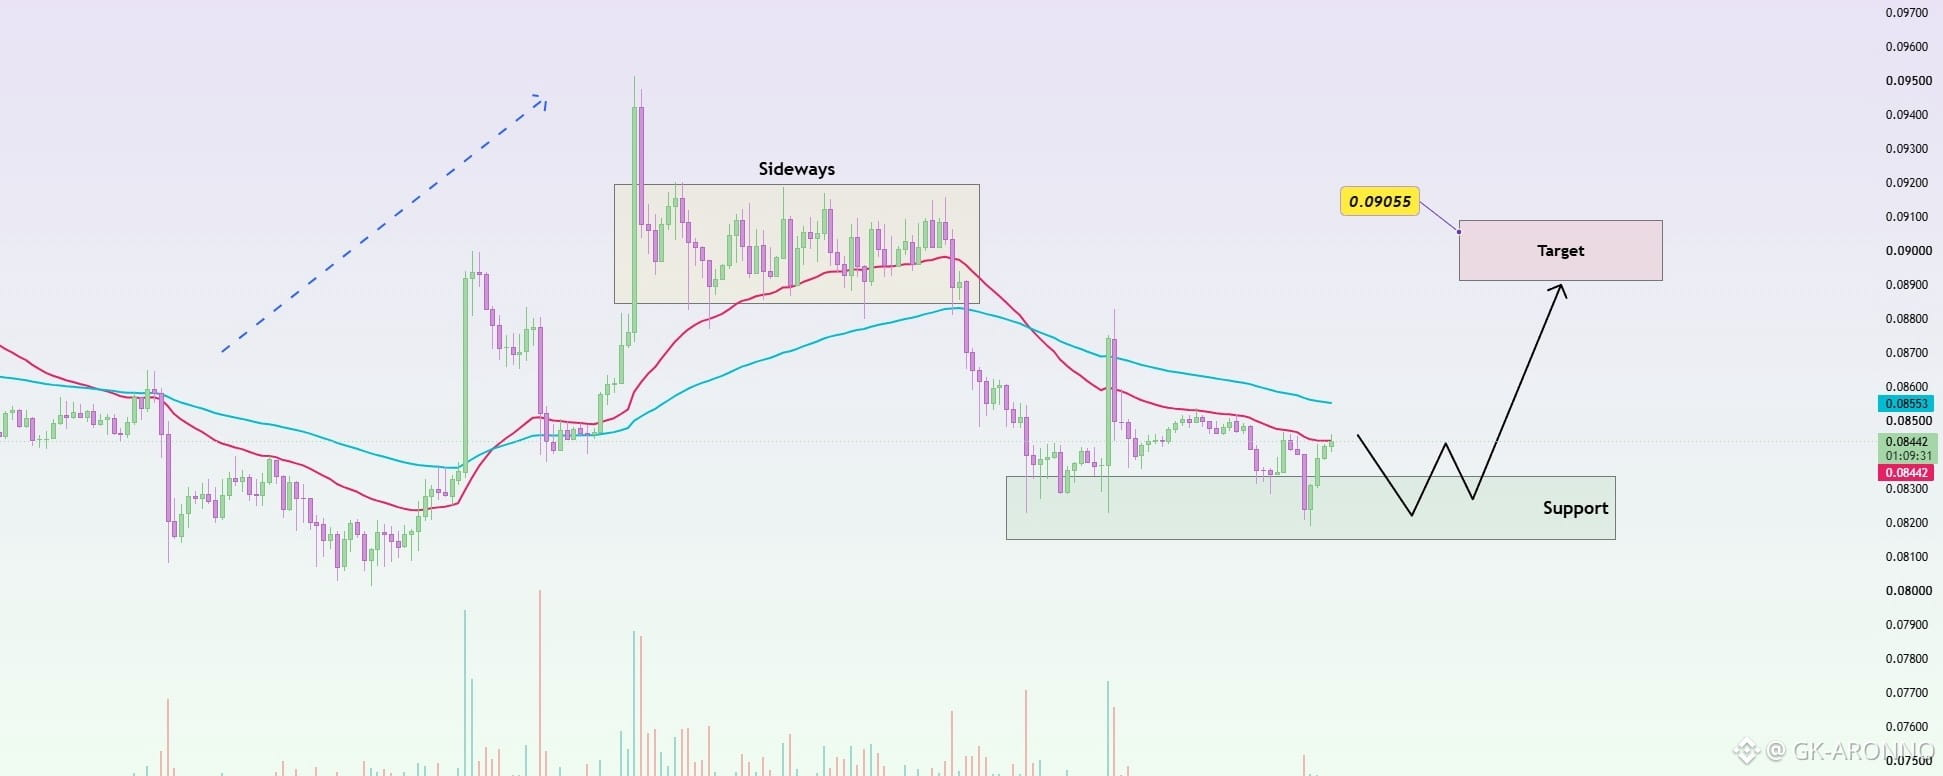
DOGEUSDT: Recovery phase, Bulls in focus🚀🚀🚀🚀DOGEUSDT is trading around 0.0844 USDT following a rebound from the 0.0815–0.0835 support zone. Although the price has not yet fully regained its bullish structure after breaking down from the previous sideways range, buying pressure near the short-term low is becoming quite evident.
The 0.0820–0.0835 zone is currently my primary area of focus. If DOGE holds this level and establishes a "higher low," the likelihood of a recovery to the 0.0860–0.0870 range increases. Reclaiming the EMA89 around 0.0855 could pave the way for a further rise to 0.0890, followed by a main target near 0.0905 USDT.
The bullish scenario would be invalidated if DOGE decisively loses the 0.0815–0.0820 level.
$DOGE
{spot}(DOGEUSDT)
DOGEUSDT: Recovery phase, Bulls in focus🚀🚀🚀🚀
DOGEUSDT is trading around 0.0844 USDT following a rebound from the 0.0815–0.0835 support zone. Although the price has not yet fully regained its bullish structure after breaking down from the previous sideways range, buying pressure near the short-term low is becoming quite evident.
The 0.0820–0.0835 zone is currently my primary area of focus. If DOGE holds this level and establishes a "higher low," the likelihood of a recovery to the 0.0860–0.0870 range increases. Reclaiming the EMA89 around 0.0855 could pave the way for a further rise to 0.0890, followed by a main target near 0.0905 USDT.
The bullish scenario would be invalidated if DOGE decisively loses the 0.0815–0.0820 level.
$DOGE
The 0.0820–0.0835 zone is currently my primary area of focus. If DOGE holds this level and establishes a "higher low," the likelihood of a recovery to the 0.0860–0.0870 range increases. Reclaiming the EMA89 around 0.0855 could pave the way for a further rise to 0.0890, followed by a main target near 0.0905 USDT.
The bullish scenario would be invalidated if DOGE decisively loses the 0.0815–0.0820 level.
$DOGE
98
·
--
Artikel
Übersetzung ansehen
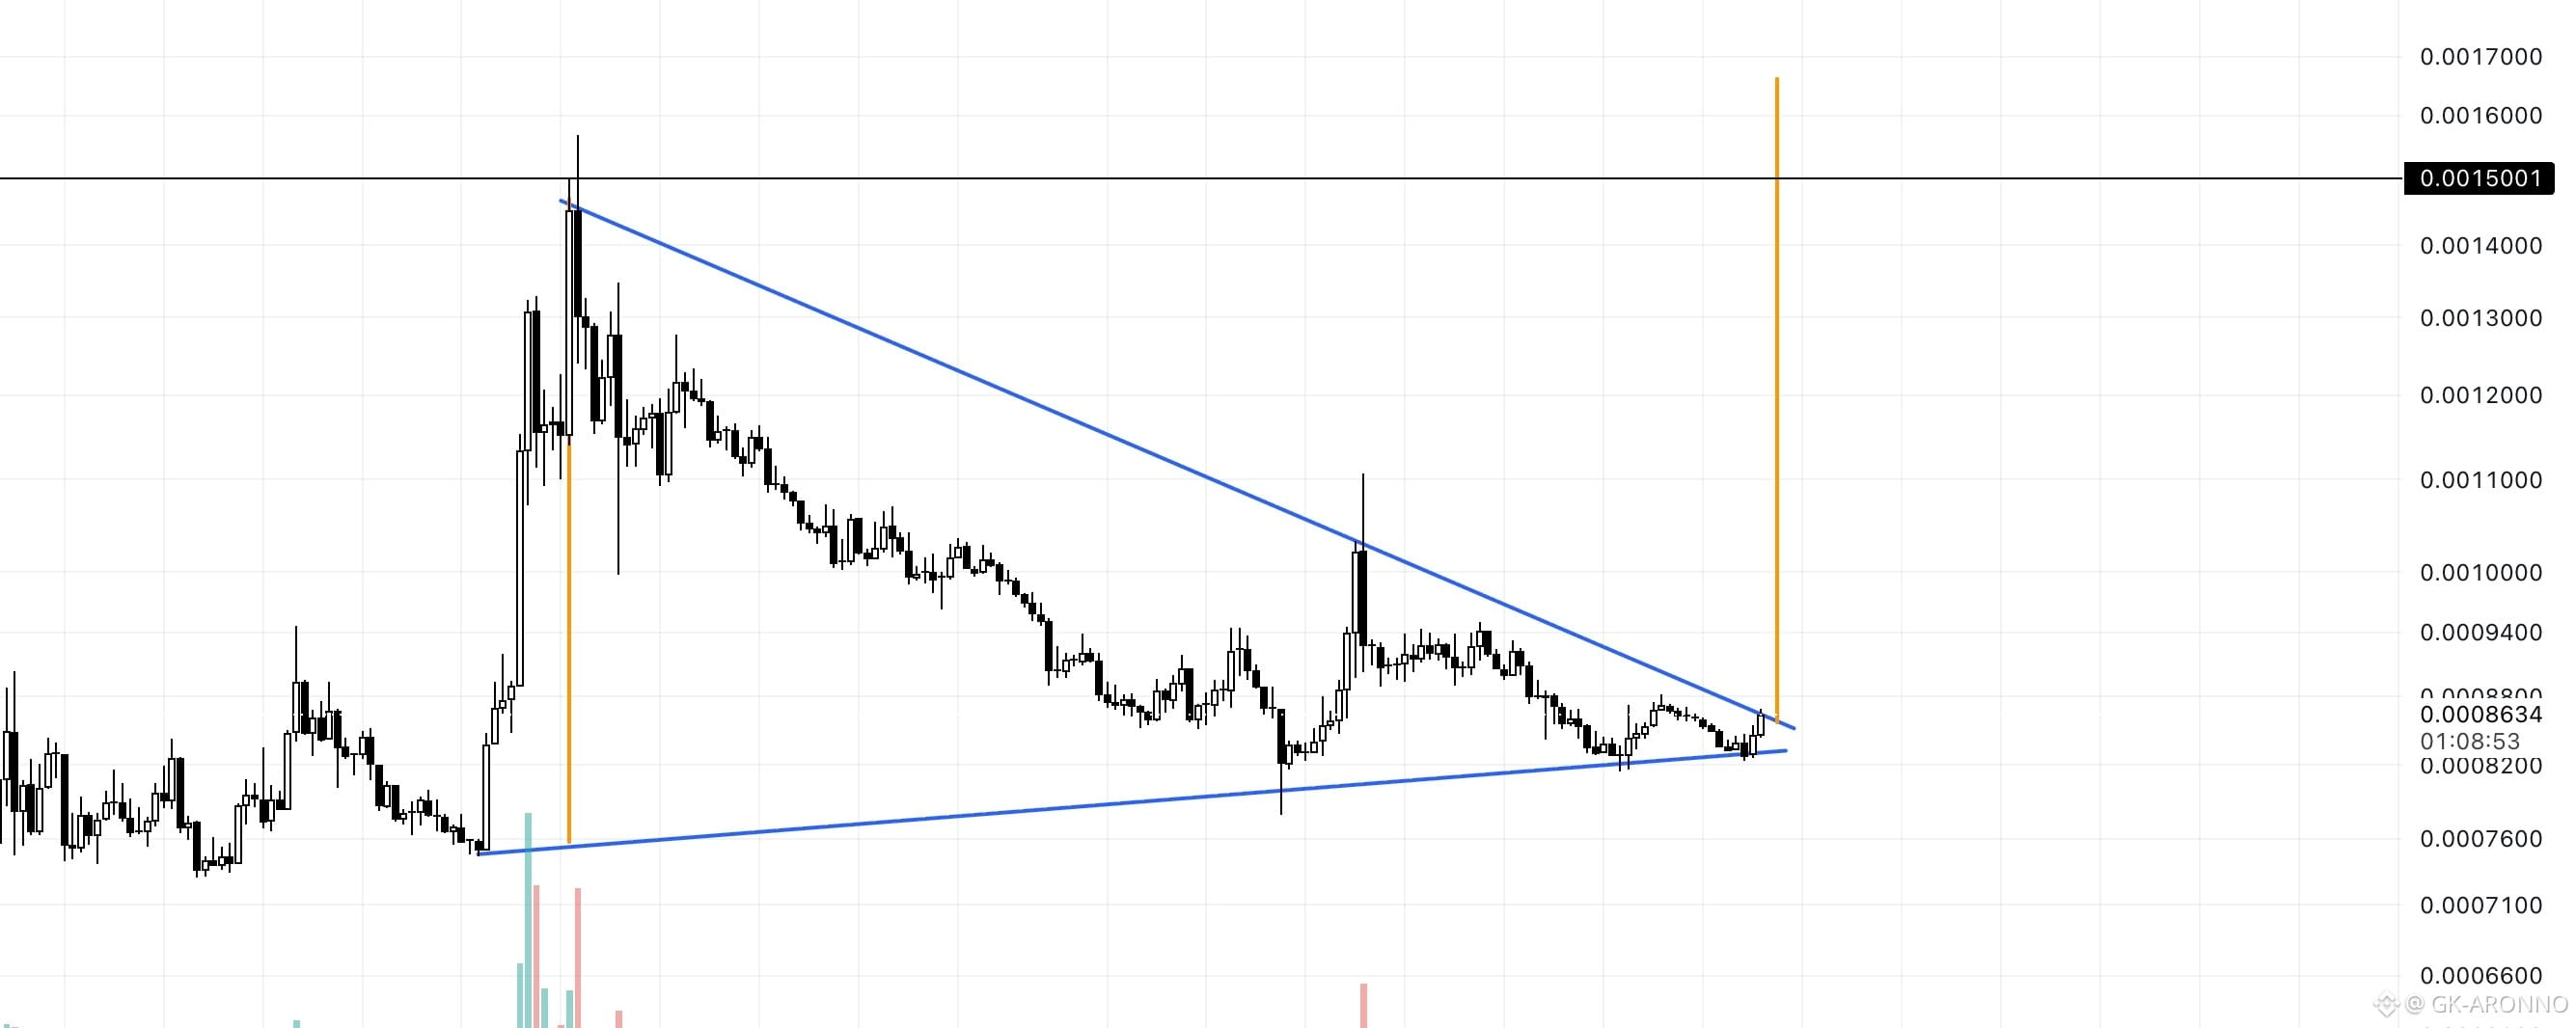
BOME/USDT (4h) Approaching a Breakout From a Symmetrical Triangl✨✨✨✨BOME/USDT has been consolidating inside a large symmetrical triangle on the 4H chart, with price forming lower highs beneath descending resistance while gradually maintaining higher lows along the rising support. The structure has tightened significantly, and price is now trading very close to the apex around $0.00085–$0.00087.
A confirmed breakout and hold above the upper trendline could trigger a strong bullish expansion toward the $0.00150 resistance area, with the full measured move extending toward approximately $0.00160–$0.00165.
A breakdown below the rising support around $0.00081–$0.00082 would invalidate the bullish setup and increase the probability of further downside.
#bome $BOME
{future}(BOMEUSDT)
BOME/USDT (4h) Approaching a Breakout From a Symmetrical Triangl✨✨✨✨
BOME/USDT has been consolidating inside a large symmetrical triangle on the 4H chart, with price forming lower highs beneath descending resistance while gradually maintaining higher lows along the rising support. The structure has tightened significantly, and price is now trading very close to the apex around $0.00085–$0.00087.
A confirmed breakout and hold above the upper trendline could trigger a strong bullish expansion toward the $0.00150 resistance area, with the full measured move extending toward approximately $0.00160–$0.00165.
A breakdown below the rising support around $0.00081–$0.00082 would invalidate the bullish setup and increase the probability of further downside.
#bome $BOME
A confirmed breakout and hold above the upper trendline could trigger a strong bullish expansion toward the $0.00150 resistance area, with the full measured move extending toward approximately $0.00160–$0.00165.
A breakdown below the rising support around $0.00081–$0.00082 would invalidate the bullish setup and increase the probability of further downside.
#bome $BOME
215
·
--
Artikel
Übersetzung ansehen
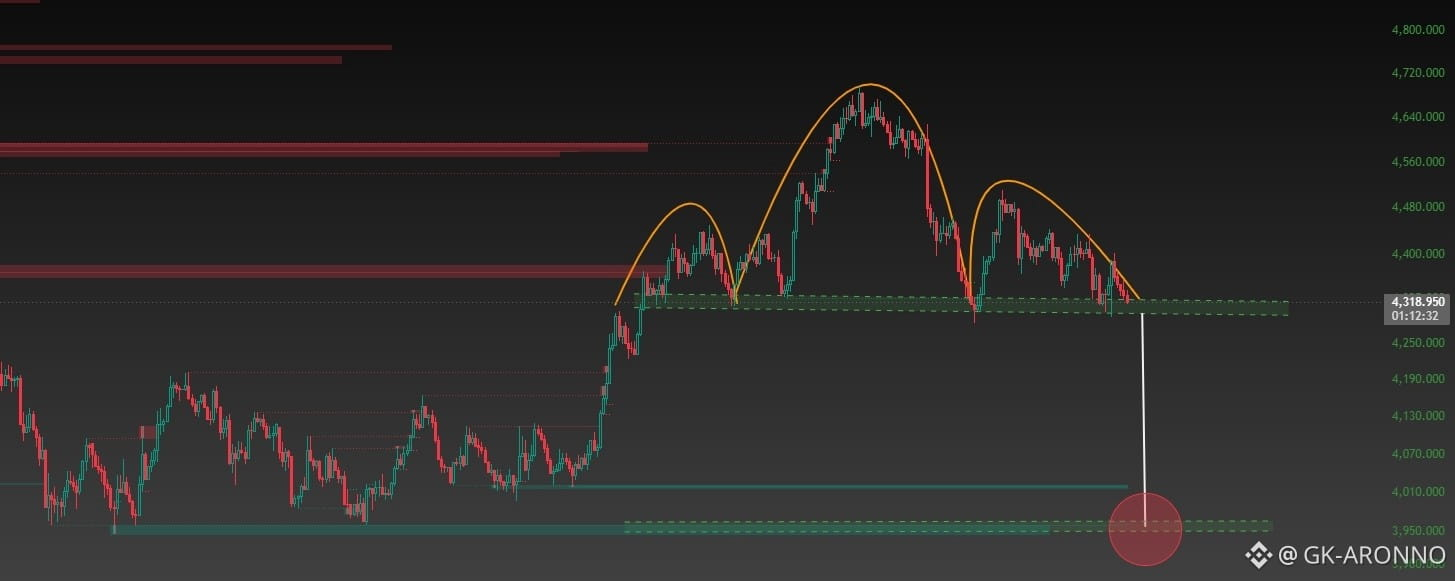
Gold 4H Chart Analysis-Head & Shoulders Setup⚡📈Gold is currently sitting at a very important decision zone around 4,315–4,320. Looking at the structure from left to right, price made a strong impulsive move upward and then formed three successive rounded structures, with the middle formation being the largest. The orange curves highlight what appears to be a developing distribution / topping structure, where each subsequent rally is struggling to sustain higher levels.
The most important feature on the chart is the green support zone around 4,300–4,320. Price has tested this area several times, and the repeated tests are weakening the support. At the moment, Gold is again pressing this zone from above. A decisive 4H breakdown and close below this green support would be the confirmation I would watch for, rather than assuming the breakdown in advance.
If that support fails, the next major downside area marked on the chart is around 3,950, which is also an important previous accumulation/support zone. That would represent a substantial correction from the current level. However, if buyers defend 4,300–4,320 and price reclaims the recent lower highs, the bearish setup would weaken and Gold could attempt another recovery.
Left Shoulder: The first rally peaks around 4,450–4,480, followed by a pullback toward the 4,300–4,320 neckline/support.
Head: The larger central rally reaches approximately 4,650–4,700, clearly higher than the shoulders.
Right Shoulder: The subsequent rally reaches around 4,480–4,520, forming a lower high and completing the right shoulder.
Neckline: The green zone around 4,300–4,320 is the critical neckline.
The important point is that the H&S is not confirmed yet. Price is currently testing the neckline. A decisive 4H candle close below 4,300–4,320 would provide the bearish confirmation. If that happens, the measured-move implication of the H&S points toward the 3,950 area, which coincides with the major support zone you've marked.
Disclaimer: This is technical/chart analysis for educational purposes only, not financial advice. The projected target is a scenario, not a certainty.
$XAU
{future}(XAUUSDT)
Gold 4H Chart Analysis-Head & Shoulders Setup⚡📈
Gold is currently sitting at a very important decision zone around 4,315–4,320. Looking at the structure from left to right, price made a strong impulsive move upward and then formed three successive rounded structures, with the middle formation being the largest. The orange curves highlight what appears to be a developing distribution / topping structure, where each subsequent rally is struggling to sustain higher levels.
The most important feature on the chart is the green support zone around 4,300–4,320. Price has tested this area several times, and the repeated tests are weakening the support. At the moment, Gold is again pressing this zone from above. A decisive 4H breakdown and close below this green support would be the confirmation I would watch for, rather than assuming the breakdown in advance.
If that support fails, the next major downside area marked on the chart is around 3,950, which is also an important previous accumulation/support zone. That would represent a substantial correction from the current level. However, if buyers defend 4,300–4,320 and price reclaims the recent lower highs, the bearish setup would weaken and Gold could attempt another recovery.
Left Shoulder: The first rally peaks around 4,450–4,480, followed by a pullback toward the 4,300–4,320 neckline/support.
Head: The larger central rally reaches approximately 4,650–4,700, clearly higher than the shoulders.
Right Shoulder: The subsequent rally reaches around 4,480–4,520, forming a lower high and completing the right shoulder.
Neckline: The green zone around 4,300–4,320 is the critical neckline.
The important point is that the H&S is not confirmed yet. Price is currently testing the neckline. A decisive 4H candle close below 4,300–4,320 would provide the bearish confirmation. If that happens, the measured-move implication of the H&S points toward the 3,950 area, which coincides with the major support zone you've marked.
Disclaimer: This is technical/chart analysis for educational purposes only, not financial advice. The projected target is a scenario, not a certainty.
$XAU
The most important feature on the chart is the green support zone around 4,300–4,320. Price has tested this area several times, and the repeated tests are weakening the support. At the moment, Gold is again pressing this zone from above. A decisive 4H breakdown and close below this green support would be the confirmation I would watch for, rather than assuming the breakdown in advance.
If that support fails, the next major downside area marked on the chart is around 3,950, which is also an important previous accumulation/support zone. That would represent a substantial correction from the current level. However, if buyers defend 4,300–4,320 and price reclaims the recent lower highs, the bearish setup would weaken and Gold could attempt another recovery.
Left Shoulder: The first rally peaks around 4,450–4,480, followed by a pullback toward the 4,300–4,320 neckline/support.
Head: The larger central rally reaches approximately 4,650–4,700, clearly higher than the shoulders.
Right Shoulder: The subsequent rally reaches around 4,480–4,520, forming a lower high and completing the right shoulder.
Neckline: The green zone around 4,300–4,320 is the critical neckline.
The important point is that the H&S is not confirmed yet. Price is currently testing the neckline. A decisive 4H candle close below 4,300–4,320 would provide the bearish confirmation. If that happens, the measured-move implication of the H&S points toward the 3,950 area, which coincides with the major support zone you've marked.
Disclaimer: This is technical/chart analysis for educational purposes only, not financial advice. The projected target is a scenario, not a certainty.
$XAU
111
·
--
Artikel
Übersetzung ansehen
Monero and the Premium on Economic Flexibility✅✅✅✅Personal investment thesis and conditions for validity — 14 September 2026
I see Monero as a leading candidate for a monetary revaluation during a period of systemic disruption. My conviction is that markets underestimate the value of being able to hold and transfer an asset without depending on an intermediary’s permission or the stability of a particular monetary order. Under certain conditions, this flexibility could become valuable enough to make XMR one of the decades to come best-performing investments.
A hypothesis of systemic disruption
My starting hypothesis is that the economic, political and social resources sustaining major state structures are under increasing strain. Relatively linear projections of the future seem to underestimate the possibility of rapid regime changes: sovereign debt crises, devaluations, capital controls, military conflict and fragmentation of trade. This is my macroeconomic premise, not a demonstrated collapse or a certain timetable.
In this setting, the risk to wealth extends beyond falling prices. An asset can remain legally owned and retain a quoted price while becoming unusable for its owner. The ability to sell it, move the proceeds or pay a counterparty then becomes an economic property distinct from its stated value.
Privacy is the visible surface
To me, presenting Monero primarily as a tool against mass surveillance remains a surface-level, “normie” reading of what could be at stake. Privacy matters, but the potential issue goes beyond personal privacy: it concerns the continuity of economic agency when monetary systems compete, close themselves off or become disorganized.
What I seek is the ability to maintain an accessible reserve and settle an exchange between parties that no longer share the same infrastructure of trust. Privacy supports this function by reducing participants’ exposure. It forms part of a broader autonomy combining self-custody, mobility, neutrality and censorship resistance.
$XMR
{future}(XMRUSDT)
Monero and the Premium on Economic Flexibility✅✅✅✅
Personal investment thesis and conditions for validity — 14 September 2026
I see Monero as a leading candidate for a monetary revaluation during a period of systemic disruption. My conviction is that markets underestimate the value of being able to hold and transfer an asset without depending on an intermediary’s permission or the stability of a particular monetary order. Under certain conditions, this flexibility could become valuable enough to make XMR one of the decades to come best-performing investments.
A hypothesis of systemic disruption
My starting hypothesis is that the economic, political and social resources sustaining major state structures are under increasing strain. Relatively linear projections of the future seem to underestimate the possibility of rapid regime changes: sovereign debt crises, devaluations, capital controls, military conflict and fragmentation of trade. This is my macroeconomic premise, not a demonstrated collapse or a certain timetable.
In this setting, the risk to wealth extends beyond falling prices. An asset can remain legally owned and retain a quoted price while becoming unusable for its owner. The ability to sell it, move the proceeds or pay a counterparty then becomes an economic property distinct from its stated value.
Privacy is the visible surface
To me, presenting Monero primarily as a tool against mass surveillance remains a surface-level, “normie” reading of what could be at stake. Privacy matters, but the potential issue goes beyond personal privacy: it concerns the continuity of economic agency when monetary systems compete, close themselves off or become disorganized.
What I seek is the ability to maintain an accessible reserve and settle an exchange between parties that no longer share the same infrastructure of trust. Privacy supports this function by reducing participants’ exposure. It forms part of a broader autonomy combining self-custody, mobility, neutrality and censorship resistance.
$XMR
I see Monero as a leading candidate for a monetary revaluation during a period of systemic disruption. My conviction is that markets underestimate the value of being able to hold and transfer an asset without depending on an intermediary’s permission or the stability of a particular monetary order. Under certain conditions, this flexibility could become valuable enough to make XMR one of the decades to come best-performing investments.
A hypothesis of systemic disruption
My starting hypothesis is that the economic, political and social resources sustaining major state structures are under increasing strain. Relatively linear projections of the future seem to underestimate the possibility of rapid regime changes: sovereign debt crises, devaluations, capital controls, military conflict and fragmentation of trade. This is my macroeconomic premise, not a demonstrated collapse or a certain timetable.
In this setting, the risk to wealth extends beyond falling prices. An asset can remain legally owned and retain a quoted price while becoming unusable for its owner. The ability to sell it, move the proceeds or pay a counterparty then becomes an economic property distinct from its stated value.
Privacy is the visible surface
To me, presenting Monero primarily as a tool against mass surveillance remains a surface-level, “normie” reading of what could be at stake. Privacy matters, but the potential issue goes beyond personal privacy: it concerns the continuity of economic agency when monetary systems compete, close themselves off or become disorganized.
What I seek is the ability to maintain an accessible reserve and settle an exchange between parties that no longer share the same infrastructure of trust. Privacy supports this function by reducing participants’ exposure. It forms part of a broader autonomy combining self-custody, mobility, neutrality and censorship resistance.
$XMR
118
·
--
Artikel
Übersetzung ansehen
APTUSDT is currently strongly bullish✨✅🔔APT
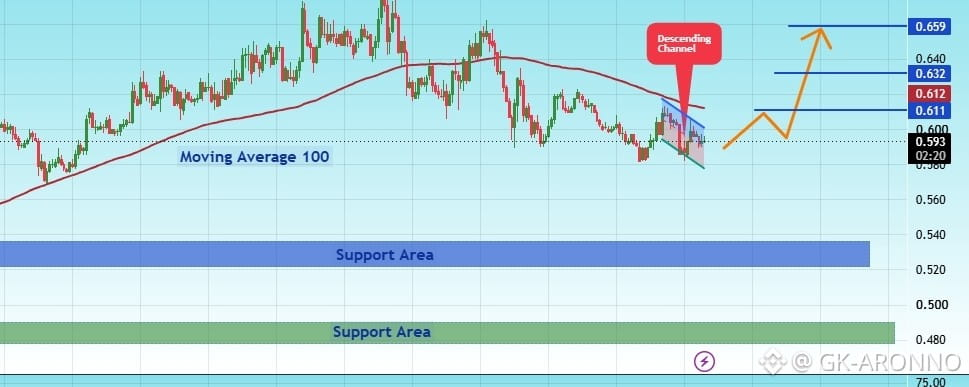
The price is moving within a descending channel on the 1-hour timeframe; it has reached the lower boundary and appears poised for a rebound. A retest of this level is expected, supporting a potential upward move.
The Relative Strength Index (RSI) indicates a bearish trend, but an upward breakout is likely due to oversold conditions on the 1-hour chart.
There is initial support at the 0.525 level.
A key support zone (marked in green) exists at 0.480; the price has bounced off this area multiple times, making it a strong support level.
The price is moving toward the 100-period moving average, a level we are currently approaching. This movement supports a potential rise.
Entry Price: 0.593
Target 1: 0.611
Target 2: 0.632
Target 3: 0.659
Stop Loss: At the green resistance zone.
Remember this simple rule: Capital management.
If you have any questions, please leave a comment.
Thank you.
$APT
{future}(APTUSDT)
APTUSDT is currently strongly bullish✨✅🔔
APT
The price is moving within a descending channel on the 1-hour timeframe; it has reached the lower boundary and appears poised for a rebound. A retest of this level is expected, supporting a potential upward move.
The Relative Strength Index (RSI) indicates a bearish trend, but an upward breakout is likely due to oversold conditions on the 1-hour chart.
There is initial support at the 0.525 level.
A key support zone (marked in green) exists at 0.480; the price has bounced off this area multiple times, making it a strong support level.
The price is moving toward the 100-period moving average, a level we are currently approaching. This movement supports a potential rise.
Entry Price: 0.593
Target 1: 0.611
Target 2: 0.632
Target 3: 0.659
Stop Loss: At the green resistance zone.
Remember this simple rule: Capital management.
If you have any questions, please leave a comment.
Thank you.
$APT
The price is moving within a descending channel on the 1-hour timeframe; it has reached the lower boundary and appears poised for a rebound. A retest of this level is expected, supporting a potential upward move.
The Relative Strength Index (RSI) indicates a bearish trend, but an upward breakout is likely due to oversold conditions on the 1-hour chart.
There is initial support at the 0.525 level.
A key support zone (marked in green) exists at 0.480; the price has bounced off this area multiple times, making it a strong support level.
The price is moving toward the 100-period moving average, a level we are currently approaching. This movement supports a potential rise.
Entry Price: 0.593
Target 1: 0.611
Target 2: 0.632
Target 3: 0.659
Stop Loss: At the green resistance zone.
Remember this simple rule: Capital management.
If you have any questions, please leave a comment.
Thank you.
$APT
44
·
--
Artikel
Übersetzung ansehen
OPUSDT may continue its trend after correction🚀🚀#OP
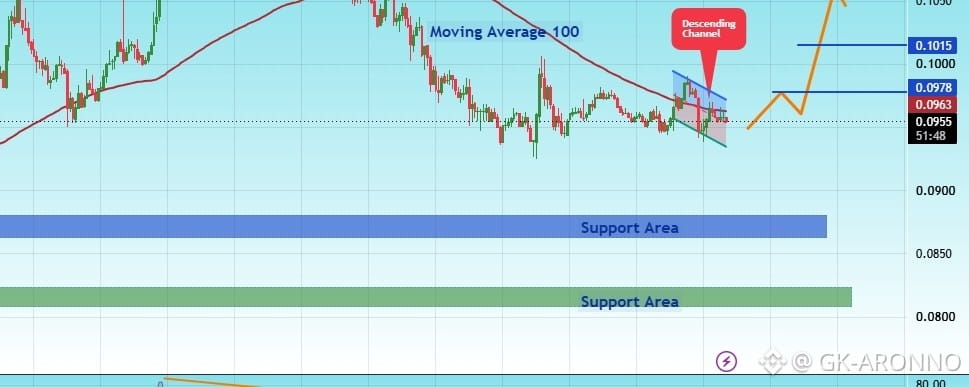
The price is moving within a descending channel on the 1-hour timeframe; it has reached the lower boundary and is poised for a rebound. A retest of this boundary is expected, supporting some upward movement.
The Relative Strength Index (RSI) indicates a bearish trend, but an upward breakout is likely due to oversold conditions on the 1-hour chart.
There is initial support at 0.0861, serving as a primary support zone.
A key support zone (marked in green) exists at 0.0800; the price has rebounded from this area multiple times, making it a strong support level.
The price is moving toward the 100-period moving average—a level we are currently approaching—which supports a potential rise.
Entry Price: 0.0956
Target 1: 0.0978
Target 2: 0.1015
Target 3: 0.1059
Stop Loss: At the green support zone.
Remember this simple rule: Capital management.
If you have any questions, please leave a comment.
Thank you.
$OP
{future}(OPUSDT)
OPUSDT may continue its trend after correction🚀🚀
#OP
The price is moving within a descending channel on the 1-hour timeframe; it has reached the lower boundary and is poised for a rebound. A retest of this boundary is expected, supporting some upward movement.
The Relative Strength Index (RSI) indicates a bearish trend, but an upward breakout is likely due to oversold conditions on the 1-hour chart.
There is initial support at 0.0861, serving as a primary support zone.
A key support zone (marked in green) exists at 0.0800; the price has rebounded from this area multiple times, making it a strong support level.
The price is moving toward the 100-period moving average—a level we are currently approaching—which supports a potential rise.
Entry Price: 0.0956
Target 1: 0.0978
Target 2: 0.1015
Target 3: 0.1059
Stop Loss: At the green support zone.
Remember this simple rule: Capital management.
If you have any questions, please leave a comment.
Thank you.
$OP
The price is moving within a descending channel on the 1-hour timeframe; it has reached the lower boundary and is poised for a rebound. A retest of this boundary is expected, supporting some upward movement.
The Relative Strength Index (RSI) indicates a bearish trend, but an upward breakout is likely due to oversold conditions on the 1-hour chart.
There is initial support at 0.0861, serving as a primary support zone.
A key support zone (marked in green) exists at 0.0800; the price has rebounded from this area multiple times, making it a strong support level.
The price is moving toward the 100-period moving average—a level we are currently approaching—which supports a potential rise.
Entry Price: 0.0956
Target 1: 0.0978
Target 2: 0.1015
Target 3: 0.1059
Stop Loss: At the green support zone.
Remember this simple rule: Capital management.
If you have any questions, please leave a comment.
Thank you.
$OP
121
·
--
Artikel
Übersetzung ansehen
AVAXUSDT : The Calm Before the Squeeze Storm🎇⚡AVAX
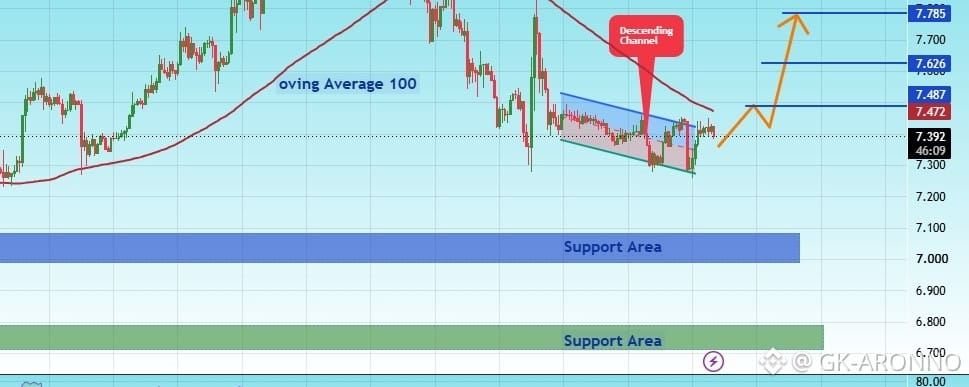
The price is moving within a descending channel on the 1-hour timeframe; it has reached the lower boundary and is poised for a rebound. A retest of this boundary is expected, supporting some upward movement.
The Relative Strength Index (RSI) indicates a bearish trend, but an upward breakout is likely due to oversold conditions on the 1-hour chart.
There is initial support at the 7.00 level.
A key support zone (marked in green) exists at 6.70; the price has bounced off this area multiple times, making it a strong support level.
The price is moving toward the 100-period moving average, which is within close range. This movement supports a rise.
Entry Price: 7.39
Target 1: 7.48
Target 2: 7.62
Target 3: 7.78
Stop Loss: At the green resistance zone.
Remember this simple rule: Capital management.
If you have any questions, please leave a comment.
Thank you.
$AVAX
{future}(AVAXUSDT)
AVAXUSDT : The Calm Before the Squeeze Storm🎇⚡
AVAX
The price is moving within a descending channel on the 1-hour timeframe; it has reached the lower boundary and is poised for a rebound. A retest of this boundary is expected, supporting some upward movement.
The Relative Strength Index (RSI) indicates a bearish trend, but an upward breakout is likely due to oversold conditions on the 1-hour chart.
There is initial support at the 7.00 level.
A key support zone (marked in green) exists at 6.70; the price has bounced off this area multiple times, making it a strong support level.
The price is moving toward the 100-period moving average, which is within close range. This movement supports a rise.
Entry Price: 7.39
Target 1: 7.48
Target 2: 7.62
Target 3: 7.78
Stop Loss: At the green resistance zone.
Remember this simple rule: Capital management.
If you have any questions, please leave a comment.
Thank you.
$AVAX
The price is moving within a descending channel on the 1-hour timeframe; it has reached the lower boundary and is poised for a rebound. A retest of this boundary is expected, supporting some upward movement.
The Relative Strength Index (RSI) indicates a bearish trend, but an upward breakout is likely due to oversold conditions on the 1-hour chart.
There is initial support at the 7.00 level.
A key support zone (marked in green) exists at 6.70; the price has bounced off this area multiple times, making it a strong support level.
The price is moving toward the 100-period moving average, which is within close range. This movement supports a rise.
Entry Price: 7.39
Target 1: 7.48
Target 2: 7.62
Target 3: 7.78
Stop Loss: At the green resistance zone.
Remember this simple rule: Capital management.
If you have any questions, please leave a comment.
Thank you.
$AVAX
76
·
--
Artikel
Übersetzung ansehen
CGPTUSDT READY TO FLY ?🎊🎈✨CGPT
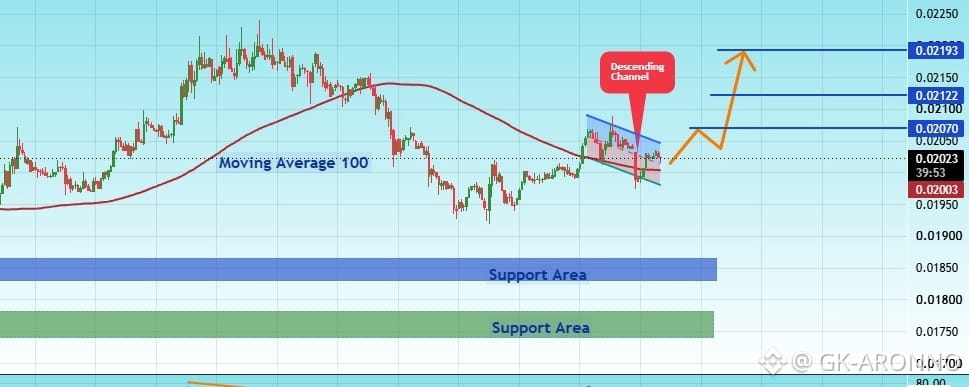
The price is moving within a descending channel on the 1-hour timeframe; it has reached the lower boundary and is poised for a rebound. A retest of this boundary is expected, supporting an upward move.
The Relative Strength Index (RSI) indicates a bearish trend, but an upward breakout is likely due to oversold conditions on the 1-hour chart.
There is initial support at 0.1834 acting as a preliminary support zone.
A key support zone (marked in green) exists at 0.01738; the price has bounced off this area multiple times, making it a strong support level.
The price is moving toward the 100-period moving average, which is within close range. This movement supports a rise.
Entry Price: 0.02019
Target 1: 0.02070
Target 2: 0.02122
Target 3: 0.02193
Stop Loss: At the green resistance zone.
Remember this simple rule: capital management.
If you have any questions, please leave a comment.
Thank you.
.$CGPT
{future}(CGPTUSDT)
CGPTUSDT READY TO FLY ?🎊🎈✨
CGPT
The price is moving within a descending channel on the 1-hour timeframe; it has reached the lower boundary and is poised for a rebound. A retest of this boundary is expected, supporting an upward move.
The Relative Strength Index (RSI) indicates a bearish trend, but an upward breakout is likely due to oversold conditions on the 1-hour chart.
There is initial support at 0.1834 acting as a preliminary support zone.
A key support zone (marked in green) exists at 0.01738; the price has bounced off this area multiple times, making it a strong support level.
The price is moving toward the 100-period moving average, which is within close range. This movement supports a rise.
Entry Price: 0.02019
Target 1: 0.02070
Target 2: 0.02122
Target 3: 0.02193
Stop Loss: At the green resistance zone.
Remember this simple rule: capital management.
If you have any questions, please leave a comment.
Thank you.
.$CGPT
The price is moving within a descending channel on the 1-hour timeframe; it has reached the lower boundary and is poised for a rebound. A retest of this boundary is expected, supporting an upward move.
The Relative Strength Index (RSI) indicates a bearish trend, but an upward breakout is likely due to oversold conditions on the 1-hour chart.
There is initial support at 0.1834 acting as a preliminary support zone.
A key support zone (marked in green) exists at 0.01738; the price has bounced off this area multiple times, making it a strong support level.
The price is moving toward the 100-period moving average, which is within close range. This movement supports a rise.
Entry Price: 0.02019
Target 1: 0.02070
Target 2: 0.02122
Target 3: 0.02193
Stop Loss: At the green resistance zone.
Remember this simple rule: capital management.
If you have any questions, please leave a comment.
Thank you.
.$CGPT
107
·
--
Artikel
Übersetzung ansehen
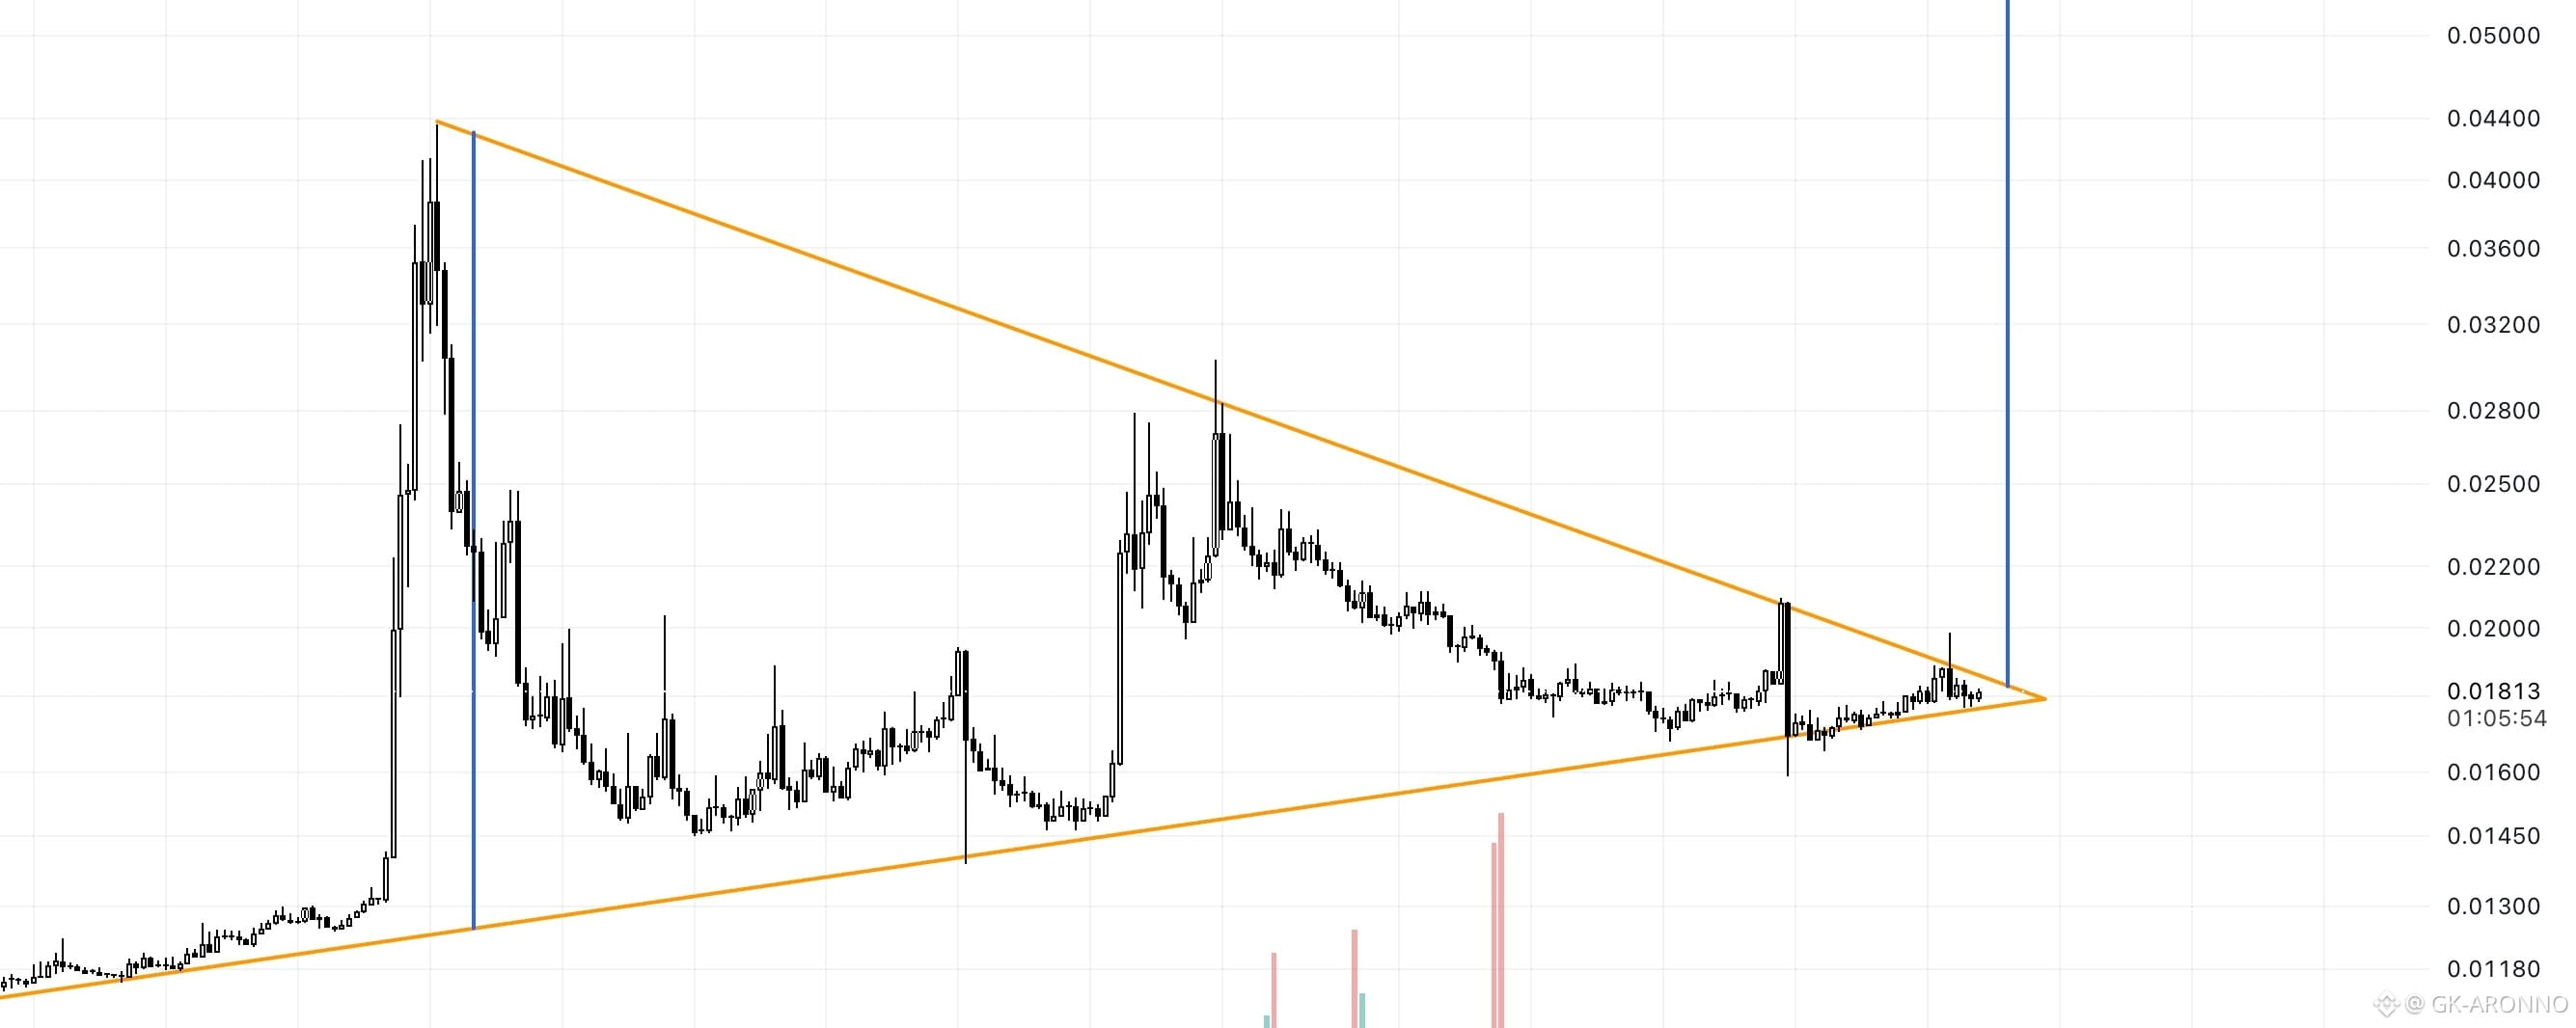
BMT/USDT (4h) Approaching a Breakout From a Symmetrical Triangle🎆🎇🎆BMT/USDT has been consolidating inside a large symmetrical triangle on the 4H chart, with price forming lower highs beneath descending resistance while maintaining higher lows along the rising support. The structure has been developing for several weeks and is now becoming very tight near the apex around $0.0180–$0.0185.
A confirmed breakout and hold above the upper trendline could trigger a strong bullish expansion, with $0.0344 acting as an important intermediate resistance and the broader measured target extending toward $0.055.
A breakdown below the rising support would invalidate the bullish setup and increase the probability of further downside.
$BMT
{future}(BMTUSDT)
BMT/USDT (4h) Approaching a Breakout From a Symmetrical Triangle🎆🎇🎆
BMT/USDT has been consolidating inside a large symmetrical triangle on the 4H chart, with price forming lower highs beneath descending resistance while maintaining higher lows along the rising support. The structure has been developing for several weeks and is now becoming very tight near the apex around $0.0180–$0.0185.
A confirmed breakout and hold above the upper trendline could trigger a strong bullish expansion, with $0.0344 acting as an important intermediate resistance and the broader measured target extending toward $0.055.
A breakdown below the rising support would invalidate the bullish setup and increase the probability of further downside.
$BMT
A confirmed breakout and hold above the upper trendline could trigger a strong bullish expansion, with $0.0344 acting as an important intermediate resistance and the broader measured target extending toward $0.055.
A breakdown below the rising support would invalidate the bullish setup and increase the probability of further downside.
$BMT
141
·
--
Artikel
Übersetzung ansehen
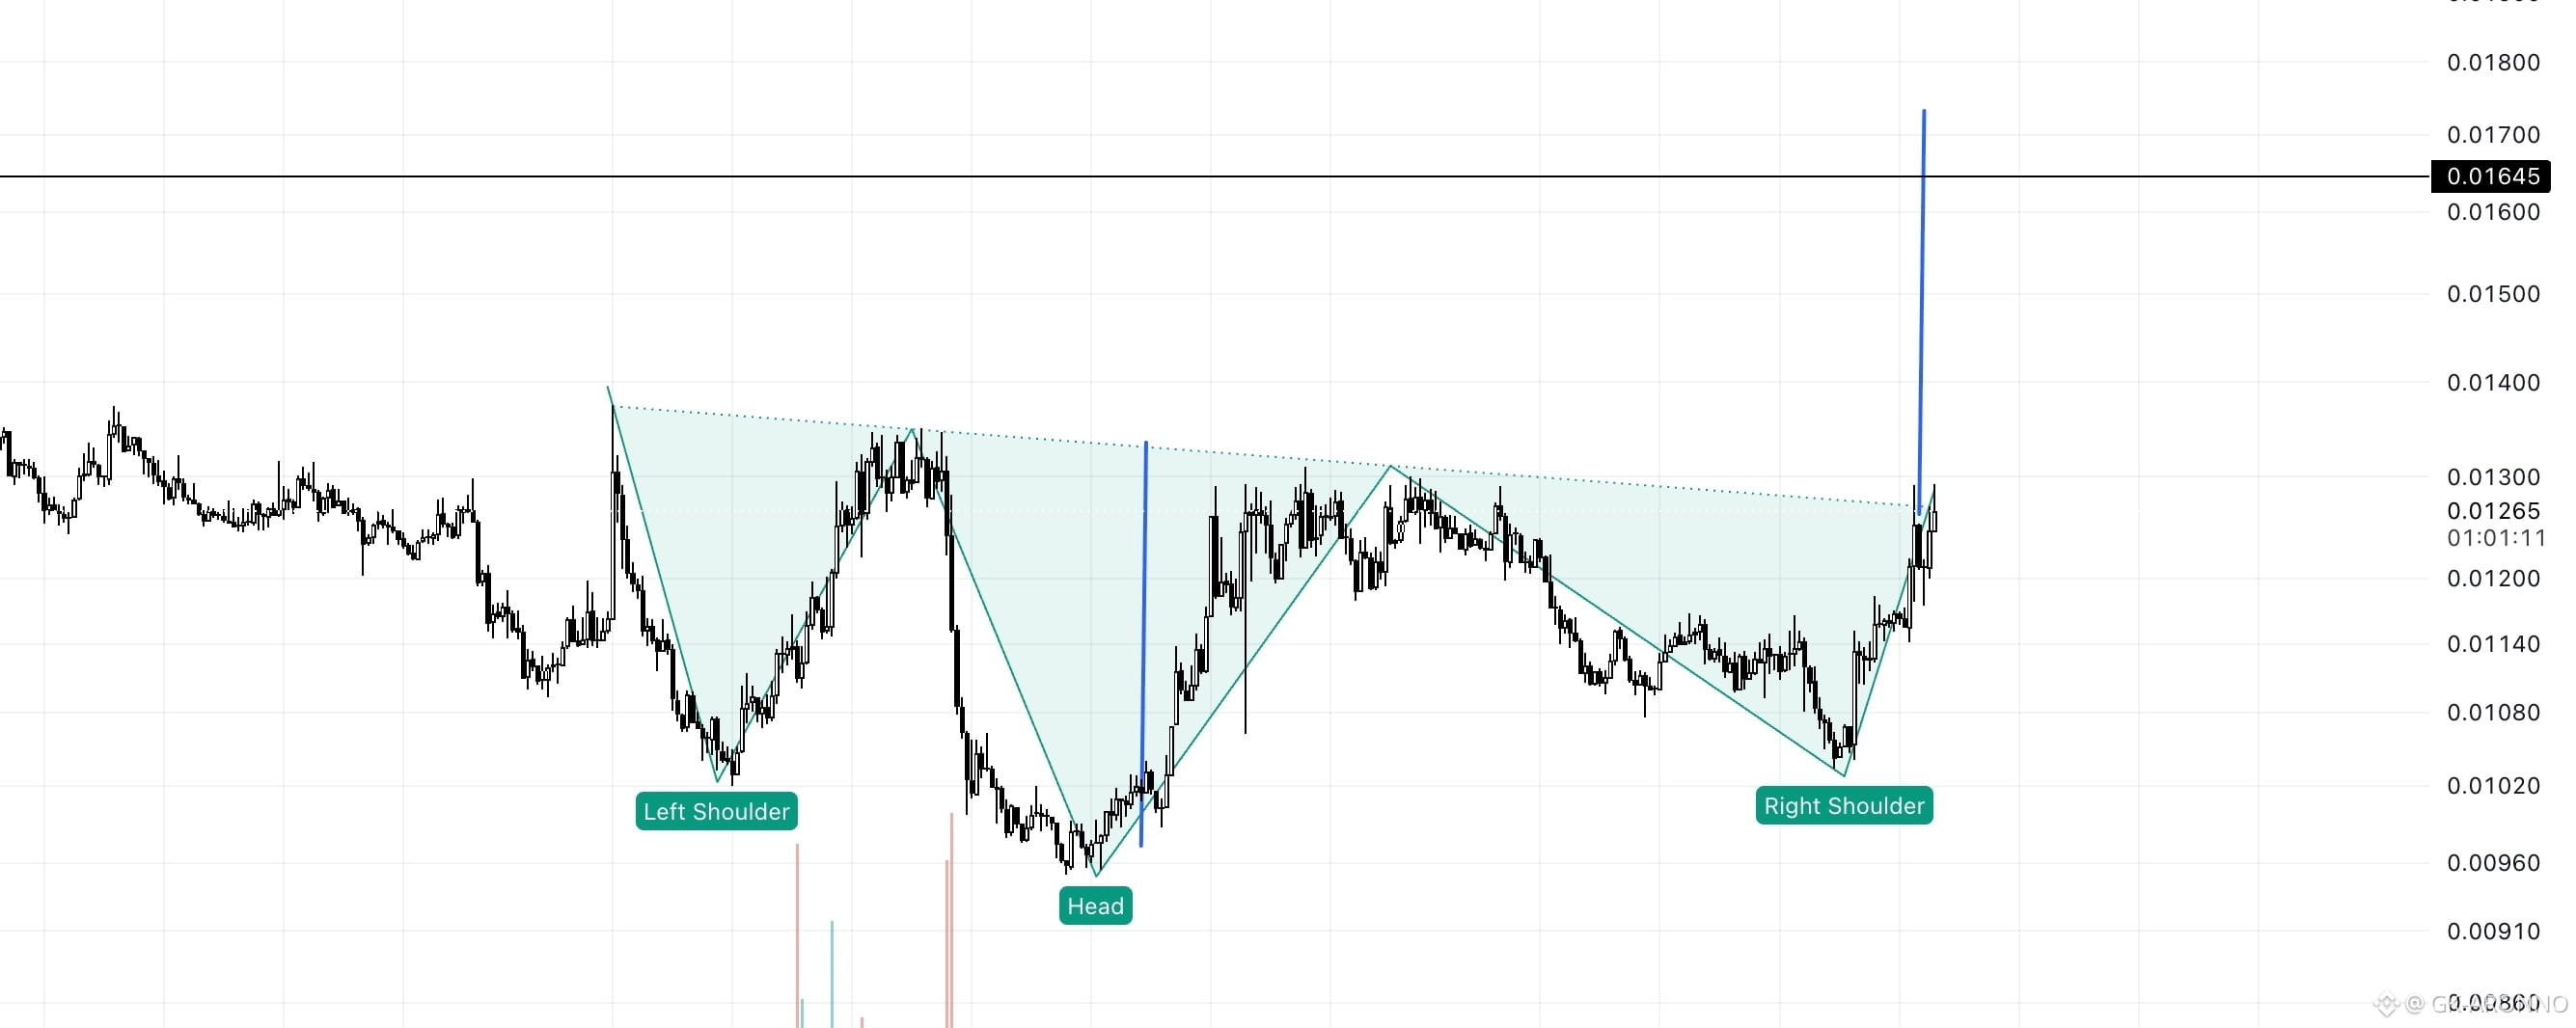
BABY/USDT (4h) Testing an Inverse Head and Shoulders Breakout🔥⚡BABY/USDT is forming a large inverse head and shoulders pattern on the 4H chart, with a clear left shoulder, deeper head, and right shoulder developing near the $0.0102–$0.0105 area.
Price has now recovered back toward the descending neckline around $0.0126–$0.0130 and is beginning to test a breakout. A confirmed close and hold above this neckline could validate the bullish reversal structure and open the way toward the $0.0164–$0.0170 measured target area.
A rejection from the neckline would keep the pattern unconfirmed, while a move back below the right-shoulder support would weaken the bullish setup.
$BABY
{future}(BABYUSDT)
BABY/USDT (4h) Testing an Inverse Head and Shoulders Breakout🔥⚡
BABY/USDT is forming a large inverse head and shoulders pattern on the 4H chart, with a clear left shoulder, deeper head, and right shoulder developing near the $0.0102–$0.0105 area.
Price has now recovered back toward the descending neckline around $0.0126–$0.0130 and is beginning to test a breakout. A confirmed close and hold above this neckline could validate the bullish reversal structure and open the way toward the $0.0164–$0.0170 measured target area.
A rejection from the neckline would keep the pattern unconfirmed, while a move back below the right-shoulder support would weaken the bullish setup.
$BABY
Price has now recovered back toward the descending neckline around $0.0126–$0.0130 and is beginning to test a breakout. A confirmed close and hold above this neckline could validate the bullish reversal structure and open the way toward the $0.0164–$0.0170 measured target area.
A rejection from the neckline would keep the pattern unconfirmed, while a move back below the right-shoulder support would weaken the bullish setup.
$BABY
1
1
140
·
--
Artikel
Übersetzung ansehen
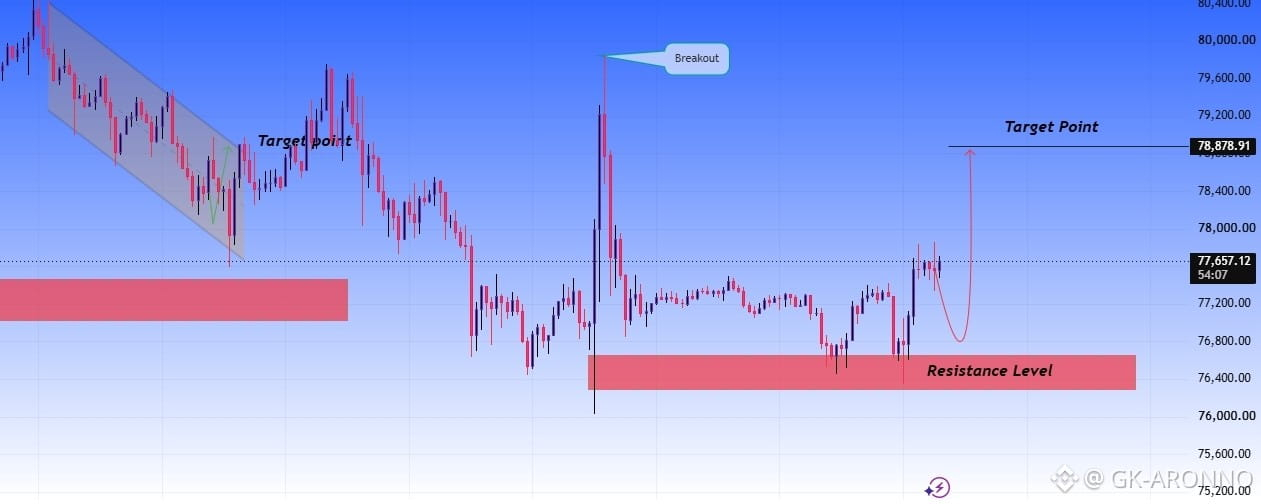
BTC/USD — Bullish Breakout Setup📣🚀🎊Bitcoin is showing a potential bullish continuation after breaking out of the previous structure. Price is currently holding above the 76,400–76,600 support/resistance zone, which is an important area for buyers.
The chart suggests a possible retest of the resistance zone followed by another move higher. If BTC maintains strength above the support area and buyers continue to step in, the next major target is around 78,878.
🔥 Key Levels
Current Price: ~77,618
Support Zone: 76,400–76,600
Breakout Area: 79,000–79,500
Target: 78,878
Bias: Bullish 📈
📌 Trade Idea
Wait for confirmation around the support/retest zone rather than chasing the move. A strong bullish reaction can provide a better entry opportunity.
Risk Management: Always use proper position sizing and a stop-loss according to your own risk tolerance. This is a technical analysis idea, not financial advice
$BTC
{future}(BTCUSDT)
BTC/USD — Bullish Breakout Setup📣🚀🎊
Bitcoin is showing a potential bullish continuation after breaking out of the previous structure. Price is currently holding above the 76,400–76,600 support/resistance zone, which is an important area for buyers.
The chart suggests a possible retest of the resistance zone followed by another move higher. If BTC maintains strength above the support area and buyers continue to step in, the next major target is around 78,878.
🔥 Key Levels
Current Price: ~77,618
Support Zone: 76,400–76,600
Breakout Area: 79,000–79,500
Target: 78,878
Bias: Bullish 📈
📌 Trade Idea
Wait for confirmation around the support/retest zone rather than chasing the move. A strong bullish reaction can provide a better entry opportunity.
Risk Management: Always use proper position sizing and a stop-loss according to your own risk tolerance. This is a technical analysis idea, not financial advice
$BTC
The chart suggests a possible retest of the resistance zone followed by another move higher. If BTC maintains strength above the support area and buyers continue to step in, the next major target is around 78,878.
🔥 Key Levels
Current Price: ~77,618
Support Zone: 76,400–76,600
Breakout Area: 79,000–79,500
Target: 78,878
Bias: Bullish 📈
📌 Trade Idea
Wait for confirmation around the support/retest zone rather than chasing the move. A strong bullish reaction can provide a better entry opportunity.
Risk Management: Always use proper position sizing and a stop-loss according to your own risk tolerance. This is a technical analysis idea, not financial advice
$BTC
87
·
--
Artikel
Übersetzung ansehen
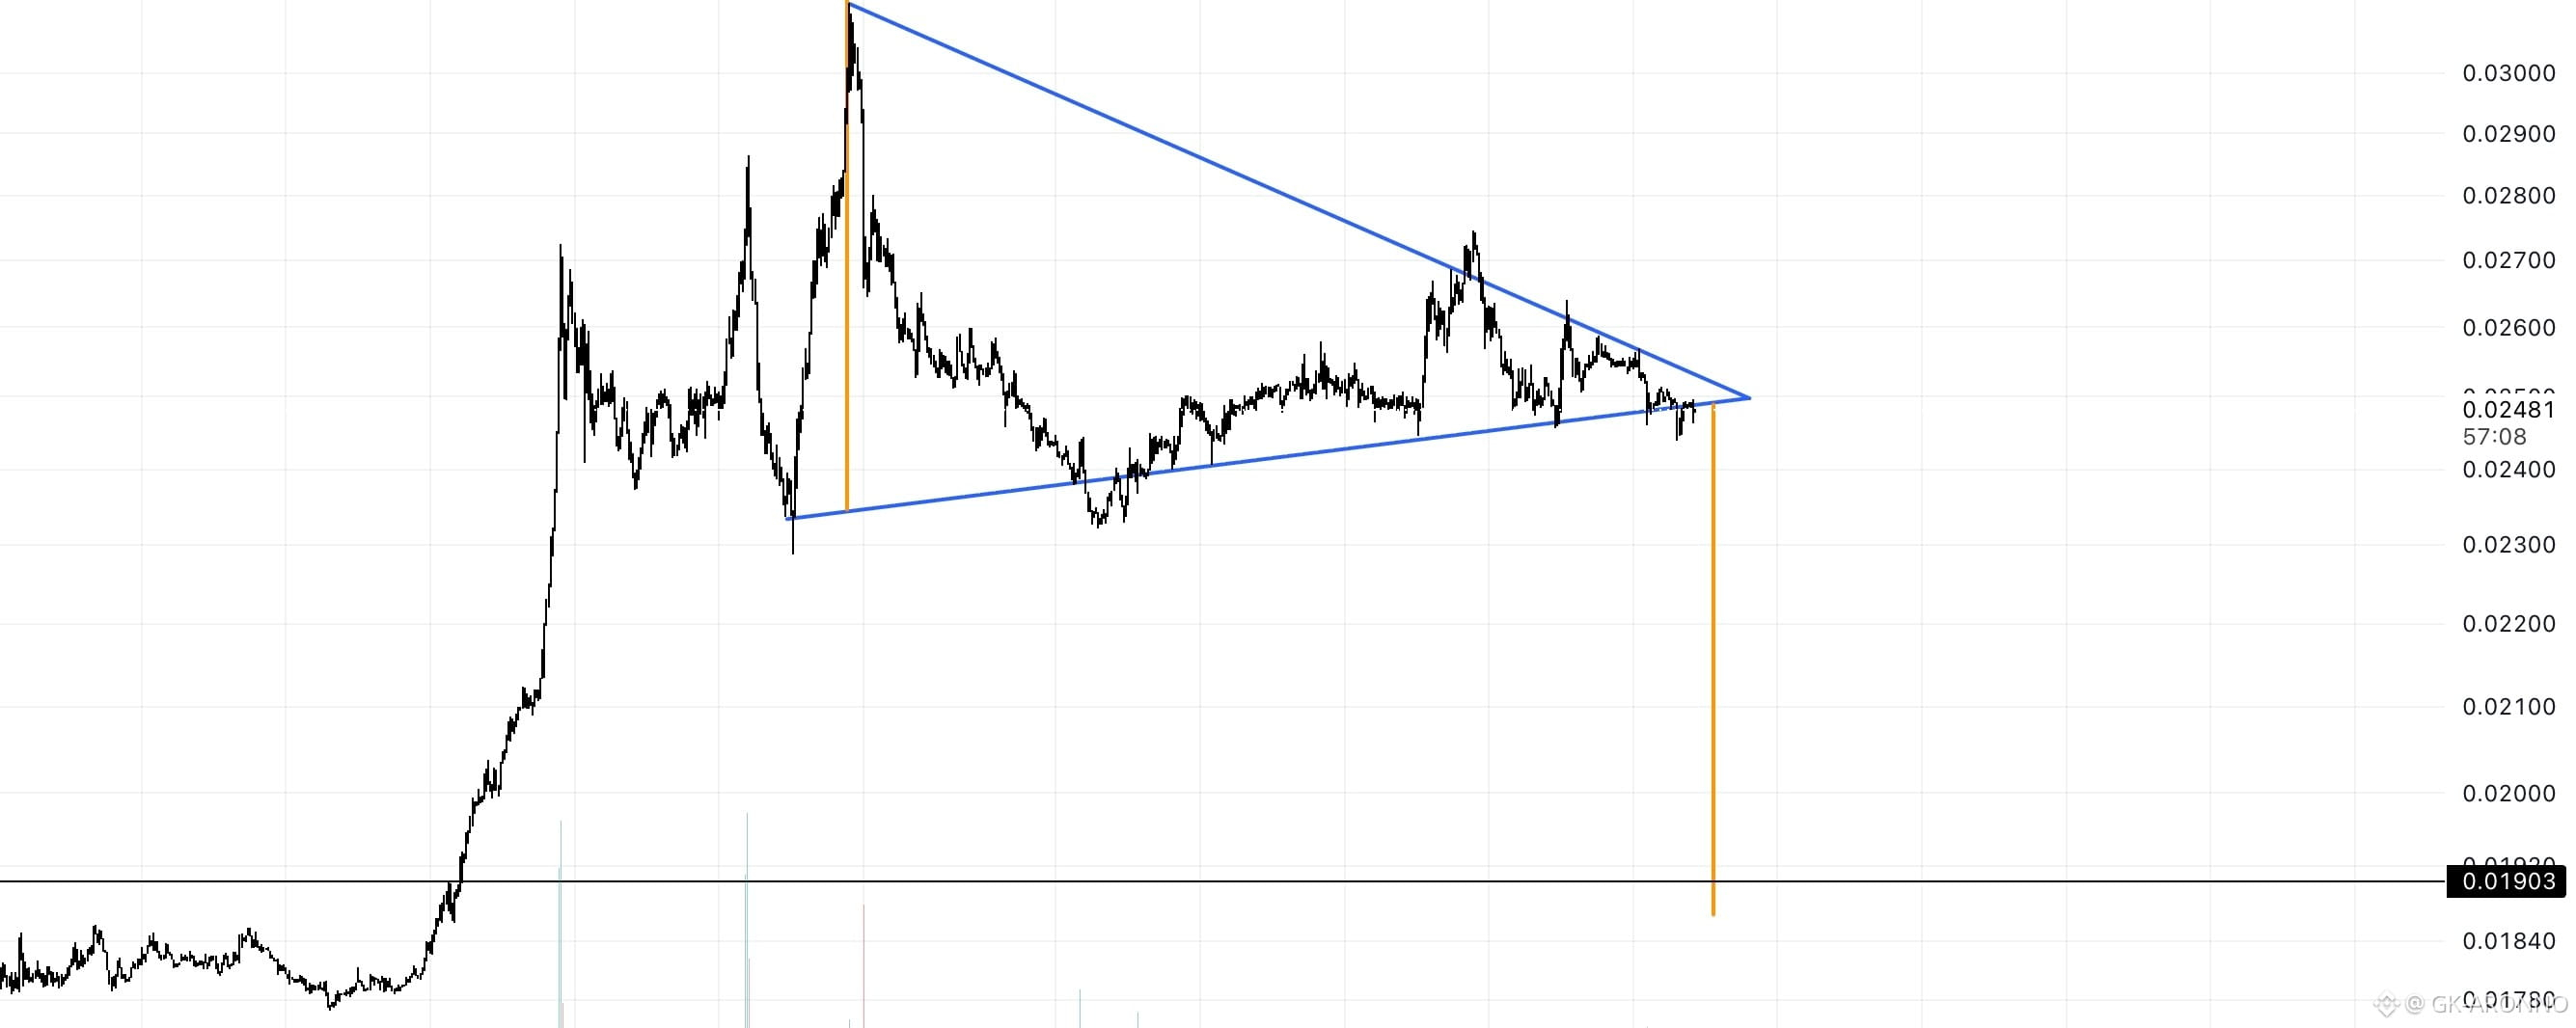
KMNO/USDT (1h) Testing a Breakdown From a Symmetrical Triangle🚀🔥⚡KMNO/USDT has been consolidating inside a large symmetrical triangle on the 1H chart, with price forming lower highs beneath the descending resistance while maintaining higher lows along the rising support. The structure has tightened significantly and price is now trading near the apex around $0.0248–$0.0250.
A confirmed breakdown below the rising support could trigger a bearish continuation toward the $0.0190 target area. A breakout above the descending trendline would invalidate the bearish scenario and could open the way for a recovery back toward the $0.0265–$0.0270 area.
$KMNO
{future}(KMNOUSDT)
KMNO/USDT (1h) Testing a Breakdown From a Symmetrical Triangle🚀🔥⚡
KMNO/USDT has been consolidating inside a large symmetrical triangle on the 1H chart, with price forming lower highs beneath the descending resistance while maintaining higher lows along the rising support. The structure has tightened significantly and price is now trading near the apex around $0.0248–$0.0250.
A confirmed breakdown below the rising support could trigger a bearish continuation toward the $0.0190 target area. A breakout above the descending trendline would invalidate the bearish scenario and could open the way for a recovery back toward the $0.0265–$0.0270 area.
$KMNO
A confirmed breakdown below the rising support could trigger a bearish continuation toward the $0.0190 target area. A breakout above the descending trendline would invalidate the bearish scenario and could open the way for a recovery back toward the $0.0265–$0.0270 area.
$KMNO
61
·
--
Artikel
Übersetzung ansehen
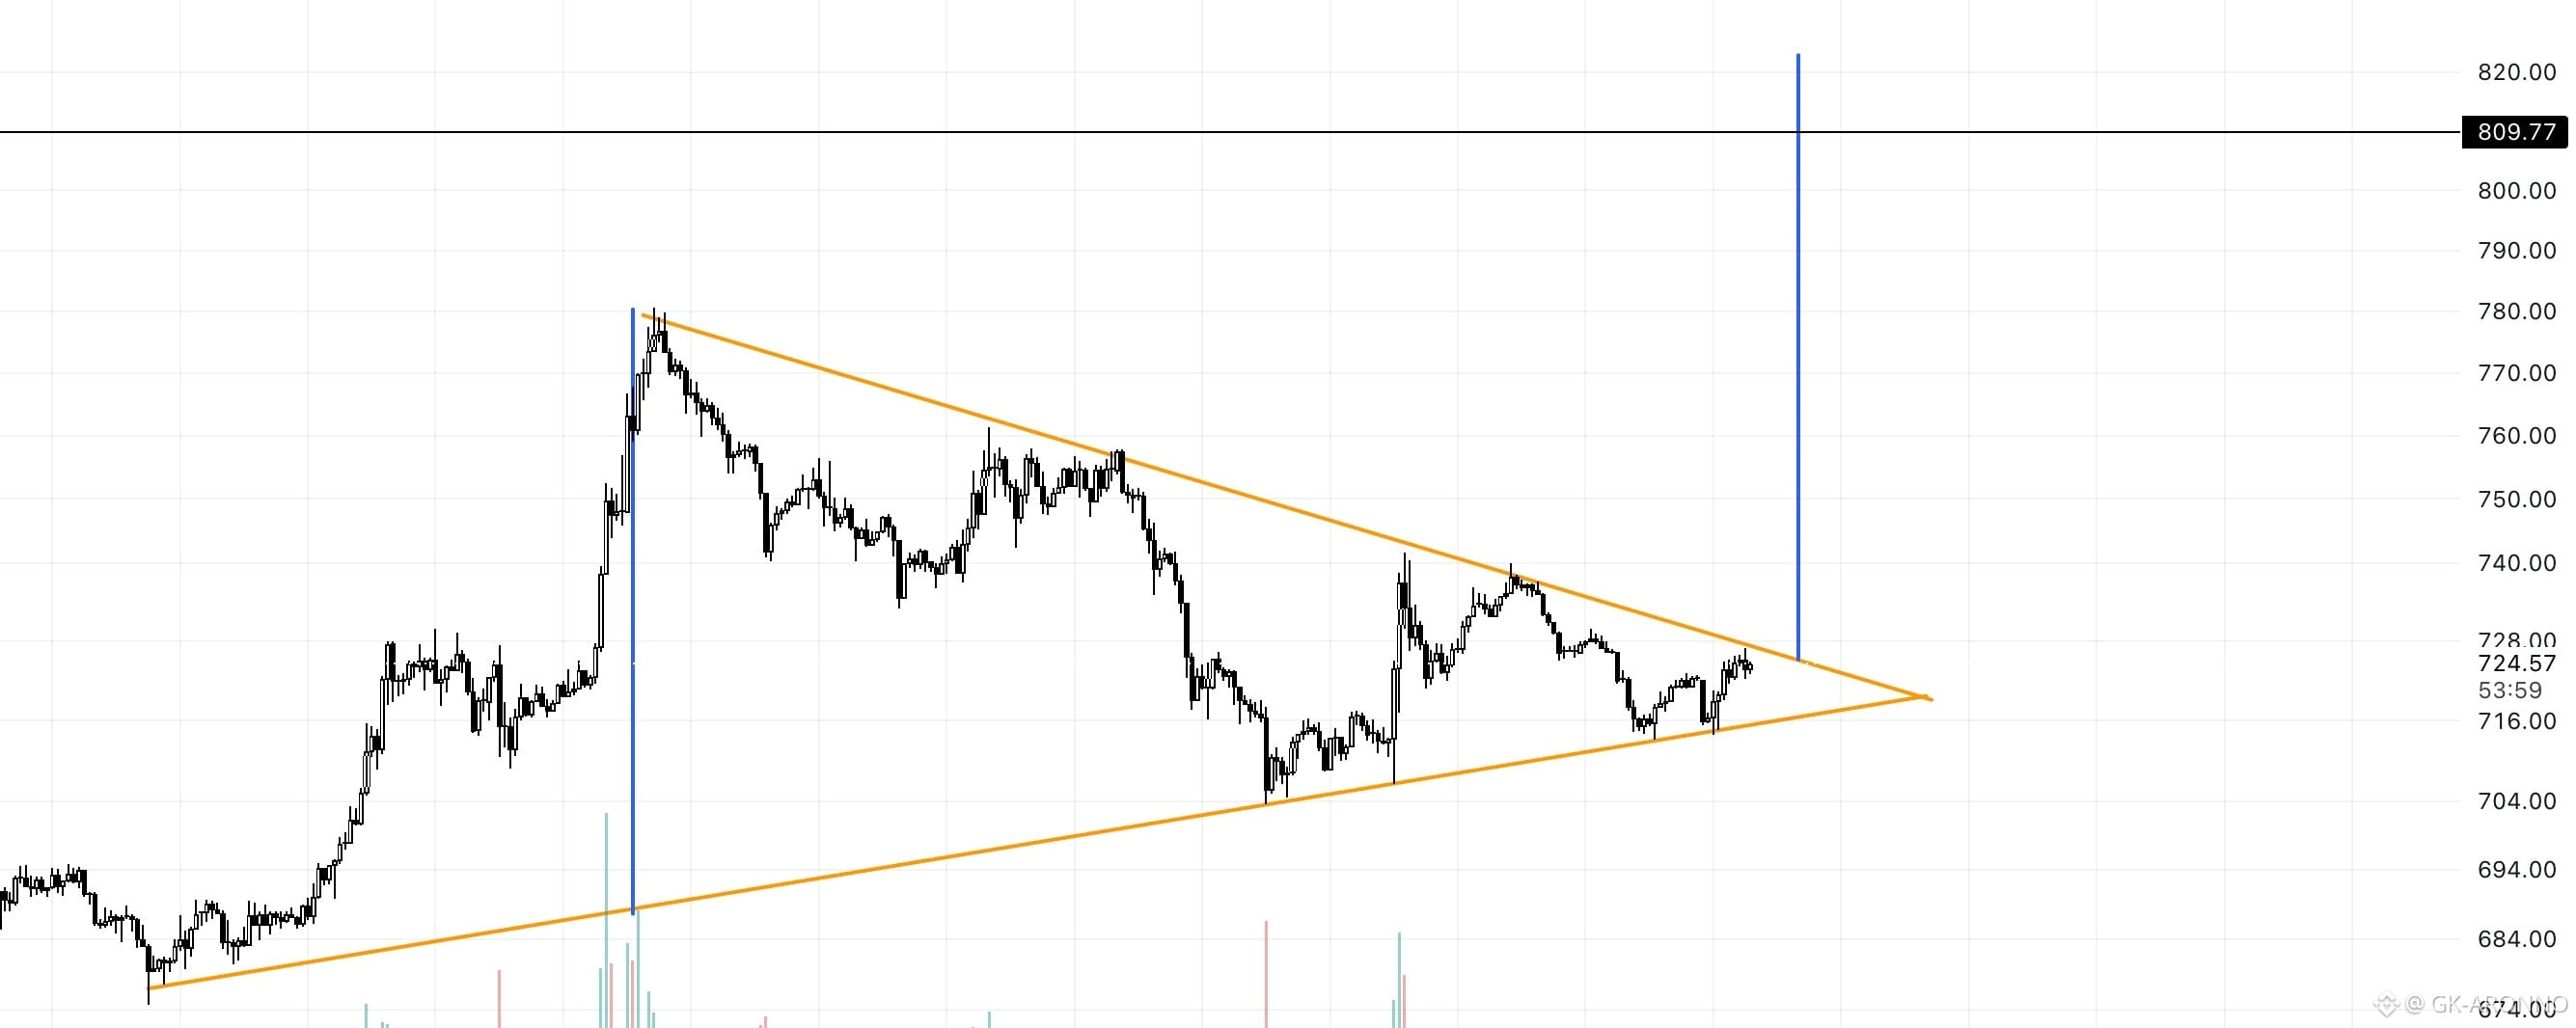
BNB/USDT (1h) Testing a Breakout From a Symmetrical Triangle⚡📣BNB/USDT is consolidating inside a large symmetrical triangle on the 1H chart, with price forming lower highs beneath descending resistance while maintaining higher lows along the rising support. The structure has tightened significantly, and price is now testing the upper boundary around $724–$726.
A confirmed breakout and hold above the descending trendline could trigger a bullish expansion toward the $809–$820 target area. A rejection from resistance would keep the triangle active, while a breakdown below the rising support around $714–$716 would weaken the bullish setup and increase the probability of further downside.
$BNB
{future}(BNBUSDT)
BNB/USDT (1h) Testing a Breakout From a Symmetrical Triangle⚡📣
BNB/USDT is consolidating inside a large symmetrical triangle on the 1H chart, with price forming lower highs beneath descending resistance while maintaining higher lows along the rising support. The structure has tightened significantly, and price is now testing the upper boundary around $724–$726.
A confirmed breakout and hold above the descending trendline could trigger a bullish expansion toward the $809–$820 target area. A rejection from resistance would keep the triangle active, while a breakdown below the rising support around $714–$716 would weaken the bullish setup and increase the probability of further downside.
$BNB
A confirmed breakout and hold above the descending trendline could trigger a bullish expansion toward the $809–$820 target area. A rejection from resistance would keep the triangle active, while a breakdown below the rising support around $714–$716 would weaken the bullish setup and increase the probability of further downside.
$BNB
64
·
--
Artikel
Übersetzung ansehen
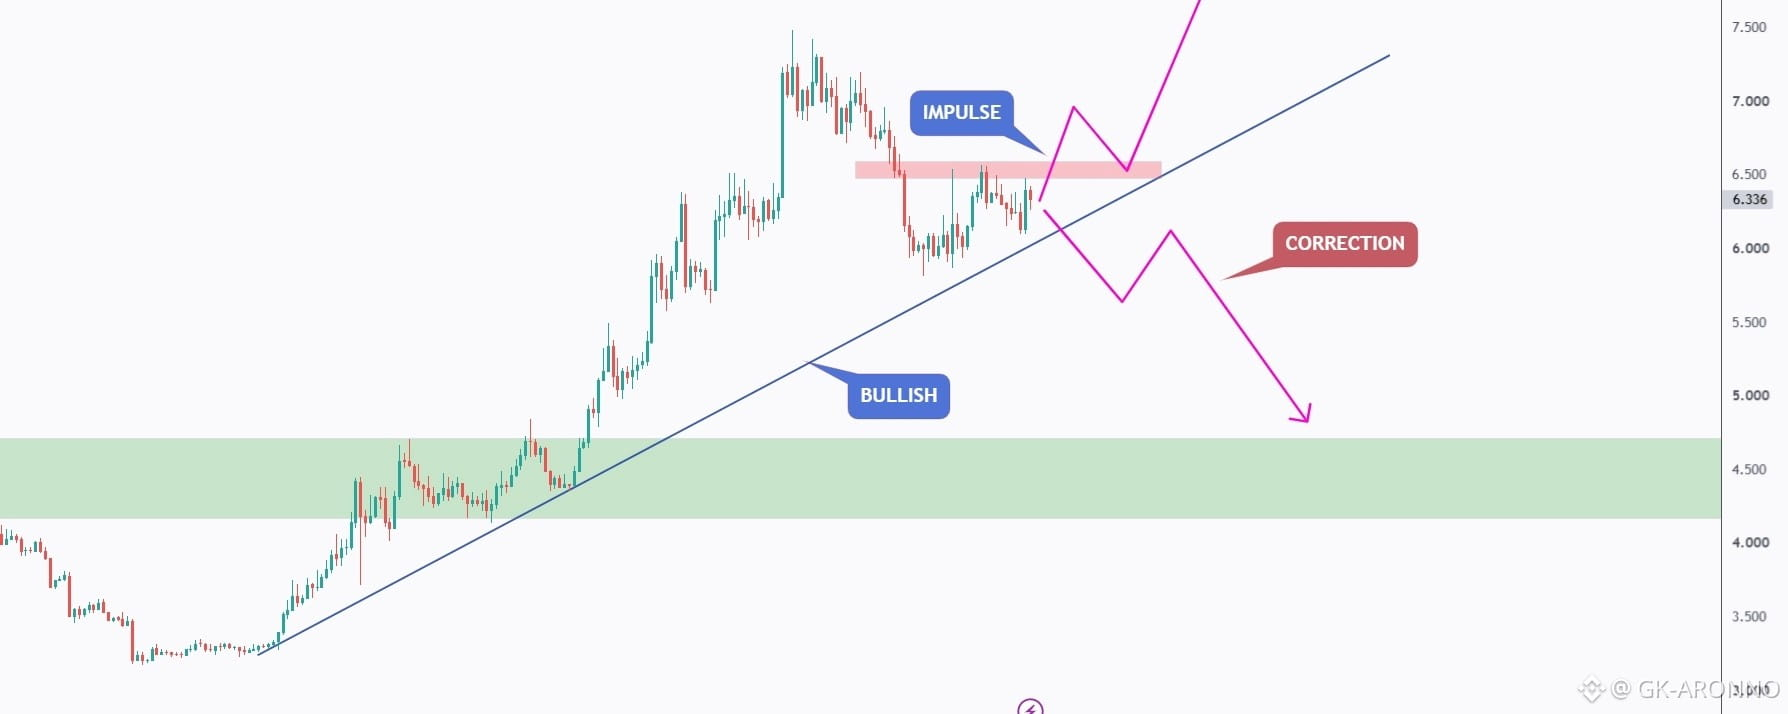
UNI – The Next Move Needs Confirmation,🚀🔥UNI has been overall bullish, trading above the rising blue trendline and maintaining its broader bullish structure.
Right now, price is consolidating after its latest impulse, and the last minor high around $6.50 is the key level for the bulls.
A clear break above this red resistance would confirm that buyers are taking control again and could activate the next bullish impulse.
On the other hand, if UNI breaks below the rising blue trendline, the bullish structure would weaken, and a deeper bearish correction toward the green demand zone around $4.20–$4.70 could follow.
📌 Two levels, two scenarios. Let price confirm the next move.
⚠️ Disclaimer: This analysis is for educational purposes only and does not constitute financial advice. Always manage your risk and wait for proper confirmation before entering a trade.
📚 Stick to your trading plan regarding entries, risk, and management.
Good luck! 🍀
$UNI
{future}(UNIUSDT)
UNI – The Next Move Needs Confirmation,🚀🔥
UNI has been overall bullish, trading above the rising blue trendline and maintaining its broader bullish structure.
Right now, price is consolidating after its latest impulse, and the last minor high around $6.50 is the key level for the bulls.
A clear break above this red resistance would confirm that buyers are taking control again and could activate the next bullish impulse.
On the other hand, if UNI breaks below the rising blue trendline, the bullish structure would weaken, and a deeper bearish correction toward the green demand zone around $4.20–$4.70 could follow.
📌 Two levels, two scenarios. Let price confirm the next move.
⚠️ Disclaimer: This analysis is for educational purposes only and does not constitute financial advice. Always manage your risk and wait for proper confirmation before entering a trade.
📚 Stick to your trading plan regarding entries, risk, and management.
Good luck! 🍀
$UNI
Right now, price is consolidating after its latest impulse, and the last minor high around $6.50 is the key level for the bulls.
A clear break above this red resistance would confirm that buyers are taking control again and could activate the next bullish impulse.
On the other hand, if UNI breaks below the rising blue trendline, the bullish structure would weaken, and a deeper bearish correction toward the green demand zone around $4.20–$4.70 could follow.
📌 Two levels, two scenarios. Let price confirm the next move.
⚠️ Disclaimer: This analysis is for educational purposes only and does not constitute financial advice. Always manage your risk and wait for proper confirmation before entering a trade.
📚 Stick to your trading plan regarding entries, risk, and management.
Good luck! 🍀
$UNI
93
·
--
Artikel
Übersetzung ansehen
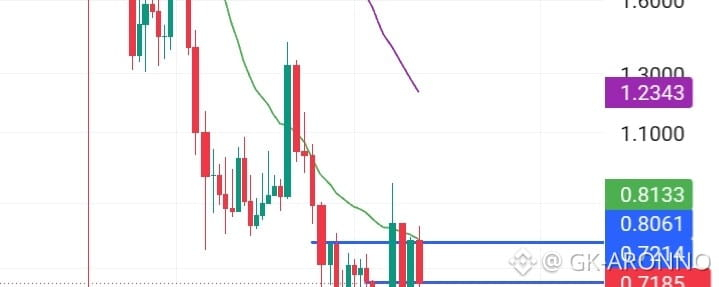
Sui analysis⚡♥️This poor fellow Sui is trapped between wyckoff creek and MA20 of weekly timeframe which is sloping down. It gave a spring around 0.63 then registered a big bullish candle which got rejected at MA20. If it falls back in to the range (meaning unable to stay above 0.7214) then there is a risk it may capitulate deep to test 0.55. For sui to enter into a bullish structure it must successfully make Ma20 on a weekly time frame a support which is around 81 to 82. If it succeeds then it is likely to rise to 3.47 which is the top of its elbow candle from where original mark down started...
$SUI
{future}(SUIUSDT)
Sui analysis⚡♥️
This poor fellow Sui is trapped between wyckoff creek and MA20 of weekly timeframe which is sloping down. It gave a spring around 0.63 then registered a big bullish candle which got rejected at MA20. If it falls back in to the range (meaning unable to stay above 0.7214) then there is a risk it may capitulate deep to test 0.55. For sui to enter into a bullish structure it must successfully make Ma20 on a weekly time frame a support which is around 81 to 82. If it succeeds then it is likely to rise to 3.47 which is the top of its elbow candle from where original mark down started...
$SUI
$SUI
115
·
--
Artikel
Übersetzung ansehen
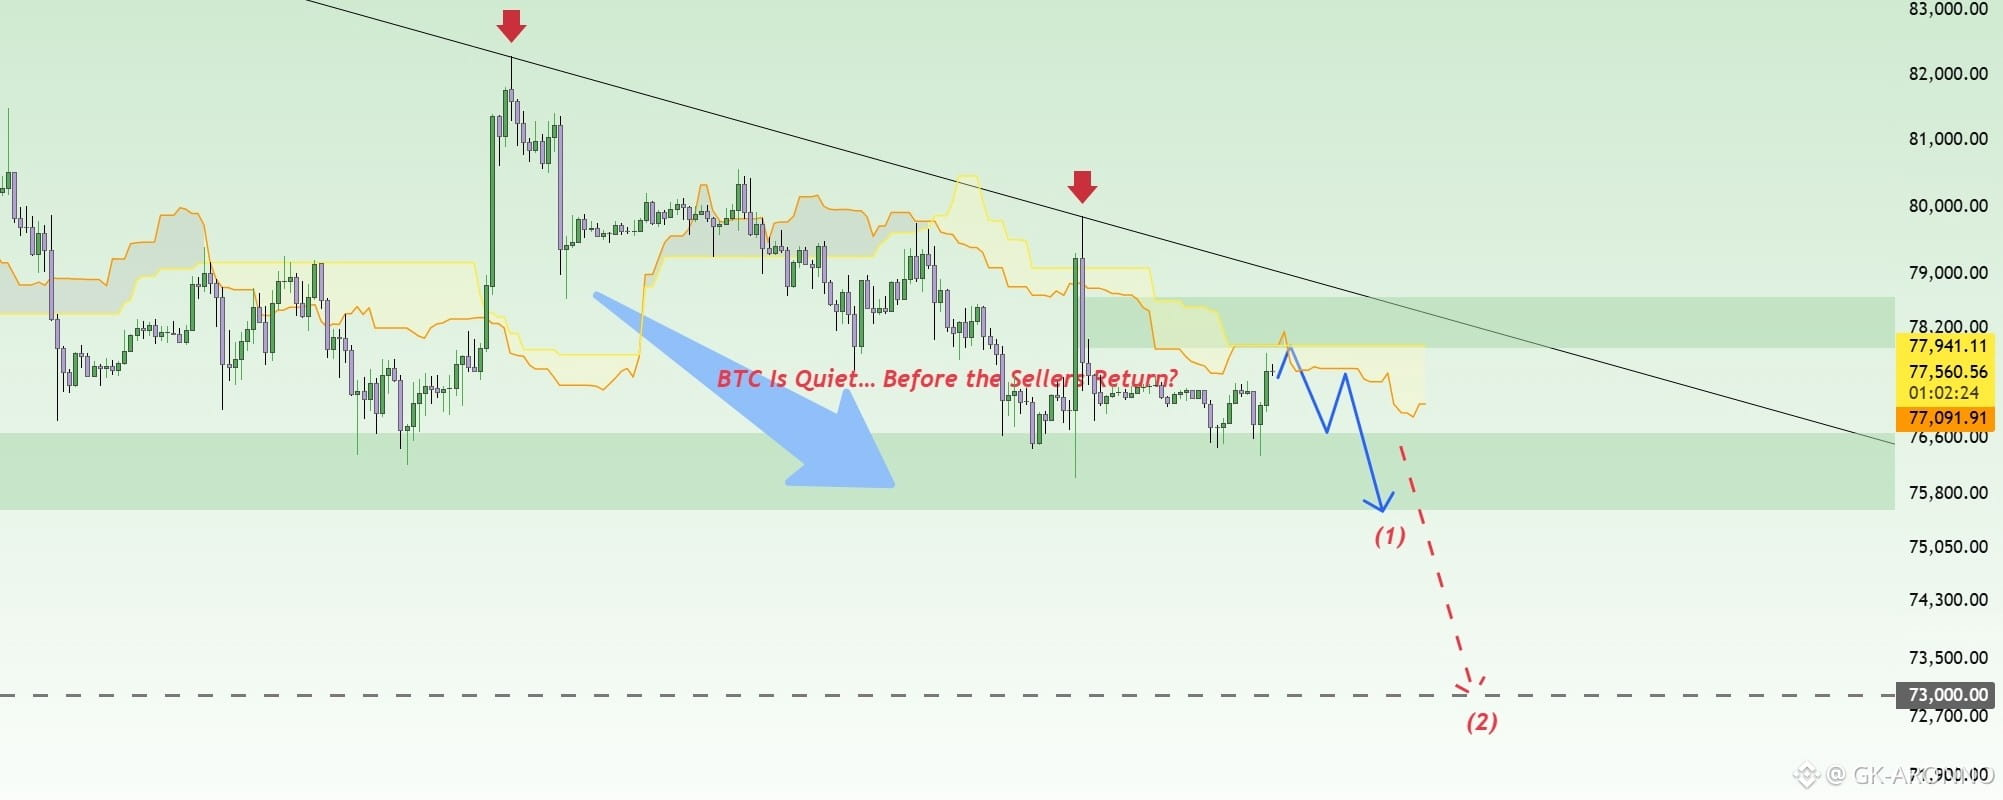
BTC Is Quiet… Before the Sellers Return?🔥📈At the moment, BTCUSD is maintaining a fairly clear and easy-to-read bearish structure. Price continues to be rejected by the descending trendline, forming lower highs while trading around or below the Ichimoku Cloud. The fact that recent rebounds have failed to break above the 77.9K–78.6K area suggests that buyers are still struggling, while selling pressure has yet to leave the market.
Combined with the recent macro backdrop, the picture increasingly favors sellers. Hotter-than-expected U.S. inflation has significantly increased expectations that the Fed could raise interest rates this week, while U.S. Treasury yields remain elevated. At the same time, Bitcoin ETF flows have weakened recently, with several consecutive sessions of net outflows. This is not an ideal environment for a liquidity-sensitive asset like Bitcoin, especially as the market enters a crucial week with the Fed’s policy decision ahead.
In the short term, if BTC remains capped below 77.9K–78.6K, I expect selling pressure to return. A loss of the current support area could send price toward 75.8K first; if bearish momentum continues to build, 73K would become the next major downside target to watch this week.
However, BTC is still trading near support, so short-term rebounds are entirely possible. In my view, these rallies are more likely to represent pullbacks within the bearish structure than a genuine trend reversal. As long as the descending trendline and overhead resistance remain intact, I continue to favor SELL setups on rebounds with confirmation.
$BTC
{future}(BTCUSDT)
BTC Is Quiet… Before the Sellers Return?🔥📈
At the moment, BTCUSD is maintaining a fairly clear and easy-to-read bearish structure. Price continues to be rejected by the descending trendline, forming lower highs while trading around or below the Ichimoku Cloud. The fact that recent rebounds have failed to break above the 77.9K–78.6K area suggests that buyers are still struggling, while selling pressure has yet to leave the market.
Combined with the recent macro backdrop, the picture increasingly favors sellers. Hotter-than-expected U.S. inflation has significantly increased expectations that the Fed could raise interest rates this week, while U.S. Treasury yields remain elevated. At the same time, Bitcoin ETF flows have weakened recently, with several consecutive sessions of net outflows. This is not an ideal environment for a liquidity-sensitive asset like Bitcoin, especially as the market enters a crucial week with the Fed’s policy decision ahead.
In the short term, if BTC remains capped below 77.9K–78.6K, I expect selling pressure to return. A loss of the current support area could send price toward 75.8K first; if bearish momentum continues to build, 73K would become the next major downside target to watch this week.
However, BTC is still trading near support, so short-term rebounds are entirely possible. In my view, these rallies are more likely to represent pullbacks within the bearish structure than a genuine trend reversal. As long as the descending trendline and overhead resistance remain intact, I continue to favor SELL setups on rebounds with confirmation.
$BTC
Combined with the recent macro backdrop, the picture increasingly favors sellers. Hotter-than-expected U.S. inflation has significantly increased expectations that the Fed could raise interest rates this week, while U.S. Treasury yields remain elevated. At the same time, Bitcoin ETF flows have weakened recently, with several consecutive sessions of net outflows. This is not an ideal environment for a liquidity-sensitive asset like Bitcoin, especially as the market enters a crucial week with the Fed’s policy decision ahead.
In the short term, if BTC remains capped below 77.9K–78.6K, I expect selling pressure to return. A loss of the current support area could send price toward 75.8K first; if bearish momentum continues to build, 73K would become the next major downside target to watch this week.
However, BTC is still trading near support, so short-term rebounds are entirely possible. In my view, these rallies are more likely to represent pullbacks within the bearish structure than a genuine trend reversal. As long as the descending trendline and overhead resistance remain intact, I continue to favor SELL setups on rebounds with confirmation.
$BTC
65
·
--
Artikel
Übersetzung ansehen
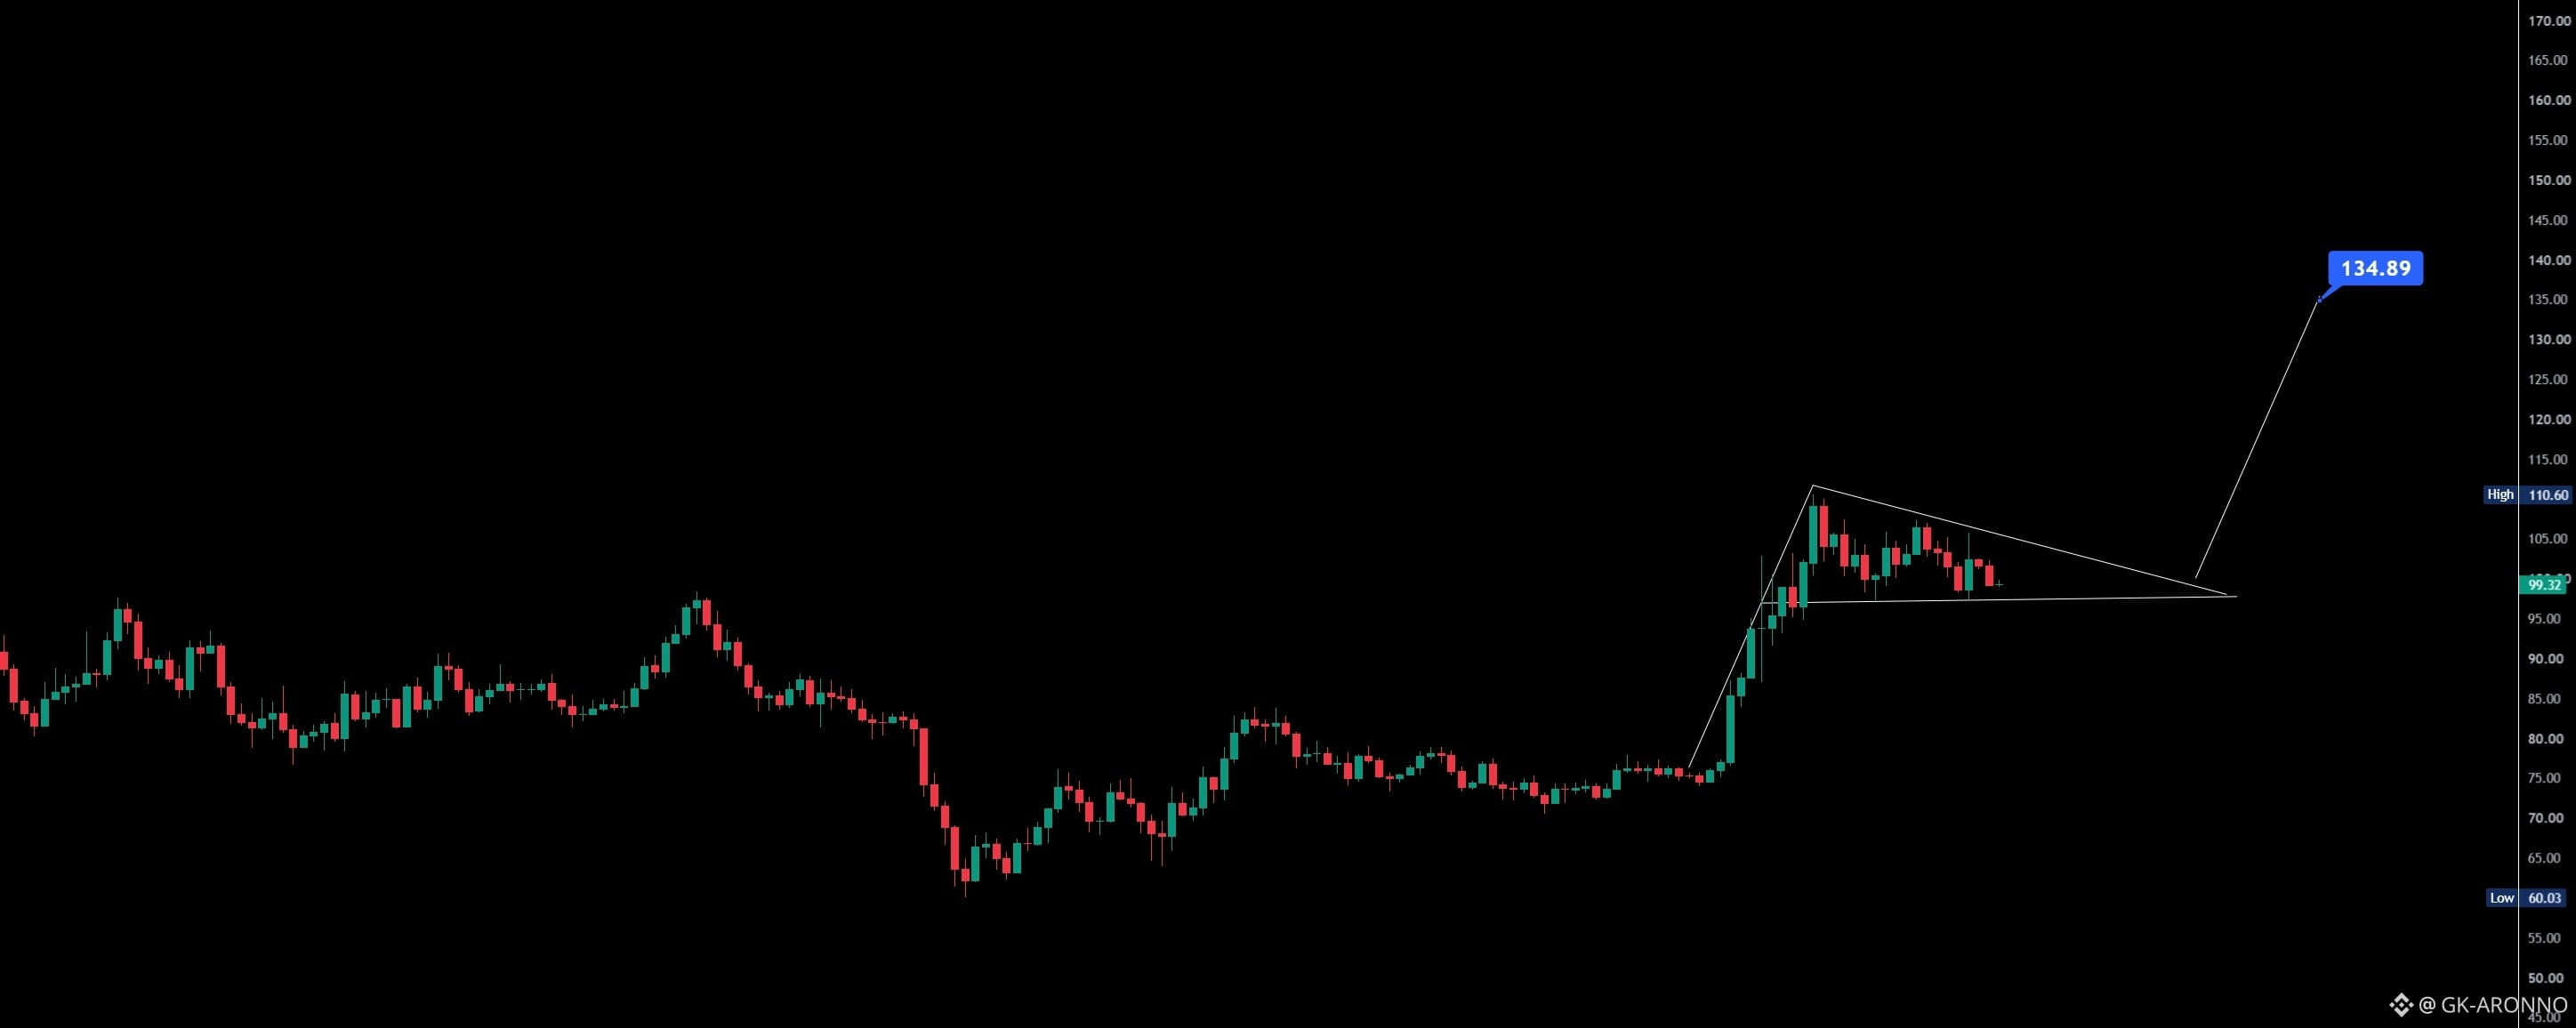
$SOLUSDT Descending Triangle⚡🔔🚀SOL/USDT Perpetual Contract is shown on the 1D timeframe.
Price is currently trading around the $99.44 zone, following a strong upward move toward the marked $110.60 high. The recent consolidation appears to be forming a descending triangle, with lower highs developing beneath a descending resistance trendline and horizontal support near $99.44.
The key support level is around $99.44. A sustained move below this level could invalidate the current bullish projection and signal further downside risk.
The descending trendline acts as the immediate breakout resistance zone, while the recent high near $110.60 remains an important resistance level to watch.
A breakout above the descending resistance trendline could provide confirmation of the upside setup. If confirmed, the chart projects a potential target near $134.89, representing an approximate 35% move from the current $99.44 price zone.
Watch for confirmation before considering the projected move, as failure to hold the $99.44 support could invalidate the setup.
$SOL
{future}(SOLUSDT)
SOL/USDT Perpetual Contract is shown on the 1D timeframe.
Price is currently trading around the $99.44 zone, following a strong upward move toward the marked $110.60 high. The recent consolidation appears to be forming a descending triangle, with lower highs developing beneath a descending resistance trendline and horizontal support near $99.44.
The key support level is around $99.44. A sustained move below this level could invalidate the current bullish projection and signal further downside risk.
The descending trendline acts as the immediate breakout resistance zone, while the recent high near $110.60 remains an important resistance level to watch.
A breakout above the descending resistance trendline could provide confirmation of the upside setup. If confirmed, the chart projects a potential target near $134.89, representing an approximate 35% move from the current $99.44 price zone.
Watch for confirmation before considering the projected move, as failure to hold the $99.44 support could invalidate the setup.
$SOLUSDT Descending Triangle⚡🔔🚀
SOL/USDT Perpetual Contract is shown on the 1D timeframe.
Price is currently trading around the $99.44 zone, following a strong upward move toward the marked $110.60 high. The recent consolidation appears to be forming a descending triangle, with lower highs developing beneath a descending resistance trendline and horizontal support near $99.44.
The key support level is around $99.44. A sustained move below this level could invalidate the current bullish projection and signal further downside risk.
The descending trendline acts as the immediate breakout resistance zone, while the recent high near $110.60 remains an important resistance level to watch.
A breakout above the descending resistance trendline could provide confirmation of the upside setup. If confirmed, the chart projects a potential target near $134.89, representing an approximate 35% move from the current $99.44 price zone.
Watch for confirmation before considering the projected move, as failure to hold the $99.44 support could invalidate the setup.
$SOL
SOL/USDT Perpetual Contract is shown on the 1D timeframe.
Price is currently trading around the $99.44 zone, following a strong upward move toward the marked $110.60 high. The recent consolidation appears to be forming a descending triangle, with lower highs developing beneath a descending resistance trendline and horizontal support near $99.44.
The key support level is around $99.44. A sustained move below this level could invalidate the current bullish projection and signal further downside risk.
The descending trendline acts as the immediate breakout resistance zone, while the recent high near $110.60 remains an important resistance level to watch.
A breakout above the descending resistance trendline could provide confirmation of the upside setup. If confirmed, the chart projects a potential target near $134.89, representing an approximate 35% move from the current $99.44 price zone.
Watch for confirmation before considering the projected move, as failure to hold the $99.44 support could invalidate the setup.
Price is currently trading around the $99.44 zone, following a strong upward move toward the marked $110.60 high. The recent consolidation appears to be forming a descending triangle, with lower highs developing beneath a descending resistance trendline and horizontal support near $99.44.
The key support level is around $99.44. A sustained move below this level could invalidate the current bullish projection and signal further downside risk.
The descending trendline acts as the immediate breakout resistance zone, while the recent high near $110.60 remains an important resistance level to watch.
A breakout above the descending resistance trendline could provide confirmation of the upside setup. If confirmed, the chart projects a potential target near $134.89, representing an approximate 35% move from the current $99.44 price zone.
Watch for confirmation before considering the projected move, as failure to hold the $99.44 support could invalidate the setup.
$SOL
SOL/USDT Perpetual Contract is shown on the 1D timeframe.
Price is currently trading around the $99.44 zone, following a strong upward move toward the marked $110.60 high. The recent consolidation appears to be forming a descending triangle, with lower highs developing beneath a descending resistance trendline and horizontal support near $99.44.
The key support level is around $99.44. A sustained move below this level could invalidate the current bullish projection and signal further downside risk.
The descending trendline acts as the immediate breakout resistance zone, while the recent high near $110.60 remains an important resistance level to watch.
A breakout above the descending resistance trendline could provide confirmation of the upside setup. If confirmed, the chart projects a potential target near $134.89, representing an approximate 35% move from the current $99.44 price zone.
Watch for confirmation before considering the projected move, as failure to hold the $99.44 support could invalidate the setup.
1
198
·
--
Artikel
Übersetzung ansehen
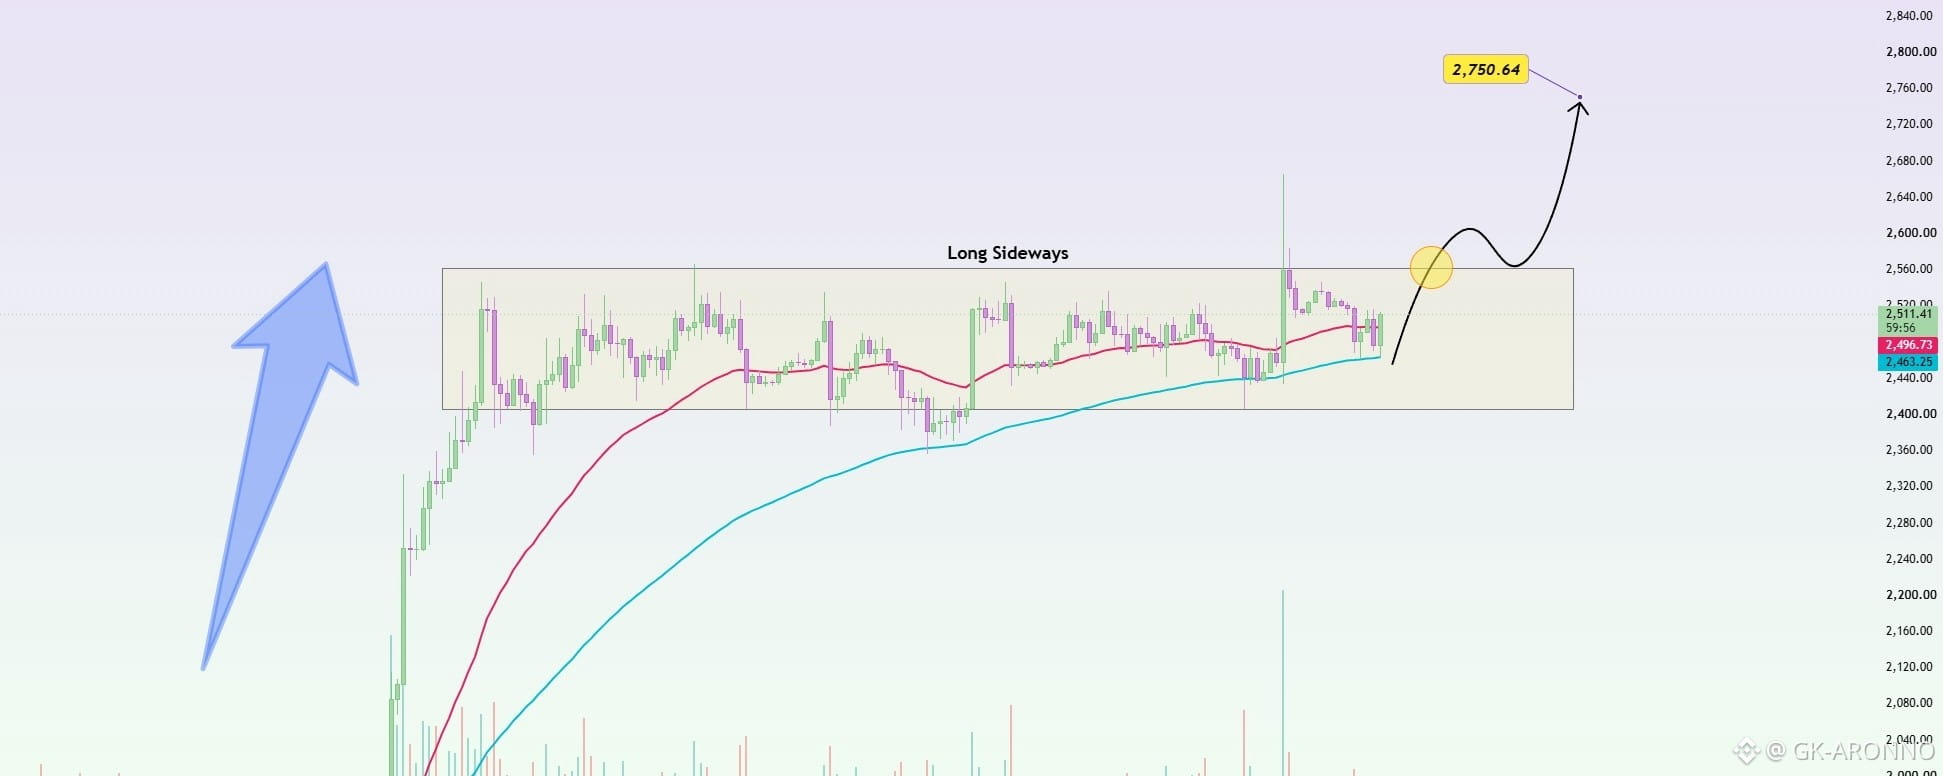
ETHUSDT: Bulls Hold Ground, Breakout Potential🔥📈ETHUSDT is trading around 2,511 USDT following weeks of consolidation within the 2,400–2,560 range. A positive sign is that the price remains above the EMA34 (approx. 2,468) and EMA89 (approx. 2,463), indicating that buyers have not lost the H4 market structure.
The 2,550–2,570 zone is currently critical. If ETH achieves a decisive breakout above the range's upper limit—followed by a retest where this area holds as support—I lean towards an extension to the 2,620–2,650 level before targeting the primary objective near 2,750 USDT.
There are also bright spots regarding ETH capital flows: FXStreet reports that US spot Ethereum ETFs have recently returned to a net inflow of approximately $34.7 million, while the daily structure remains positive relative to long-term EMAs.
The bullish scenario would weaken if ETH loses the 2,460 level, particularly if it drops back below the range low of 2,400.
$ETH
{future}(ETHUSDT)
ETHUSDT: Bulls Hold Ground, Breakout Potential🔥📈
ETHUSDT is trading around 2,511 USDT following weeks of consolidation within the 2,400–2,560 range. A positive sign is that the price remains above the EMA34 (approx. 2,468) and EMA89 (approx. 2,463), indicating that buyers have not lost the H4 market structure.
The 2,550–2,570 zone is currently critical. If ETH achieves a decisive breakout above the range's upper limit—followed by a retest where this area holds as support—I lean towards an extension to the 2,620–2,650 level before targeting the primary objective near 2,750 USDT.
There are also bright spots regarding ETH capital flows: FXStreet reports that US spot Ethereum ETFs have recently returned to a net inflow of approximately $34.7 million, while the daily structure remains positive relative to long-term EMAs.
The bullish scenario would weaken if ETH loses the 2,460 level, particularly if it drops back below the range low of 2,400.
$ETH
The 2,550–2,570 zone is currently critical. If ETH achieves a decisive breakout above the range's upper limit—followed by a retest where this area holds as support—I lean towards an extension to the 2,620–2,650 level before targeting the primary objective near 2,750 USDT.
There are also bright spots regarding ETH capital flows: FXStreet reports that US spot Ethereum ETFs have recently returned to a net inflow of approximately $34.7 million, while the daily structure remains positive relative to long-term EMAs.
The bullish scenario would weaken if ETH loses the 2,460 level, particularly if it drops back below the range low of 2,400.
$ETH
67
·
--
Artikel
Übersetzung ansehen
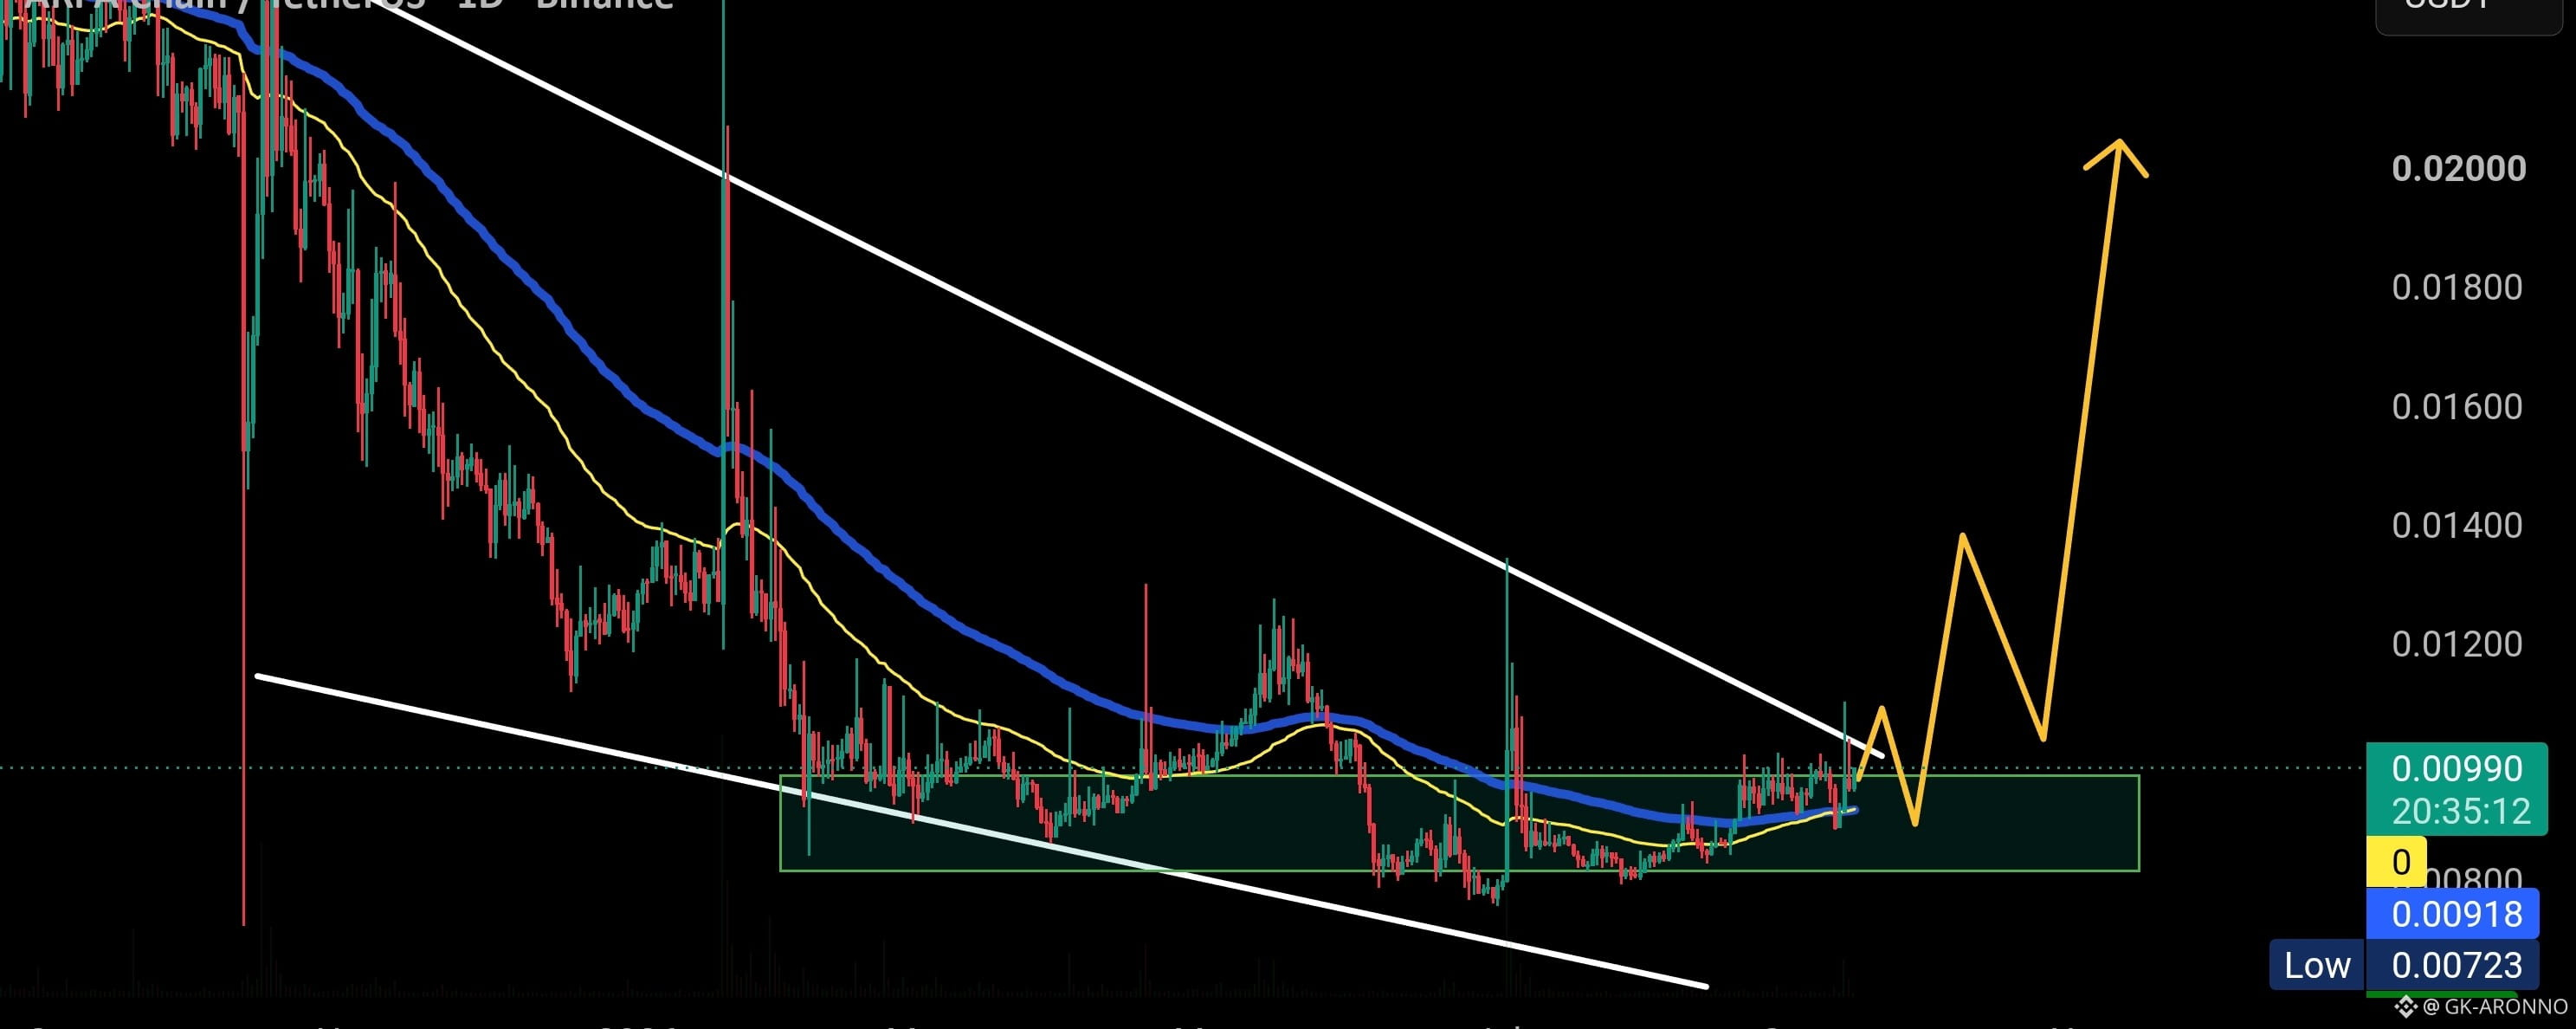
$ARPA has been building a base for months inside this accumulati✅♥️ARPA WATCHING THE BREAKOUT 👀
ARPA has been building a base for months inside this accumulation zone, and now price is pushing right into the long-term descending trendline.
The setup is getting interesting, but the breakout is NOT confirmed yet.
I want to see ARPA break and hold above the downtrend, ideally with a strong daily close. If that happens, the structure could finally start changing.
For now, I’m watching the breakout closely.
Breakout confirmed → $0.014 → $0.018 → $0.020+ 🎯
Until the trendline is broken and holds as support, I’m not calling it a breakout yet.
$ARB
$ARPA has been building a base for months inside this accumulati✅♥️
ARPA WATCHING THE BREAKOUT 👀
ARPA has been building a base for months inside this accumulation zone, and now price is pushing right into the long-term descending trendline.
The setup is getting interesting, but the breakout is NOT confirmed yet.
I want to see ARPA break and hold above the downtrend, ideally with a strong daily close. If that happens, the structure could finally start changing.
For now, I’m watching the breakout closely.
Breakout confirmed → $0.014 → $0.018 → $0.020+ 🎯
Until the trendline is broken and holds as support, I’m not calling it a breakout yet.
$ARB
ARPA has been building a base for months inside this accumulation zone, and now price is pushing right into the long-term descending trendline.
The setup is getting interesting, but the breakout is NOT confirmed yet.
I want to see ARPA break and hold above the downtrend, ideally with a strong daily close. If that happens, the structure could finally start changing.
For now, I’m watching the breakout closely.
Breakout confirmed → $0.014 → $0.018 → $0.020+ 🎯
Until the trendline is broken and holds as support, I’m not calling it a breakout yet.
$ARB
52
·
--
Artikel
Übersetzung ansehen
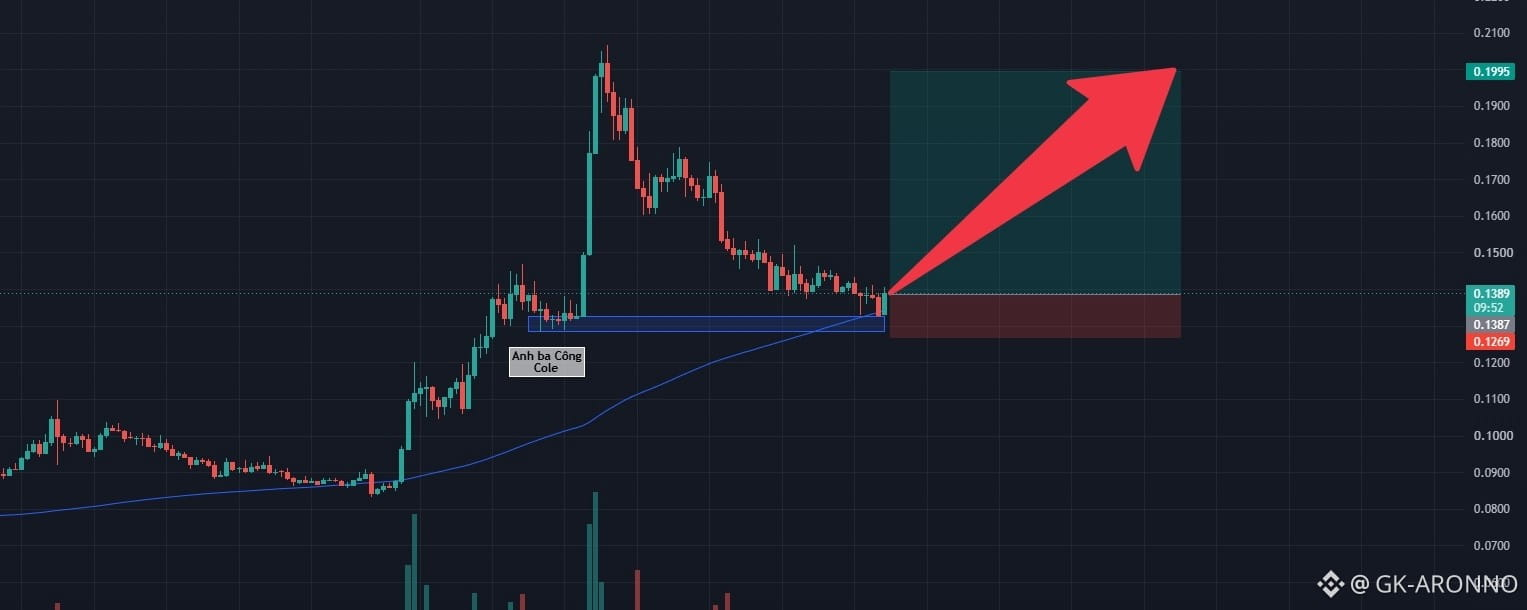
ARB: Defends Confluence Support at Dynamic MA100🔥📈⚡ARB: Defends Confluence Support at Dynamic MA100 – High-RR Breakout Long Targeting $0.200 Resistance Retest
Arbitrum (ARB) is presenting an optimal trend-continuation entry on the 4-hour timeframe as an extensive corrective pullback successfully retests foundational structural support. Following an aggressive vertical markup wave off historical lows that stalled beneath the critical $0.200 psychological round-number threshold, this orderly cool-off has effectively flushed out late momentum chasers to reset the broader macro trend.
Based on the visual data from the 4-hour chart , price action has landed squarely upon a major technical confluence zone around the $0.138–$0.139 pocket. This demand shelf represents the intersection of a former horizontal resistance zone flipped into support and the upward-sloping dynamic MA100 trendline. The active 4-hour candle near $0.1392 is printing clear lower-wick absorption alongside sharply contracting sell volume. This behavior verifies that sell-side distribution has thoroughly exhausted, while responsive institutional buyers actively step in to defend the baseline and safeguard the prevailing intermediate uptrend.
This technical framework presents an asymmetric trend-following Long execution opportunity featuring tight risk parameters. The optimal trading strategy is to initiate Long positions within the $0.1387–$0.1392 zone, placing a tight protective stop-loss parameter directly beneath the confluence cushion at $0.1269. The primary strategic take-profit objective targets the structural swing high across the $0.1995–$0.2000 resistance ceiling, securing an exceptional risk-to-reward ratio.
Disclaimer: This is not financial advice, DYOR.
$ARB
{future}(ARBUSDT)
ARB: Defends Confluence Support at Dynamic MA100🔥📈⚡
ARB: Defends Confluence Support at Dynamic MA100 – High-RR Breakout Long Targeting $0.200 Resistance Retest
Arbitrum (ARB) is presenting an optimal trend-continuation entry on the 4-hour timeframe as an extensive corrective pullback successfully retests foundational structural support. Following an aggressive vertical markup wave off historical lows that stalled beneath the critical $0.200 psychological round-number threshold, this orderly cool-off has effectively flushed out late momentum chasers to reset the broader macro trend.
Based on the visual data from the 4-hour chart , price action has landed squarely upon a major technical confluence zone around the $0.138–$0.139 pocket. This demand shelf represents the intersection of a former horizontal resistance zone flipped into support and the upward-sloping dynamic MA100 trendline. The active 4-hour candle near $0.1392 is printing clear lower-wick absorption alongside sharply contracting sell volume. This behavior verifies that sell-side distribution has thoroughly exhausted, while responsive institutional buyers actively step in to defend the baseline and safeguard the prevailing intermediate uptrend.
This technical framework presents an asymmetric trend-following Long execution opportunity featuring tight risk parameters. The optimal trading strategy is to initiate Long positions within the $0.1387–$0.1392 zone, placing a tight protective stop-loss parameter directly beneath the confluence cushion at $0.1269. The primary strategic take-profit objective targets the structural swing high across the $0.1995–$0.2000 resistance ceiling, securing an exceptional risk-to-reward ratio.
Disclaimer: This is not financial advice, DYOR.
$ARB
Arbitrum (ARB) is presenting an optimal trend-continuation entry on the 4-hour timeframe as an extensive corrective pullback successfully retests foundational structural support. Following an aggressive vertical markup wave off historical lows that stalled beneath the critical $0.200 psychological round-number threshold, this orderly cool-off has effectively flushed out late momentum chasers to reset the broader macro trend.
Based on the visual data from the 4-hour chart , price action has landed squarely upon a major technical confluence zone around the $0.138–$0.139 pocket. This demand shelf represents the intersection of a former horizontal resistance zone flipped into support and the upward-sloping dynamic MA100 trendline. The active 4-hour candle near $0.1392 is printing clear lower-wick absorption alongside sharply contracting sell volume. This behavior verifies that sell-side distribution has thoroughly exhausted, while responsive institutional buyers actively step in to defend the baseline and safeguard the prevailing intermediate uptrend.
This technical framework presents an asymmetric trend-following Long execution opportunity featuring tight risk parameters. The optimal trading strategy is to initiate Long positions within the $0.1387–$0.1392 zone, placing a tight protective stop-loss parameter directly beneath the confluence cushion at $0.1269. The primary strategic take-profit objective targets the structural swing high across the $0.1995–$0.2000 resistance ceiling, securing an exceptional risk-to-reward ratio.
Disclaimer: This is not financial advice, DYOR.
$ARB
56
Anmelden und weiter Inhalte entdecken
Krypto-Nutzer weltweit auf Binance Square kennenlernen
⚡️ Bleib in Sachen Krypto stets am Puls.
💬 Die weltgrößte Kryptobörse vertraut darauf.
👍 Erhalte verlässliche Einblicke von verifizierten Creators.
E-Mail-Adresse/Telefonnummer
Trendthemen
BitcoinHoldsAbove$77000
482 Aufrufe
41 Kommentare
#anthropicceocallsforaislowdown
🚨 $BTC HÄLT 77.000 $ WÄHREND DER MARKT SICH AUF BTC & ETH KONZENTRIERT! 🦅
Bitcoin respektiert die 4H-Trendlinie und hält das bullische Setup aktiv! 🎯
📍 Einstieg: 76.826 – 76.500
🎯 Ziele: 76.900 ➔ 77.000 ➔ 77.300
🛑 Stop-Loss: 76.400
⚠️ Strikte Regel: Das Setup ist nur gültig, solange die entscheidende Struktur hält. Das Verlassen des Stop-Bereichs macht den Trade ungültig.
⚡ Beobachtungswerte (Watchlist):
🪙 $BTC — Respektiert den wichtigen technischen Support vor makrogetriebiger Volatilität! 📈
🌐 $ETH — Konsolidiert eng um wichtige Nachfrageszonen für einen möglichen Ausbruch! 📊
Handhebel vorsichtig managen und warten, bis der Preis deine vorab definierte Jagdzone erreicht! 🛡️🧠
❓ Was ist dein nächster Schritt? Hier BTC long gehen oder auf niedrigere Einstiege warten? Poste deinen Plan unten! 👇
Haftungsausschluss: Informiere dich selbst (DYOR). Keine finanzielle Beratung.
#BitcoinHoldsAbove$77000
#AvalancheIntegratesIntoUAEPassDigitalVault
#AnthropicCEOCallsForAISlowdown
#BrazilCentralBankRaisesVASPCapitalRequirements
Hifza Rubab
·0 Likes
·51 Aufrufe
FedHikeOddsRiseTo89%
1,677 Aufrufe
104 Kommentare
BitcoinCrosses$78000
2,934 Aufrufe
134 Kommentare