
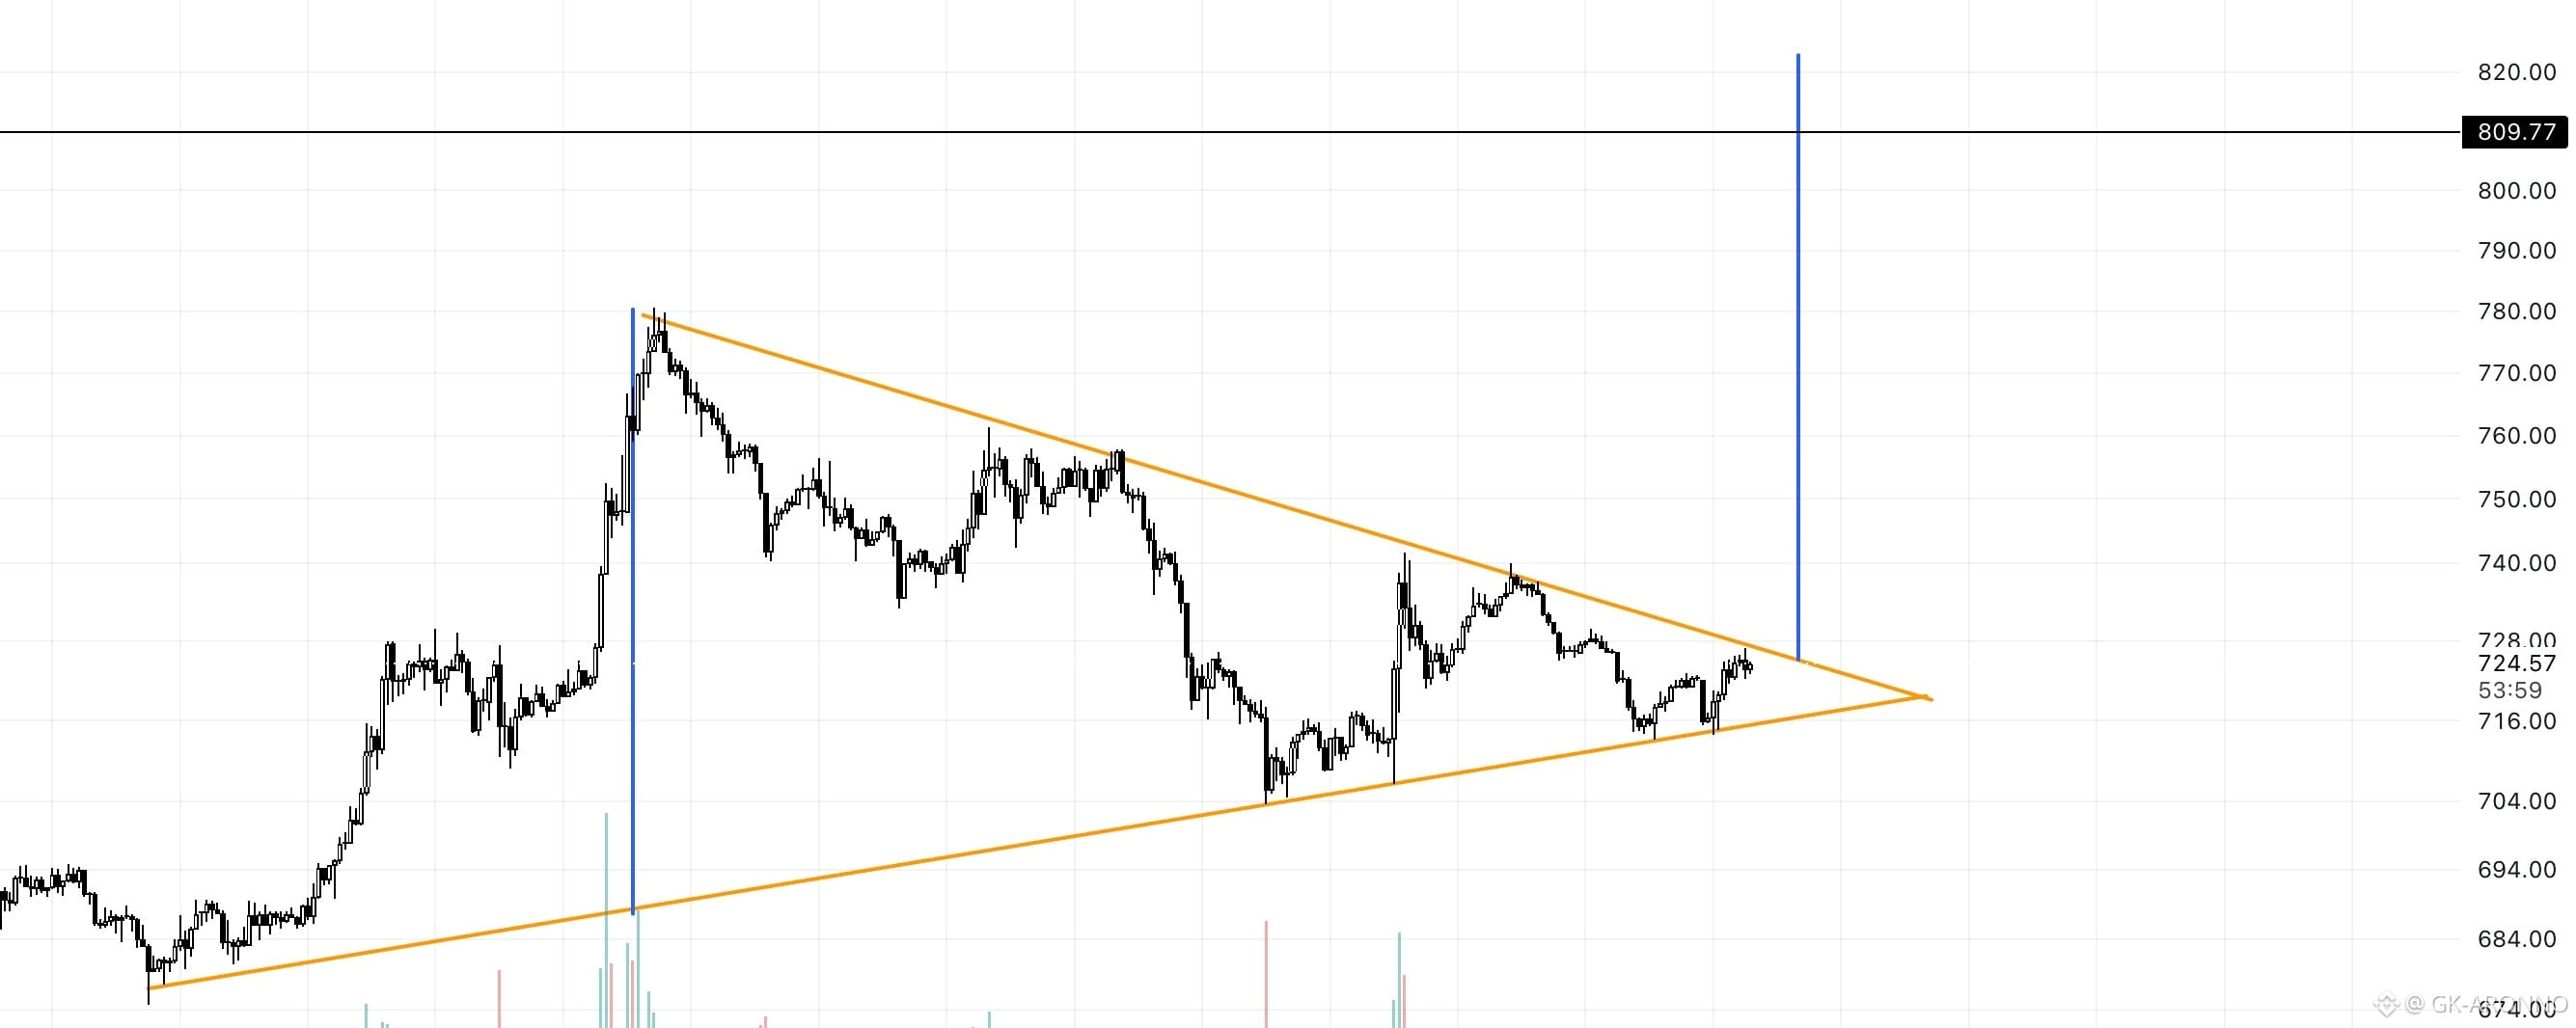

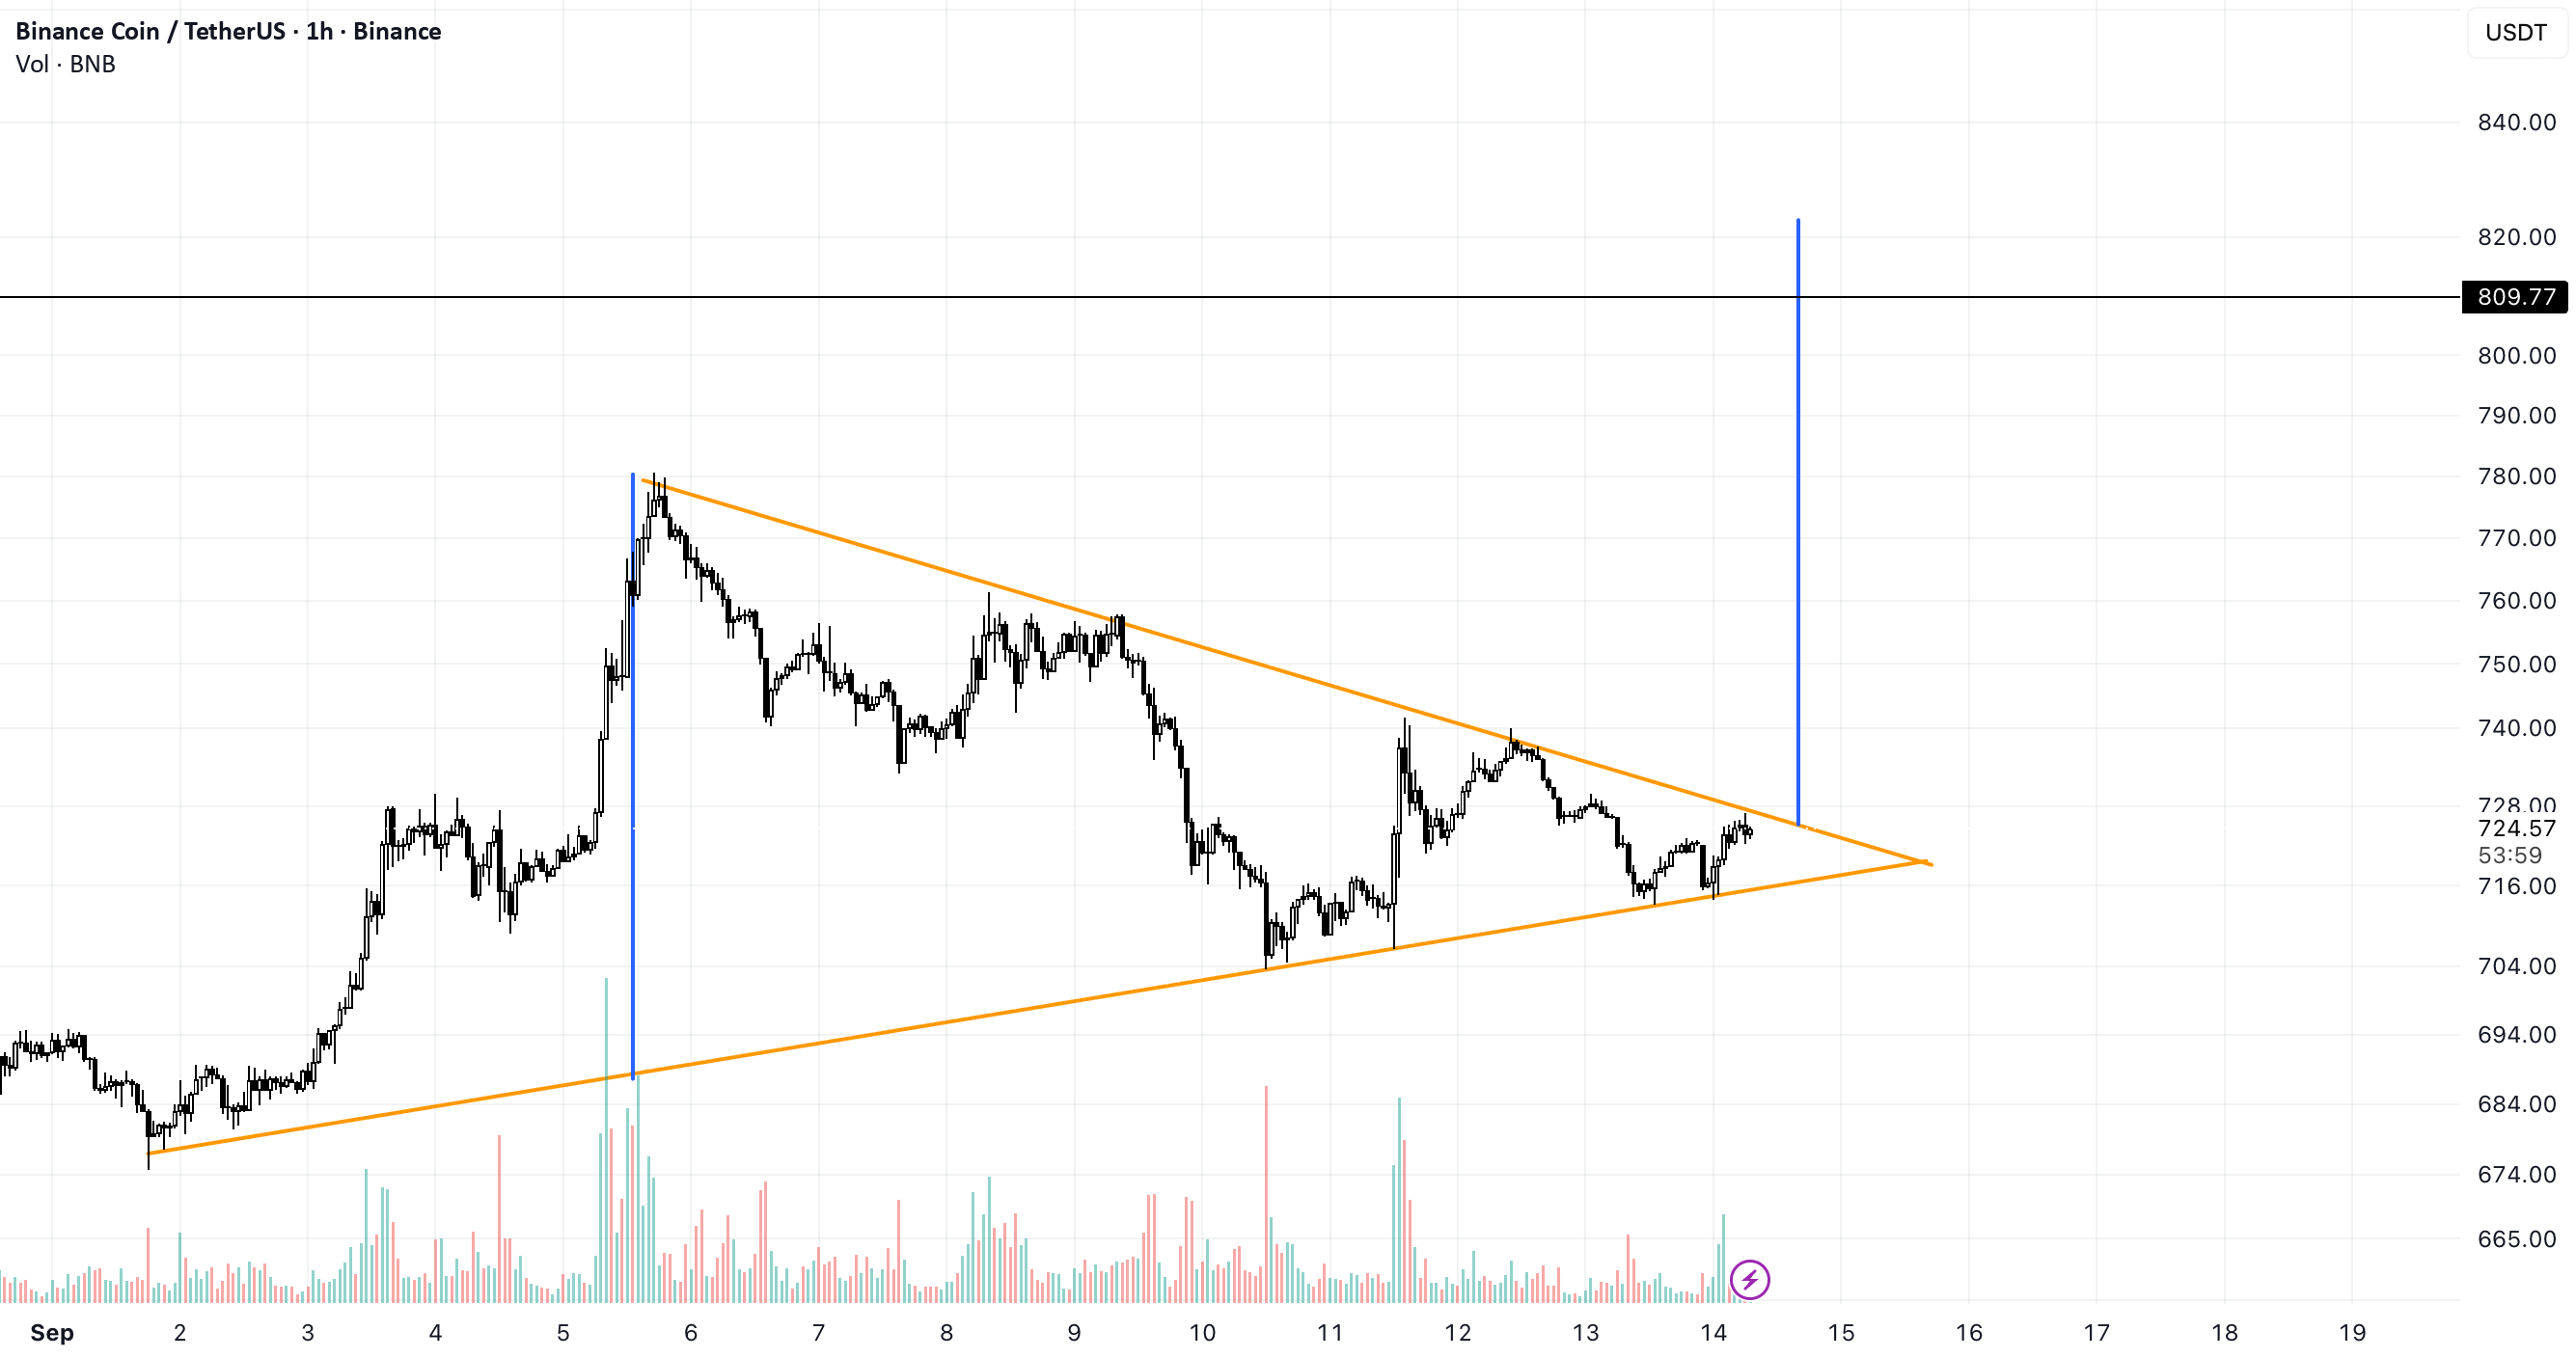
BNB/USDT is consolidating inside a large symmetrical triangle on the 1H chart, with price forming lower highs beneath descending resistance while maintaining higher lows along the rising support. The structure has tightened significantly, and price is now testing the upper boundary around $724–$726.
A confirmed breakout and hold above the descending trendline could trigger a bullish expansion toward the $809–$820 target area. A rejection from resistance would keep the triangle active, while a breakdown below the rising support around $714–$716 would weaken the bullish setup and increase the probability of further downside.

BNBUSDT
Perp
720.83
-0.52%