

Babar Markets
3 Beiträge

Babar Markets
Melden
Nutzer blockieren
Market Research & Analysis | Crypto & Digital Assets | Bitcoin | Trading Insights
Trade eröffnen
0 Tage
1 Following
3 Follower
0 Like gegeben
Beiträge
Portfolio
Übersetzung ansehen
$ETH
{spot}(ETHUSDT)
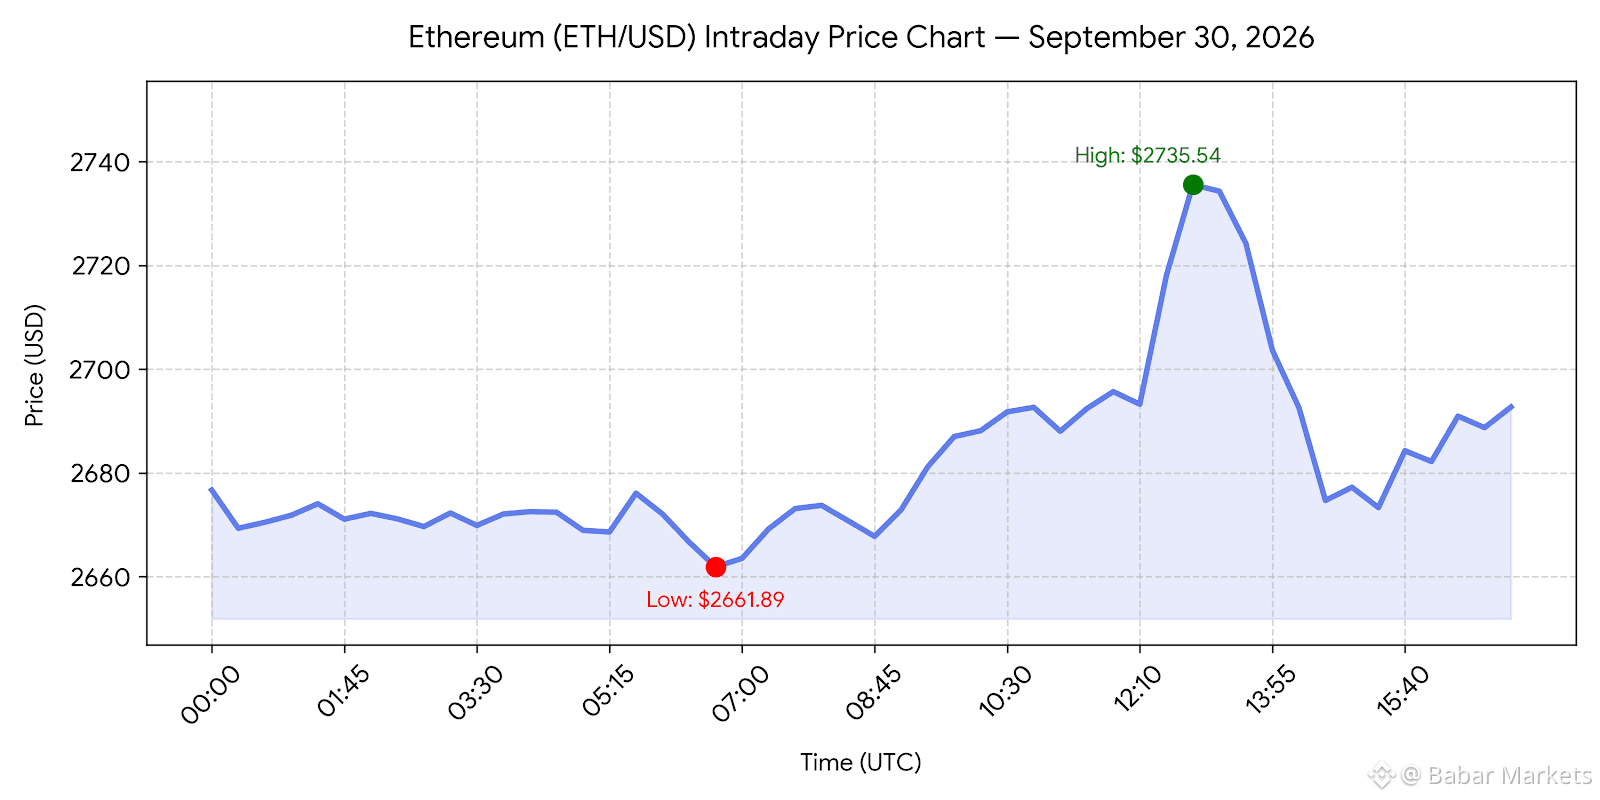
Ethereum (ETH) experienced moderate volatility today, trading in a range between $2,661.89 and $2,735.54 before settling near $2,692.71 (+0.60% intraday).
Key Market Statistics (September 30, 2026)
MetricValue (USD)NotesOpen$2,676.69Midnight UTC starting priceIntraday High$2,735.54Reached at 12:55 UTC during midday breakout attemptIntraday Low$2,661.89Reached at 06:35 UTC during early Asian tradingLatest Price$2,692.71Consolidating in upper band of daily channelIntraday Change+$16.02 (+0.60%)Modest net gain following afternoon rebalancing
Technical & Market Drivers
Midday Breakout & Rejection at Resistance
Following a quiet accumulation phase near $2,665, buying volume accelerated around 09:00 UTC, pushing ETH past $2,700 to an intraday high of $2,735.54. However, strong supply between $2,730 and $2,750 capped the move, triggering profit-taking.
Long Liquidations & Midday Pullback
The rapid reversal from $2,735 back down to $2,674 was exacerbated by short-term leverage unwinding, with over $8.4 million in long position liquidations across major derivative exchanges (Binance, OKX, Bybit).
Quarter-End Rebalancing & Key Levels
As September and Q3 come to a close, institutional fund rebalancing and ETF inflow dynamics have kept price action range-bound.
Immediate Support: $2,650 – $2,660 (day's low and rising trendline support).
Immediate Resistance: $2,735 – $2,750 (upper boundary of the recent rising wedge pattern). A sustained daily close above $2,750 is required to target the $2,800 psychological level.
#BitcoinClears$85200 #AltcoinSeasonIndexHoldsAbove60For5Days #USADPAdds90000JobsInSeptember #USCorePCEEasesTo3%InAugust #KospiPostsWorstQuarterSince2020
$ETH
Ethereum (ETH) experienced moderate volatility today, trading in a range between $2,661.89 and $2,735.54 before settling near $2,692.71 (+0.60% intraday).
Key Market Statistics (September 30, 2026)
MetricValue (USD)NotesOpen$2,676.69Midnight UTC starting priceIntraday High$2,735.54Reached at 12:55 UTC during midday breakout attemptIntraday Low$2,661.89Reached at 06:35 UTC during early Asian tradingLatest Price$2,692.71Consolidating in upper band of daily channelIntraday Change+$16.02 (+0.60%)Modest net gain following afternoon rebalancing
Technical & Market Drivers
Midday Breakout & Rejection at Resistance
Following a quiet accumulation phase near $2,665, buying volume accelerated around 09:00 UTC, pushing ETH past $2,700 to an intraday high of $2,735.54. However, strong supply between $2,730 and $2,750 capped the move, triggering profit-taking.
Long Liquidations & Midday Pullback
The rapid reversal from $2,735 back down to $2,674 was exacerbated by short-term leverage unwinding, with over $8.4 million in long position liquidations across major derivative exchanges (Binance, OKX, Bybit).
Quarter-End Rebalancing & Key Levels
As September and Q3 come to a close, institutional fund rebalancing and ETF inflow dynamics have kept price action range-bound.
Immediate Support: $2,650 – $2,660 (day's low and rising trendline support).
Immediate Resistance: $2,735 – $2,750 (upper boundary of the recent rising wedge pattern). A sustained daily close above $2,750 is required to target the $2,800 psychological level.
#BitcoinClears$85200 #AltcoinSeasonIndexHoldsAbove60For5Days #USADPAdds90000JobsInSeptember #USCorePCEEasesTo3%InAugust #KospiPostsWorstQuarterSince2020
Ethereum (ETH) experienced moderate volatility today, trading in a range between $2,661.89 and $2,735.54 before settling near $2,692.71 (+0.60% intraday).
Key Market Statistics (September 30, 2026)
MetricValue (USD)NotesOpen$2,676.69Midnight UTC starting priceIntraday High$2,735.54Reached at 12:55 UTC during midday breakout attemptIntraday Low$2,661.89Reached at 06:35 UTC during early Asian tradingLatest Price$2,692.71Consolidating in upper band of daily channelIntraday Change+$16.02 (+0.60%)Modest net gain following afternoon rebalancing
Technical & Market Drivers
Midday Breakout & Rejection at Resistance
Following a quiet accumulation phase near $2,665, buying volume accelerated around 09:00 UTC, pushing ETH past $2,700 to an intraday high of $2,735.54. However, strong supply between $2,730 and $2,750 capped the move, triggering profit-taking.
Long Liquidations & Midday Pullback
The rapid reversal from $2,735 back down to $2,674 was exacerbated by short-term leverage unwinding, with over $8.4 million in long position liquidations across major derivative exchanges (Binance, OKX, Bybit).
Quarter-End Rebalancing & Key Levels
As September and Q3 come to a close, institutional fund rebalancing and ETF inflow dynamics have kept price action range-bound.
Immediate Support: $2,650 – $2,660 (day's low and rising trendline support).
Immediate Resistance: $2,735 – $2,750 (upper boundary of the recent rising wedge pattern). A sustained daily close above $2,750 is required to target the $2,800 psychological level.
#BitcoinClears$85200 #AltcoinSeasonIndexHoldsAbove60For5Days #USADPAdds90000JobsInSeptember #USCorePCEEasesTo3%InAugust #KospiPostsWorstQuarterSince2020
62
$AAVE
{spot}(AAVEUSDT)
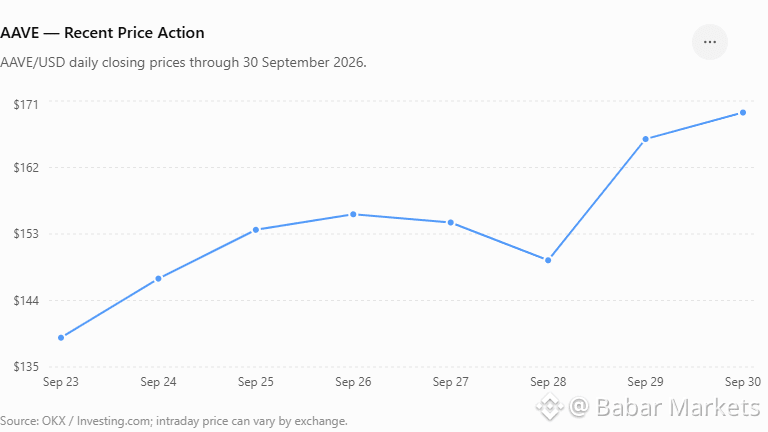
AAVE liegt derzeit bei etwa $169–$170, nachdem es gestern einen großen Sprung von ungefähr $146 auf $176 gemacht hat. Die heutige Kursbewegung ist relativ eng im Vergleich zur Volatilität von gestern.
Wichtige Kursmarken:
🟢 Unterstützung: $165 → $158 🔥 Widerstand: $176 → $185 🚀 Ausbruch über $185: könnte auf eine Fortsetzung des jüngsten Aufwärtsimpulses hindeuten. ⚠️ Ausbruch unter $158: würde eine zunehmende Schwäche im kurzfristigen Bereich signalisieren.
Marktüberblick
Der jüngste Anstieg wurde teilweise durch Diskussionen rund um Aavenomics 3.0 und einen möglichen AAVE-Token-Burn-Mechanismus getrieben. Außerdem hat Aave kürzlich die V4-Funktionalität erweitert, unter anderem mit Unterstützung für Coinbase tokenisierte Aktien als Sicherheiten auf Base.
Kurzfristiges Setup: 🟢 Bullisch, solange AAVE $158–165 hält, aber nach dem großen Move gestern wäre ein Rücksetzer/eine Konsolidierung nicht ungewöhnlich.
#EarningsSeason #SECChairWantsStockMarketsOnChain #CEARenamesToBNBStandardUnderBNC #AAVEUSDT.P
$AAVE
AAVE liegt derzeit bei etwa $169–$170, nachdem es gestern einen großen Sprung von ungefähr $146 auf $176 gemacht hat. Die heutige Kursbewegung ist relativ eng im Vergleich zur Volatilität von gestern.
Wichtige Kursmarken:
🟢 Unterstützung: $165 → $158 🔥 Widerstand: $176 → $185 🚀 Ausbruch über $185: könnte auf eine Fortsetzung des jüngsten Aufwärtsimpulses hindeuten. ⚠️ Ausbruch unter $158: würde eine zunehmende Schwäche im kurzfristigen Bereich signalisieren.
Marktüberblick
Der jüngste Anstieg wurde teilweise durch Diskussionen rund um Aavenomics 3.0 und einen möglichen AAVE-Token-Burn-Mechanismus getrieben. Außerdem hat Aave kürzlich die V4-Funktionalität erweitert, unter anderem mit Unterstützung für Coinbase tokenisierte Aktien als Sicherheiten auf Base.
Kurzfristiges Setup: 🟢 Bullisch, solange AAVE $158–165 hält, aber nach dem großen Move gestern wäre ein Rücksetzer/eine Konsolidierung nicht ungewöhnlich.
#EarningsSeason #SECChairWantsStockMarketsOnChain #CEARenamesToBNBStandardUnderBNC #AAVEUSDT.P
AAVE liegt derzeit bei etwa $169–$170, nachdem es gestern einen großen Sprung von ungefähr $146 auf $176 gemacht hat. Die heutige Kursbewegung ist relativ eng im Vergleich zur Volatilität von gestern.
Wichtige Kursmarken:
🟢 Unterstützung: $165 → $158 🔥 Widerstand: $176 → $185 🚀 Ausbruch über $185: könnte auf eine Fortsetzung des jüngsten Aufwärtsimpulses hindeuten. ⚠️ Ausbruch unter $158: würde eine zunehmende Schwäche im kurzfristigen Bereich signalisieren.
Marktüberblick
Der jüngste Anstieg wurde teilweise durch Diskussionen rund um Aavenomics 3.0 und einen möglichen AAVE-Token-Burn-Mechanismus getrieben. Außerdem hat Aave kürzlich die V4-Funktionalität erweitert, unter anderem mit Unterstützung für Coinbase tokenisierte Aktien als Sicherheiten auf Base.
Kurzfristiges Setup: 🟢 Bullisch, solange AAVE $158–165 hält, aber nach dem großen Move gestern wäre ein Rücksetzer/eine Konsolidierung nicht ungewöhnlich.
#EarningsSeason #SECChairWantsStockMarketsOnChain #CEARenamesToBNBStandardUnderBNC #AAVEUSDT.P
135
Übersetzung ansehen
$BTC
{spot}(BTCUSDT)
MARKET ANALYSIS | 30 SEPTEMBER 2026
Bitcoin is currently trading around the $83K–$84K zone, following a strong September move that pushed BTC above $87,000 before the recent pullback.
📊 KEY MARKET LEVELS
🔴 Resistance: $85,000–$87,000
A sustained move above this zone could bring the recent September high back into focus.
🟢 Support: Around $82,000
This is an important short-term level to monitor during the current consolidation.
🔵 Major psychological support: $80,000
A decisive break below this area could increase downside pressure.
💰 ETF FLOW UPDATE
U.S. spot Bitcoin ETFs recorded approximately $2.39 billion in net inflows for the week ended September 25, one of the strongest weekly inflow periods of 2026. However, daily inflows slowed significantly toward the end of the week.
🌍 MACRO FACTORS TO WATCH
• U.S. inflation/PCE data
• Treasury yields
• Federal Reserve rate expectations
• Continued Bitcoin ETF flows
• Overall risk sentiment in global markets
📈 MARKET STRUCTURE
BTC remains in a consolidation phase after its September rally. The key question is whether buyers can reclaim the $85K–$87K resistance area, or whether sellers push price back toward $82K and potentially $80K.
⚠️ Important: Bitcoin is highly volatile. Key levels are areas to monitor, not guaranteed price targets. This post is for educational purposes and is not financial advice.
#EarningsSeason #BitwiseLaunchesFirstSpotNEARETF #USJobOpeningsFallToFiveMonthLow #ECBToTestAIAgentsInDigitalEuroPayments #ECBToTestAIAgentsInDigitalEuroPayments
#Bitcoin #BTC #Crypto #Binance #BinanceSquare #BitcoinAnalysis #CryptoMarket #BTCUSDT #Trading #CryptoNews #Web3
$BTC
MARKET ANALYSIS | 30 SEPTEMBER 2026
Bitcoin is currently trading around the $83K–$84K zone, following a strong September move that pushed BTC above $87,000 before the recent pullback.
📊 KEY MARKET LEVELS
🔴 Resistance: $85,000–$87,000
A sustained move above this zone could bring the recent September high back into focus.
🟢 Support: Around $82,000
This is an important short-term level to monitor during the current consolidation.
🔵 Major psychological support: $80,000
A decisive break below this area could increase downside pressure.
💰 ETF FLOW UPDATE
U.S. spot Bitcoin ETFs recorded approximately $2.39 billion in net inflows for the week ended September 25, one of the strongest weekly inflow periods of 2026. However, daily inflows slowed significantly toward the end of the week.
🌍 MACRO FACTORS TO WATCH
• U.S. inflation/PCE data
• Treasury yields
• Federal Reserve rate expectations
• Continued Bitcoin ETF flows
• Overall risk sentiment in global markets
📈 MARKET STRUCTURE
BTC remains in a consolidation phase after its September rally. The key question is whether buyers can reclaim the $85K–$87K resistance area, or whether sellers push price back toward $82K and potentially $80K.
⚠️ Important: Bitcoin is highly volatile. Key levels are areas to monitor, not guaranteed price targets. This post is for educational purposes and is not financial advice.
#EarningsSeason #BitwiseLaunchesFirstSpotNEARETF #USJobOpeningsFallToFiveMonthLow #ECBToTestAIAgentsInDigitalEuroPayments #ECBToTestAIAgentsInDigitalEuroPayments
#Bitcoin #BTC #Crypto #Binance #BinanceSquare #BitcoinAnalysis #CryptoMarket #BTCUSDT #Trading #CryptoNews #Web3
MARKET ANALYSIS | 30 SEPTEMBER 2026
Bitcoin is currently trading around the $83K–$84K zone, following a strong September move that pushed BTC above $87,000 before the recent pullback.
📊 KEY MARKET LEVELS
🔴 Resistance: $85,000–$87,000
A sustained move above this zone could bring the recent September high back into focus.
🟢 Support: Around $82,000
This is an important short-term level to monitor during the current consolidation.
🔵 Major psychological support: $80,000
A decisive break below this area could increase downside pressure.
💰 ETF FLOW UPDATE
U.S. spot Bitcoin ETFs recorded approximately $2.39 billion in net inflows for the week ended September 25, one of the strongest weekly inflow periods of 2026. However, daily inflows slowed significantly toward the end of the week.
🌍 MACRO FACTORS TO WATCH
• U.S. inflation/PCE data
• Treasury yields
• Federal Reserve rate expectations
• Continued Bitcoin ETF flows
• Overall risk sentiment in global markets
📈 MARKET STRUCTURE
BTC remains in a consolidation phase after its September rally. The key question is whether buyers can reclaim the $85K–$87K resistance area, or whether sellers push price back toward $82K and potentially $80K.
⚠️ Important: Bitcoin is highly volatile. Key levels are areas to monitor, not guaranteed price targets. This post is for educational purposes and is not financial advice.
#EarningsSeason #BitwiseLaunchesFirstSpotNEARETF #USJobOpeningsFallToFiveMonthLow #ECBToTestAIAgentsInDigitalEuroPayments #ECBToTestAIAgentsInDigitalEuroPayments
#Bitcoin #BTC #Crypto #Binance #BinanceSquare #BitcoinAnalysis #CryptoMarket #BTCUSDT #Trading #CryptoNews #Web3
86
Anmelden und weiter Inhalte entdecken
Krypto-Nutzer weltweit auf Binance Square kennenlernen
⚡️ Bleib in Sachen Krypto stets am Puls.
💬 Die weltgrößte Kryptobörse vertraut darauf.
👍 Erhalte verlässliche Einblicke von verifizierten Creators.
E-Mail-Adresse/Telefonnummer
Trendthemen
BitcoinClears$85200
6,344 Aufrufe
172 Kommentare
Wir haben die Bewegung bekommen, und $BTC steht genau dort, wo wir vorher die Daten hatten. So sieht echte Geduld für einen Trade aus.
Die Daten kamen gemischt rein, aber mit ein paar wichtigen Zahlen. ADP Non-Farm Employment Change lag bei 90K gegenüber 73K Prognose, während Core PCE bei 0,2% gegenüber den erwarteten 0,3% lag. Das finale BIP war ebenfalls stärker bei 2,2% gegenüber 1,5% Prognose, während Personal Spending bei 0,9% gegenüber den erwarteten 0,8% lag. Gleichzeitig verfehlte Personal Income mit 0,2% gegenüber 0,5% Prognose.
BTC ist zunächst auf 85.600 $ gestiegen und ist jetzt wieder dort, wo es hingehört. Ich schaue immer noch in Richtung der unteren Bereiche bei 82.759 $ und der 80.000 $-Liquidität, weil die übergeordnete Liquidität erledigt und abgehakt ist.
Wir hatten während der Daten eine Live-Session, und in dieser Session haben wir den Markt bei 83.800 $ gesehen, dann bei 85.600 $ und anschließend wieder in Richtung 83.000 $ – und wir sind trotzdem nicht in einen Trade eingestiegen.
So sieht Geduld aus.
Wir können keinen Einstieg erzwingen, wenn der Markt keine klare Richtung hat. Der gleiche Bereich ist weiterhin im Fokus, und wir warten darauf, dass der Markt uns das Setup gibt.
Lasst mich wissen, Jungs: Wie war die Session? Und sollten wir mehr reguläre Sessions mit unseren geschätzten Mitgliedern machen, damit wir ordentliche Diskussionen über den Markt führen können?
#BitcoinClears$85200 #AltcoinSeasonIndexHoldsAbove60For5Days #USADPAdds90000JobsInSeptember #BitcoinSlipsBelow$84000 #SECToClarifyOnChainFundraisingRules
Crypto_LUX
·24 Likes
·12.7k Aufrufe
AltcoinSeasonIndexHoldsAbove60For5Days
35,569 Aufrufe
959 Kommentare
USADPAdds90000JobsInSeptember
15,885 Aufrufe
545 Kommentare