

Crypto Signals and Analysis
58 Postlar
Crypto Signals and Analysis
Shikoyat qilish
Foydalanuvchini bloklash
Crypto trading signals and market analysis. We identify key levels, clear entry points, and defined targets with a disciplined focus on risk management.
Ochiq savdo
Tez-tez savdo qiluvchi
3.4 yil
2 Kuzatilmoqda
37 Kuzatuvchilar
55 Yoqdi
Postlar
Portfel
·
--
O‘suvchi
Tarjimani ko‘rish
$TRUMP Price Prediction Today (Oct 28, Evening Update): Official Trump Crypto Signal & Technical Analysis 📊
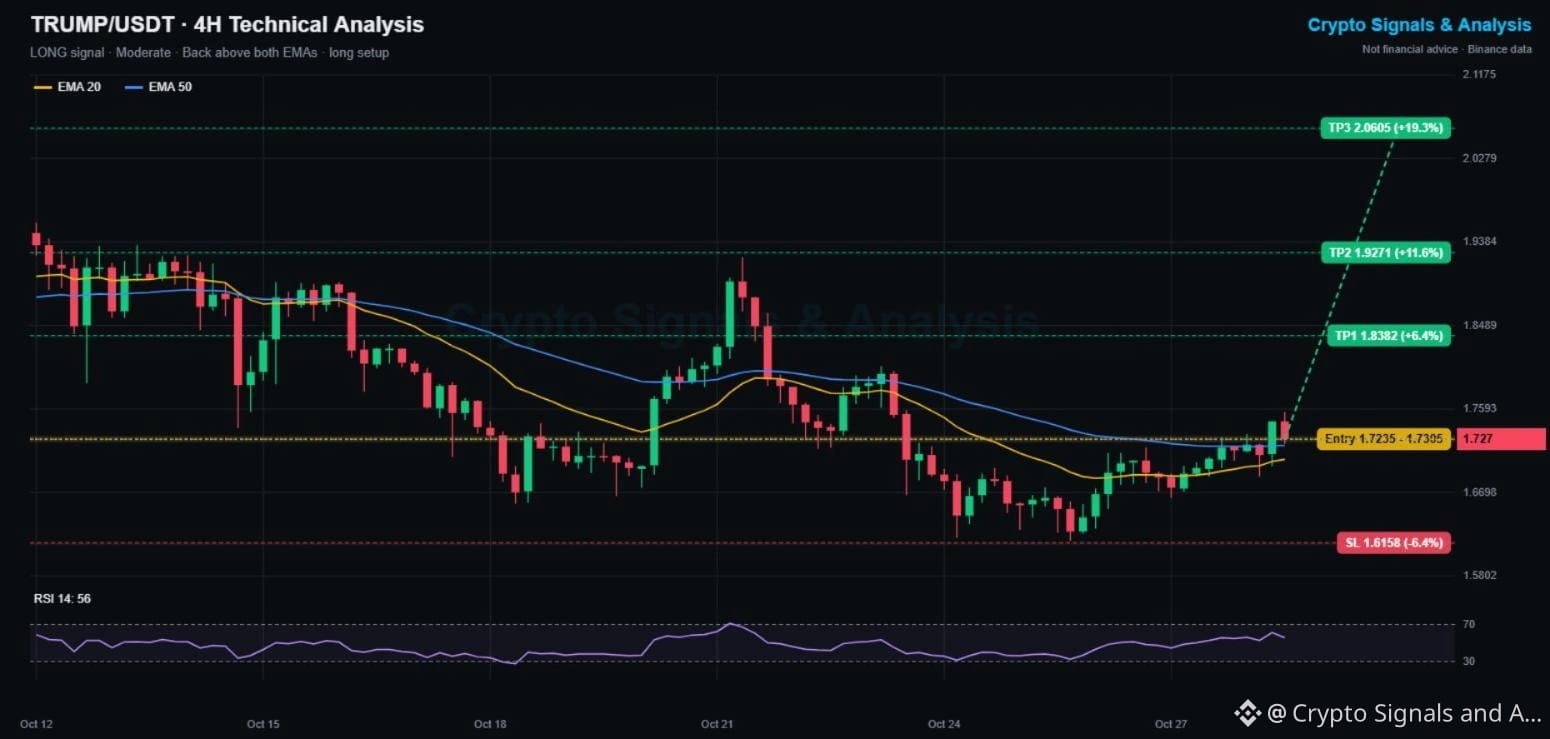
🟢 LONG | Entry 1.7235 - 1.7305 | TP1 1.8382 | SL 1.6158
👉 Tap $TRUMP to place your trade fast
🕒 Updated: Oct 28, 20:52 UTC · price 1.727
Official Trump bounced off 1.618 (its lowest level in over two weeks) and just reclaimed both 4H moving averages. With memes leading tonight, this is its first real trend shift since Oct 22.
📌 OFFICIAL TRUMP TRADING SIGNAL (Moderate, 4/5 signals agree)
Entry: 1.7235 - 1.7305
Take profit 1: 1.8382 (+6.4%)
Take profit 2: 1.9271 (+11.6%)
Take profit 3: 2.0605 (+19.3%)
Stop loss: 1.6158 (-6.4%)
📊 TRUMP TECHNICAL ANALYSIS (4H CHART)
Price is above the EMA20 (1.705) and EMA50 (1.720), and the EMA20 has turned up. RSI at 56 favors buyers. The one bearish check: it is still down 6.5% on the week, so this is an early reversal, not a confirmed trend.
🔑 KEY LEVELS
Support: 1.705 (EMA20), then 1.618
Resistance: 1.756, then 1.84 and 1.93
📈 Bullish scenario: a 4H close above 1.756 opens TP1 at 1.838.
📉 Bearish scenario: losing 1.70 puts the 1.618 low back in play. A close under 1.6158 cancels this signal.
💡 Bottom line: good risk/reward off a fresh low, but size small until 1.756 breaks.
👉 Tap $TRUMP
to open the live chart. NFA
🔥 TRADE WITH LOWER FEES
✅ Get a 10% kickback on your Binance Futures trading fees
👇👇👇
{spot}(TRUMPUSDT)
[Claim your 10% Futures fee kickback here](https://www.binance.com/join?ref=SQUAREGINOS)
━━━━━━━━━━
Real reversal or just a dead-cat bounce? Vote below 👇
Follow Crypto Signals and Analysis for daily signals.
#cryptosignals #TRUMP #FOMCWatch
⚠️ Crypto is volatile: risk only what you can afford to lose.
$TRUMP Price Prediction Today (Oct 28, Evening Update): Official Trump Crypto Signal & Technical Analysis 📊
🟢 LONG | Entry 1.7235 - 1.7305 | TP1 1.8382 | SL 1.6158
👉 Tap $TRUMP to place your trade fast
🕒 Updated: Oct 28, 20:52 UTC · price 1.727
Official Trump bounced off 1.618 (its lowest level in over two weeks) and just reclaimed both 4H moving averages. With memes leading tonight, this is its first real trend shift since Oct 22.
📌 OFFICIAL TRUMP TRADING SIGNAL (Moderate, 4/5 signals agree)
Entry: 1.7235 - 1.7305
Take profit 1: 1.8382 (+6.4%)
Take profit 2: 1.9271 (+11.6%)
Take profit 3: 2.0605 (+19.3%)
Stop loss: 1.6158 (-6.4%)
📊 TRUMP TECHNICAL ANALYSIS (4H CHART)
Price is above the EMA20 (1.705) and EMA50 (1.720), and the EMA20 has turned up. RSI at 56 favors buyers. The one bearish check: it is still down 6.5% on the week, so this is an early reversal, not a confirmed trend.
🔑 KEY LEVELS
Support: 1.705 (EMA20), then 1.618
Resistance: 1.756, then 1.84 and 1.93
📈 Bullish scenario: a 4H close above 1.756 opens TP1 at 1.838.
📉 Bearish scenario: losing 1.70 puts the 1.618 low back in play. A close under 1.6158 cancels this signal.
💡 Bottom line: good risk/reward off a fresh low, but size small until 1.756 breaks.
👉 Tap $TRUMP
to open the live chart. NFA
🔥 TRADE WITH LOWER FEES
✅ Get a 10% kickback on your Binance Futures trading fees
👇👇👇
Claim your 10% Futures fee kickback here
━━━━━━━━━━
Real reversal or just a dead-cat bounce? Vote below 👇
Follow Crypto Signals and Analysis for daily signals.
#cryptosignals #TRUMP #FOMCWatch
⚠️ Crypto is volatile: risk only what you can afford to lose.
·
--
Pasayuvchi
Tarjimani ko‘rish
$CRV Price Prediction Today (Oct 28, Evening Update): Curve DAO Crypto Signal & Technical Analysis 📊
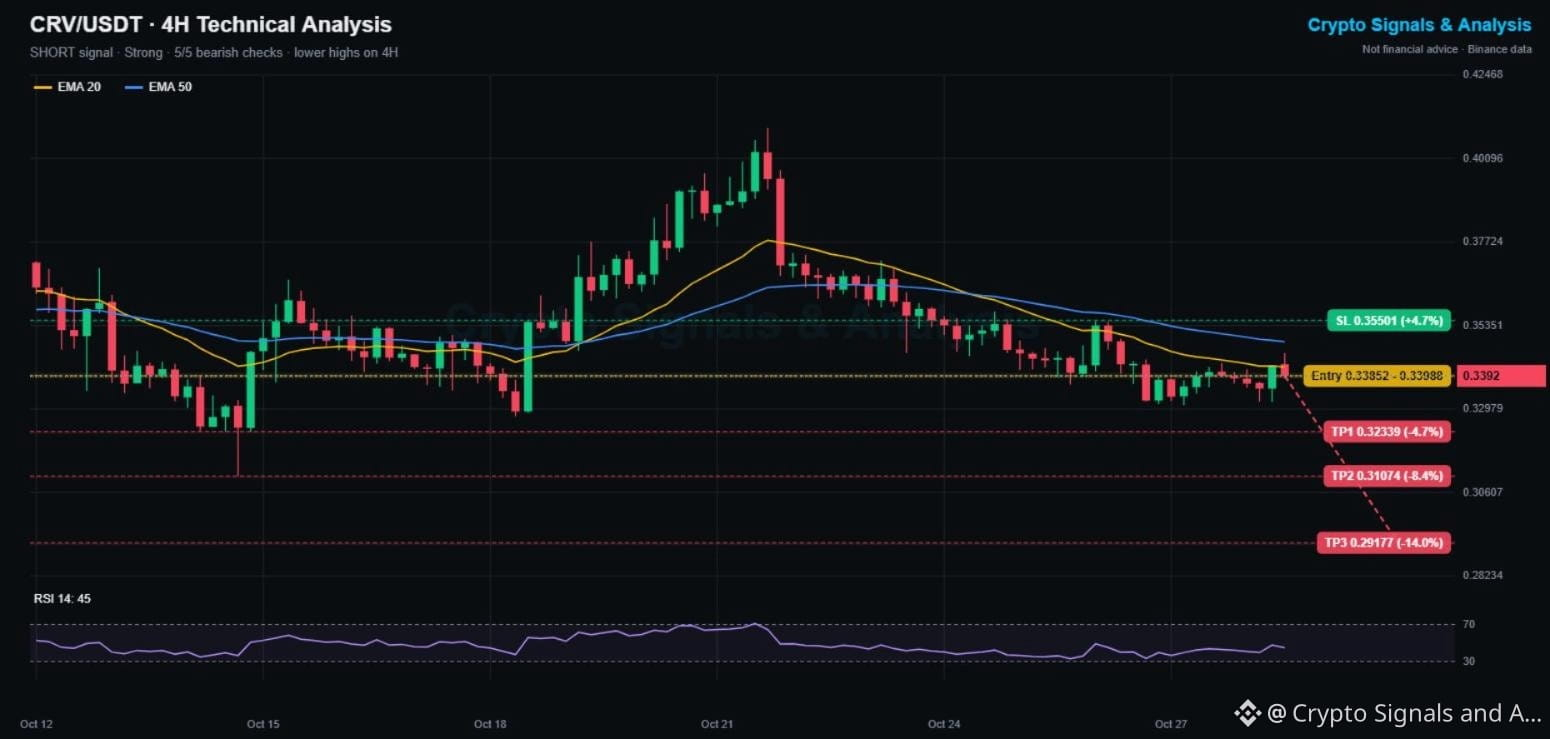
🔴 SHORT | Entry 0.3385 - 0.3399 | TP1 0.3234 | SL 0.3550
👉 Tap $CRV to place your trade fast
🕒 Updated: Oct 28, 20:35 UTC · price 0.3392
Curve DAO is one of the weakest large DeFi tokens this week: down 15.8% in 7 days and flat today while memes rally. Since the Oct 21 rejection near 0.41, every 4H bounce has made a lower high.
📌 CURVE DAO TRADING SIGNAL (Strong, 5/5 signals agree)
Entry: 0.3385 - 0.3399
Take profit 1: 0.3234 (-4.7%)
Take profit 2: 0.3107 (-8.4%)
Take profit 3: 0.2918 (-14.0%)
Stop loss: 0.3550 (+4.7%)
📊 CRV TECHNICAL ANALYSIS (4H CHART)
Price is below the EMA20 (0.3417) and EMA50 (0.3489), and both are sloping down. RSI at 45 shows sellers in control without being oversold. The latest bounce died right at the EMA20.
🔑 KEY LEVELS
Support: 0.331, then 0.311 (Oct 18 low)
Resistance: 0.342 (EMA20), then 0.355
📉 Bearish scenario: a 4H close under 0.331 opens TP1 and the 0.311 low.
📈 Bullish scenario: reclaiming 0.349 (EMA50) flips the bias. A close above 0.3550 cancels this signal.
💡 Bottom line: trend, momentum and weekly change all point down. Respect the stop.
👉 Tap $CRV
to open the live chart. NFA
🔥 TRADE WITH LOWER FEES
✅ Get a 10% kickback on your Binance Futures trading fees
👇👇👇
{spot}(CRVUSDT)
[Claim your 10% Futures fee kickback here](https://www.binance.com/join?ref=SQUAREGINOS)
━━━━━━━━━━
Is DeFi bleeding out, or is Curve DAO close to a bottom? 👇
Follow Crypto Signals and Analysis for daily signals.
#cryptosignals #CRV #FOMCWatch
⚠️ Crypto is volatile: risk only what you can afford to lose.
$CRV Price Prediction Today (Oct 28, Evening Update): Curve DAO Crypto Signal & Technical Analysis 📊
🔴 SHORT | Entry 0.3385 - 0.3399 | TP1 0.3234 | SL 0.3550
👉 Tap $CRV to place your trade fast
🕒 Updated: Oct 28, 20:35 UTC · price 0.3392
Curve DAO is one of the weakest large DeFi tokens this week: down 15.8% in 7 days and flat today while memes rally. Since the Oct 21 rejection near 0.41, every 4H bounce has made a lower high.
📌 CURVE DAO TRADING SIGNAL (Strong, 5/5 signals agree)
Entry: 0.3385 - 0.3399
Take profit 1: 0.3234 (-4.7%)
Take profit 2: 0.3107 (-8.4%)
Take profit 3: 0.2918 (-14.0%)
Stop loss: 0.3550 (+4.7%)
📊 CRV TECHNICAL ANALYSIS (4H CHART)
Price is below the EMA20 (0.3417) and EMA50 (0.3489), and both are sloping down. RSI at 45 shows sellers in control without being oversold. The latest bounce died right at the EMA20.
🔑 KEY LEVELS
Support: 0.331, then 0.311 (Oct 18 low)
Resistance: 0.342 (EMA20), then 0.355
📉 Bearish scenario: a 4H close under 0.331 opens TP1 and the 0.311 low.
📈 Bullish scenario: reclaiming 0.349 (EMA50) flips the bias. A close above 0.3550 cancels this signal.
💡 Bottom line: trend, momentum and weekly change all point down. Respect the stop.
👉 Tap $CRV
to open the live chart. NFA
🔥 TRADE WITH LOWER FEES
✅ Get a 10% kickback on your Binance Futures trading fees
👇👇👇
Claim your 10% Futures fee kickback here
━━━━━━━━━━
Is DeFi bleeding out, or is Curve DAO close to a bottom? 👇
Follow Crypto Signals and Analysis for daily signals.
#cryptosignals #CRV #FOMCWatch
⚠️ Crypto is volatile: risk only what you can afford to lose.
1
·
--
O‘suvchi
Tarjimani ko‘rish
$PEPE Price Prediction Today (Oct 28, Evening Update): PEPE Leads Binance Gainers +12%, Morning Signal Hits TP1 🚀
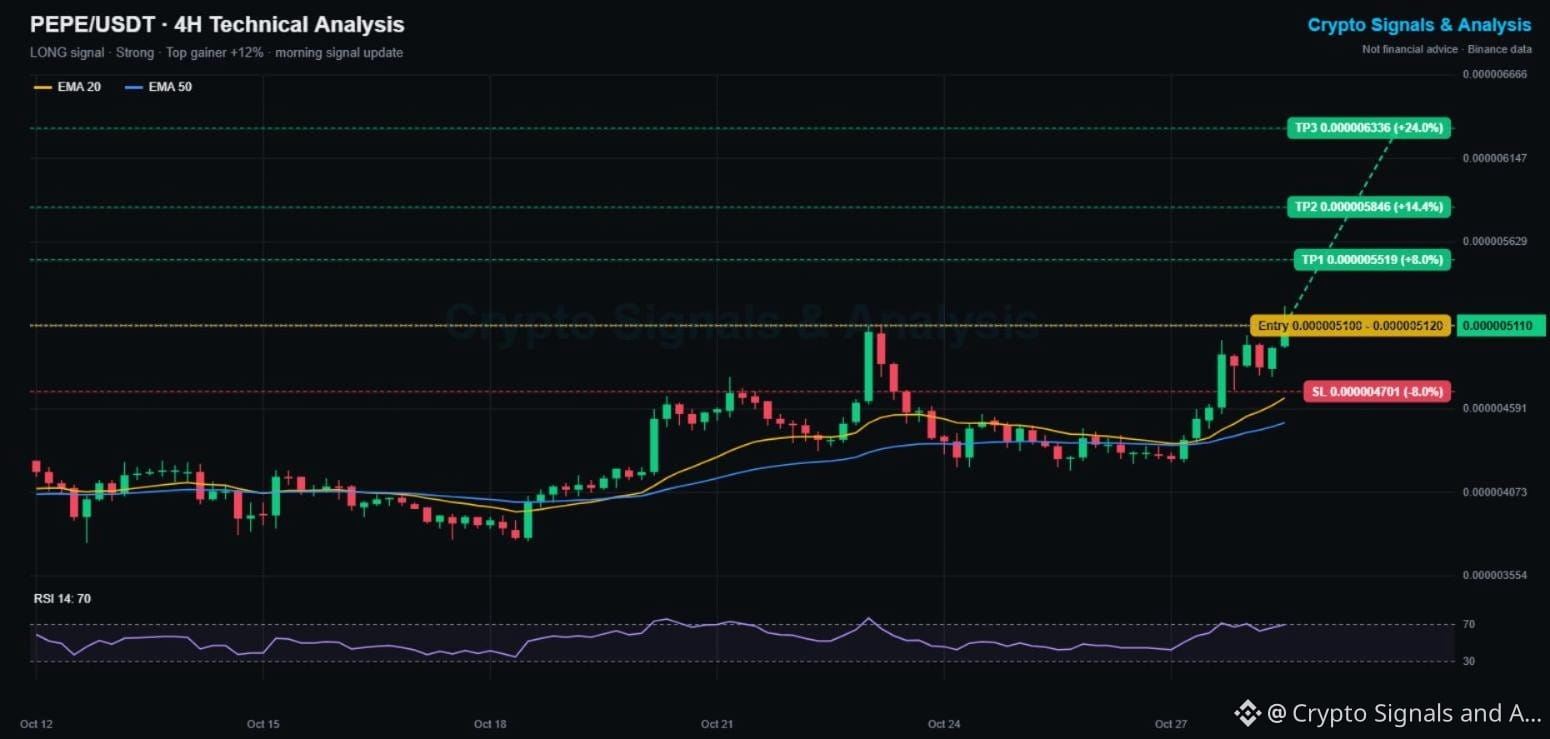
🟢 LONG | Entry 0.00000510 - 0.00000512 | TP1 0.00000552 | SL 0.00000470
👉 Tap $PEPE to place your trade fast
🕒 Updated: Oct 28, 20:20 UTC · price 0.00000511
📰 MARKET UPDATE
PEPE is the top gainer among high-volume coins on Binance spot tonight: +12.4% in 24 hours on about 102M USDT volume. Bitcoin is up only 0.6% after the Fed hold, so memes are leading this bounce.
✅ MORNING SIGNAL RESULT
This morning we posted a PEPE long from 0.00000484. In the last hour price tagged 0.00000523, which was TP1 (+8%). The stop at 0.00000445 was never touched. TP2 and TP3 are still open.
📌 NEW PEPE SETUP (Strong, 5/5 signals agree)
Entry: 0.00000510 - 0.00000512
Take profit 1: 0.00000552 (+8%)
Take profit 2: 0.00000585 (+14%)
Take profit 3: 0.00000634 (+24%)
Stop loss: 0.00000470 (-8%)
📊 4H CHART
Price is far above the EMA20 (0.00000466) and EMA50 (0.00000451). RSI is 70, so momentum is strong but stretched. Chasing here is riskier than this morning; a dip to 0.00000497 - 0.00000500 would be a better fill.
🔑 KEY LEVELS
Support: 0.00000500, then 0.00000470
Resistance: 0.00000523 (today's high), then 0.00000552
💡 Bottom line: trend is up, but take partial profit at targets and keep the stop.
👉 Tap $PEPE
to open the live chart. NFA
🔥 TRADE WITH LOWER FEES
✅ Get a 10% kickback on your Binance Futures trading fees
👇👇👇
{spot}(PEPEUSDT)
[Claim your 10% Futures fee kickback here](https://www.binance.com/join?ref=SQUAREGINOS)
━━━━━━━━━━
Did you catch the PEPE move or are you waiting for a dip? 👇
Follow Crypto Signals and Analysis for daily signals.
#cryptosignals #PEPE #FOMCWatch
⚠️ Crypto is volatile: risk only what you can afford to lose.
$PEPE Price Prediction Today (Oct 28, Evening Update): PEPE Leads Binance Gainers +12%, Morning Signal Hits TP1 🚀
🟢 LONG | Entry 0.00000510 - 0.00000512 | TP1 0.00000552 | SL 0.00000470
👉 Tap $PEPE to place your trade fast
🕒 Updated: Oct 28, 20:20 UTC · price 0.00000511
📰 MARKET UPDATE
PEPE is the top gainer among high-volume coins on Binance spot tonight: +12.4% in 24 hours on about 102M USDT volume. Bitcoin is up only 0.6% after the Fed hold, so memes are leading this bounce.
✅ MORNING SIGNAL RESULT
This morning we posted a PEPE long from 0.00000484. In the last hour price tagged 0.00000523, which was TP1 (+8%). The stop at 0.00000445 was never touched. TP2 and TP3 are still open.
📌 NEW PEPE SETUP (Strong, 5/5 signals agree)
Entry: 0.00000510 - 0.00000512
Take profit 1: 0.00000552 (+8%)
Take profit 2: 0.00000585 (+14%)
Take profit 3: 0.00000634 (+24%)
Stop loss: 0.00000470 (-8%)
📊 4H CHART
Price is far above the EMA20 (0.00000466) and EMA50 (0.00000451). RSI is 70, so momentum is strong but stretched. Chasing here is riskier than this morning; a dip to 0.00000497 - 0.00000500 would be a better fill.
🔑 KEY LEVELS
Support: 0.00000500, then 0.00000470
Resistance: 0.00000523 (today's high), then 0.00000552
💡 Bottom line: trend is up, but take partial profit at targets and keep the stop.
👉 Tap $PEPE
to open the live chart. NFA
🔥 TRADE WITH LOWER FEES
✅ Get a 10% kickback on your Binance Futures trading fees
👇👇👇
Claim your 10% Futures fee kickback here
━━━━━━━━━━
Did you catch the PEPE move or are you waiting for a dip? 👇
Follow Crypto Signals and Analysis for daily signals.
#cryptosignals #PEPE #FOMCWatch
⚠️ Crypto is volatile: risk only what you can afford to lose.
33
·
--
Pasayuvchi
Tarjimani ko‘rish
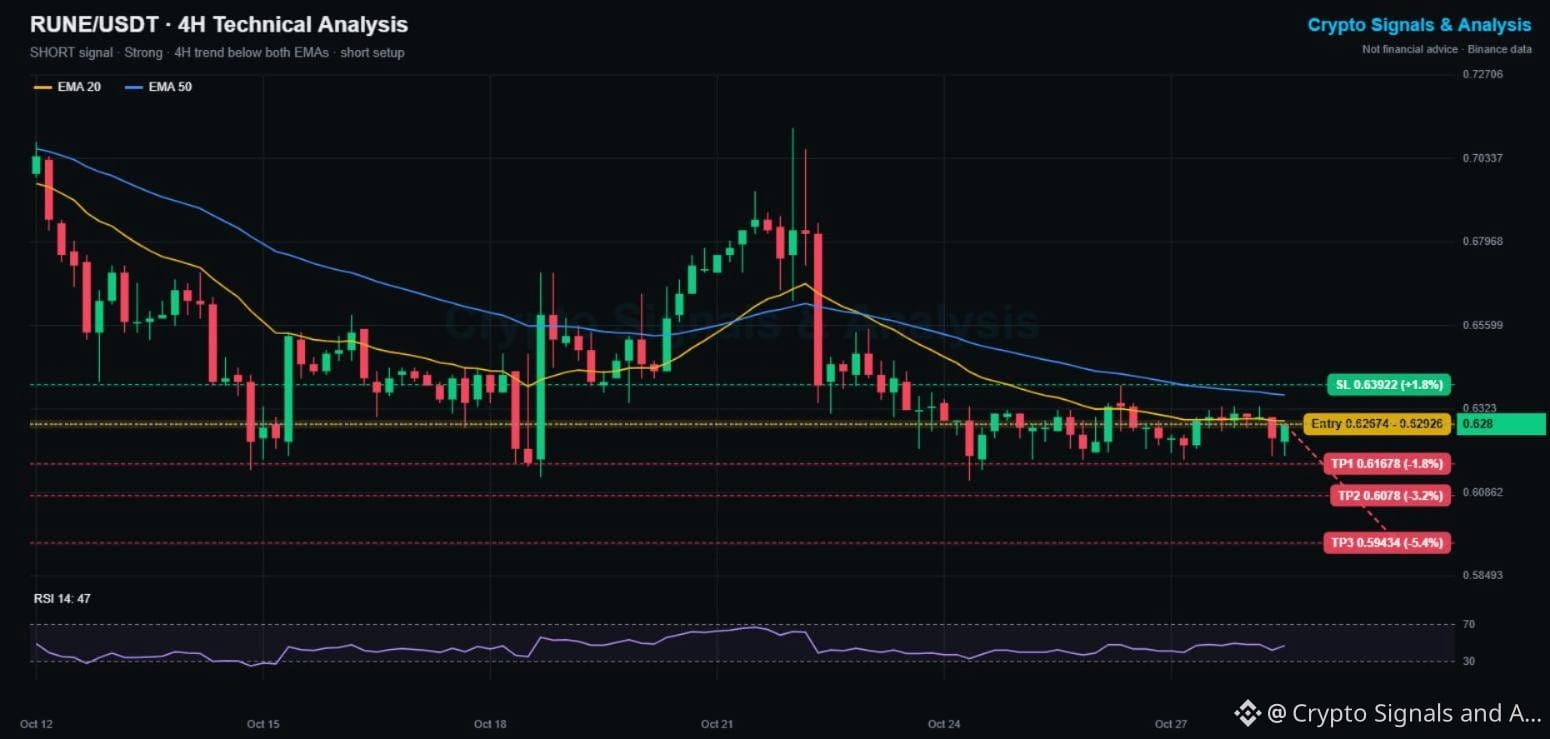
$RUNE Price Prediction Today (Oct 28, Evening Update): THORChain Crypto Signal & Technical Analysis 📊
🔴 SHORT | Entry 0.6267 - 0.6293 | TP1 0.6168 | SL 0.6392
👉 Tap $RUNE to place your trade fast
🕒 Updated: Oct 28, 20:00 UTC · price 0.628
While Bitcoin bounced after the Fed hold, THORChain did not join in. It is down 8.5% this week and keeps getting rejected under its 4H moving averages.
📌 THORCHAIN TRADING SIGNAL (Strong, 4/5 signals agree)
Entry: 0.6267 - 0.6293
Take profit 1: 0.6168 (-1.8%)
Take profit 2: 0.6078 (-3.2%)
Take profit 3: 0.5943 (-5.4%)
Stop loss: 0.6392 (+1.8%)
📊 RUNE TECHNICAL ANALYSIS (4H CHART)
Price sits below the EMA20 (0.6289) and the EMA50 (0.6363), and the EMA20 is sloping down. Every bounce since Oct 23 has stalled near 0.639. RSI at 47 leaves room to fall before oversold.
🔑 KEY LEVELS
Support: 0.618, then 0.612 (100-candle low)
Resistance: 0.636 (EMA50), then 0.639
📉 Bearish scenario: a 4H close under 0.618 opens TP2 and a retest of 0.612.
📈 Bullish scenario: reclaiming the EMA50 flips the bias. A close above 0.6392 cancels this signal.
💡 Bottom line: weak relative strength on a green day is a warning sign. Tight stop, small size.
👉 Tap $RUNE
to open the live chart. NFA
🔥 TRADE WITH LOWER FEES
✅ Get a 10% kickback on your Binance Futures trading fees
👇👇👇
{spot}(RUNEUSDT)
[Claim your 10% Futures fee kickback here](https://www.binance.com/join?ref=SQUAREGINOS)
━━━━━━━━━━
Does THORChain lose 0.618 this week, or bounce first? 👇
Follow Crypto Signals and Analysis for daily signals.
#cryptosignals #RUNE #FOMCWatch
⚠️ Crypto is volatile: risk only what you can afford to lose.
$RUNE Price Prediction Today (Oct 28, Evening Update): THORChain Crypto Signal & Technical Analysis 📊
🔴 SHORT | Entry 0.6267 - 0.6293 | TP1 0.6168 | SL 0.6392
👉 Tap $RUNE to place your trade fast
🕒 Updated: Oct 28, 20:00 UTC · price 0.628
While Bitcoin bounced after the Fed hold, THORChain did not join in. It is down 8.5% this week and keeps getting rejected under its 4H moving averages.
📌 THORCHAIN TRADING SIGNAL (Strong, 4/5 signals agree)
Entry: 0.6267 - 0.6293
Take profit 1: 0.6168 (-1.8%)
Take profit 2: 0.6078 (-3.2%)
Take profit 3: 0.5943 (-5.4%)
Stop loss: 0.6392 (+1.8%)
📊 RUNE TECHNICAL ANALYSIS (4H CHART)
Price sits below the EMA20 (0.6289) and the EMA50 (0.6363), and the EMA20 is sloping down. Every bounce since Oct 23 has stalled near 0.639. RSI at 47 leaves room to fall before oversold.
🔑 KEY LEVELS
Support: 0.618, then 0.612 (100-candle low)
Resistance: 0.636 (EMA50), then 0.639
📉 Bearish scenario: a 4H close under 0.618 opens TP2 and a retest of 0.612.
📈 Bullish scenario: reclaiming the EMA50 flips the bias. A close above 0.6392 cancels this signal.
💡 Bottom line: weak relative strength on a green day is a warning sign. Tight stop, small size.
👉 Tap $RUNE
to open the live chart. NFA
🔥 TRADE WITH LOWER FEES
✅ Get a 10% kickback on your Binance Futures trading fees
👇👇👇
Claim your 10% Futures fee kickback here
━━━━━━━━━━
Does THORChain lose 0.618 this week, or bounce first? 👇
Follow Crypto Signals and Analysis for daily signals.
#cryptosignals #RUNE #FOMCWatch
⚠️ Crypto is volatile: risk only what you can afford to lose.
4
·
--
O‘suvchi
Tarjimani ko‘rish
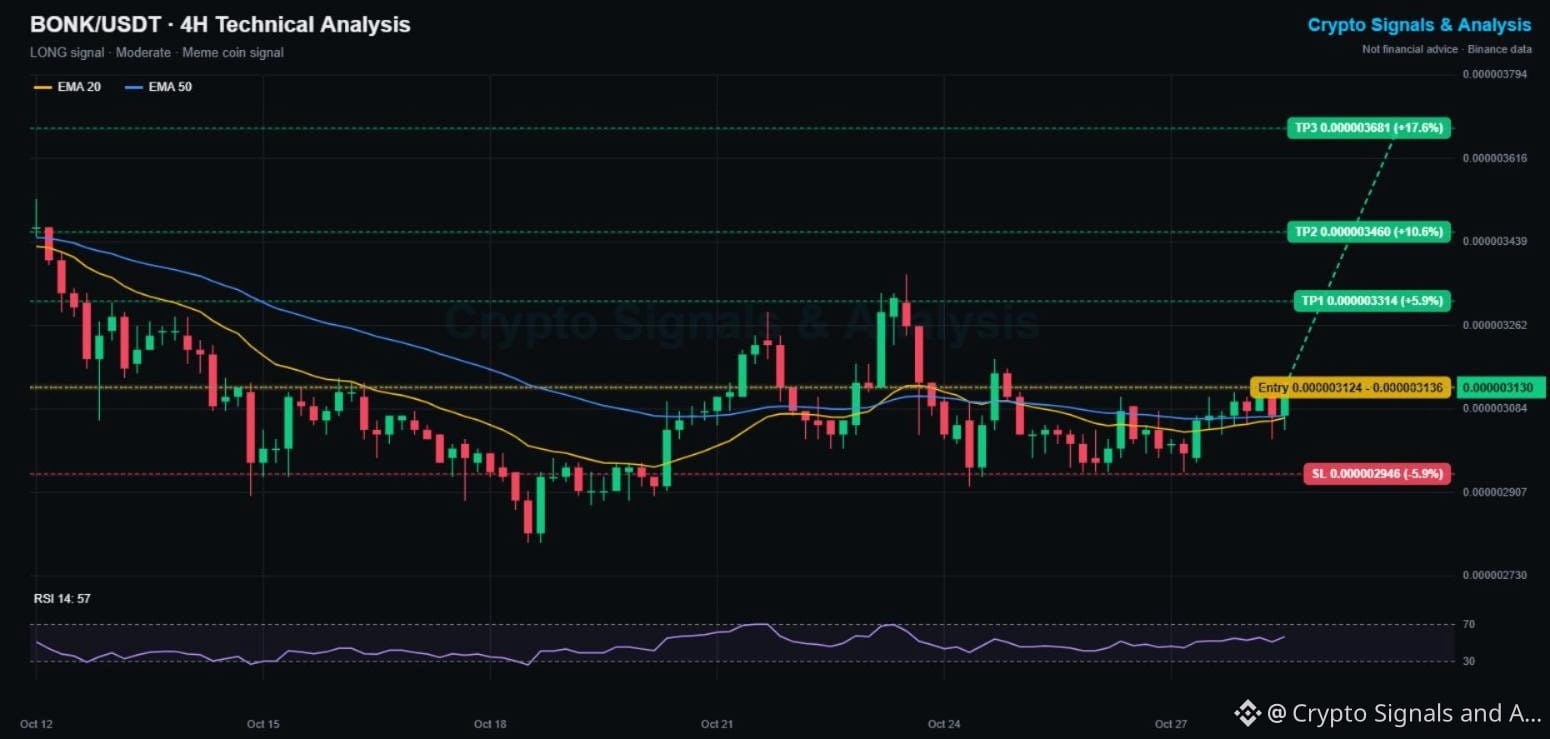
$BONK Price Prediction Today (Oct 28, Evening Update): Bonk Crypto Signal & Technical Analysis 📊
🟢 LONG | Entry 0.000003124 - 0.000003136 | TP1 0.000003314 | SL 0.000002946
👉 Tap $BONK to place your trade fast
🕒 Updated: Oct 28, 19:40 UTC · price 0.000003130
Bonk is up 2% today and just tagged a new 5-day high as meme coins bounce after the Fed hold. It held the 0.00000295 floor all week and is now sitting on top of both 4H EMAs.
📌 BONK TRADING SIGNAL (Moderate, 4/5 signals agree)
Entry: 0.000003124 - 0.000003136
Take profit 1: 0.000003314 (+5.9%)
Take profit 2: 0.000003460 (+10.6%)
Take profit 3: 0.000003681 (+17.6%)
Stop loss: 0.000002946 (-5.9%)
📊 BONK TECHNICAL ANALYSIS (4H CHART)
Price holds above the EMA20 (0.000003065) and EMA50 (0.000003070), and the EMA20 is sloping up. RSI at 57 favors buyers. The Oct 23 spike to 0.00000330 is the first real resistance, close to TP1.
🔑 KEY LEVELS
Support: 0.00000307 (EMAs), then 0.00000295
Resistance: 0.00000314, then 0.00000330
📈 Bullish scenario: a 4H close above 0.00000314 opens TP1 and the 0.00000346 zone.
📉 Bearish scenario: losing the EMAs sends Bonk back to its range. A close under 0.000002946 cancels this signal.
💡 Bottom line: Solana memes are waking up, and Bonk has the cleanest chart of the group.
👉 Tap $BONK
to open the live chart. NFA
🔥 TRADE WITH LOWER FEES
✅ Get a 10% kickback on your Binance Futures trading fees
👇👇👇
{spot}(BONKUSDT)
[Claim your 10% Futures fee kickback here](https://www.binance.com/join?ref=SQUAREGINOS)
━━━━━━━━━━
Best Solana meme right now: BONK, WIF or something new? 👇
Follow Crypto Signals and Analysis for daily signals.
#cryptosignals #BONK #FOMCWatch
⚠️ Crypto is volatile: risk only what you can afford to lose.
$BONK Price Prediction Today (Oct 28, Evening Update): Bonk Crypto Signal & Technical Analysis 📊
🟢 LONG | Entry 0.000003124 - 0.000003136 | TP1 0.000003314 | SL 0.000002946
👉 Tap $BONK to place your trade fast
🕒 Updated: Oct 28, 19:40 UTC · price 0.000003130
Bonk is up 2% today and just tagged a new 5-day high as meme coins bounce after the Fed hold. It held the 0.00000295 floor all week and is now sitting on top of both 4H EMAs.
📌 BONK TRADING SIGNAL (Moderate, 4/5 signals agree)
Entry: 0.000003124 - 0.000003136
Take profit 1: 0.000003314 (+5.9%)
Take profit 2: 0.000003460 (+10.6%)
Take profit 3: 0.000003681 (+17.6%)
Stop loss: 0.000002946 (-5.9%)
📊 BONK TECHNICAL ANALYSIS (4H CHART)
Price holds above the EMA20 (0.000003065) and EMA50 (0.000003070), and the EMA20 is sloping up. RSI at 57 favors buyers. The Oct 23 spike to 0.00000330 is the first real resistance, close to TP1.
🔑 KEY LEVELS
Support: 0.00000307 (EMAs), then 0.00000295
Resistance: 0.00000314, then 0.00000330
📈 Bullish scenario: a 4H close above 0.00000314 opens TP1 and the 0.00000346 zone.
📉 Bearish scenario: losing the EMAs sends Bonk back to its range. A close under 0.000002946 cancels this signal.
💡 Bottom line: Solana memes are waking up, and Bonk has the cleanest chart of the group.
👉 Tap $BONK
to open the live chart. NFA
🔥 TRADE WITH LOWER FEES
✅ Get a 10% kickback on your Binance Futures trading fees
👇👇👇
Claim your 10% Futures fee kickback here
━━━━━━━━━━
Best Solana meme right now: BONK, WIF or something new? 👇
Follow Crypto Signals and Analysis for daily signals.
#cryptosignals #BONK #FOMCWatch
⚠️ Crypto is volatile: risk only what you can afford to lose.
1
13
·
--
O‘suvchi
Tarjimani ko‘rish
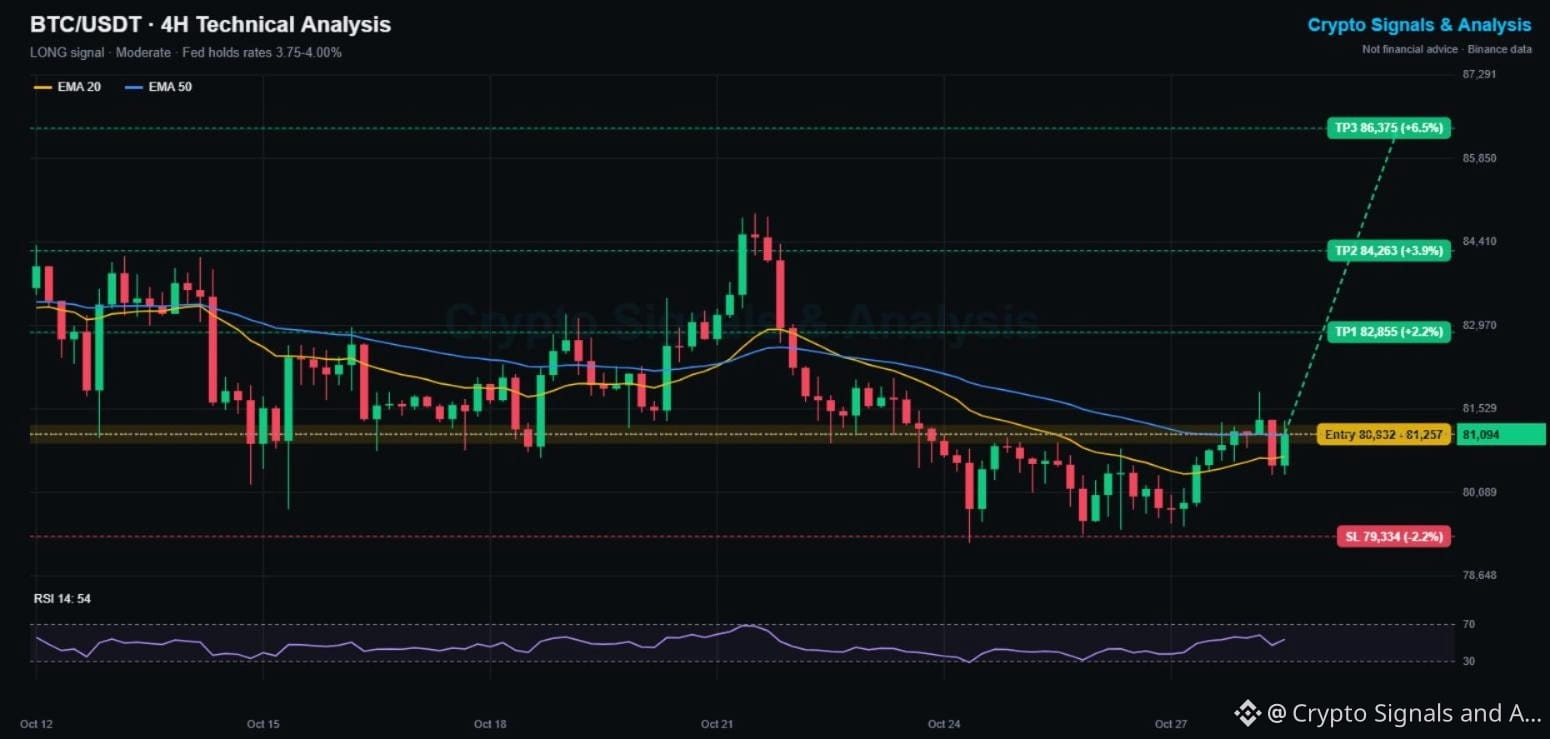
$BTC Price Prediction After the Fed (Oct 28, Evening Update): Fed Holds Rates, Bitcoin Signal Flips 🏛️
🟢 LONG | Entry 80,932 - 81,257 | TP1 82,855 | SL 79,334
👉 Tap $BTC to place your trade fast
🕒 Updated: Oct 28, 19:25 UTC · price 81,094
The Fed kept rates unchanged at 3.75% to 4.00% today, as markets expected The statement said inflation "remains elevated" while activity is expanding. Bitcoin's first reaction: a bounce back above 81K.
🔄 UPDATE ON THIS MORNING'S SIGNAL
Our 15:00 short (entry 80,400 to 80,722) did not reach TP1 at 79,274, and price climbed to 81,327 instead. The stop at 81,848 was not hit. We close that idea and follow the new trend.
📌 NEW BITCOIN SIGNAL (Moderate, 3/5 signals agree)
Entry: 80,932 - 81,257
Take profit 1: 82,855 (+2.2%)
Take profit 2: 84,263 (+3.9%)
Take profit 3: 86,375 (+6.5%)
Stop loss: 79,334 (-2.2%)
📊 BTC TECHNICAL ANALYSIS (4H CHART)
Price is back above the EMA20 (80,711) and just over the EMA50 (81,076), and the EMA20 is turning up. RSI at 54 leaves room to run. The weekly trend is still down (-4%), so the 81,800 high from earlier today is the line buyers need to break.
🔑 KEY LEVELS
Support: 80,711 (EMA20), then 79,370
Resistance: 81,823, then 82,900
📈 Bullish scenario: a 4H close above 81,823 confirms the post-Fed breakout toward TP1 and TP2.
📉 Bearish scenario: losing 80,700 means the Fed bounce failed. A close under 79,334 cancels this signal.
💡 Bottom line: no surprise from the Fed, and the market took it as a relief.
👉 Tap $BTC
to open the live chart. NFA
🔥 TRADE WITH LOWER FEES
✅ Get a 10% kickback on your Binance Futures trading fees
👇👇👇
{spot}(BTCUSDT)
[Claim your 10% Futures fee kickback here](https://www.binance.com/join?ref=SQUAREGINOS)
━━━━━━━━━━
Fed held rates. Is Bitcoin going to 85K or back to 79K first? 👇
Follow Crypto Signals and Analysis for daily signals.
#cryptosignals #FOMCWatch #BTC
⚠️ Crypto is volatile: risk only what you can afford to lose.
$BTC Price Prediction After the Fed (Oct 28, Evening Update): Fed Holds Rates, Bitcoin Signal Flips 🏛️
🟢 LONG | Entry 80,932 - 81,257 | TP1 82,855 | SL 79,334
👉 Tap $BTC to place your trade fast
🕒 Updated: Oct 28, 19:25 UTC · price 81,094
The Fed kept rates unchanged at 3.75% to 4.00% today, as markets expected The statement said inflation "remains elevated" while activity is expanding. Bitcoin's first reaction: a bounce back above 81K.
🔄 UPDATE ON THIS MORNING'S SIGNAL
Our 15:00 short (entry 80,400 to 80,722) did not reach TP1 at 79,274, and price climbed to 81,327 instead. The stop at 81,848 was not hit. We close that idea and follow the new trend.
📌 NEW BITCOIN SIGNAL (Moderate, 3/5 signals agree)
Entry: 80,932 - 81,257
Take profit 1: 82,855 (+2.2%)
Take profit 2: 84,263 (+3.9%)
Take profit 3: 86,375 (+6.5%)
Stop loss: 79,334 (-2.2%)
📊 BTC TECHNICAL ANALYSIS (4H CHART)
Price is back above the EMA20 (80,711) and just over the EMA50 (81,076), and the EMA20 is turning up. RSI at 54 leaves room to run. The weekly trend is still down (-4%), so the 81,800 high from earlier today is the line buyers need to break.
🔑 KEY LEVELS
Support: 80,711 (EMA20), then 79,370
Resistance: 81,823, then 82,900
📈 Bullish scenario: a 4H close above 81,823 confirms the post-Fed breakout toward TP1 and TP2.
📉 Bearish scenario: losing 80,700 means the Fed bounce failed. A close under 79,334 cancels this signal.
💡 Bottom line: no surprise from the Fed, and the market took it as a relief.
👉 Tap $BTC
to open the live chart. NFA
🔥 TRADE WITH LOWER FEES
✅ Get a 10% kickback on your Binance Futures trading fees
👇👇👇
Claim your 10% Futures fee kickback here
━━━━━━━━━━
Fed held rates. Is Bitcoin going to 85K or back to 79K first? 👇
Follow Crypto Signals and Analysis for daily signals.
#cryptosignals #FOMCWatch #BTC
⚠️ Crypto is volatile: risk only what you can afford to lose.
36
·
--
Pasayuvchi
Tarjimani ko‘rish
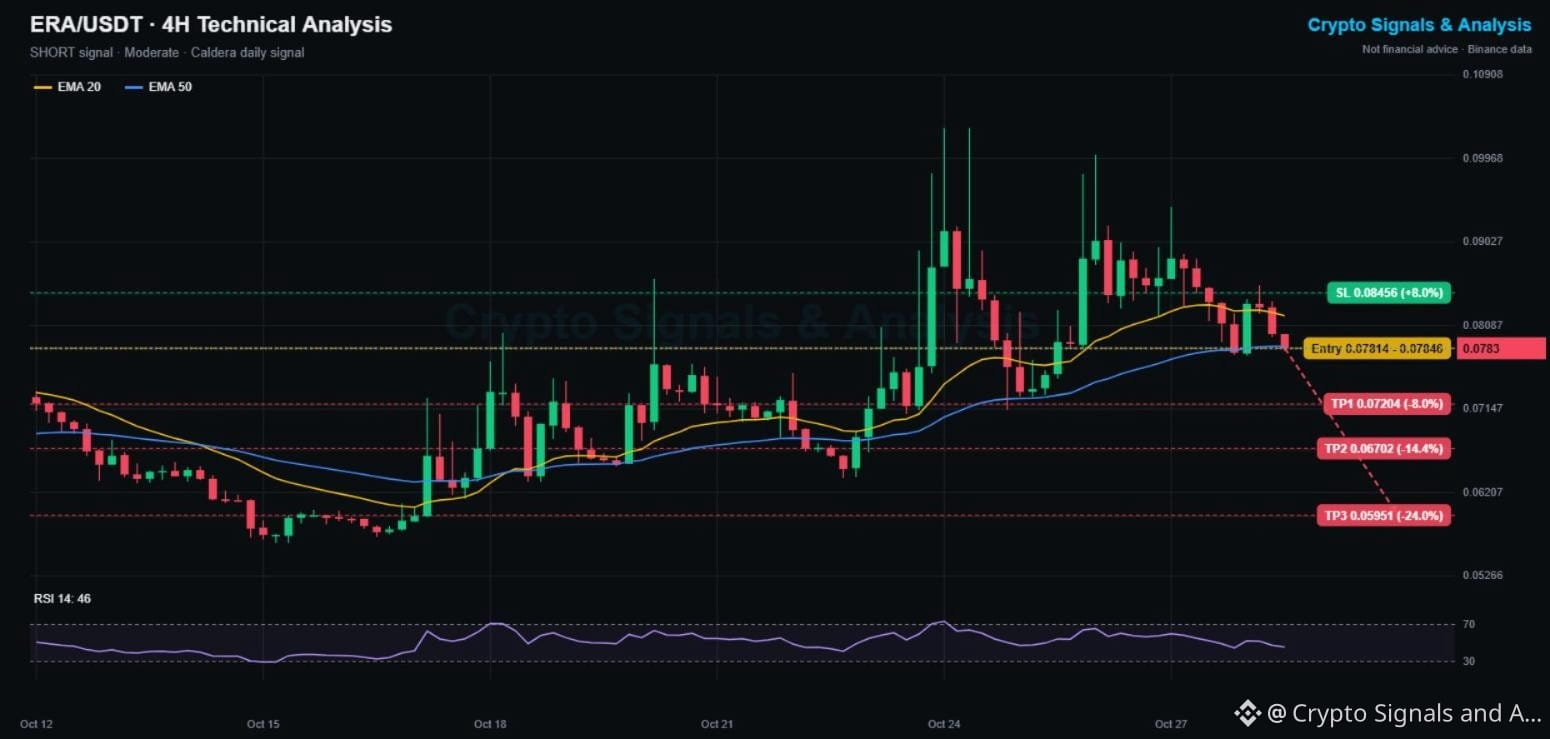
$ERA Price Prediction Today: Caldera Crypto Signal & Technical Analysis 📊
🔴 SHORT | Entry 0.07814 - 0.07846 | TP1 0.07204 | SL 0.08456
👉 Tap $ERA to place your trade fast
Caldera ran from 0.056 to 0.100 this month, but the last three pushes toward 0.10 all got rejected with long wicks. Today it dropped 6% and lost its 4H EMA20, and price is now sitting right on the EMA50.
📌 CALDERA TRADING SIGNAL (Moderate, momentum fading)
Entry: 0.07814 - 0.07846
Take profit 1: 0.07204 (-8%)
Take profit 2: 0.06702 (-14%)
Take profit 3: 0.05951 (-24%)
Stop loss: 0.08456 (+8%)
📊 ERA TECHNICAL ANALYSIS (4H CHART)
ERA is under the EMA20 (0.0820), which is now turning down, and it is testing the EMA50 (0.0785). RSI dropped to 46. The repeated wicks at 0.096 to 0.100 show heavy supply up there. Caution: the coin is still up 11% on the week, so wait for a 4H close under the EMA50 before going full size.
🔑 KEY LEVELS
Support: 0.0785 (EMA50), then 0.0731
Resistance: 0.0820 (EMA20), then 0.0880
📈 Bullish scenario: a bounce from the EMA50 and a close above 0.0846 keeps the uptrend alive and cancels the short.
📉 Bearish scenario: a 4H close under 0.0785 confirms the top and opens TP1 and TP2.
💡 Bottom line: three failed tops is a warning. The EMA50 is the line that decides it.
👉 Tap $ERA
to open the live chart. NFA
🔥 TRADE WITH LOWER FEES
✅ Get a 20% kickback on your Binance trading fees, for life
👇👇👇
{spot}(ERAUSDT)
[Claim your 20% Binance fee kickback here](https://www.binance.com/register?ref=X0NQWZ4N)
━━━━━━━━━━
Caldera: bull flag or triple top? Tell me your read 👇
Follow Crypto Signals and Analysis for daily signals.
#cryptosignals #ERA #EarningsSeason
⚠️ Crypto is volatile: risk only what you can afford to lose.
$ERA Price Prediction Today: Caldera Crypto Signal & Technical Analysis 📊
🔴 SHORT | Entry 0.07814 - 0.07846 | TP1 0.07204 | SL 0.08456
👉 Tap $ERA to place your trade fast
Caldera ran from 0.056 to 0.100 this month, but the last three pushes toward 0.10 all got rejected with long wicks. Today it dropped 6% and lost its 4H EMA20, and price is now sitting right on the EMA50.
📌 CALDERA TRADING SIGNAL (Moderate, momentum fading)
Entry: 0.07814 - 0.07846
Take profit 1: 0.07204 (-8%)
Take profit 2: 0.06702 (-14%)
Take profit 3: 0.05951 (-24%)
Stop loss: 0.08456 (+8%)
📊 ERA TECHNICAL ANALYSIS (4H CHART)
ERA is under the EMA20 (0.0820), which is now turning down, and it is testing the EMA50 (0.0785). RSI dropped to 46. The repeated wicks at 0.096 to 0.100 show heavy supply up there. Caution: the coin is still up 11% on the week, so wait for a 4H close under the EMA50 before going full size.
🔑 KEY LEVELS
Support: 0.0785 (EMA50), then 0.0731
Resistance: 0.0820 (EMA20), then 0.0880
📈 Bullish scenario: a bounce from the EMA50 and a close above 0.0846 keeps the uptrend alive and cancels the short.
📉 Bearish scenario: a 4H close under 0.0785 confirms the top and opens TP1 and TP2.
💡 Bottom line: three failed tops is a warning. The EMA50 is the line that decides it.
👉 Tap $ERA
to open the live chart. NFA
🔥 TRADE WITH LOWER FEES
✅ Get a 20% kickback on your Binance trading fees, for life
👇👇👇
Claim your 20% Binance fee kickback here
━━━━━━━━━━
Caldera: bull flag or triple top? Tell me your read 👇
Follow Crypto Signals and Analysis for daily signals.
#cryptosignals #ERA #EarningsSeason
⚠️ Crypto is volatile: risk only what you can afford to lose.
1
202
·
--
Pasayuvchi
Tarjimani ko‘rish
$QNT Price Prediction Today: Quant Crypto Signal & Technical Analysis 📊
🔴 SHORT | Entry 193.5 - 194.3 | TP1 178.4 | SL 209.4
👉 Tap $QNT to place your trade fast
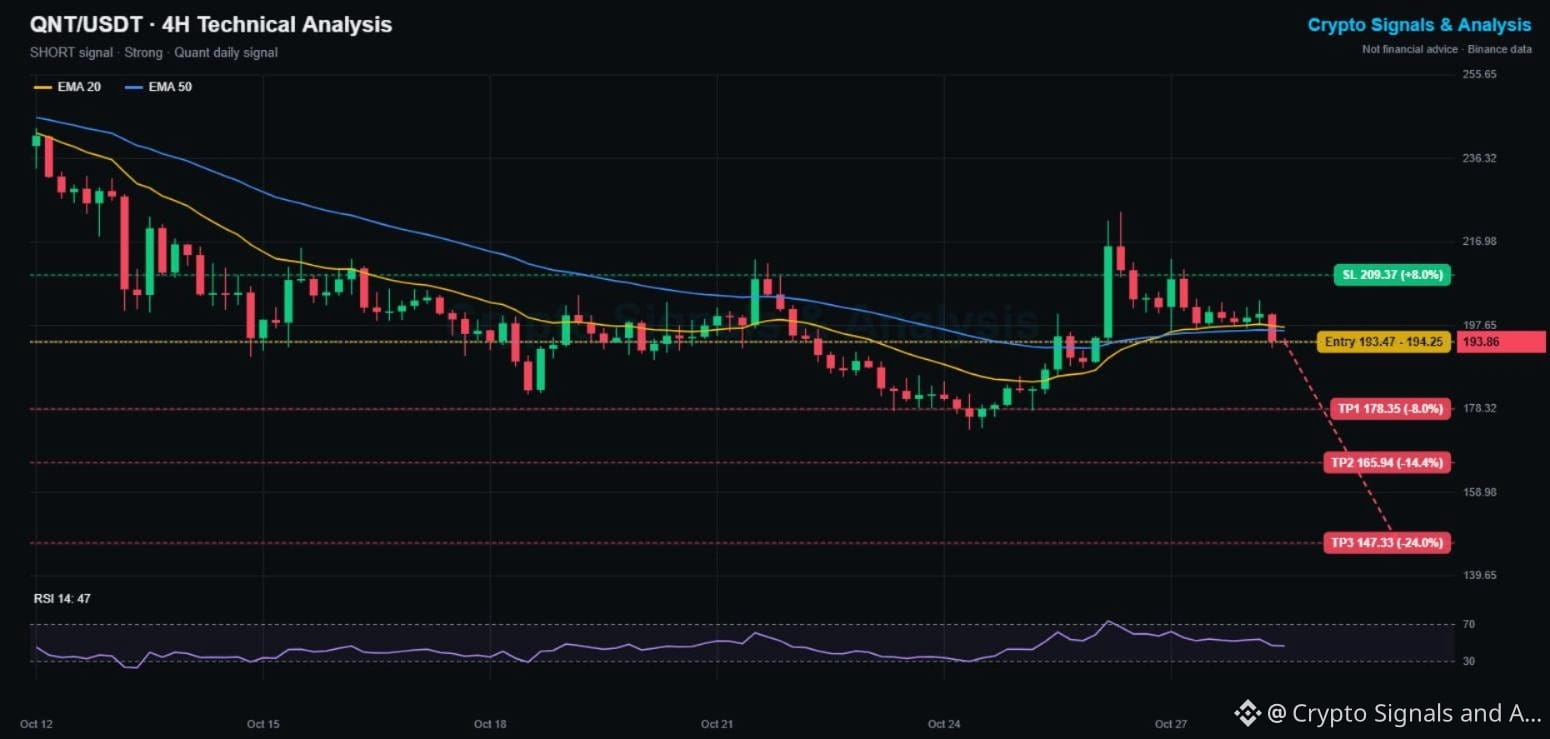
Quant spiked to 224 on Oct 26 but could not hold it. Two days of lower highs followed, and today a 3.4% drop pushed it back under both 4H EMAs. The spike now looks like a bull trap.
📌 QUANT TRADING SIGNAL (Strong, 4/5 signals agree)
Entry: 193.5 - 194.3
Take profit 1: 178.4 (-8%)
Take profit 2: 165.9 (-14%)
Take profit 3: 147.3 (-24%)
Stop loss: 209.4 (+8%)
📊 QNT TECHNICAL ANALYSIS (4H CHART)
QNT has lost the EMA20 (197.2) and EMA50 (196.4), and the EMA20 is rolling over. RSI at 47 is neutral but falling. The long-term trend from 243 in mid-October is still down. The 181.8 low is the first target zone, and the Oct 24 low at 173.6 is the next.
🔑 KEY LEVELS
Support: 181.8, then 173.6
Resistance: 197.2 (EMA20), then 209
📈 Bullish scenario: a 4H close above 209.4 reclaims the breakout zone and cancels the short.
📉 Bearish scenario: losing 181.8 opens TP2 and the October lows.
💡 Bottom line: a failed spike plus an EMA breakdown is a bearish combo. Respect the stop above 209.
👉 Tap $QNT
to open the live chart. NFA
🔥 TRADE WITH LOWER FEES
✅ Get a 20% kickback on your Binance trading fees, for life
👇👇👇
{spot}(QNTUSDT)
[Claim your 20% Binance fee kickback here](https://www.binance.com/register?ref=X0NQWZ4N)
━━━━━━━━━━
Was the Quant spike to 224 a trap? Tell me below 👇
Follow Crypto Signals and Analysis for daily signals.
#cryptosignals #QNT #CanGoogleDefendItsCore
⚠️ Crypto is volatile: risk only what you can afford to lose.
$QNT Price Prediction Today: Quant Crypto Signal & Technical Analysis 📊
🔴 SHORT | Entry 193.5 - 194.3 | TP1 178.4 | SL 209.4
👉 Tap $QNT to place your trade fast
Quant spiked to 224 on Oct 26 but could not hold it. Two days of lower highs followed, and today a 3.4% drop pushed it back under both 4H EMAs. The spike now looks like a bull trap.
📌 QUANT TRADING SIGNAL (Strong, 4/5 signals agree)
Entry: 193.5 - 194.3
Take profit 1: 178.4 (-8%)
Take profit 2: 165.9 (-14%)
Take profit 3: 147.3 (-24%)
Stop loss: 209.4 (+8%)
📊 QNT TECHNICAL ANALYSIS (4H CHART)
QNT has lost the EMA20 (197.2) and EMA50 (196.4), and the EMA20 is rolling over. RSI at 47 is neutral but falling. The long-term trend from 243 in mid-October is still down. The 181.8 low is the first target zone, and the Oct 24 low at 173.6 is the next.
🔑 KEY LEVELS
Support: 181.8, then 173.6
Resistance: 197.2 (EMA20), then 209
📈 Bullish scenario: a 4H close above 209.4 reclaims the breakout zone and cancels the short.
📉 Bearish scenario: losing 181.8 opens TP2 and the October lows.
💡 Bottom line: a failed spike plus an EMA breakdown is a bearish combo. Respect the stop above 209.
👉 Tap $QNT
to open the live chart. NFA
🔥 TRADE WITH LOWER FEES
✅ Get a 20% kickback on your Binance trading fees, for life
👇👇👇
Claim your 20% Binance fee kickback here
━━━━━━━━━━
Was the Quant spike to 224 a trap? Tell me below 👇
Follow Crypto Signals and Analysis for daily signals.
#cryptosignals #QNT #CanGoogleDefendItsCore
⚠️ Crypto is volatile: risk only what you can afford to lose.
171
·
--
Pasayuvchi
Tarjimani ko‘rish
$GTC Price Prediction Today: Gitcoin Crypto Signal & Technical Analysis 📊
🔴 SHORT | Entry 0.2439 - 0.2449 | TP1 0.2248 | SL 0.2639
👉 Tap $GTC to place your trade fast
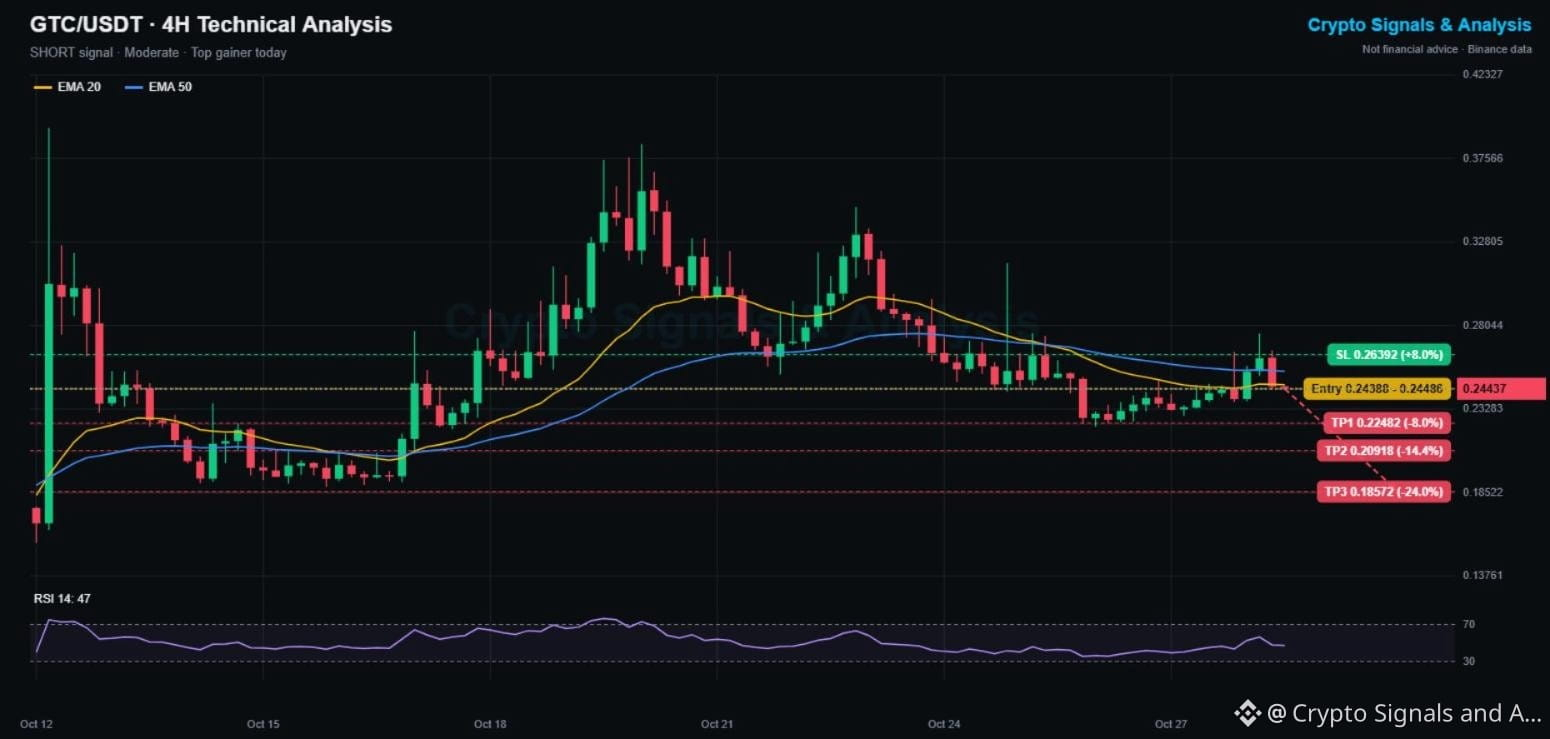
Gitcoin made the top gainers list earlier today with a spike to 0.276, but the move was sold hard right at the falling 4H EMA50. That long upper wick and the red candle that followed are classic signs of a failed breakout.
📌 GITCOIN TRADING SIGNAL (Moderate, failed breakout setup)
Entry: 0.2439 - 0.2449
Take profit 1: 0.2248 (-8%)
Take profit 2: 0.2092 (-14%)
Take profit 3: 0.1857 (-24%)
Stop loss: 0.2639 (+8%)
📊 GTC TECHNICAL ANALYSIS (4H CHART)
GTC peaked at 0.393 on Oct 12 and 0.38 on Oct 20. Since then it has made lower highs at 0.34, 0.31 and now 0.276. Price is back under the EMA20 (0.2467) and EMA50 (0.2544). RSI at 47 is neutral. The 0.2227 low from Oct 26 is the key support.
🔑 KEY LEVELS
Support: 0.2227, then 0.2090
Resistance: 0.2544 (EMA50), then 0.2758
📈 Bullish scenario: a 4H close above 0.2639 and the EMA50 cancels the short.
📉 Bearish scenario: losing 0.2227 opens TP2 and possibly TP3.
💡 Bottom line: top gainer lists can trap late buyers. This chart says the rally was sold.
👉 Tap $GTC
to open the live chart. NFA
🔥 TRADE WITH LOWER FEES
✅ Get a 20% kickback on your Binance trading fees, for life
👇👇👇
{spot}(GTCUSDT)
[Claim your 20% Binance fee kickback here](https://www.binance.com/register?ref=X0NQWZ4N)
━━━━━━━━━━
Do you chase top gainers or wait for the pullback? 👇
Follow Crypto Signals and Analysis for daily signals.
#cryptosignals #GTC #CanMicrosoftDeliverOnAI
⚠️ Crypto is volatile: risk only what you can afford to lose.
$GTC Price Prediction Today: Gitcoin Crypto Signal & Technical Analysis 📊
🔴 SHORT | Entry 0.2439 - 0.2449 | TP1 0.2248 | SL 0.2639
👉 Tap $GTC to place your trade fast
Gitcoin made the top gainers list earlier today with a spike to 0.276, but the move was sold hard right at the falling 4H EMA50. That long upper wick and the red candle that followed are classic signs of a failed breakout.
📌 GITCOIN TRADING SIGNAL (Moderate, failed breakout setup)
Entry: 0.2439 - 0.2449
Take profit 1: 0.2248 (-8%)
Take profit 2: 0.2092 (-14%)
Take profit 3: 0.1857 (-24%)
Stop loss: 0.2639 (+8%)
📊 GTC TECHNICAL ANALYSIS (4H CHART)
GTC peaked at 0.393 on Oct 12 and 0.38 on Oct 20. Since then it has made lower highs at 0.34, 0.31 and now 0.276. Price is back under the EMA20 (0.2467) and EMA50 (0.2544). RSI at 47 is neutral. The 0.2227 low from Oct 26 is the key support.
🔑 KEY LEVELS
Support: 0.2227, then 0.2090
Resistance: 0.2544 (EMA50), then 0.2758
📈 Bullish scenario: a 4H close above 0.2639 and the EMA50 cancels the short.
📉 Bearish scenario: losing 0.2227 opens TP2 and possibly TP3.
💡 Bottom line: top gainer lists can trap late buyers. This chart says the rally was sold.
👉 Tap $GTC
to open the live chart. NFA
🔥 TRADE WITH LOWER FEES
✅ Get a 20% kickback on your Binance trading fees, for life
👇👇👇
Claim your 20% Binance fee kickback here
━━━━━━━━━━
Do you chase top gainers or wait for the pullback? 👇
Follow Crypto Signals and Analysis for daily signals.
#cryptosignals #GTC #CanMicrosoftDeliverOnAI
⚠️ Crypto is volatile: risk only what you can afford to lose.
197
·
--
O‘suvchi
Tarjimani ko‘rish
$ENS Price Prediction Today: Ethereum Name Service Crypto Signal & Technical Analysis 📊
🟢 LONG | Entry 5.260 - 5.281 | TP1 5.515 | SL 5.025
👉 Tap $ENS to place your trade fast
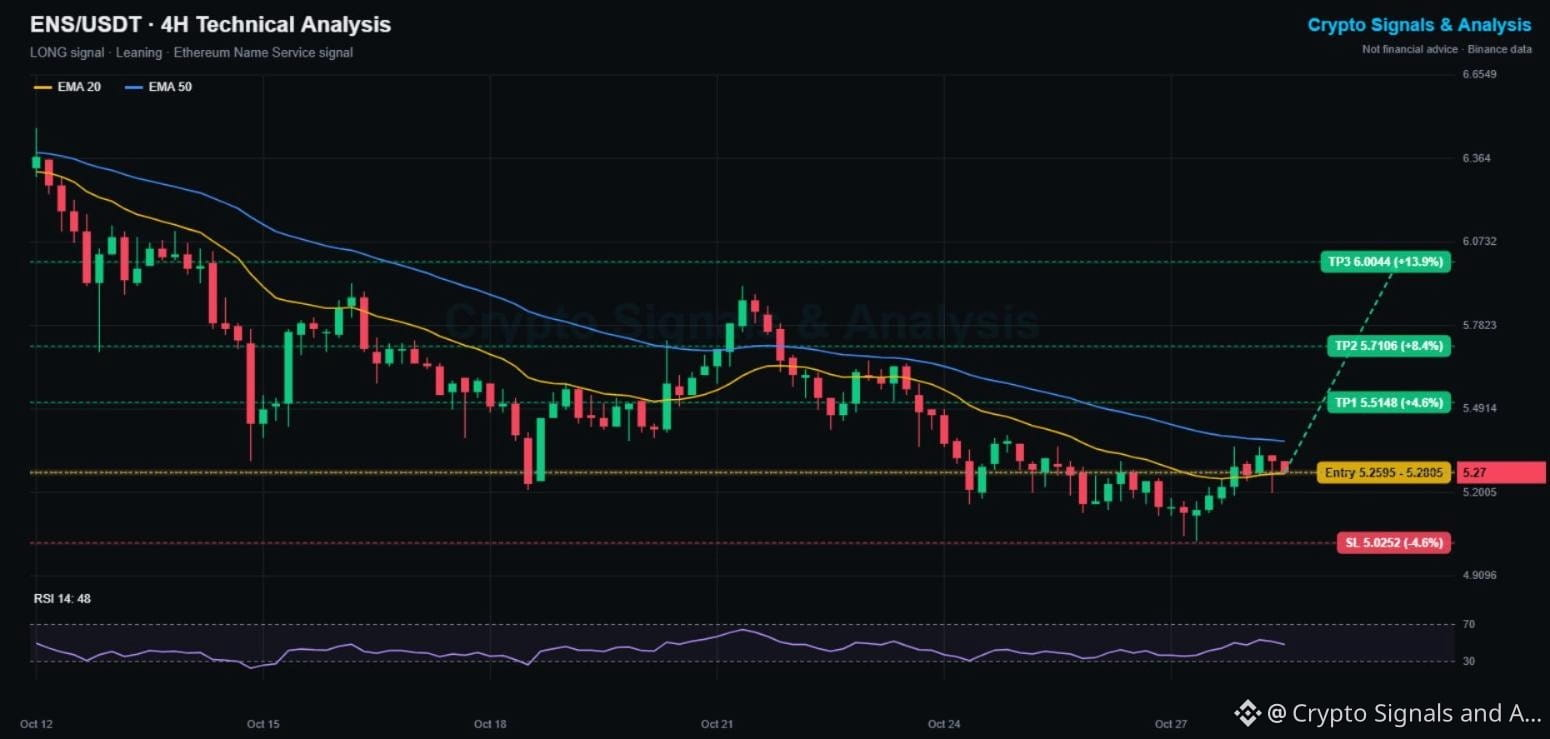
ENS found a floor at 5.03 after a 22% slide from 6.47, and the last 3 candles show a higher low. Price just reclaimed its 4H EMA20 and is now pulling back to retest it.
📌 ENS TRADING SIGNAL (Leaning, early reversal setup)
Entry: 5.260 - 5.281
Take profit 1: 5.515 (+4.6%)
Take profit 2: 5.711 (+8.4%)
Take profit 3: 6.004 (+13.9%)
Stop loss: 5.025 (-4.6%)
📊 ENS TECHNICAL ANALYSIS (4H CHART)
The EMA20 (5.266) has started to turn up. The falling EMA50 (5.379) is the confirmation line, and it has capped every rally since Oct 12. RSI at 48 is neutral. A close above 5.38 would be the first EMA50 break in over two weeks.
🔑 KEY LEVELS
Support: 5.266 (EMA20), then 5.03
Resistance: 5.379 (EMA50), then 5.51
📈 Bullish scenario: a 4H close above 5.38 confirms the reversal and opens TP2 and TP3.
📉 Bearish scenario: another EMA50 rejection sends ENS back to 5.03. A close under 5.025 cancels this signal.
💡 Bottom line: an early reversal with a tight stop under the floor. The EMA50 decides the trade.
👉 Tap $ENS
to open the live chart. NFA
🔥 TRADE WITH LOWER FEES
✅ Get a 20% kickback on your Binance trading fees, for life
👇👇👇
{spot}(ENSUSDT)
[Claim your 20% Binance fee kickback here](https://www.binance.com/register?ref=X0NQWZ4N)
━━━━━━━━━━
Do you own a .eth name? Tell me below 👇
Follow Crypto Signals and Analysis for daily signals.
#cryptosignals #ENS #EarningsSeason
⚠️ Crypto is volatile: risk only what you can afford to lose.
$ENS Price Prediction Today: Ethereum Name Service Crypto Signal & Technical Analysis 📊
🟢 LONG | Entry 5.260 - 5.281 | TP1 5.515 | SL 5.025
👉 Tap $ENS to place your trade fast
ENS found a floor at 5.03 after a 22% slide from 6.47, and the last 3 candles show a higher low. Price just reclaimed its 4H EMA20 and is now pulling back to retest it.
📌 ENS TRADING SIGNAL (Leaning, early reversal setup)
Entry: 5.260 - 5.281
Take profit 1: 5.515 (+4.6%)
Take profit 2: 5.711 (+8.4%)
Take profit 3: 6.004 (+13.9%)
Stop loss: 5.025 (-4.6%)
📊 ENS TECHNICAL ANALYSIS (4H CHART)
The EMA20 (5.266) has started to turn up. The falling EMA50 (5.379) is the confirmation line, and it has capped every rally since Oct 12. RSI at 48 is neutral. A close above 5.38 would be the first EMA50 break in over two weeks.
🔑 KEY LEVELS
Support: 5.266 (EMA20), then 5.03
Resistance: 5.379 (EMA50), then 5.51
📈 Bullish scenario: a 4H close above 5.38 confirms the reversal and opens TP2 and TP3.
📉 Bearish scenario: another EMA50 rejection sends ENS back to 5.03. A close under 5.025 cancels this signal.
💡 Bottom line: an early reversal with a tight stop under the floor. The EMA50 decides the trade.
👉 Tap $ENS
to open the live chart. NFA
🔥 TRADE WITH LOWER FEES
✅ Get a 20% kickback on your Binance trading fees, for life
👇👇👇
Claim your 20% Binance fee kickback here
━━━━━━━━━━
Do you own a .eth name? Tell me below 👇
Follow Crypto Signals and Analysis for daily signals.
#cryptosignals #ENS #EarningsSeason
⚠️ Crypto is volatile: risk only what you can afford to lose.
1
21
·
--
Pasayuvchi
Tarjimani ko‘rish
$RENDER Price Prediction Today: Render Crypto Signal & Technical Analysis 📊
🔴 SHORT | Entry 1.662 - 1.668 | TP1 1.557 | SL 1.773
👉 Tap $RENDER to place your trade fast
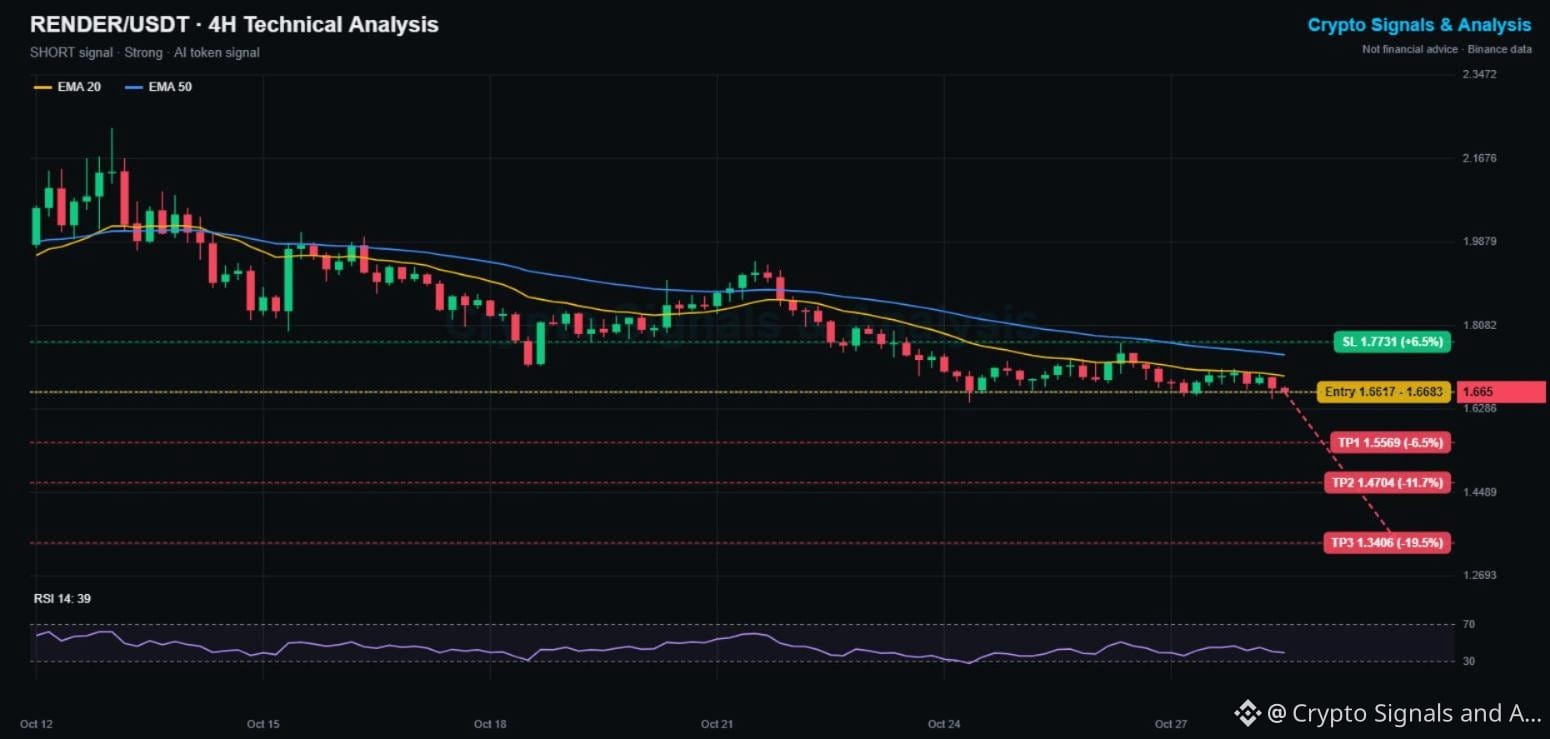
Render, the AI and GPU computing token, is down 13% this week and 25% since Oct 13 (from 2.23 to 1.65). It just slipped to a new low for the week, and the 4H EMAs keep pressing it lower.
📌 RENDER TRADING SIGNAL (Strong, 5/5 signals agree)
Entry: 1.662 - 1.668
Take profit 1: 1.557 (-6.5%)
Take profit 2: 1.470 (-11.7%)
Take profit 3: 1.341 (-19.5%)
Stop loss: 1.773 (+6.5%)
📊 RENDER TECHNICAL ANALYSIS (4H CHART)
Price is under the EMA20 (1.700) and EMA50 (1.745), both are falling, and RSI at 39 shows sellers in control. The 1.643 to 1.65 zone is the last support from Oct 24. A clean break below it has no nearby floor until the 1.50s.
🔑 KEY LEVELS
Support: 1.643, then 1.557
Resistance: 1.700 (EMA20), then 1.771
📈 Bullish scenario: a 4H close above 1.773 breaks the downtrend and cancels the short.
📉 Bearish scenario: a close under 1.643 confirms the breakdown toward TP1 and TP2.
💡 Bottom line: AI tokens are the weakest sector this week, and Render's trend is clearly down.
👉 Tap $RENDER
to open the live chart. NFA
🔥 TRADE WITH LOWER FEES
✅ Get a 20% kickback on your Binance trading fees, for life
👇👇👇
{spot}(RENDERUSDT)
[Claim your 20% Binance fee kickback here](https://www.binance.com/register?ref=X0NQWZ4N)
━━━━━━━━━━
AI crypto sell-off: buying opportunity or warning sign? 👇
Follow Crypto Signals and Analysis for daily signals.
#cryptosignals #RENDER #CanGoogleDefendItsCore
⚠️ Crypto is volatile: risk only what you can afford to lose.
$RENDER Price Prediction Today: Render Crypto Signal & Technical Analysis 📊
🔴 SHORT | Entry 1.662 - 1.668 | TP1 1.557 | SL 1.773
👉 Tap $RENDER to place your trade fast
Render, the AI and GPU computing token, is down 13% this week and 25% since Oct 13 (from 2.23 to 1.65). It just slipped to a new low for the week, and the 4H EMAs keep pressing it lower.
📌 RENDER TRADING SIGNAL (Strong, 5/5 signals agree)
Entry: 1.662 - 1.668
Take profit 1: 1.557 (-6.5%)
Take profit 2: 1.470 (-11.7%)
Take profit 3: 1.341 (-19.5%)
Stop loss: 1.773 (+6.5%)
📊 RENDER TECHNICAL ANALYSIS (4H CHART)
Price is under the EMA20 (1.700) and EMA50 (1.745), both are falling, and RSI at 39 shows sellers in control. The 1.643 to 1.65 zone is the last support from Oct 24. A clean break below it has no nearby floor until the 1.50s.
🔑 KEY LEVELS
Support: 1.643, then 1.557
Resistance: 1.700 (EMA20), then 1.771
📈 Bullish scenario: a 4H close above 1.773 breaks the downtrend and cancels the short.
📉 Bearish scenario: a close under 1.643 confirms the breakdown toward TP1 and TP2.
💡 Bottom line: AI tokens are the weakest sector this week, and Render's trend is clearly down.
👉 Tap $RENDER
to open the live chart. NFA
🔥 TRADE WITH LOWER FEES
✅ Get a 20% kickback on your Binance trading fees, for life
👇👇👇
Claim your 20% Binance fee kickback here
━━━━━━━━━━
AI crypto sell-off: buying opportunity or warning sign? 👇
Follow Crypto Signals and Analysis for daily signals.
#cryptosignals #RENDER #CanGoogleDefendItsCore
⚠️ Crypto is volatile: risk only what you can afford to lose.
28
·
--
Pasayuvchi
Tarjimani ko‘rish
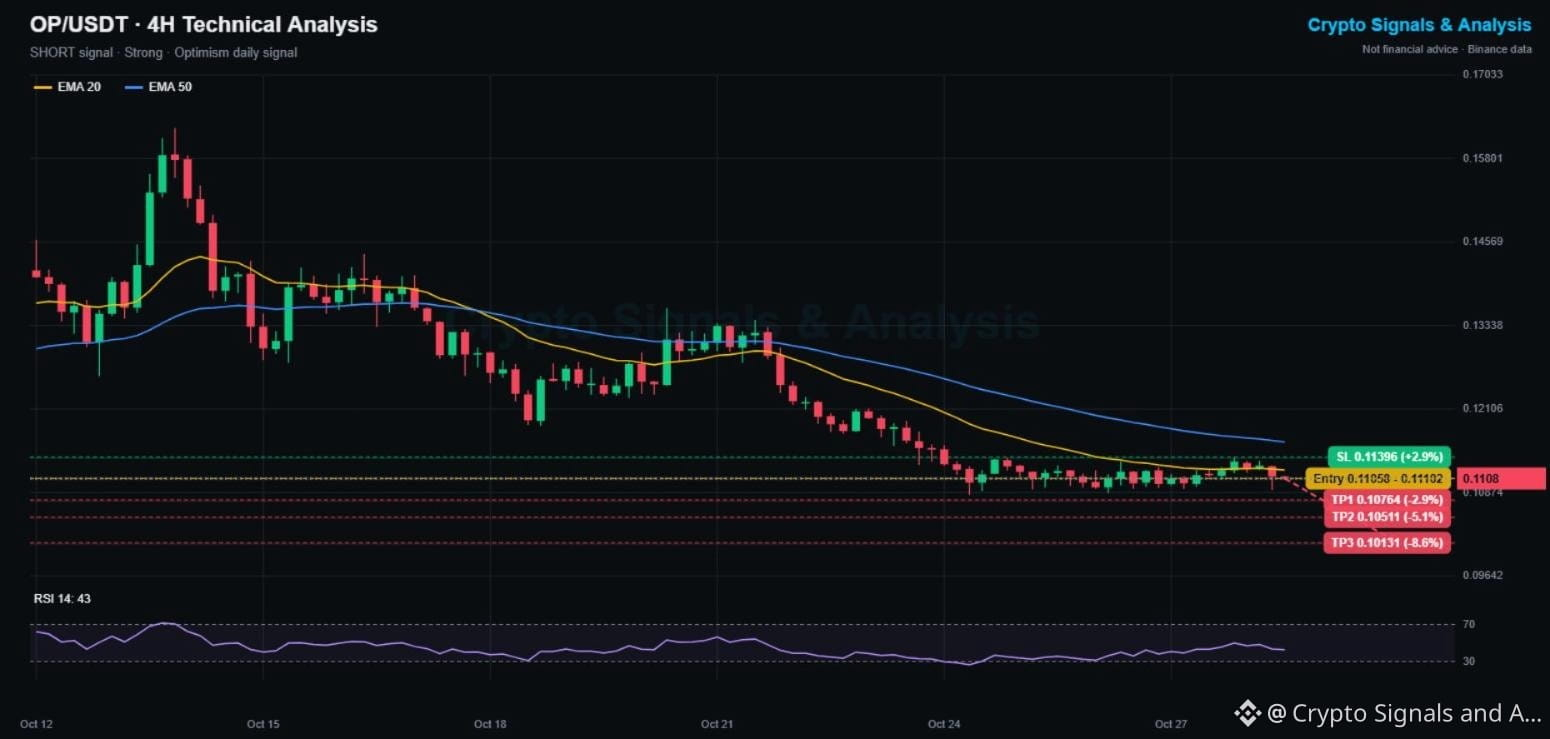
$OP Price Prediction Today: Optimism Crypto Signal & Technical Analysis 📊
🔴 SHORT | Entry 0.1106 - 0.1110 | TP1 0.1076 | SL 0.1140
👉 Tap $OP to place your trade fast
Optimism has collapsed 33% from its Oct 14 spike at 0.1625 and is down 16% this week. It has been drifting along the 0.108 to 0.114 floor for 5 days, capped every time by the falling 4H EMA20.
📌 OPTIMISM TRADING SIGNAL (Strong, 5/5 signals agree)
Entry: 0.1106 - 0.1110
Take profit 1: 0.1076 (-2.9%)
Take profit 2: 0.1051 (-5.1%)
Take profit 3: 0.1013 (-8.6%)
Stop loss: 0.1140 (+2.9%)
📊 OP TECHNICAL ANALYSIS (4H CHART)
OP sits under the EMA20 (0.1121) and EMA50 (0.1162), both sloping down. RSI at 43 shows weak buying. The 0.1084 to 0.1087 lows are the line to watch. Below them, the psychological 0.10 level is the next magnet.
🔑 KEY LEVELS
Support: 0.1084, then 0.1050
Resistance: 0.1121 (EMA20), then 0.1139
📈 Bullish scenario: a 4H close above 0.1140 breaks the range and cancels the short.
📉 Bearish scenario: losing 0.1084 opens TP2 and the 0.10 round number.
💡 Bottom line: Optimism is still searching for a bottom. Low volatility, tight stop, clear direction.
👉 Tap $OP
to open the live chart. NFA
🔥 TRADE WITH LOWER FEES
✅ Get a 20% kickback on your Binance trading fees, for life
👇👇👇
{spot}(OPUSDT)
[Claim your 20% Binance fee kickback here](https://www.binance.com/register?ref=X0NQWZ4N)
━━━━━━━━━━
Will Optimism hold 0.10, or is a new low coming? 👇
Follow Crypto Signals and Analysis for daily signals.
#cryptosignals #OP #CanMicrosoftDeliverOnAI
⚠️ Crypto is volatile: risk only what you can afford to lose.
$OP Price Prediction Today: Optimism Crypto Signal & Technical Analysis 📊
🔴 SHORT | Entry 0.1106 - 0.1110 | TP1 0.1076 | SL 0.1140
👉 Tap $OP to place your trade fast
Optimism has collapsed 33% from its Oct 14 spike at 0.1625 and is down 16% this week. It has been drifting along the 0.108 to 0.114 floor for 5 days, capped every time by the falling 4H EMA20.
📌 OPTIMISM TRADING SIGNAL (Strong, 5/5 signals agree)
Entry: 0.1106 - 0.1110
Take profit 1: 0.1076 (-2.9%)
Take profit 2: 0.1051 (-5.1%)
Take profit 3: 0.1013 (-8.6%)
Stop loss: 0.1140 (+2.9%)
📊 OP TECHNICAL ANALYSIS (4H CHART)
OP sits under the EMA20 (0.1121) and EMA50 (0.1162), both sloping down. RSI at 43 shows weak buying. The 0.1084 to 0.1087 lows are the line to watch. Below them, the psychological 0.10 level is the next magnet.
🔑 KEY LEVELS
Support: 0.1084, then 0.1050
Resistance: 0.1121 (EMA20), then 0.1139
📈 Bullish scenario: a 4H close above 0.1140 breaks the range and cancels the short.
📉 Bearish scenario: losing 0.1084 opens TP2 and the 0.10 round number.
💡 Bottom line: Optimism is still searching for a bottom. Low volatility, tight stop, clear direction.
👉 Tap $OP
to open the live chart. NFA
🔥 TRADE WITH LOWER FEES
✅ Get a 20% kickback on your Binance trading fees, for life
👇👇👇
Claim your 20% Binance fee kickback here
━━━━━━━━━━
Will Optimism hold 0.10, or is a new low coming? 👇
Follow Crypto Signals and Analysis for daily signals.
#cryptosignals #OP #CanMicrosoftDeliverOnAI
⚠️ Crypto is volatile: risk only what you can afford to lose.
139
·
--
O‘suvchi
Tarjimani ko‘rish
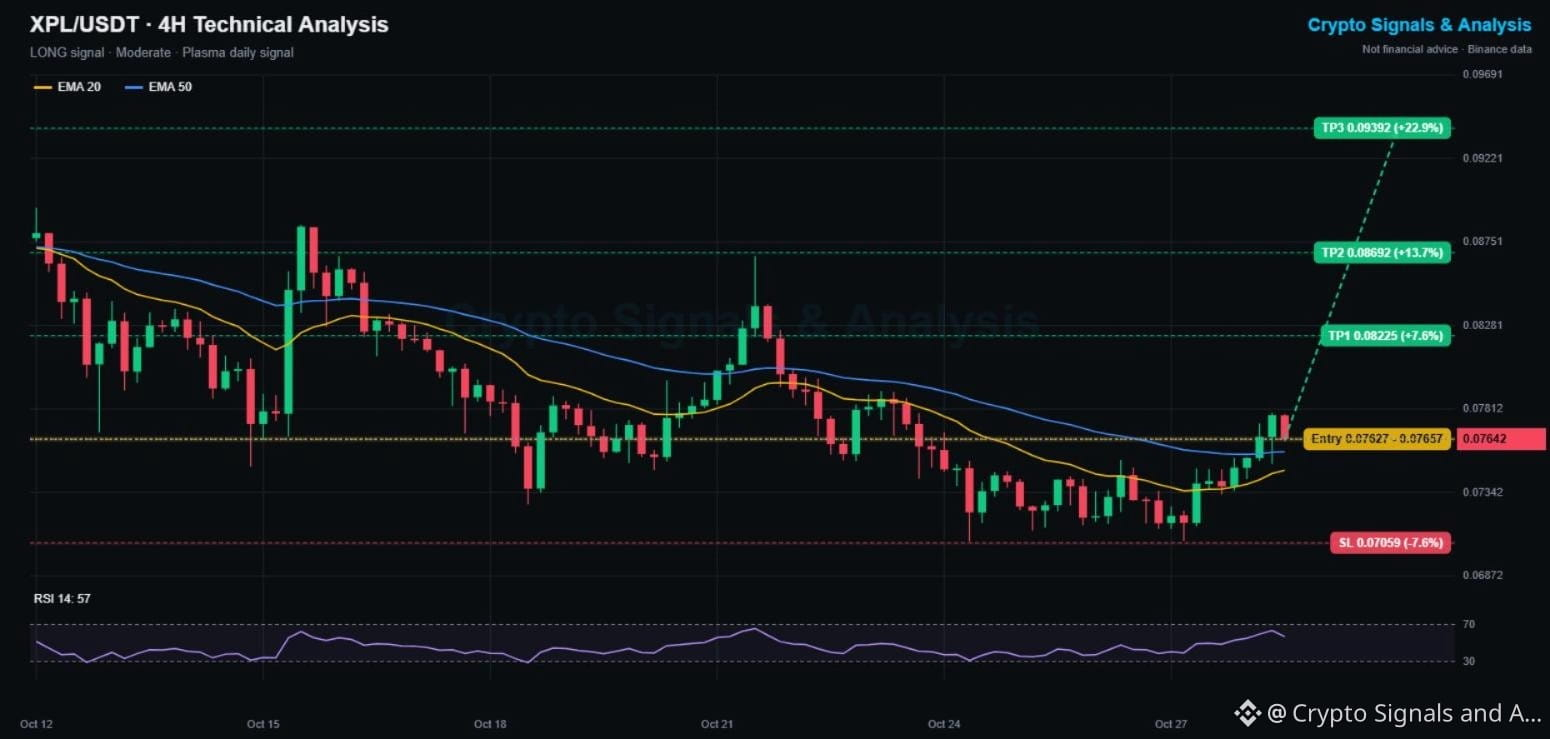
$XPL Price Prediction Today: Plasma Crypto Signal & Technical Analysis 📊
🟢 LONG | Entry 0.07627 - 0.07657 | TP1 0.08225 | SL 0.07059
👉 Tap $XPL to place your trade fast
Plasma, the stablecoin-focused blockchain, is up 3.2% today and just broke above its 4H EMA50 for the first time since Oct 22. It held a double bottom at 0.0707 and is now turning the trend.
📌 PLASMA TRADING SIGNAL (Moderate, 4/5 signals agree)
Entry: 0.07627 - 0.07657
Take profit 1: 0.08225 (+7.6%)
Take profit 2: 0.08692 (+13.7%)
Take profit 3: 0.09392 (+22.9%)
Stop loss: 0.07059 (-7.6%)
📊 XPL TECHNICAL ANALYSIS (4H CHART)
Price is above the EMA20 (0.0747) and EMA50 (0.0757), and the EMA20 is curling up for a bullish cross. RSI at 57 favors buyers. The 0.0779 recent high is the first test. Above it, the Oct 21 spike zone at 0.082 to 0.087 is the main target.
🔑 KEY LEVELS
Support: 0.0757 (EMA50), then 0.0707
Resistance: 0.0779, then 0.0822
📈 Bullish scenario: a 4H close above 0.0779 confirms the breakout and targets TP1 and TP2.
📉 Bearish scenario: losing the EMA50 makes this a fakeout. A close under 0.07059 cancels this signal.
💡 Bottom line: a double bottom plus an EMA50 reclaim is a solid early-trend setup.
👉 Tap $XPL
to open the live chart. NFA
🔥 TRADE WITH LOWER FEES
✅ Get a 20% kickback on your Binance trading fees, for life
👇👇👇
{spot}(XPLUSDT)
[Claim your 20% Binance fee kickback here](https://www.binance.com/register?ref=X0NQWZ4N)
━━━━━━━━━━
Stablecoin chains: the next big narrative? What do you think 👇
Follow Crypto Signals and Analysis for daily signals.
#cryptosignals #XPL #EarningsSeason
⚠️ Crypto is volatile: risk only what you can afford to lose.
$XPL Price Prediction Today: Plasma Crypto Signal & Technical Analysis 📊
🟢 LONG | Entry 0.07627 - 0.07657 | TP1 0.08225 | SL 0.07059
👉 Tap $XPL to place your trade fast
Plasma, the stablecoin-focused blockchain, is up 3.2% today and just broke above its 4H EMA50 for the first time since Oct 22. It held a double bottom at 0.0707 and is now turning the trend.
📌 PLASMA TRADING SIGNAL (Moderate, 4/5 signals agree)
Entry: 0.07627 - 0.07657
Take profit 1: 0.08225 (+7.6%)
Take profit 2: 0.08692 (+13.7%)
Take profit 3: 0.09392 (+22.9%)
Stop loss: 0.07059 (-7.6%)
📊 XPL TECHNICAL ANALYSIS (4H CHART)
Price is above the EMA20 (0.0747) and EMA50 (0.0757), and the EMA20 is curling up for a bullish cross. RSI at 57 favors buyers. The 0.0779 recent high is the first test. Above it, the Oct 21 spike zone at 0.082 to 0.087 is the main target.
🔑 KEY LEVELS
Support: 0.0757 (EMA50), then 0.0707
Resistance: 0.0779, then 0.0822
📈 Bullish scenario: a 4H close above 0.0779 confirms the breakout and targets TP1 and TP2.
📉 Bearish scenario: losing the EMA50 makes this a fakeout. A close under 0.07059 cancels this signal.
💡 Bottom line: a double bottom plus an EMA50 reclaim is a solid early-trend setup.
👉 Tap $XPL
to open the live chart. NFA
🔥 TRADE WITH LOWER FEES
✅ Get a 20% kickback on your Binance trading fees, for life
👇👇👇
Claim your 20% Binance fee kickback here
━━━━━━━━━━
Stablecoin chains: the next big narrative? What do you think 👇
Follow Crypto Signals and Analysis for daily signals.
#cryptosignals #XPL #EarningsSeason
⚠️ Crypto is volatile: risk only what you can afford to lose.
149
·
--
O‘suvchi
Tarjimani ko‘rish
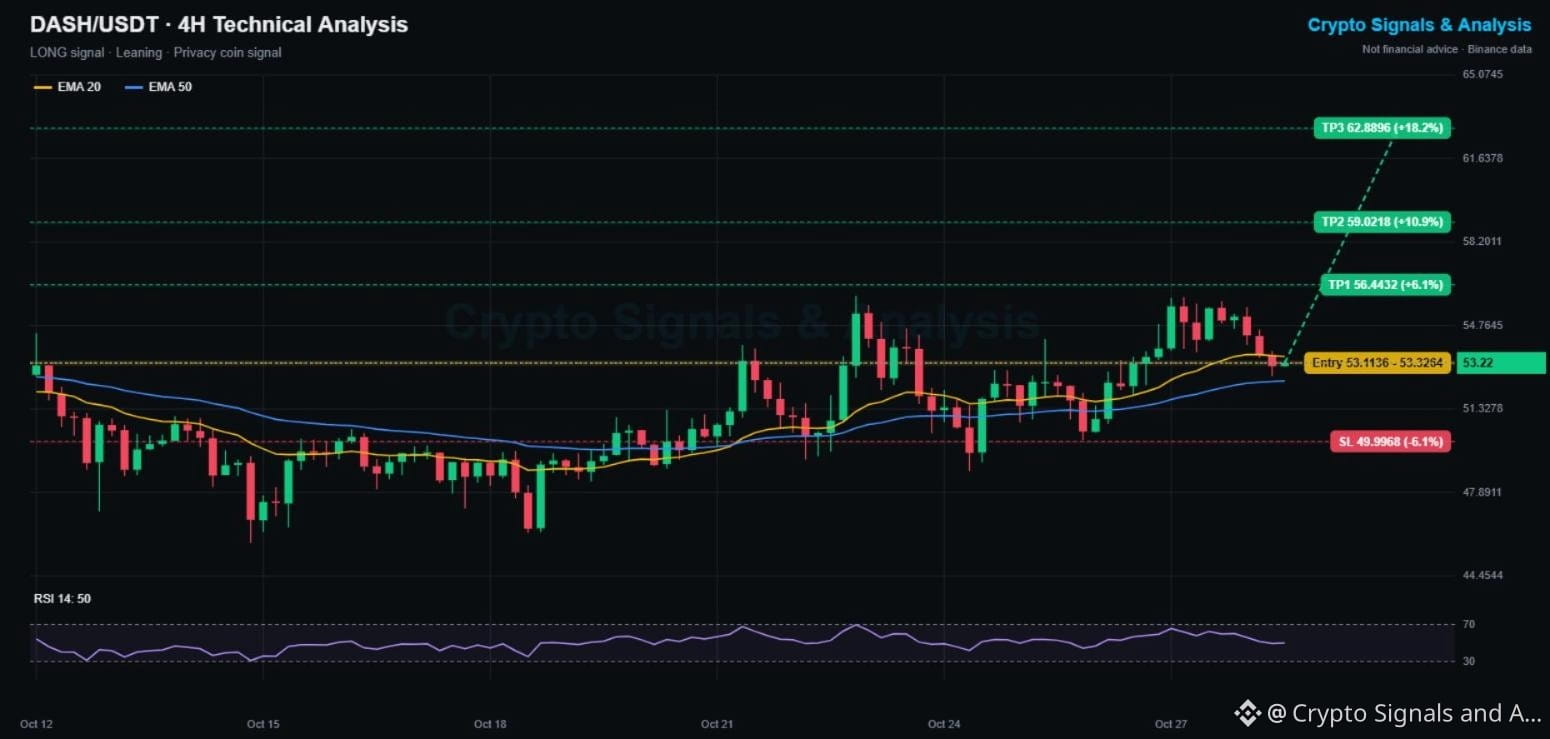
$DASH Price Prediction Today: Dash Crypto Signal & Technical Analysis 📊
🟢 LONG | Entry 53.11 - 53.33 | TP1 56.44 | SL 50.00
👉 Tap $DASH to place your trade fast
Dash, like Zcash, is one of the few coins in an uptrend this month, with higher lows since Oct 19 (45.8, then 49.0, then 50.0). After a 4% pullback today, it is sitting right on its rising 4H EMA50, a classic buy-the-dip zone.
📌 DASH TRADING SIGNAL (Leaning, pullback in an uptrend)
Entry: 53.11 - 53.33
Take profit 1: 56.44 (+6.1%)
Take profit 2: 59.02 (+10.9%)
Take profit 3: 62.89 (+18.2%)
Stop loss: 50.00 (-6.1%)
📊 DASH TECHNICAL ANALYSIS (4H CHART)
The bigger trend is up: the EMA50 (52.49) is rising, and price has stayed above it since Oct 21. The short-term dip took price just under the EMA20 (53.49), and RSI reset to 50. The 55.9 high (double top area) is the key breakout level.
🔑 KEY LEVELS
Support: 52.49 (EMA50), then 50.06
Resistance: 53.49 (EMA20), then 55.92
📈 Bullish scenario: a bounce from the EMA50 and a close above 55.9 opens TP2 and TP3.
📉 Bearish scenario: losing the EMA50 means the uptrend is in trouble. A close under 50.00 cancels this signal.
💡 Bottom line: privacy coins are outperforming this month. This is a dip-buy in an uptrend, with a clear stop.
👉 Tap $DASH
to open the live chart. NFA
🔥 TRADE WITH LOWER FEES
✅ Get a 20% kickback on your Binance trading fees, for life
👇👇👇
{spot}(DASHUSDT)
[Claim your 20% Binance fee kickback here](https://www.binance.com/register?ref=X0NQWZ4N)
━━━━━━━━━━
Zcash or Dash: which privacy coin is your pick? 👇
Follow Crypto Signals and Analysis for daily signals.
#cryptosignals #DASH #CanGoogleDefendItsCore
⚠️ Crypto is volatile: risk only what you can afford to lose.
$DASH Price Prediction Today: Dash Crypto Signal & Technical Analysis 📊
🟢 LONG | Entry 53.11 - 53.33 | TP1 56.44 | SL 50.00
👉 Tap $DASH to place your trade fast
Dash, like Zcash, is one of the few coins in an uptrend this month, with higher lows since Oct 19 (45.8, then 49.0, then 50.0). After a 4% pullback today, it is sitting right on its rising 4H EMA50, a classic buy-the-dip zone.
📌 DASH TRADING SIGNAL (Leaning, pullback in an uptrend)
Entry: 53.11 - 53.33
Take profit 1: 56.44 (+6.1%)
Take profit 2: 59.02 (+10.9%)
Take profit 3: 62.89 (+18.2%)
Stop loss: 50.00 (-6.1%)
📊 DASH TECHNICAL ANALYSIS (4H CHART)
The bigger trend is up: the EMA50 (52.49) is rising, and price has stayed above it since Oct 21. The short-term dip took price just under the EMA20 (53.49), and RSI reset to 50. The 55.9 high (double top area) is the key breakout level.
🔑 KEY LEVELS
Support: 52.49 (EMA50), then 50.06
Resistance: 53.49 (EMA20), then 55.92
📈 Bullish scenario: a bounce from the EMA50 and a close above 55.9 opens TP2 and TP3.
📉 Bearish scenario: losing the EMA50 means the uptrend is in trouble. A close under 50.00 cancels this signal.
💡 Bottom line: privacy coins are outperforming this month. This is a dip-buy in an uptrend, with a clear stop.
👉 Tap $DASH
to open the live chart. NFA
🔥 TRADE WITH LOWER FEES
✅ Get a 20% kickback on your Binance trading fees, for life
👇👇👇
Claim your 20% Binance fee kickback here
━━━━━━━━━━
Zcash or Dash: which privacy coin is your pick? 👇
Follow Crypto Signals and Analysis for daily signals.
#cryptosignals #DASH #CanGoogleDefendItsCore
⚠️ Crypto is volatile: risk only what you can afford to lose.
134
·
--
O‘suvchi
Tarjimani ko‘rish
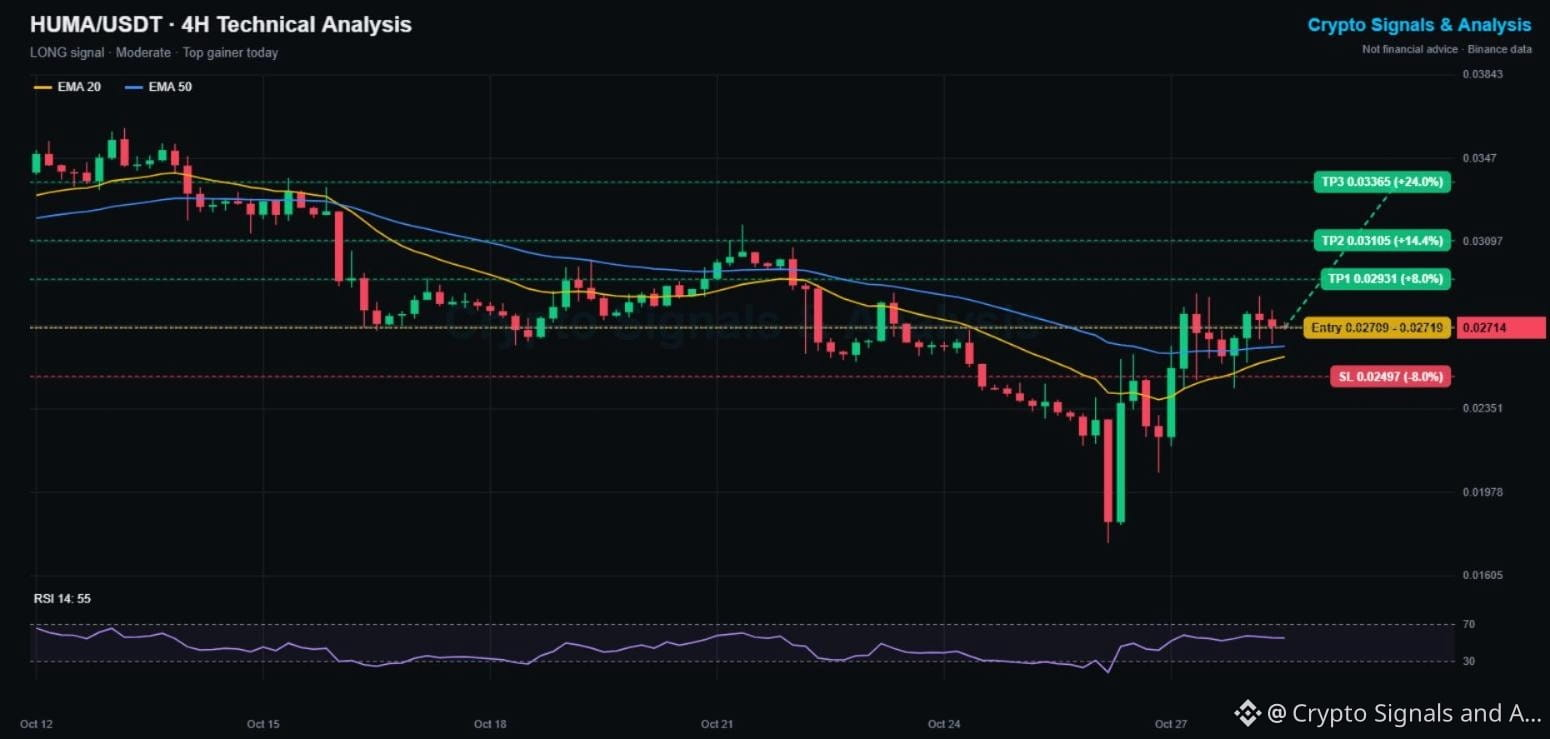
$HUMA Price Prediction Today: Huma Finance Crypto Signal & Technical Analysis 📊
🟢 LONG | Entry 0.02709 - 0.02719 | TP1 0.02931 | SL 0.02497
👉 Tap $HUMA to place your trade fast
Huma Finance printed a sharp V-bottom: a flush to 0.0175 on Oct 26, then a 55% rebound to 0.027. Price has now reclaimed both 4H EMAs and is holding above them, which shows buyers absorbing the dips.
📌 HUMA TRADING SIGNAL (Moderate, 4/5 signals agree)
Entry: 0.02709 - 0.02719
Take profit 1: 0.02931 (+8%)
Take profit 2: 0.03105 (+14%)
Take profit 3: 0.03365 (+24%)
Stop loss: 0.02497 (-8%)
📊 HUMA TECHNICAL ANALYSIS (4H CHART)
The EMA20 (0.0259) is rising toward a bullish cross with the EMA50 (0.0263). RSI at 55 has room to run. The 0.0287 high is the first barrier, and above it the Oct 21 high around 0.031 lines up with TP2.
🔑 KEY LEVELS
Support: 0.0263 (EMA50), then 0.0250
Resistance: 0.0287, then 0.0310
📈 Bullish scenario: a 4H close above 0.0287 confirms the reversal and opens TP2 and TP3.
📉 Bearish scenario: losing the EMAs sends HUMA back toward the 0.023 zone. A close under 0.02497 cancels this signal.
💡 Bottom line: V-bottoms are powerful when they hold. Keep the stop under the EMAs.
👉 Tap $HUMA
to open the live chart. NFA
🔥 TRADE WITH LOWER FEES
✅ Get a 20% kickback on your Binance trading fees, for life
👇👇👇
{spot}(HUMAUSDT)
[Claim your 20% Binance fee kickback here](https://www.binance.com/register?ref=X0NQWZ4N)
━━━━━━━━━━
Did you catch the Huma bounce, or are you waiting for a dip? 👇
Follow Crypto Signals and Analysis for daily signals.
#cryptosignals #HUMA #CanMicrosoftDeliverOnAI
⚠️ Crypto is volatile: risk only what you can afford to lose.
$HUMA Price Prediction Today: Huma Finance Crypto Signal & Technical Analysis 📊
🟢 LONG | Entry 0.02709 - 0.02719 | TP1 0.02931 | SL 0.02497
👉 Tap $HUMA to place your trade fast
Huma Finance printed a sharp V-bottom: a flush to 0.0175 on Oct 26, then a 55% rebound to 0.027. Price has now reclaimed both 4H EMAs and is holding above them, which shows buyers absorbing the dips.
📌 HUMA TRADING SIGNAL (Moderate, 4/5 signals agree)
Entry: 0.02709 - 0.02719
Take profit 1: 0.02931 (+8%)
Take profit 2: 0.03105 (+14%)
Take profit 3: 0.03365 (+24%)
Stop loss: 0.02497 (-8%)
📊 HUMA TECHNICAL ANALYSIS (4H CHART)
The EMA20 (0.0259) is rising toward a bullish cross with the EMA50 (0.0263). RSI at 55 has room to run. The 0.0287 high is the first barrier, and above it the Oct 21 high around 0.031 lines up with TP2.
🔑 KEY LEVELS
Support: 0.0263 (EMA50), then 0.0250
Resistance: 0.0287, then 0.0310
📈 Bullish scenario: a 4H close above 0.0287 confirms the reversal and opens TP2 and TP3.
📉 Bearish scenario: losing the EMAs sends HUMA back toward the 0.023 zone. A close under 0.02497 cancels this signal.
💡 Bottom line: V-bottoms are powerful when they hold. Keep the stop under the EMAs.
👉 Tap $HUMA
to open the live chart. NFA
🔥 TRADE WITH LOWER FEES
✅ Get a 20% kickback on your Binance trading fees, for life
👇👇👇
Claim your 20% Binance fee kickback here
━━━━━━━━━━
Did you catch the Huma bounce, or are you waiting for a dip? 👇
Follow Crypto Signals and Analysis for daily signals.
#cryptosignals #HUMA #CanMicrosoftDeliverOnAI
⚠️ Crypto is volatile: risk only what you can afford to lose.
34
·
--
Pasayuvchi
Tarjimani ko‘rish
$ETC Price Prediction Today: Ethereum Classic Crypto Signal & Technical Analysis 📊
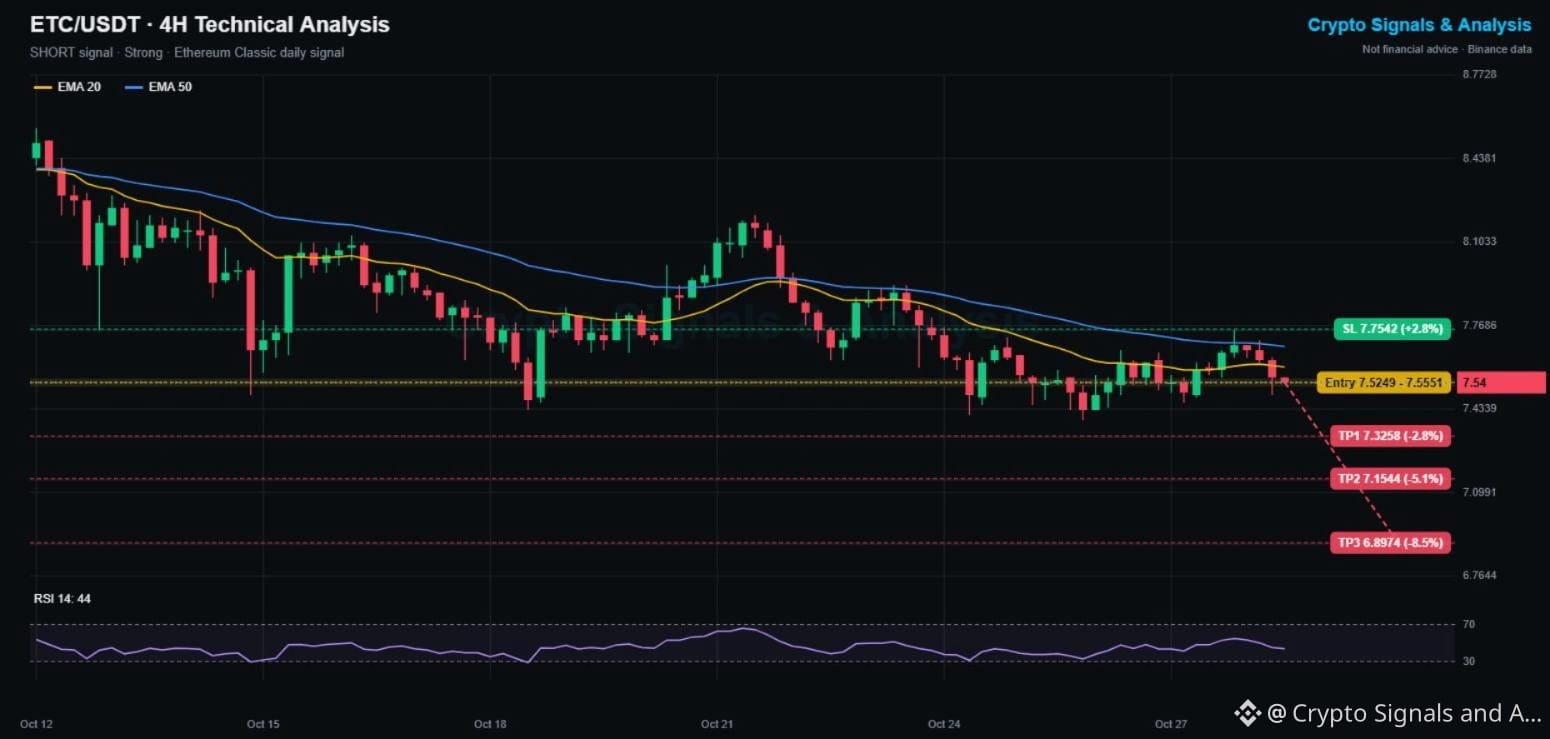
🔴 SHORT | Entry 7.525 - 7.555 | TP1 7.326 | SL 7.754
👉 Tap $ETC to place your trade fast
Ethereum Classic tested its falling 4H EMA50 at 7.75 yesterday and got rejected once more. Now it is back under both EMAs and heading toward the 7.39 weekly low, down 7.6% on the week.
📌 ETHEREUM CLASSIC TRADING SIGNAL (Strong, 5/5 signals agree)
Entry: 7.525 - 7.555
Take profit 1: 7.326 (-2.8%)
Take profit 2: 7.154 (-5.1%)
Take profit 3: 6.897 (-8.5%)
Stop loss: 7.754 (+2.8%)
📊 ETC TECHNICAL ANALYSIS (4H CHART)
ETC has slid from 8.56 to 7.39 since Oct 12, with lower highs at 8.2, 7.9 and 7.75. The EMA20 (7.60) and EMA50 (7.68) are falling and act as a ceiling. RSI at 44 leans bearish. A break of 7.39 would put the 7.0 area in play.
🔑 KEY LEVELS
Support: 7.39, then 7.15
Resistance: 7.60 (EMA20), then 7.75
📈 Bullish scenario: a 4H close above 7.754 breaks the lower-high pattern and cancels the short.
📉 Bearish scenario: a close under 7.39 opens TP2 and TP3.
💡 Bottom line: lower highs plus falling EMAs means the trend is down. Short rallies toward 7.6 to 7.7.
👉 Tap $ETC
to open the live chart. NFA
🔥 TRADE WITH LOWER FEES
✅ Get a 20% kickback on your Binance trading fees, for life
👇👇👇
{spot}(ETCUSDT)
[Claim your 20% Binance fee kickback here](https://www.binance.com/register?ref=X0NQWZ4N)
━━━━━━━━━━
Ethereum Classic at 7 or 8.5 first? Vote below 👇
Follow Crypto Signals and Analysis for daily signals.
#cryptosignals #ETC #CanGoogleDefendItsCore
⚠️ Crypto is volatile: risk only what you can afford to lose.
$ETC Price Prediction Today: Ethereum Classic Crypto Signal & Technical Analysis 📊
🔴 SHORT | Entry 7.525 - 7.555 | TP1 7.326 | SL 7.754
👉 Tap $ETC to place your trade fast
Ethereum Classic tested its falling 4H EMA50 at 7.75 yesterday and got rejected once more. Now it is back under both EMAs and heading toward the 7.39 weekly low, down 7.6% on the week.
📌 ETHEREUM CLASSIC TRADING SIGNAL (Strong, 5/5 signals agree)
Entry: 7.525 - 7.555
Take profit 1: 7.326 (-2.8%)
Take profit 2: 7.154 (-5.1%)
Take profit 3: 6.897 (-8.5%)
Stop loss: 7.754 (+2.8%)
📊 ETC TECHNICAL ANALYSIS (4H CHART)
ETC has slid from 8.56 to 7.39 since Oct 12, with lower highs at 8.2, 7.9 and 7.75. The EMA20 (7.60) and EMA50 (7.68) are falling and act as a ceiling. RSI at 44 leans bearish. A break of 7.39 would put the 7.0 area in play.
🔑 KEY LEVELS
Support: 7.39, then 7.15
Resistance: 7.60 (EMA20), then 7.75
📈 Bullish scenario: a 4H close above 7.754 breaks the lower-high pattern and cancels the short.
📉 Bearish scenario: a close under 7.39 opens TP2 and TP3.
💡 Bottom line: lower highs plus falling EMAs means the trend is down. Short rallies toward 7.6 to 7.7.
👉 Tap $ETC
to open the live chart. NFA
🔥 TRADE WITH LOWER FEES
✅ Get a 20% kickback on your Binance trading fees, for life
👇👇👇
Claim your 20% Binance fee kickback here
━━━━━━━━━━
Ethereum Classic at 7 or 8.5 first? Vote below 👇
Follow Crypto Signals and Analysis for daily signals.
#cryptosignals #ETC #CanGoogleDefendItsCore
⚠️ Crypto is volatile: risk only what you can afford to lose.
5
·
--
O‘suvchi
Tarjimani ko‘rish
$TUT Price Prediction Today: Tutorial Token Crypto Signal & Technical Analysis 📊
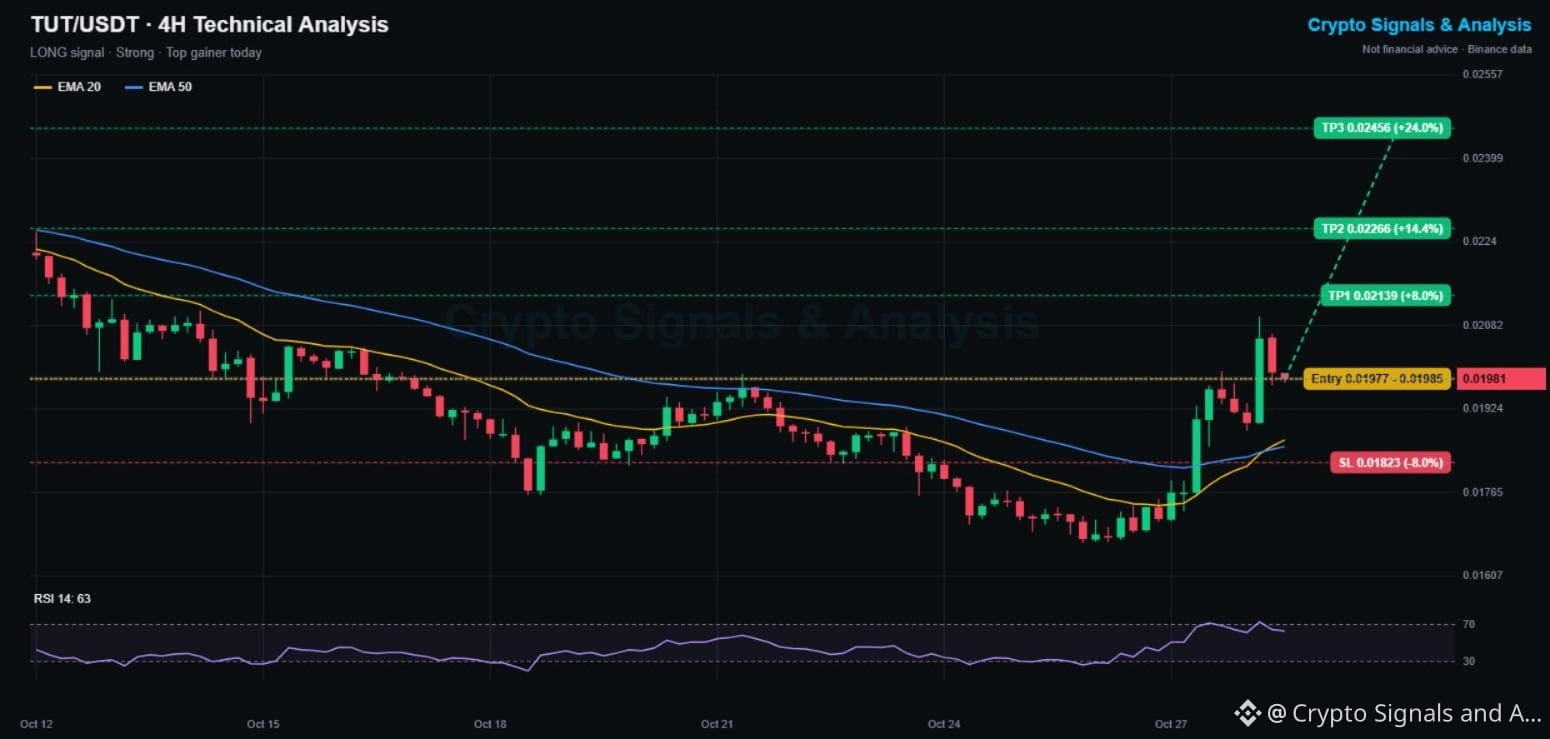
🟢 LONG | Entry 0.01977 - 0.01985 | TP1 0.02139 | SL 0.01823
👉 Tap $TUT to place your trade fast
TUT, the BNB Chain meme coin, was one of today's top gainers. It bounced 25% off the 0.0167 low, broke above both 4H EMAs, and the EMA20 has just crossed above the EMA50: a fresh bullish cross.
📌 TUT TRADING SIGNAL (Strong, 5/5 signals agree)
Entry: 0.01977 - 0.01985
Take profit 1: 0.02139 (+8%)
Take profit 2: 0.02266 (+14%)
Take profit 3: 0.02456 (+24%)
Stop loss: 0.01823 (-8%)
📊 TUT TECHNICAL ANALYSIS (4H CHART)
Price holds well above the EMA20 (0.01865) and EMA50 (0.01852). RSI at 63 is strong but has cooled from 70. The spike to 0.0210 was partly sold, so a small pullback toward 0.0193 is possible before the next push. The Oct 12 high at 0.0226 is the main upside target.
🔑 KEY LEVELS
Support: 0.0193, then 0.01865 (EMA20)
Resistance: 0.0210, then 0.0226
📈 Bullish scenario: a 4H close above 0.0210 opens TP2 at the Oct 12 high.
📉 Bearish scenario: losing the EMAs makes this a failed breakout. A close under 0.01823 cancels this signal.
💡 Bottom line: a fresh trend change on a volatile meme coin. Small size, and take partial profit at TP1.
👉 Tap $TUT
to open the live chart. NFA
🔥 TRADE WITH LOWER FEES
✅ Get a 20% kickback on your Binance trading fees, for life
👇👇👇
{spot}(TUTUSDT)
[Claim your 20% Binance fee kickback here](https://www.binance.com/register?ref=X0NQWZ4N)
━━━━━━━━━━
BNB Chain memes are waking up. Which one are you watching? 👇
Follow Crypto Signals and Analysis for daily signals.
#cryptosignals #TUT #EarningsSeason
⚠️ Crypto is volatile: risk only what you can afford to lose.
$TUT Price Prediction Today: Tutorial Token Crypto Signal & Technical Analysis 📊
🟢 LONG | Entry 0.01977 - 0.01985 | TP1 0.02139 | SL 0.01823
👉 Tap $TUT to place your trade fast
TUT, the BNB Chain meme coin, was one of today's top gainers. It bounced 25% off the 0.0167 low, broke above both 4H EMAs, and the EMA20 has just crossed above the EMA50: a fresh bullish cross.
📌 TUT TRADING SIGNAL (Strong, 5/5 signals agree)
Entry: 0.01977 - 0.01985
Take profit 1: 0.02139 (+8%)
Take profit 2: 0.02266 (+14%)
Take profit 3: 0.02456 (+24%)
Stop loss: 0.01823 (-8%)
📊 TUT TECHNICAL ANALYSIS (4H CHART)
Price holds well above the EMA20 (0.01865) and EMA50 (0.01852). RSI at 63 is strong but has cooled from 70. The spike to 0.0210 was partly sold, so a small pullback toward 0.0193 is possible before the next push. The Oct 12 high at 0.0226 is the main upside target.
🔑 KEY LEVELS
Support: 0.0193, then 0.01865 (EMA20)
Resistance: 0.0210, then 0.0226
📈 Bullish scenario: a 4H close above 0.0210 opens TP2 at the Oct 12 high.
📉 Bearish scenario: losing the EMAs makes this a failed breakout. A close under 0.01823 cancels this signal.
💡 Bottom line: a fresh trend change on a volatile meme coin. Small size, and take partial profit at TP1.
👉 Tap $TUT
to open the live chart. NFA
🔥 TRADE WITH LOWER FEES
✅ Get a 20% kickback on your Binance trading fees, for life
👇👇👇
Claim your 20% Binance fee kickback here
━━━━━━━━━━
BNB Chain memes are waking up. Which one are you watching? 👇
Follow Crypto Signals and Analysis for daily signals.
#cryptosignals #TUT #EarningsSeason
⚠️ Crypto is volatile: risk only what you can afford to lose.
120
·
--
Pasayuvchi
Tarjimani ko‘rish
$APT Price Prediction Today: Aptos Crypto Signal & Technical Analysis 📊
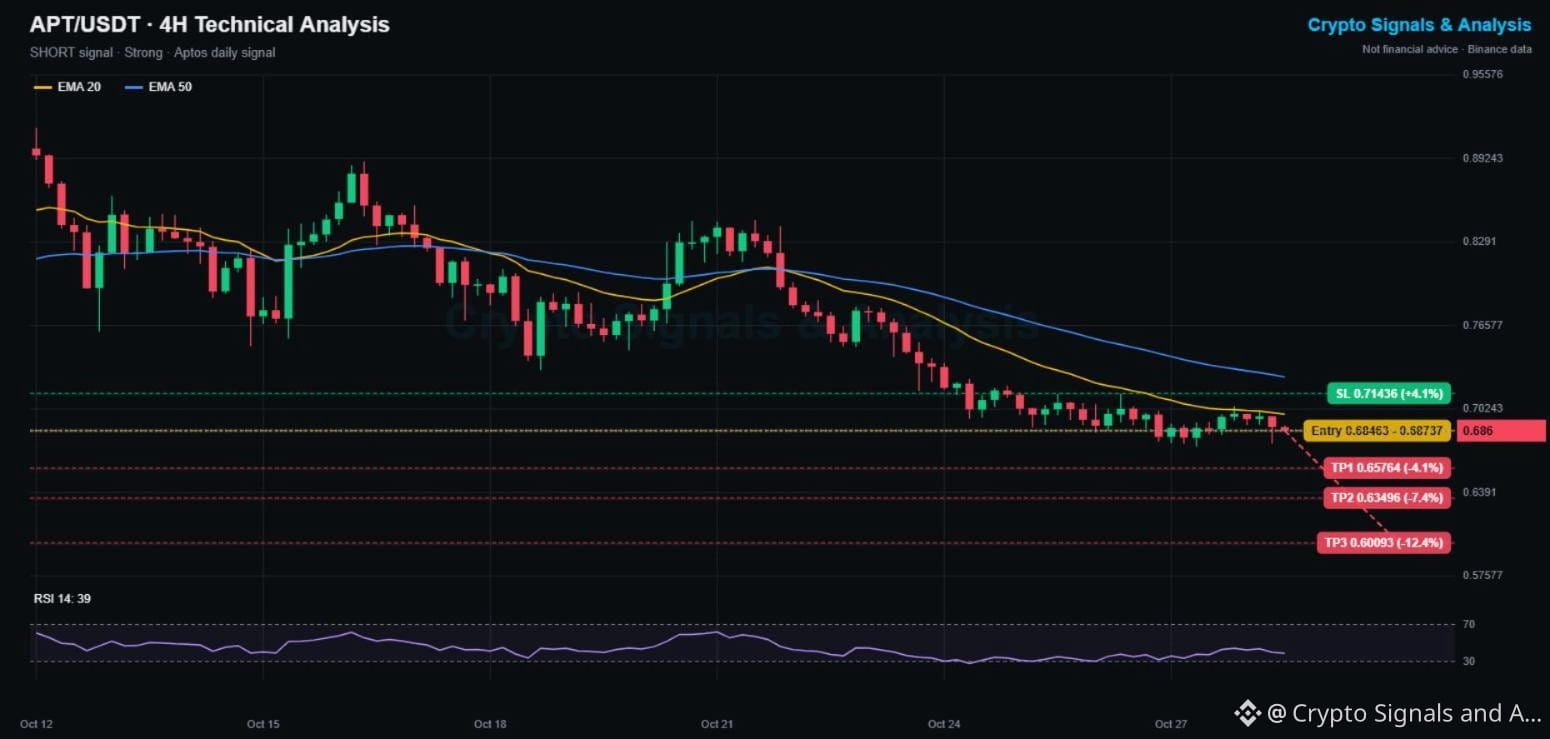
🔴 SHORT | Entry 0.6846 - 0.6874 | TP1 0.6576 | SL 0.7144
👉 Tap $APT to place your trade fast
Aptos is down 17% this week and 25% since Oct 12, from 0.92 to 0.674. It has spent 4 days pinned under the falling 4H EMA20, and every small bounce is getting sold.
📌 APTOS TRADING SIGNAL (Strong, 5/5 signals agree)
Entry: 0.6846 - 0.6874
Take profit 1: 0.6576 (-4.1%)
Take profit 2: 0.6350 (-7.4%)
Take profit 3: 0.6009 (-12.4%)
Stop loss: 0.7144 (+4.1%)
📊 APT TECHNICAL ANALYSIS (4H CHART)
All the trend signals point down: price is under the EMA20 (0.6984) and EMA50 (0.7268), both are sloping lower, and RSI at 39 shows weak demand. The 0.674 low is the only nearby support. Once it gives way, there is no structure until the low 0.60s.
🔑 KEY LEVELS
Support: 0.674, then 0.635
Resistance: 0.698 (EMA20), then 0.714
📈 Bullish scenario: a 4H close above 0.7144 reclaims the EMA zone and cancels the short.
📉 Bearish scenario: losing 0.674 opens TP2 and TP3.
💡 Bottom line: Aptos is one of the weakest layer 1 charts right now. Trend followers stay short under the EMAs.
👉 Tap $APT
to open the live chart. NFA
🔥 TRADE WITH LOWER FEES
✅ Get a 20% kickback on your Binance trading fees, for life
👇👇👇
{spot}(APTUSDT)
[Claim your 20% Binance fee kickback here](https://www.binance.com/register?ref=X0NQWZ4N)
━━━━━━━━━━
Aptos or Sui: which Move chain recovers first? 👇
Follow Crypto Signals and Analysis for daily signals.
#cryptosignals #APT #CanMicrosoftDeliverOnAI
⚠️ Crypto is volatile: risk only what you can afford to lose.
$APT Price Prediction Today: Aptos Crypto Signal & Technical Analysis 📊
🔴 SHORT | Entry 0.6846 - 0.6874 | TP1 0.6576 | SL 0.7144
👉 Tap $APT to place your trade fast
Aptos is down 17% this week and 25% since Oct 12, from 0.92 to 0.674. It has spent 4 days pinned under the falling 4H EMA20, and every small bounce is getting sold.
📌 APTOS TRADING SIGNAL (Strong, 5/5 signals agree)
Entry: 0.6846 - 0.6874
Take profit 1: 0.6576 (-4.1%)
Take profit 2: 0.6350 (-7.4%)
Take profit 3: 0.6009 (-12.4%)
Stop loss: 0.7144 (+4.1%)
📊 APT TECHNICAL ANALYSIS (4H CHART)
All the trend signals point down: price is under the EMA20 (0.6984) and EMA50 (0.7268), both are sloping lower, and RSI at 39 shows weak demand. The 0.674 low is the only nearby support. Once it gives way, there is no structure until the low 0.60s.
🔑 KEY LEVELS
Support: 0.674, then 0.635
Resistance: 0.698 (EMA20), then 0.714
📈 Bullish scenario: a 4H close above 0.7144 reclaims the EMA zone and cancels the short.
📉 Bearish scenario: losing 0.674 opens TP2 and TP3.
💡 Bottom line: Aptos is one of the weakest layer 1 charts right now. Trend followers stay short under the EMAs.
👉 Tap $APT
to open the live chart. NFA
🔥 TRADE WITH LOWER FEES
✅ Get a 20% kickback on your Binance trading fees, for life
👇👇👇
Claim your 20% Binance fee kickback here
━━━━━━━━━━
Aptos or Sui: which Move chain recovers first? 👇
Follow Crypto Signals and Analysis for daily signals.
#cryptosignals #APT #CanMicrosoftDeliverOnAI
⚠️ Crypto is volatile: risk only what you can afford to lose.
145
·
--
O‘suvchi
Tarjimani ko‘rish
$SHIB Price Prediction Today: Shiba Inu Crypto Signal & Technical Analysis 📊
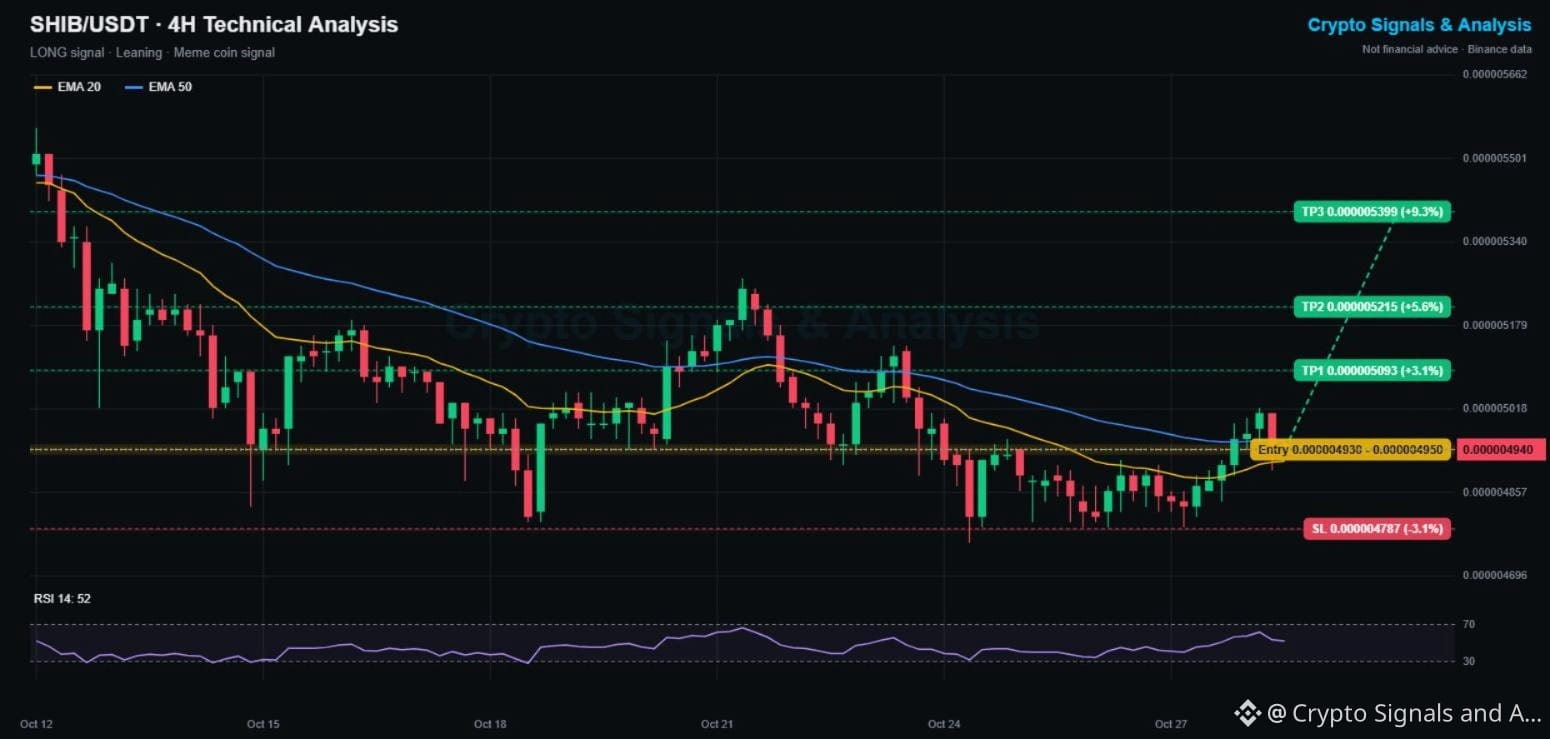
🟢 LONG | Entry 0.00000493 - 0.00000495 | TP1 0.00000509 | SL 0.00000479
👉 Tap $SHIB to place your trade fast
Shiba Inu is joining today's meme rebound. It held its 0.00000476 to 0.00000479 floor for 5 days, then broke above the 4H EMA20. Now it is retesting that EMA from above, which is a classic spot to buy a pullback.
📌 SHIBA INU TRADING SIGNAL (Leaning, early reversal setup)
Entry: 0.00000493 - 0.00000495
Take profit 1: 0.00000509 (+3.1%)
Take profit 2: 0.00000522 (+5.6%)
Take profit 3: 0.00000540 (+9.3%)
Stop loss: 0.00000479 (-3.1%)
📊 SHIB TECHNICAL ANALYSIS (4H CHART)
The EMA20 (0.000004918) has turned up, and the EMA50 (0.000004957) sits just overhead. RSI at 52 is neutral. The local high at 0.00000502 is the trigger: above it, SHIB has room to the Oct 21 high near 0.00000522.
🔑 KEY LEVELS
Support: 0.00000492 (EMA20), then 0.00000479
Resistance: 0.00000502, then 0.00000522
📈 Bullish scenario: a 4H close above 0.00000502 confirms the reversal and targets TP2 and TP3.
📉 Bearish scenario: losing the EMA20 puts SHIB back into its range. A close under 0.00000479 cancels this signal.
💡 Bottom line: a tight-stop meme play. If meme season continues, SHIB usually follows DOGE and PEPE.
👉 Tap $SHIB
to open the live chart. NFA
🔥 TRADE WITH LOWER FEES
✅ Get a 20% kickback on your Binance trading fees, for life
👇👇👇
{spot}(SHIBUSDT)
[Claim your 20% Binance fee kickback here](https://www.binance.com/register?ref=X0NQWZ4N)
━━━━━━━━━━
SHIB army: still holding, or did you switch to PEPE? 👇
Follow Crypto Signals and Analysis for daily signals.
#cryptosignals #SHİB #CanGoogleDefendItsCore
⚠️ Crypto is volatile: risk only what you can afford to lose.
$SHIB Price Prediction Today: Shiba Inu Crypto Signal & Technical Analysis 📊
🟢 LONG | Entry 0.00000493 - 0.00000495 | TP1 0.00000509 | SL 0.00000479
👉 Tap $SHIB to place your trade fast
Shiba Inu is joining today's meme rebound. It held its 0.00000476 to 0.00000479 floor for 5 days, then broke above the 4H EMA20. Now it is retesting that EMA from above, which is a classic spot to buy a pullback.
📌 SHIBA INU TRADING SIGNAL (Leaning, early reversal setup)
Entry: 0.00000493 - 0.00000495
Take profit 1: 0.00000509 (+3.1%)
Take profit 2: 0.00000522 (+5.6%)
Take profit 3: 0.00000540 (+9.3%)
Stop loss: 0.00000479 (-3.1%)
📊 SHIB TECHNICAL ANALYSIS (4H CHART)
The EMA20 (0.000004918) has turned up, and the EMA50 (0.000004957) sits just overhead. RSI at 52 is neutral. The local high at 0.00000502 is the trigger: above it, SHIB has room to the Oct 21 high near 0.00000522.
🔑 KEY LEVELS
Support: 0.00000492 (EMA20), then 0.00000479
Resistance: 0.00000502, then 0.00000522
📈 Bullish scenario: a 4H close above 0.00000502 confirms the reversal and targets TP2 and TP3.
📉 Bearish scenario: losing the EMA20 puts SHIB back into its range. A close under 0.00000479 cancels this signal.
💡 Bottom line: a tight-stop meme play. If meme season continues, SHIB usually follows DOGE and PEPE.
👉 Tap $SHIB
to open the live chart. NFA
🔥 TRADE WITH LOWER FEES
✅ Get a 20% kickback on your Binance trading fees, for life
👇👇👇
Claim your 20% Binance fee kickback here
━━━━━━━━━━
SHIB army: still holding, or did you switch to PEPE? 👇
Follow Crypto Signals and Analysis for daily signals.
#cryptosignals #SHİB #CanGoogleDefendItsCore
⚠️ Crypto is volatile: risk only what you can afford to lose.
11
·
--
O‘suvchi
Tarjimani ko‘rish
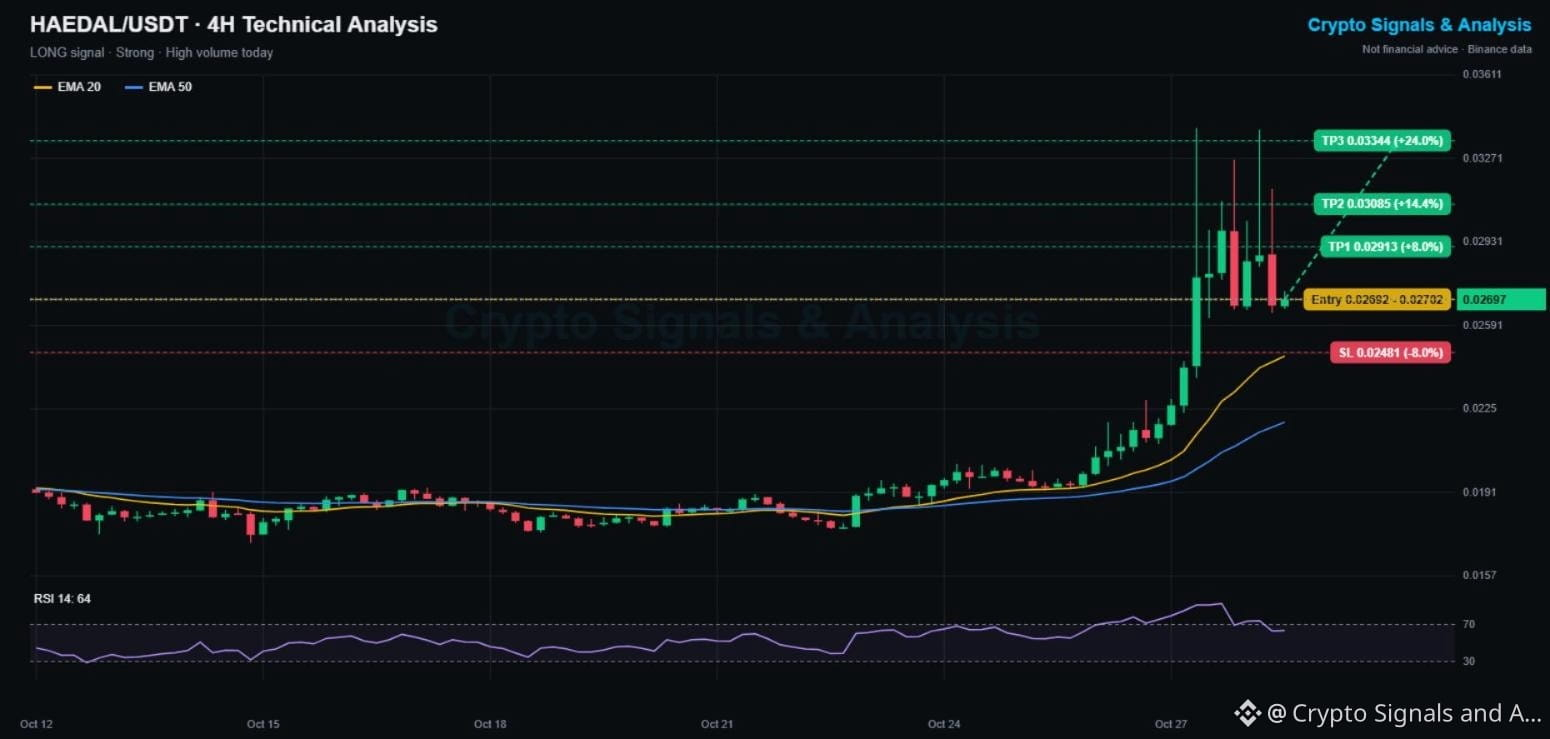
$HAEDAL Price Prediction Today: Haedal Protocol Crypto Signal & Technical Analysis 📊
🟢 LONG | Entry 0.02692 - 0.02702 | TP1 0.02913 | SL 0.02481
👉 Tap $HAEDAL to place your trade fast
Haedal Protocol is up 43% this week and is one of the most traded small caps on Binance today. After two spikes to 0.034, it is cooling off and consolidating at 0.026 to 0.029, well above its rising 4H EMAs.
📌 HAEDAL TRADING SIGNAL (Strong trend, very high volatility)
Entry: 0.02692 - 0.02702
Take profit 1: 0.02913 (+8%)
Take profit 2: 0.03085 (+14%)
Take profit 3: 0.03344 (+24%)
Stop loss: 0.02481 (-8%)
📊 HAEDAL TECHNICAL ANALYSIS (4H CHART)
The trend is clearly up: EMA20 (0.0247) and EMA50 (0.0220) are rising fast, and RSI cooled from 80 to 64. But the two long upper wicks at 0.034 show heavy selling at the top. The best case is a flag: sideways consolidation, then another leg up.
🔑 KEY LEVELS
Support: 0.0260, then 0.0247 (EMA20)
Resistance: 0.0293, then 0.0340
📈 Bullish scenario: a 4H close above 0.0293 breaks the flag and targets TP2 and the 0.034 highs.
📉 Bearish scenario: losing the EMA20 means the pump is over for now. A close under 0.02481 cancels this signal.
💡 Bottom line: strong momentum, but this coin swings 20% in hours. Use small size and respect the stop.
👉 Tap $HAEDAL
to open the live chart. NFA
🔥 TRADE WITH LOWER FEES
✅ Get a 20% kickback on your Binance trading fees, for life
👇👇👇
{spot}(HAEDALUSDT)
[Claim your 20% Binance fee kickback here](https://www.binance.com/register?ref=X0NQWZ4N)
━━━━━━━━━━
Haedal: third push to 0.034, or is the pump done? 👇
Follow Crypto Signals and Analysis for daily signals.
#cryptosignals #HAEDAL #EarningsSeason
⚠️ Crypto is volatile: risk only what you can afford to lose.
$HAEDAL Price Prediction Today: Haedal Protocol Crypto Signal & Technical Analysis 📊
🟢 LONG | Entry 0.02692 - 0.02702 | TP1 0.02913 | SL 0.02481
👉 Tap $HAEDAL to place your trade fast
Haedal Protocol is up 43% this week and is one of the most traded small caps on Binance today. After two spikes to 0.034, it is cooling off and consolidating at 0.026 to 0.029, well above its rising 4H EMAs.
📌 HAEDAL TRADING SIGNAL (Strong trend, very high volatility)
Entry: 0.02692 - 0.02702
Take profit 1: 0.02913 (+8%)
Take profit 2: 0.03085 (+14%)
Take profit 3: 0.03344 (+24%)
Stop loss: 0.02481 (-8%)
📊 HAEDAL TECHNICAL ANALYSIS (4H CHART)
The trend is clearly up: EMA20 (0.0247) and EMA50 (0.0220) are rising fast, and RSI cooled from 80 to 64. But the two long upper wicks at 0.034 show heavy selling at the top. The best case is a flag: sideways consolidation, then another leg up.
🔑 KEY LEVELS
Support: 0.0260, then 0.0247 (EMA20)
Resistance: 0.0293, then 0.0340
📈 Bullish scenario: a 4H close above 0.0293 breaks the flag and targets TP2 and the 0.034 highs.
📉 Bearish scenario: losing the EMA20 means the pump is over for now. A close under 0.02481 cancels this signal.
💡 Bottom line: strong momentum, but this coin swings 20% in hours. Use small size and respect the stop.
👉 Tap $HAEDAL
to open the live chart. NFA
🔥 TRADE WITH LOWER FEES
✅ Get a 20% kickback on your Binance trading fees, for life
👇👇👇
Claim your 20% Binance fee kickback here
━━━━━━━━━━
Haedal: third push to 0.034, or is the pump done? 👇
Follow Crypto Signals and Analysis for daily signals.
#cryptosignals #HAEDAL #EarningsSeason
⚠️ Crypto is volatile: risk only what you can afford to lose.
175
Ko‘proq kontentni ko‘rish uchun tizimga kiring
Binance Square'da global kriptovalyuta foydalanuvchilariga qo‘shiling
⚡️ Kriptovalyuta haqida eng so‘nggi va foydali ma’lumotlarni oling.
💬 Dunyoning eng yirik kriptovalyuta birjasi tomonidan ishonchli deb topilgan.
👍 Tasdiqlangan mualliflardan haqiqiy tahlillarni kashf eting.
Email / telefon raqami
Trenddagi mavzular
CanMicrosoftDeliverOnAI
446,358 marta koʻrilgan
3,315 muhokama qilmoqda
Daromadlar mavsumining 3-sessiyasi: Google va Microsoft moliyaviy natijalari kutilganidan yaxshiroq bo‘ladimi?
Binance Square Official
·147 ta layk
·80.4k marta koʻrilgan
CanGoogleDefindItsCore
277,312 marta koʻrilgan
2,340 muhokama qilmoqda
EarningsSeason
6M marta koʻrilgan
29,413 muhokama qilmoqda