
#crv
crv
1.9M views
8,092 Discussing
Hot
Latest

·
--
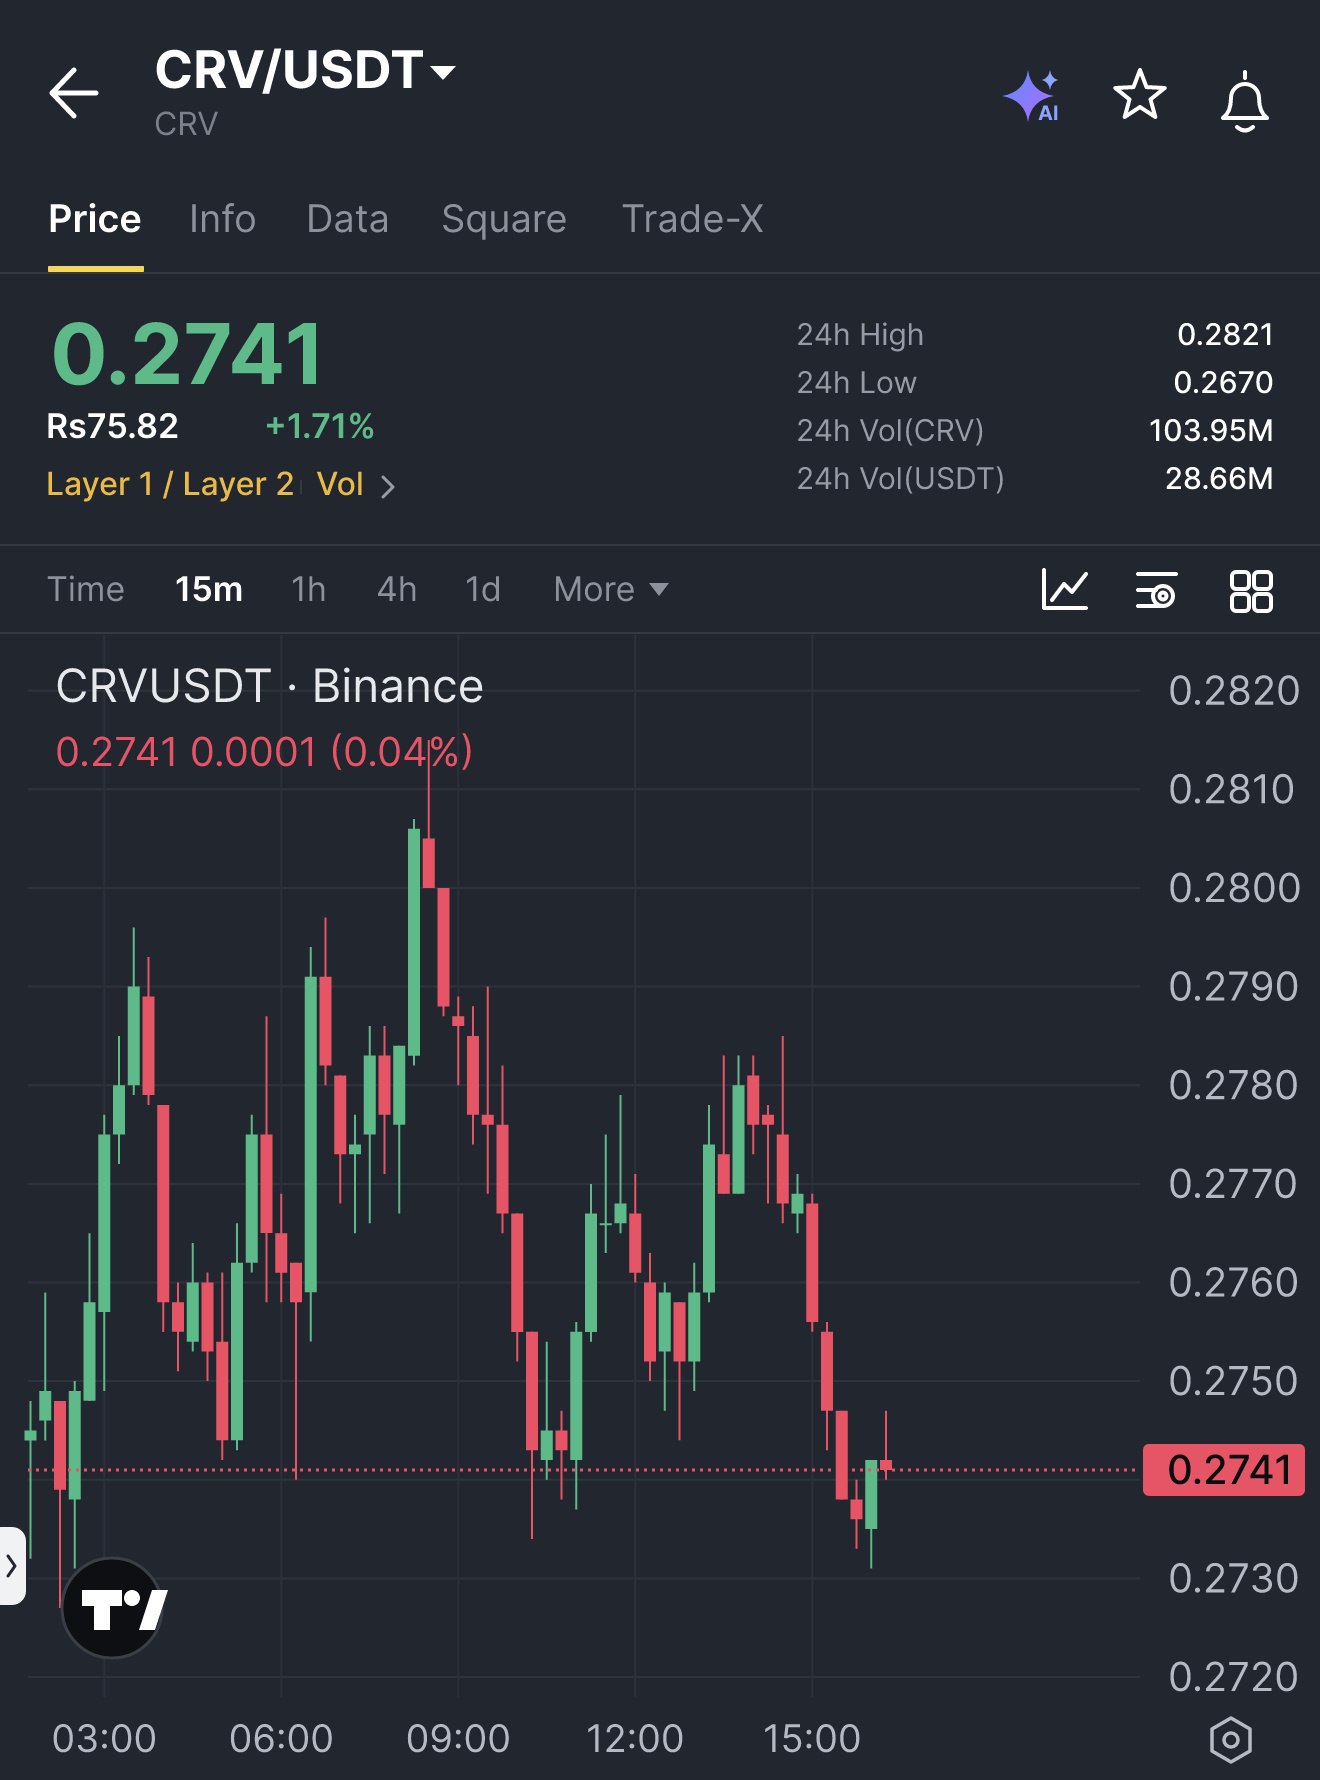
🚀 $CRV BREAKS HIGH, LONG SETUP ACTIVATES! 📈
Entry: 0.2741 ⚡
Target: 0.2759/0.2771/0.2789 🚀
Stop Loss: 0.2729 ⚠️
Buyers have snapped the prior candle’s high, slicing through lingering bearish pressure and executing a smart‑money liquidity grab. 🦈
Entry at 0.2741 sits just above the broken resistance, with three stacked profit zones that map the order‑block ladder, each aligning with shrinking supply pockets. ⚡
💬 Are you positioning to ride the ladder or taking partials early? 👇
⚠️ Not financial advice. Always manage your risk. 🛡️
🏷️ #CRV #LongSetup #Liquidity #Crypto
🔥 💎
🚀 $CRV BREAKS HIGH, LONG SETUP ACTIVATES! 📈
Entry: 0.2741 ⚡
Target: 0.2759/0.2771/0.2789 🚀
Stop Loss: 0.2729 ⚠️
Buyers have snapped the prior candle’s high, slicing through lingering bearish pressure and executing a smart‑money liquidity grab. 🦈
Entry at 0.2741 sits just above the broken resistance, with three stacked profit zones that map the order‑block ladder, each aligning with shrinking supply pockets. ⚡
💬 Are you positioning to ride the ladder or taking partials early? 👇
⚠️ Not financial advice. Always manage your risk. 🛡️
🏷️ #CRV #LongSetup #Liquidity #Crypto
🔥 💎
Entry: 0.2741 ⚡
Target: 0.2759/0.2771/0.2789 🚀
Stop Loss: 0.2729 ⚠️
Buyers have snapped the prior candle’s high, slicing through lingering bearish pressure and executing a smart‑money liquidity grab. 🦈
Entry at 0.2741 sits just above the broken resistance, with three stacked profit zones that map the order‑block ladder, each aligning with shrinking supply pockets. ⚡
💬 Are you positioning to ride the ladder or taking partials early? 👇
⚠️ Not financial advice. Always manage your risk. 🛡️
🏷️ #CRV #LongSetup #Liquidity #Crypto
🔥 💎
2

·
--
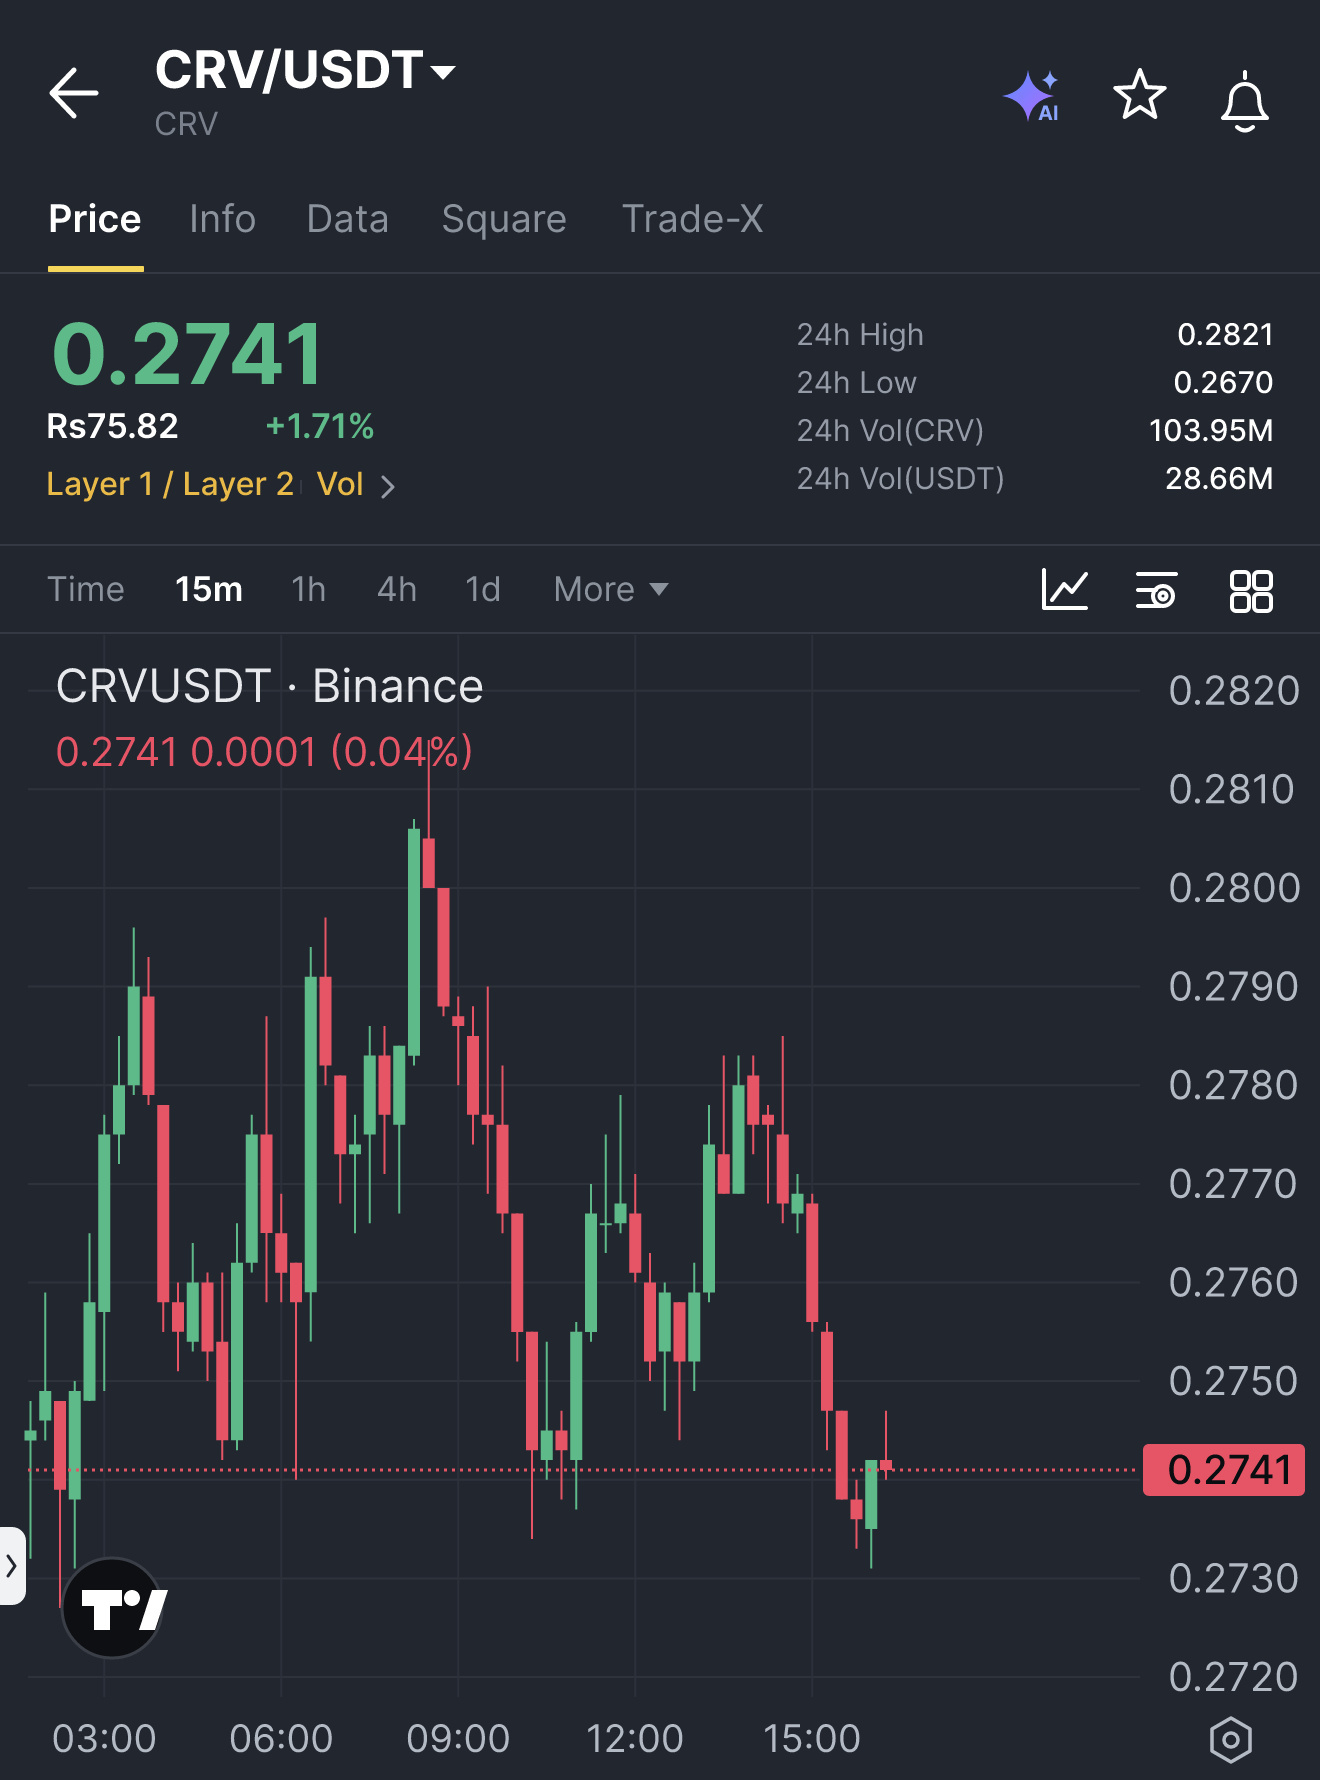
🚀 $CRV SURGES PAST PREV HIGH – ENTRY LIVE! 🟢
Entry: 0.2741 ⚡
Target: 0.2759 🚀
Target: 0.2771 🚀
Target: 0.2789 🚀
Stop Loss: 0.2729 ⚠️
📊 Buyers ripped through the prior candle’s high after a disciplined decline, flipping the momentum into a clean recovery. ⚡ Volume is swelling on the 4‑hour chart, signaling smart‑money stepping in to claim the next liquidity bucket. 🌊 The setup offers a crisp risk‑reward profile, with each profit zone stacked like a ladder.
💬 Are you positioned to catch this bounce or waiting for the next pullback? 👇
⚠️ Not financial advice. Always manage your risk. 🛡️
🏷️ #CRV #LongSetup #DeFi #Breakout #Crypto
🔥 💎
🚀 $CRV SURGES PAST PREV HIGH – ENTRY LIVE! 🟢
Entry: 0.2741 ⚡
Target: 0.2759 🚀
Target: 0.2771 🚀
Target: 0.2789 🚀
Stop Loss: 0.2729 ⚠️
📊 Buyers ripped through the prior candle’s high after a disciplined decline, flipping the momentum into a clean recovery. ⚡ Volume is swelling on the 4‑hour chart, signaling smart‑money stepping in to claim the next liquidity bucket. 🌊 The setup offers a crisp risk‑reward profile, with each profit zone stacked like a ladder.
💬 Are you positioned to catch this bounce or waiting for the next pullback? 👇
⚠️ Not financial advice. Always manage your risk. 🛡️
🏷️ #CRV #LongSetup #DeFi #Breakout #Crypto
🔥 💎
Entry: 0.2741 ⚡
Target: 0.2759 🚀
Target: 0.2771 🚀
Target: 0.2789 🚀
Stop Loss: 0.2729 ⚠️
📊 Buyers ripped through the prior candle’s high after a disciplined decline, flipping the momentum into a clean recovery. ⚡ Volume is swelling on the 4‑hour chart, signaling smart‑money stepping in to claim the next liquidity bucket. 🌊 The setup offers a crisp risk‑reward profile, with each profit zone stacked like a ladder.
💬 Are you positioned to catch this bounce or waiting for the next pullback? 👇
⚠️ Not financial advice. Always manage your risk. 🛡️
🏷️ #CRV #LongSetup #DeFi #Breakout #Crypto
🔥 💎
13

·
--
$CRV volume is 0.6x its weekly average. Here is why that matters more than price
Most traders see $CRV up 5.5 percent today and assume buyers are stepping in hard
They look at the price sitting near the top of the daily range at $0.27810 and think the breakout is real
Then they miss the actual story hiding in the volume profile
The 24 hour volume sits at 1.9M dollars which is only 0.6x the seven day average
That math tells me participation is actually drying up while price drifts higher
A real expansion needs heavy volume backing it up or the move usually fades right back down
When price rises on low volume it simply means sellers are absent rather than buyers being aggressive
Checking that ratio takes twenty seconds on any chart by comparing the current bar to the simple moving average of volume
Always check if the volume confirms the price move before you risk any capital
What volume filter do you use on your charts
#CRV #TradingTips
$CRV volume is 0.6x its weekly average. Here is why that matters more than price
Most traders see $CRV up 5.5 percent today and assume buyers are stepping in hard
They look at the price sitting near the top of the daily range at $0.27810 and think the breakout is real
Then they miss the actual story hiding in the volume profile
The 24 hour volume sits at 1.9M dollars which is only 0.6x the seven day average
That math tells me participation is actually drying up while price drifts higher
A real expansion needs heavy volume backing it up or the move usually fades right back down
When price rises on low volume it simply means sellers are absent rather than buyers being aggressive
Checking that ratio takes twenty seconds on any chart by comparing the current bar to the simple moving average of volume
Always check if the volume confirms the price move before you risk any capital
What volume filter do you use on your charts
#CRV #TradingTips
Most traders see $CRV up 5.5 percent today and assume buyers are stepping in hard
They look at the price sitting near the top of the daily range at $0.27810 and think the breakout is real
Then they miss the actual story hiding in the volume profile
The 24 hour volume sits at 1.9M dollars which is only 0.6x the seven day average
That math tells me participation is actually drying up while price drifts higher
A real expansion needs heavy volume backing it up or the move usually fades right back down
When price rises on low volume it simply means sellers are absent rather than buyers being aggressive
Checking that ratio takes twenty seconds on any chart by comparing the current bar to the simple moving average of volume
Always check if the volume confirms the price move before you risk any capital
What volume filter do you use on your charts
#CRV #TradingTips

·
--
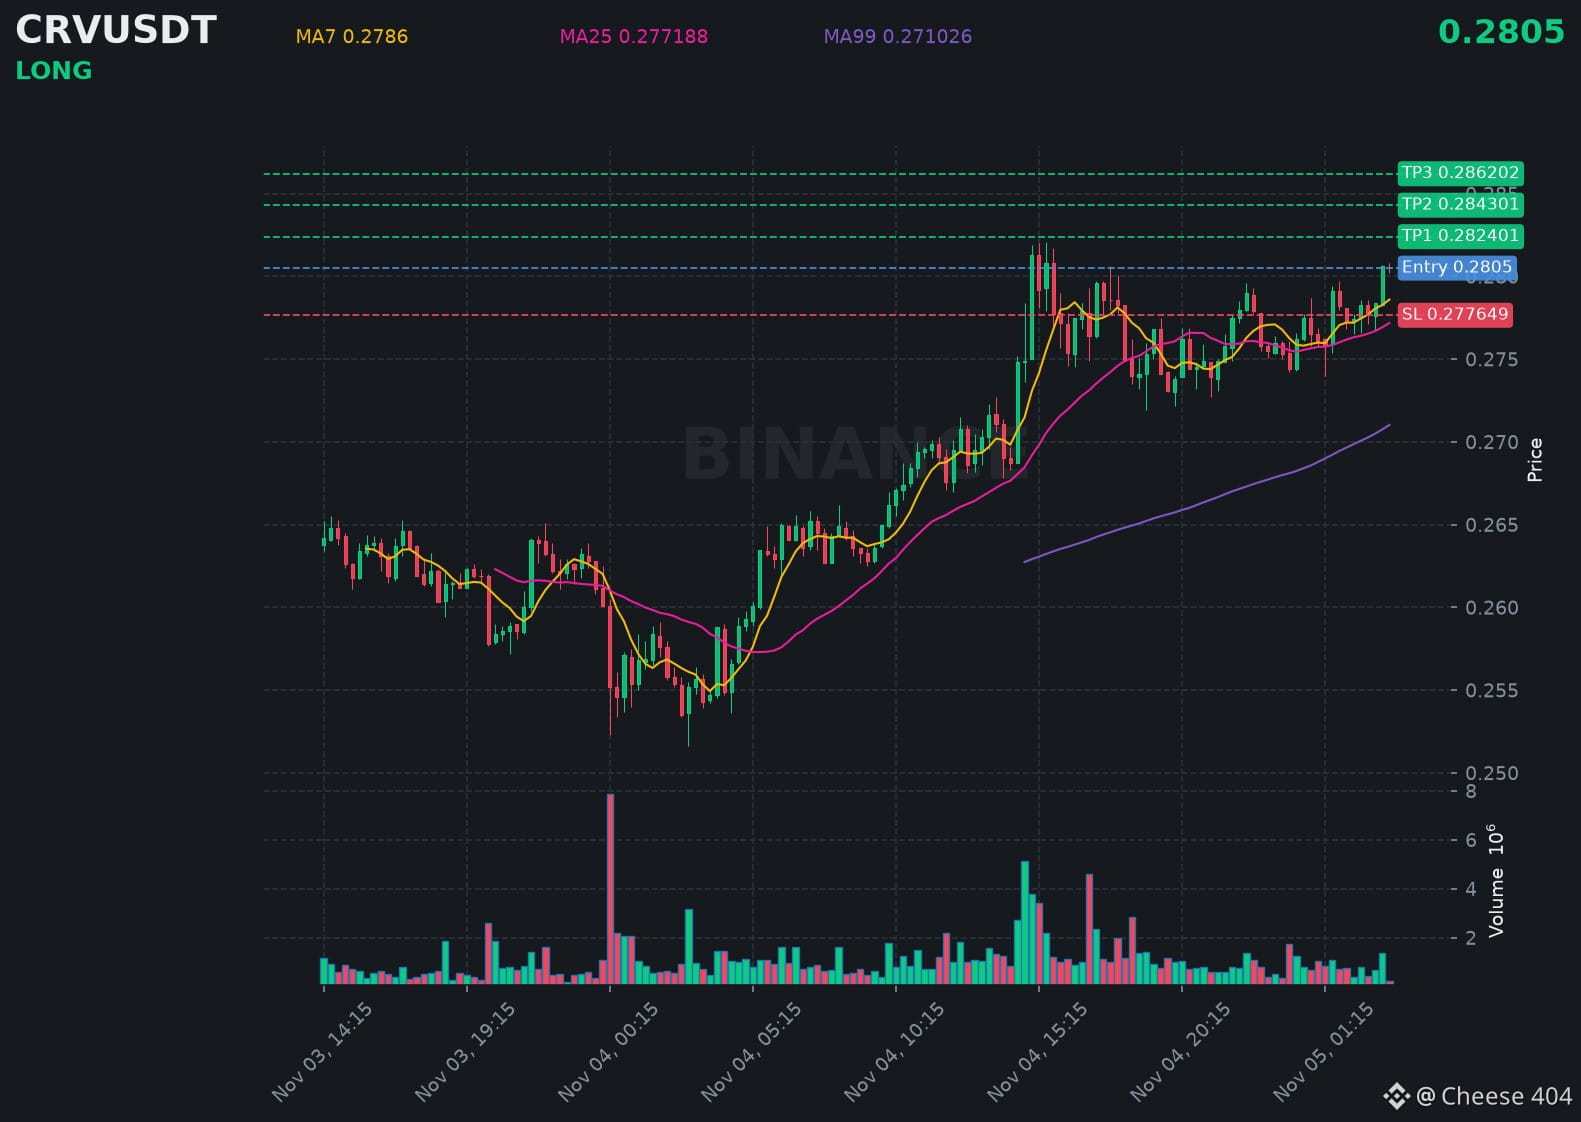
$CRV is gaining strong bullish momentum as volume rises and price breaks key resistance.
📍 @ 0.2805 | Volume: 0.07M USD
RSI 62 | EMA20: 0.277665 USD
📈 Trade Plan:
📈 Entry: 0.27993 – 0.28107
🛑 Stop Loss: 0.277649
🎯 TP1: 0.282401
🎯 TP2: 0.284301
🎯 TP3: 0.286202
Waiting for a retest, then riding the uptrend.
👉 $CRV 👈 Catch it
#CRV
$CRV is gaining strong bullish momentum as volume rises and price breaks key resistance.
📍 @ 0.2805 | Volume: 0.07M USD
RSI 62 | EMA20: 0.277665 USD
📈 Trade Plan:
📈 Entry: 0.27993 – 0.28107
🛑 Stop Loss: 0.277649
🎯 TP1: 0.282401
🎯 TP2: 0.284301
🎯 TP3: 0.286202
Waiting for a retest, then riding the uptrend.
👉 $CRV 👈 Catch it
#CRV
📍 @ 0.2805 | Volume: 0.07M USD
RSI 62 | EMA20: 0.277665 USD
📈 Trade Plan:
📈 Entry: 0.27993 – 0.28107
🛑 Stop Loss: 0.277649
🎯 TP1: 0.282401
🎯 TP2: 0.284301
🎯 TP3: 0.286202
Waiting for a retest, then riding the uptrend.
👉 $CRV 👈 Catch it
#CRV
124

·
--
Bullish
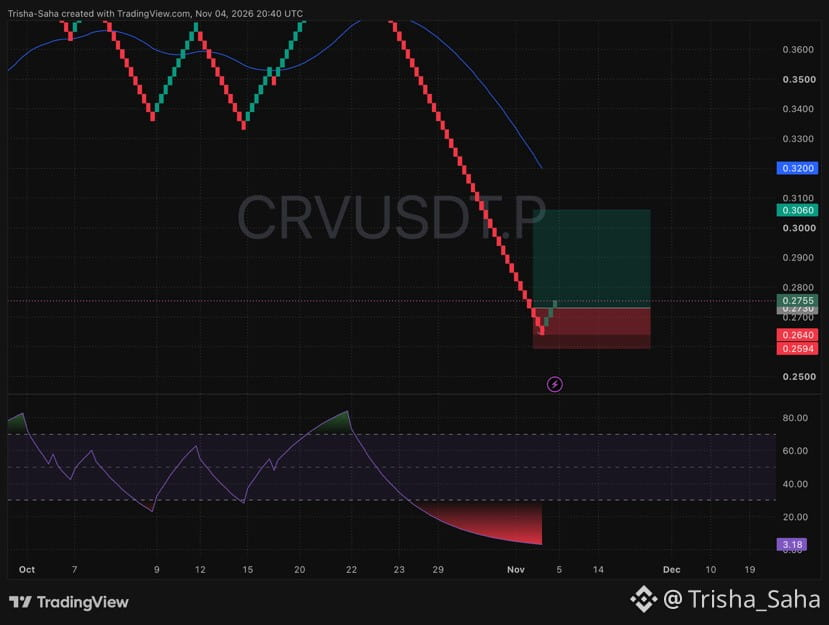
🧲 $CRV has reached total seller exhaustion and a massive relief bounce is firing up right now! 📈
📍 Trade Setup:
• Entry Zone: $0.2700 –$0.2760
• Stop Loss: $0.2594
• Target: $0.3060
📌 Chart Analysis:
• Sellers are completely out of ammo after a nonstop waterfall drop, dragging bottom momentum down to an extreme 3.18 floor.
• Three straight green candles just stepped up off the $0.2640 bottom, proving heavy buyers are aggressively scooping this dip.
• Wide-open space overhead with zero major roadblocks until our $0.3060 target, right below the $0.3200 blue trendline.
🛡️ Lock in a zero-risk trade by moving your Stop Loss to Break-Even the moment we hit +3% to +4% profit.
My long is open and locked in. Who is riding this reversal up with me? Drop a 💰 below! 👇
#CRV #CRVUSDT #DeFi #BinanceSquare
{future}(CRVUSDT)
🧲 $CRV has reached total seller exhaustion and a massive relief bounce is firing up right now! 📈
📍 Trade Setup:
• Entry Zone: $0.2700 –$0.2760
• Stop Loss: $0.2594
• Target: $0.3060
📌 Chart Analysis:
• Sellers are completely out of ammo after a nonstop waterfall drop, dragging bottom momentum down to an extreme 3.18 floor.
• Three straight green candles just stepped up off the $0.2640 bottom, proving heavy buyers are aggressively scooping this dip.
• Wide-open space overhead with zero major roadblocks until our $0.3060 target, right below the $0.3200 blue trendline.
🛡️ Lock in a zero-risk trade by moving your Stop Loss to Break-Even the moment we hit +3% to +4% profit.
My long is open and locked in. Who is riding this reversal up with me? Drop a 💰 below! 👇
#CRV #CRVUSDT #DeFi #BinanceSquare
📍 Trade Setup:
• Entry Zone: $0.2700 –$0.2760
• Stop Loss: $0.2594
• Target: $0.3060
📌 Chart Analysis:
• Sellers are completely out of ammo after a nonstop waterfall drop, dragging bottom momentum down to an extreme 3.18 floor.
• Three straight green candles just stepped up off the $0.2640 bottom, proving heavy buyers are aggressively scooping this dip.
• Wide-open space overhead with zero major roadblocks until our $0.3060 target, right below the $0.3200 blue trendline.
🛡️ Lock in a zero-risk trade by moving your Stop Loss to Break-Even the moment we hit +3% to +4% profit.
My long is open and locked in. Who is riding this reversal up with me? Drop a 💰 below! 👇
#CRV #CRVUSDT #DeFi #BinanceSquare
174
·
--
$CRV sits 0.8 percent below $0.26660 right now
An hourly close past this resistance opens up room
Rejection sends it back toward $0.25200 support
Break or reject? 👀
Open $CRV and set an alert at that level
#CRV #PriceAction
$CRV sits 0.8 percent below $0.26660 right now
An hourly close past this resistance opens up room
Rejection sends it back toward $0.25200 support
Break or reject? 👀
Open $CRV and set an alert at that level
#CRV #PriceAction
An hourly close past this resistance opens up room
Rejection sends it back toward $0.25200 support
Break or reject? 👀
Open $CRV and set an alert at that level
#CRV #PriceAction
4

🔥 $CRV /USDT UNDER HEAVY SELLING PRESSURE — WILL $0.2520 SUPPORT HOLD OR BREAK?
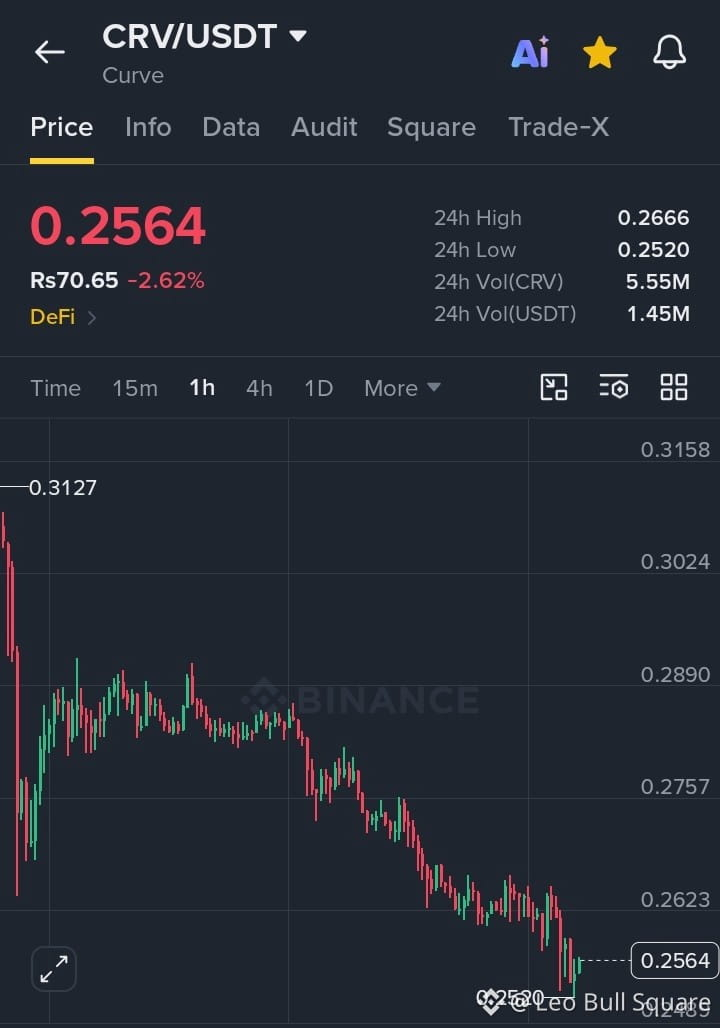
$CRV is maintaining a clear bearish structure on the 1H timeframe, trading at $0.2564 (-2.62%) after a sharp decline from the $0.3127 high. Price continues forming lower highs and lower lows, confirming seller dominance, while the recent bounce from $0.2520 suggests buyers are attempting to defend a critical demand zone. A breakdown below $0.2520 could open the door toward $0.2489, whereas reclaiming $0.2623 could trigger a short-term relief bounce toward $0.2757. With 24H volume at $1.45M USDT, traders should watch for a liquidity sweep, bullish CHoCH, and volume-confirmed reversal before considering long entries. The key battle is now around $0.2520 — watch the breakout or breakdown carefully!
#crv
{spot}(CRVUSDT)
🔥 $CRV /USDT UNDER HEAVY SELLING PRESSURE — WILL $0.2520 SUPPORT HOLD OR BREAK?
$CRV is maintaining a clear bearish structure on the 1H timeframe, trading at $0.2564 (-2.62%) after a sharp decline from the $0.3127 high. Price continues forming lower highs and lower lows, confirming seller dominance, while the recent bounce from $0.2520 suggests buyers are attempting to defend a critical demand zone. A breakdown below $0.2520 could open the door toward $0.2489, whereas reclaiming $0.2623 could trigger a short-term relief bounce toward $0.2757. With 24H volume at $1.45M USDT, traders should watch for a liquidity sweep, bullish CHoCH, and volume-confirmed reversal before considering long entries. The key battle is now around $0.2520 — watch the breakout or breakdown carefully!
#crv
$CRV is maintaining a clear bearish structure on the 1H timeframe, trading at $0.2564 (-2.62%) after a sharp decline from the $0.3127 high. Price continues forming lower highs and lower lows, confirming seller dominance, while the recent bounce from $0.2520 suggests buyers are attempting to defend a critical demand zone. A breakdown below $0.2520 could open the door toward $0.2489, whereas reclaiming $0.2623 could trigger a short-term relief bounce toward $0.2757. With 24H volume at $1.45M USDT, traders should watch for a liquidity sweep, bullish CHoCH, and volume-confirmed reversal before considering long entries. The key battle is now around $0.2520 — watch the breakout or breakdown carefully!
#crv
1
117

·
--
🎯 High-Probability Short: $CRV Failing to Reclaim Range
Rating: 75/100 [A] • Strategy: VolBreakout
📊 Trade Thesis:
Substantial selling volume forced price below the local support shelf. The breakdown without immediate buyer absorption points toward aggressive distribution toward lower demand pools.
🎯 Entry: 0.25890
🛑 Stop-Loss: 0.26364 (-1.83%)
✅ Take-Profit: 0.25041 (+3.28%)
⚖️ Risk/Reward: 1:1.8
🚫 Invalidation Rule: If a 1-hour candle closes above $0.26364 (+1.83%), this bearish thesis is invalidated. Cut position immediately.
💡 Trade Management: Secure 50% profit at Take-Profit target ($0.25041 +3.28%) and move Stop-Loss to Breakeven to eliminate downside risk.
⚖️ Risk Note: Moderate leverage recommended (3x–5x on Futures). Never risk more than 1–2% of total portfolio capital on a single setup.
📈 Binance Market Data:
• Funding: 0.0100% (Neutral) • Next: 2h 58m
• Open Interest (OI): $19.50M
• 24h Volume: $15.37M
• 24h Range: 0.2572 — 0.2677 (-2.2%)
📈 Strategy Track Record: WR 52% over 108 trades
#CRV #TechnicalAnalysis #Altcoins #BinanceSquare
⚠️ Not financial advice. Always manage your risk.
🎯 High-Probability Short: $CRV Failing to Reclaim Range
Rating: 75/100 [A] • Strategy: VolBreakout
📊 Trade Thesis:
Substantial selling volume forced price below the local support shelf. The breakdown without immediate buyer absorption points toward aggressive distribution toward lower demand pools.
🎯 Entry: 0.25890
🛑 Stop-Loss: 0.26364 (-1.83%)
✅ Take-Profit: 0.25041 (+3.28%)
⚖️ Risk/Reward: 1:1.8
🚫 Invalidation Rule: If a 1-hour candle closes above $0.26364 (+1.83%), this bearish thesis is invalidated. Cut position immediately.
💡 Trade Management: Secure 50% profit at Take-Profit target ($0.25041 +3.28%) and move Stop-Loss to Breakeven to eliminate downside risk.
⚖️ Risk Note: Moderate leverage recommended (3x–5x on Futures). Never risk more than 1–2% of total portfolio capital on a single setup.
📈 Binance Market Data:
• Funding: 0.0100% (Neutral) • Next: 2h 58m
• Open Interest (OI): $19.50M
• 24h Volume: $15.37M
• 24h Range: 0.2572 — 0.2677 (-2.2%)
📈 Strategy Track Record: WR 52% over 108 trades
#CRV #TechnicalAnalysis #Altcoins #BinanceSquare
⚠️ Not financial advice. Always manage your risk.
Rating: 75/100 [A] • Strategy: VolBreakout
📊 Trade Thesis:
Substantial selling volume forced price below the local support shelf. The breakdown without immediate buyer absorption points toward aggressive distribution toward lower demand pools.
🎯 Entry: 0.25890
🛑 Stop-Loss: 0.26364 (-1.83%)
✅ Take-Profit: 0.25041 (+3.28%)
⚖️ Risk/Reward: 1:1.8
🚫 Invalidation Rule: If a 1-hour candle closes above $0.26364 (+1.83%), this bearish thesis is invalidated. Cut position immediately.
💡 Trade Management: Secure 50% profit at Take-Profit target ($0.25041 +3.28%) and move Stop-Loss to Breakeven to eliminate downside risk.
⚖️ Risk Note: Moderate leverage recommended (3x–5x on Futures). Never risk more than 1–2% of total portfolio capital on a single setup.
📈 Binance Market Data:
• Funding: 0.0100% (Neutral) • Next: 2h 58m
• Open Interest (OI): $19.50M
• 24h Volume: $15.37M
• 24h Range: 0.2572 — 0.2677 (-2.2%)
📈 Strategy Track Record: WR 52% over 108 trades
#CRV #TechnicalAnalysis #Altcoins #BinanceSquare
⚠️ Not financial advice. Always manage your risk.
47
·
--
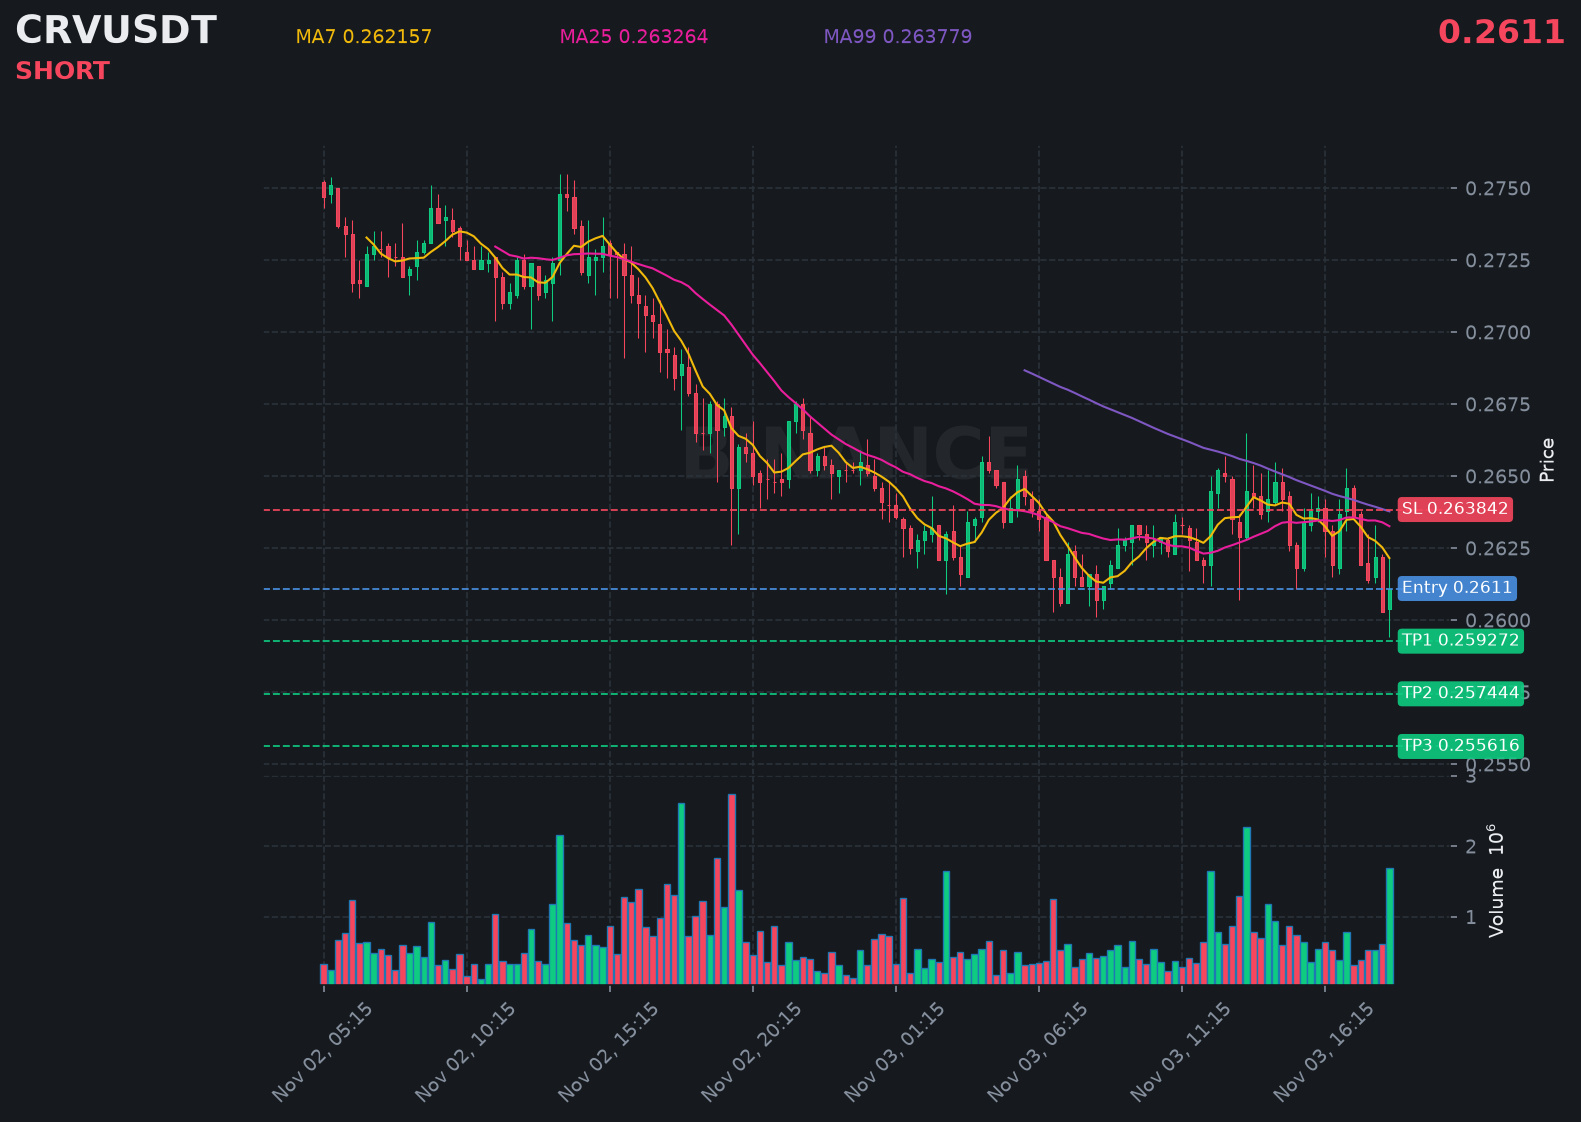
$CRV is struggling below resistance, hinting at another leg down in the coming hours.
📍 @ 0.2611 | Volume: 0.44M USD
RSI 43 | EMA20: 0.262631 USD
📈 Trade Plan:
📈 Entry: 0.260552 – 0.261648
🛑 Stop Loss: 0.263842
🎯 TP1: 0.259272
🎯 TP2: 0.257444
🎯 TP3: 0.255616
Waiting for confirmation, then riding the downtrend.
👉 $CRV 👈 Catch it
#CRV
$CRV is struggling below resistance, hinting at another leg down in the coming hours.
📍 @ 0.2611 | Volume: 0.44M USD
RSI 43 | EMA20: 0.262631 USD
📈 Trade Plan:
📈 Entry: 0.260552 – 0.261648
🛑 Stop Loss: 0.263842
🎯 TP1: 0.259272
🎯 TP2: 0.257444
🎯 TP3: 0.255616
Waiting for confirmation, then riding the downtrend.
👉 $CRV 👈 Catch it
#CRV
📍 @ 0.2611 | Volume: 0.44M USD
RSI 43 | EMA20: 0.262631 USD
📈 Trade Plan:
📈 Entry: 0.260552 – 0.261648
🛑 Stop Loss: 0.263842
🎯 TP1: 0.259272
🎯 TP2: 0.257444
🎯 TP3: 0.255616
Waiting for confirmation, then riding the downtrend.
👉 $CRV 👈 Catch it
#CRV
78


·
--
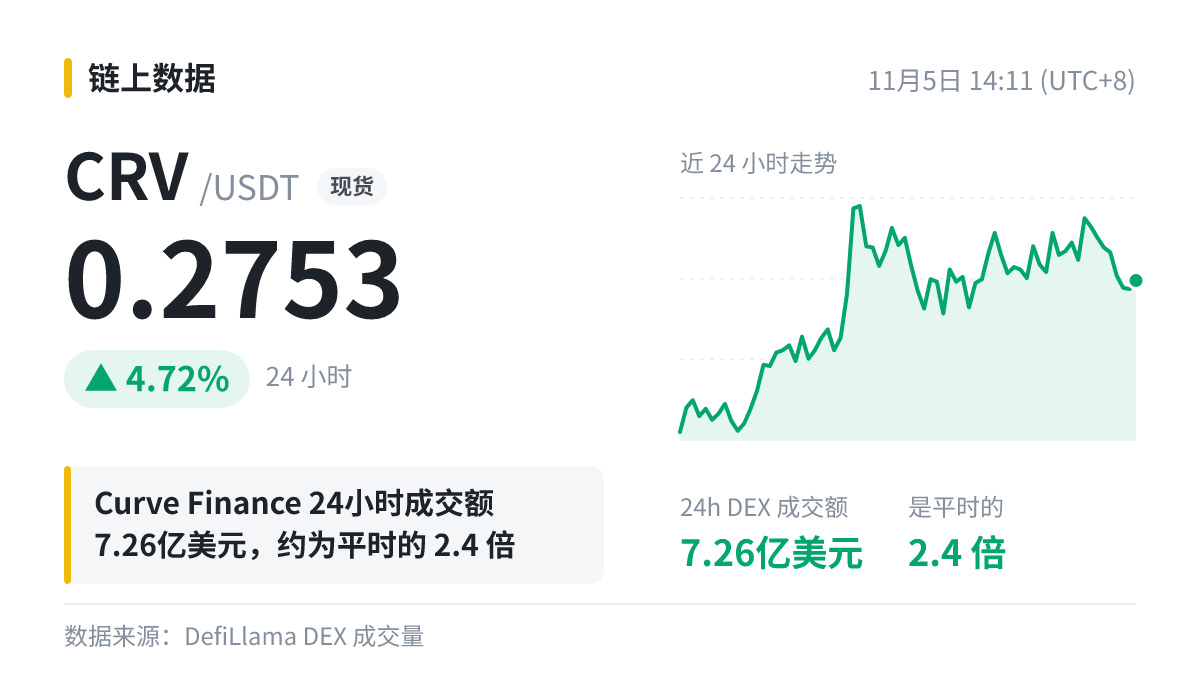
Curve Finance, corresponding to $CRV , trading comparison:
Usual: $301 million / day
Today: $726 million (×2.4)
Rank: No. 5 among all DEXs
Trading has picked up, so protocol fee revenue may also rise; however, one day's data doesn't indicate a trend—we need to keep watching for several days.
#CRV
Curve Finance, corresponding to $CRV , trading comparison:
Usual: $301 million / day
Today: $726 million (×2.4)
Rank: No. 5 among all DEXs
Trading has picked up, so protocol fee revenue may also rise; however, one day's data doesn't indicate a trend—we need to keep watching for several days.
#CRV
Usual: $301 million / day
Today: $726 million (×2.4)
Rank: No. 5 among all DEXs
Trading has picked up, so protocol fee revenue may also rise; however, one day's data doesn't indicate a trend—we need to keep watching for several days.
#CRV
39

·
--
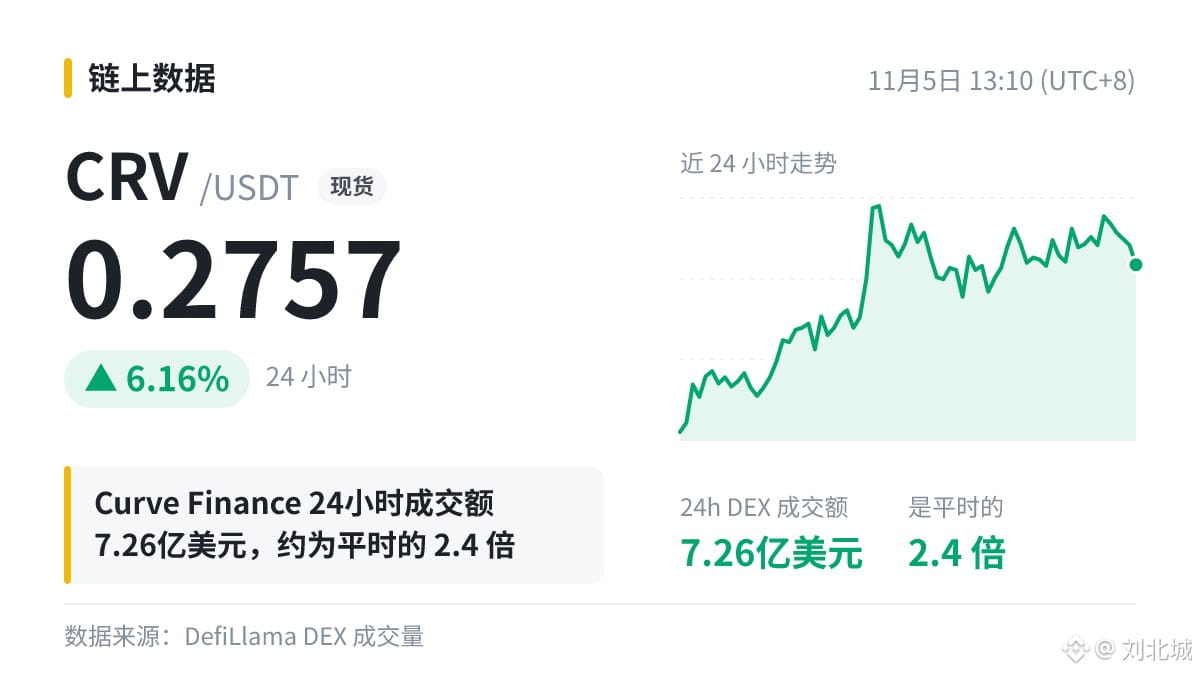
Curve Finance's 24-hour trading volume is 2.4 times its usual level, and the token is $CRV . What that means is, when the market moves, volume across various DEXs often rises along with it—it doesn't necessarily mean anything has changed with Curve itself.
#CRV
Just my personal opinion, not investment advice.
Curve Finance's 24-hour trading volume is 2.4 times its usual level, and the token is $CRV . What that means is, when the market moves, volume across various DEXs often rises along with it—it doesn't necessarily mean anything has changed with Curve itself.
#CRV
Just my personal opinion, not investment advice.
#CRV
Just my personal opinion, not investment advice.

·
--
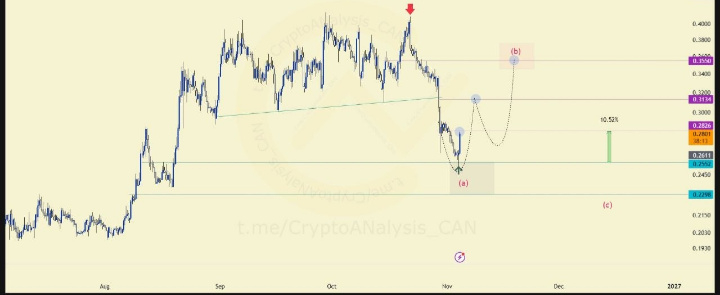
🌙 #CRVUSDT | 8H UPDATE |
📈 CRV is once again showing strength from our entry zone!
The price has recovered 10.52% from support, quickly reaching the first resistance zone.
🎯 What is our strategy now?
✅ Secure profits by closing 50% of the position.
✅ Hold the remaining 50% as long as the technical structure continues to favor an upward move.
✅ Protect profits by adjusting the Stop Loss and avoiding giving back to the market what we have already gained.
🔍 What do we expect now?
The reaction at resistance will be decisive. If CRV manages to break through it with buying volume, there could be room for further upside.
⚠️ If rejection occurs, we must be prepared for a correction. We should not confuse a good recovery with a guaranteed rise.
💡 Discipline comes before greed. A good trader knows not only when to enter, but also when to secure profits.
🔥 Would you secure 50% or hold the entire position while waiting for a new move higher?
#CRV #CurveDAO #CRVUSDT #BinanceSquare
🌙 #CRVUSDT | 8H UPDATE |
📈 CRV is once again showing strength from our entry zone!
The price has recovered 10.52% from support, quickly reaching the first resistance zone.
🎯 What is our strategy now?
✅ Secure profits by closing 50% of the position.
✅ Hold the remaining 50% as long as the technical structure continues to favor an upward move.
✅ Protect profits by adjusting the Stop Loss and avoiding giving back to the market what we have already gained.
🔍 What do we expect now?
The reaction at resistance will be decisive. If CRV manages to break through it with buying volume, there could be room for further upside.
⚠️ If rejection occurs, we must be prepared for a correction. We should not confuse a good recovery with a guaranteed rise.
💡 Discipline comes before greed. A good trader knows not only when to enter, but also when to secure profits.
🔥 Would you secure 50% or hold the entire position while waiting for a new move higher?
#CRV #CurveDAO #CRVUSDT #BinanceSquare
📈 CRV is once again showing strength from our entry zone!
The price has recovered 10.52% from support, quickly reaching the first resistance zone.
🎯 What is our strategy now?
✅ Secure profits by closing 50% of the position.
✅ Hold the remaining 50% as long as the technical structure continues to favor an upward move.
✅ Protect profits by adjusting the Stop Loss and avoiding giving back to the market what we have already gained.
🔍 What do we expect now?
The reaction at resistance will be decisive. If CRV manages to break through it with buying volume, there could be room for further upside.
⚠️ If rejection occurs, we must be prepared for a correction. We should not confuse a good recovery with a guaranteed rise.
💡 Discipline comes before greed. A good trader knows not only when to enter, but also when to secure profits.
🔥 Would you secure 50% or hold the entire position while waiting for a new move higher?
#CRV #CurveDAO #CRVUSDT #BinanceSquare
18

·
--
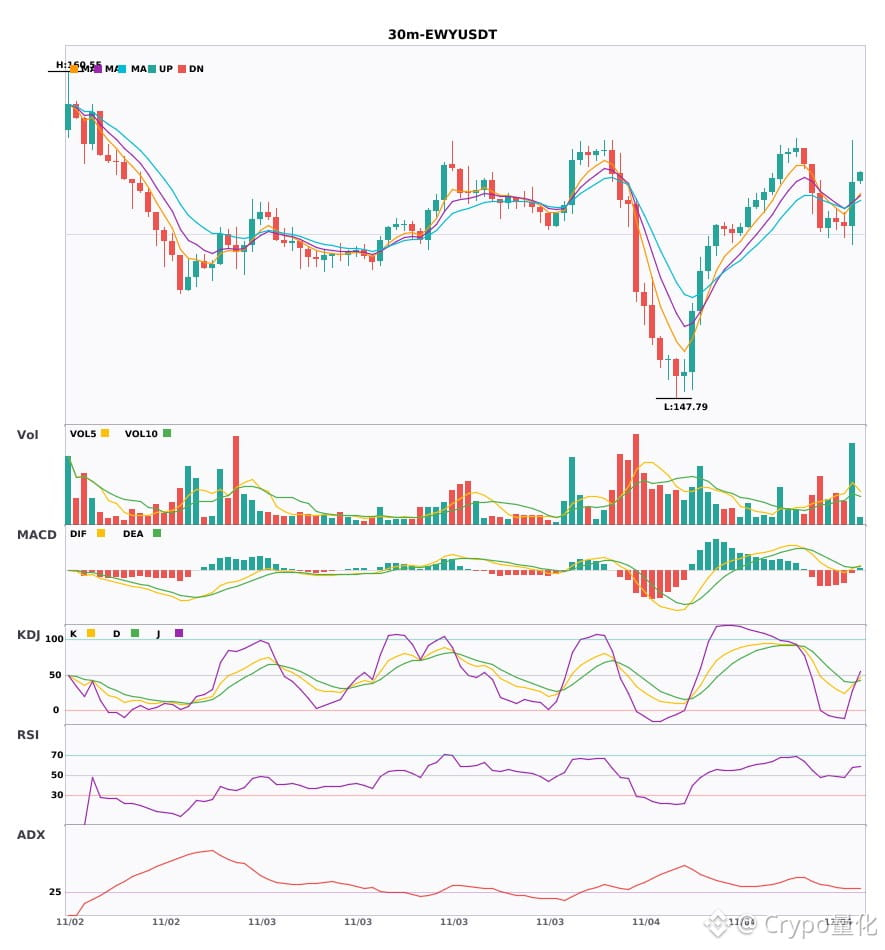
$EWY / $CRV / $KMNO 30-minute bullish bias, short-term confluence opportunity 🔥
════════════════════
🔴 $EWY 30-minute bullish signal
⚠️Technical analysis: ADX(33) indicates a clear trend | MACD DIF breaks above zero, signaling a bullish trend shift | Moving averages converge and build momentum, with a direction expected soon | KDJ is weak, with bears in control (K: 35.7, D: 39.6) | Volume surges (2.6x)
════════════════════
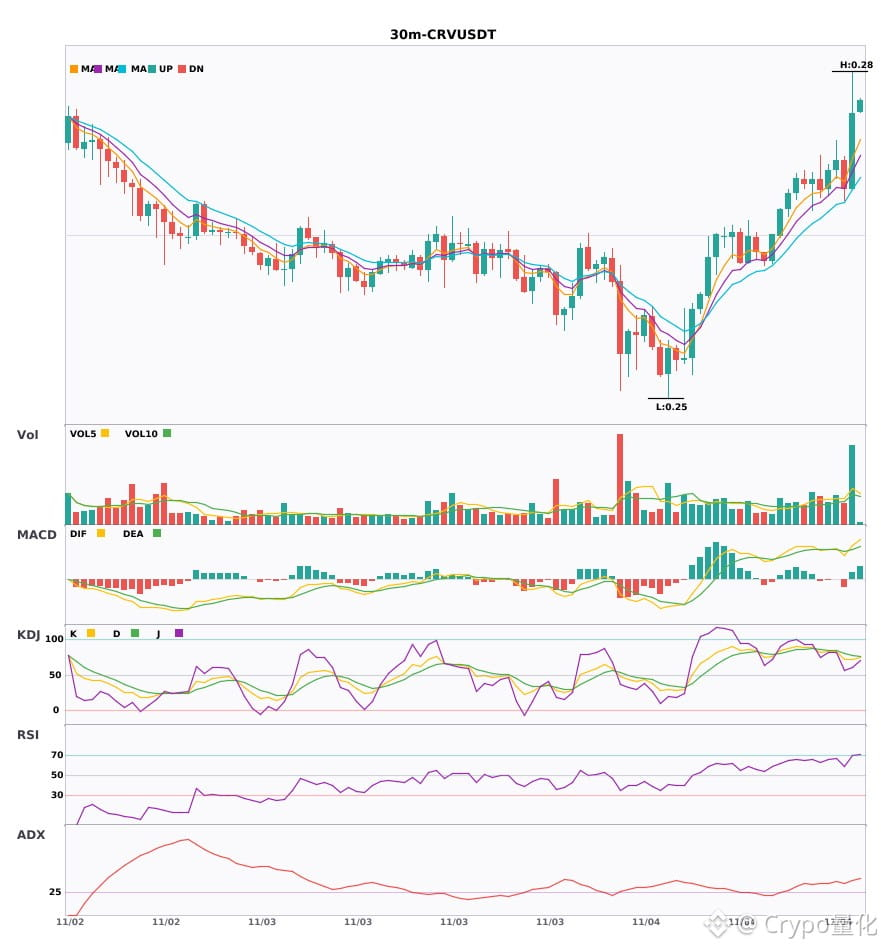
🔴 $CRV 30-minute bullish signal
⚠️Technical analysis: ADX(41) indicates a clear trend | MACD bullish crossover above zero, releasing bullish momentum | EMA5 > EMA8 > EMA13, bullish alignment | KDJ is strong, with bulls in control (K: 71.6, D: 77.4) | Volume surges (2.6x)
════════════════════
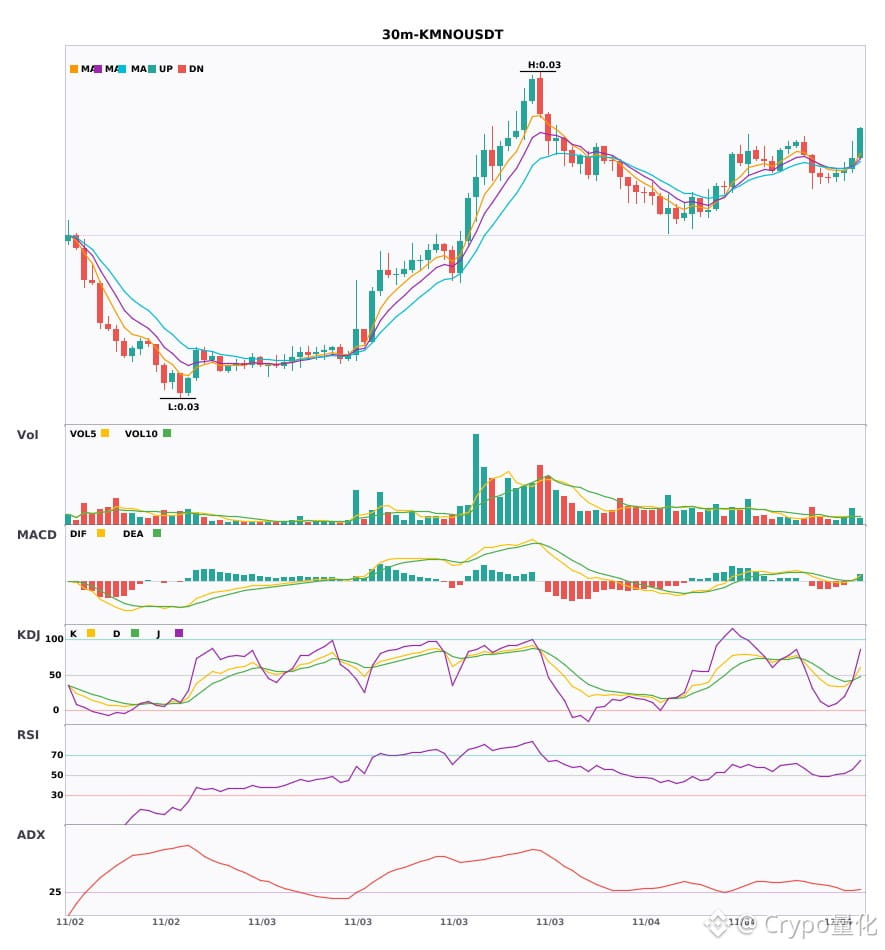
🔴 $KMNO 30-minute bullish signal
⚠️Technical analysis: ADX(29) indicates a trend is forming and may be traded | MACD DIF breaks above zero, signaling a bullish trend shift | EMA5 crosses above EMA8, turning bullish in the short term | KDJ bullish crossover, short-term outlook is bullish (K: 42.2, D: 41.8) | Volume increases (2.0x)
════════════════════
🔔 Follow us for the latest market moves 🔔
#技术分析 #EWY #CRV #KMNO
📌 When trading, watch for confirming candlestick patterns
$EWY / $CRV / $KMNO 30-minute bullish bias, short-term confluence opportunity 🔥
════════════════════
🔴 $EWY 30-minute bullish signal
⚠️Technical analysis: ADX(33) indicates a clear trend | MACD DIF breaks above zero, signaling a bullish trend shift | Moving averages converge and build momentum, with a direction expected soon | KDJ is weak, with bears in control (K: 35.7, D: 39.6) | Volume surges (2.6x)
════════════════════
🔴 $CRV 30-minute bullish signal
⚠️Technical analysis: ADX(41) indicates a clear trend | MACD bullish crossover above zero, releasing bullish momentum | EMA5 > EMA8 > EMA13, bullish alignment | KDJ is strong, with bulls in control (K: 71.6, D: 77.4) | Volume surges (2.6x)
════════════════════
🔴 $KMNO 30-minute bullish signal
⚠️Technical analysis: ADX(29) indicates a trend is forming and may be traded | MACD DIF breaks above zero, signaling a bullish trend shift | EMA5 crosses above EMA8, turning bullish in the short term | KDJ bullish crossover, short-term outlook is bullish (K: 42.2, D: 41.8) | Volume increases (2.0x)
════════════════════
🔔 Follow us for the latest market moves 🔔
#技术分析 #EWY #CRV #KMNO
📌 When trading, watch for confirming candlestick patterns
════════════════════
🔴 $EWY 30-minute bullish signal
⚠️Technical analysis: ADX(33) indicates a clear trend | MACD DIF breaks above zero, signaling a bullish trend shift | Moving averages converge and build momentum, with a direction expected soon | KDJ is weak, with bears in control (K: 35.7, D: 39.6) | Volume surges (2.6x)
════════════════════
🔴 $CRV 30-minute bullish signal
⚠️Technical analysis: ADX(41) indicates a clear trend | MACD bullish crossover above zero, releasing bullish momentum | EMA5 > EMA8 > EMA13, bullish alignment | KDJ is strong, with bulls in control (K: 71.6, D: 77.4) | Volume surges (2.6x)
════════════════════
🔴 $KMNO 30-minute bullish signal
⚠️Technical analysis: ADX(29) indicates a trend is forming and may be traded | MACD DIF breaks above zero, signaling a bullish trend shift | EMA5 crosses above EMA8, turning bullish in the short term | KDJ bullish crossover, short-term outlook is bullish (K: 42.2, D: 41.8) | Volume increases (2.0x)
════════════════════
🔔 Follow us for the latest market moves 🔔
#技术分析 #EWY #CRV #KMNO
📌 When trading, watch for confirming candlestick patterns
15

·
--
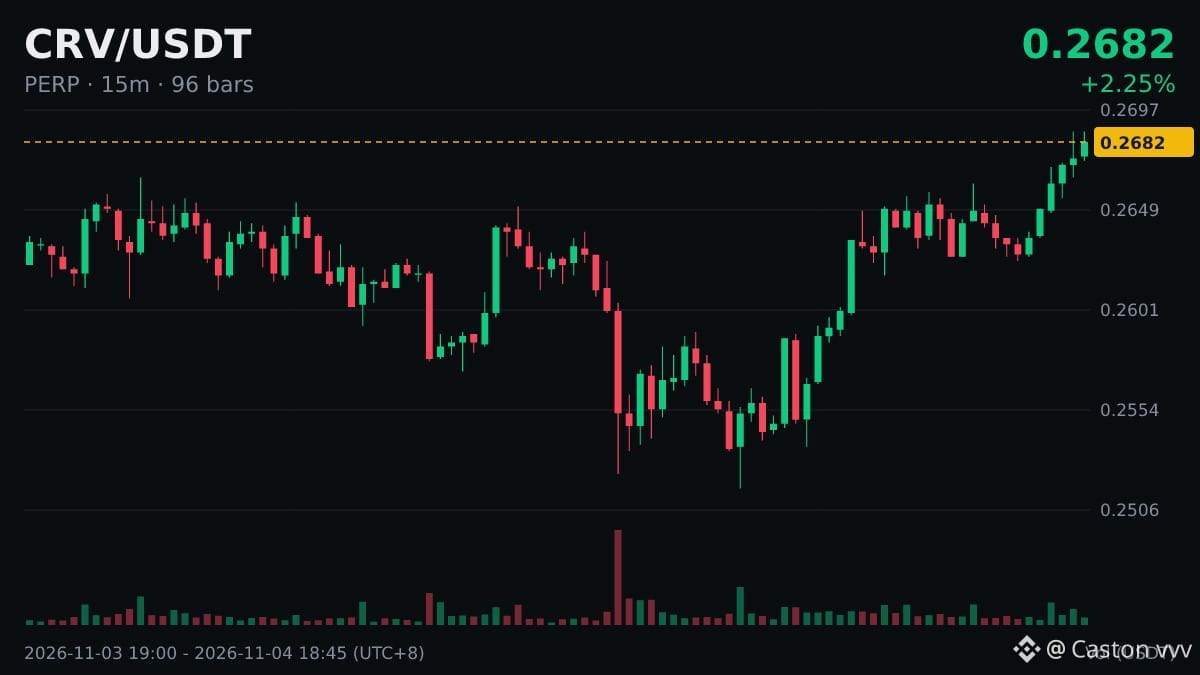
$CRV 24-hour new high, current price 0.2683, previous high 0.2665.
Three common patterns after a new high:
① Pull back to the previous high without breaking below it, then make a new high: healthiest
② Chop around the previous high: consolidation; wait for direction
③ Fall straight back below the previous high and fail to reclaim it: bull trap
Currently above the previous high; watch whether it follows ① or ②.
#CRV
DYOR, participate rationally.
$CRV 24-hour new high, current price 0.2683, previous high 0.2665.
Three common patterns after a new high:
① Pull back to the previous high without breaking below it, then make a new high: healthiest
② Chop around the previous high: consolidation; wait for direction
③ Fall straight back below the previous high and fail to reclaim it: bull trap
Currently above the previous high; watch whether it follows ① or ②.
#CRV
DYOR, participate rationally.
Three common patterns after a new high:
① Pull back to the previous high without breaking below it, then make a new high: healthiest
② Chop around the previous high: consolidation; wait for direction
③ Fall straight back below the previous high and fail to reclaim it: bull trap
Currently above the previous high; watch whether it follows ① or ②.
#CRV
DYOR, participate rationally.
3

📊 The data speaks: a new $CRV 24-hour high of 0.2683, above the previous high of 0.2665; 24h +2.29%, with a trading volume of $1.86 million.
Whether the new high can hold depends on whether the price stays above the previous high on the next pullback. Let’s see together what happens next.
#CRV
📊 The data speaks: a new $CRV 24-hour high of 0.2683, above the previous high of 0.2665; 24h +2.29%, with a trading volume of $1.86 million.
Whether the new high can hold depends on whether the price stays above the previous high on the next pullback. Let’s see together what happens next.
#CRV
Whether the new high can hold depends on whether the price stays above the previous high on the next pullback. Let’s see together what happens next.
#CRV
·
--
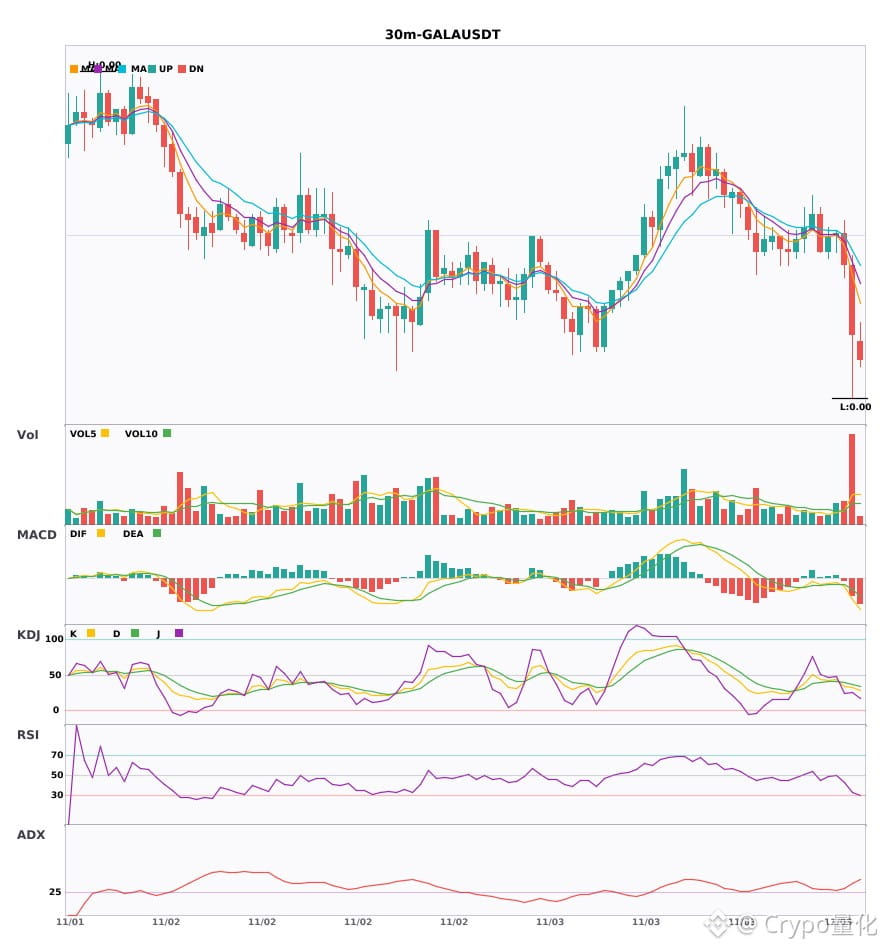
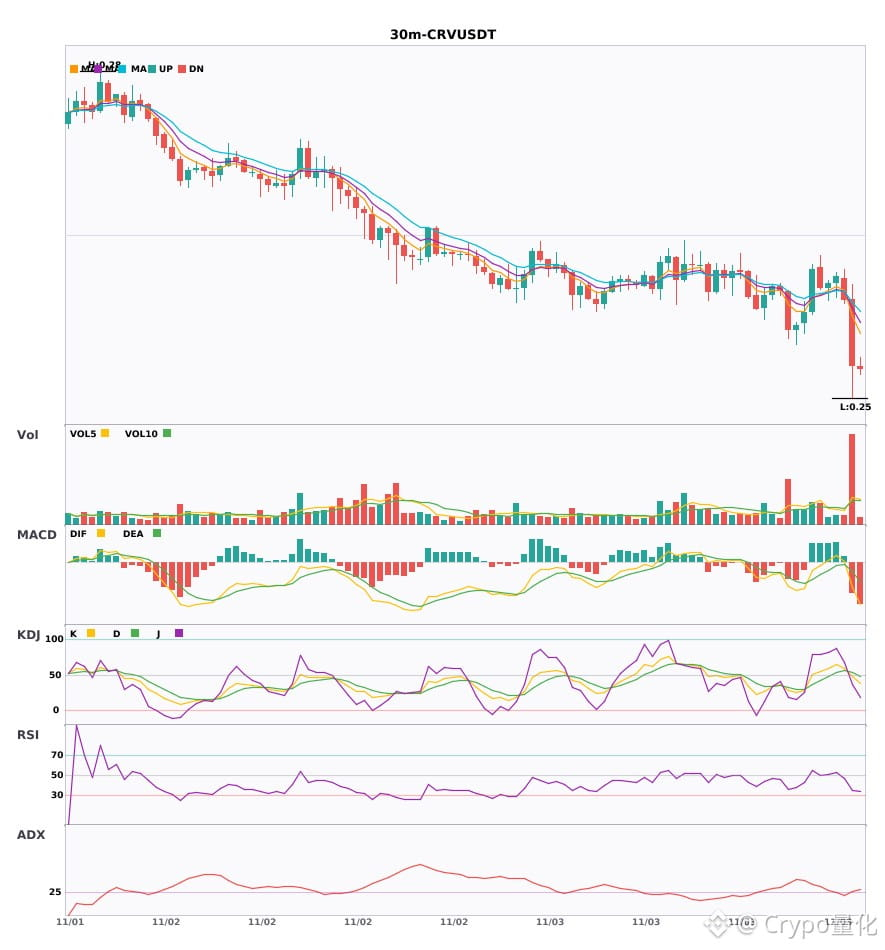
$COMP / $GALA / $CRV 30-minute technical indicators are weakening in sync; beware of risk 🔥
════════════════════
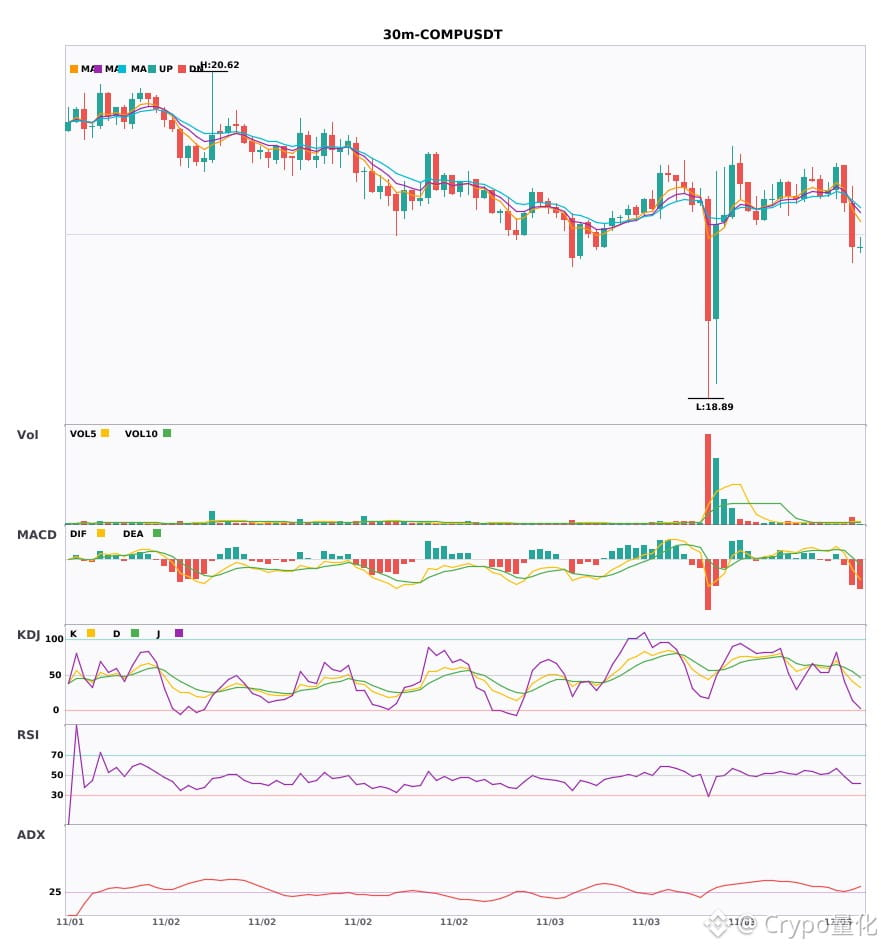
🟢 $COMP 30-minute bearish signal
⚠️Technical analysis: ADX(27) Trend is forming; opportunity to participate | MACD DIF falls below the zero line, trend turns bearish | EMA5 crosses below EMA8, short-term outlook turns bearish | Volume surge (2.8x)
════════════════════
🟢 $GALA 30-minute bearish signal
⚠️Technical analysis: ADX(31) Clear trending market | MACD bearish crossover below zero, bearish momentum accelerating | EMA5 < EMA8 < EMA13, bearish alignment | KDJ bearish crossover, short-term bearish outlook (K: 34.1, D: 39.0) | Volume increase (1.7x)
════════════════════
🟢 $CRV 30-minute bearish signal
⚠️Technical analysis: ADX(28) Trend is forming; opportunity to participate | MACD bearish crossover below zero, bearish momentum accelerating | EMA5 crosses below EMA8, short-term outlook turns bearish | KDJ bearish crossover, short-term bearish outlook (K: 47.3, D: 52.9) | Volume surge (3.7x)
════════════════════
🔔 Follow for first-hand market movement alerts 🔔
#技术分析 #COMP #GALA #CRV
📌 When trading, pay attention to whether the candlestick pattern confirms the signal
$COMP / $GALA / $CRV 30-minute technical indicators are weakening in sync; beware of risk 🔥
════════════════════
🟢 $COMP 30-minute bearish signal
⚠️Technical analysis: ADX(27) Trend is forming; opportunity to participate | MACD DIF falls below the zero line, trend turns bearish | EMA5 crosses below EMA8, short-term outlook turns bearish | Volume surge (2.8x)
════════════════════
🟢 $GALA 30-minute bearish signal
⚠️Technical analysis: ADX(31) Clear trending market | MACD bearish crossover below zero, bearish momentum accelerating | EMA5 < EMA8 < EMA13, bearish alignment | KDJ bearish crossover, short-term bearish outlook (K: 34.1, D: 39.0) | Volume increase (1.7x)
════════════════════
🟢 $CRV 30-minute bearish signal
⚠️Technical analysis: ADX(28) Trend is forming; opportunity to participate | MACD bearish crossover below zero, bearish momentum accelerating | EMA5 crosses below EMA8, short-term outlook turns bearish | KDJ bearish crossover, short-term bearish outlook (K: 47.3, D: 52.9) | Volume surge (3.7x)
════════════════════
🔔 Follow for first-hand market movement alerts 🔔
#技术分析 #COMP #GALA #CRV
📌 When trading, pay attention to whether the candlestick pattern confirms the signal
════════════════════
🟢 $COMP 30-minute bearish signal
⚠️Technical analysis: ADX(27) Trend is forming; opportunity to participate | MACD DIF falls below the zero line, trend turns bearish | EMA5 crosses below EMA8, short-term outlook turns bearish | Volume surge (2.8x)
════════════════════
🟢 $GALA 30-minute bearish signal
⚠️Technical analysis: ADX(31) Clear trending market | MACD bearish crossover below zero, bearish momentum accelerating | EMA5 < EMA8 < EMA13, bearish alignment | KDJ bearish crossover, short-term bearish outlook (K: 34.1, D: 39.0) | Volume increase (1.7x)
════════════════════
🟢 $CRV 30-minute bearish signal
⚠️Technical analysis: ADX(28) Trend is forming; opportunity to participate | MACD bearish crossover below zero, bearish momentum accelerating | EMA5 crosses below EMA8, short-term outlook turns bearish | KDJ bearish crossover, short-term bearish outlook (K: 47.3, D: 52.9) | Volume surge (3.7x)
════════════════════
🔔 Follow for first-hand market movement alerts 🔔
#技术分析 #COMP #GALA #CRV
📌 When trading, pay attention to whether the candlestick pattern confirms the signal
73

·
--
Trading Notes | Stablecoin Exchange Pools
① CryptoSwap pools, introduced after Curve, support assets with greater price volatility and concentrate liquidity near the current price based on their internal pricing.
② One of Curve’s best-known early pools, 3pool, consists of three stablecoins: DAI, USDC, and USDT.
③ Before exchanging, you can check the proportion of each coin in the pool. An unusually high proportion of a particular coin is often interpreted as a sign that funds are selling it.
$CRV 0.2649(-2.57%)
#CRV
Trading Notes | Stablecoin Exchange Pools
① CryptoSwap pools, introduced after Curve, support assets with greater price volatility and concentrate liquidity near the current price based on their internal pricing.
② One of Curve’s best-known early pools, 3pool, consists of three stablecoins: DAI, USDC, and USDT.
③ Before exchanging, you can check the proportion of each coin in the pool. An unusually high proportion of a particular coin is often interpreted as a sign that funds are selling it.
$CRV 0.2649(-2.57%)
#CRV
① CryptoSwap pools, introduced after Curve, support assets with greater price volatility and concentrate liquidity near the current price based on their internal pricing.
② One of Curve’s best-known early pools, 3pool, consists of three stablecoins: DAI, USDC, and USDT.
③ Before exchanging, you can check the proportion of each coin in the pool. An unusually high proportion of a particular coin is often interpreted as a sign that funds are selling it.
$CRV 0.2649(-2.57%)
#CRV
1
·
--
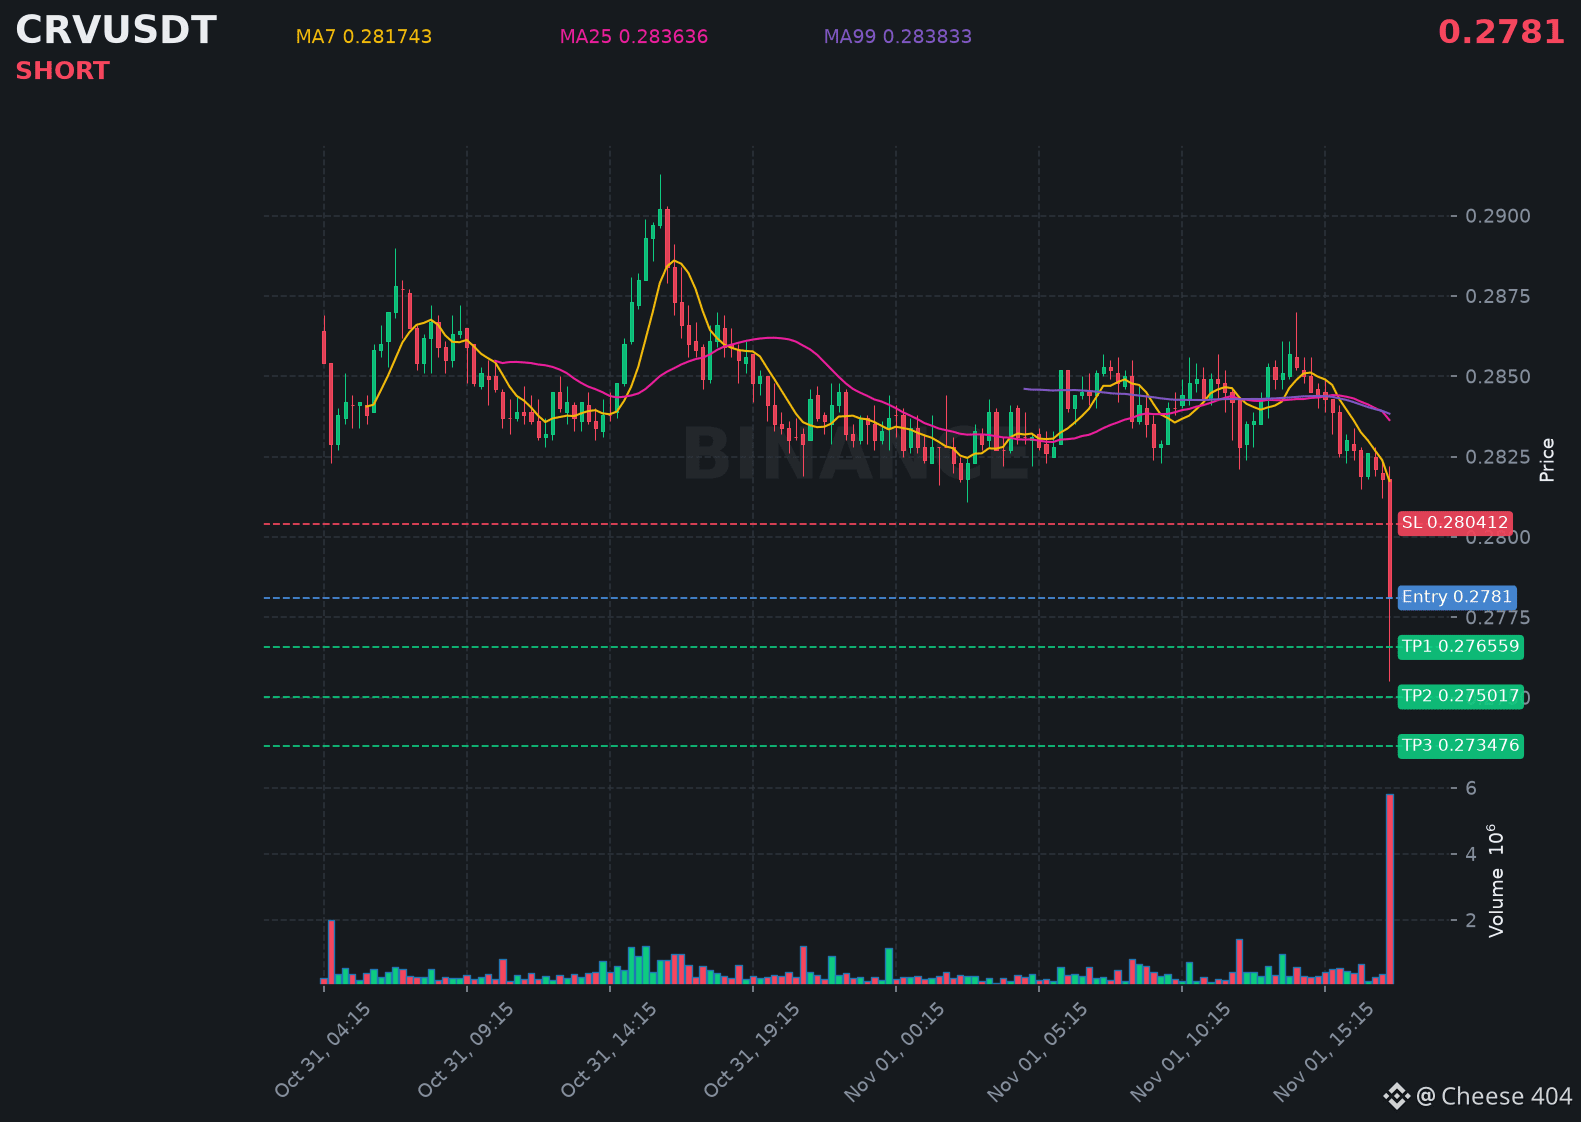
$CRV just printed a strong bearish candle, signaling more downside pressure building right now.
📍 @ 0.2781 | Volume: 1.61M USD
RSI 23 | EMA20: 0.282884 USD
📈 Trade Plan:
📈 Entry: 0.277638 – 0.278562
🛑 Stop Loss: 0.280412
🎯 TP1: 0.276559
🎯 TP2: 0.275017
🎯 TP3: 0.273476
Waiting for confirmation, then riding the downtrend.
👉 $CRV 👈 Catch it
#CRV
$CRV just printed a strong bearish candle, signaling more downside pressure building right now.
📍 @ 0.2781 | Volume: 1.61M USD
RSI 23 | EMA20: 0.282884 USD
📈 Trade Plan:
📈 Entry: 0.277638 – 0.278562
🛑 Stop Loss: 0.280412
🎯 TP1: 0.276559
🎯 TP2: 0.275017
🎯 TP3: 0.273476
Waiting for confirmation, then riding the downtrend.
👉 $CRV 👈 Catch it
#CRV
📍 @ 0.2781 | Volume: 1.61M USD
RSI 23 | EMA20: 0.282884 USD
📈 Trade Plan:
📈 Entry: 0.277638 – 0.278562
🛑 Stop Loss: 0.280412
🎯 TP1: 0.276559
🎯 TP2: 0.275017
🎯 TP3: 0.273476
Waiting for confirmation, then riding the downtrend.
👉 $CRV 👈 Catch it
#CRV
79

·
--
Anyone watching the market?
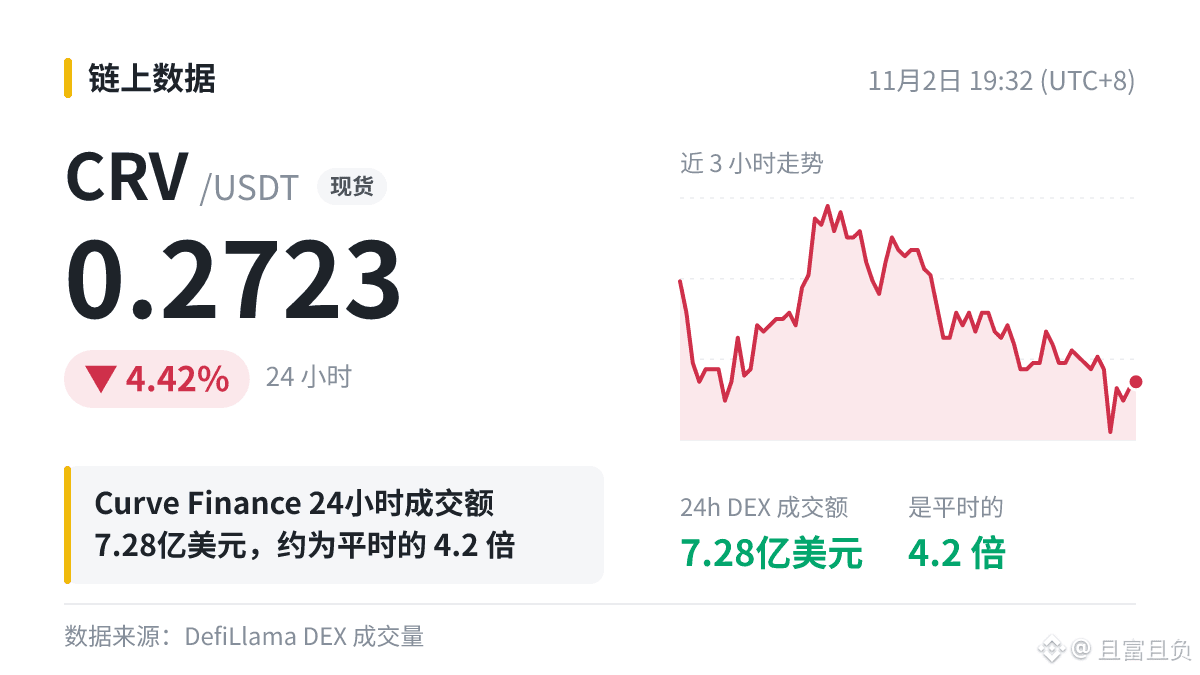
Curve Finance’s on-chain trading volume suddenly hit $728 million—4.2 times the usual level 🔥 It’s now the #2 DEX!
$CRV suddenly heated up! But the volume spike came and went quickly. Keep an eye on whether it lasts, and don’t go all in!
#CRV
Anyone watching the market?
Curve Finance’s on-chain trading volume suddenly hit $728 million—4.2 times the usual level 🔥 It’s now the #2 DEX!
$CRV suddenly heated up! But the volume spike came and went quickly. Keep an eye on whether it lasts, and don’t go all in!
#CRV
Curve Finance’s on-chain trading volume suddenly hit $728 million—4.2 times the usual level 🔥 It’s now the #2 DEX!
$CRV suddenly heated up! But the volume spike came and went quickly. Keep an eye on whether it lasts, and don’t go all in!
#CRV
13
Log in to explore more content
Join global crypto users on Binance Square
⚡️ Get latest and useful information about crypto.
💬 Trusted by the world’s largest crypto exchange.
👍 Discover real insights from verified creators.
Email / Phone number
Trending Topics
1
#BinanceReopensWithdrawalsForMoreAssets
780,583 views
4,344 Discussing
2
#Binance98PercentReplenished
147,454 views
1,703 Discussing
3
#USStocksSlipandCryptoMarketUnderBroadPressure
1,215 views
131 Discussing
4
#StrategySTRCResumesIssuanceAfterOver170Days
14,680 views
358 Discussing
5
#ADPUSPrivateEmployersAdd86000JobsInOctober
30,166 views
513 Discussing
6
#KazakhstanReportedlyInvests$100MInCryptoFunds
1,297 views
46 Discussing
7
#SouthKoreaSeeksCryptoTaxDelayUntil2029
17,748 views
231 Discussing
8
#USMidterms-WhatAreMarketsExpecting?
585,996 views
2,842 Discussing
9
#US10YearTreasuryYieldFallsTo4.845%
20,422 views
173 Discussing
10
#ZcashExpectsNU7ToMake$16MSproutZECInaccessible
1,271 views
18 Discussing