

F I N K Y
14.5k Postlar

F I N K Y
 Square Verified+
Shikoyat qilish
Foydalanuvchini bloklash
Building wealth, one sat at a time | Sharing my crypto journey...
Ochiq savdo
Tez-tez savdo qiluvchi
1.2 yil
27 Kuzatilmoqda
39.2K+ Kuzatuvchilar
38.1K+ Yoqdi
Postlar
Portfel
Barchasi
Iqtiboslar
Jonli
·
--
Maqola
Tarjimani ko‘rish
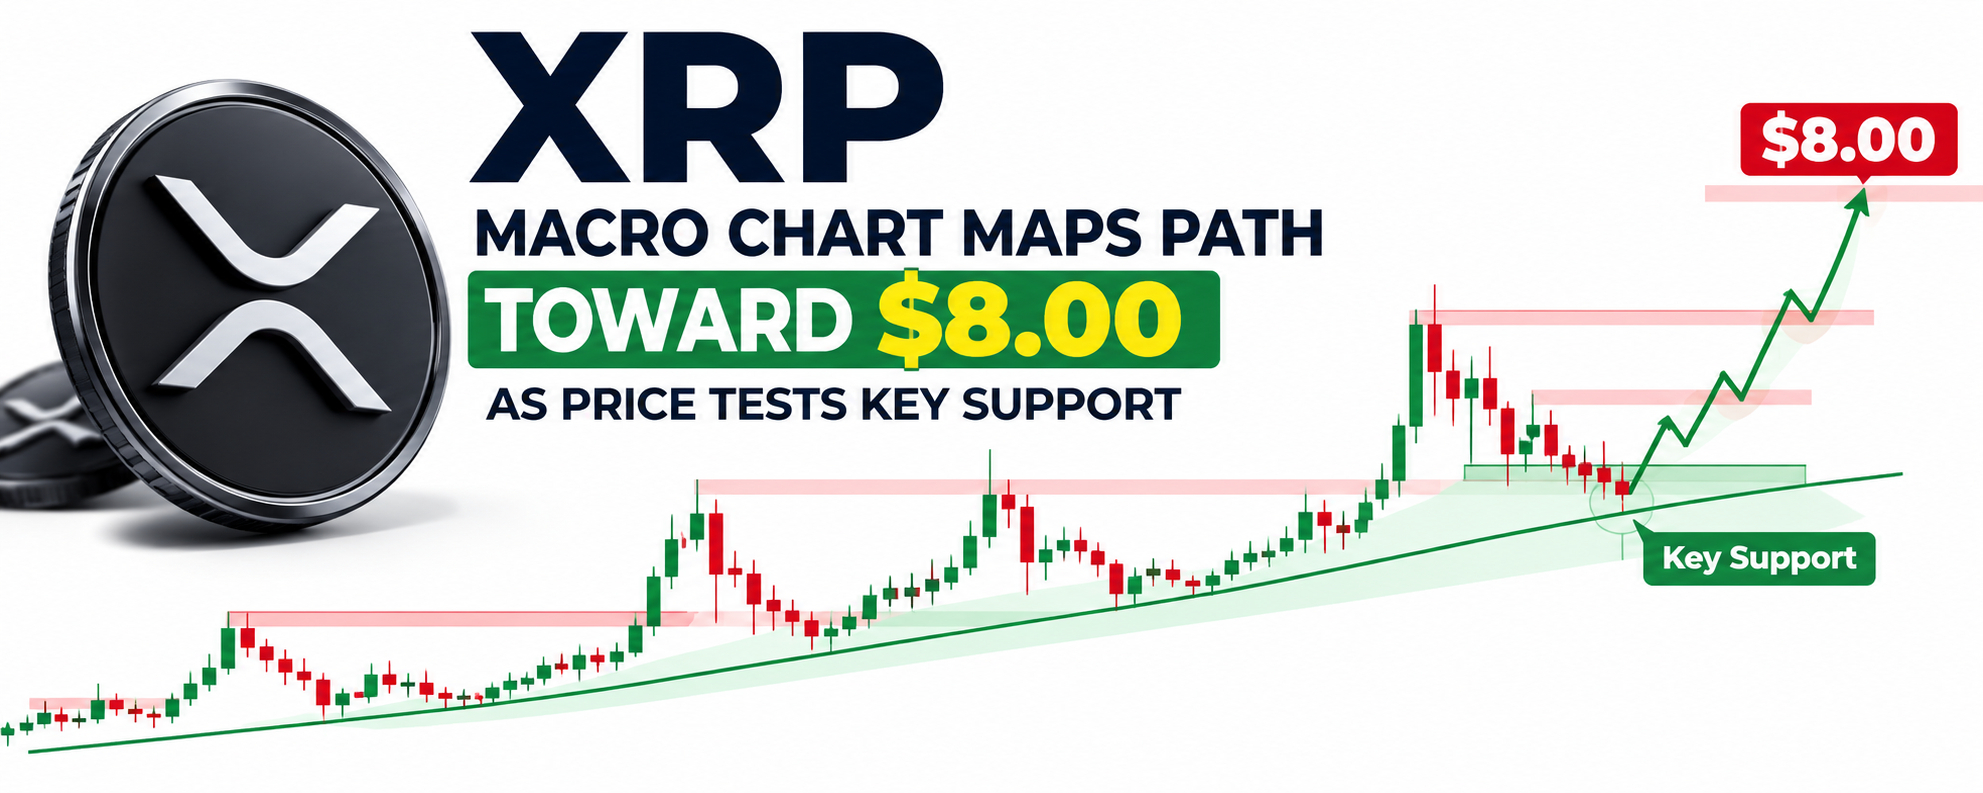
XRP Macro Chart Maps a Potential Path Toward $8 as Price Tests Key SupportXRP is entering another important phase of its market structure.
After a sharp period of volatility, price is now trading around the $1.50 area, with the market attempting to establish whether this zone can become a durable base or merely a temporary pause before another leg of volatility.
The interesting part is that the XRP chart is no longer simply about short-term price action.
The larger question is whether XRP can transition from a recovery asset into a broader institutional and liquidity-driven trade.
That distinction matters because an $8 XRP price would require much more than a technical breakout.
It would require a combination of stronger crypto liquidity, sustained institutional demand, continued XRP Ledger development, expanding real-world activity and a market willing to assign XRP a substantially larger valuation.
The chart can map the potential path.
The fundamentals and macro environment determine whether that path can actually be traveled.
The Current XRP Setup
Recent market data places XRP near $1.53–$1.56, while the recent daily range shows a major increase in volatility.
On September 21, XRP gained roughly 8.9%, moving from around $1.41 to above $1.57 before consolidating. The following sessions produced a mixture of gains and declines, with September 23 seeing a roughly 4.5% decline before XRP recovered toward the $1.50 area.
That sequence is important.
It shows that buyers have been willing to defend the lower-$1.40 area, but it also shows that sellers remain active around the upper part of the current range.
The immediate technical battle is therefore concentrated between support around $1.45–$1.50 and resistance around $1.55–$1.65.
A clean break of the upper boundary would change the technical conversation.
A sustained loss of support would do the opposite.
The First Level That Matters: $1.45–$1.50
The $1.45–$1.50 region has become an important short-term decision zone.
CoinMarketCap's current technical analysis identifies approximately $1.45–$1.48 as near-term support, while $1.56 is highlighted as an important resistance area. A break below $1.45 could expose approximately $1.35.
This creates a relatively clear framework.
If XRP repeatedly holds this region and buyers continue stepping in during pullbacks, the market can continue building a higher-timeframe base.
If price loses it decisively, the market could revisit lower support before attempting another recovery.
The distinction between a temporary intraday wick and a confirmed structural breakdown is critical.
Crypto markets frequently move below obvious support levels, trigger liquidations and then reclaim those same levels.
Therefore, the reaction after a support test may be more informative than the initial breakdown itself.
The Bigger Defensive Zone: $1.25
Below the immediate $1.45–$1.50 area sits a much more significant structural zone around $1.25.
One current daily framework places $1.25 as the more important defensive line, with approximately $0.99 representing the lower boundary of the three-month range.
This creates two different technical situations.
Above $1.25, XRP can still be viewed within a broad recovery/consolidation structure.
A sustained move below $1.25 would weaken that structure substantially and potentially expose the lower end of the broader range.
That makes $1.25 an important level for anyone analyzing the macro chart rather than simply watching intraday candles.
What the Indicators Are Saying
Current daily technical readings provide a mixed but constructive picture.
CoinLore currently shows XRP trading above its 10-, 20-, 30-, 50-, 100- and 200-day simple moving averages. Its listed daily EMAs are also below the current price, while the daily RSI is around 63.
That combination suggests that the broader daily structure has not been destroyed by the recent volatility.
But RSI around the low 60s also tells us something important:
XRP is not sitting in an extreme oversold condition waiting for an automatic rebound.
The market already recovered significantly from recent lows.
Consequently, the next phase needs confirmation through price structure and volume rather than simply relying on the argument that XRP has fallen enough.
The Breakout Zone
The $1.55–$1.65 region is where the chart becomes particularly interesting.
A move through $1.55 would put XRP back above a nearby resistance level identified by current technical analysis.
But $1.65 is arguably more important because it corresponds with the upper boundary of the recent three-month range identified in current market analysis.
A decisive move above $1.65 would therefore represent something more meaningful than a normal intraday bounce.
It would suggest that XRP is attempting to leave the current consolidation range.
From there, the next psychological and technical zones would need to be established progressively rather than assuming an immediate move to $8.
A possible long-term sequence could look like:
$1.50 → $1.65 → $2.00 → $3.00 → $4.00 → $5.00 → $6.00 → $8.00
These are scenario levels, not guaranteed targets.
The market would have to establish acceptance at each major region.
Why $2 Is More Important Than It Looks
The $2 level is likely to become an important psychological checkpoint if XRP successfully escapes its current range.
The reason is simple.
A move from approximately $1.50 to $2 would represent a gain of roughly one-third.
At the same time, reclaiming $2 would move XRP back toward a valuation level that the market has previously been willing to assign to the asset.
The important question would then become whether $2 acts as resistance or becomes support.
A failed breakout around $2 could produce another consolidation.
A successful reclaim followed by sustained trading above it could create the foundation for another expansion.
That is how a potential $8 path would need to develop: through multiple successful structural transitions rather than one uninterrupted vertical rally.
The $3–$4 Zone
Above $2, the $3–$4 region becomes increasingly important from a historical perspective.
XRP has previously traded significantly higher than its current price, but its historical all-time high remains below $4, according to recent market reporting.
That means a move toward $4 would not simply be another percentage rally.
It would represent a major attempt to establish a new valuation regime.
At these levels, market capitalization becomes increasingly important.
With approximately 62.7 billion XRP circulating, recent analysis estimates that a $10 XRP price would correspond to roughly $627 billion in market capitalization.
An $8 price using that same approximate circulating-supply figure would imply roughly:
$8 × 62.7 billion XRP ≈ $501.6 billion market capitalization
That is a massive valuation.
Therefore, an $8 scenario cannot reasonably be explained by chart patterns alone.
The market would need to absorb a valuation of roughly half a trillion dollars at the cited circulating supply.
What Could Drive That Repricing?
This is where the XRP story becomes more interesting than the chart itself.
XRP is connected to the XRP Ledger, Ripple's payment infrastructure and a growing ecosystem involving stablecoins, tokenized assets and institutional financial applications.
Recent reporting on XRPL showed a notable change in network activity.
During Q2, order-book trading volume reportedly increased approximately 79% year over year even though the number of accounts initiating trades fell around 41%. At the same time, average tokenized-asset and RLUSD balances reportedly climbed to approximately $4.26 billion.
That creates a more nuanced picture.
Network participation was not uniformly increasing across every metric.
But the value moving through certain parts of the ecosystem was becoming significantly larger.
For investors watching XRP, this distinction matters.
More users do not automatically mean more token value.
Likewise, larger transaction values do not automatically translate into higher XRP prices.
The key question is whether increasing ecosystem activity eventually creates persistent demand for XRP itself.
Institutional Demand Is Another Major Variable
Institutional access is becoming another important part of the XRP market structure.
CoinDesk reported that U.S. spot XRP exchange-traded funds experienced 11 consecutive sessions of net inflows, bringing approximately $170 million during that streak and approximately $1.68 billion since their November launch. The same report noted institutional holders including Goldman Sachs, Jane Street and Millennium in regulatory filings.
This does not guarantee higher XRP prices.
ETF flows can change.
Institutions can hedge.
Investors can reduce exposure.
And market-wide risk appetite can overwhelm asset-specific developments.
But structurally, spot investment products can make it easier for traditional investors to obtain XRP exposure without directly interacting with crypto exchanges or self-custody infrastructure.
That expands the potential investor base.
The next question is whether those flows remain persistent through both rising and falling markets.
The Macro Variable Cannot Be Ignored
XRP does not trade in isolation.
Liquidity conditions, Bitcoin's trend, interest-rate expectations, dollar strength, institutional risk appetite and overall crypto market capitalization can all influence the amount of capital available for altcoins.
A strong XRP-specific story can therefore struggle during a broad crypto deleveraging event.
Conversely, a favorable macro environment can amplify XRP-specific catalysts.
This is why the $8 thesis should be viewed as a macro-plus-fundamental scenario rather than simply a technical prediction.
If global liquidity expands and risk appetite returns to higher-beta crypto assets, XRP could receive an additional tailwind.
If liquidity tightens and investors move toward defensive assets, even strong XRP fundamentals may not prevent significant drawdowns.
What an $8 XRP Scenario Would Actually Require
For XRP to reach $8, several conditions would likely need to align.
1. XRP must reclaim major technical levels
The market would first need to recover and hold levels such as $1.65, followed by progressively higher resistance zones.
2. The $2 region would need to become support
A sustainable move above $2 would provide evidence that the market is accepting a higher valuation.
3. XRP would need to break through its previous major price structure
A move toward and beyond the $3–$4 region would require significant buying pressure.
4. Institutional demand would need to remain meaningful
ETF flows are potentially important because they provide an accessible route for institutional and traditional-market exposure.
5. XRPL activity would need to continue developing
Growth in tokenized assets, stablecoin activity, payments and institutional infrastructure could strengthen the broader ecosystem.
But the crucial distinction remains:
XRPL growth is not automatically equivalent to XRP price growth.
The economic connection between network activity and XRP demand needs to remain visible.
6. The broader crypto market would likely need to cooperate
A $500 billion-scale XRP valuation would be easier to sustain within a much larger and liquid digital-asset market than during a broad crypto contraction.
The Bull-Case Structure
The constructive scenario begins with XRP continuing to defend the $1.45–$1.50 region.
From there, buyers would need to reclaim $1.55 and eventually break the $1.65 resistance area.
A confirmed breakout could shift the chart from consolidation into expansion.
The next major psychological checkpoints would then be $2, $3 and eventually the previous major highs around the $3–$4 region.
If XRP were able to establish a new high above its historical range, the market could begin pricing a completely different valuation framework.
That is where the path toward $5, $6 and potentially $8 becomes technically conceivable.
But each level would need confirmation.
The market does not owe XRP a straight-line move.
The Bear Case Cannot Be Ignored
The biggest mistake would be to focus only on the $8 scenario.
If XRP loses $1.45 and fails to reclaim it, the market could revisit approximately $1.35.
If the deeper $1.25 support zone also breaks, the broader structure would deteriorate significantly.
A move toward the lower end of the broader range around $0.99 would then become technically relevant.
This is why support levels matter.
They are not simply numbers on a chart.
They tell us where the market's previous balance between buyers and sellers changed.
The Most Important Question: Is This Accumulation or Distribution?
That is ultimately what the XRP chart needs to answer.
If price repeatedly tests support but refuses to break lower, while volume expands during advances and institutional flows remain positive, the market could be demonstrating absorption.
If price repeatedly fails at resistance while selling volume increases and support levels disappear one by one, the interpretation changes.
The next several structural breaks will therefore be more important than any single prediction.
XRP's Supply Structure Also Matters
Unlike proof-of-work assets with ongoing mining issuance, XRP has a fixed maximum supply of 100 billion tokens.
However, the distinction between maximum supply and circulating supply is important when calculating valuation.
Recent market analysis uses approximately 62.7 billion XRP in circulation for its valuation calculations.
That means the headline $8 price target must always be viewed alongside supply.
At approximately 62.7 billion circulating XRP:
$1 = ~$62.7B market cap
$2 = ~$125.4B
$3 = ~$188.1B
$4 = ~$250.8B
$5 = ~$313.5B
$6 = ~$376.2B
$8 = ~$501.6B
These calculations illustrate why $8 is a substantial macro-market scenario rather than an ordinary technical target.
Future changes in circulating supply would also affect the exact market-cap calculation.
The Real XRP Thesis
The strongest version of the XRP thesis is not simply:
“XRP can go to $8.”
The more useful thesis is:
Can XRP evolve into an asset whose valuation is supported by institutional access, increasing financial infrastructure on XRPL, persistent market liquidity and sustained demand for the token itself?
That is the question the market is currently trying to answer.
The chart provides the framework.
The fundamentals provide the potential catalysts.
Macro liquidity provides the fuel.
And market participants ultimately decide whether the valuation is justified.
Final Outlook
XRP is currently sitting at a technically important point.
The immediate structure is centered around the $1.45–$1.50 support region, while $1.55–$1.65 represents the important upside resistance band.
Above $1.65, the chart could begin transitioning into a larger expansion structure.
Below $1.45, the market would need to defend lower levels.
Below $1.25, the broader recovery structure would become substantially weaker.
The path toward $8 therefore should not be viewed as one prediction.
It is a chain of conditions:
Hold support → reclaim resistance → establish $2 → break the previous major range → sustain institutional demand → expand XRPL activity → maintain favorable macro liquidity → build a much larger XRP valuation.
Only if those conditions progressively align does the $8 scenario become increasingly relevant.
For now, the most important thing is not the final number.
It is what XRP does at the levels immediately in front of it.
The market is testing support.
The next major move will tell us whether this is simply another consolidation phase—or the beginning of a much larger repricing cycle.
This is market analysis, not financial advice. Price targets such as $8 are scenario-based and highly speculative, not guarantees. Crypto assets can experience extreme volatility and substantial losses.
#Xrp🔥🔥
XRP Macro Chart Maps a Potential Path Toward $8 as Price Tests Key Support
XRP is entering another important phase of its market structure.
After a sharp period of volatility, price is now trading around the $1.50 area, with the market attempting to establish whether this zone can become a durable base or merely a temporary pause before another leg of volatility.
The interesting part is that the XRP chart is no longer simply about short-term price action.
The larger question is whether XRP can transition from a recovery asset into a broader institutional and liquidity-driven trade.
That distinction matters because an $8 XRP price would require much more than a technical breakout.
It would require a combination of stronger crypto liquidity, sustained institutional demand, continued XRP Ledger development, expanding real-world activity and a market willing to assign XRP a substantially larger valuation.
The chart can map the potential path.
The fundamentals and macro environment determine whether that path can actually be traveled.
The Current XRP Setup
Recent market data places XRP near $1.53–$1.56, while the recent daily range shows a major increase in volatility.
On September 21, XRP gained roughly 8.9%, moving from around $1.41 to above $1.57 before consolidating. The following sessions produced a mixture of gains and declines, with September 23 seeing a roughly 4.5% decline before XRP recovered toward the $1.50 area.
That sequence is important.
It shows that buyers have been willing to defend the lower-$1.40 area, but it also shows that sellers remain active around the upper part of the current range.
The immediate technical battle is therefore concentrated between support around $1.45–$1.50 and resistance around $1.55–$1.65.
A clean break of the upper boundary would change the technical conversation.
A sustained loss of support would do the opposite.
The First Level That Matters: $1.45–$1.50
The $1.45–$1.50 region has become an important short-term decision zone.
CoinMarketCap's current technical analysis identifies approximately $1.45–$1.48 as near-term support, while $1.56 is highlighted as an important resistance area. A break below $1.45 could expose approximately $1.35.
This creates a relatively clear framework.
If XRP repeatedly holds this region and buyers continue stepping in during pullbacks, the market can continue building a higher-timeframe base.
If price loses it decisively, the market could revisit lower support before attempting another recovery.
The distinction between a temporary intraday wick and a confirmed structural breakdown is critical.
Crypto markets frequently move below obvious support levels, trigger liquidations and then reclaim those same levels.
Therefore, the reaction after a support test may be more informative than the initial breakdown itself.
The Bigger Defensive Zone: $1.25
Below the immediate $1.45–$1.50 area sits a much more significant structural zone around $1.25.
One current daily framework places $1.25 as the more important defensive line, with approximately $0.99 representing the lower boundary of the three-month range.
This creates two different technical situations.
Above $1.25, XRP can still be viewed within a broad recovery/consolidation structure.
A sustained move below $1.25 would weaken that structure substantially and potentially expose the lower end of the broader range.
That makes $1.25 an important level for anyone analyzing the macro chart rather than simply watching intraday candles.
What the Indicators Are Saying
Current daily technical readings provide a mixed but constructive picture.
CoinLore currently shows XRP trading above its 10-, 20-, 30-, 50-, 100- and 200-day simple moving averages. Its listed daily EMAs are also below the current price, while the daily RSI is around 63.
That combination suggests that the broader daily structure has not been destroyed by the recent volatility.
But RSI around the low 60s also tells us something important:
XRP is not sitting in an extreme oversold condition waiting for an automatic rebound.
The market already recovered significantly from recent lows.
Consequently, the next phase needs confirmation through price structure and volume rather than simply relying on the argument that XRP has fallen enough.
The Breakout Zone
The $1.55–$1.65 region is where the chart becomes particularly interesting.
A move through $1.55 would put XRP back above a nearby resistance level identified by current technical analysis.
But $1.65 is arguably more important because it corresponds with the upper boundary of the recent three-month range identified in current market analysis.
A decisive move above $1.65 would therefore represent something more meaningful than a normal intraday bounce.
It would suggest that XRP is attempting to leave the current consolidation range.
From there, the next psychological and technical zones would need to be established progressively rather than assuming an immediate move to $8.
A possible long-term sequence could look like:
$1.50 → $1.65 → $2.00 → $3.00 → $4.00 → $5.00 → $6.00 → $8.00
These are scenario levels, not guaranteed targets.
The market would have to establish acceptance at each major region.
Why $2 Is More Important Than It Looks
The $2 level is likely to become an important psychological checkpoint if XRP successfully escapes its current range.
The reason is simple.
A move from approximately $1.50 to $2 would represent a gain of roughly one-third.
At the same time, reclaiming $2 would move XRP back toward a valuation level that the market has previously been willing to assign to the asset.
The important question would then become whether $2 acts as resistance or becomes support.
A failed breakout around $2 could produce another consolidation.
A successful reclaim followed by sustained trading above it could create the foundation for another expansion.
That is how a potential $8 path would need to develop: through multiple successful structural transitions rather than one uninterrupted vertical rally.
The $3–$4 Zone
Above $2, the $3–$4 region becomes increasingly important from a historical perspective.
XRP has previously traded significantly higher than its current price, but its historical all-time high remains below $4, according to recent market reporting.
That means a move toward $4 would not simply be another percentage rally.
It would represent a major attempt to establish a new valuation regime.
At these levels, market capitalization becomes increasingly important.
With approximately 62.7 billion XRP circulating, recent analysis estimates that a $10 XRP price would correspond to roughly $627 billion in market capitalization.
An $8 price using that same approximate circulating-supply figure would imply roughly:
$8 × 62.7 billion XRP ≈ $501.6 billion market capitalization
That is a massive valuation.
Therefore, an $8 scenario cannot reasonably be explained by chart patterns alone.
The market would need to absorb a valuation of roughly half a trillion dollars at the cited circulating supply.
What Could Drive That Repricing?
This is where the XRP story becomes more interesting than the chart itself.
XRP is connected to the XRP Ledger, Ripple's payment infrastructure and a growing ecosystem involving stablecoins, tokenized assets and institutional financial applications.
Recent reporting on XRPL showed a notable change in network activity.
During Q2, order-book trading volume reportedly increased approximately 79% year over year even though the number of accounts initiating trades fell around 41%. At the same time, average tokenized-asset and RLUSD balances reportedly climbed to approximately $4.26 billion.
That creates a more nuanced picture.
Network participation was not uniformly increasing across every metric.
But the value moving through certain parts of the ecosystem was becoming significantly larger.
For investors watching XRP, this distinction matters.
More users do not automatically mean more token value.
Likewise, larger transaction values do not automatically translate into higher XRP prices.
The key question is whether increasing ecosystem activity eventually creates persistent demand for XRP itself.
Institutional Demand Is Another Major Variable
Institutional access is becoming another important part of the XRP market structure.
CoinDesk reported that U.S. spot XRP exchange-traded funds experienced 11 consecutive sessions of net inflows, bringing approximately $170 million during that streak and approximately $1.68 billion since their November launch. The same report noted institutional holders including Goldman Sachs, Jane Street and Millennium in regulatory filings.
This does not guarantee higher XRP prices.
ETF flows can change.
Institutions can hedge.
Investors can reduce exposure.
And market-wide risk appetite can overwhelm asset-specific developments.
But structurally, spot investment products can make it easier for traditional investors to obtain XRP exposure without directly interacting with crypto exchanges or self-custody infrastructure.
That expands the potential investor base.
The next question is whether those flows remain persistent through both rising and falling markets.
The Macro Variable Cannot Be Ignored
XRP does not trade in isolation.
Liquidity conditions, Bitcoin's trend, interest-rate expectations, dollar strength, institutional risk appetite and overall crypto market capitalization can all influence the amount of capital available for altcoins.
A strong XRP-specific story can therefore struggle during a broad crypto deleveraging event.
Conversely, a favorable macro environment can amplify XRP-specific catalysts.
This is why the $8 thesis should be viewed as a macro-plus-fundamental scenario rather than simply a technical prediction.
If global liquidity expands and risk appetite returns to higher-beta crypto assets, XRP could receive an additional tailwind.
If liquidity tightens and investors move toward defensive assets, even strong XRP fundamentals may not prevent significant drawdowns.
What an $8 XRP Scenario Would Actually Require
For XRP to reach $8, several conditions would likely need to align.
1. XRP must reclaim major technical levels
The market would first need to recover and hold levels such as $1.65, followed by progressively higher resistance zones.
2. The $2 region would need to become support
A sustainable move above $2 would provide evidence that the market is accepting a higher valuation.
3. XRP would need to break through its previous major price structure
A move toward and beyond the $3–$4 region would require significant buying pressure.
4. Institutional demand would need to remain meaningful
ETF flows are potentially important because they provide an accessible route for institutional and traditional-market exposure.
5. XRPL activity would need to continue developing
Growth in tokenized assets, stablecoin activity, payments and institutional infrastructure could strengthen the broader ecosystem.
But the crucial distinction remains:
XRPL growth is not automatically equivalent to XRP price growth.
The economic connection between network activity and XRP demand needs to remain visible.
6. The broader crypto market would likely need to cooperate
A $500 billion-scale XRP valuation would be easier to sustain within a much larger and liquid digital-asset market than during a broad crypto contraction.
The Bull-Case Structure
The constructive scenario begins with XRP continuing to defend the $1.45–$1.50 region.
From there, buyers would need to reclaim $1.55 and eventually break the $1.65 resistance area.
A confirmed breakout could shift the chart from consolidation into expansion.
The next major psychological checkpoints would then be $2, $3 and eventually the previous major highs around the $3–$4 region.
If XRP were able to establish a new high above its historical range, the market could begin pricing a completely different valuation framework.
That is where the path toward $5, $6 and potentially $8 becomes technically conceivable.
But each level would need confirmation.
The market does not owe XRP a straight-line move.
The Bear Case Cannot Be Ignored
The biggest mistake would be to focus only on the $8 scenario.
If XRP loses $1.45 and fails to reclaim it, the market could revisit approximately $1.35.
If the deeper $1.25 support zone also breaks, the broader structure would deteriorate significantly.
A move toward the lower end of the broader range around $0.99 would then become technically relevant.
This is why support levels matter.
They are not simply numbers on a chart.
They tell us where the market's previous balance between buyers and sellers changed.
The Most Important Question: Is This Accumulation or Distribution?
That is ultimately what the XRP chart needs to answer.
If price repeatedly tests support but refuses to break lower, while volume expands during advances and institutional flows remain positive, the market could be demonstrating absorption.
If price repeatedly fails at resistance while selling volume increases and support levels disappear one by one, the interpretation changes.
The next several structural breaks will therefore be more important than any single prediction.
XRP's Supply Structure Also Matters
Unlike proof-of-work assets with ongoing mining issuance, XRP has a fixed maximum supply of 100 billion tokens.
However, the distinction between maximum supply and circulating supply is important when calculating valuation.
Recent market analysis uses approximately 62.7 billion XRP in circulation for its valuation calculations.
That means the headline $8 price target must always be viewed alongside supply.
At approximately 62.7 billion circulating XRP:
$1 = ~$62.7B market cap
$2 = ~$125.4B
$3 = ~$188.1B
$4 = ~$250.8B
$5 = ~$313.5B
$6 = ~$376.2B
$8 = ~$501.6B
These calculations illustrate why $8 is a substantial macro-market scenario rather than an ordinary technical target.
Future changes in circulating supply would also affect the exact market-cap calculation.
The Real XRP Thesis
The strongest version of the XRP thesis is not simply:
“XRP can go to $8.”
The more useful thesis is:
Can XRP evolve into an asset whose valuation is supported by institutional access, increasing financial infrastructure on XRPL, persistent market liquidity and sustained demand for the token itself?
That is the question the market is currently trying to answer.
The chart provides the framework.
The fundamentals provide the potential catalysts.
Macro liquidity provides the fuel.
And market participants ultimately decide whether the valuation is justified.
Final Outlook
XRP is currently sitting at a technically important point.
The immediate structure is centered around the $1.45–$1.50 support region, while $1.55–$1.65 represents the important upside resistance band.
Above $1.65, the chart could begin transitioning into a larger expansion structure.
Below $1.45, the market would need to defend lower levels.
Below $1.25, the broader recovery structure would become substantially weaker.
The path toward $8 therefore should not be viewed as one prediction.
It is a chain of conditions:
Hold support → reclaim resistance → establish $2 → break the previous major range → sustain institutional demand → expand XRPL activity → maintain favorable macro liquidity → build a much larger XRP valuation.
Only if those conditions progressively align does the $8 scenario become increasingly relevant.
For now, the most important thing is not the final number.
It is what XRP does at the levels immediately in front of it.
The market is testing support.
The next major move will tell us whether this is simply another consolidation phase—or the beginning of a much larger repricing cycle.
This is market analysis, not financial advice. Price targets such as $8 are scenario-based and highly speculative, not guarantees. Crypto assets can experience extreme volatility and substantial losses.
#Xrp🔥🔥
After a sharp period of volatility, price is now trading around the $1.50 area, with the market attempting to establish whether this zone can become a durable base or merely a temporary pause before another leg of volatility.
The interesting part is that the XRP chart is no longer simply about short-term price action.
The larger question is whether XRP can transition from a recovery asset into a broader institutional and liquidity-driven trade.
That distinction matters because an $8 XRP price would require much more than a technical breakout.
It would require a combination of stronger crypto liquidity, sustained institutional demand, continued XRP Ledger development, expanding real-world activity and a market willing to assign XRP a substantially larger valuation.
The chart can map the potential path.
The fundamentals and macro environment determine whether that path can actually be traveled.
The Current XRP Setup
Recent market data places XRP near $1.53–$1.56, while the recent daily range shows a major increase in volatility.
On September 21, XRP gained roughly 8.9%, moving from around $1.41 to above $1.57 before consolidating. The following sessions produced a mixture of gains and declines, with September 23 seeing a roughly 4.5% decline before XRP recovered toward the $1.50 area.
That sequence is important.
It shows that buyers have been willing to defend the lower-$1.40 area, but it also shows that sellers remain active around the upper part of the current range.
The immediate technical battle is therefore concentrated between support around $1.45–$1.50 and resistance around $1.55–$1.65.
A clean break of the upper boundary would change the technical conversation.
A sustained loss of support would do the opposite.
The First Level That Matters: $1.45–$1.50
The $1.45–$1.50 region has become an important short-term decision zone.
CoinMarketCap's current technical analysis identifies approximately $1.45–$1.48 as near-term support, while $1.56 is highlighted as an important resistance area. A break below $1.45 could expose approximately $1.35.
This creates a relatively clear framework.
If XRP repeatedly holds this region and buyers continue stepping in during pullbacks, the market can continue building a higher-timeframe base.
If price loses it decisively, the market could revisit lower support before attempting another recovery.
The distinction between a temporary intraday wick and a confirmed structural breakdown is critical.
Crypto markets frequently move below obvious support levels, trigger liquidations and then reclaim those same levels.
Therefore, the reaction after a support test may be more informative than the initial breakdown itself.
The Bigger Defensive Zone: $1.25
Below the immediate $1.45–$1.50 area sits a much more significant structural zone around $1.25.
One current daily framework places $1.25 as the more important defensive line, with approximately $0.99 representing the lower boundary of the three-month range.
This creates two different technical situations.
Above $1.25, XRP can still be viewed within a broad recovery/consolidation structure.
A sustained move below $1.25 would weaken that structure substantially and potentially expose the lower end of the broader range.
That makes $1.25 an important level for anyone analyzing the macro chart rather than simply watching intraday candles.
What the Indicators Are Saying
Current daily technical readings provide a mixed but constructive picture.
CoinLore currently shows XRP trading above its 10-, 20-, 30-, 50-, 100- and 200-day simple moving averages. Its listed daily EMAs are also below the current price, while the daily RSI is around 63.
That combination suggests that the broader daily structure has not been destroyed by the recent volatility.
But RSI around the low 60s also tells us something important:
XRP is not sitting in an extreme oversold condition waiting for an automatic rebound.
The market already recovered significantly from recent lows.
Consequently, the next phase needs confirmation through price structure and volume rather than simply relying on the argument that XRP has fallen enough.
The Breakout Zone
The $1.55–$1.65 region is where the chart becomes particularly interesting.
A move through $1.55 would put XRP back above a nearby resistance level identified by current technical analysis.
But $1.65 is arguably more important because it corresponds with the upper boundary of the recent three-month range identified in current market analysis.
A decisive move above $1.65 would therefore represent something more meaningful than a normal intraday bounce.
It would suggest that XRP is attempting to leave the current consolidation range.
From there, the next psychological and technical zones would need to be established progressively rather than assuming an immediate move to $8.
A possible long-term sequence could look like:
$1.50 → $1.65 → $2.00 → $3.00 → $4.00 → $5.00 → $6.00 → $8.00
These are scenario levels, not guaranteed targets.
The market would have to establish acceptance at each major region.
Why $2 Is More Important Than It Looks
The $2 level is likely to become an important psychological checkpoint if XRP successfully escapes its current range.
The reason is simple.
A move from approximately $1.50 to $2 would represent a gain of roughly one-third.
At the same time, reclaiming $2 would move XRP back toward a valuation level that the market has previously been willing to assign to the asset.
The important question would then become whether $2 acts as resistance or becomes support.
A failed breakout around $2 could produce another consolidation.
A successful reclaim followed by sustained trading above it could create the foundation for another expansion.
That is how a potential $8 path would need to develop: through multiple successful structural transitions rather than one uninterrupted vertical rally.
The $3–$4 Zone
Above $2, the $3–$4 region becomes increasingly important from a historical perspective.
XRP has previously traded significantly higher than its current price, but its historical all-time high remains below $4, according to recent market reporting.
That means a move toward $4 would not simply be another percentage rally.
It would represent a major attempt to establish a new valuation regime.
At these levels, market capitalization becomes increasingly important.
With approximately 62.7 billion XRP circulating, recent analysis estimates that a $10 XRP price would correspond to roughly $627 billion in market capitalization.
An $8 price using that same approximate circulating-supply figure would imply roughly:
$8 × 62.7 billion XRP ≈ $501.6 billion market capitalization
That is a massive valuation.
Therefore, an $8 scenario cannot reasonably be explained by chart patterns alone.
The market would need to absorb a valuation of roughly half a trillion dollars at the cited circulating supply.
What Could Drive That Repricing?
This is where the XRP story becomes more interesting than the chart itself.
XRP is connected to the XRP Ledger, Ripple's payment infrastructure and a growing ecosystem involving stablecoins, tokenized assets and institutional financial applications.
Recent reporting on XRPL showed a notable change in network activity.
During Q2, order-book trading volume reportedly increased approximately 79% year over year even though the number of accounts initiating trades fell around 41%. At the same time, average tokenized-asset and RLUSD balances reportedly climbed to approximately $4.26 billion.
That creates a more nuanced picture.
Network participation was not uniformly increasing across every metric.
But the value moving through certain parts of the ecosystem was becoming significantly larger.
For investors watching XRP, this distinction matters.
More users do not automatically mean more token value.
Likewise, larger transaction values do not automatically translate into higher XRP prices.
The key question is whether increasing ecosystem activity eventually creates persistent demand for XRP itself.
Institutional Demand Is Another Major Variable
Institutional access is becoming another important part of the XRP market structure.
CoinDesk reported that U.S. spot XRP exchange-traded funds experienced 11 consecutive sessions of net inflows, bringing approximately $170 million during that streak and approximately $1.68 billion since their November launch. The same report noted institutional holders including Goldman Sachs, Jane Street and Millennium in regulatory filings.
This does not guarantee higher XRP prices.
ETF flows can change.
Institutions can hedge.
Investors can reduce exposure.
And market-wide risk appetite can overwhelm asset-specific developments.
But structurally, spot investment products can make it easier for traditional investors to obtain XRP exposure without directly interacting with crypto exchanges or self-custody infrastructure.
That expands the potential investor base.
The next question is whether those flows remain persistent through both rising and falling markets.
The Macro Variable Cannot Be Ignored
XRP does not trade in isolation.
Liquidity conditions, Bitcoin's trend, interest-rate expectations, dollar strength, institutional risk appetite and overall crypto market capitalization can all influence the amount of capital available for altcoins.
A strong XRP-specific story can therefore struggle during a broad crypto deleveraging event.
Conversely, a favorable macro environment can amplify XRP-specific catalysts.
This is why the $8 thesis should be viewed as a macro-plus-fundamental scenario rather than simply a technical prediction.
If global liquidity expands and risk appetite returns to higher-beta crypto assets, XRP could receive an additional tailwind.
If liquidity tightens and investors move toward defensive assets, even strong XRP fundamentals may not prevent significant drawdowns.
What an $8 XRP Scenario Would Actually Require
For XRP to reach $8, several conditions would likely need to align.
1. XRP must reclaim major technical levels
The market would first need to recover and hold levels such as $1.65, followed by progressively higher resistance zones.
2. The $2 region would need to become support
A sustainable move above $2 would provide evidence that the market is accepting a higher valuation.
3. XRP would need to break through its previous major price structure
A move toward and beyond the $3–$4 region would require significant buying pressure.
4. Institutional demand would need to remain meaningful
ETF flows are potentially important because they provide an accessible route for institutional and traditional-market exposure.
5. XRPL activity would need to continue developing
Growth in tokenized assets, stablecoin activity, payments and institutional infrastructure could strengthen the broader ecosystem.
But the crucial distinction remains:
XRPL growth is not automatically equivalent to XRP price growth.
The economic connection between network activity and XRP demand needs to remain visible.
6. The broader crypto market would likely need to cooperate
A $500 billion-scale XRP valuation would be easier to sustain within a much larger and liquid digital-asset market than during a broad crypto contraction.
The Bull-Case Structure
The constructive scenario begins with XRP continuing to defend the $1.45–$1.50 region.
From there, buyers would need to reclaim $1.55 and eventually break the $1.65 resistance area.
A confirmed breakout could shift the chart from consolidation into expansion.
The next major psychological checkpoints would then be $2, $3 and eventually the previous major highs around the $3–$4 region.
If XRP were able to establish a new high above its historical range, the market could begin pricing a completely different valuation framework.
That is where the path toward $5, $6 and potentially $8 becomes technically conceivable.
But each level would need confirmation.
The market does not owe XRP a straight-line move.
The Bear Case Cannot Be Ignored
The biggest mistake would be to focus only on the $8 scenario.
If XRP loses $1.45 and fails to reclaim it, the market could revisit approximately $1.35.
If the deeper $1.25 support zone also breaks, the broader structure would deteriorate significantly.
A move toward the lower end of the broader range around $0.99 would then become technically relevant.
This is why support levels matter.
They are not simply numbers on a chart.
They tell us where the market's previous balance between buyers and sellers changed.
The Most Important Question: Is This Accumulation or Distribution?
That is ultimately what the XRP chart needs to answer.
If price repeatedly tests support but refuses to break lower, while volume expands during advances and institutional flows remain positive, the market could be demonstrating absorption.
If price repeatedly fails at resistance while selling volume increases and support levels disappear one by one, the interpretation changes.
The next several structural breaks will therefore be more important than any single prediction.
XRP's Supply Structure Also Matters
Unlike proof-of-work assets with ongoing mining issuance, XRP has a fixed maximum supply of 100 billion tokens.
However, the distinction between maximum supply and circulating supply is important when calculating valuation.
Recent market analysis uses approximately 62.7 billion XRP in circulation for its valuation calculations.
That means the headline $8 price target must always be viewed alongside supply.
At approximately 62.7 billion circulating XRP:
$1 = ~$62.7B market cap
$2 = ~$125.4B
$3 = ~$188.1B
$4 = ~$250.8B
$5 = ~$313.5B
$6 = ~$376.2B
$8 = ~$501.6B
These calculations illustrate why $8 is a substantial macro-market scenario rather than an ordinary technical target.
Future changes in circulating supply would also affect the exact market-cap calculation.
The Real XRP Thesis
The strongest version of the XRP thesis is not simply:
“XRP can go to $8.”
The more useful thesis is:
Can XRP evolve into an asset whose valuation is supported by institutional access, increasing financial infrastructure on XRPL, persistent market liquidity and sustained demand for the token itself?
That is the question the market is currently trying to answer.
The chart provides the framework.
The fundamentals provide the potential catalysts.
Macro liquidity provides the fuel.
And market participants ultimately decide whether the valuation is justified.
Final Outlook
XRP is currently sitting at a technically important point.
The immediate structure is centered around the $1.45–$1.50 support region, while $1.55–$1.65 represents the important upside resistance band.
Above $1.65, the chart could begin transitioning into a larger expansion structure.
Below $1.45, the market would need to defend lower levels.
Below $1.25, the broader recovery structure would become substantially weaker.
The path toward $8 therefore should not be viewed as one prediction.
It is a chain of conditions:
Hold support → reclaim resistance → establish $2 → break the previous major range → sustain institutional demand → expand XRPL activity → maintain favorable macro liquidity → build a much larger XRP valuation.
Only if those conditions progressively align does the $8 scenario become increasingly relevant.
For now, the most important thing is not the final number.
It is what XRP does at the levels immediately in front of it.
The market is testing support.
The next major move will tell us whether this is simply another consolidation phase—or the beginning of a much larger repricing cycle.
This is market analysis, not financial advice. Price targets such as $8 are scenario-based and highly speculative, not guarantees. Crypto assets can experience extreme volatility and substantial losses.
#Xrp🔥🔥
82
·
--
O‘suvchi
Tarjimani ko‘rish
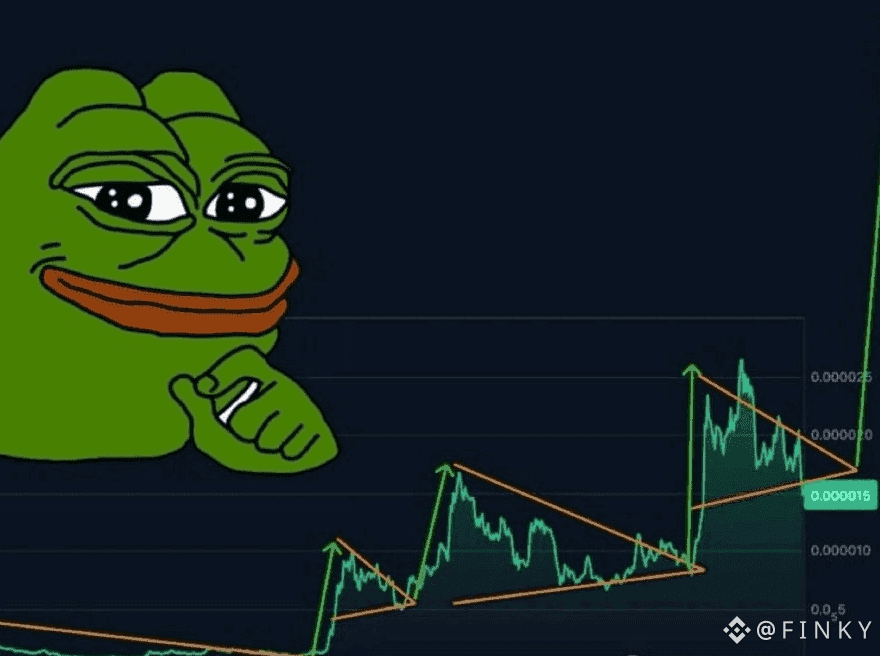
$PEPE — The frog is moving again.
Who caught $PEPE from my earlier call?
PEPE has been showing renewed momentum, with the token recently trading around the $0.0000044 area and a market cap around $1.8B. 24H trading volume remains hundreds of millions of dollars, showing that liquidity and market attention are still significant.
The bigger story is the community-driven meme narrative. PEPE remains one of the most closely watched meme assets, and recent whale-flow data showed more PEPE leaving tracked exchanges than entering them, although that flow alone does not guarantee future price appreciation.
And then there is the question everyone keeps asking:
Could ever reach $1?
With roughly 413–421 trillion tokens in circulation depending on the data source, a $1 PEPE would imply a market capitalization in the hundreds of trillions of dollars. That makes $1 an extremely speculative hypothetical rather than a realistic near-term target under today's supply structure.
That’s exactly why the interesting story is not simply "$1."
The real question is how far PEPE can reprice if meme-coin liquidity, Bitcoin strength, retail participation and social attention all accelerate together.
PEPE remains highly volatile and fundamentally different from utility-focused crypto assets. Its value is heavily tied to market demand, liquidity and the strength of its meme/community narrative.
The frog doesn't need a $1 price to make a major move.
The numbers will tell the story.
Who is still holding $PEPE
{spot}(PEPEUSDT)
$PEPE — The frog is moving again.
Who caught $PEPE from my earlier call?
PEPE has been showing renewed momentum, with the token recently trading around the $0.0000044 area and a market cap around $1.8B. 24H trading volume remains hundreds of millions of dollars, showing that liquidity and market attention are still significant.
The bigger story is the community-driven meme narrative. PEPE remains one of the most closely watched meme assets, and recent whale-flow data showed more PEPE leaving tracked exchanges than entering them, although that flow alone does not guarantee future price appreciation.
And then there is the question everyone keeps asking:
Could ever reach $1?
With roughly 413–421 trillion tokens in circulation depending on the data source, a $1 PEPE would imply a market capitalization in the hundreds of trillions of dollars. That makes $1 an extremely speculative hypothetical rather than a realistic near-term target under today's supply structure.
That’s exactly why the interesting story is not simply "$1."
The real question is how far PEPE can reprice if meme-coin liquidity, Bitcoin strength, retail participation and social attention all accelerate together.
PEPE remains highly volatile and fundamentally different from utility-focused crypto assets. Its value is heavily tied to market demand, liquidity and the strength of its meme/community narrative.
The frog doesn't need a $1 price to make a major move.
The numbers will tell the story.
Who is still holding $PEPE
Who caught $PEPE from my earlier call?
PEPE has been showing renewed momentum, with the token recently trading around the $0.0000044 area and a market cap around $1.8B. 24H trading volume remains hundreds of millions of dollars, showing that liquidity and market attention are still significant.
The bigger story is the community-driven meme narrative. PEPE remains one of the most closely watched meme assets, and recent whale-flow data showed more PEPE leaving tracked exchanges than entering them, although that flow alone does not guarantee future price appreciation.
And then there is the question everyone keeps asking:
Could ever reach $1?
With roughly 413–421 trillion tokens in circulation depending on the data source, a $1 PEPE would imply a market capitalization in the hundreds of trillions of dollars. That makes $1 an extremely speculative hypothetical rather than a realistic near-term target under today's supply structure.
That’s exactly why the interesting story is not simply "$1."
The real question is how far PEPE can reprice if meme-coin liquidity, Bitcoin strength, retail participation and social attention all accelerate together.
PEPE remains highly volatile and fundamentally different from utility-focused crypto assets. Its value is heavily tied to market demand, liquidity and the strength of its meme/community narrative.
The frog doesn't need a $1 price to make a major move.
The numbers will tell the story.
Who is still holding $PEPE
1
79
·
--
O‘suvchi
Tarjimani ko‘rish
$RHEA — THE MOVE HAS ALREADY STARTED, NOW THE KEY IS THE HOLD
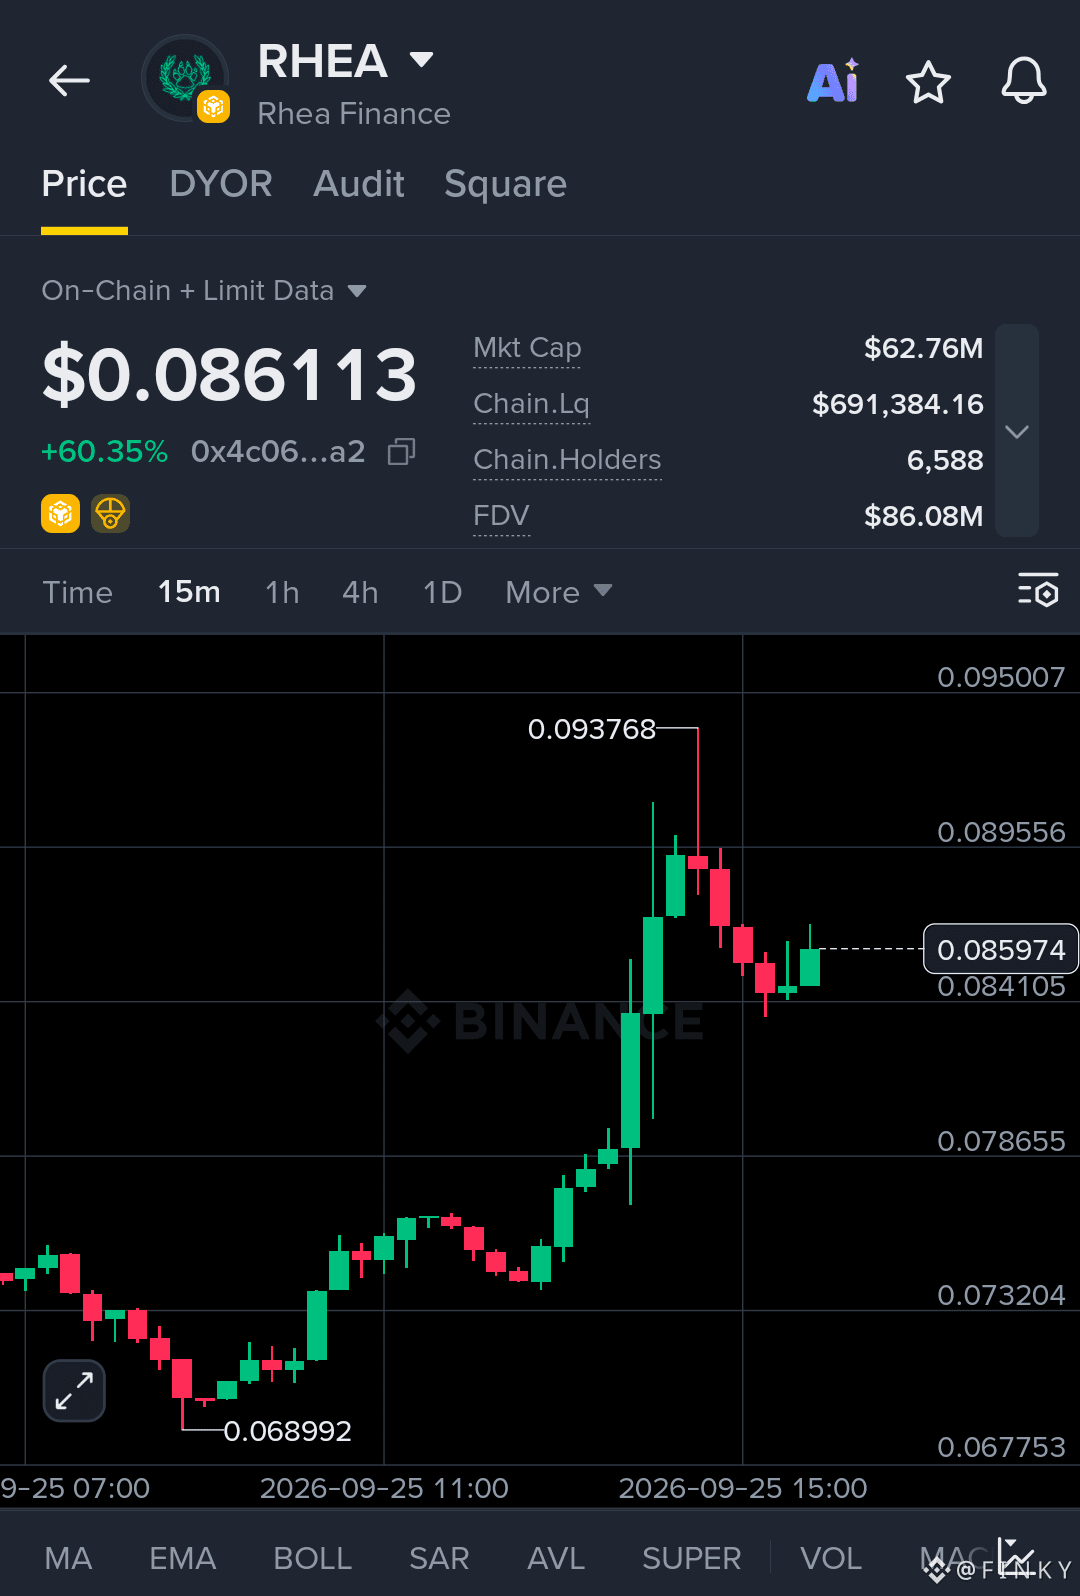
Rhea Finance is showing aggressive momentum on the 15M chart.
Price is currently around $0.08611, with the screenshot showing +60.35% on the session. The move started from the $0.06899 area and pushed sharply into a fresh local high of $0.093768.
After that spike, price pulled back and is now attempting to stabilize around $0.08410–$0.08600.
SIGNAL SETUP
Entry: $0.08450 – $0.08620
Stop Loss: $0.08180
TP1: $0.08955
TP2: $0.09377
TP3: $0.09500
KEY LEVELS
Support:
$0.
{alpha}(560x4c067de26475e1cefee8b8d1f6e2266b33a2372e)
#CFTCUpdatesGuidanceOnTokenizedAssets #BinanceWillListHyperliquid(HYPE) #FedProposesRulesForBankIssuedStablecoins #OndoFinanceSoughtSaleAfterFoundersDeath #FedOctoberRateHikeOddsRiseTo69.7%
$RHEA — THE MOVE HAS ALREADY STARTED, NOW THE KEY IS THE HOLD
Rhea Finance is showing aggressive momentum on the 15M chart.
Price is currently around $0.08611, with the screenshot showing +60.35% on the session. The move started from the $0.06899 area and pushed sharply into a fresh local high of $0.093768.
After that spike, price pulled back and is now attempting to stabilize around $0.08410–$0.08600.
SIGNAL SETUP
Entry: $0.08450 – $0.08620
Stop Loss: $0.08180
TP1: $0.08955
TP2: $0.09377
TP3: $0.09500
KEY LEVELS
Support:
$0.
#CFTCUpdatesGuidanceOnTokenizedAssets #BinanceWillListHyperliquid(HYPE) #FedProposesRulesForBankIssuedStablecoins #OndoFinanceSoughtSaleAfterFoundersDeath #FedOctoberRateHikeOddsRiseTo69.7%
Rhea Finance is showing aggressive momentum on the 15M chart.
Price is currently around $0.08611, with the screenshot showing +60.35% on the session. The move started from the $0.06899 area and pushed sharply into a fresh local high of $0.093768.
After that spike, price pulled back and is now attempting to stabilize around $0.08410–$0.08600.
SIGNAL SETUP
Entry: $0.08450 – $0.08620
Stop Loss: $0.08180
TP1: $0.08955
TP2: $0.09377
TP3: $0.09500
KEY LEVELS
Support:
$0.
#CFTCUpdatesGuidanceOnTokenizedAssets #BinanceWillListHyperliquid(HYPE) #FedProposesRulesForBankIssuedStablecoins #OndoFinanceSoughtSaleAfterFoundersDeath #FedOctoberRateHikeOddsRiseTo69.7%
1
73
·
--
O‘suvchi
Tarjimani ko‘rish
$BTW — BITWAY IS PUSHING INTO PRICE DISCOVERY
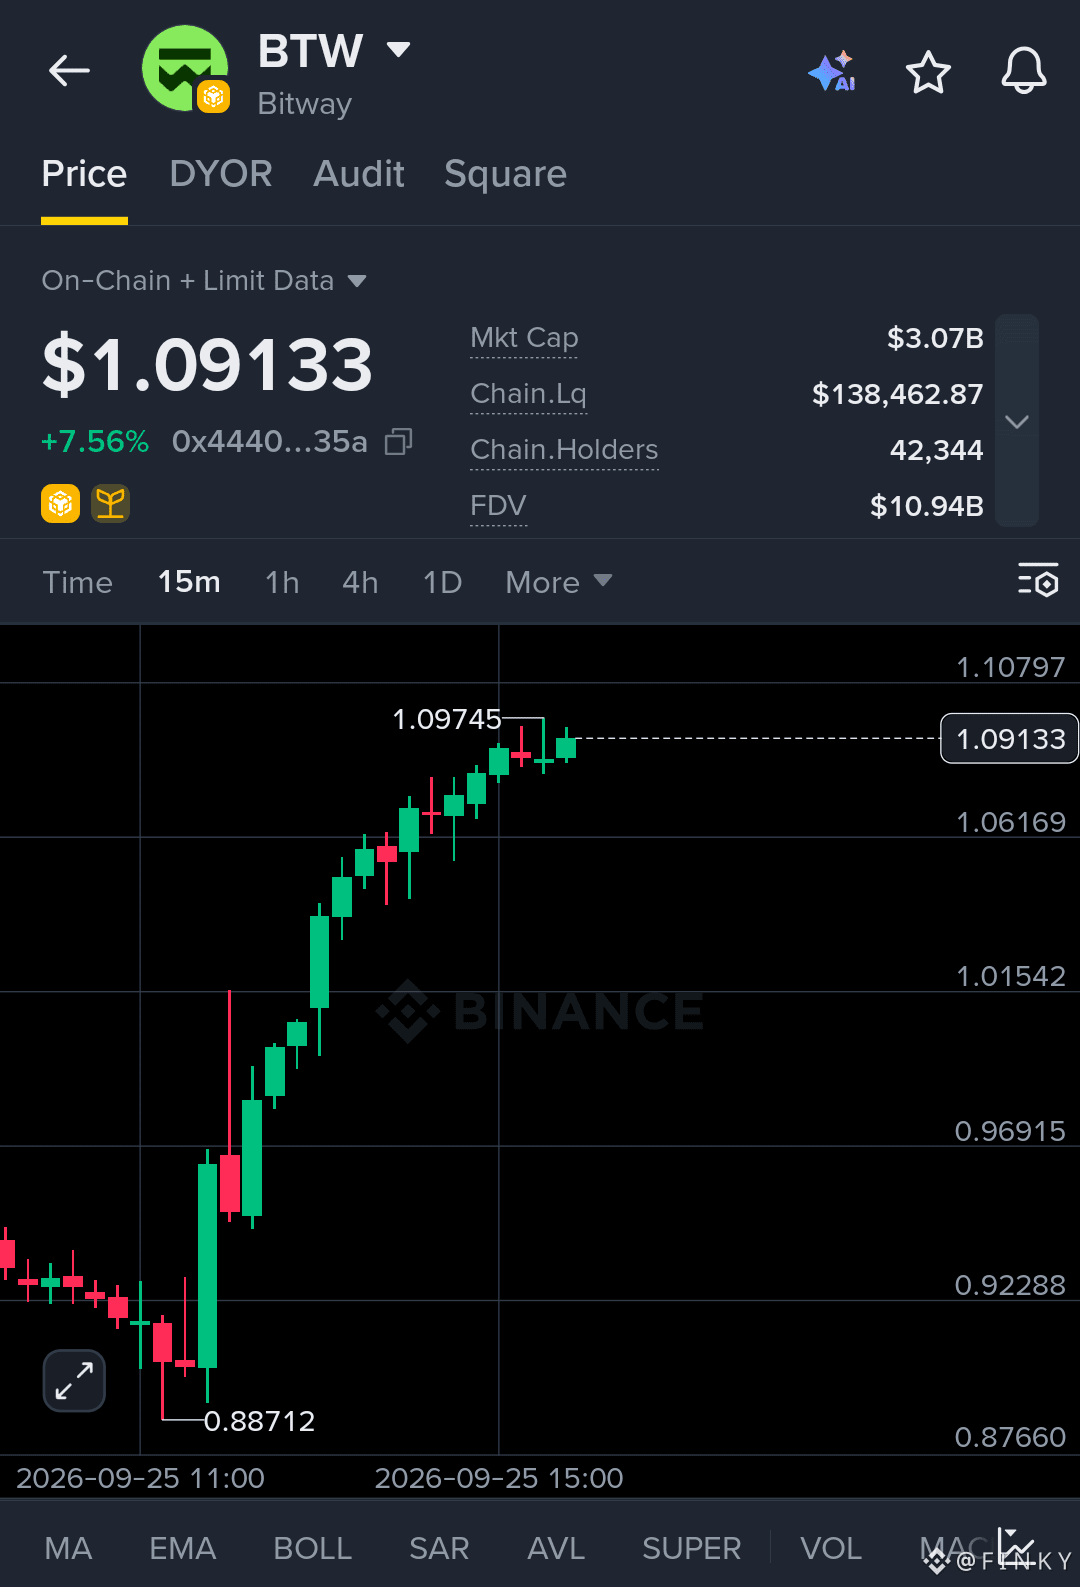
BTW is showing one of the strongest structures on the 15M chart right now.
Price is sitting around $1.0913, up 7.56% on the screenshot, after an aggressive move from the $0.88712 low. The important part is not just the percentage gain — it is the sequence of higher highs and higher lows that has developed throughout the move.
The latest candles are consolidating just below the visible $1.09745 high. A clean reclaim of that zone would put the $1.108 area directly in focus.
SIGNAL SETUP
Entry: $1.075 – $1.095
Stop Loss: $1.048
TP1: $1.108
TP2: $1.135
TP3: $1.175
KEY LEVELS
Support:
$1.0617
$1.0154
$0.9691
$0.8871
Resistance:
$1.09745
$1.1080
$1.1350
$1.1750
CHART READ
The 15M structure has shifted sharply from the $0.88712 low.
Price reclaimed:
$0.9229
$0.9691
$1.0154
$1.0617
Now the market is holding above $1.06 while pressing against the recent $1.09745 high.
That makes $1.09745 the immediate decision zone.
A sustained break above it would confirm another leg of the current momentum structure. Losing $1.0617 would weaken the setup and increase the probability of a deeper retracement.
FUNDAMENTAL SNAPSHOT
Bitway
{alpha}(560x444045b0ee1ee319a660a5e3d604ca0ffa35acaa)
#CFTCUpdatesGuidanceOnTokenizedAssets #NYAndPolymarketSueEachOther #BinanceWillListHyperliquid(HYPE) #FedProposesRulesForBankIssuedStablecoins #OndoFinanceSoughtSaleAfterFoundersDeath
$BTW — BITWAY IS PUSHING INTO PRICE DISCOVERY
BTW is showing one of the strongest structures on the 15M chart right now.
Price is sitting around $1.0913, up 7.56% on the screenshot, after an aggressive move from the $0.88712 low. The important part is not just the percentage gain — it is the sequence of higher highs and higher lows that has developed throughout the move.
The latest candles are consolidating just below the visible $1.09745 high. A clean reclaim of that zone would put the $1.108 area directly in focus.
SIGNAL SETUP
Entry: $1.075 – $1.095
Stop Loss: $1.048
TP1: $1.108
TP2: $1.135
TP3: $1.175
KEY LEVELS
Support:
$1.0617
$1.0154
$0.9691
$0.8871
Resistance:
$1.09745
$1.1080
$1.1350
$1.1750
CHART READ
The 15M structure has shifted sharply from the $0.88712 low.
Price reclaimed:
$0.9229
$0.9691
$1.0154
$1.0617
Now the market is holding above $1.06 while pressing against the recent $1.09745 high.
That makes $1.09745 the immediate decision zone.
A sustained break above it would confirm another leg of the current momentum structure. Losing $1.0617 would weaken the setup and increase the probability of a deeper retracement.
FUNDAMENTAL SNAPSHOT
Bitway
#CFTCUpdatesGuidanceOnTokenizedAssets #NYAndPolymarketSueEachOther #BinanceWillListHyperliquid(HYPE) #FedProposesRulesForBankIssuedStablecoins #OndoFinanceSoughtSaleAfterFoundersDeath
BTW is showing one of the strongest structures on the 15M chart right now.
Price is sitting around $1.0913, up 7.56% on the screenshot, after an aggressive move from the $0.88712 low. The important part is not just the percentage gain — it is the sequence of higher highs and higher lows that has developed throughout the move.
The latest candles are consolidating just below the visible $1.09745 high. A clean reclaim of that zone would put the $1.108 area directly in focus.
SIGNAL SETUP
Entry: $1.075 – $1.095
Stop Loss: $1.048
TP1: $1.108
TP2: $1.135
TP3: $1.175
KEY LEVELS
Support:
$1.0617
$1.0154
$0.9691
$0.8871
Resistance:
$1.09745
$1.1080
$1.1350
$1.1750
CHART READ
The 15M structure has shifted sharply from the $0.88712 low.
Price reclaimed:
$0.9229
$0.9691
$1.0154
$1.0617
Now the market is holding above $1.06 while pressing against the recent $1.09745 high.
That makes $1.09745 the immediate decision zone.
A sustained break above it would confirm another leg of the current momentum structure. Losing $1.0617 would weaken the setup and increase the probability of a deeper retracement.
FUNDAMENTAL SNAPSHOT
Bitway
#CFTCUpdatesGuidanceOnTokenizedAssets #NYAndPolymarketSueEachOther #BinanceWillListHyperliquid(HYPE) #FedProposesRulesForBankIssuedStablecoins #OndoFinanceSoughtSaleAfterFoundersDeath
1
183
·
--
O‘suvchi
Tarjimani ko‘rish
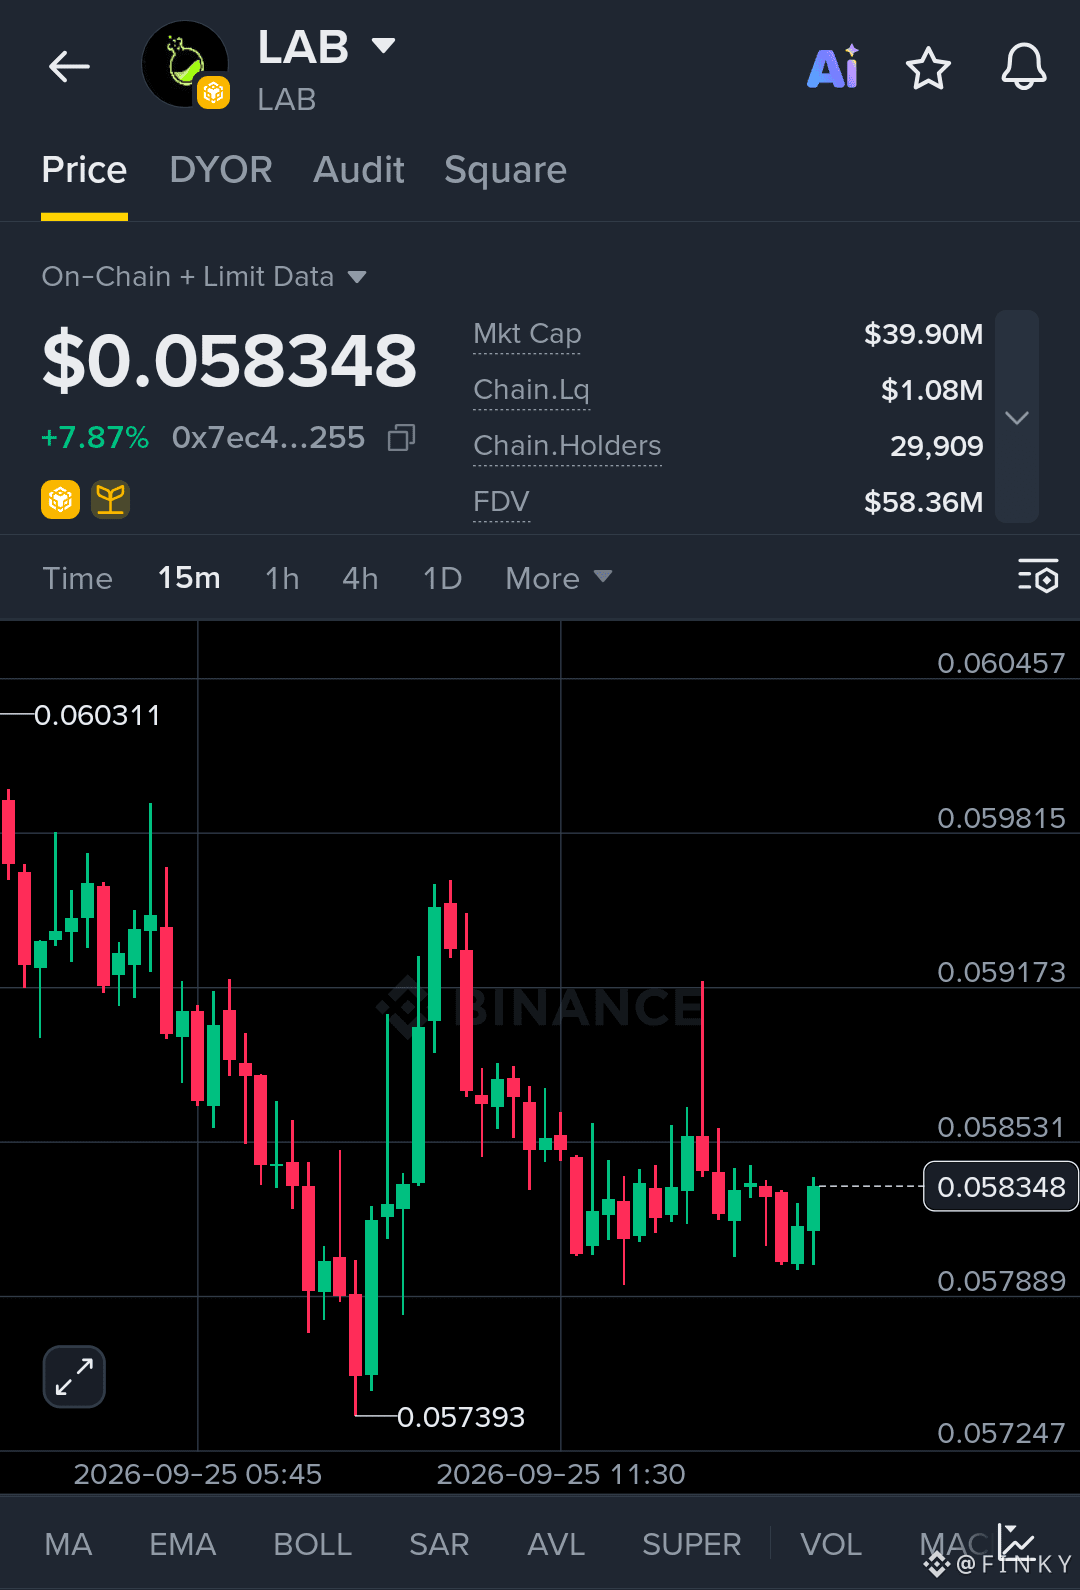
$LAB — A Tight Range Is Building After the Sell-Off
LAB is trading around $0.05835, up roughly 7.87% on the chart, with price now compressing between the $0.0579 and $0.0585 area.
The 15M structure shows a sharp recovery from the $0.05739 low, followed by consolidation. Buyers are defending the lower range, but the real confirmation comes from reclaiming the $0.05917 resistance zone.
SIGNAL SETUP
Entry: $0.05810 – $0.05850
Stop Loss: $0.05725
TP1: $0.05917
TP2: $0.05982
TP3: $0.06045
Key Support:
$0.05789
$0.05739
Key Resistance:
$0.05853
$0.05917
$0.05982
$0.06045
Market Structure:
LAB bounced strongly from $0.05739 and is now forming a tight 15M consolidation. The repeated defense of the $0.0579 area is important, while a clean break above $0.05917 would provide stronger confirmation of momentum.
Fundamental Snapshot:
Current market data puts LAB around a $45M market cap with roughly 775.5M LAB circulating out of a 1B maximum supply. 24H trading volume is around $40M, showing substantial activity relative to its market cap.
Risk:
LAB remains highly volatile. The setup is invalidated if price loses the $0.05725 area. Do not chase a sharp candle; let the entry and confirmation levels work.
The chart is compressed, liquidity is
{alpha}(560x7ec43cf65f1663f820427c62a5780b8f2e25593a)
#CFTCUpdatesGuidanceOnTokenizedAssets #BinanceWillListHyperliquid(HYPE) #FedProposesRulesForBankIssuedStablecoins #OndoFinanceSoughtSaleAfterFoundersDeath #FedOctoberRateHikeOddsRiseTo69.7%
$LAB — A Tight Range Is Building After the Sell-Off
LAB is trading around $0.05835, up roughly 7.87% on the chart, with price now compressing between the $0.0579 and $0.0585 area.
The 15M structure shows a sharp recovery from the $0.05739 low, followed by consolidation. Buyers are defending the lower range, but the real confirmation comes from reclaiming the $0.05917 resistance zone.
SIGNAL SETUP
Entry: $0.05810 – $0.05850
Stop Loss: $0.05725
TP1: $0.05917
TP2: $0.05982
TP3: $0.06045
Key Support:
$0.05789
$0.05739
Key Resistance:
$0.05853
$0.05917
$0.05982
$0.06045
Market Structure:
LAB bounced strongly from $0.05739 and is now forming a tight 15M consolidation. The repeated defense of the $0.0579 area is important, while a clean break above $0.05917 would provide stronger confirmation of momentum.
Fundamental Snapshot:
Current market data puts LAB around a $45M market cap with roughly 775.5M LAB circulating out of a 1B maximum supply. 24H trading volume is around $40M, showing substantial activity relative to its market cap.
Risk:
LAB remains highly volatile. The setup is invalidated if price loses the $0.05725 area. Do not chase a sharp candle; let the entry and confirmation levels work.
The chart is compressed, liquidity is
#CFTCUpdatesGuidanceOnTokenizedAssets #BinanceWillListHyperliquid(HYPE) #FedProposesRulesForBankIssuedStablecoins #OndoFinanceSoughtSaleAfterFoundersDeath #FedOctoberRateHikeOddsRiseTo69.7%
LAB is trading around $0.05835, up roughly 7.87% on the chart, with price now compressing between the $0.0579 and $0.0585 area.
The 15M structure shows a sharp recovery from the $0.05739 low, followed by consolidation. Buyers are defending the lower range, but the real confirmation comes from reclaiming the $0.05917 resistance zone.
SIGNAL SETUP
Entry: $0.05810 – $0.05850
Stop Loss: $0.05725
TP1: $0.05917
TP2: $0.05982
TP3: $0.06045
Key Support:
$0.05789
$0.05739
Key Resistance:
$0.05853
$0.05917
$0.05982
$0.06045
Market Structure:
LAB bounced strongly from $0.05739 and is now forming a tight 15M consolidation. The repeated defense of the $0.0579 area is important, while a clean break above $0.05917 would provide stronger confirmation of momentum.
Fundamental Snapshot:
Current market data puts LAB around a $45M market cap with roughly 775.5M LAB circulating out of a 1B maximum supply. 24H trading volume is around $40M, showing substantial activity relative to its market cap.
Risk:
LAB remains highly volatile. The setup is invalidated if price loses the $0.05725 area. Do not chase a sharp candle; let the entry and confirmation levels work.
The chart is compressed, liquidity is
#CFTCUpdatesGuidanceOnTokenizedAssets #BinanceWillListHyperliquid(HYPE) #FedProposesRulesForBankIssuedStablecoins #OndoFinanceSoughtSaleAfterFoundersDeath #FedOctoberRateHikeOddsRiseTo69.7%
55
·
--
O‘suvchi
Tarjimani ko‘rish
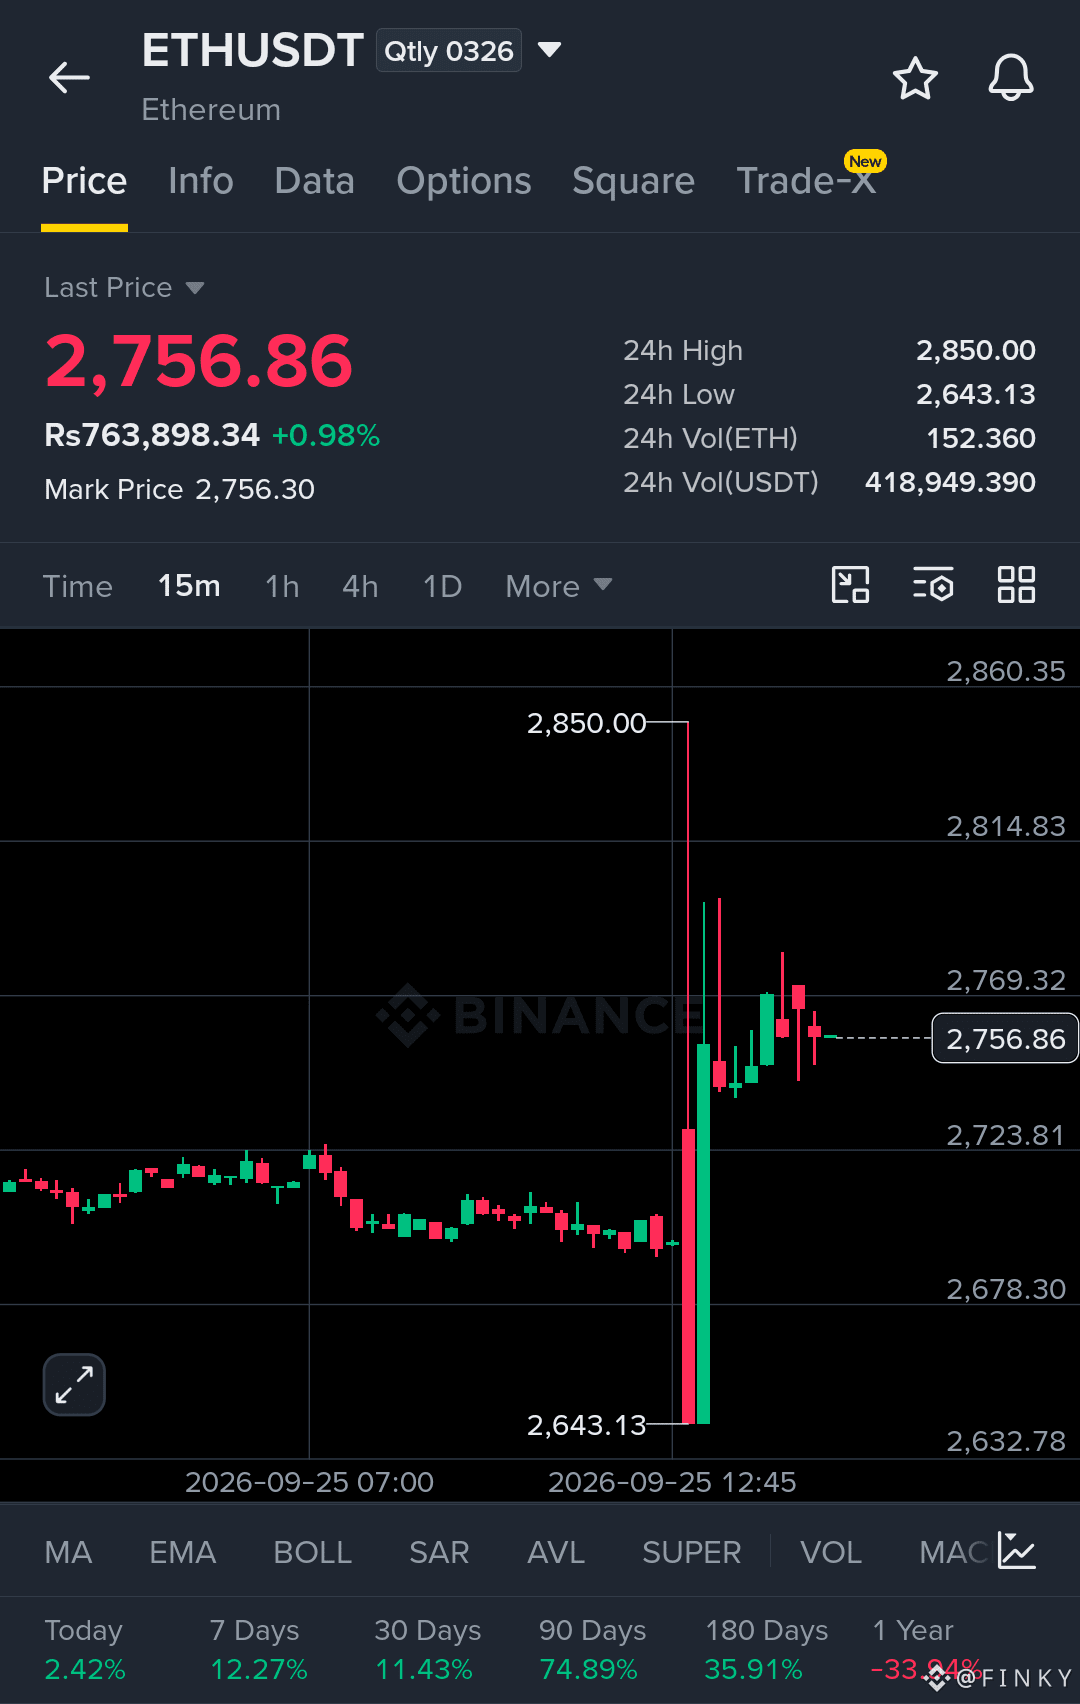
$ETH USDT — VIOLENT MOVE, STRONG RECOVERY
Ethereum just delivered a major volatility expansion on the 15M chart.
Current Price: 2,756.86
24H Change: +0.98%
24H High: 2,850.00
24H Low: 2,643.13
Mark Price: 2,756.30
24H Volume: 152.360 ETH
24H Volume (USDT): 418,949.390
The chart shows a sharp liquidity sweep from 2,643.13 followed by an aggressive recovery toward 2,850.
That move created a wide intraday range of more than $200, so ETH is currently sitting in a high-volatility zone.
KEY LEVELS
Support 1: 2,720–2,730
Support 2: 2,675–2,690
Major support: 2,640–2,650
Resistance 1: 2,770–2,785
Resistance 2: 2,815–2,825
Major resistance: 2,850–2,860
SIGNAL SETUP
LONG CONFIRMATION
Entry: 2,770–2,785 after a clean 15M breakout and hold
Stop Loss: 2,735
TP1: 2,815
TP2: 2,850
TP3: 2,900
SHORT CONFIRMATION
Entry: 2,720–2,710 after a confirmed 15M breakdown
Stop Loss: 2,755
TP1: 2,680
TP2: 2,645
TP3: 2,620
MARKET READ
ETH has recovered strongly from the 2,643 liquidity sweep, but the rejection near 2,850 shows that sellers are still active around the upper range.
The 2,770 area is now important.
A decisive reclaim with volume could open the way toward the 2,815–2,850 resistance zone.
If 2,720 fails, the recovery structure becomes vulnerable and the market could revisit the lower support region.
This is a confirmation setup — not a blind entry.
Wait for the 15M candle close, watch volume, and keep leverage under control because this chart is showing extreme intraday volatility.
Risk managed. Confirmation first. Let the chart decide.
{spot}(ETHUSDT)
#CFTCUpdatesGuidanceOnTokenizedAssets #BinanceWillListHyperliquid(HYPE) #FedProposesRulesForBankIssuedStablecoins #OndoFinanceSoughtSaleAfterFoundersDeath #FedOctoberRateHikeOddsRiseTo69.7%
$ETH USDT — VIOLENT MOVE, STRONG RECOVERY
Ethereum just delivered a major volatility expansion on the 15M chart.
Current Price: 2,756.86
24H Change: +0.98%
24H High: 2,850.00
24H Low: 2,643.13
Mark Price: 2,756.30
24H Volume: 152.360 ETH
24H Volume (USDT): 418,949.390
The chart shows a sharp liquidity sweep from 2,643.13 followed by an aggressive recovery toward 2,850.
That move created a wide intraday range of more than $200, so ETH is currently sitting in a high-volatility zone.
KEY LEVELS
Support 1: 2,720–2,730
Support 2: 2,675–2,690
Major support: 2,640–2,650
Resistance 1: 2,770–2,785
Resistance 2: 2,815–2,825
Major resistance: 2,850–2,860
SIGNAL SETUP
LONG CONFIRMATION
Entry: 2,770–2,785 after a clean 15M breakout and hold
Stop Loss: 2,735
TP1: 2,815
TP2: 2,850
TP3: 2,900
SHORT CONFIRMATION
Entry: 2,720–2,710 after a confirmed 15M breakdown
Stop Loss: 2,755
TP1: 2,680
TP2: 2,645
TP3: 2,620
MARKET READ
ETH has recovered strongly from the 2,643 liquidity sweep, but the rejection near 2,850 shows that sellers are still active around the upper range.
The 2,770 area is now important.
A decisive reclaim with volume could open the way toward the 2,815–2,850 resistance zone.
If 2,720 fails, the recovery structure becomes vulnerable and the market could revisit the lower support region.
This is a confirmation setup — not a blind entry.
Wait for the 15M candle close, watch volume, and keep leverage under control because this chart is showing extreme intraday volatility.
Risk managed. Confirmation first. Let the chart decide.
#CFTCUpdatesGuidanceOnTokenizedAssets #BinanceWillListHyperliquid(HYPE) #FedProposesRulesForBankIssuedStablecoins #OndoFinanceSoughtSaleAfterFoundersDeath #FedOctoberRateHikeOddsRiseTo69.7%
Ethereum just delivered a major volatility expansion on the 15M chart.
Current Price: 2,756.86
24H Change: +0.98%
24H High: 2,850.00
24H Low: 2,643.13
Mark Price: 2,756.30
24H Volume: 152.360 ETH
24H Volume (USDT): 418,949.390
The chart shows a sharp liquidity sweep from 2,643.13 followed by an aggressive recovery toward 2,850.
That move created a wide intraday range of more than $200, so ETH is currently sitting in a high-volatility zone.
KEY LEVELS
Support 1: 2,720–2,730
Support 2: 2,675–2,690
Major support: 2,640–2,650
Resistance 1: 2,770–2,785
Resistance 2: 2,815–2,825
Major resistance: 2,850–2,860
SIGNAL SETUP
LONG CONFIRMATION
Entry: 2,770–2,785 after a clean 15M breakout and hold
Stop Loss: 2,735
TP1: 2,815
TP2: 2,850
TP3: 2,900
SHORT CONFIRMATION
Entry: 2,720–2,710 after a confirmed 15M breakdown
Stop Loss: 2,755
TP1: 2,680
TP2: 2,645
TP3: 2,620
MARKET READ
ETH has recovered strongly from the 2,643 liquidity sweep, but the rejection near 2,850 shows that sellers are still active around the upper range.
The 2,770 area is now important.
A decisive reclaim with volume could open the way toward the 2,815–2,850 resistance zone.
If 2,720 fails, the recovery structure becomes vulnerable and the market could revisit the lower support region.
This is a confirmation setup — not a blind entry.
Wait for the 15M candle close, watch volume, and keep leverage under control because this chart is showing extreme intraday volatility.
Risk managed. Confirmation first. Let the chart decide.
#CFTCUpdatesGuidanceOnTokenizedAssets #BinanceWillListHyperliquid(HYPE) #FedProposesRulesForBankIssuedStablecoins #OndoFinanceSoughtSaleAfterFoundersDeath #FedOctoberRateHikeOddsRiseTo69.7%
48
·
--
O‘suvchi
Tarjimani ko‘rish
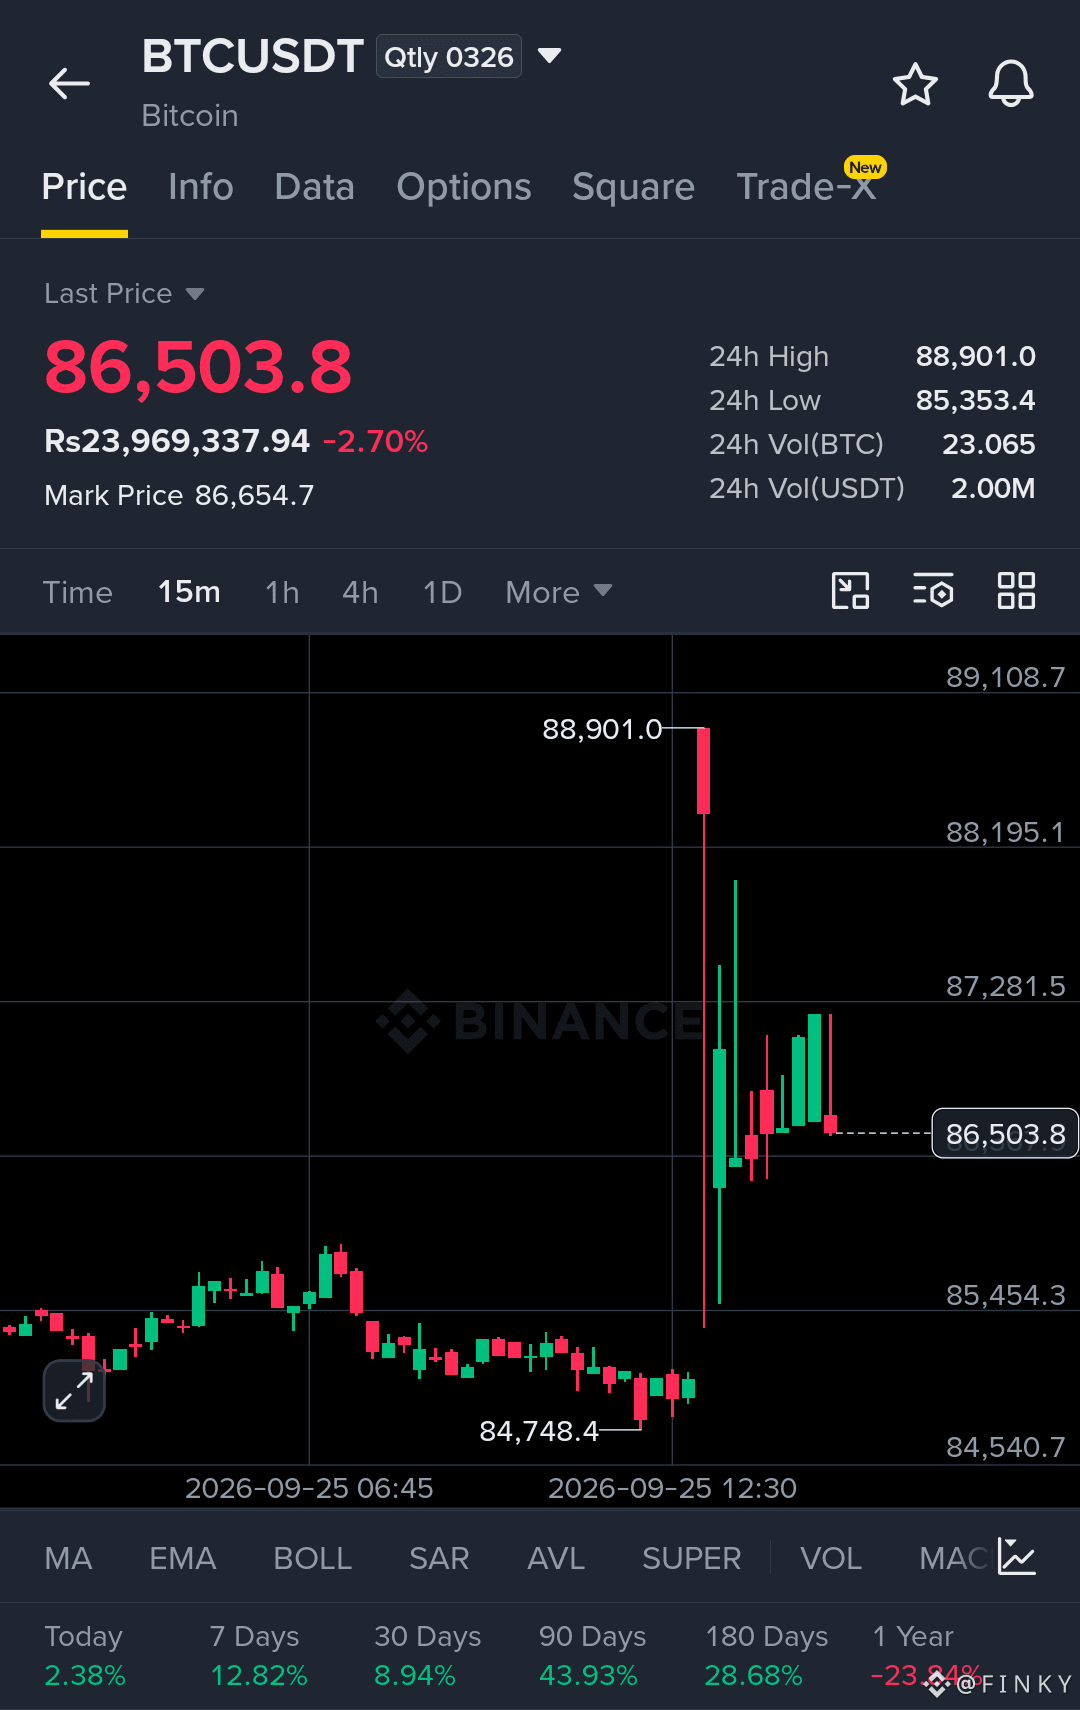
$BTC USDT — VOLATILITY IS BACK
Bitcoin is trading around 86,503.8 after one of the sharpest intraday moves visible on this 15M chart.
24H High: 88,901
24H Low: 85,353.4
Current Price: 86,503.8
Mark Price: 86,654.7
24H Change: -2.70%
24H Volume: 23.065 BTC / ~2.00M USDT
The important part is the structure.
BTC pushed from the 84,748 area all the way toward 88,901, but the move was rejected aggressively. Price then recovered from the 85,353 zone and is now consolidating around 86,500.
Key levels are clearly visible:
Support 1: 85,350–85,500
Support 2: 84,750–84,900
Resistance 1: 87,250–87,300
Resistance 2: 88,150–88,250
Major resistance: 88,900–89,100
SIGNAL SETUP
Bullish confirmation:
Entry: 87,300+ after a clean 15M breakout and hold
Stop Loss: 86,500
TP1: 88,150
TP2: 88,900
TP3: 89,100+
Bearish confirmation:
Entry: 85,350–85,300 after a confirmed 15M breakdown
Stop Loss: 86,150
TP1: 84,900
TP2: 84,750
TP3: 84,500
The key zone right now is 86,500–87,300.
A clean reclaim above resistance would show that buyers are absorbing the previous rejection. On the other hand, losing 85,350 would put the recent recovery under serious pressure.
No blind entry
{spot}(BTCUSDT)
#CFTCUpdatesGuidanceOnTokenizedAssets #BinanceWillListHyperliquid(HYPE) #FedProposesRulesForBankIssuedStablecoins #OndoFinanceSoughtSaleAfterFoundersDeath #FedOctoberRateHikeOddsRiseTo69.7%
$BTC USDT — VOLATILITY IS BACK
Bitcoin is trading around 86,503.8 after one of the sharpest intraday moves visible on this 15M chart.
24H High: 88,901
24H Low: 85,353.4
Current Price: 86,503.8
Mark Price: 86,654.7
24H Change: -2.70%
24H Volume: 23.065 BTC / ~2.00M USDT
The important part is the structure.
BTC pushed from the 84,748 area all the way toward 88,901, but the move was rejected aggressively. Price then recovered from the 85,353 zone and is now consolidating around 86,500.
Key levels are clearly visible:
Support 1: 85,350–85,500
Support 2: 84,750–84,900
Resistance 1: 87,250–87,300
Resistance 2: 88,150–88,250
Major resistance: 88,900–89,100
SIGNAL SETUP
Bullish confirmation:
Entry: 87,300+ after a clean 15M breakout and hold
Stop Loss: 86,500
TP1: 88,150
TP2: 88,900
TP3: 89,100+
Bearish confirmation:
Entry: 85,350–85,300 after a confirmed 15M breakdown
Stop Loss: 86,150
TP1: 84,900
TP2: 84,750
TP3: 84,500
The key zone right now is 86,500–87,300.
A clean reclaim above resistance would show that buyers are absorbing the previous rejection. On the other hand, losing 85,350 would put the recent recovery under serious pressure.
No blind entry
#CFTCUpdatesGuidanceOnTokenizedAssets #BinanceWillListHyperliquid(HYPE) #FedProposesRulesForBankIssuedStablecoins #OndoFinanceSoughtSaleAfterFoundersDeath #FedOctoberRateHikeOddsRiseTo69.7%
Bitcoin is trading around 86,503.8 after one of the sharpest intraday moves visible on this 15M chart.
24H High: 88,901
24H Low: 85,353.4
Current Price: 86,503.8
Mark Price: 86,654.7
24H Change: -2.70%
24H Volume: 23.065 BTC / ~2.00M USDT
The important part is the structure.
BTC pushed from the 84,748 area all the way toward 88,901, but the move was rejected aggressively. Price then recovered from the 85,353 zone and is now consolidating around 86,500.
Key levels are clearly visible:
Support 1: 85,350–85,500
Support 2: 84,750–84,900
Resistance 1: 87,250–87,300
Resistance 2: 88,150–88,250
Major resistance: 88,900–89,100
SIGNAL SETUP
Bullish confirmation:
Entry: 87,300+ after a clean 15M breakout and hold
Stop Loss: 86,500
TP1: 88,150
TP2: 88,900
TP3: 89,100+
Bearish confirmation:
Entry: 85,350–85,300 after a confirmed 15M breakdown
Stop Loss: 86,150
TP1: 84,900
TP2: 84,750
TP3: 84,500
The key zone right now is 86,500–87,300.
A clean reclaim above resistance would show that buyers are absorbing the previous rejection. On the other hand, losing 85,350 would put the recent recovery under serious pressure.
No blind entry
#CFTCUpdatesGuidanceOnTokenizedAssets #BinanceWillListHyperliquid(HYPE) #FedProposesRulesForBankIssuedStablecoins #OndoFinanceSoughtSaleAfterFoundersDeath #FedOctoberRateHikeOddsRiseTo69.7%
35
·
--
O‘suvchi
Tarjimani ko‘rish
$AXTIB — MOMENTUM IS BUILDING FAST
AXTIB is showing a strong intraday expansion on the 15-minute chart, with buyers pushing price from the $75.29 low toward the $78.39 area.
Current Price: $78.24
24H Change: +11.25%
24H High: $78.60
24H Low: $69.14
24H Volume: 10,492 AXTIB
24H Volume (USDT): $775.62K
The structure is getting interesting.
Price formed a base around $75.3–$75.8, started printing higher lows, then broke through the $76.50 area and accelerated toward $78+.
Now price is sitting just below the 24H high.
TRADE SETUP
Entry Zone: $77.70 – $78.20
Stop Loss: $76.95
TP1: $78.60
TP2: $79.50
TP3: $80.50
TP4: $82.00
KEY LEVELS
$78.60 — 24H high / immediate resistance
$78.39 — recent chart high
$77.86 — near-term support
$77.18 — breakout support
$76.50 — previous structure resistance
$75.29 — major intraday swing low
The key signal here is the change in market structure.
AXTIB moved from consolidation into a series of higher highs and higher lows. The strongest acceleration came after price reclaimed $77.18 and pushed through $77.86.
If buyers can establish price above $78.60, the breakout could open room toward the higher target zones.
If price gets rejected around $78.40–$78.60, watch $77.86 and $77.18 closely for the next reaction.
Momentum is strong, but after an 11%+ daily move, volatility can be aggressive.
Trade the setup.
Manage the risk.
Let price confirm the next move.
$AXTIB
{spot}(AXTIBUSDT)
#CFTCUpdatesGuidanceOnTokenizedAssets #BinanceWillListHyperliquid(HYPE) #FedProposesRulesForBankIssuedStablecoins #OndoFinanceSoughtSaleAfterFoundersDeath #FedOctoberRateHikeOddsRiseTo69.7%
$AXTIB — MOMENTUM IS BUILDING FAST
AXTIB is showing a strong intraday expansion on the 15-minute chart, with buyers pushing price from the $75.29 low toward the $78.39 area.
Current Price: $78.24
24H Change: +11.25%
24H High: $78.60
24H Low: $69.14
24H Volume: 10,492 AXTIB
24H Volume (USDT): $775.62K
The structure is getting interesting.
Price formed a base around $75.3–$75.8, started printing higher lows, then broke through the $76.50 area and accelerated toward $78+.
Now price is sitting just below the 24H high.
TRADE SETUP
Entry Zone: $77.70 – $78.20
Stop Loss: $76.95
TP1: $78.60
TP2: $79.50
TP3: $80.50
TP4: $82.00
KEY LEVELS
$78.60 — 24H high / immediate resistance
$78.39 — recent chart high
$77.86 — near-term support
$77.18 — breakout support
$76.50 — previous structure resistance
$75.29 — major intraday swing low
The key signal here is the change in market structure.
AXTIB moved from consolidation into a series of higher highs and higher lows. The strongest acceleration came after price reclaimed $77.18 and pushed through $77.86.
If buyers can establish price above $78.60, the breakout could open room toward the higher target zones.
If price gets rejected around $78.40–$78.60, watch $77.86 and $77.18 closely for the next reaction.
Momentum is strong, but after an 11%+ daily move, volatility can be aggressive.
Trade the setup.
Manage the risk.
Let price confirm the next move.
$AXTIB
#CFTCUpdatesGuidanceOnTokenizedAssets #BinanceWillListHyperliquid(HYPE) #FedProposesRulesForBankIssuedStablecoins #OndoFinanceSoughtSaleAfterFoundersDeath #FedOctoberRateHikeOddsRiseTo69.7%
AXTIB is showing a strong intraday expansion on the 15-minute chart, with buyers pushing price from the $75.29 low toward the $78.39 area.
Current Price: $78.24
24H Change: +11.25%
24H High: $78.60
24H Low: $69.14
24H Volume: 10,492 AXTIB
24H Volume (USDT): $775.62K
The structure is getting interesting.
Price formed a base around $75.3–$75.8, started printing higher lows, then broke through the $76.50 area and accelerated toward $78+.
Now price is sitting just below the 24H high.
TRADE SETUP
Entry Zone: $77.70 – $78.20
Stop Loss: $76.95
TP1: $78.60
TP2: $79.50
TP3: $80.50
TP4: $82.00
KEY LEVELS
$78.60 — 24H high / immediate resistance
$78.39 — recent chart high
$77.86 — near-term support
$77.18 — breakout support
$76.50 — previous structure resistance
$75.29 — major intraday swing low
The key signal here is the change in market structure.
AXTIB moved from consolidation into a series of higher highs and higher lows. The strongest acceleration came after price reclaimed $77.18 and pushed through $77.86.
If buyers can establish price above $78.60, the breakout could open room toward the higher target zones.
If price gets rejected around $78.40–$78.60, watch $77.86 and $77.18 closely for the next reaction.
Momentum is strong, but after an 11%+ daily move, volatility can be aggressive.
Trade the setup.
Manage the risk.
Let price confirm the next move.
$AXTIB
#CFTCUpdatesGuidanceOnTokenizedAssets #BinanceWillListHyperliquid(HYPE) #FedProposesRulesForBankIssuedStablecoins #OndoFinanceSoughtSaleAfterFoundersDeath #FedOctoberRateHikeOddsRiseTo69.7%
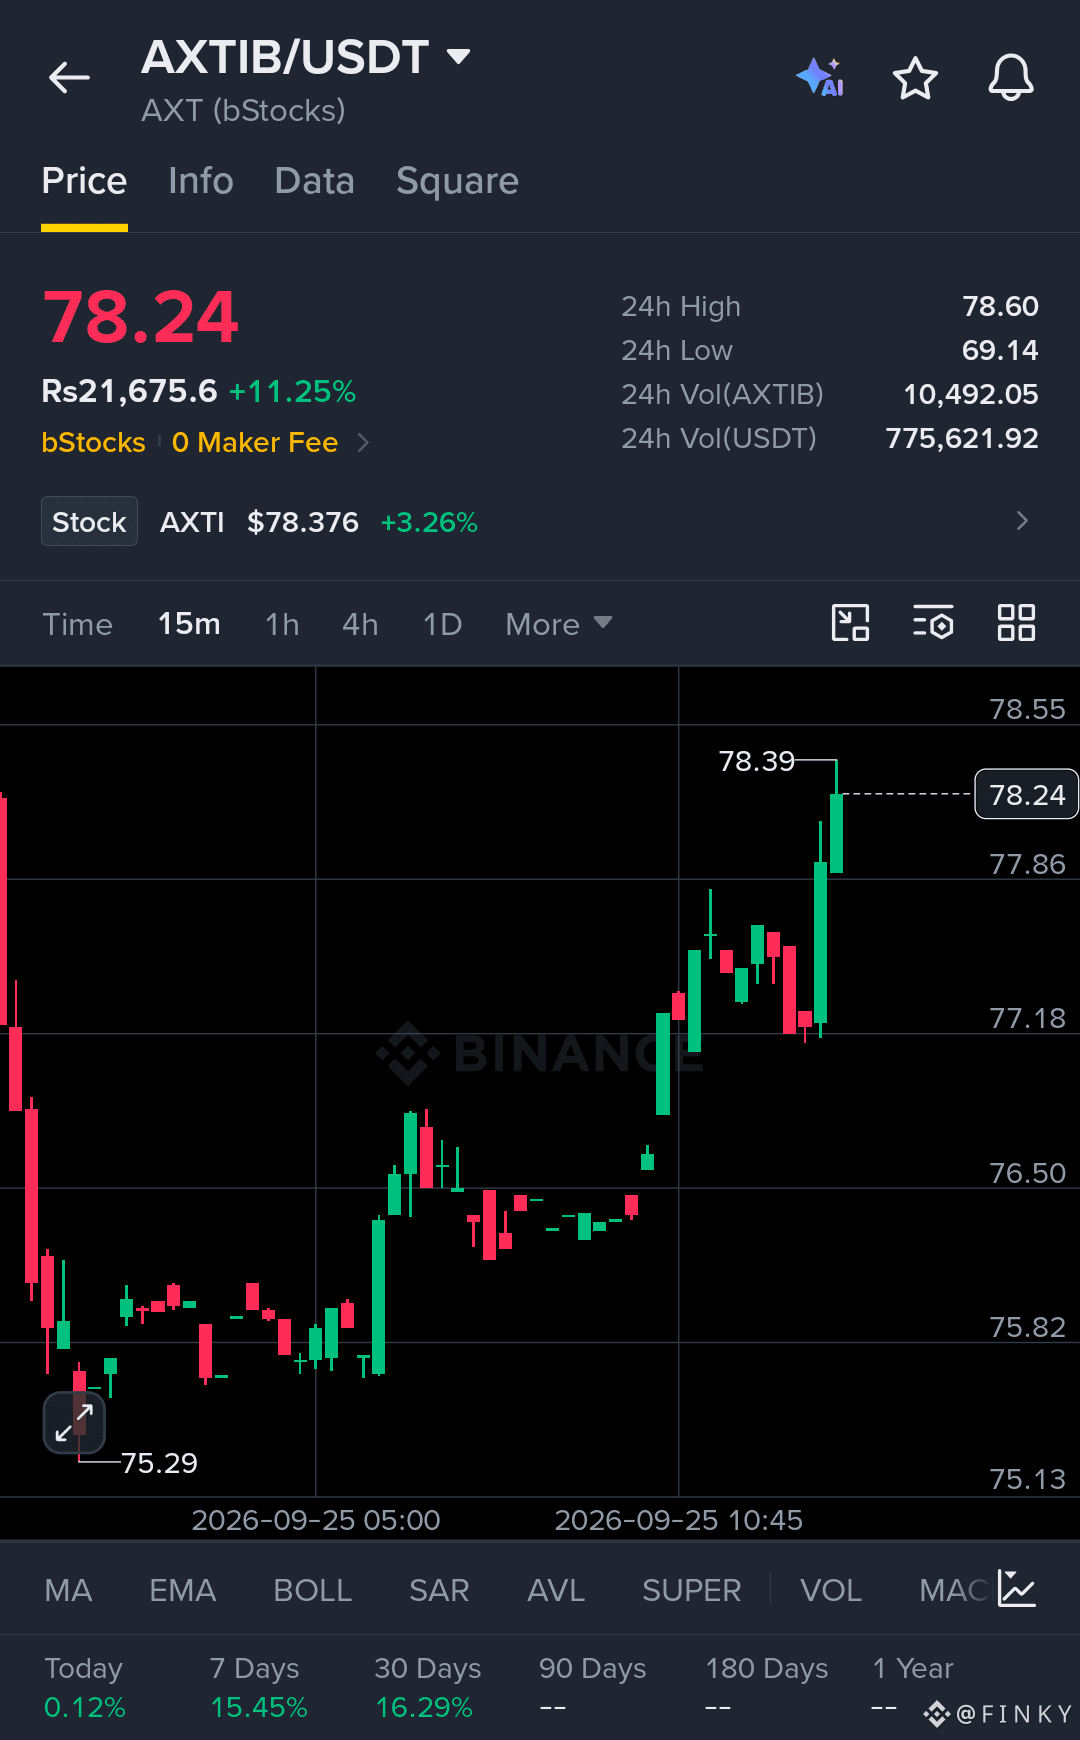
48
·
--
O‘suvchi
Tarjimani ko‘rish
$CFG — CENTRIFUGE IS WAKING UP
CFG is showing a sharp momentum expansion on the 15-minute chart.
Current Price: $0.1561
24H Change: +11.90%
24H High: $0.1597
24H Low: $0.1348
24H Volume: 30.85M CFG
Volume in USDT: $4.64M
The chart is building a clear sequence of higher lows after defending the $0.1477 area.
Price has now pushed back above $0.1537 and is trading near the recent $0.1575 resistance zone.
The important battle is happening here.
TRADE SETUP
Entry Zone: $0.1535 – $0.1560
Stop Loss: $0.1490
TP1: $0.1595
TP2: $0.1640
TP3: $0.1690
TP4: $0.1750
KEY LEVELS
$0.1575 — immediate resistance
$0.1597 — 24H high
$0.1537 — near-term support
$0.1515 — structure support
$0.1490 — risk invalidation
$0.1477 — major chart swing low
The interesting part is the momentum.
CFG dropped toward $0.1477, stabilized, then started printing stronger candles with progressively higher lows. The latest push reached $0.1575 before price consolidated around $0.156.
A clean break and hold above $0.1597 would put the next resistance zones into focus.
But if $0.1537 fails, momentum could cool and price may revisit the lower support areas.
This is a momentum setup, not a guaranteed move.
Manage risk carefully and watch how price reacts around $0.1575–$0.1597.
CFG is definitely one to keep on the radar.
{spot}(CFGUSDT)
#CFTCUpdatesGuidanceOnTokenizedAssets #BinanceWillListHyperliquid(HYPE) #FedProposesRulesForBankIssuedStablecoins #OndoFinanceSoughtSaleAfterFoundersDeath #FedOctoberRateHikeOddsRiseTo69.7%
$CFG — CENTRIFUGE IS WAKING UP
CFG is showing a sharp momentum expansion on the 15-minute chart.
Current Price: $0.1561
24H Change: +11.90%
24H High: $0.1597
24H Low: $0.1348
24H Volume: 30.85M CFG
Volume in USDT: $4.64M
The chart is building a clear sequence of higher lows after defending the $0.1477 area.
Price has now pushed back above $0.1537 and is trading near the recent $0.1575 resistance zone.
The important battle is happening here.
TRADE SETUP
Entry Zone: $0.1535 – $0.1560
Stop Loss: $0.1490
TP1: $0.1595
TP2: $0.1640
TP3: $0.1690
TP4: $0.1750
KEY LEVELS
$0.1575 — immediate resistance
$0.1597 — 24H high
$0.1537 — near-term support
$0.1515 — structure support
$0.1490 — risk invalidation
$0.1477 — major chart swing low
The interesting part is the momentum.
CFG dropped toward $0.1477, stabilized, then started printing stronger candles with progressively higher lows. The latest push reached $0.1575 before price consolidated around $0.156.
A clean break and hold above $0.1597 would put the next resistance zones into focus.
But if $0.1537 fails, momentum could cool and price may revisit the lower support areas.
This is a momentum setup, not a guaranteed move.
Manage risk carefully and watch how price reacts around $0.1575–$0.1597.
CFG is definitely one to keep on the radar.
#CFTCUpdatesGuidanceOnTokenizedAssets #BinanceWillListHyperliquid(HYPE) #FedProposesRulesForBankIssuedStablecoins #OndoFinanceSoughtSaleAfterFoundersDeath #FedOctoberRateHikeOddsRiseTo69.7%
CFG is showing a sharp momentum expansion on the 15-minute chart.
Current Price: $0.1561
24H Change: +11.90%
24H High: $0.1597
24H Low: $0.1348
24H Volume: 30.85M CFG
Volume in USDT: $4.64M
The chart is building a clear sequence of higher lows after defending the $0.1477 area.
Price has now pushed back above $0.1537 and is trading near the recent $0.1575 resistance zone.
The important battle is happening here.
TRADE SETUP
Entry Zone: $0.1535 – $0.1560
Stop Loss: $0.1490
TP1: $0.1595
TP2: $0.1640
TP3: $0.1690
TP4: $0.1750
KEY LEVELS
$0.1575 — immediate resistance
$0.1597 — 24H high
$0.1537 — near-term support
$0.1515 — structure support
$0.1490 — risk invalidation
$0.1477 — major chart swing low
The interesting part is the momentum.
CFG dropped toward $0.1477, stabilized, then started printing stronger candles with progressively higher lows. The latest push reached $0.1575 before price consolidated around $0.156.
A clean break and hold above $0.1597 would put the next resistance zones into focus.
But if $0.1537 fails, momentum could cool and price may revisit the lower support areas.
This is a momentum setup, not a guaranteed move.
Manage risk carefully and watch how price reacts around $0.1575–$0.1597.
CFG is definitely one to keep on the radar.
#CFTCUpdatesGuidanceOnTokenizedAssets #BinanceWillListHyperliquid(HYPE) #FedProposesRulesForBankIssuedStablecoins #OndoFinanceSoughtSaleAfterFoundersDeath #FedOctoberRateHikeOddsRiseTo69.7%
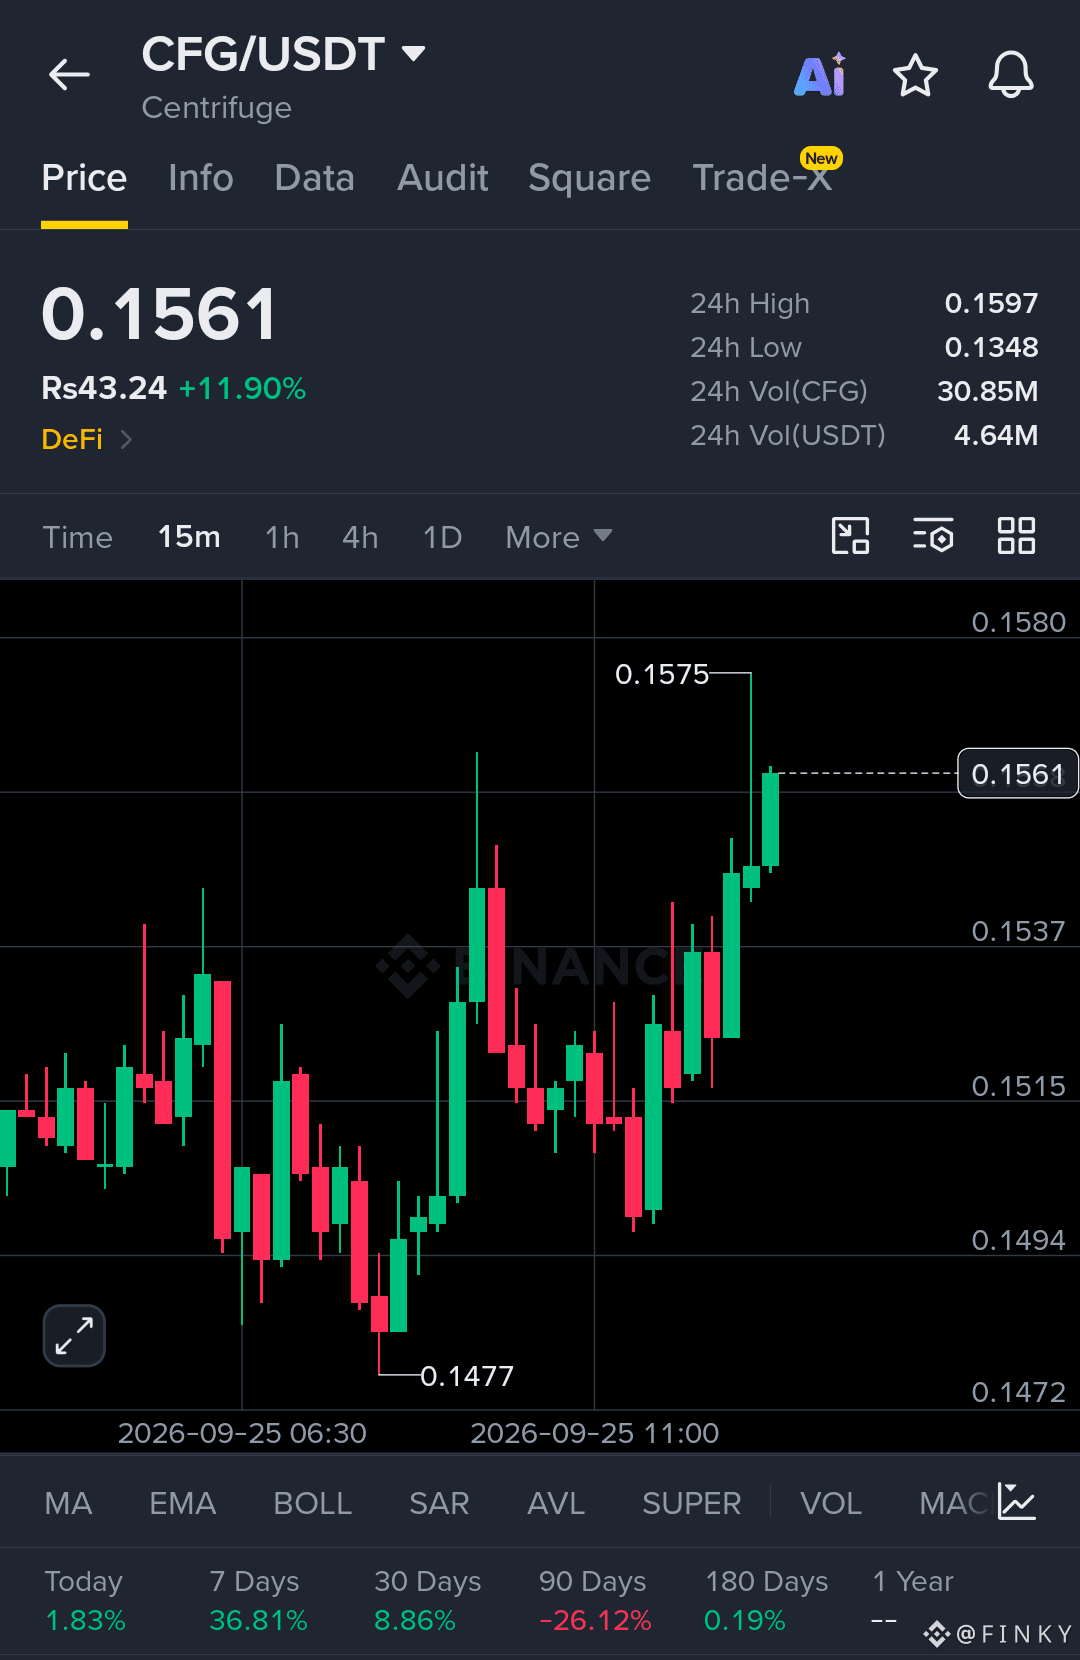
1
55
·
--
O‘suvchi
Tarjimani ko‘rish
$BTC — The Bitcoin Cycle Is Getting VERY Interesting
History is flashing a pattern traders cannot ignore.
Across previous major Bitcoin bear markets, extended periods of red 6-month candles have appeared close to major cycle exhaustion zones. The 2018–19 and 2022–23 bear markets both eventually transitioned from heavy downside pressure into powerful recovery phases.
And now, Bitcoin is showing another potentially important setup.
After falling from the 2025 cycle high near $126K, BTC experienced a major drawdown before recovering sharply from the 2026 lows. CoinGecko's latest cycle analysis puts the current drawdown at roughly 51% from the prior high, compared with much deeper declines during the 2018–19 and 2022–23 bear markets.
Then came the shift:
• August produced a powerful recovery
• BTC reclaimed the $80K area
• Price pushed through the former $82K resistance zone
• BTC reached the $86K–$87K region in September
• Institutional/ETF demand has improved
• Momentum has accelerated alongside broader risk appetite
But here's the important part:
A historical pattern is NOT a guarantee.
The market still needs confirmation.
Key levels traders are watching:
Support:
$85K
$82K
$80K
$76K–$78K
Resistance:
$86.5K–$87.3K
$88K–$89K
A sustained breakout above the major resistance zone would strengthen the recovery structure. A loss of the key support areas could instead signal that the market needs more time to consolidate. Current technical readings also show elevated momentum, meaning volatility can remain high.
The bigger story isn't simply one red candle.
It's the combination of:
Deep correction
Historical cycle behavior
Recovery from the lows
Improving liquidity
Renewed ETF demand
Resistance being reclaimed
And expanding market momentum
Bitcoin has repeatedly shown that the most important transitions can begin when sentiment is still uncertain.
The setup is getting interesting.
#BTC
$BTC — The Bitcoin Cycle Is Getting VERY Interesting
History is flashing a pattern traders cannot ignore.
Across previous major Bitcoin bear markets, extended periods of red 6-month candles have appeared close to major cycle exhaustion zones. The 2018–19 and 2022–23 bear markets both eventually transitioned from heavy downside pressure into powerful recovery phases.
And now, Bitcoin is showing another potentially important setup.
After falling from the 2025 cycle high near $126K, BTC experienced a major drawdown before recovering sharply from the 2026 lows. CoinGecko's latest cycle analysis puts the current drawdown at roughly 51% from the prior high, compared with much deeper declines during the 2018–19 and 2022–23 bear markets.
Then came the shift:
• August produced a powerful recovery
• BTC reclaimed the $80K area
• Price pushed through the former $82K resistance zone
• BTC reached the $86K–$87K region in September
• Institutional/ETF demand has improved
• Momentum has accelerated alongside broader risk appetite
But here's the important part:
A historical pattern is NOT a guarantee.
The market still needs confirmation.
Key levels traders are watching:
Support:
$85K
$82K
$80K
$76K–$78K
Resistance:
$86.5K–$87.3K
$88K–$89K
A sustained breakout above the major resistance zone would strengthen the recovery structure. A loss of the key support areas could instead signal that the market needs more time to consolidate. Current technical readings also show elevated momentum, meaning volatility can remain high.
The bigger story isn't simply one red candle.
It's the combination of:
Deep correction
Historical cycle behavior
Recovery from the lows
Improving liquidity
Renewed ETF demand
Resistance being reclaimed
And expanding market momentum
Bitcoin has repeatedly shown that the most important transitions can begin when sentiment is still uncertain.
The setup is getting interesting.
#BTC
History is flashing a pattern traders cannot ignore.
Across previous major Bitcoin bear markets, extended periods of red 6-month candles have appeared close to major cycle exhaustion zones. The 2018–19 and 2022–23 bear markets both eventually transitioned from heavy downside pressure into powerful recovery phases.
And now, Bitcoin is showing another potentially important setup.
After falling from the 2025 cycle high near $126K, BTC experienced a major drawdown before recovering sharply from the 2026 lows. CoinGecko's latest cycle analysis puts the current drawdown at roughly 51% from the prior high, compared with much deeper declines during the 2018–19 and 2022–23 bear markets.
Then came the shift:
• August produced a powerful recovery
• BTC reclaimed the $80K area
• Price pushed through the former $82K resistance zone
• BTC reached the $86K–$87K region in September
• Institutional/ETF demand has improved
• Momentum has accelerated alongside broader risk appetite
But here's the important part:
A historical pattern is NOT a guarantee.
The market still needs confirmation.
Key levels traders are watching:
Support:
$85K
$82K
$80K
$76K–$78K
Resistance:
$86.5K–$87.3K
$88K–$89K
A sustained breakout above the major resistance zone would strengthen the recovery structure. A loss of the key support areas could instead signal that the market needs more time to consolidate. Current technical readings also show elevated momentum, meaning volatility can remain high.
The bigger story isn't simply one red candle.
It's the combination of:
Deep correction
Historical cycle behavior
Recovery from the lows
Improving liquidity
Renewed ETF demand
Resistance being reclaimed
And expanding market momentum
Bitcoin has repeatedly shown that the most important transitions can begin when sentiment is still uncertain.
The setup is getting interesting.
#BTC
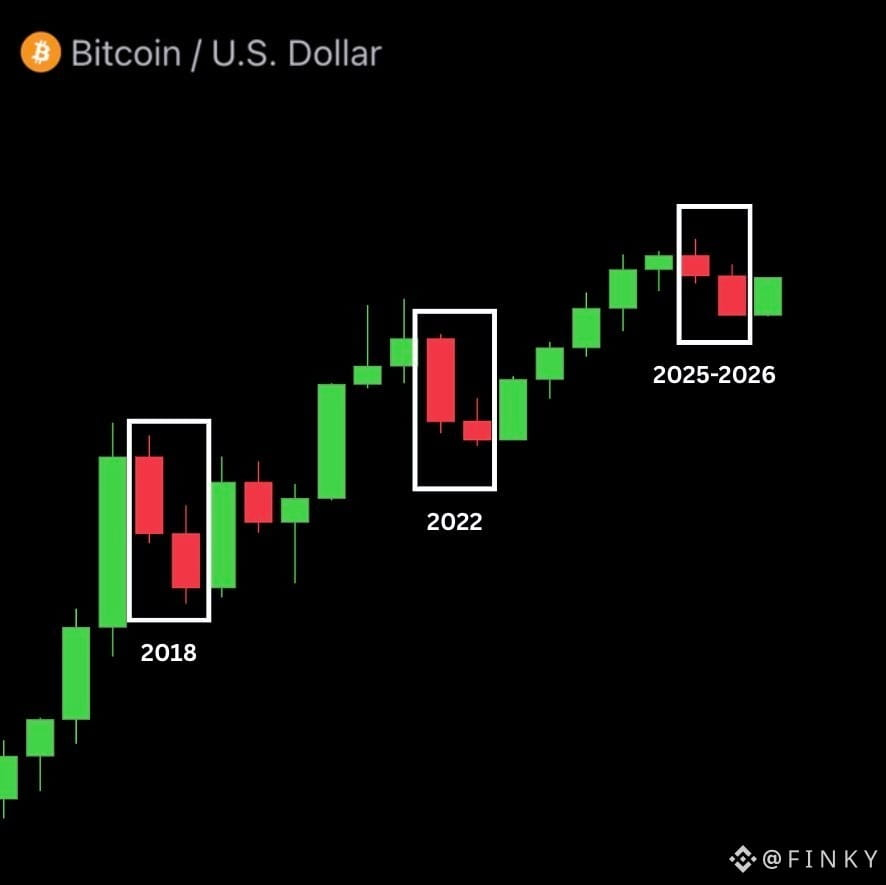
74
·
--
O‘suvchi
Tarjimani ko‘rish
$QNT/USDT — Momentum Is Heating Up
QNT is showing strong short-term momentum on the 15M chart, climbing from the 88.25 area toward 98.50 before pulling back to 95.83.
The key zone now is 94.50–95.00. Holding this area keeps the recent structure intact, while a clean reclaim of 96.76 can put the 98.50 high back in focus.
Signal Setup
Entry: 94.80 – 96.00
Stop Loss: 93.70
TP1: 97.20
TP2: 98.50
TP3: 101.00
24H High: 98.50
24H Low: 70.39
24H Volume: $6.85M
Current Price: 95.83
24H Change: +32.75%
Market Note:
The move has been aggressive, with QNT already up more than 32% over 24 hours. That makes volatility high, so chasing extended candles carries additional risk. The 94.50 area is an important short-term level to watch, while 98.50 remains the immediate breakout zone.
Risk managed. Let the setup confirm before increasing exposure.
Trade now $QNT
{spot}(QNTUSDT)
$QNT /USDT — Momentum Is Heating Up
QNT is showing strong short-term momentum on the 15M chart, climbing from the 88.25 area toward 98.50 before pulling back to 95.83.
The key zone now is 94.50–95.00. Holding this area keeps the recent structure intact, while a clean reclaim of 96.76 can put the 98.50 high back in focus.
Signal Setup
Entry: 94.80 – 96.00
Stop Loss: 93.70
TP1: 97.20
TP2: 98.50
TP3: 101.00
24H High: 98.50
24H Low: 70.39
24H Volume: $6.85M
Current Price: 95.83
24H Change: +32.75%
Market Note:
The move has been aggressive, with QNT already up more than 32% over 24 hours. That makes volatility high, so chasing extended candles carries additional risk. The 94.50 area is an important short-term level to watch, while 98.50 remains the immediate breakout zone.
Risk managed. Let the setup confirm before increasing exposure.
Trade now $QNT
QNT is showing strong short-term momentum on the 15M chart, climbing from the 88.25 area toward 98.50 before pulling back to 95.83.
The key zone now is 94.50–95.00. Holding this area keeps the recent structure intact, while a clean reclaim of 96.76 can put the 98.50 high back in focus.
Signal Setup
Entry: 94.80 – 96.00
Stop Loss: 93.70
TP1: 97.20
TP2: 98.50
TP3: 101.00
24H High: 98.50
24H Low: 70.39
24H Volume: $6.85M
Current Price: 95.83
24H Change: +32.75%
Market Note:
The move has been aggressive, with QNT already up more than 32% over 24 hours. That makes volatility high, so chasing extended candles carries additional risk. The 94.50 area is an important short-term level to watch, while 98.50 remains the immediate breakout zone.
Risk managed. Let the setup confirm before increasing exposure.
Trade now $QNT
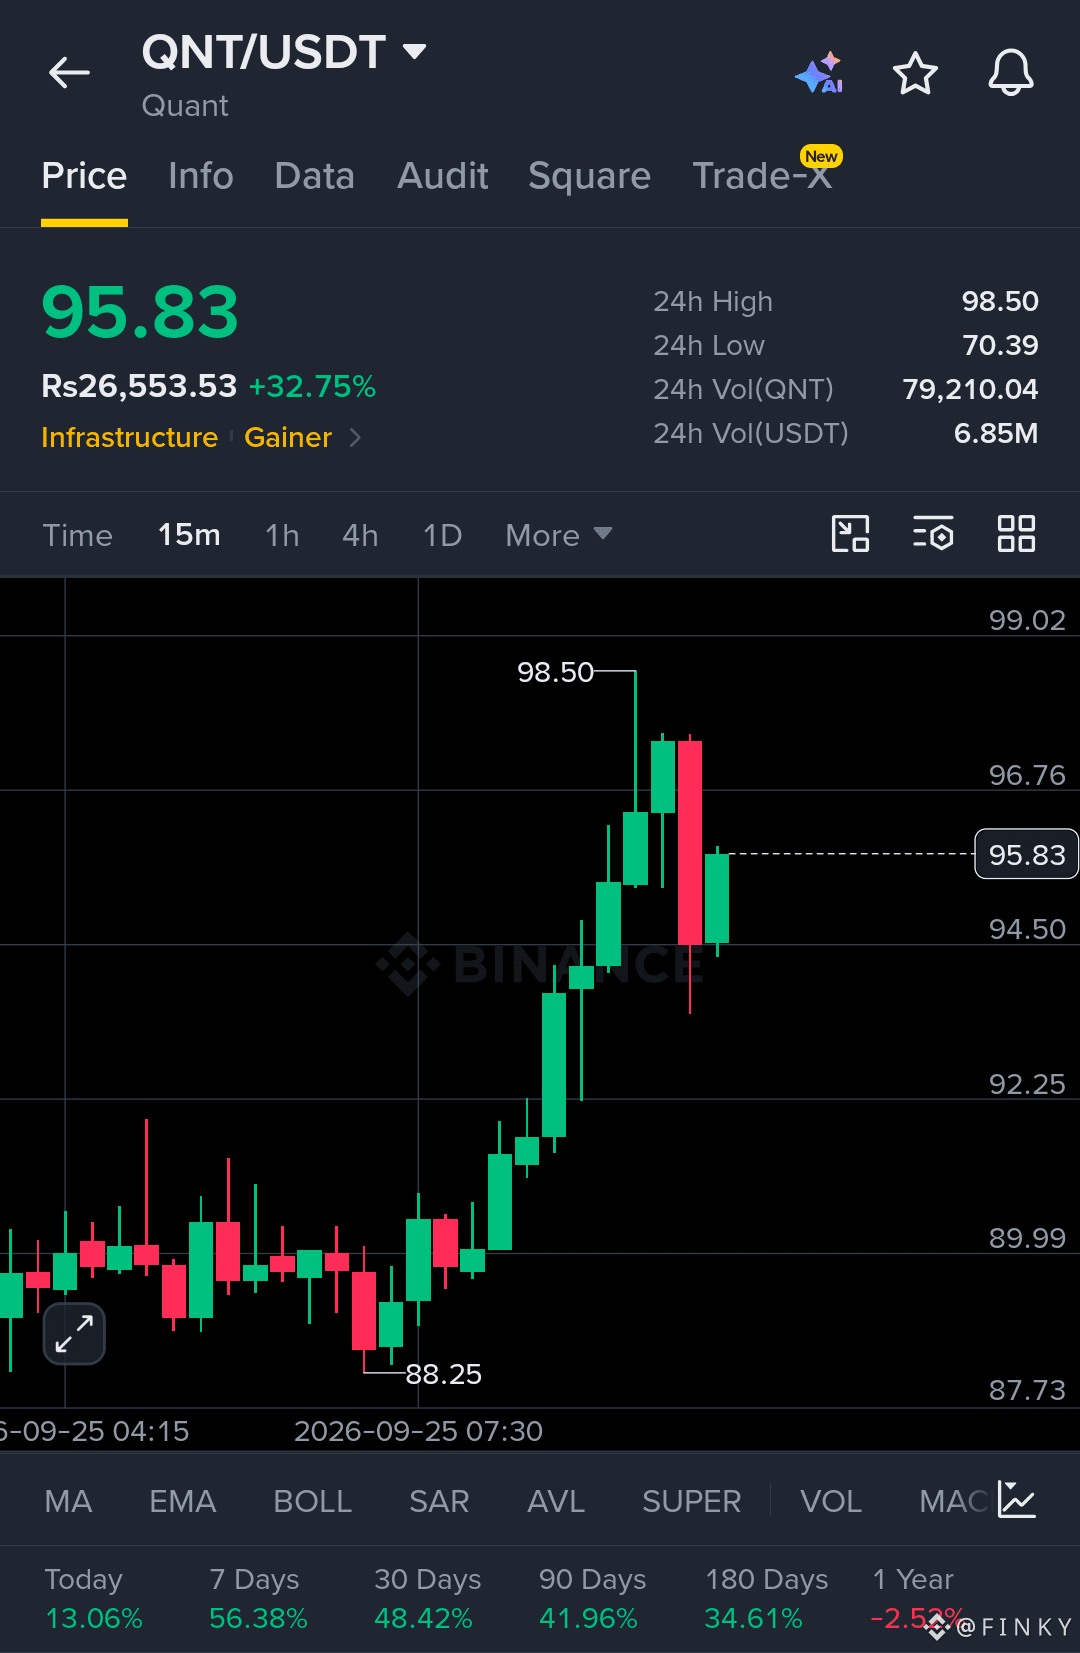
94
·
--
O‘suvchi
Tarjimani ko‘rish
$QI — Momentum has exploded, but price is now testing a critical resistance zone.
QI/USDT is trading around 0.003551 on the 15M chart, showing a massive +139.61% 24H move with approximately 7.92M USDT in reported 24H volume.
The chart shows a powerful expansion from the 0.001544 area, followed by consolidation and another sharp push toward the 0.003598 high. Price is now sitting just below the session high, making this a high-volatility setup where confirmation matters.
SIGNAL
Pair: QI/USDT
Timeframe: 15M
Entry Zone:
0.00325 – 0.00345
Stop Loss:
0.00305
TP1:
0.00360
TP2:
0.00385
TP3:
0.00410
Extended Target:
0.00440
KEY LEVELS
0.003701 — next major chart resistance
0.003598 — current 24H high
0.003551 — current price
0.003249 — immediate support
0.002797 — key structure support
0.002345 — deeper support
0.001544 — visible swing low
MARKET STRUCTURE
QI has delivered an exceptional
{spot}(QIUSDT)
#CFTCUpdatesGuidanceOnTokenizedAssets #BinanceWillListHyperliquid(HYPE) #FedProposesRulesForBankIssuedStablecoins #OndoFinanceSoughtSaleAfterFoundersDeath #FedOctoberRateHikeOddsRiseTo69.7%
$QI — Momentum has exploded, but price is now testing a critical resistance zone.
QI/USDT is trading around 0.003551 on the 15M chart, showing a massive +139.61% 24H move with approximately 7.92M USDT in reported 24H volume.
The chart shows a powerful expansion from the 0.001544 area, followed by consolidation and another sharp push toward the 0.003598 high. Price is now sitting just below the session high, making this a high-volatility setup where confirmation matters.
SIGNAL
Pair: QI/USDT
Timeframe: 15M
Entry Zone:
0.00325 – 0.00345
Stop Loss:
0.00305
TP1:
0.00360
TP2:
0.00385
TP3:
0.00410
Extended Target:
0.00440
KEY LEVELS
0.003701 — next major chart resistance
0.003598 — current 24H high
0.003551 — current price
0.003249 — immediate support
0.002797 — key structure support
0.002345 — deeper support
0.001544 — visible swing low
MARKET STRUCTURE
QI has delivered an exceptional
#CFTCUpdatesGuidanceOnTokenizedAssets #BinanceWillListHyperliquid(HYPE) #FedProposesRulesForBankIssuedStablecoins #OndoFinanceSoughtSaleAfterFoundersDeath #FedOctoberRateHikeOddsRiseTo69.7%
QI/USDT is trading around 0.003551 on the 15M chart, showing a massive +139.61% 24H move with approximately 7.92M USDT in reported 24H volume.
The chart shows a powerful expansion from the 0.001544 area, followed by consolidation and another sharp push toward the 0.003598 high. Price is now sitting just below the session high, making this a high-volatility setup where confirmation matters.
SIGNAL
Pair: QI/USDT
Timeframe: 15M
Entry Zone:
0.00325 – 0.00345
Stop Loss:
0.00305
TP1:
0.00360
TP2:
0.00385
TP3:
0.00410
Extended Target:
0.00440
KEY LEVELS
0.003701 — next major chart resistance
0.003598 — current 24H high
0.003551 — current price
0.003249 — immediate support
0.002797 — key structure support
0.002345 — deeper support
0.001544 — visible swing low
MARKET STRUCTURE
QI has delivered an exceptional
#CFTCUpdatesGuidanceOnTokenizedAssets #BinanceWillListHyperliquid(HYPE) #FedProposesRulesForBankIssuedStablecoins #OndoFinanceSoughtSaleAfterFoundersDeath #FedOctoberRateHikeOddsRiseTo69.7%
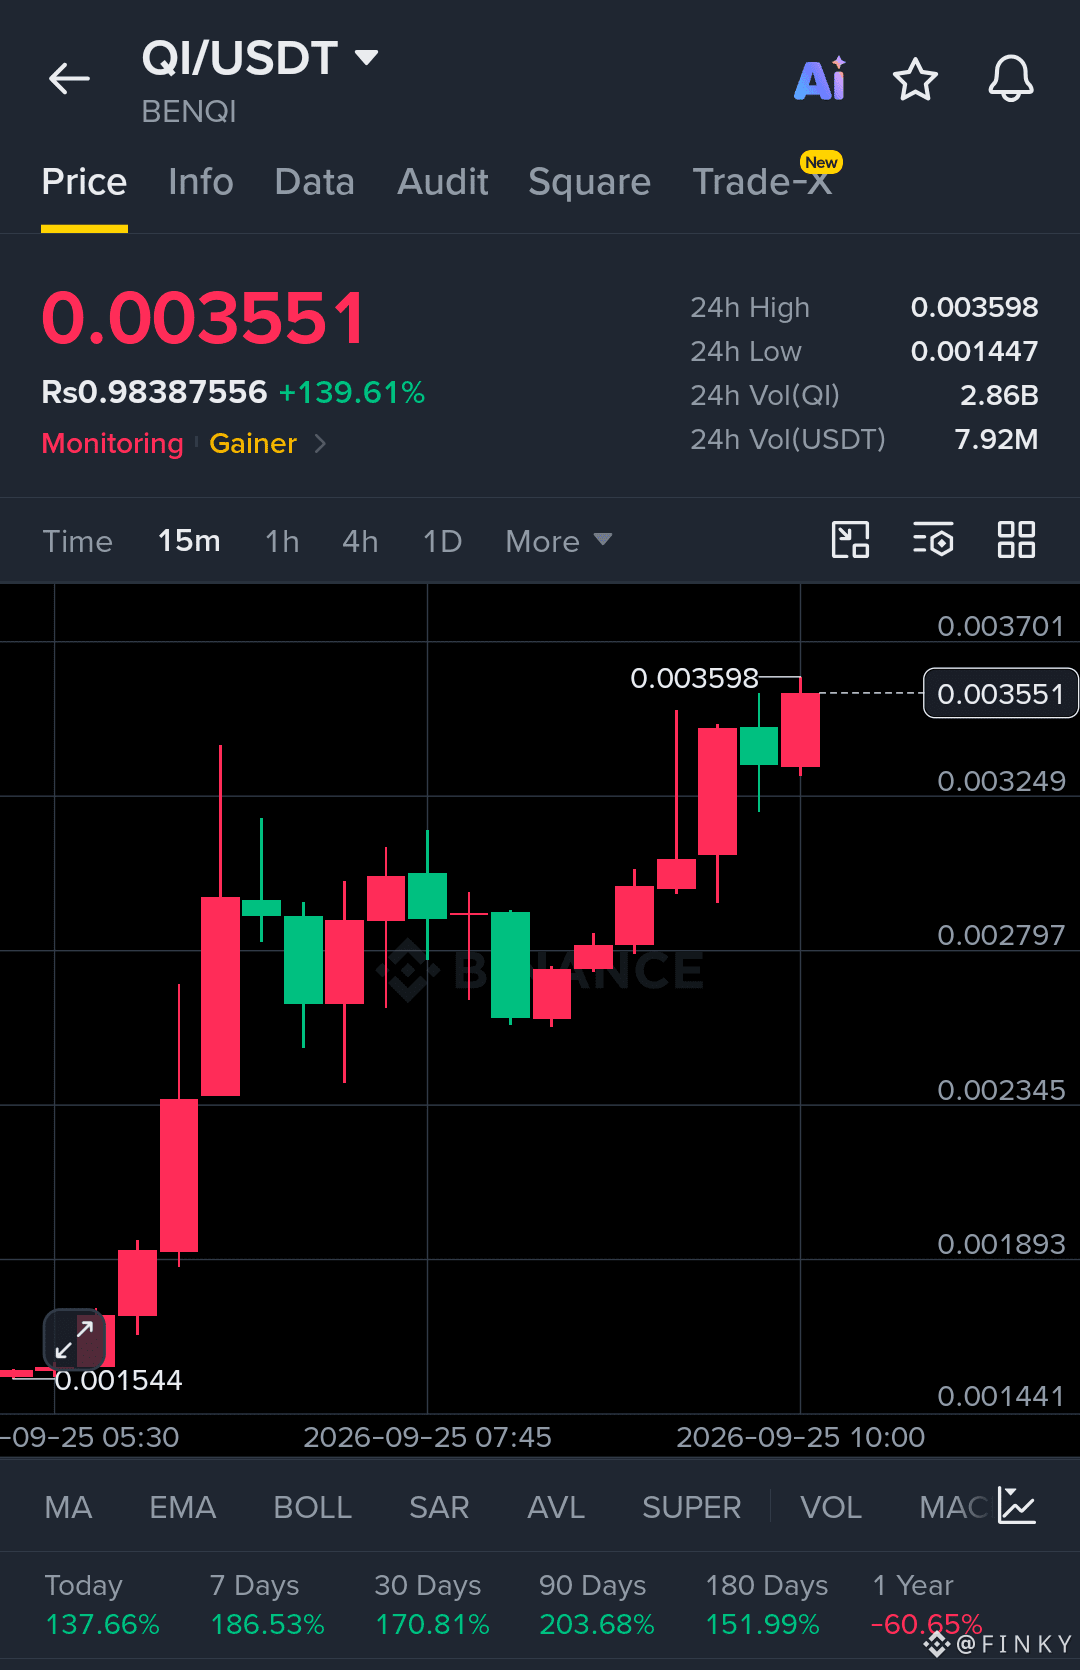
103
·
--
O‘suvchi
Tarjimani ko‘rish
$ONDO — Momentum is holding near the highs, and the 15M structure is getting interesting.
ONDO/USDT is trading around 0.5361, up 25.64% over 24H, with approximately 136M USDT in reported 24H volume.
The chart shows a strong recovery from 0.5164 followed by a series of higher lows and a push into the 0.5438 high. Price is currently consolidating around 0.5330–0.5360 after that move, making this zone important for the next setup.
SIGNAL
Pair: ONDO/USDT
Timeframe: 15M
Entry Zone:
0.5320 – 0.5360
Stop Loss:
0.5260
TP1:
0.5438
TP2:
0.5500
TP3:
0.5600
Extended Target:
0.5750
KEY LEVELS
0.5438 — 24H / recent swing high
0.5391 — immediate resistance
0.5331 — current structure support
0.5271 — key short-term support
0.5211 — deeper support
0.5164 — recent swing low
MARKET STRUCTURE
ONDO has recovered aggressively from 0.5164 and reclaimed the 0.5271 and 0.5331 areas. The latest candles are holding above the previous consolidation zone, while price remains close to the 0.5438 resistance.
A clean reclaim of 0.5391 followed by a break above 0.5438 would provide stronger confirmation for the higher target zones.
On the other hand, losing 0.5271 would weaken the current 15M structure and increase the chance of a deeper pull
{spot}(ONDOUSDT)
#CFTCUpdatesGuidanceOnTokenizedAssets #BinanceWillListHyperliquid(HYPE) #FedProposesRulesForBankIssuedStablecoins #OndoFinanceSoughtSaleAfterFoundersDeath #FedOctoberRateHikeOddsRiseTo69.7%
$ONDO — Momentum is holding near the highs, and the 15M structure is getting interesting.
ONDO/USDT is trading around 0.5361, up 25.64% over 24H, with approximately 136M USDT in reported 24H volume.
The chart shows a strong recovery from 0.5164 followed by a series of higher lows and a push into the 0.5438 high. Price is currently consolidating around 0.5330–0.5360 after that move, making this zone important for the next setup.
SIGNAL
Pair: ONDO/USDT
Timeframe: 15M
Entry Zone:
0.5320 – 0.5360
Stop Loss:
0.5260
TP1:
0.5438
TP2:
0.5500
TP3:
0.5600
Extended Target:
0.5750
KEY LEVELS
0.5438 — 24H / recent swing high
0.5391 — immediate resistance
0.5331 — current structure support
0.5271 — key short-term support
0.5211 — deeper support
0.5164 — recent swing low
MARKET STRUCTURE
ONDO has recovered aggressively from 0.5164 and reclaimed the 0.5271 and 0.5331 areas. The latest candles are holding above the previous consolidation zone, while price remains close to the 0.5438 resistance.
A clean reclaim of 0.5391 followed by a break above 0.5438 would provide stronger confirmation for the higher target zones.
On the other hand, losing 0.5271 would weaken the current 15M structure and increase the chance of a deeper pull
#CFTCUpdatesGuidanceOnTokenizedAssets #BinanceWillListHyperliquid(HYPE) #FedProposesRulesForBankIssuedStablecoins #OndoFinanceSoughtSaleAfterFoundersDeath #FedOctoberRateHikeOddsRiseTo69.7%
ONDO/USDT is trading around 0.5361, up 25.64% over 24H, with approximately 136M USDT in reported 24H volume.
The chart shows a strong recovery from 0.5164 followed by a series of higher lows and a push into the 0.5438 high. Price is currently consolidating around 0.5330–0.5360 after that move, making this zone important for the next setup.
SIGNAL
Pair: ONDO/USDT
Timeframe: 15M
Entry Zone:
0.5320 – 0.5360
Stop Loss:
0.5260
TP1:
0.5438
TP2:
0.5500
TP3:
0.5600
Extended Target:
0.5750
KEY LEVELS
0.5438 — 24H / recent swing high
0.5391 — immediate resistance
0.5331 — current structure support
0.5271 — key short-term support
0.5211 — deeper support
0.5164 — recent swing low
MARKET STRUCTURE
ONDO has recovered aggressively from 0.5164 and reclaimed the 0.5271 and 0.5331 areas. The latest candles are holding above the previous consolidation zone, while price remains close to the 0.5438 resistance.
A clean reclaim of 0.5391 followed by a break above 0.5438 would provide stronger confirmation for the higher target zones.
On the other hand, losing 0.5271 would weaken the current 15M structure and increase the chance of a deeper pull
#CFTCUpdatesGuidanceOnTokenizedAssets #BinanceWillListHyperliquid(HYPE) #FedProposesRulesForBankIssuedStablecoins #OndoFinanceSoughtSaleAfterFoundersDeath #FedOctoberRateHikeOddsRiseTo69.7%
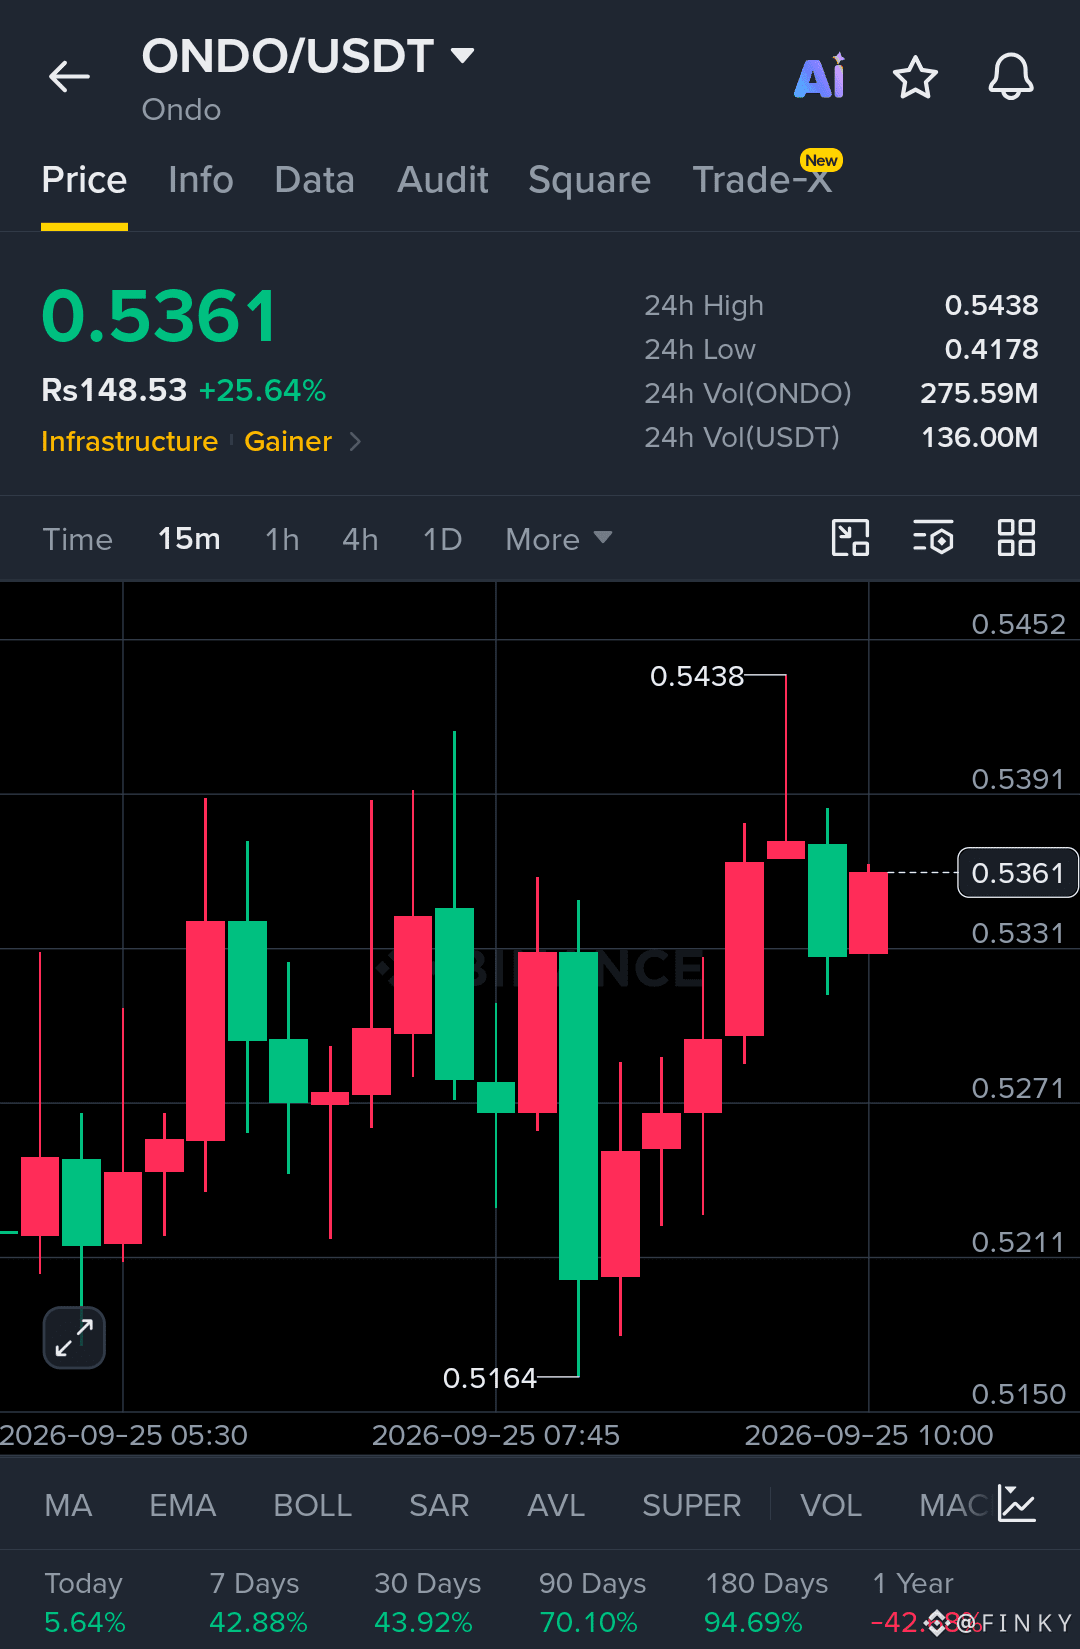
174
·
--
O‘suvchi
Tarjimani ko‘rish
$BROCCOLI714 — A sharp breakout attempt has put this setup on the radar.
BROCCOLI714/USDT is trading around 0.02829 on the 15M chart, with the pair showing +17.05% on the 24H move and approximately 20.63M USDT in reported 24H volume.
The chart shows a strong push from the 0.02739 area toward 0.02956 before a fast rejection. Price has now pulled back into the 0.02800–0.02830 region, making the next few candles important for confirmation.
SIGNAL
Pair: BROCCOLI714/USDT
Timeframe: 15M
Entry Zone:
0.02805 – 0.02835
Stop Loss:
0.02735
TP1:
0.02870
TP2:
0.02920
TP3:
0.02955
Extended Target:
0.03000
KEY LEVELS
0.02956 — recent 15M swing high
0.02919 — immediate resistance
0.02871 — important reclaim level
0.02829 — current price
0.02776 — nearby
{spot}(BROCCOLI714USDT)
#CFTCUpdatesGuidanceOnTokenizedAssets #BinanceWillListHyperliquid(HYPE) #FedProposesRulesForBankIssuedStablecoins #OndoFinanceSoughtSaleAfterFoundersDeath #FedOctoberRateHikeOddsRiseTo69.7%
$BROCCOLI714 — A sharp breakout attempt has put this setup on the radar.
BROCCOLI714/USDT is trading around 0.02829 on the 15M chart, with the pair showing +17.05% on the 24H move and approximately 20.63M USDT in reported 24H volume.
The chart shows a strong push from the 0.02739 area toward 0.02956 before a fast rejection. Price has now pulled back into the 0.02800–0.02830 region, making the next few candles important for confirmation.
SIGNAL
Pair: BROCCOLI714/USDT
Timeframe: 15M
Entry Zone:
0.02805 – 0.02835
Stop Loss:
0.02735
TP1:
0.02870
TP2:
0.02920
TP3:
0.02955
Extended Target:
0.03000
KEY LEVELS
0.02956 — recent 15M swing high
0.02919 — immediate resistance
0.02871 — important reclaim level
0.02829 — current price
0.02776 — nearby
#CFTCUpdatesGuidanceOnTokenizedAssets #BinanceWillListHyperliquid(HYPE) #FedProposesRulesForBankIssuedStablecoins #OndoFinanceSoughtSaleAfterFoundersDeath #FedOctoberRateHikeOddsRiseTo69.7%
BROCCOLI714/USDT is trading around 0.02829 on the 15M chart, with the pair showing +17.05% on the 24H move and approximately 20.63M USDT in reported 24H volume.
The chart shows a strong push from the 0.02739 area toward 0.02956 before a fast rejection. Price has now pulled back into the 0.02800–0.02830 region, making the next few candles important for confirmation.
SIGNAL
Pair: BROCCOLI714/USDT
Timeframe: 15M
Entry Zone:
0.02805 – 0.02835
Stop Loss:
0.02735
TP1:
0.02870
TP2:
0.02920
TP3:
0.02955
Extended Target:
0.03000
KEY LEVELS
0.02956 — recent 15M swing high
0.02919 — immediate resistance
0.02871 — important reclaim level
0.02829 — current price
0.02776 — nearby
#CFTCUpdatesGuidanceOnTokenizedAssets #BinanceWillListHyperliquid(HYPE) #FedProposesRulesForBankIssuedStablecoins #OndoFinanceSoughtSaleAfterFoundersDeath #FedOctoberRateHikeOddsRiseTo69.7%
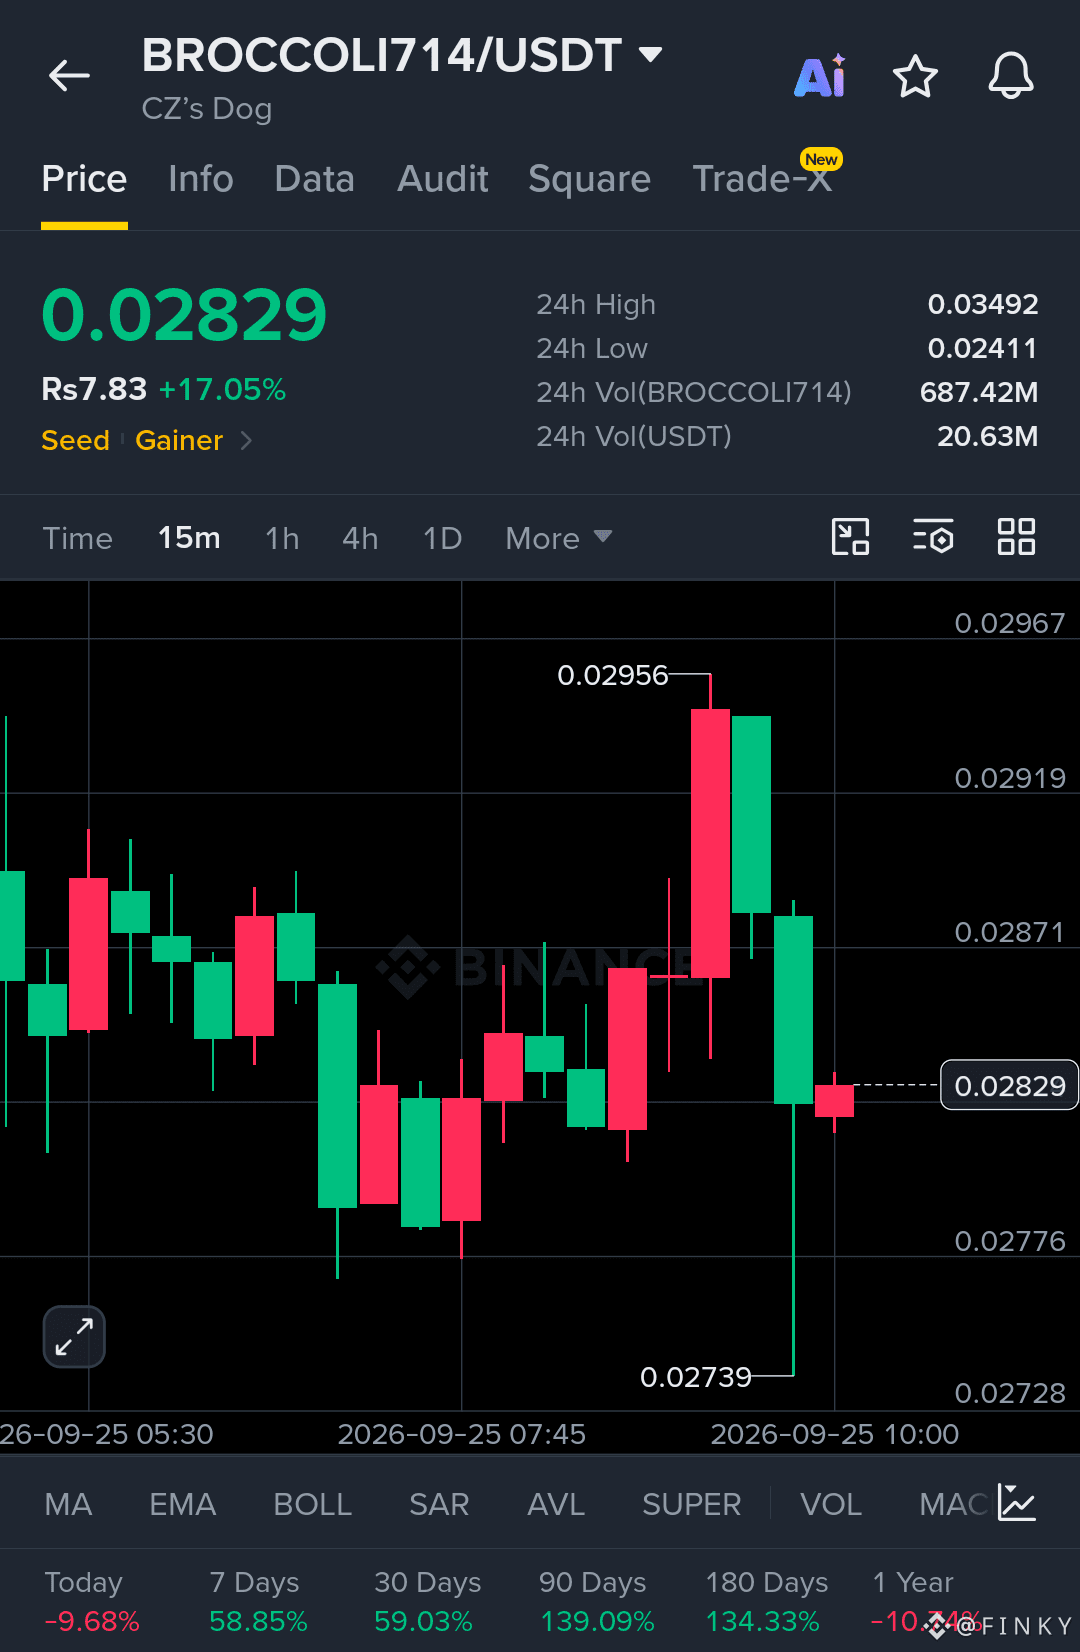
127
·
--
O‘suvchi
Tarjimani ko‘rish
$QNT — Momentum is heating up after a powerful breakout.
QNT/USDT is trading around 97.02 on the 15M chart, up 35.41% over 24H with 6.48M USDT in reported volume.
The structure has changed sharply: QNT pushed from the 88.25 area into a fresh 24H high of 98.50, printing a strong sequence of higher highs and higher lows. The key now is whether the market can hold the breakout zone instead of giving back the entire move.
SIGNAL
Token: QNT
Pair: QNT/USDT
Timeframe: 15M
Entry Zone:
95.00 – 96.20
Stop Loss:
92.00
TP1:
98.50
TP2:
101.00
TP3:
104.00
Key Levels:
98.50 — immediate resistance / 24H high
97.00 — current price area
94.50 — first important support
92.25 — major short-term support
89.99 — previous consolidation area
88.25 — recent chart low
Market Structure:
QNT has moved aggressively from the 88.25 base and broke through the 92.25 and 94.50 areas with strong momentum. Price is now sitting close to the 98.50 high, so this is a critical reaction zone.
A clean hold above 94.50 keeps the recent breakout structure intact. A successful reclaim of 98.50 would put the higher target zones into focus.
Risk Management:
Do not chase a vertical candle after a 35%+ daily move. The preferred setup is a controlled entry around the stated zone or confirmation after a successful retest.
Invalidation:
A sustained move below 92.00 would weaken the current 15M structure and invalidate this setup.
QNT is now at the stage where volume, retest strength and reaction around 98.50 matter more than simply following the percentage gain.
Trade the levels, manage the risk, and let the price confirm the next move.
{spot}(QNTUSDT)
#CFTCUpdatesGuidanceOnTokenizedAssets #BinanceWillListHyperliquid(HYPE) #FedProposesRulesForBankIssuedStablecoins #OndoFinanceSoughtSaleAfterFoundersDeath #FedOctoberRateHikeOddsRiseTo69.7%
$QNT — Momentum is heating up after a powerful breakout.
QNT/USDT is trading around 97.02 on the 15M chart, up 35.41% over 24H with 6.48M USDT in reported volume.
The structure has changed sharply: QNT pushed from the 88.25 area into a fresh 24H high of 98.50, printing a strong sequence of higher highs and higher lows. The key now is whether the market can hold the breakout zone instead of giving back the entire move.
SIGNAL
Token: QNT
Pair: QNT/USDT
Timeframe: 15M
Entry Zone:
95.00 – 96.20
Stop Loss:
92.00
TP1:
98.50
TP2:
101.00
TP3:
104.00
Key Levels:
98.50 — immediate resistance / 24H high
97.00 — current price area
94.50 — first important support
92.25 — major short-term support
89.99 — previous consolidation area
88.25 — recent chart low
Market Structure:
QNT has moved aggressively from the 88.25 base and broke through the 92.25 and 94.50 areas with strong momentum. Price is now sitting close to the 98.50 high, so this is a critical reaction zone.
A clean hold above 94.50 keeps the recent breakout structure intact. A successful reclaim of 98.50 would put the higher target zones into focus.
Risk Management:
Do not chase a vertical candle after a 35%+ daily move. The preferred setup is a controlled entry around the stated zone or confirmation after a successful retest.
Invalidation:
A sustained move below 92.00 would weaken the current 15M structure and invalidate this setup.
QNT is now at the stage where volume, retest strength and reaction around 98.50 matter more than simply following the percentage gain.
Trade the levels, manage the risk, and let the price confirm the next move.
#CFTCUpdatesGuidanceOnTokenizedAssets #BinanceWillListHyperliquid(HYPE) #FedProposesRulesForBankIssuedStablecoins #OndoFinanceSoughtSaleAfterFoundersDeath #FedOctoberRateHikeOddsRiseTo69.7%
QNT/USDT is trading around 97.02 on the 15M chart, up 35.41% over 24H with 6.48M USDT in reported volume.
The structure has changed sharply: QNT pushed from the 88.25 area into a fresh 24H high of 98.50, printing a strong sequence of higher highs and higher lows. The key now is whether the market can hold the breakout zone instead of giving back the entire move.
SIGNAL
Token: QNT
Pair: QNT/USDT
Timeframe: 15M
Entry Zone:
95.00 – 96.20
Stop Loss:
92.00
TP1:
98.50
TP2:
101.00
TP3:
104.00
Key Levels:
98.50 — immediate resistance / 24H high
97.00 — current price area
94.50 — first important support
92.25 — major short-term support
89.99 — previous consolidation area
88.25 — recent chart low
Market Structure:
QNT has moved aggressively from the 88.25 base and broke through the 92.25 and 94.50 areas with strong momentum. Price is now sitting close to the 98.50 high, so this is a critical reaction zone.
A clean hold above 94.50 keeps the recent breakout structure intact. A successful reclaim of 98.50 would put the higher target zones into focus.
Risk Management:
Do not chase a vertical candle after a 35%+ daily move. The preferred setup is a controlled entry around the stated zone or confirmation after a successful retest.
Invalidation:
A sustained move below 92.00 would weaken the current 15M structure and invalidate this setup.
QNT is now at the stage where volume, retest strength and reaction around 98.50 matter more than simply following the percentage gain.
Trade the levels, manage the risk, and let the price confirm the next move.
#CFTCUpdatesGuidanceOnTokenizedAssets #BinanceWillListHyperliquid(HYPE) #FedProposesRulesForBankIssuedStablecoins #OndoFinanceSoughtSaleAfterFoundersDeath #FedOctoberRateHikeOddsRiseTo69.7%
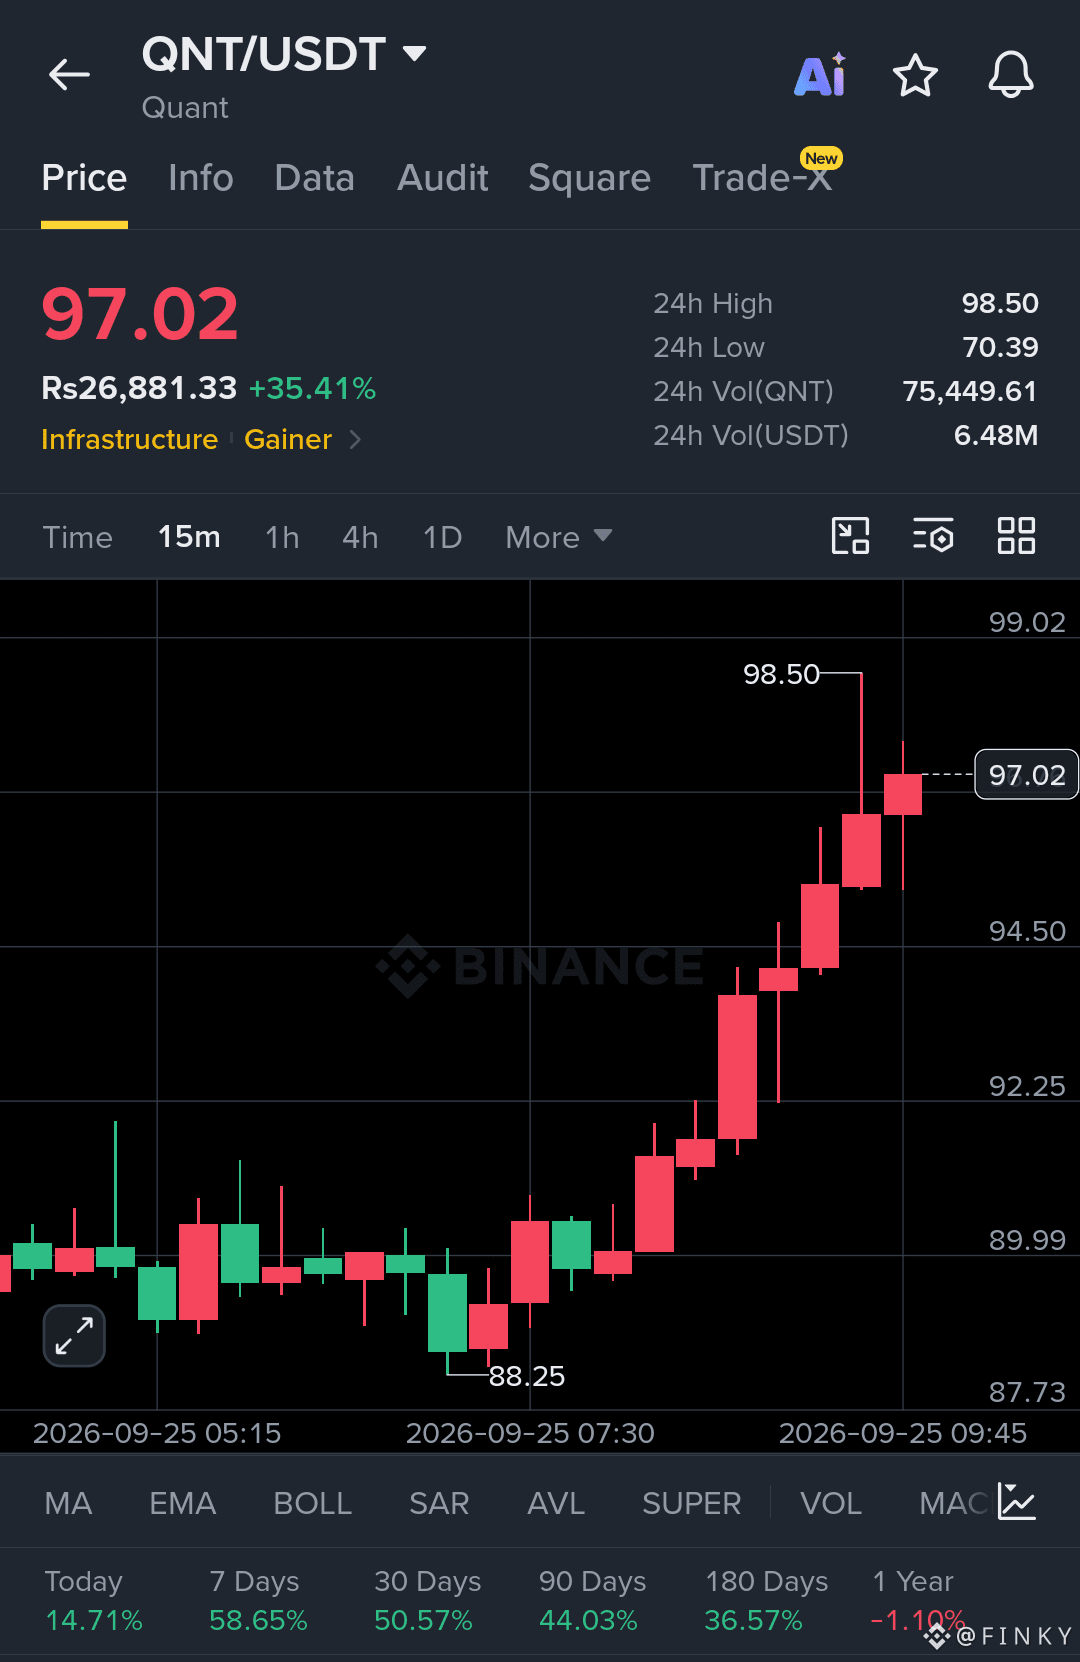
275
·
--
O‘suvchi
Tarjimani ko‘rish
$ZEC — Zcash is trading around 1,550.32 after defending the sharp intraday dip and rebuilding momentum from the 1,533.12 local low.
Entry: 1,545 – 1,552
TP1: 1,558
TP2: 1,563
TP3: 1,574
Stop Loss: 1,532
Current Price: 1,550.32
24H Change: +1.90%
24H High: 1,574.60
24H Low: 1,456.92
24H Volume: 194,064 ZEC
24H USDT Volume: 296.03M
15M Chart Setup:
ZEC bounced
{spot}(ZECUSDT)
#CFTCUpdatesGuidanceOnTokenizedAssets #BinanceWillListHyperliquid(HYPE) #FedProposesRulesForBankIssuedStablecoins #OndoFinanceSoughtSaleAfterFoundersDeath #FedOctoberRateHikeOddsRiseTo69.7%
$ZEC — Zcash is trading around 1,550.32 after defending the sharp intraday dip and rebuilding momentum from the 1,533.12 local low.
Entry: 1,545 – 1,552
TP1: 1,558
TP2: 1,563
TP3: 1,574
Stop Loss: 1,532
Current Price: 1,550.32
24H Change: +1.90%
24H High: 1,574.60
24H Low: 1,456.92
24H Volume: 194,064 ZEC
24H USDT Volume: 296.03M
15M Chart Setup:
ZEC bounced
#CFTCUpdatesGuidanceOnTokenizedAssets #BinanceWillListHyperliquid(HYPE) #FedProposesRulesForBankIssuedStablecoins #OndoFinanceSoughtSaleAfterFoundersDeath #FedOctoberRateHikeOddsRiseTo69.7%
Entry: 1,545 – 1,552
TP1: 1,558
TP2: 1,563
TP3: 1,574
Stop Loss: 1,532
Current Price: 1,550.32
24H Change: +1.90%
24H High: 1,574.60
24H Low: 1,456.92
24H Volume: 194,064 ZEC
24H USDT Volume: 296.03M
15M Chart Setup:
ZEC bounced
#CFTCUpdatesGuidanceOnTokenizedAssets #BinanceWillListHyperliquid(HYPE) #FedProposesRulesForBankIssuedStablecoins #OndoFinanceSoughtSaleAfterFoundersDeath #FedOctoberRateHikeOddsRiseTo69.7%
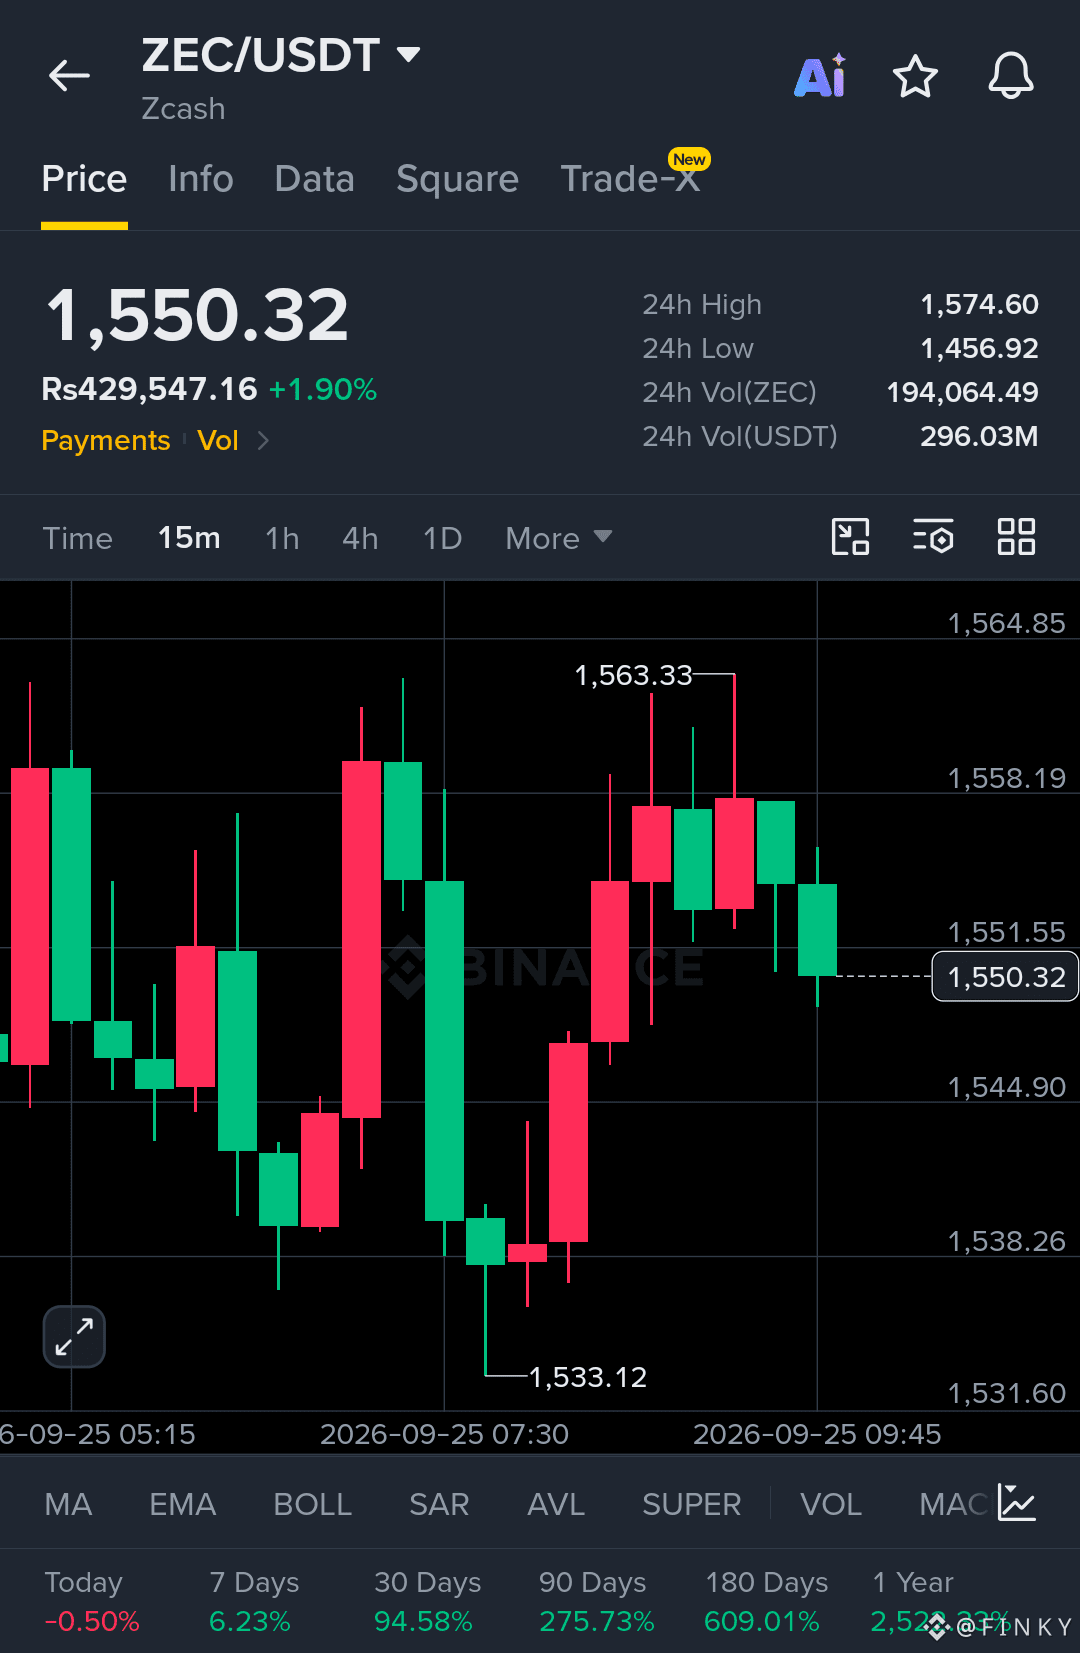
142
·
--
O‘suvchi
$HYPE — KATTA YANGI LISTING OGOSHLANTIRISH
Binance HYPE uchun YANGI LISTING e’lon qildi va Hyperliquid tokenini bevosita e’tibor markaziga olib chiqdi.
Bu turdagi listing token atrofida jiddiy e’tibor, yangi likvidlik va bozor faolligining oshishiga olib kelishi mumkin.
Binance tomonidan ulashilgan rasmda quyidagilar ta’kidlangan:
• Token: HYPE
• Platforma: Binance
• Holat: Yangi listing
• Loyiha: Hyperliquid
• E’londa ko‘rsatilgan rasmiy brending
• Ko‘rsatilgan manba: Binance TG Community
HYPE endi Binance tokenni o‘z platformasiga olib chiqishi bilan qat’iy ravishda radar markazida. Katta birja listingi bilan ko‘rinish oshadi va bozor narx harakatini diqqat bilan kuzatadigan holatga keladi.
Listing atrofida volatillikni kuting va risk-menejmentga e’tibor qaratib turing. Kutilmagan “shamlar” ortidan quvmay, bozor harakatni tasdiqlashini kuting.
HYPE rasmiy ravishda Binance e’tiboriga tushmoqda.
{spot}(HYPEUSDT)
#BinanceWillListHyperliquid(HYPE) #FedOctoberRateHikeOddsRiseTo69.7% #US30YearYieldHighestSince2004 #USWeighsPromotingDollarStablecoinsAbroad #US10YTreasuryYieldHits19YearHigh
$HYPE — KATTA YANGI LISTING OGOSHLANTIRISH
Binance HYPE uchun YANGI LISTING e’lon qildi va Hyperliquid tokenini bevosita e’tibor markaziga olib chiqdi.
Bu turdagi listing token atrofida jiddiy e’tibor, yangi likvidlik va bozor faolligining oshishiga olib kelishi mumkin.
Binance tomonidan ulashilgan rasmda quyidagilar ta’kidlangan:
• Token: HYPE
• Platforma: Binance
• Holat: Yangi listing
• Loyiha: Hyperliquid
• E’londa ko‘rsatilgan rasmiy brending
• Ko‘rsatilgan manba: Binance TG Community
HYPE endi Binance tokenni o‘z platformasiga olib chiqishi bilan qat’iy ravishda radar markazida. Katta birja listingi bilan ko‘rinish oshadi va bozor narx harakatini diqqat bilan kuzatadigan holatga keladi.
Listing atrofida volatillikni kuting va risk-menejmentga e’tibor qaratib turing. Kutilmagan “shamlar” ortidan quvmay, bozor harakatni tasdiqlashini kuting.
HYPE rasmiy ravishda Binance e’tiboriga tushmoqda.
#BinanceWillListHyperliquid(HYPE) #FedOctoberRateHikeOddsRiseTo69.7% #US30YearYieldHighestSince2004 #USWeighsPromotingDollarStablecoinsAbroad #US10YTreasuryYieldHits19YearHigh
Binance HYPE uchun YANGI LISTING e’lon qildi va Hyperliquid tokenini bevosita e’tibor markaziga olib chiqdi.
Bu turdagi listing token atrofida jiddiy e’tibor, yangi likvidlik va bozor faolligining oshishiga olib kelishi mumkin.
Binance tomonidan ulashilgan rasmda quyidagilar ta’kidlangan:
• Token: HYPE
• Platforma: Binance
• Holat: Yangi listing
• Loyiha: Hyperliquid
• E’londa ko‘rsatilgan rasmiy brending
• Ko‘rsatilgan manba: Binance TG Community
HYPE endi Binance tokenni o‘z platformasiga olib chiqishi bilan qat’iy ravishda radar markazida. Katta birja listingi bilan ko‘rinish oshadi va bozor narx harakatini diqqat bilan kuzatadigan holatga keladi.
Listing atrofida volatillikni kuting va risk-menejmentga e’tibor qaratib turing. Kutilmagan “shamlar” ortidan quvmay, bozor harakatni tasdiqlashini kuting.
HYPE rasmiy ravishda Binance e’tiboriga tushmoqda.
#BinanceWillListHyperliquid(HYPE) #FedOctoberRateHikeOddsRiseTo69.7% #US30YearYieldHighestSince2004 #USWeighsPromotingDollarStablecoinsAbroad #US10YTreasuryYieldHits19YearHigh

1
121
·
--
O‘suvchi
$HYPE — MOMENTUM SETUP IS LIVE
Narx: 91.39
24H High: 92.30
24H Low: 90.66
24H Change: -0.66%
24H Volume: 7.83M USDT
SIGNAL: LONG
Entry: 91.25 – 91.45
Stop Loss: 90.55
TP1: 91.66
TP2: 92.02
TP3: 92.30
Setup:
HYPE 90.66 dan kuchli tarzda sakrab chiqdi va 91.30 hududini qayta egalladi. Xaridorlar tiklanishni himoya qilmoqda, 91.66 esa birinchi asosiy qarshilik. Toza uzilish 92.02 tomon va 24H yuqori nuqtasi 92.30 ga yo‘l ochishi mumkin.
Risk: Pozitsiya hajmini nazoratda tuting va 90.55 buzilsa, kapitalni himoya qiling.
His-tuyg‘ularni emas, darajalarni savdo qiling.
{spot}(HYPEUSDT)
#BinanceWillListHyperliquid(HYPE) #US30YearYieldHighestSince2004 #USWeighsPromotingDollarStablecoinsAbroad #US10YTreasuryYieldHits19YearHigh
$HYPE — MOMENTUM SETUP IS LIVE
Narx: 91.39
24H High: 92.30
24H Low: 90.66
24H Change: -0.66%
24H Volume: 7.83M USDT
SIGNAL: LONG
Entry: 91.25 – 91.45
Stop Loss: 90.55
TP1: 91.66
TP2: 92.02
TP3: 92.30
Setup:
HYPE 90.66 dan kuchli tarzda sakrab chiqdi va 91.30 hududini qayta egalladi. Xaridorlar tiklanishni himoya qilmoqda, 91.66 esa birinchi asosiy qarshilik. Toza uzilish 92.02 tomon va 24H yuqori nuqtasi 92.30 ga yo‘l ochishi mumkin.
Risk: Pozitsiya hajmini nazoratda tuting va 90.55 buzilsa, kapitalni himoya qiling.
His-tuyg‘ularni emas, darajalarni savdo qiling.
#BinanceWillListHyperliquid(HYPE) #US30YearYieldHighestSince2004 #USWeighsPromotingDollarStablecoinsAbroad #US10YTreasuryYieldHits19YearHigh
Narx: 91.39
24H High: 92.30
24H Low: 90.66
24H Change: -0.66%
24H Volume: 7.83M USDT
SIGNAL: LONG
Entry: 91.25 – 91.45
Stop Loss: 90.55
TP1: 91.66
TP2: 92.02
TP3: 92.30
Setup:
HYPE 90.66 dan kuchli tarzda sakrab chiqdi va 91.30 hududini qayta egalladi. Xaridorlar tiklanishni himoya qilmoqda, 91.66 esa birinchi asosiy qarshilik. Toza uzilish 92.02 tomon va 24H yuqori nuqtasi 92.30 ga yo‘l ochishi mumkin.
Risk: Pozitsiya hajmini nazoratda tuting va 90.55 buzilsa, kapitalni himoya qiling.
His-tuyg‘ularni emas, darajalarni savdo qiling.
#BinanceWillListHyperliquid(HYPE) #US30YearYieldHighestSince2004 #USWeighsPromotingDollarStablecoinsAbroad #US10YTreasuryYieldHits19YearHigh

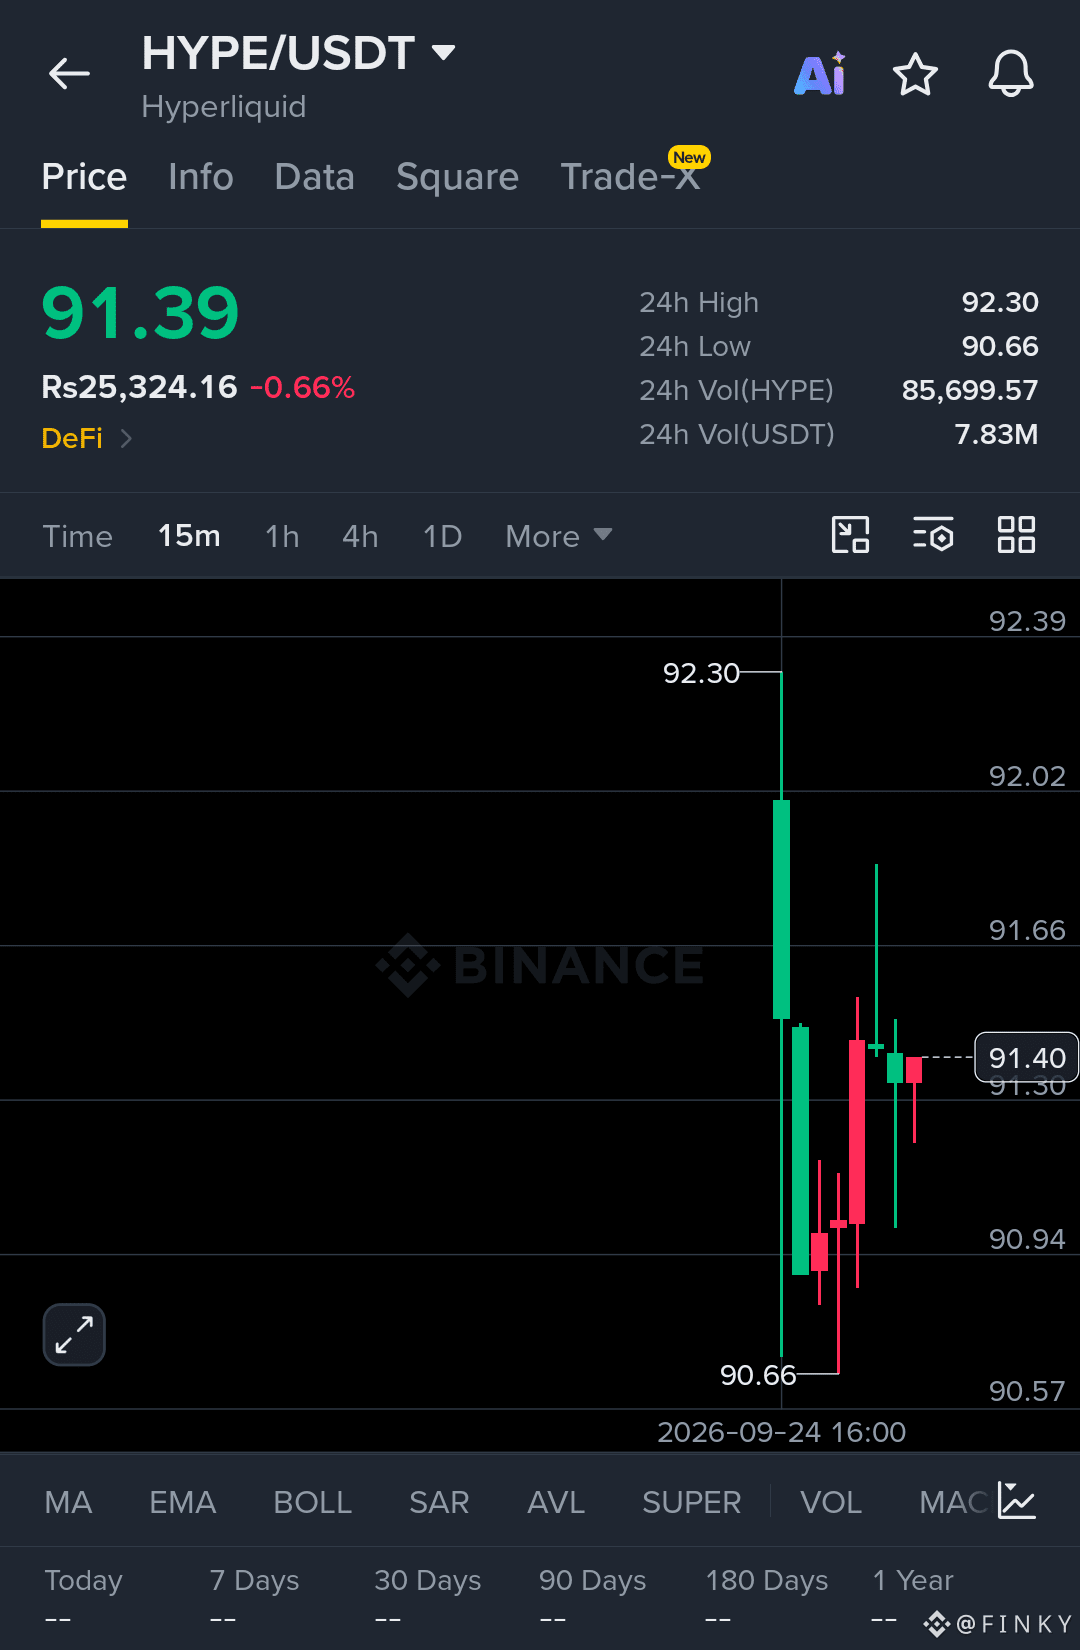
1
9
8.8k
·
--
O‘suvchi
$ARX — Xaridorlar mustahkam sur’at bilan kirib kelmoqda.
Kirish: 0.245–0.251
Stop Loss: 0.236
TP1: 0.260
TP2: 0.275
TP3: 0.290
Kirish zonasidan yuqorida impuls kuchli bo‘lib qolmoqda. Risk nazoratda.
#BinanceWillListHyperliquid(HYPE) #USWeighsPromotingDollarStablecoinsAbroad #BCHJumps28%OnCMEFuturesListing #WallStreetEarningsRevisionsTurnBearish #DollarIndexReclaims101
$ARX — Xaridorlar mustahkam sur’at bilan kirib kelmoqda.
Kirish: 0.245–0.251
Stop Loss: 0.236
TP1: 0.260
TP2: 0.275
TP3: 0.290
Kirish zonasidan yuqorida impuls kuchli bo‘lib qolmoqda. Risk nazoratda.
#BinanceWillListHyperliquid(HYPE) #USWeighsPromotingDollarStablecoinsAbroad #BCHJumps28%OnCMEFuturesListing #WallStreetEarningsRevisionsTurnBearish #DollarIndexReclaims101
Kirish: 0.245–0.251
Stop Loss: 0.236
TP1: 0.260
TP2: 0.275
TP3: 0.290
Kirish zonasidan yuqorida impuls kuchli bo‘lib qolmoqda. Risk nazoratda.
#BinanceWillListHyperliquid(HYPE) #USWeighsPromotingDollarStablecoinsAbroad #BCHJumps28%OnCMEFuturesListing #WallStreetEarningsRevisionsTurnBearish #DollarIndexReclaims101
LONG
100%
SHORT
0%
2 Ovozlar • Ovoz berish yopildi
54
·
--
O‘suvchi
$BTW — +7,33% ko‘tarilgandan keyin momentum mustahkam ushlab turibdi.
Kirish: 0.995–1.010
Stop Loss: 0.960
TP1: 1.050
TP2: 1.090
TP3: 1.140
Kirish zonasidan yuqorida ushlansa, momentum davom etishi mumkin. Risk nazoratda.
#BinanceWillListHyperliquid(HYPE) #BCHJumps28%OnCMEFuturesListing #BCHJumps28%OnCMEFuturesListing #DollarIndexReclaims101 #DollarIndexReclaims101
$BTW — +7,33% ko‘tarilgandan keyin momentum mustahkam ushlab turibdi.
Kirish: 0.995–1.010
Stop Loss: 0.960
TP1: 1.050
TP2: 1.090
TP3: 1.140
Kirish zonasidan yuqorida ushlansa, momentum davom etishi mumkin. Risk nazoratda.
#BinanceWillListHyperliquid(HYPE) #BCHJumps28%OnCMEFuturesListing #BCHJumps28%OnCMEFuturesListing #DollarIndexReclaims101 #DollarIndexReclaims101
Kirish: 0.995–1.010
Stop Loss: 0.960
TP1: 1.050
TP2: 1.090
TP3: 1.140
Kirish zonasidan yuqorida ushlansa, momentum davom etishi mumkin. Risk nazoratda.
#BinanceWillListHyperliquid(HYPE) #BCHJumps28%OnCMEFuturesListing #BCHJumps28%OnCMEFuturesListing #DollarIndexReclaims101 #DollarIndexReclaims101
48
Ko‘proq kontentni ko‘rish uchun tizimga kiring
Binance Square'da global kriptovalyuta foydalanuvchilariga qo‘shiling
⚡️ Kriptovalyuta haqida eng so‘nggi va foydali ma’lumotlarni oling.
💬 Dunyoning eng yirik kriptovalyuta birjasi tomonidan ishonchli deb topilgan.
👍 Tasdiqlangan mualliflardan haqiqiy tahlillarni kashf eting.
Email / telefon raqami
Trenddagi mavzular
QNTRises39%
5,300 marta koʻrilgan
378 muhokama qilmoqda
🚀 $QNT NASOSLAR +39%!
Quant The Clearing House bilan hamkorlik qildi — kuniga $2 TRILLIONni boshqaradigan tarmoq!
Ular tokenlashtirilgan depozit tarmog‘ini AQShdagi 25 ta yetakchi bank uchun quvvatlaydi. $70 dan bir necha soat ichida $100+ gacha, hajm 553% ga oshgan.
Bu INSTITUTSIONAL qabul qilish uchun juda KATTA.
$QNT endi $110 tomonga ketyaptimi?
#QNT #Quant #CryptoNews #RWA #Bullish#qntrises39%
True News
·3 ta layk
·3.1k marta koʻrilgan
EthereumBreaksAbove$2700
772 marta koʻrilgan
52 muhokama qilmoqda
BitgetBreachForgedRequestsNotStolenKeys
4,260 marta koʻrilgan
298 muhokama qilmoqda