

#teknikanaliz
teknikanaliz
3,099 views
27 Discussing
Hot
Latest

NEARUSDT 1-Hour SHORT Signal | NEARUSDT 1H SHORT Signal
🇹🇷 TURKISH
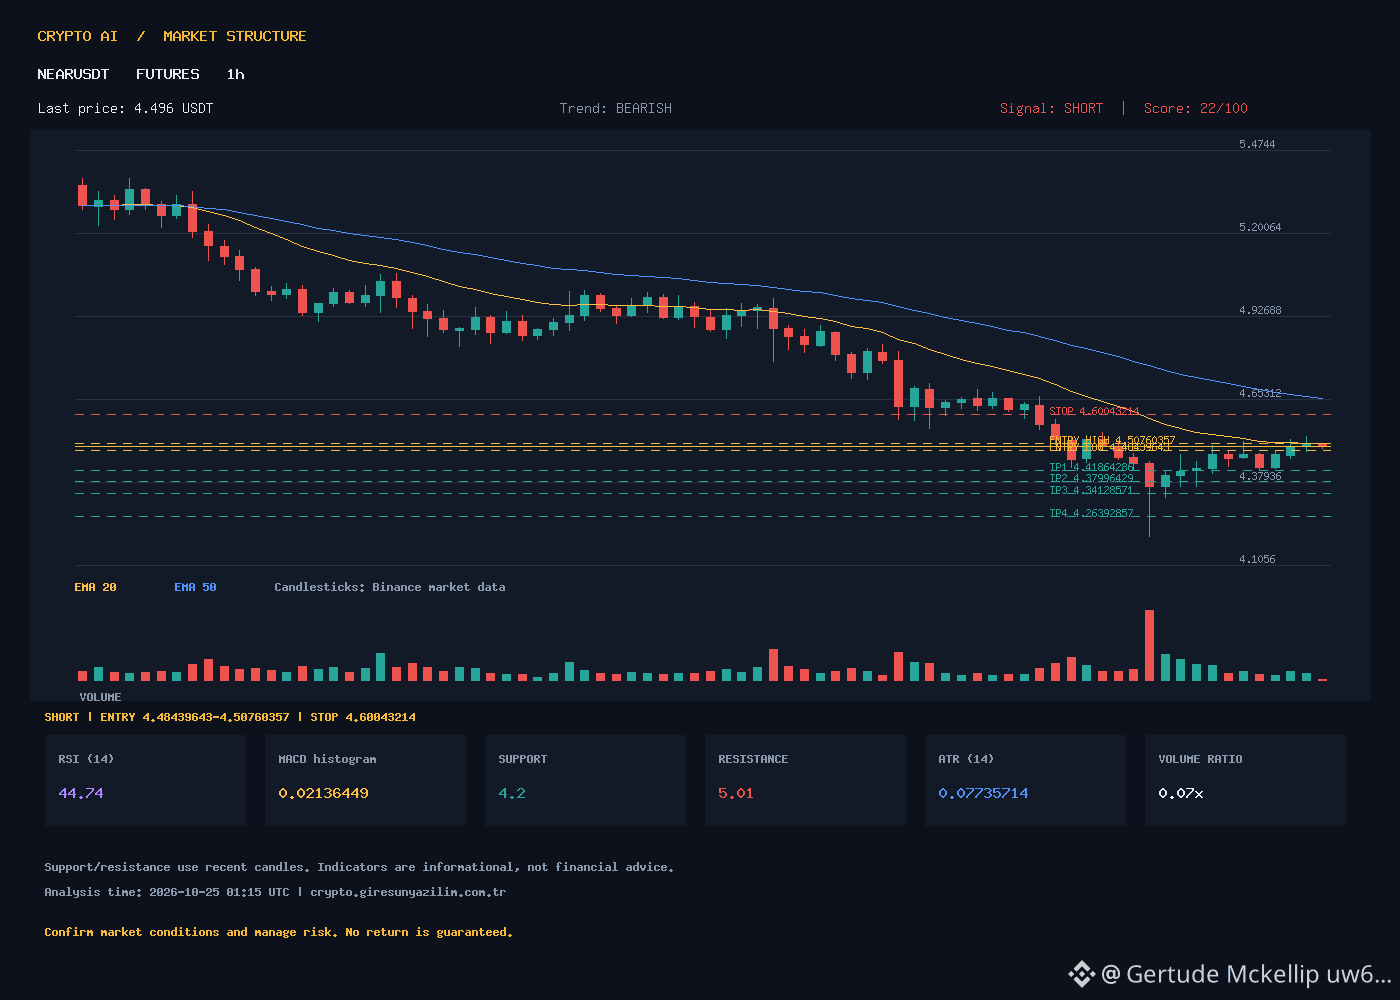
NEARUSDT 1h: BEARISH trend, score 22, price 4.496. RSI 44.74 (neutral-to-bearish), EMA20 4.507 > EMA50 4.645 > EMA200 4.861 – all EMAs are above the price, indicating downside momentum. MACD -0.056, signal -0.077, histogram +0.021 (weak bullish divergence, but the trend is still down). ATR 0.077, volume at 7% of average (low). Support 4.2, resistance 5.01.
SHORT trade plan (ATR-based scenario, not guaranteed):
Entry range: 4.48439643 – 4.50760357 (midpoint 4.496)
Stop-Loss: 4.60043214
TP1: 4.41864286 | TP2: 4.37996429 | TP3: 4.34128571 | TP4: 4.26392857
Risk: Low volume and a positive MACD histogram indicate a risk of a short-term bounce. Adjust position size based on ATR.
Question: If support at 4.2 is tested, how quickly do you expect a reaction?
🇬🇧 ENGLISH
NEARUSDT 1h: BEARISH trend, score 22, price 4.496. RSI 44.74 (neutral-bearish), EMA20 4.507 > EMA50 4.645 > EMA200 4.861 – all EMAs above price, downside momentum. MACD -0.056, signal -0.077, histogram +0.021 (weak bullish divergence but trend still down). ATR 0.077, volume 7% of average (low). Support 4.2, resistance 5.01.
SHORT trade plan (ATR-based scenario, not guaranteed):
Entry range: 4.48439643 – 4.50760357 (mid 4.496)
Stop-Loss: 4.60043214
TP1: 4.41864286 | TP2: 4.37996429 | TP3: 4.34128571 | TP4: 4.26392857
Risk: Low volume and positive MACD histogram suggest short-term bounce risk. Size position per ATR.
Question: If 4.2 support is tested, how quickly do you expect a reaction?
#NEARUSDT #SHORT #TeknikAnaliz #Kripto #BinanceFutures
NEARUSDT 1-Hour SHORT Signal | NEARUSDT 1H SHORT Signal
🇹🇷 TURKISH
NEARUSDT 1h: BEARISH trend, score 22, price 4.496. RSI 44.74 (neutral-to-bearish), EMA20 4.507 > EMA50 4.645 > EMA200 4.861 – all EMAs are above the price, indicating downside momentum. MACD -0.056, signal -0.077, histogram +0.021 (weak bullish divergence, but the trend is still down). ATR 0.077, volume at 7% of average (low). Support 4.2, resistance 5.01.
SHORT trade plan (ATR-based scenario, not guaranteed):
Entry range: 4.48439643 – 4.50760357 (midpoint 4.496)
Stop-Loss: 4.60043214
TP1: 4.41864286 | TP2: 4.37996429 | TP3: 4.34128571 | TP4: 4.26392857
Risk: Low volume and a positive MACD histogram indicate a risk of a short-term bounce. Adjust position size based on ATR.
Question: If support at 4.2 is tested, how quickly do you expect a reaction?
🇬🇧 ENGLISH
NEARUSDT 1h: BEARISH trend, score 22, price 4.496. RSI 44.74 (neutral-bearish), EMA20 4.507 > EMA50 4.645 > EMA200 4.861 – all EMAs above price, downside momentum. MACD -0.056, signal -0.077, histogram +0.021 (weak bullish divergence but trend still down). ATR 0.077, volume 7% of average (low). Support 4.2, resistance 5.01.
SHORT trade plan (ATR-based scenario, not guaranteed):
Entry range: 4.48439643 – 4.50760357 (mid 4.496)
Stop-Loss: 4.60043214
TP1: 4.41864286 | TP2: 4.37996429 | TP3: 4.34128571 | TP4: 4.26392857
Risk: Low volume and positive MACD histogram suggest short-term bounce risk. Size position per ATR.
Question: If 4.2 support is tested, how quickly do you expect a reaction?
#NEARUSDT #SHORT #TeknikAnaliz #Kripto #BinanceFutures
🇹🇷 TURKISH
NEARUSDT 1h: BEARISH trend, score 22, price 4.496. RSI 44.74 (neutral-to-bearish), EMA20 4.507 > EMA50 4.645 > EMA200 4.861 – all EMAs are above the price, indicating downside momentum. MACD -0.056, signal -0.077, histogram +0.021 (weak bullish divergence, but the trend is still down). ATR 0.077, volume at 7% of average (low). Support 4.2, resistance 5.01.
SHORT trade plan (ATR-based scenario, not guaranteed):
Entry range: 4.48439643 – 4.50760357 (midpoint 4.496)
Stop-Loss: 4.60043214
TP1: 4.41864286 | TP2: 4.37996429 | TP3: 4.34128571 | TP4: 4.26392857
Risk: Low volume and a positive MACD histogram indicate a risk of a short-term bounce. Adjust position size based on ATR.
Question: If support at 4.2 is tested, how quickly do you expect a reaction?
🇬🇧 ENGLISH
NEARUSDT 1h: BEARISH trend, score 22, price 4.496. RSI 44.74 (neutral-bearish), EMA20 4.507 > EMA50 4.645 > EMA200 4.861 – all EMAs above price, downside momentum. MACD -0.056, signal -0.077, histogram +0.021 (weak bullish divergence but trend still down). ATR 0.077, volume 7% of average (low). Support 4.2, resistance 5.01.
SHORT trade plan (ATR-based scenario, not guaranteed):
Entry range: 4.48439643 – 4.50760357 (mid 4.496)
Stop-Loss: 4.60043214
TP1: 4.41864286 | TP2: 4.37996429 | TP3: 4.34128571 | TP4: 4.26392857
Risk: Low volume and positive MACD histogram suggest short-term bounce risk. Size position per ATR.
Question: If 4.2 support is tested, how quickly do you expect a reaction?
#NEARUSDT #SHORT #TeknikAnaliz #Kripto #BinanceFutures
25
NEARUSDT 1H Short Position Signal – Strong Bearish | NEARUSDT 1H Short Signal – Strong Bearish
🇹🇷 TURKISH
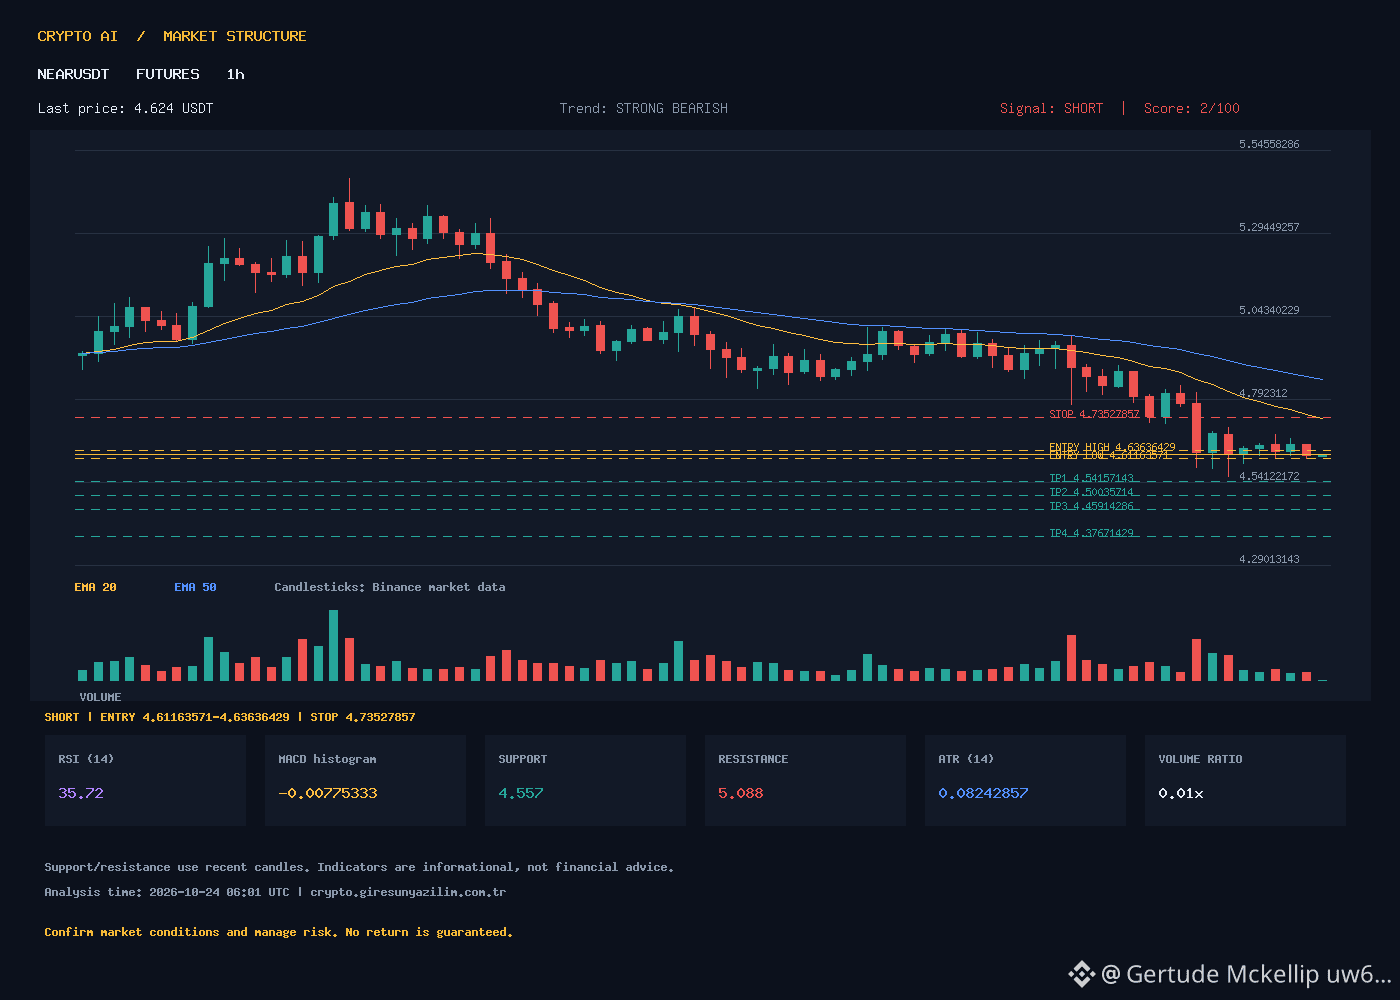
The NEARUSDT 1-hour chart is dominated by a STRONG BEARISH trend. Score: 2/10; price: 4.624, below EMA20 (4.734), EMA50 (4.849), and EMA200 (4.944). RSI at 35.72 is approaching oversold territory; the MACD histogram is negative at -0.0078, with downward momentum. ATR: 0.0824; support: 4.557; resistance: 5.088. Volume on the last candle was 29,849 (1% of average) – liquidity is very low, with a high risk of slippage during a breakdown.
Signal: SHORT (ATR-based scenario, not guaranteed).
Entry range: 4.6116 – 4.6364 (midpoint 4.624)
Stop-Loss: 4.7353
TP1: 4.5416 | TP2: 4.5004 | TP3: 4.4591 | TP4: 4.3767
The EMAs are turning down from flat; price may test the 4.557 support. Watch for false breakouts in low-volume conditions.
Discussion: If the 4.557 support holds, should we expect a bounce or a rapid move below 4.50?
🇬🇧 ENGLISH
NEARUSDT 1H shows a STRONG BEARISH trend. Score 2/10, price 4.624 below EMA20 (4.734), EMA50 (4.849), EMA200 (4.944). RSI 35.72 nearing oversold; MACD histogram -0.0078 negative, momentum down. ATR 0.0824, support 4.557, resistance 5.088. Volume last candle 29,849 (1% of average) – very thin liquidity, high slippage risk on breakdown.
Signal: SHORT (ATR-based scenario, not guaranteed).
Entry range: 4.6116 – 4.6364 (mid 4.624)
Stop-Loss: 4.7353
TP1: 4.5416 | TP2: 4.5004 | TP3: 4.4591 | TP4: 4.3767
EMAs turning down from flat; price may test 4.557 support. Watch for false breaks in low volume.
Discussion: If 4.557 holds, bounce or accelerated drop toward 4.50?
#NEARUSDT #NEAR #ShortSignal #TeknikAnaliz #TechnicalAnalysis
NEARUSDT 1H Short Position Signal – Strong Bearish | NEARUSDT 1H Short Signal – Strong Bearish
🇹🇷 TURKISH
The NEARUSDT 1-hour chart is dominated by a STRONG BEARISH trend. Score: 2/10; price: 4.624, below EMA20 (4.734), EMA50 (4.849), and EMA200 (4.944). RSI at 35.72 is approaching oversold territory; the MACD histogram is negative at -0.0078, with downward momentum. ATR: 0.0824; support: 4.557; resistance: 5.088. Volume on the last candle was 29,849 (1% of average) – liquidity is very low, with a high risk of slippage during a breakdown.
Signal: SHORT (ATR-based scenario, not guaranteed).
Entry range: 4.6116 – 4.6364 (midpoint 4.624)
Stop-Loss: 4.7353
TP1: 4.5416 | TP2: 4.5004 | TP3: 4.4591 | TP4: 4.3767
The EMAs are turning down from flat; price may test the 4.557 support. Watch for false breakouts in low-volume conditions.
Discussion: If the 4.557 support holds, should we expect a bounce or a rapid move below 4.50?
🇬🇧 ENGLISH
NEARUSDT 1H shows a STRONG BEARISH trend. Score 2/10, price 4.624 below EMA20 (4.734), EMA50 (4.849), EMA200 (4.944). RSI 35.72 nearing oversold; MACD histogram -0.0078 negative, momentum down. ATR 0.0824, support 4.557, resistance 5.088. Volume last candle 29,849 (1% of average) – very thin liquidity, high slippage risk on breakdown.
Signal: SHORT (ATR-based scenario, not guaranteed).
Entry range: 4.6116 – 4.6364 (mid 4.624)
Stop-Loss: 4.7353
TP1: 4.5416 | TP2: 4.5004 | TP3: 4.4591 | TP4: 4.3767
EMAs turning down from flat; price may test 4.557 support. Watch for false breaks in low volume.
Discussion: If 4.557 holds, bounce or accelerated drop toward 4.50?
#NEARUSDT #NEAR #ShortSignal #TeknikAnaliz #TechnicalAnalysis
🇹🇷 TURKISH
The NEARUSDT 1-hour chart is dominated by a STRONG BEARISH trend. Score: 2/10; price: 4.624, below EMA20 (4.734), EMA50 (4.849), and EMA200 (4.944). RSI at 35.72 is approaching oversold territory; the MACD histogram is negative at -0.0078, with downward momentum. ATR: 0.0824; support: 4.557; resistance: 5.088. Volume on the last candle was 29,849 (1% of average) – liquidity is very low, with a high risk of slippage during a breakdown.
Signal: SHORT (ATR-based scenario, not guaranteed).
Entry range: 4.6116 – 4.6364 (midpoint 4.624)
Stop-Loss: 4.7353
TP1: 4.5416 | TP2: 4.5004 | TP3: 4.4591 | TP4: 4.3767
The EMAs are turning down from flat; price may test the 4.557 support. Watch for false breakouts in low-volume conditions.
Discussion: If the 4.557 support holds, should we expect a bounce or a rapid move below 4.50?
🇬🇧 ENGLISH
NEARUSDT 1H shows a STRONG BEARISH trend. Score 2/10, price 4.624 below EMA20 (4.734), EMA50 (4.849), EMA200 (4.944). RSI 35.72 nearing oversold; MACD histogram -0.0078 negative, momentum down. ATR 0.0824, support 4.557, resistance 5.088. Volume last candle 29,849 (1% of average) – very thin liquidity, high slippage risk on breakdown.
Signal: SHORT (ATR-based scenario, not guaranteed).
Entry range: 4.6116 – 4.6364 (mid 4.624)
Stop-Loss: 4.7353
TP1: 4.5416 | TP2: 4.5004 | TP3: 4.4591 | TP4: 4.3767
EMAs turning down from flat; price may test 4.557 support. Watch for false breaks in low volume.
Discussion: If 4.557 holds, bounce or accelerated drop toward 4.50?
#NEARUSDT #NEAR #ShortSignal #TeknikAnaliz #TechnicalAnalysis
6
BIRBUSDT 1H LONG Signal – Strong Bullish Scenario | BIRBUSDT 1H LONG Signal – Strong Bullish Setup
🇹🇷 ENGLISH
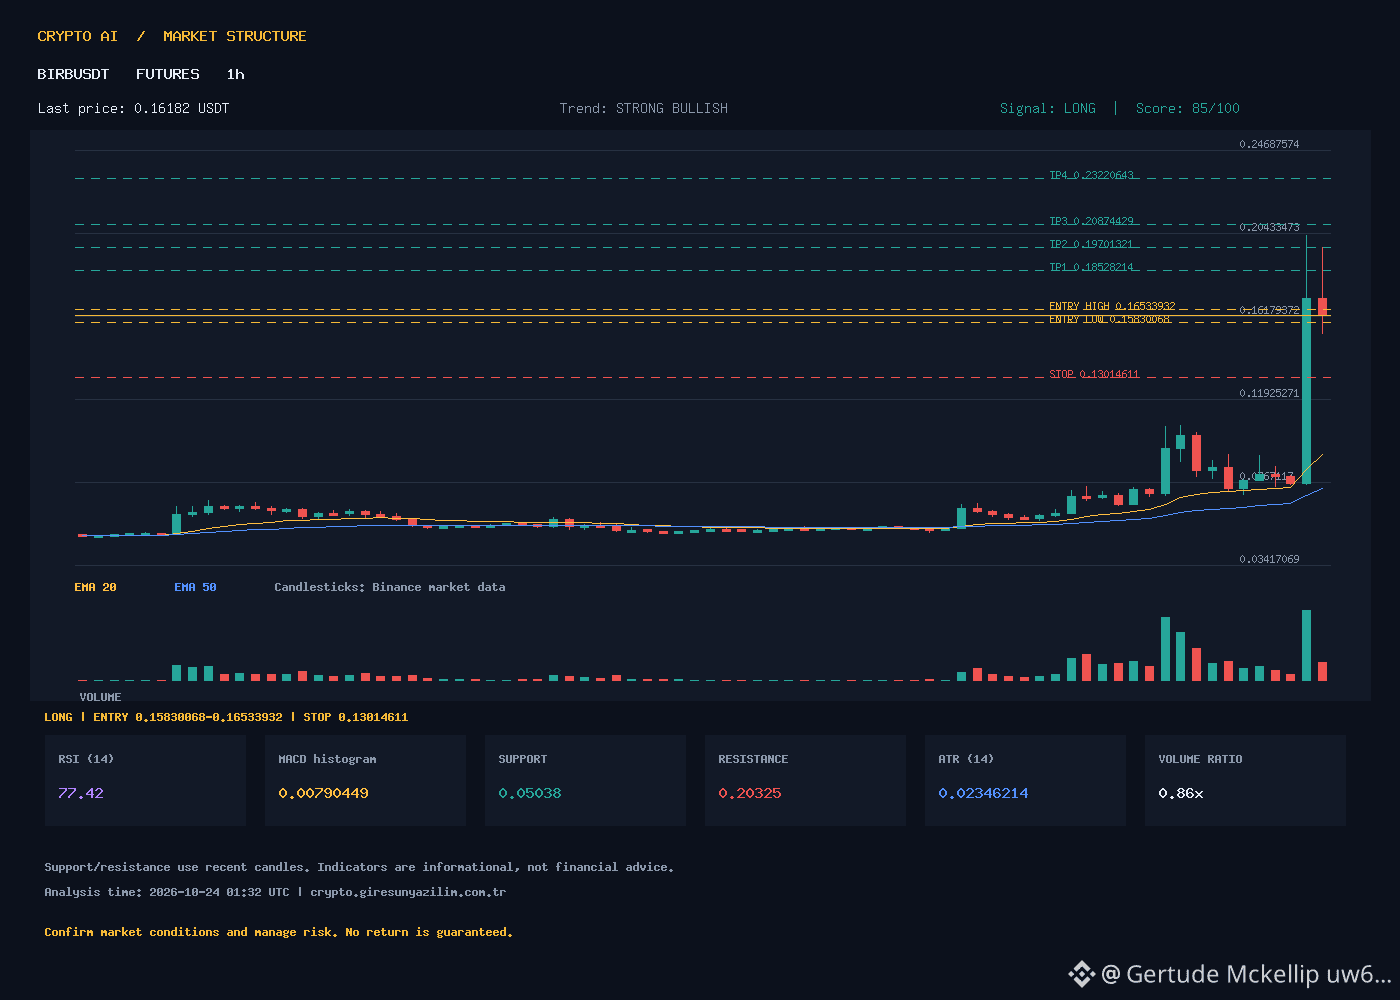
BIRBUSDT on the 1-hour chart has an active **STRONG BULLISH** trend (score 85/100) and a **LONG** signal. Current price **0.16182**, RSI **77.42** (overbought zone), EMA20 **0.09056** > EMA50 **0.07316** > EMA200 **0.05780** – a strong bullish structure. MACD **0.0175** is above the signal **0.0096**, with a positive histogram of **0.0079**. ATR **0.02346**, support **0.05038**, resistance **0.20325**. Volume is at 86% of average (209.2M vs. 242.2M average).
**Trade Plan (ATR-based scenario, not guaranteed):**
- Direction: LONG
- Entry range: **0.15830068 – 0.16533932** (midpoint 0.16182)
- Stop-Loss: **0.13014611**
- TP1: **0.18528214**
- TP2: **0.19701321**
- TP3: **0.20874429**
- TP4: **0.23220643**
RSI is at 77; there is a risk of a short-term pullback. Volume confirmation is weak. Do you think the 0.20325 resistance can be broken?
🇬🇧 ENGLISH
BIRBUSDT 1H shows a **STRONG BULLISH** trend (score 85/100) with a confirmed **LONG** signal. Price **0.16182**, RSI **77.42** (overbought), EMA20 **0.09056** > EMA50 **0.07316** > EMA200 **0.05780** – robust uptrend. MACD **0.0175** above signal **0.0096**, histogram **0.0079** positive. ATR **0.02346**, support **0.05038**, resistance **0.20325**. Volume at 86% of average (209.2M vs 242.2M avg).
**Trade Plan (ATR-based scenario, not guaranteed):**
- Direction: LONG
- Entry range: **0.15830068 – 0.16533932** (mid 0.16182)
- Stop-Loss: **0.13014611**
- TP1: **0.18528214**
- TP2: **0.19701321**
- TP3: **0.20874429**
- TP4: **0.23220643**
RSI at 77 warns of short-term pullback risk; volume confirmation is modest. Can 0.20325 resistance be broken?
#BIRBUSDT #BinanceFutures #TeknikAnaliz #KriptoTrading #LONG
BIRBUSDT 1H LONG Signal – Strong Bullish Scenario | BIRBUSDT 1H LONG Signal – Strong Bullish Setup
🇹🇷 ENGLISH
BIRBUSDT on the 1-hour chart has an active **STRONG BULLISH** trend (score 85/100) and a **LONG** signal. Current price **0.16182**, RSI **77.42** (overbought zone), EMA20 **0.09056** > EMA50 **0.07316** > EMA200 **0.05780** – a strong bullish structure. MACD **0.0175** is above the signal **0.0096**, with a positive histogram of **0.0079**. ATR **0.02346**, support **0.05038**, resistance **0.20325**. Volume is at 86% of average (209.2M vs. 242.2M average).
**Trade Plan (ATR-based scenario, not guaranteed):**
- Direction: LONG
- Entry range: **0.15830068 – 0.16533932** (midpoint 0.16182)
- Stop-Loss: **0.13014611**
- TP1: **0.18528214**
- TP2: **0.19701321**
- TP3: **0.20874429**
- TP4: **0.23220643**
RSI is at 77; there is a risk of a short-term pullback. Volume confirmation is weak. Do you think the 0.20325 resistance can be broken?
🇬🇧 ENGLISH
BIRBUSDT 1H shows a **STRONG BULLISH** trend (score 85/100) with a confirmed **LONG** signal. Price **0.16182**, RSI **77.42** (overbought), EMA20 **0.09056** > EMA50 **0.07316** > EMA200 **0.05780** – robust uptrend. MACD **0.0175** above signal **0.0096**, histogram **0.0079** positive. ATR **0.02346**, support **0.05038**, resistance **0.20325**. Volume at 86% of average (209.2M vs 242.2M avg).
**Trade Plan (ATR-based scenario, not guaranteed):**
- Direction: LONG
- Entry range: **0.15830068 – 0.16533932** (mid 0.16182)
- Stop-Loss: **0.13014611**
- TP1: **0.18528214**
- TP2: **0.19701321**
- TP3: **0.20874429**
- TP4: **0.23220643**
RSI at 77 warns of short-term pullback risk; volume confirmation is modest. Can 0.20325 resistance be broken?
#BIRBUSDT #BinanceFutures #TeknikAnaliz #KriptoTrading #LONG
🇹🇷 ENGLISH
BIRBUSDT on the 1-hour chart has an active **STRONG BULLISH** trend (score 85/100) and a **LONG** signal. Current price **0.16182**, RSI **77.42** (overbought zone), EMA20 **0.09056** > EMA50 **0.07316** > EMA200 **0.05780** – a strong bullish structure. MACD **0.0175** is above the signal **0.0096**, with a positive histogram of **0.0079**. ATR **0.02346**, support **0.05038**, resistance **0.20325**. Volume is at 86% of average (209.2M vs. 242.2M average).
**Trade Plan (ATR-based scenario, not guaranteed):**
- Direction: LONG
- Entry range: **0.15830068 – 0.16533932** (midpoint 0.16182)
- Stop-Loss: **0.13014611**
- TP1: **0.18528214**
- TP2: **0.19701321**
- TP3: **0.20874429**
- TP4: **0.23220643**
RSI is at 77; there is a risk of a short-term pullback. Volume confirmation is weak. Do you think the 0.20325 resistance can be broken?
🇬🇧 ENGLISH
BIRBUSDT 1H shows a **STRONG BULLISH** trend (score 85/100) with a confirmed **LONG** signal. Price **0.16182**, RSI **77.42** (overbought), EMA20 **0.09056** > EMA50 **0.07316** > EMA200 **0.05780** – robust uptrend. MACD **0.0175** above signal **0.0096**, histogram **0.0079** positive. ATR **0.02346**, support **0.05038**, resistance **0.20325**. Volume at 86% of average (209.2M vs 242.2M avg).
**Trade Plan (ATR-based scenario, not guaranteed):**
- Direction: LONG
- Entry range: **0.15830068 – 0.16533932** (mid 0.16182)
- Stop-Loss: **0.13014611**
- TP1: **0.18528214**
- TP2: **0.19701321**
- TP3: **0.20874429**
- TP4: **0.23220643**
RSI at 77 warns of short-term pullback risk; volume confirmation is modest. Can 0.20325 resistance be broken?
#BIRBUSDT #BinanceFutures #TeknikAnaliz #KriptoTrading #LONG
27
NEARUSDT 1H Short Position Signal | NEARUSDT 1H Short Signal
🇹🇷 TURKISH
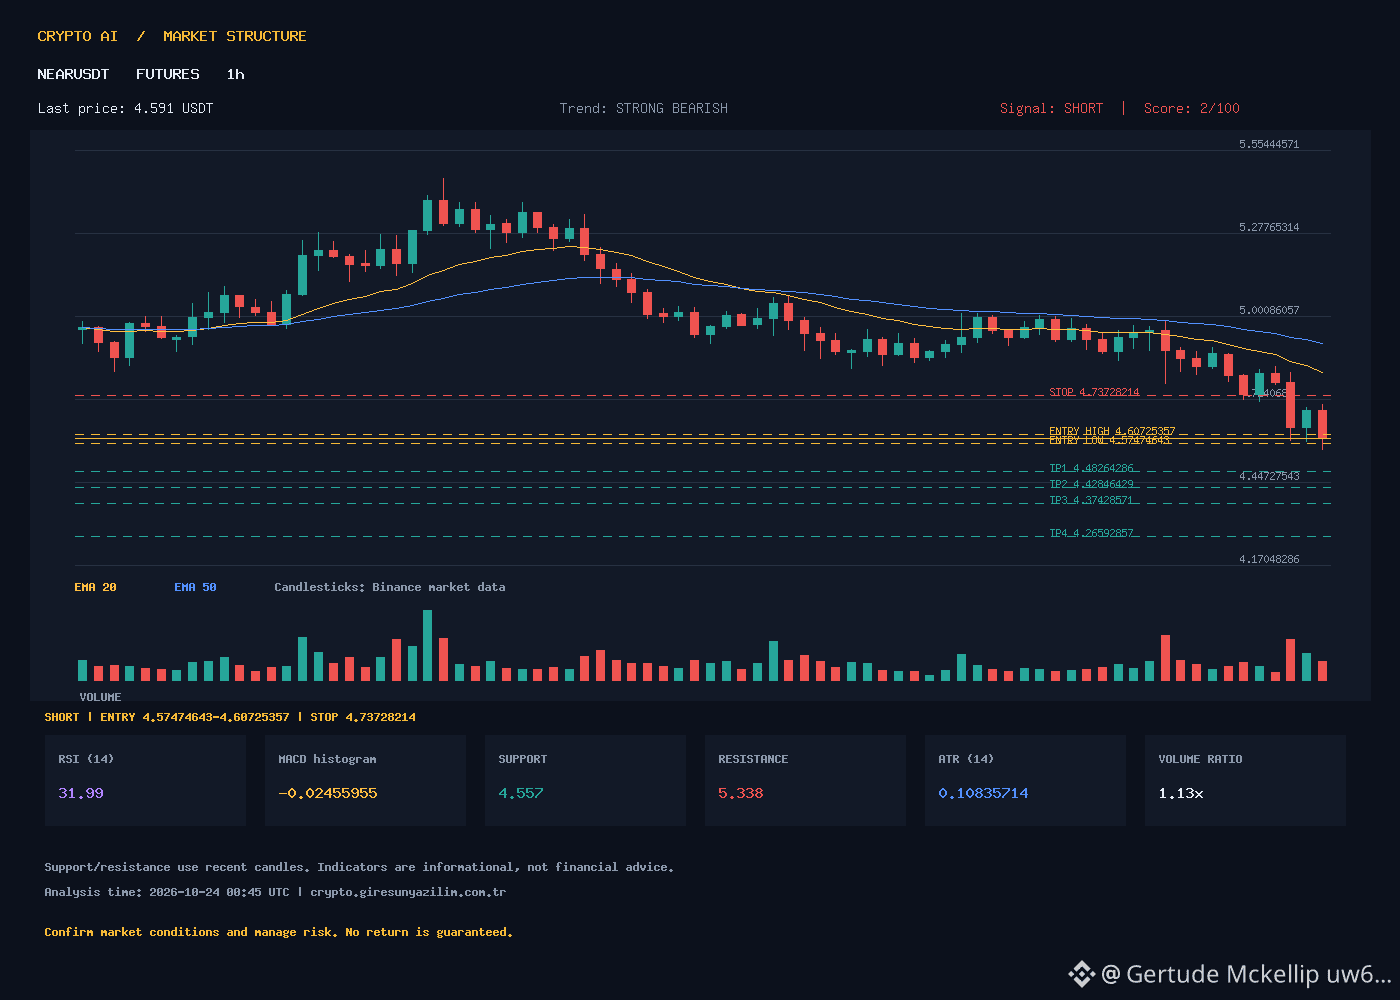
NEARUSDT 1-hour chart shows a **STRONG BEARISH** trend (score 2) and an active **SHORT** signal. Current price **4.591**, RSI **31.99** (near the oversold zone). EMA20 **4.811**, EMA50 **4.905**, EMA200 **4.966** – price is below all moving averages. MACD **-0.078** (signal **-0.054**, histogram **-0.025**) confirms negative momentum. ATR **0.108**, support **4.557**, resistance **5.338**. Volume is 13% above average (5.58M vs 4.96M).
**ATR-based SHORT scenario (not guaranteed):**
- Entry range: **4.5747 – 4.6073** (mid **4.591**)
- Stop-Loss: **4.7373**
- TP1: **4.4826** | TP2: **4.4285** | TP3: **4.3743** | TP4: **4.2659**
Risk: RSI is near the bottom, so there is a risk of a short-term reversal; the stop-loss should account for the ATR range.
Question: Which confirmation candle are you waiting for before entering a short position at these levels?
🇬🇧 ENGLISH
NEARUSDT 1H shows a **STRONG BEARISH** trend (score 2) with a confirmed **SHORT** signal. Current price **4.591**, RSI **31.99** near oversold. EMA20 **4.811**, EMA50 **4.905**, EMA200 **4.966** – price below all MAs. MACD **-0.078** (signal **-0.054**, hist **-0.025**) confirms bearish momentum. ATR **0.108**, support **4.557**, resistance **5.338**. Volume 13% above average (5.58M vs 4.96M).
**ATR-based SHORT scenario (not guaranteed):**
- Entry range: **4.5747 – 4.6073** (mid **4.591**)
- Stop-Loss: **4.7373**
- TP1: **4.4826** | TP2: **4.4285** | TP3: **4.3743** | TP4: **4.2659**
Risk: RSI at lows, bounce risk exists; protect with ATR-based stop.
Question: Which confirmation candle are you waiting for before entering short at these levels?
#NEARUSDT #SHORT #Futures #TeknikAnaliz #CryptoTR
NEARUSDT 1H Short Position Signal | NEARUSDT 1H Short Signal
🇹🇷 TURKISH
NEARUSDT 1-hour chart shows a **STRONG BEARISH** trend (score 2) and an active **SHORT** signal. Current price **4.591**, RSI **31.99** (near the oversold zone). EMA20 **4.811**, EMA50 **4.905**, EMA200 **4.966** – price is below all moving averages. MACD **-0.078** (signal **-0.054**, histogram **-0.025**) confirms negative momentum. ATR **0.108**, support **4.557**, resistance **5.338**. Volume is 13% above average (5.58M vs 4.96M).
**ATR-based SHORT scenario (not guaranteed):**
- Entry range: **4.5747 – 4.6073** (mid **4.591**)
- Stop-Loss: **4.7373**
- TP1: **4.4826** | TP2: **4.4285** | TP3: **4.3743** | TP4: **4.2659**
Risk: RSI is near the bottom, so there is a risk of a short-term reversal; the stop-loss should account for the ATR range.
Question: Which confirmation candle are you waiting for before entering a short position at these levels?
🇬🇧 ENGLISH
NEARUSDT 1H shows a **STRONG BEARISH** trend (score 2) with a confirmed **SHORT** signal. Current price **4.591**, RSI **31.99** near oversold. EMA20 **4.811**, EMA50 **4.905**, EMA200 **4.966** – price below all MAs. MACD **-0.078** (signal **-0.054**, hist **-0.025**) confirms bearish momentum. ATR **0.108**, support **4.557**, resistance **5.338**. Volume 13% above average (5.58M vs 4.96M).
**ATR-based SHORT scenario (not guaranteed):**
- Entry range: **4.5747 – 4.6073** (mid **4.591**)
- Stop-Loss: **4.7373**
- TP1: **4.4826** | TP2: **4.4285** | TP3: **4.3743** | TP4: **4.2659**
Risk: RSI at lows, bounce risk exists; protect with ATR-based stop.
Question: Which confirmation candle are you waiting for before entering short at these levels?
#NEARUSDT #SHORT #Futures #TeknikAnaliz #CryptoTR
🇹🇷 TURKISH
NEARUSDT 1-hour chart shows a **STRONG BEARISH** trend (score 2) and an active **SHORT** signal. Current price **4.591**, RSI **31.99** (near the oversold zone). EMA20 **4.811**, EMA50 **4.905**, EMA200 **4.966** – price is below all moving averages. MACD **-0.078** (signal **-0.054**, histogram **-0.025**) confirms negative momentum. ATR **0.108**, support **4.557**, resistance **5.338**. Volume is 13% above average (5.58M vs 4.96M).
**ATR-based SHORT scenario (not guaranteed):**
- Entry range: **4.5747 – 4.6073** (mid **4.591**)
- Stop-Loss: **4.7373**
- TP1: **4.4826** | TP2: **4.4285** | TP3: **4.3743** | TP4: **4.2659**
Risk: RSI is near the bottom, so there is a risk of a short-term reversal; the stop-loss should account for the ATR range.
Question: Which confirmation candle are you waiting for before entering a short position at these levels?
🇬🇧 ENGLISH
NEARUSDT 1H shows a **STRONG BEARISH** trend (score 2) with a confirmed **SHORT** signal. Current price **4.591**, RSI **31.99** near oversold. EMA20 **4.811**, EMA50 **4.905**, EMA200 **4.966** – price below all MAs. MACD **-0.078** (signal **-0.054**, hist **-0.025**) confirms bearish momentum. ATR **0.108**, support **4.557**, resistance **5.338**. Volume 13% above average (5.58M vs 4.96M).
**ATR-based SHORT scenario (not guaranteed):**
- Entry range: **4.5747 – 4.6073** (mid **4.591**)
- Stop-Loss: **4.7373**
- TP1: **4.4826** | TP2: **4.4285** | TP3: **4.3743** | TP4: **4.2659**
Risk: RSI at lows, bounce risk exists; protect with ATR-based stop.
Question: Which confirmation candle are you waiting for before entering short at these levels?
#NEARUSDT #SHORT #Futures #TeknikAnaliz #CryptoTR
40
NEARUSDT 1-Hour SHORT Signal: Risk Management with ATR-Based Levels | NEARUSDT 1H SHORT Signal: ATR-Based Levels for Risk Management
🇹🇷 TURKISH
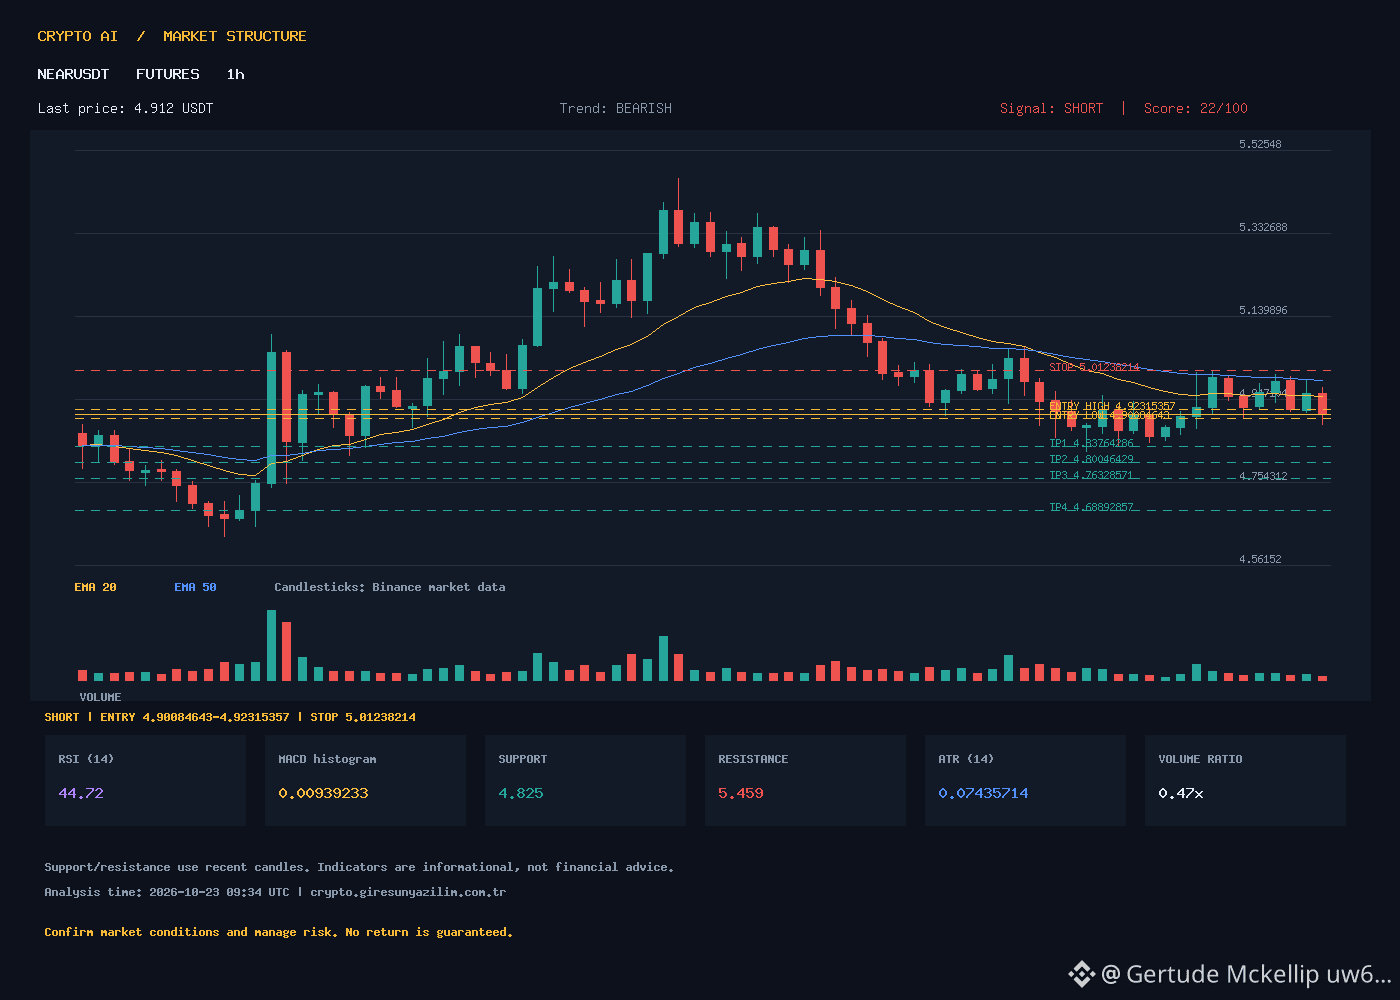
The BEARISH trend (score 22/100) continues on the NEARUSDT 1-hour chart. The current price is 4.912, below EMA20 (4.952) and EMA50 (4.994); EMA200 (5.013) is also overhead, acting as resistance. RSI is 44.72, in the neutral-bearish zone. The MACD histogram is positive (+0.0094), but the MACD line is below the signal line (-0.0243 vs -0.0337). Volume is at 47% of average (2.08M vs 4.43M average) — weak participation. Support is 4.825, resistance is 5.459. ATR is 0.0744.
The SHORT signal is confirmed. ATR-based illustrative levels (not guaranteed):
- Entry zone: 4.9008 – 4.9232 (midpoint 4.912)
- Stop-Loss: 5.0124
- TP1: 4.8376 | TP2: 4.8005 | TP3: 4.7633 | TP4: 4.6889
Risk/reward is around 1:1.3. Low volume increases the risk of a failed breakout. The EMA20/EMA50 crossover is approaching — could momentum be shifting?
🇬🇧 ENGLISH
NEARUSDT 1H chart shows BEARISH trend (score 22/100). Price 4.912 sits below EMA20 (4.952) and EMA50 (4.994); EMA200 (5.013) caps upside. RSI 44.72 neutral-bearish, MACD histogram positive (+0.0094) yet MACD line below signal (-0.0243 vs -0.0337). Volume at 47% of average (2.08M vs 4.43M avg) – weak participation. Support 4.825, resistance 5.459. ATR 0.0744.
SHORT signal confirmed. ATR-based illustrative levels (not guaranteed):
- Entry zone: 4.9008 – 4.9232 (mid 4.912)
- Stop-Loss: 5.0124
- TP1: 4.8376 | TP2: 4.8005 | TP3: 4.7633 | TP4: 4.6889
Risk/reward ~1:1.3. Low volume raises breakout-failure risk. EMA20/EMA50 convergence nearing – could momentum shift?
#NEARUSDT #NEAR #BinanceFutures #KriptoAnaliz #TechnicalAnalysis
NEARUSDT 1-Hour SHORT Signal: Risk Management with ATR-Based Levels | NEARUSDT 1H SHORT Signal: ATR-Based Levels for Risk Management
🇹🇷 TURKISH
The BEARISH trend (score 22/100) continues on the NEARUSDT 1-hour chart. The current price is 4.912, below EMA20 (4.952) and EMA50 (4.994); EMA200 (5.013) is also overhead, acting as resistance. RSI is 44.72, in the neutral-bearish zone. The MACD histogram is positive (+0.0094), but the MACD line is below the signal line (-0.0243 vs -0.0337). Volume is at 47% of average (2.08M vs 4.43M average) — weak participation. Support is 4.825, resistance is 5.459. ATR is 0.0744.
The SHORT signal is confirmed. ATR-based illustrative levels (not guaranteed):
- Entry zone: 4.9008 – 4.9232 (midpoint 4.912)
- Stop-Loss: 5.0124
- TP1: 4.8376 | TP2: 4.8005 | TP3: 4.7633 | TP4: 4.6889
Risk/reward is around 1:1.3. Low volume increases the risk of a failed breakout. The EMA20/EMA50 crossover is approaching — could momentum be shifting?
🇬🇧 ENGLISH
NEARUSDT 1H chart shows BEARISH trend (score 22/100). Price 4.912 sits below EMA20 (4.952) and EMA50 (4.994); EMA200 (5.013) caps upside. RSI 44.72 neutral-bearish, MACD histogram positive (+0.0094) yet MACD line below signal (-0.0243 vs -0.0337). Volume at 47% of average (2.08M vs 4.43M avg) – weak participation. Support 4.825, resistance 5.459. ATR 0.0744.
SHORT signal confirmed. ATR-based illustrative levels (not guaranteed):
- Entry zone: 4.9008 – 4.9232 (mid 4.912)
- Stop-Loss: 5.0124
- TP1: 4.8376 | TP2: 4.8005 | TP3: 4.7633 | TP4: 4.6889
Risk/reward ~1:1.3. Low volume raises breakout-failure risk. EMA20/EMA50 convergence nearing – could momentum shift?
#NEARUSDT #NEAR #BinanceFutures #KriptoAnaliz #TechnicalAnalysis
🇹🇷 TURKISH
The BEARISH trend (score 22/100) continues on the NEARUSDT 1-hour chart. The current price is 4.912, below EMA20 (4.952) and EMA50 (4.994); EMA200 (5.013) is also overhead, acting as resistance. RSI is 44.72, in the neutral-bearish zone. The MACD histogram is positive (+0.0094), but the MACD line is below the signal line (-0.0243 vs -0.0337). Volume is at 47% of average (2.08M vs 4.43M average) — weak participation. Support is 4.825, resistance is 5.459. ATR is 0.0744.
The SHORT signal is confirmed. ATR-based illustrative levels (not guaranteed):
- Entry zone: 4.9008 – 4.9232 (midpoint 4.912)
- Stop-Loss: 5.0124
- TP1: 4.8376 | TP2: 4.8005 | TP3: 4.7633 | TP4: 4.6889
Risk/reward is around 1:1.3. Low volume increases the risk of a failed breakout. The EMA20/EMA50 crossover is approaching — could momentum be shifting?
🇬🇧 ENGLISH
NEARUSDT 1H chart shows BEARISH trend (score 22/100). Price 4.912 sits below EMA20 (4.952) and EMA50 (4.994); EMA200 (5.013) caps upside. RSI 44.72 neutral-bearish, MACD histogram positive (+0.0094) yet MACD line below signal (-0.0243 vs -0.0337). Volume at 47% of average (2.08M vs 4.43M avg) – weak participation. Support 4.825, resistance 5.459. ATR 0.0744.
SHORT signal confirmed. ATR-based illustrative levels (not guaranteed):
- Entry zone: 4.9008 – 4.9232 (mid 4.912)
- Stop-Loss: 5.0124
- TP1: 4.8376 | TP2: 4.8005 | TP3: 4.7633 | TP4: 4.6889
Risk/reward ~1:1.3. Low volume raises breakout-failure risk. EMA20/EMA50 convergence nearing – could momentum shift?
#NEARUSDT #NEAR #BinanceFutures #KriptoAnaliz #TechnicalAnalysis
1
BTC/USDT 1‑Hour Short Signal | BTC/USDT 1‑Hour Short Signal
🇹🇷 TURKISH
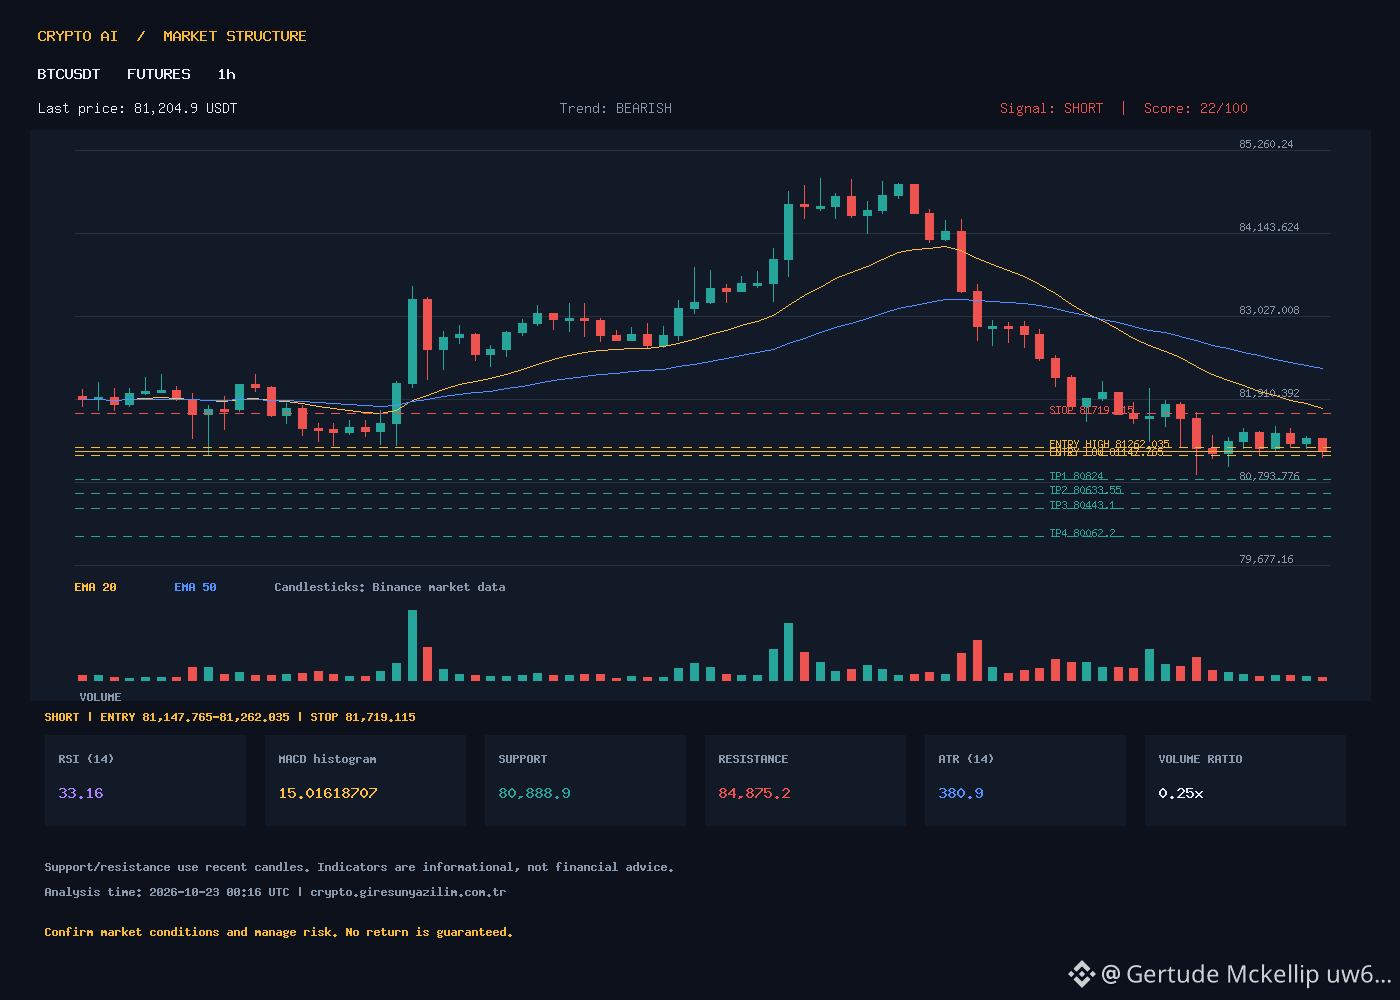
Signal: SHORT, 1-hour timeframe. Current price 81204.9, RSI 33, EMA20 81783.92, EMA50 82322.30, EMA200 82354.55, MACD -472.2 (signal -487.2), ATR 380.9. Trend BEARISH, score 22. Low volume (1663) with a ratio of 0.25. Support 80888.9, resistance 84875.2. Trade plan: SHORT, entry range 81147.765‑81262.035, stop-loss 81719.115, TP1 80824, TP2 80633.55, TP3 80443.1, TP4 80062.2. These levels are illustrative ATR-based scenarios, not guaranteed outcomes. Could the price test the 80888 support level and fall further?
🇬🇧 ENGLISH
Signal: SHORT, 1‑hour timeframe. Current price 81204.9, RSI 33, EMA20 81783.92, EMA50 82322.30, EMA200 82354.55, MACD -472.2 (signal -487.2), ATR 380.9. Trend BEARISH, score 22. Low volume (1663) with ratio 0.25. Support 80888.9, resistance 84875.2. Trade plan: SHORT, entry range 81147.765‑81262.035, stop‑loss 81719.115, TP1 80824, TP2 80633.55, TP3 80443.1, TP4 80062.2. These levels are illustrative ATR‑based scenarios, not guaranteed outcomes. Could the price break below the 80888 support?
#BTCUSDT #BinanceFutures #TeknikAnaliz #Short #Crypto
BTC/USDT 1‑Hour Short Signal | BTC/USDT 1‑Hour Short Signal
🇹🇷 TURKISH
Signal: SHORT, 1-hour timeframe. Current price 81204.9, RSI 33, EMA20 81783.92, EMA50 82322.30, EMA200 82354.55, MACD -472.2 (signal -487.2), ATR 380.9. Trend BEARISH, score 22. Low volume (1663) with a ratio of 0.25. Support 80888.9, resistance 84875.2. Trade plan: SHORT, entry range 81147.765‑81262.035, stop-loss 81719.115, TP1 80824, TP2 80633.55, TP3 80443.1, TP4 80062.2. These levels are illustrative ATR-based scenarios, not guaranteed outcomes. Could the price test the 80888 support level and fall further?
🇬🇧 ENGLISH
Signal: SHORT, 1‑hour timeframe. Current price 81204.9, RSI 33, EMA20 81783.92, EMA50 82322.30, EMA200 82354.55, MACD -472.2 (signal -487.2), ATR 380.9. Trend BEARISH, score 22. Low volume (1663) with ratio 0.25. Support 80888.9, resistance 84875.2. Trade plan: SHORT, entry range 81147.765‑81262.035, stop‑loss 81719.115, TP1 80824, TP2 80633.55, TP3 80443.1, TP4 80062.2. These levels are illustrative ATR‑based scenarios, not guaranteed outcomes. Could the price break below the 80888 support?
#BTCUSDT #BinanceFutures #TeknikAnaliz #Short #Crypto
🇹🇷 TURKISH
Signal: SHORT, 1-hour timeframe. Current price 81204.9, RSI 33, EMA20 81783.92, EMA50 82322.30, EMA200 82354.55, MACD -472.2 (signal -487.2), ATR 380.9. Trend BEARISH, score 22. Low volume (1663) with a ratio of 0.25. Support 80888.9, resistance 84875.2. Trade plan: SHORT, entry range 81147.765‑81262.035, stop-loss 81719.115, TP1 80824, TP2 80633.55, TP3 80443.1, TP4 80062.2. These levels are illustrative ATR-based scenarios, not guaranteed outcomes. Could the price test the 80888 support level and fall further?
🇬🇧 ENGLISH
Signal: SHORT, 1‑hour timeframe. Current price 81204.9, RSI 33, EMA20 81783.92, EMA50 82322.30, EMA200 82354.55, MACD -472.2 (signal -487.2), ATR 380.9. Trend BEARISH, score 22. Low volume (1663) with ratio 0.25. Support 80888.9, resistance 84875.2. Trade plan: SHORT, entry range 81147.765‑81262.035, stop‑loss 81719.115, TP1 80824, TP2 80633.55, TP3 80443.1, TP4 80062.2. These levels are illustrative ATR‑based scenarios, not guaranteed outcomes. Could the price break below the 80888 support?
#BTCUSDT #BinanceFutures #TeknikAnaliz #Short #Crypto
65
HYPE/USDT 1‑hour Short Position | HYPE/USDT 1‑hour Short Position
🇹🇷 TURKISH
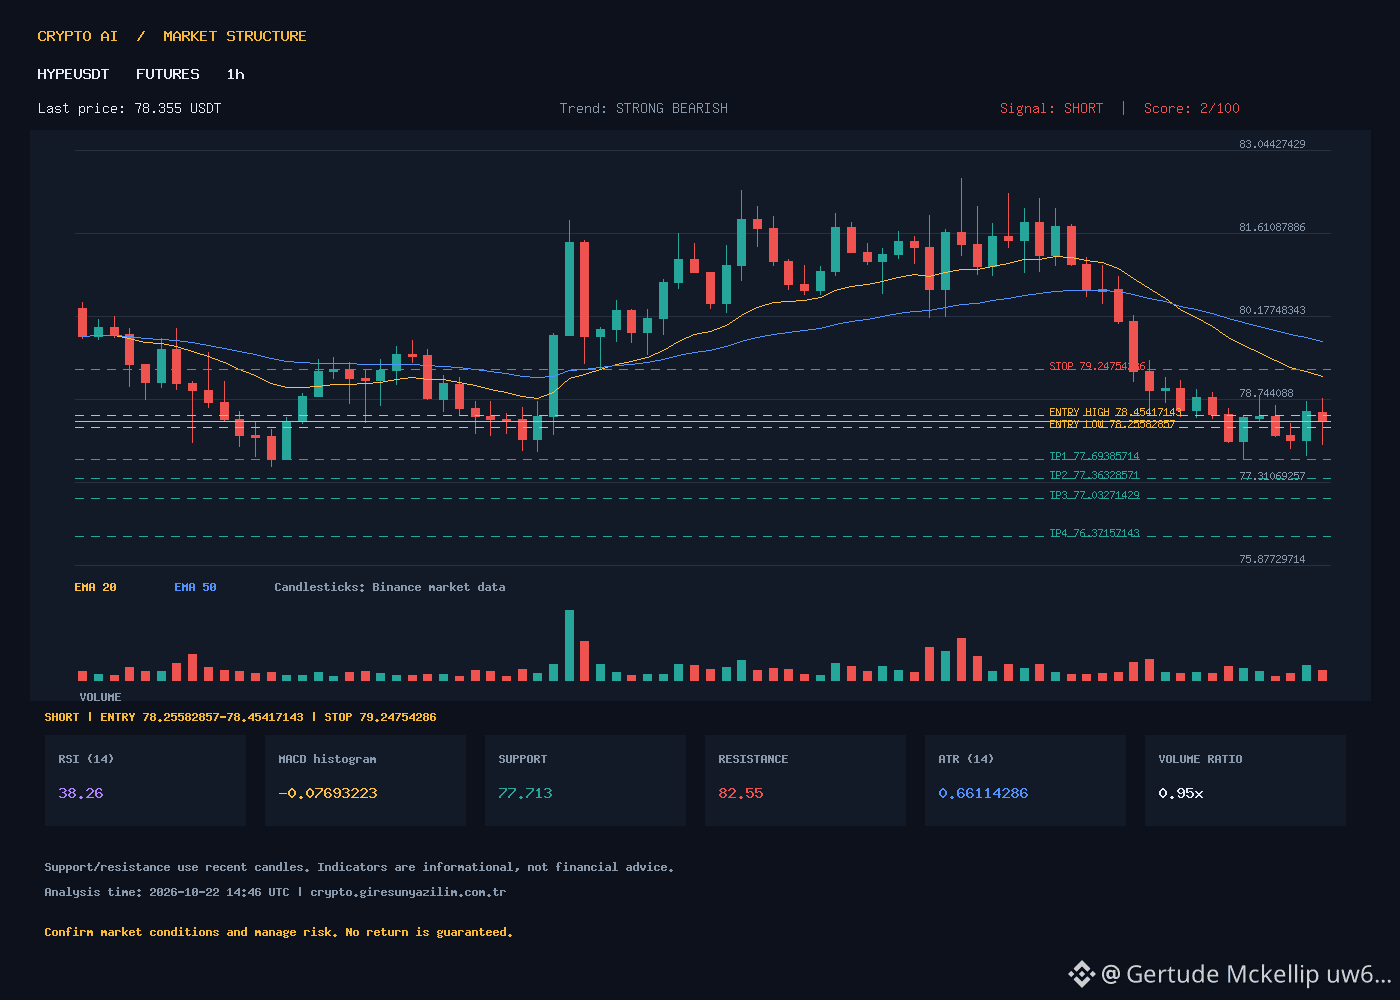
Signal: SHORT (1 hour). Trend: STRONG BEARISH, score 2. Current price 78.355, RSI 38.26, EMA20 79.13045499, EMA50 79.70711486, EMA200 80.39023422. MACD -0.67541695, signal -0.59848472, histogram -0.07693223, ATR 0.66114286. Volume 221 910 (below average 234 800). Support 77.713, resistance 82.55. Trade plan: SHORT, entry 78.25582857‑78.45417143, stop‑loss 79.24754286, TP1 77.69385714, TP2 77.36328571, TP3 77.03271429, TP4 76.37157143. These are ATR-based illustrative levels; not a guaranteed outcome. Risk: price could rebound above EMA20. Question: Could there be a short-term reversal before the price breaks the 77.713 support and reaches TP4?
🇬🇧 ENGLISH
Signal: SHORT on the 1‑hour chart. Trend: STRONG BEARISH, score 2. Current price 78.355, RSI 38.26, EMA20 79.13045499, EMA50 79.70711486, EMA200 80.39023422. MACD -0.67541695, signal -0.59848472, histogram -0.07693223, ATR 0.66114286. Volume 221 910 (average 234 800). Support 77.713, resistance 82.55. Trade plan: SHORT, entry 78.25582857‑78.45417143, stop‑loss 79.24754286, TP1 77.69385714, TP2 77.36328571, TP3 77.03271429, TP4 76.37157143. These are ATR‑based illustrative levels; not a guaranteed outcome. Risk: price could rebound above EMA20 before reaching targets. Question: Could the price break the 77.713 support before reaching TP4, or will a short‑term rebound occur?
#HYPE #BinanceFutures #TeknikAnaliz #Kripto #Short
HYPE/USDT 1‑hour Short Position | HYPE/USDT 1‑hour Short Position
🇹🇷 TURKISH
Signal: SHORT (1 hour). Trend: STRONG BEARISH, score 2. Current price 78.355, RSI 38.26, EMA20 79.13045499, EMA50 79.70711486, EMA200 80.39023422. MACD -0.67541695, signal -0.59848472, histogram -0.07693223, ATR 0.66114286. Volume 221 910 (below average 234 800). Support 77.713, resistance 82.55. Trade plan: SHORT, entry 78.25582857‑78.45417143, stop‑loss 79.24754286, TP1 77.69385714, TP2 77.36328571, TP3 77.03271429, TP4 76.37157143. These are ATR-based illustrative levels; not a guaranteed outcome. Risk: price could rebound above EMA20. Question: Could there be a short-term reversal before the price breaks the 77.713 support and reaches TP4?
🇬🇧 ENGLISH
Signal: SHORT on the 1‑hour chart. Trend: STRONG BEARISH, score 2. Current price 78.355, RSI 38.26, EMA20 79.13045499, EMA50 79.70711486, EMA200 80.39023422. MACD -0.67541695, signal -0.59848472, histogram -0.07693223, ATR 0.66114286. Volume 221 910 (average 234 800). Support 77.713, resistance 82.55. Trade plan: SHORT, entry 78.25582857‑78.45417143, stop‑loss 79.24754286, TP1 77.69385714, TP2 77.36328571, TP3 77.03271429, TP4 76.37157143. These are ATR‑based illustrative levels; not a guaranteed outcome. Risk: price could rebound above EMA20 before reaching targets. Question: Could the price break the 77.713 support before reaching TP4, or will a short‑term rebound occur?
#HYPE #BinanceFutures #TeknikAnaliz #Kripto #Short
🇹🇷 TURKISH
Signal: SHORT (1 hour). Trend: STRONG BEARISH, score 2. Current price 78.355, RSI 38.26, EMA20 79.13045499, EMA50 79.70711486, EMA200 80.39023422. MACD -0.67541695, signal -0.59848472, histogram -0.07693223, ATR 0.66114286. Volume 221 910 (below average 234 800). Support 77.713, resistance 82.55. Trade plan: SHORT, entry 78.25582857‑78.45417143, stop‑loss 79.24754286, TP1 77.69385714, TP2 77.36328571, TP3 77.03271429, TP4 76.37157143. These are ATR-based illustrative levels; not a guaranteed outcome. Risk: price could rebound above EMA20. Question: Could there be a short-term reversal before the price breaks the 77.713 support and reaches TP4?
🇬🇧 ENGLISH
Signal: SHORT on the 1‑hour chart. Trend: STRONG BEARISH, score 2. Current price 78.355, RSI 38.26, EMA20 79.13045499, EMA50 79.70711486, EMA200 80.39023422. MACD -0.67541695, signal -0.59848472, histogram -0.07693223, ATR 0.66114286. Volume 221 910 (average 234 800). Support 77.713, resistance 82.55. Trade plan: SHORT, entry 78.25582857‑78.45417143, stop‑loss 79.24754286, TP1 77.69385714, TP2 77.36328571, TP3 77.03271429, TP4 76.37157143. These are ATR‑based illustrative levels; not a guaranteed outcome. Risk: price could rebound above EMA20 before reaching targets. Question: Could the price break the 77.713 support before reaching TP4, or will a short‑term rebound occur?
#HYPE #BinanceFutures #TeknikAnaliz #Kripto #Short

·
--
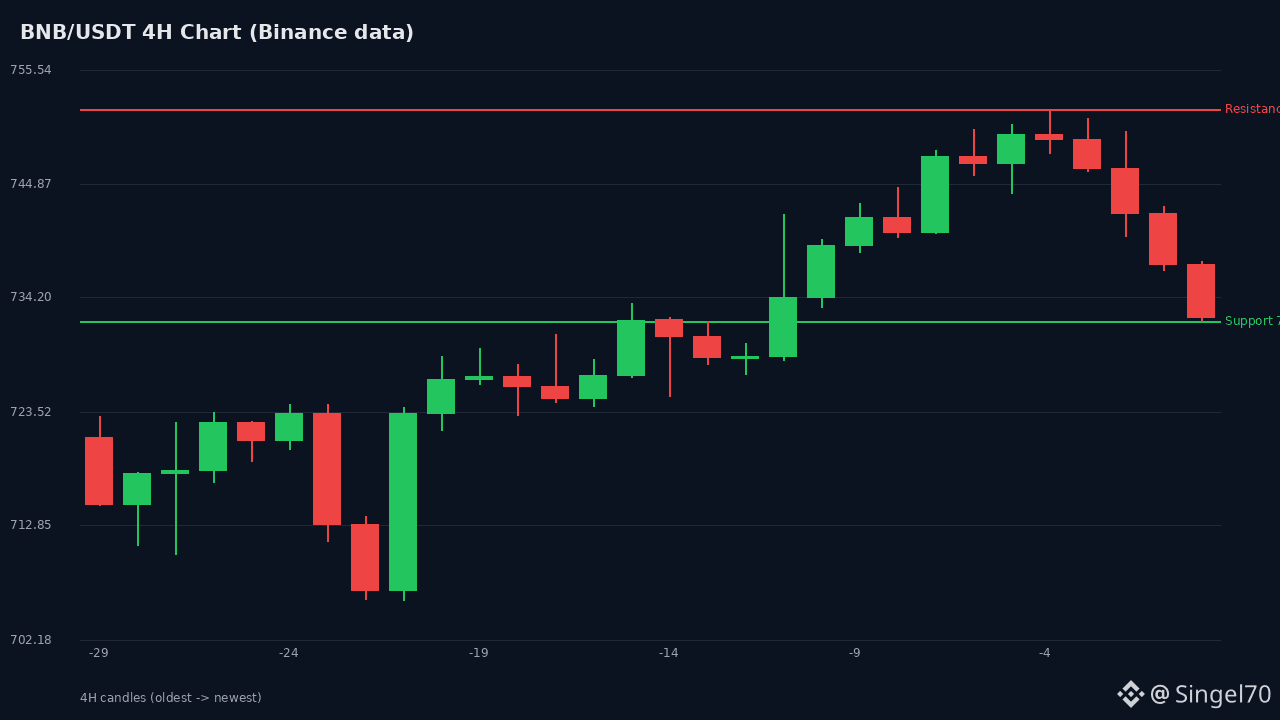
BNBUSDT 4H TECHNICAL ANALYSIS (Live Binance data)
Price: 732.40 USDT
24h change: -1.80% | 24h range: 732.00 - 751.86
Indicators (4H, 100 candles):
• RSI(14): 52.0 — neutral, weak direction
• SMA10: 743.30 | SMA20: 736.54 — price is below both (short-term pressure)
• EMA12: 739.46 | EMA26: 735.75 — EMA12 is slightly higher, but the gap is narrowing
• MACD: 3.71 / signal 3.71 / histogram 0.0 — momentum has reset to zero, indecision
• Bollinger Bands: upper 753.48 | middle 736.54 | lower 719.60 — price has dipped below the middle band
• Stochastic %K: 21.7 — in the lower zone, with potential for a rebound
• ATR(14): 6.08 USDT (~0.83%) — volatility is relatively low
Support / Resistance:
Support: 723.19 → 719.60 (lower BB) → 708.48 (major weekly support)
Resistance: 736.54 (SMA20) → 743.30 (SMA10) → 751.86 (24h high) → 770
Latest News:
• BNB Chain completed its 37th quarterly burn: 1.646 million BNB (≈$1.2 billion) was removed from circulation; supply fell to 131.51 million.
• BNB Standard (Nasdaq: BNC) will ring the Nasdaq opening bell on October 26; institutional visibility is increasing.
• The Jenner upgrade is scheduled for testnet on October 29: the CAS20 token standard and payment rails are coming; the NewL1 testnet is targeted for year-end.
Scenario and Probability:
• 55% — hold in the 719–723 range and rebound to 736–743 (low Stoch + spot outflows provide support)
• 45% — pull back to 708–706 with a daily close below 719.60
Plan:
• Buying interest: scale in around 723–720, stop below 714, first target 736, second target 743
• Breakout: if a 4H candle closes above 743, the 751–770 target range opens up; stop below 736
• Risk: 1–2% of capital per trade; since ATR is low, don't set the stop too tight
• Invalidation: a 4H close below 708.48 invalidates the scenario
Note: For educational purposes only; not financial advice.
#BNB #BNBUSDT #Kripto #TeknikAnaliz #BinanceSquare
BNBUSDT 4H TECHNICAL ANALYSIS (Live Binance data)
Price: 732.40 USDT
24h change: -1.80% | 24h range: 732.00 - 751.86
Indicators (4H, 100 candles):
• RSI(14): 52.0 — neutral, weak direction
• SMA10: 743.30 | SMA20: 736.54 — price is below both (short-term pressure)
• EMA12: 739.46 | EMA26: 735.75 — EMA12 is slightly higher, but the gap is narrowing
• MACD: 3.71 / signal 3.71 / histogram 0.0 — momentum has reset to zero, indecision
• Bollinger Bands: upper 753.48 | middle 736.54 | lower 719.60 — price has dipped below the middle band
• Stochastic %K: 21.7 — in the lower zone, with potential for a rebound
• ATR(14): 6.08 USDT (~0.83%) — volatility is relatively low
Support / Resistance:
Support: 723.19 → 719.60 (lower BB) → 708.48 (major weekly support)
Resistance: 736.54 (SMA20) → 743.30 (SMA10) → 751.86 (24h high) → 770
Latest News:
• BNB Chain completed its 37th quarterly burn: 1.646 million BNB (≈$1.2 billion) was removed from circulation; supply fell to 131.51 million.
• BNB Standard (Nasdaq: BNC) will ring the Nasdaq opening bell on October 26; institutional visibility is increasing.
• The Jenner upgrade is scheduled for testnet on October 29: the CAS20 token standard and payment rails are coming; the NewL1 testnet is targeted for year-end.
Scenario and Probability:
• 55% — hold in the 719–723 range and rebound to 736–743 (low Stoch + spot outflows provide support)
• 45% — pull back to 708–706 with a daily close below 719.60
Plan:
• Buying interest: scale in around 723–720, stop below 714, first target 736, second target 743
• Breakout: if a 4H candle closes above 743, the 751–770 target range opens up; stop below 736
• Risk: 1–2% of capital per trade; since ATR is low, don't set the stop too tight
• Invalidation: a 4H close below 708.48 invalidates the scenario
Note: For educational purposes only; not financial advice.
#BNB #BNBUSDT #Kripto #TeknikAnaliz #BinanceSquare
Price: 732.40 USDT
24h change: -1.80% | 24h range: 732.00 - 751.86
Indicators (4H, 100 candles):
• RSI(14): 52.0 — neutral, weak direction
• SMA10: 743.30 | SMA20: 736.54 — price is below both (short-term pressure)
• EMA12: 739.46 | EMA26: 735.75 — EMA12 is slightly higher, but the gap is narrowing
• MACD: 3.71 / signal 3.71 / histogram 0.0 — momentum has reset to zero, indecision
• Bollinger Bands: upper 753.48 | middle 736.54 | lower 719.60 — price has dipped below the middle band
• Stochastic %K: 21.7 — in the lower zone, with potential for a rebound
• ATR(14): 6.08 USDT (~0.83%) — volatility is relatively low
Support / Resistance:
Support: 723.19 → 719.60 (lower BB) → 708.48 (major weekly support)
Resistance: 736.54 (SMA20) → 743.30 (SMA10) → 751.86 (24h high) → 770
Latest News:
• BNB Chain completed its 37th quarterly burn: 1.646 million BNB (≈$1.2 billion) was removed from circulation; supply fell to 131.51 million.
• BNB Standard (Nasdaq: BNC) will ring the Nasdaq opening bell on October 26; institutional visibility is increasing.
• The Jenner upgrade is scheduled for testnet on October 29: the CAS20 token standard and payment rails are coming; the NewL1 testnet is targeted for year-end.
Scenario and Probability:
• 55% — hold in the 719–723 range and rebound to 736–743 (low Stoch + spot outflows provide support)
• 45% — pull back to 708–706 with a daily close below 719.60
Plan:
• Buying interest: scale in around 723–720, stop below 714, first target 736, second target 743
• Breakout: if a 4H candle closes above 743, the 751–770 target range opens up; stop below 736
• Risk: 1–2% of capital per trade; since ATR is low, don't set the stop too tight
• Invalidation: a 4H close below 708.48 invalidates the scenario
Note: For educational purposes only; not financial advice.
#BNB #BNBUSDT #Kripto #TeknikAnaliz #BinanceSquare
1
4
·
--
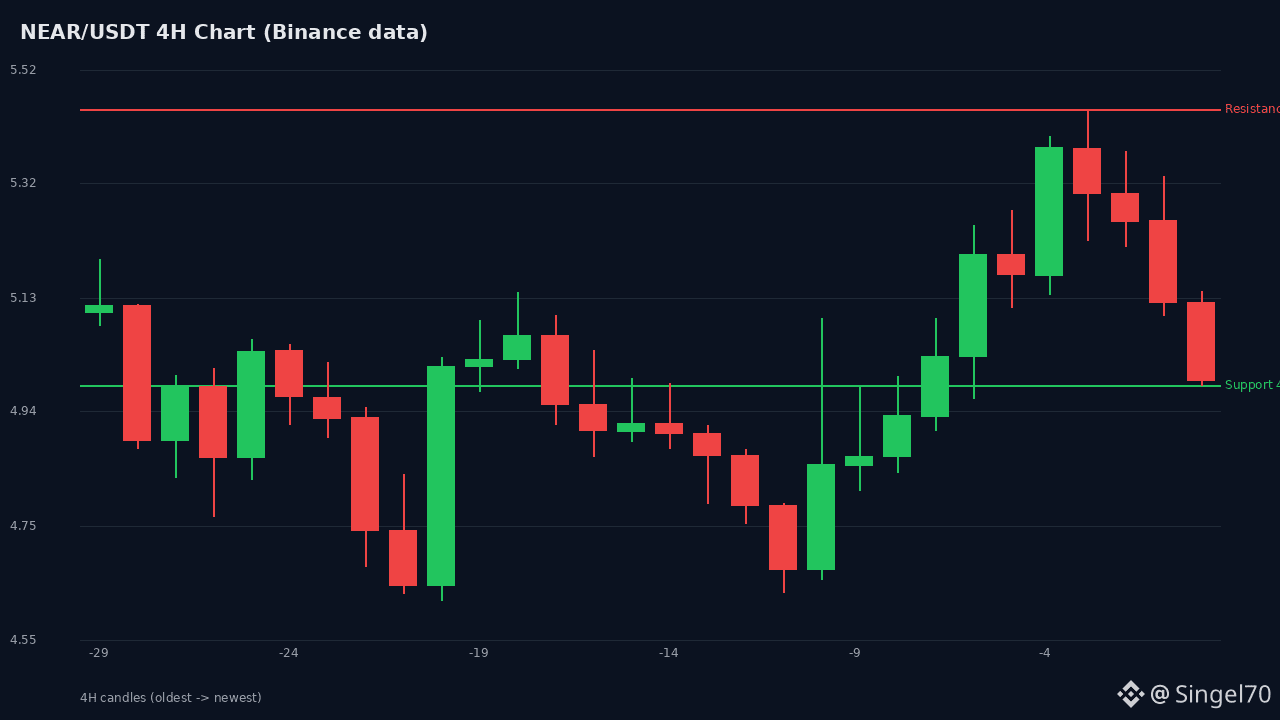
NEAR/USDT 4H Technical Analysis | Binance, Oct 22, 2026 06:36 UTC
Price 4.993 USDT | 24h -0.85% | range 4.985-5.451 | volume 172.8M USDT
TREND (100 x 4H)
Price is below the main averages: SMA20 5.012 | SMA50 5.001 | EMA12 5.096 | EMA26 5.044 | EMA100 5.079 | EMA200 5.118. 4H is weak; the daily structure is strong.
MOMENTUM
RSI14 53.2 (Wilder 48.1) → neutral, no overbought/oversold conditions.
MACD +0.0513 / signal +0.0294 / histogram +0.0219 → positive, but contracting for 3 bars (0.0612→0.0219).
Stochastic %K 43.9, %D 60.3 → %K below %D, selling pressure.
VOLATILITY
ATR14 0.2051 = 4.11% of price. Bollinger 5.381 / 5.012 / 4.642, %B 0.475. Last 4H volume 2.65M vs. 20-period average 5.02M (0.53x) → volume is drying up during the decline.
LEVELS
Support 4.938 (Fib 61.8%) / 4.90 (HVN) / 4.799 (Fib 78.6%) / 4.62 (lower BB) / 4.301 (100-candle low)
Resistance 5.012-5.036 (SMA20 + Fib 50%) / 5.096-5.134 (EMA12 + Fib 38.2%) / 5.255 (Fib 23.6%) / 5.451 (24h high) / 6.00 (100-candle high)
SIGNAL PROBABILITY (24 hours, 4H close; σ 2.39%/candle, random walk + drift model)
Touch 5.13: 59% | touch 4.90: 79% (close: 44%) | 5.26: 32% | 4.80: 56% | 5.45: 11%
24h close above 4.993: 43% | 72h: 5.13: 72%, 4.62: 55% | 7 days: 5.45: 43%, 4.62: 74%
PLAN
Signal: WAIT / PARTIAL BUY — short-term indecision, medium-term positive.
Entry at 4.94 / 4.90 / 4.80 in stages (40%/30%/30%) | Stop on a 4H close below 4.60 (~2 ATR)
Targets 5.13 → 5.45 → 5.75-6.00 | Position size max 2-3%, no leverage
Trigger: 4H close above 5.13 + volume above the 20-period average = buy confirmation; below 4.90 = wait
NEWS
- Oct 20: Confidential Intents TVL ~160M$ (Q3 +463%), Q3 volume $10.4B, total $32B, $52M+ in fees, $8M+ in buybacks.
- Oct 20: House of Stake HSP-029 vote aims to reduce emissions from 2.5%→1.6% (voting closes Nov 2). NEAR Business multisig treasury platform launched.
- Oct 19-20: Bitwise NEAR ETF (NRR) saw inflows for 3 consecutive days, cumulative ~88.5M$. Oct 16: 3.8M$ Intents exploit postmortem, full compensation.
Note: For educational purposes only; not financial advice.
#NEAR #NEARUSDT #BinanceSquare #TeknikAnaliz #Crypto
NEAR/USDT 4H Technical Analysis | Binance, Oct 22, 2026 06:36 UTC
Price 4.993 USDT | 24h -0.85% | range 4.985-5.451 | volume 172.8M USDT
TREND (100 x 4H)
Price is below the main averages: SMA20 5.012 | SMA50 5.001 | EMA12 5.096 | EMA26 5.044 | EMA100 5.079 | EMA200 5.118. 4H is weak; the daily structure is strong.
MOMENTUM
RSI14 53.2 (Wilder 48.1) → neutral, no overbought/oversold conditions.
MACD +0.0513 / signal +0.0294 / histogram +0.0219 → positive, but contracting for 3 bars (0.0612→0.0219).
Stochastic %K 43.9, %D 60.3 → %K below %D, selling pressure.
VOLATILITY
ATR14 0.2051 = 4.11% of price. Bollinger 5.381 / 5.012 / 4.642, %B 0.475. Last 4H volume 2.65M vs. 20-period average 5.02M (0.53x) → volume is drying up during the decline.
LEVELS
Support 4.938 (Fib 61.8%) / 4.90 (HVN) / 4.799 (Fib 78.6%) / 4.62 (lower BB) / 4.301 (100-candle low)
Resistance 5.012-5.036 (SMA20 + Fib 50%) / 5.096-5.134 (EMA12 + Fib 38.2%) / 5.255 (Fib 23.6%) / 5.451 (24h high) / 6.00 (100-candle high)
SIGNAL PROBABILITY (24 hours, 4H close; σ 2.39%/candle, random walk + drift model)
Touch 5.13: 59% | touch 4.90: 79% (close: 44%) | 5.26: 32% | 4.80: 56% | 5.45: 11%
24h close above 4.993: 43% | 72h: 5.13: 72%, 4.62: 55% | 7 days: 5.45: 43%, 4.62: 74%
PLAN
Signal: WAIT / PARTIAL BUY — short-term indecision, medium-term positive.
Entry at 4.94 / 4.90 / 4.80 in stages (40%/30%/30%) | Stop on a 4H close below 4.60 (~2 ATR)
Targets 5.13 → 5.45 → 5.75-6.00 | Position size max 2-3%, no leverage
Trigger: 4H close above 5.13 + volume above the 20-period average = buy confirmation; below 4.90 = wait
NEWS
- Oct 20: Confidential Intents TVL ~160M$ (Q3 +463%), Q3 volume $10.4B, total $32B, $52M+ in fees, $8M+ in buybacks.
- Oct 20: House of Stake HSP-029 vote aims to reduce emissions from 2.5%→1.6% (voting closes Nov 2). NEAR Business multisig treasury platform launched.
- Oct 19-20: Bitwise NEAR ETF (NRR) saw inflows for 3 consecutive days, cumulative ~88.5M$. Oct 16: 3.8M$ Intents exploit postmortem, full compensation.
Note: For educational purposes only; not financial advice.
#NEAR #NEARUSDT #BinanceSquare #TeknikAnaliz #Crypto
Price 4.993 USDT | 24h -0.85% | range 4.985-5.451 | volume 172.8M USDT
TREND (100 x 4H)
Price is below the main averages: SMA20 5.012 | SMA50 5.001 | EMA12 5.096 | EMA26 5.044 | EMA100 5.079 | EMA200 5.118. 4H is weak; the daily structure is strong.
MOMENTUM
RSI14 53.2 (Wilder 48.1) → neutral, no overbought/oversold conditions.
MACD +0.0513 / signal +0.0294 / histogram +0.0219 → positive, but contracting for 3 bars (0.0612→0.0219).
Stochastic %K 43.9, %D 60.3 → %K below %D, selling pressure.
VOLATILITY
ATR14 0.2051 = 4.11% of price. Bollinger 5.381 / 5.012 / 4.642, %B 0.475. Last 4H volume 2.65M vs. 20-period average 5.02M (0.53x) → volume is drying up during the decline.
LEVELS
Support 4.938 (Fib 61.8%) / 4.90 (HVN) / 4.799 (Fib 78.6%) / 4.62 (lower BB) / 4.301 (100-candle low)
Resistance 5.012-5.036 (SMA20 + Fib 50%) / 5.096-5.134 (EMA12 + Fib 38.2%) / 5.255 (Fib 23.6%) / 5.451 (24h high) / 6.00 (100-candle high)
SIGNAL PROBABILITY (24 hours, 4H close; σ 2.39%/candle, random walk + drift model)
Touch 5.13: 59% | touch 4.90: 79% (close: 44%) | 5.26: 32% | 4.80: 56% | 5.45: 11%
24h close above 4.993: 43% | 72h: 5.13: 72%, 4.62: 55% | 7 days: 5.45: 43%, 4.62: 74%
PLAN
Signal: WAIT / PARTIAL BUY — short-term indecision, medium-term positive.
Entry at 4.94 / 4.90 / 4.80 in stages (40%/30%/30%) | Stop on a 4H close below 4.60 (~2 ATR)
Targets 5.13 → 5.45 → 5.75-6.00 | Position size max 2-3%, no leverage
Trigger: 4H close above 5.13 + volume above the 20-period average = buy confirmation; below 4.90 = wait
NEWS
- Oct 20: Confidential Intents TVL ~160M$ (Q3 +463%), Q3 volume $10.4B, total $32B, $52M+ in fees, $8M+ in buybacks.
- Oct 20: House of Stake HSP-029 vote aims to reduce emissions from 2.5%→1.6% (voting closes Nov 2). NEAR Business multisig treasury platform launched.
- Oct 19-20: Bitwise NEAR ETF (NRR) saw inflows for 3 consecutive days, cumulative ~88.5M$. Oct 16: 3.8M$ Intents exploit postmortem, full compensation.
Note: For educational purposes only; not financial advice.
#NEAR #NEARUSDT #BinanceSquare #TeknikAnaliz #Crypto
1
51
IOSTUSDT 1h Long Setup – ATR‑Based Targets | IOST/USDT 1h Long Setup – ATR‑Based Targets
🇹🇷 **TURKISH**
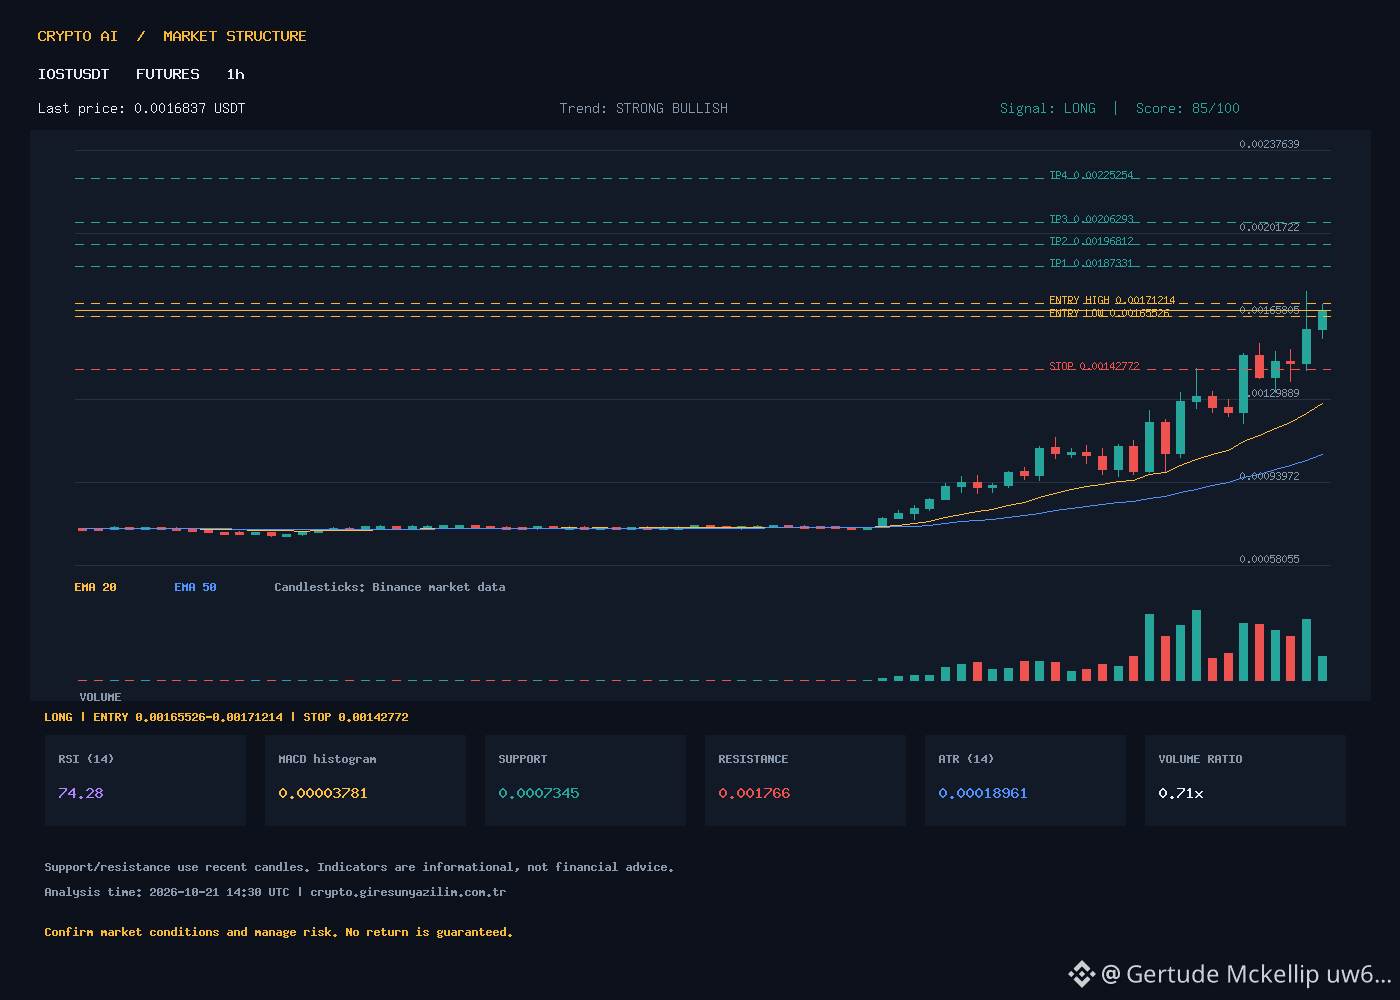
IOST/USDT 1h signal **LONG** (strong). Trend **STRONG BULLISH**, Score 85. Price **0.0016837**, RSI 74.28 (overbought). EMA20 0.00127957, EMA50 0.00106082, EMA200 0.00088006 (price above all EMAs). MACD 0.00017767, signal 0.00013986, histogram 3.781e‑5 (bullish). ATR 0.00018961. Volume 16.16 B (current), average 22.90 B, ratio 0.71. Support 0.0007345, Resistance 0.001766.
**Trade Plan (LONG):**
- Entry range: **0.00165526 – 0.00171214** (mid 0.0016837)
- Stop-loss: **0.00142772**
- TP1: **0.00187331**
- TP2: **0.00196812**
- TP3: **0.00206293**
- TP4: **0.00225254**
These levels are ATR-based illustrative scenarios, not guaranteed outcomes. Please pay attention to risk management.
**How do you view IOST's move given the current support and resistance levels?**
🇬🇧 **ENGLISH**
IOST/USDT 1h signal **LONG** (strong). Trend **STRONG BULLISH**, Score 85. Price **0.0016837**, RSI 74.28 (overbought). EMA20 0.00127957, EMA50 0.00106082, EMA200 0.00088006 (price above all EMAs). MACD 0.00017767, signal 0.00013986, histogram 3.781e‑5 (bullish). ATR 0.00018961. Volume 16.16 B (current), average 22.90 B, ratio 0.71. Support 0.0007345, Resistance 0.001766.
**Trade Plan (LONG):**
- Entry range: **0.00165526 – 0.00171214** (mid 0.0016837)
- Stop-loss: **0.00142772**
- TP1: **0.00187331**
- TP2: **0.00196812**
- TP3: **0.00206293**
- TP4: **0.00225254**
These levels are ATR-based illustrative scenarios, not guaranteed outcomes. Always use proper risk management.
**How do you view IOST's move given the current support and resistance levels?**
#BinanceFutures #IOST #IOSTUSDT #Kripto #TeknikAnaliz
IOSTUSDT 1h Long Setup – ATR‑Based Targets | IOST/USDT 1h Long Setup – ATR‑Based Targets
🇹🇷 **TURKISH**
IOST/USDT 1h signal **LONG** (strong). Trend **STRONG BULLISH**, Score 85. Price **0.0016837**, RSI 74.28 (overbought). EMA20 0.00127957, EMA50 0.00106082, EMA200 0.00088006 (price above all EMAs). MACD 0.00017767, signal 0.00013986, histogram 3.781e‑5 (bullish). ATR 0.00018961. Volume 16.16 B (current), average 22.90 B, ratio 0.71. Support 0.0007345, Resistance 0.001766.
**Trade Plan (LONG):**
- Entry range: **0.00165526 – 0.00171214** (mid 0.0016837)
- Stop-loss: **0.00142772**
- TP1: **0.00187331**
- TP2: **0.00196812**
- TP3: **0.00206293**
- TP4: **0.00225254**
These levels are ATR-based illustrative scenarios, not guaranteed outcomes. Please pay attention to risk management.
**How do you view IOST's move given the current support and resistance levels?**
🇬🇧 **ENGLISH**
IOST/USDT 1h signal **LONG** (strong). Trend **STRONG BULLISH**, Score 85. Price **0.0016837**, RSI 74.28 (overbought). EMA20 0.00127957, EMA50 0.00106082, EMA200 0.00088006 (price above all EMAs). MACD 0.00017767, signal 0.00013986, histogram 3.781e‑5 (bullish). ATR 0.00018961. Volume 16.16 B (current), average 22.90 B, ratio 0.71. Support 0.0007345, Resistance 0.001766.
**Trade Plan (LONG):**
- Entry range: **0.00165526 – 0.00171214** (mid 0.0016837)
- Stop-loss: **0.00142772**
- TP1: **0.00187331**
- TP2: **0.00196812**
- TP3: **0.00206293**
- TP4: **0.00225254**
These levels are ATR-based illustrative scenarios, not guaranteed outcomes. Always use proper risk management.
**How do you view IOST's move given the current support and resistance levels?**
#BinanceFutures #IOST #IOSTUSDT #Kripto #TeknikAnaliz
🇹🇷 **TURKISH**
IOST/USDT 1h signal **LONG** (strong). Trend **STRONG BULLISH**, Score 85. Price **0.0016837**, RSI 74.28 (overbought). EMA20 0.00127957, EMA50 0.00106082, EMA200 0.00088006 (price above all EMAs). MACD 0.00017767, signal 0.00013986, histogram 3.781e‑5 (bullish). ATR 0.00018961. Volume 16.16 B (current), average 22.90 B, ratio 0.71. Support 0.0007345, Resistance 0.001766.
**Trade Plan (LONG):**
- Entry range: **0.00165526 – 0.00171214** (mid 0.0016837)
- Stop-loss: **0.00142772**
- TP1: **0.00187331**
- TP2: **0.00196812**
- TP3: **0.00206293**
- TP4: **0.00225254**
These levels are ATR-based illustrative scenarios, not guaranteed outcomes. Please pay attention to risk management.
**How do you view IOST's move given the current support and resistance levels?**
🇬🇧 **ENGLISH**
IOST/USDT 1h signal **LONG** (strong). Trend **STRONG BULLISH**, Score 85. Price **0.0016837**, RSI 74.28 (overbought). EMA20 0.00127957, EMA50 0.00106082, EMA200 0.00088006 (price above all EMAs). MACD 0.00017767, signal 0.00013986, histogram 3.781e‑5 (bullish). ATR 0.00018961. Volume 16.16 B (current), average 22.90 B, ratio 0.71. Support 0.0007345, Resistance 0.001766.
**Trade Plan (LONG):**
- Entry range: **0.00165526 – 0.00171214** (mid 0.0016837)
- Stop-loss: **0.00142772**
- TP1: **0.00187331**
- TP2: **0.00196812**
- TP3: **0.00206293**
- TP4: **0.00225254**
These levels are ATR-based illustrative scenarios, not guaranteed outcomes. Always use proper risk management.
**How do you view IOST's move given the current support and resistance levels?**
#BinanceFutures #IOST #IOSTUSDT #Kripto #TeknikAnaliz
1
ETHUSDT 1H LONG Signal: Strong Uptrend Continues | ETHUSDT 1H LONG Signal: Strong Uptrend Continues
🇹🇷 TURKISH
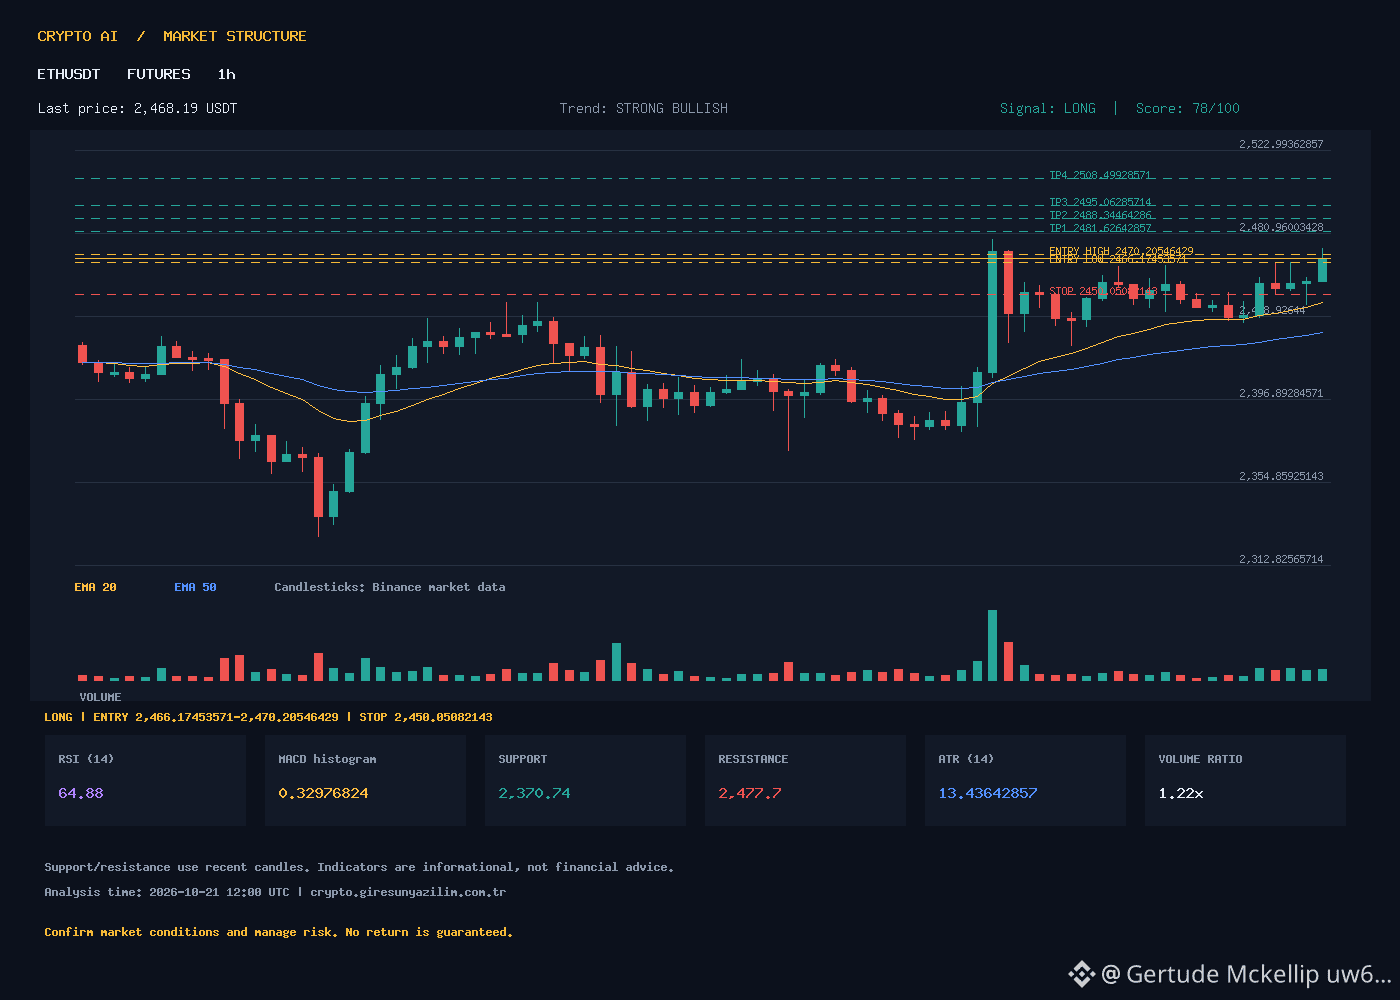
ETHUSDT is continuing its STRONG BULLISH trend (score 78) on the 1-hour chart. Price is 2468.19, above EMA20 (2445.62) and EMA50 (2430.87); EMA200 (2444.87) is also providing support. RSI is 64.88 – not overbought. MACD histogram is positive (0.33), with upward momentum. ATR is 13.44, and volume is 22% above average (1.22x). Support: 2370.74; resistance: 2477.70.
Signal: LONG (ATR-based scenario, not guaranteed).
Entry range: 2466.17 – 2470.21 | Stop-Loss: 2450.05
TP1: 2481.63 | TP2: 2488.34 | TP3: 2495.06 | TP4: 2508.50
Risk: Resistance at 2477.70 will be tested; failure to break through could trigger a pullback. Adjust position size according to your risk tolerance.
💭 If resistance at 2477.70 breaks, how realistic are targets above 2500?
🇬🇧 ENGLISH
ETHUSDT 1H shows STRONG BULLISH trend (score 78). Price 2468.19 above EMA20 (2445.62) and EMA50 (2430.87); EMA200 (2444.87) also supportive. RSI 64.88 – no overbought. MACD histogram positive (0.33), upside momentum. ATR 13.44, volume 22% above average (1.22x). Support 2370.74, resistance 2477.70.
Signal: LONG (ATR-based scenario, not guaranteed).
Entry range: 2466.17 – 2470.21 | Stop-Loss: 2450.05
TP1: 2481.63 | TP2: 2488.34 | TP3: 2495.06 | TP4: 2508.50
Risk: Resistance at 2477.70 will be tested; failure to break may trigger pullback. Size position per your risk tolerance.
💭 If 2477.70 breaks, how realistic are 2500+ targets?
#ETHUSDT #Ethereum #KriptoAnaliz #TeknikAnaliz #BinanceFutures
ETHUSDT 1H LONG Signal: Strong Uptrend Continues | ETHUSDT 1H LONG Signal: Strong Uptrend Continues
🇹🇷 TURKISH
ETHUSDT is continuing its STRONG BULLISH trend (score 78) on the 1-hour chart. Price is 2468.19, above EMA20 (2445.62) and EMA50 (2430.87); EMA200 (2444.87) is also providing support. RSI is 64.88 – not overbought. MACD histogram is positive (0.33), with upward momentum. ATR is 13.44, and volume is 22% above average (1.22x). Support: 2370.74; resistance: 2477.70.
Signal: LONG (ATR-based scenario, not guaranteed).
Entry range: 2466.17 – 2470.21 | Stop-Loss: 2450.05
TP1: 2481.63 | TP2: 2488.34 | TP3: 2495.06 | TP4: 2508.50
Risk: Resistance at 2477.70 will be tested; failure to break through could trigger a pullback. Adjust position size according to your risk tolerance.
💭 If resistance at 2477.70 breaks, how realistic are targets above 2500?
🇬🇧 ENGLISH
ETHUSDT 1H shows STRONG BULLISH trend (score 78). Price 2468.19 above EMA20 (2445.62) and EMA50 (2430.87); EMA200 (2444.87) also supportive. RSI 64.88 – no overbought. MACD histogram positive (0.33), upside momentum. ATR 13.44, volume 22% above average (1.22x). Support 2370.74, resistance 2477.70.
Signal: LONG (ATR-based scenario, not guaranteed).
Entry range: 2466.17 – 2470.21 | Stop-Loss: 2450.05
TP1: 2481.63 | TP2: 2488.34 | TP3: 2495.06 | TP4: 2508.50
Risk: Resistance at 2477.70 will be tested; failure to break may trigger pullback. Size position per your risk tolerance.
💭 If 2477.70 breaks, how realistic are 2500+ targets?
#ETHUSDT #Ethereum #KriptoAnaliz #TeknikAnaliz #BinanceFutures
🇹🇷 TURKISH
ETHUSDT is continuing its STRONG BULLISH trend (score 78) on the 1-hour chart. Price is 2468.19, above EMA20 (2445.62) and EMA50 (2430.87); EMA200 (2444.87) is also providing support. RSI is 64.88 – not overbought. MACD histogram is positive (0.33), with upward momentum. ATR is 13.44, and volume is 22% above average (1.22x). Support: 2370.74; resistance: 2477.70.
Signal: LONG (ATR-based scenario, not guaranteed).
Entry range: 2466.17 – 2470.21 | Stop-Loss: 2450.05
TP1: 2481.63 | TP2: 2488.34 | TP3: 2495.06 | TP4: 2508.50
Risk: Resistance at 2477.70 will be tested; failure to break through could trigger a pullback. Adjust position size according to your risk tolerance.
💭 If resistance at 2477.70 breaks, how realistic are targets above 2500?
🇬🇧 ENGLISH
ETHUSDT 1H shows STRONG BULLISH trend (score 78). Price 2468.19 above EMA20 (2445.62) and EMA50 (2430.87); EMA200 (2444.87) also supportive. RSI 64.88 – no overbought. MACD histogram positive (0.33), upside momentum. ATR 13.44, volume 22% above average (1.22x). Support 2370.74, resistance 2477.70.
Signal: LONG (ATR-based scenario, not guaranteed).
Entry range: 2466.17 – 2470.21 | Stop-Loss: 2450.05
TP1: 2481.63 | TP2: 2488.34 | TP3: 2495.06 | TP4: 2508.50
Risk: Resistance at 2477.70 will be tested; failure to break may trigger pullback. Size position per your risk tolerance.
💭 If 2477.70 breaks, how realistic are 2500+ targets?
#ETHUSDT #Ethereum #KriptoAnaliz #TeknikAnaliz #BinanceFutures
3
NEARUSDT 1-Hour: Strong Uptrend, LONG Signal | NEARUSDT 1H: Strong Bullish Trend, LONG Signal
🇹🇷 TURKISH
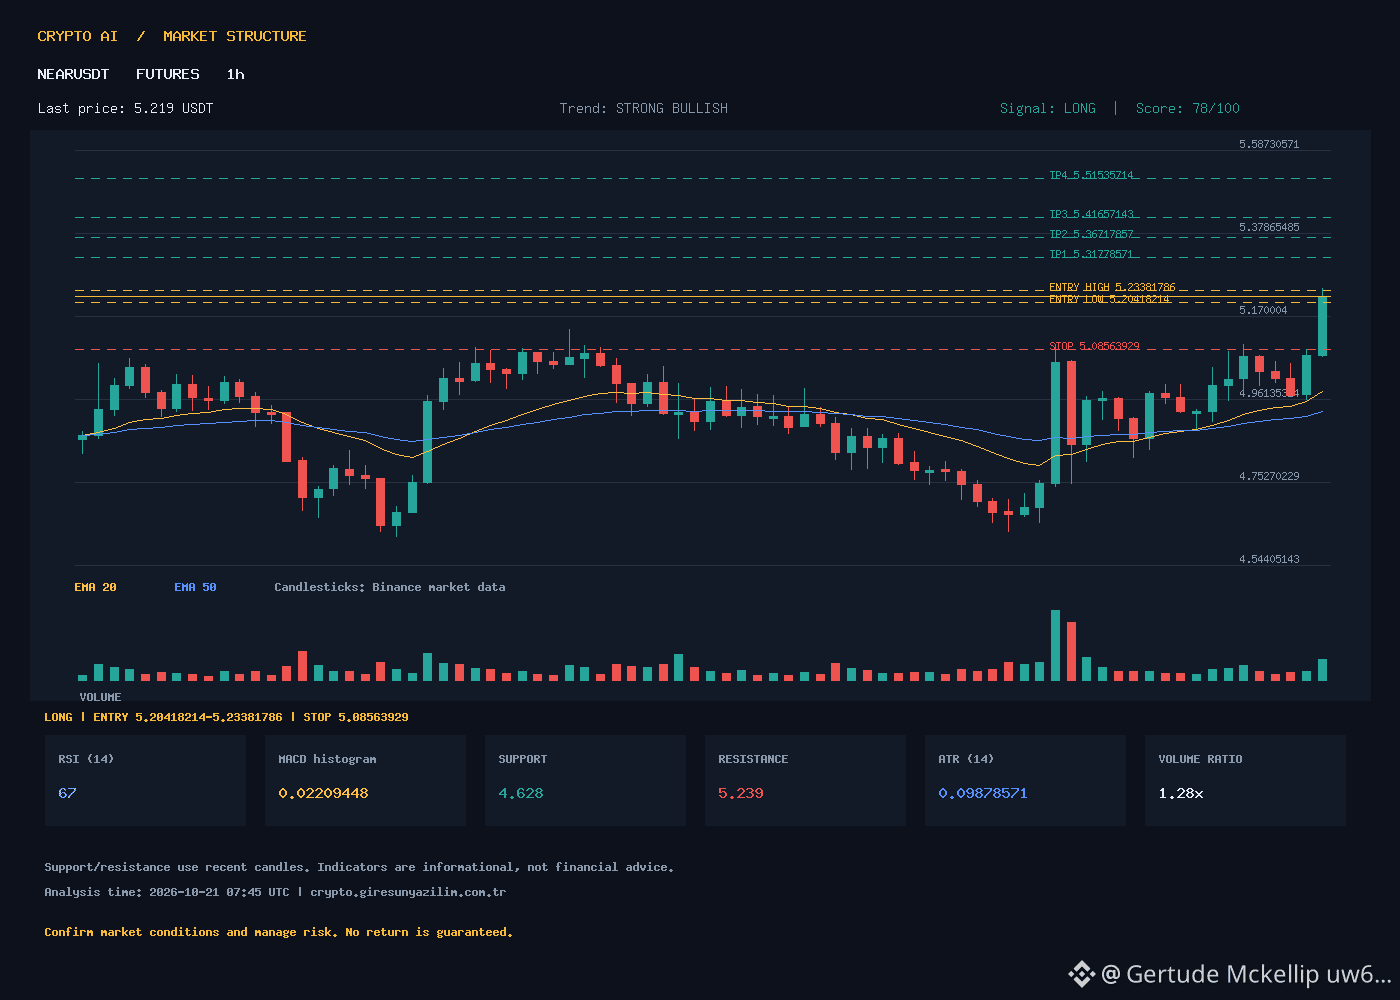
The NEARUSDT 1h chart shows the price at 5.219 USDT, a STRONG BULLISH trend (score 78), and a LONG signal. RSI is 67 (near the overbought threshold), EMA20 4.98 > EMA50 4.94 > EMA200 5.05; the MACD histogram is positive (0.022). ATR is 0.099, and volume is 1.28× the average (9.99M vs 7.80M). Support is at 4.628, resistance at 5.239.
ATR-based scenario (not guaranteed):
Direction: LONG
Entry range: 5.20418214 – 5.23381786 (midpoint 5.219)
Stop-Loss: 5.08563929
TP1: 5.31778571
TP2: 5.36717857
TP3: 5.41657143
TP4: 5.51535714
RSI 67 indicates strong momentum, but there is a risk of a pullback. EMA200 is still above the price, so the long-term trend is not yet confirmed. A sustained increase in volume could trigger a breakout.
Discussion: Is EMA200 at 5.05 challenging buyers’ control?
🇬🇧 ENGLISH
The NEARUSDT 1h chart shows the price at 5.219 USDT, a STRONG BULLISH trend (score 78), and a LONG signal. RSI is 67 (near overbought), EMA20 4.98 > EMA50 4.94 > EMA200 5.05; the MACD histogram is positive (0.022). ATR is 0.099, and volume is 1.28× the average (9.99M vs 7.80M). Support is at 4.628, resistance at 5.239.
ATR-based scenario (not guaranteed):
Direction: LONG
Entry range: 5.20418214 – 5.23381786 (midpoint 5.219)
Stop-Loss: 5.08563929
TP1: 5.31778571
TP2: 5.36717857
TP3: 5.41657143
TP4: 5.51535714
RSI 67 signals strong momentum, but a pullback is possible. EMA200 is still above the price, so the long-term trend is not yet confirmed. A sustained surge in volume could trigger a breakout.
Discussion: Does EMA200 holding at 5.05 challenge buyers’ control?
#NEARUSDT #BTC #Altcoin #Futures #TeknikAnaliz
NEARUSDT 1-Hour: Strong Uptrend, LONG Signal | NEARUSDT 1H: Strong Bullish Trend, LONG Signal
🇹🇷 TURKISH
The NEARUSDT 1h chart shows the price at 5.219 USDT, a STRONG BULLISH trend (score 78), and a LONG signal. RSI is 67 (near the overbought threshold), EMA20 4.98 > EMA50 4.94 > EMA200 5.05; the MACD histogram is positive (0.022). ATR is 0.099, and volume is 1.28× the average (9.99M vs 7.80M). Support is at 4.628, resistance at 5.239.
ATR-based scenario (not guaranteed):
Direction: LONG
Entry range: 5.20418214 – 5.23381786 (midpoint 5.219)
Stop-Loss: 5.08563929
TP1: 5.31778571
TP2: 5.36717857
TP3: 5.41657143
TP4: 5.51535714
RSI 67 indicates strong momentum, but there is a risk of a pullback. EMA200 is still above the price, so the long-term trend is not yet confirmed. A sustained increase in volume could trigger a breakout.
Discussion: Is EMA200 at 5.05 challenging buyers’ control?
🇬🇧 ENGLISH
The NEARUSDT 1h chart shows the price at 5.219 USDT, a STRONG BULLISH trend (score 78), and a LONG signal. RSI is 67 (near overbought), EMA20 4.98 > EMA50 4.94 > EMA200 5.05; the MACD histogram is positive (0.022). ATR is 0.099, and volume is 1.28× the average (9.99M vs 7.80M). Support is at 4.628, resistance at 5.239.
ATR-based scenario (not guaranteed):
Direction: LONG
Entry range: 5.20418214 – 5.23381786 (midpoint 5.219)
Stop-Loss: 5.08563929
TP1: 5.31778571
TP2: 5.36717857
TP3: 5.41657143
TP4: 5.51535714
RSI 67 signals strong momentum, but a pullback is possible. EMA200 is still above the price, so the long-term trend is not yet confirmed. A sustained surge in volume could trigger a breakout.
Discussion: Does EMA200 holding at 5.05 challenge buyers’ control?
#NEARUSDT #BTC #Altcoin #Futures #TeknikAnaliz
🇹🇷 TURKISH
The NEARUSDT 1h chart shows the price at 5.219 USDT, a STRONG BULLISH trend (score 78), and a LONG signal. RSI is 67 (near the overbought threshold), EMA20 4.98 > EMA50 4.94 > EMA200 5.05; the MACD histogram is positive (0.022). ATR is 0.099, and volume is 1.28× the average (9.99M vs 7.80M). Support is at 4.628, resistance at 5.239.
ATR-based scenario (not guaranteed):
Direction: LONG
Entry range: 5.20418214 – 5.23381786 (midpoint 5.219)
Stop-Loss: 5.08563929
TP1: 5.31778571
TP2: 5.36717857
TP3: 5.41657143
TP4: 5.51535714
RSI 67 indicates strong momentum, but there is a risk of a pullback. EMA200 is still above the price, so the long-term trend is not yet confirmed. A sustained increase in volume could trigger a breakout.
Discussion: Is EMA200 at 5.05 challenging buyers’ control?
🇬🇧 ENGLISH
The NEARUSDT 1h chart shows the price at 5.219 USDT, a STRONG BULLISH trend (score 78), and a LONG signal. RSI is 67 (near overbought), EMA20 4.98 > EMA50 4.94 > EMA200 5.05; the MACD histogram is positive (0.022). ATR is 0.099, and volume is 1.28× the average (9.99M vs 7.80M). Support is at 4.628, resistance at 5.239.
ATR-based scenario (not guaranteed):
Direction: LONG
Entry range: 5.20418214 – 5.23381786 (midpoint 5.219)
Stop-Loss: 5.08563929
TP1: 5.31778571
TP2: 5.36717857
TP3: 5.41657143
TP4: 5.51535714
RSI 67 signals strong momentum, but a pullback is possible. EMA200 is still above the price, so the long-term trend is not yet confirmed. A sustained surge in volume could trigger a breakout.
Discussion: Does EMA200 holding at 5.05 challenge buyers’ control?
#NEARUSDT #BTC #Altcoin #Futures #TeknikAnaliz
35
SOLUSDT 1-Hour SHORT Signal – ATR-Based Levels | SOLUSDT 1H SHORT Signal – ATR-Based Levels
🇹🇷 TURKISH
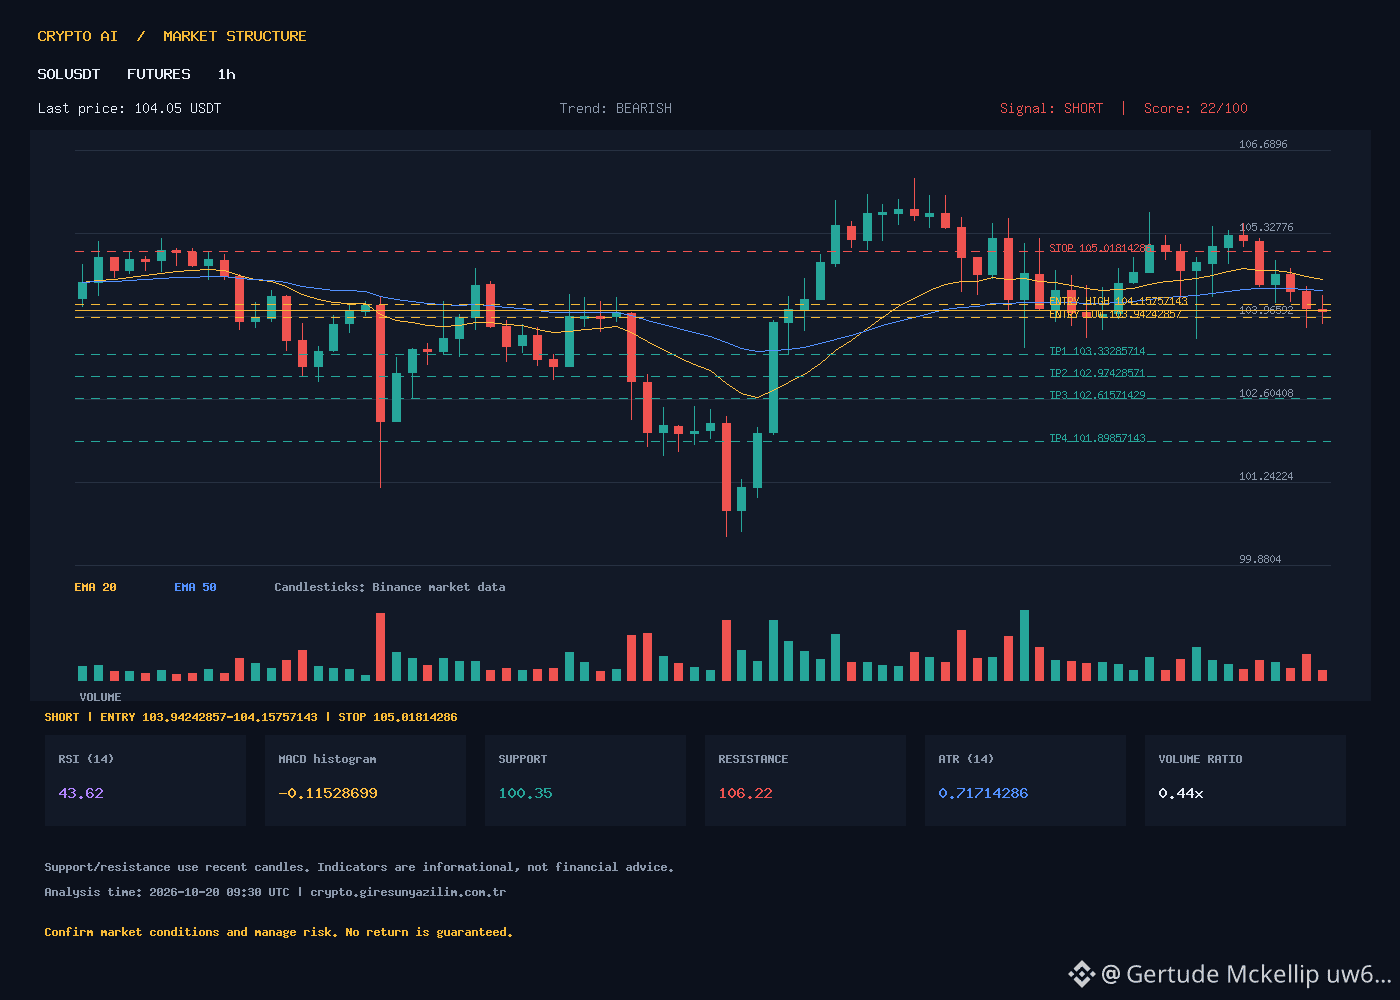
The SOLUSDT 1-hour chart generated a BEARISH trend (score 22) and a SHORT signal. Current price 104.05, RSI 43.62 (neutral-to-early), EMA20 104.57, EMA50 104.41, below EMA200 at 105.87; MACD histogram -0.115 (negative), ATR 0.717. Volume is at 44% of average (213k vs. 481k average). Support 100.35, resistance 106.22.
Illustrative ATR-based levels (not guaranteed):
Entry range: 103.9424 – 104.1576 (midpoint 104.05)
Stop-Loss: 105.0181
TP1: 103.3329 | TP2: 102.9743 | TP3: 102.6157 | TP4: 101.8986
The risk/reward ratio varies depending on the entry; position sizing and margin management are the user's responsibility.
Discussion: With EMA200 still above the price, can a short-term pullback reach TP1?
🇬🇧 ENGLISH
SOLUSDT 1H chart shows a BEARISH trend (score 22) with a SHORT signal. Current price 104.05, RSI 43.62 (neutral), EMA20 104.57, EMA50 104.41, EMA200 105.87 above price; MACD histogram -0.115 negative, ATR 0.717. Volume at 44% of average (213k vs 481k avg). Support 100.35, resistance 106.22.
ATR-based illustrative levels (not guaranteed):
Entry range: 103.9424 – 104.1576 (mid 104.05)
Stop-Loss: 105.0181
TP1: 103.3329 | TP2: 102.9743 | TP3: 102.6157 | TP4: 101.8986
Risk/reward varies with entry; position sizing and margin management are user’s responsibility.
Discussion: With EMA200 still above price, can a short-term pullback reach TP1?
#SOLUSDT #SHORT #BinanceFutures #TeknikAnaliz #CryptoTR
SOLUSDT 1-Hour SHORT Signal – ATR-Based Levels | SOLUSDT 1H SHORT Signal – ATR-Based Levels
🇹🇷 TURKISH
The SOLUSDT 1-hour chart generated a BEARISH trend (score 22) and a SHORT signal. Current price 104.05, RSI 43.62 (neutral-to-early), EMA20 104.57, EMA50 104.41, below EMA200 at 105.87; MACD histogram -0.115 (negative), ATR 0.717. Volume is at 44% of average (213k vs. 481k average). Support 100.35, resistance 106.22.
Illustrative ATR-based levels (not guaranteed):
Entry range: 103.9424 – 104.1576 (midpoint 104.05)
Stop-Loss: 105.0181
TP1: 103.3329 | TP2: 102.9743 | TP3: 102.6157 | TP4: 101.8986
The risk/reward ratio varies depending on the entry; position sizing and margin management are the user's responsibility.
Discussion: With EMA200 still above the price, can a short-term pullback reach TP1?
🇬🇧 ENGLISH
SOLUSDT 1H chart shows a BEARISH trend (score 22) with a SHORT signal. Current price 104.05, RSI 43.62 (neutral), EMA20 104.57, EMA50 104.41, EMA200 105.87 above price; MACD histogram -0.115 negative, ATR 0.717. Volume at 44% of average (213k vs 481k avg). Support 100.35, resistance 106.22.
ATR-based illustrative levels (not guaranteed):
Entry range: 103.9424 – 104.1576 (mid 104.05)
Stop-Loss: 105.0181
TP1: 103.3329 | TP2: 102.9743 | TP3: 102.6157 | TP4: 101.8986
Risk/reward varies with entry; position sizing and margin management are user’s responsibility.
Discussion: With EMA200 still above price, can a short-term pullback reach TP1?
#SOLUSDT #SHORT #BinanceFutures #TeknikAnaliz #CryptoTR
🇹🇷 TURKISH
The SOLUSDT 1-hour chart generated a BEARISH trend (score 22) and a SHORT signal. Current price 104.05, RSI 43.62 (neutral-to-early), EMA20 104.57, EMA50 104.41, below EMA200 at 105.87; MACD histogram -0.115 (negative), ATR 0.717. Volume is at 44% of average (213k vs. 481k average). Support 100.35, resistance 106.22.
Illustrative ATR-based levels (not guaranteed):
Entry range: 103.9424 – 104.1576 (midpoint 104.05)
Stop-Loss: 105.0181
TP1: 103.3329 | TP2: 102.9743 | TP3: 102.6157 | TP4: 101.8986
The risk/reward ratio varies depending on the entry; position sizing and margin management are the user's responsibility.
Discussion: With EMA200 still above the price, can a short-term pullback reach TP1?
🇬🇧 ENGLISH
SOLUSDT 1H chart shows a BEARISH trend (score 22) with a SHORT signal. Current price 104.05, RSI 43.62 (neutral), EMA20 104.57, EMA50 104.41, EMA200 105.87 above price; MACD histogram -0.115 negative, ATR 0.717. Volume at 44% of average (213k vs 481k avg). Support 100.35, resistance 106.22.
ATR-based illustrative levels (not guaranteed):
Entry range: 103.9424 – 104.1576 (mid 104.05)
Stop-Loss: 105.0181
TP1: 103.3329 | TP2: 102.9743 | TP3: 102.6157 | TP4: 101.8986
Risk/reward varies with entry; position sizing and margin management are user’s responsibility.
Discussion: With EMA200 still above price, can a short-term pullback reach TP1?
#SOLUSDT #SHORT #BinanceFutures #TeknikAnaliz #CryptoTR
6
ETHUSDT 1H Strong Downtrend – SHORT Signal | ETHUSDT 1H Strong Bearish Trend – SHORT Signal
🇹🇷 TURKISH
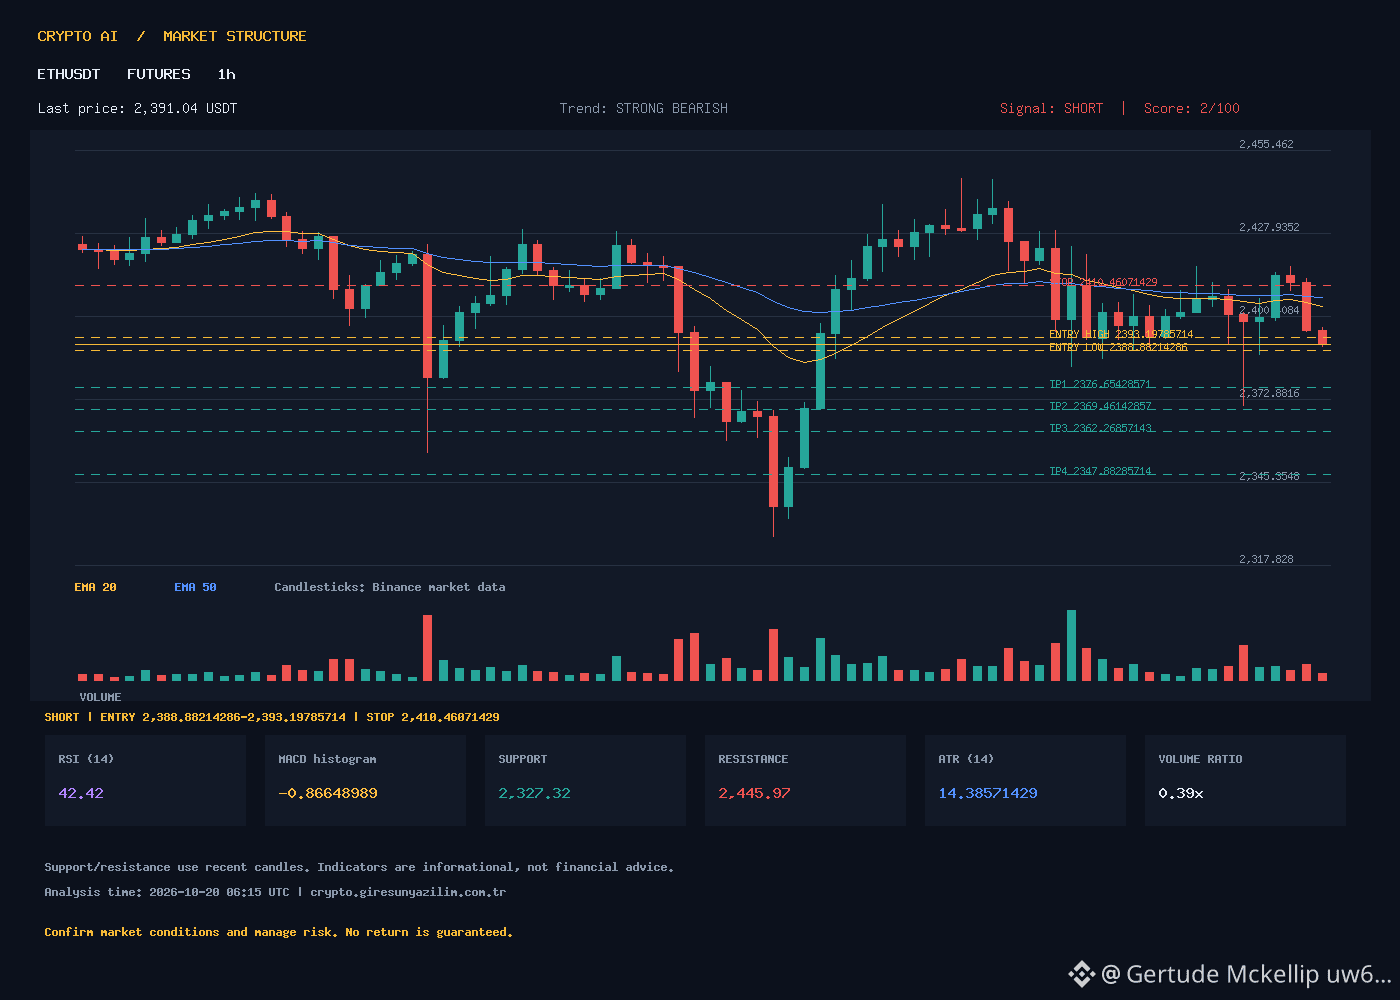
The STRONG BEARISH trend (score 2/10) continues on the ETHUSDT 1-hour chart. Price is 2391.04, below EMA20 (2403.72) and EMA50 (2406.96); EMA200 (2444.88) is also overhead resistance. RSI 42.42 – not yet oversold. MACD histogram at -0.87 indicates negative momentum. ATR 14.39, volume is 39% of average (low). Support 2327.32, resistance 2445.97.
SHORT signal confirmed. ATR-based scenario (not guaranteed):
Entry range: 2388.88 – 2393.20
Stop-Loss: 2410.46
TP1: 2376.65 | TP2: 2369.46 | TP3: 2362.27 | TP4: 2347.88
Risk: Low volume increases the risk of a breakout; the SL is tight. EMAs are flat – a volume-backed close is needed for a trend reversal. Staying below 2391 keeps the downside targets in play.
Discussion: If support at 2327 is tested, will price hold there or accelerate toward 2300?
🇬🇧 ENGLISH
ETHUSDT 1H shows a STRONG BEARISH trend (score 2/10). Price 2391.04 sits below EMA20 (2403.72) and EMA50 (2406.96); EMA200 (2444.88) caps upside. RSI 42.42 – not yet oversold. MACD histogram -0.87 confirms negative momentum. ATR 14.39, volume only 39% of average. Support 2327.32, resistance 2445.97.
SHORT signal confirmed. ATR-based scenario (not guaranteed):
Entry range: 2388.88 – 2393.20
Stop-Loss: 2410.46
TP1: 2376.65 | TP2: 2369.46 | TP3: 2362.27 | TP4: 2347.88
Risk: Low volume raises breakout risk; SL is tight. EMAs flat – a volume-backed close needed for trend flip. Holding below 2391 keeps downside targets alive.
Discussion: If 2327 support is tested, will price hold or accelerate toward 2300?
#ETHUSDT #Ethereum #KriptoAnaliz #TeknikAnaliz #SHORT
ETHUSDT 1H Strong Downtrend – SHORT Signal | ETHUSDT 1H Strong Bearish Trend – SHORT Signal
🇹🇷 TURKISH
The STRONG BEARISH trend (score 2/10) continues on the ETHUSDT 1-hour chart. Price is 2391.04, below EMA20 (2403.72) and EMA50 (2406.96); EMA200 (2444.88) is also overhead resistance. RSI 42.42 – not yet oversold. MACD histogram at -0.87 indicates negative momentum. ATR 14.39, volume is 39% of average (low). Support 2327.32, resistance 2445.97.
SHORT signal confirmed. ATR-based scenario (not guaranteed):
Entry range: 2388.88 – 2393.20
Stop-Loss: 2410.46
TP1: 2376.65 | TP2: 2369.46 | TP3: 2362.27 | TP4: 2347.88
Risk: Low volume increases the risk of a breakout; the SL is tight. EMAs are flat – a volume-backed close is needed for a trend reversal. Staying below 2391 keeps the downside targets in play.
Discussion: If support at 2327 is tested, will price hold there or accelerate toward 2300?
🇬🇧 ENGLISH
ETHUSDT 1H shows a STRONG BEARISH trend (score 2/10). Price 2391.04 sits below EMA20 (2403.72) and EMA50 (2406.96); EMA200 (2444.88) caps upside. RSI 42.42 – not yet oversold. MACD histogram -0.87 confirms negative momentum. ATR 14.39, volume only 39% of average. Support 2327.32, resistance 2445.97.
SHORT signal confirmed. ATR-based scenario (not guaranteed):
Entry range: 2388.88 – 2393.20
Stop-Loss: 2410.46
TP1: 2376.65 | TP2: 2369.46 | TP3: 2362.27 | TP4: 2347.88
Risk: Low volume raises breakout risk; SL is tight. EMAs flat – a volume-backed close needed for trend flip. Holding below 2391 keeps downside targets alive.
Discussion: If 2327 support is tested, will price hold or accelerate toward 2300?
#ETHUSDT #Ethereum #KriptoAnaliz #TeknikAnaliz #SHORT
🇹🇷 TURKISH
The STRONG BEARISH trend (score 2/10) continues on the ETHUSDT 1-hour chart. Price is 2391.04, below EMA20 (2403.72) and EMA50 (2406.96); EMA200 (2444.88) is also overhead resistance. RSI 42.42 – not yet oversold. MACD histogram at -0.87 indicates negative momentum. ATR 14.39, volume is 39% of average (low). Support 2327.32, resistance 2445.97.
SHORT signal confirmed. ATR-based scenario (not guaranteed):
Entry range: 2388.88 – 2393.20
Stop-Loss: 2410.46
TP1: 2376.65 | TP2: 2369.46 | TP3: 2362.27 | TP4: 2347.88
Risk: Low volume increases the risk of a breakout; the SL is tight. EMAs are flat – a volume-backed close is needed for a trend reversal. Staying below 2391 keeps the downside targets in play.
Discussion: If support at 2327 is tested, will price hold there or accelerate toward 2300?
🇬🇧 ENGLISH
ETHUSDT 1H shows a STRONG BEARISH trend (score 2/10). Price 2391.04 sits below EMA20 (2403.72) and EMA50 (2406.96); EMA200 (2444.88) caps upside. RSI 42.42 – not yet oversold. MACD histogram -0.87 confirms negative momentum. ATR 14.39, volume only 39% of average. Support 2327.32, resistance 2445.97.
SHORT signal confirmed. ATR-based scenario (not guaranteed):
Entry range: 2388.88 – 2393.20
Stop-Loss: 2410.46
TP1: 2376.65 | TP2: 2369.46 | TP3: 2362.27 | TP4: 2347.88
Risk: Low volume raises breakout risk; SL is tight. EMAs flat – a volume-backed close needed for trend flip. Holding below 2391 keeps downside targets alive.
Discussion: If 2327 support is tested, will price hold or accelerate toward 2300?
#ETHUSDT #Ethereum #KriptoAnaliz #TeknikAnaliz #SHORT
1
BTCUSDT 1h SHORT Signal – Strong Bearish Trend | BTCUSDT 1h SHORT Signal – Strong Bearish Trend
🇹🇷 TURKISH
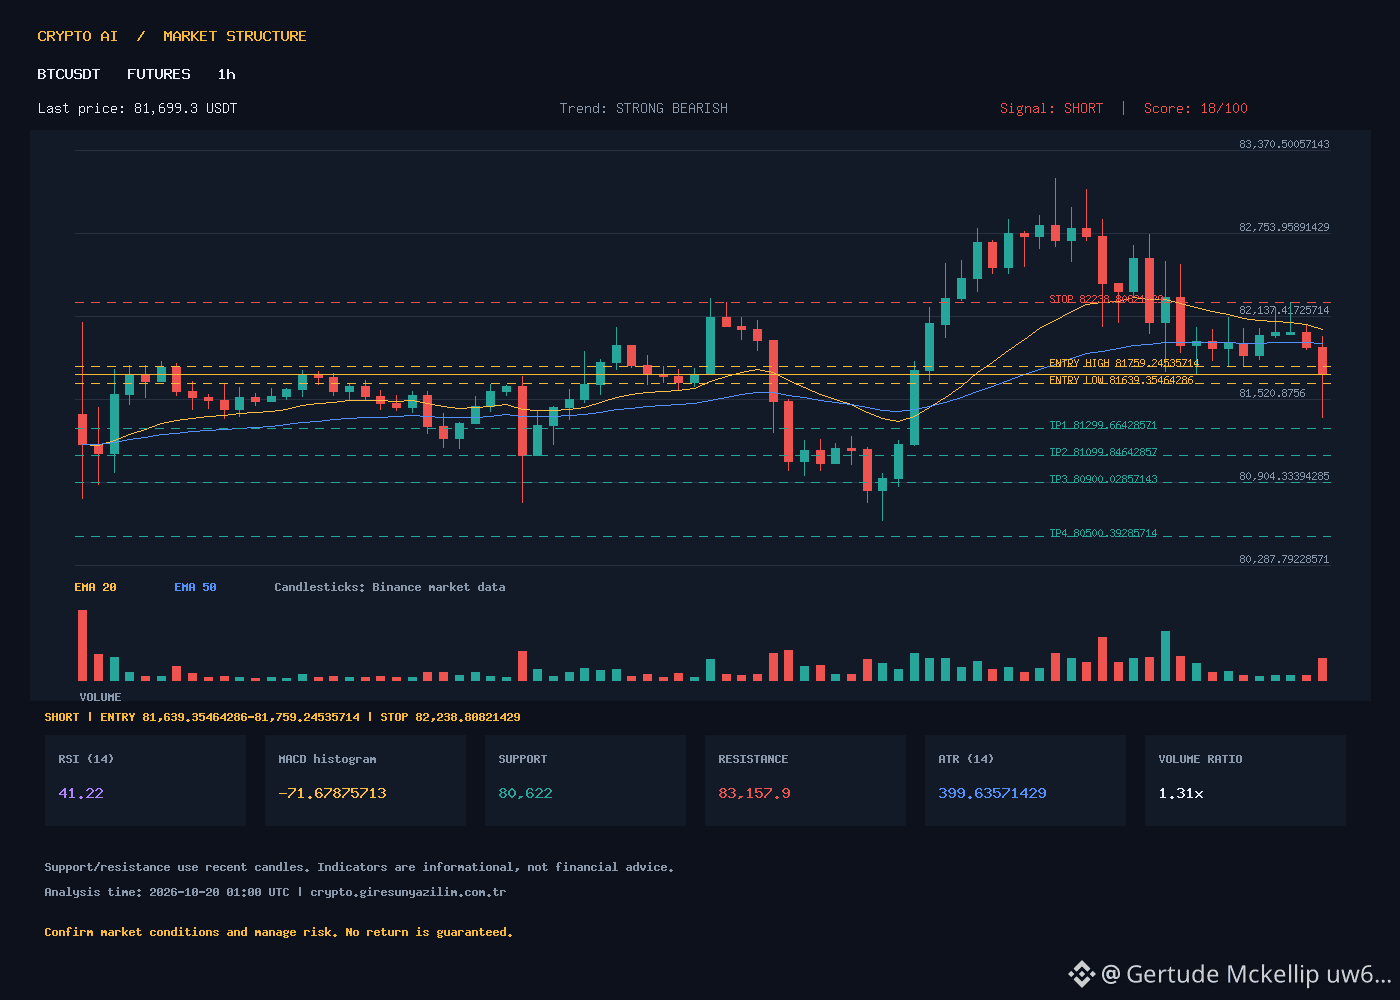
A STRONG BEARISH trend (score 18) dominates the BTCUSDT 1-hour chart. Price is 81,699.3 USDT, below EMA20 (82,037.5) and EMA50 (81,966.3); EMA200 (82,295.3) is also overhead resistance. RSI is 41.22 – not yet oversold. The MACD histogram at -71.68 indicates negative momentum. ATR is 399.64, and volume is 1.31 times the average (7,047 vs. 5,374) – selling pressure is strong. Support is 80,622; resistance is 83,157.9.
The SHORT signal is confirmed. ATR-based scenario levels (not guaranteed):
Entry range: 81,639.35 – 81,759.25 (midpoint 81,699.3)
Stop-Loss: 82,238.81
TP1: 81,299.66 | TP2: 81,099.85 | TP3: 80,900.03 | TP4: 80,500.39
Risk: The EMAs are flat, and the MACD signal line (25.95) is above – a short-term pullback is possible. Adjust position size according to ATR.
Discussion: Around 81,700, would you prefer a limit order or a market order?
🇬🇧 ENGLISH
BTCUSDT 1h shows a STRONG BEARISH trend (score 18). Price 81,699.3 USDT sits below EMA20 (82,037.5) and EMA50 (81,966.3); EMA200 (82,295.3) caps upside. RSI 41.22 – not oversold yet. MACD histogram -71.68 confirms negative momentum. ATR 399.64, volume 1.31× average (7,048 vs 5,374) – selling pressure elevated. Support 80,622, resistance 83,157.9.
SHORT signal confirmed. ATR-based scenario levels (not guaranteed outcomes):
Entry range: 81,639.35 – 81,759.25 (mid 81,699.3)
Stop-Loss: 82,238.81
TP1: 81,299.66 | TP2: 81,099.85 | TP3: 80,900.03 | TP4: 80,500.39
Risk: EMAs flat, MACD signal line (25.95) above – short-term pullback possible. Size position per ATR.
Discussion: At ~81,700 do you prefer a limit order or market entry?
#BTCUSDT #Bitcoin #SHORT #Futures #TeknikAnaliz
BTCUSDT 1h SHORT Signal – Strong Bearish Trend | BTCUSDT 1h SHORT Signal – Strong Bearish Trend
🇹🇷 TURKISH
A STRONG BEARISH trend (score 18) dominates the BTCUSDT 1-hour chart. Price is 81,699.3 USDT, below EMA20 (82,037.5) and EMA50 (81,966.3); EMA200 (82,295.3) is also overhead resistance. RSI is 41.22 – not yet oversold. The MACD histogram at -71.68 indicates negative momentum. ATR is 399.64, and volume is 1.31 times the average (7,047 vs. 5,374) – selling pressure is strong. Support is 80,622; resistance is 83,157.9.
The SHORT signal is confirmed. ATR-based scenario levels (not guaranteed):
Entry range: 81,639.35 – 81,759.25 (midpoint 81,699.3)
Stop-Loss: 82,238.81
TP1: 81,299.66 | TP2: 81,099.85 | TP3: 80,900.03 | TP4: 80,500.39
Risk: The EMAs are flat, and the MACD signal line (25.95) is above – a short-term pullback is possible. Adjust position size according to ATR.
Discussion: Around 81,700, would you prefer a limit order or a market order?
🇬🇧 ENGLISH
BTCUSDT 1h shows a STRONG BEARISH trend (score 18). Price 81,699.3 USDT sits below EMA20 (82,037.5) and EMA50 (81,966.3); EMA200 (82,295.3) caps upside. RSI 41.22 – not oversold yet. MACD histogram -71.68 confirms negative momentum. ATR 399.64, volume 1.31× average (7,048 vs 5,374) – selling pressure elevated. Support 80,622, resistance 83,157.9.
SHORT signal confirmed. ATR-based scenario levels (not guaranteed outcomes):
Entry range: 81,639.35 – 81,759.25 (mid 81,699.3)
Stop-Loss: 82,238.81
TP1: 81,299.66 | TP2: 81,099.85 | TP3: 80,900.03 | TP4: 80,500.39
Risk: EMAs flat, MACD signal line (25.95) above – short-term pullback possible. Size position per ATR.
Discussion: At ~81,700 do you prefer a limit order or market entry?
#BTCUSDT #Bitcoin #SHORT #Futures #TeknikAnaliz
🇹🇷 TURKISH
A STRONG BEARISH trend (score 18) dominates the BTCUSDT 1-hour chart. Price is 81,699.3 USDT, below EMA20 (82,037.5) and EMA50 (81,966.3); EMA200 (82,295.3) is also overhead resistance. RSI is 41.22 – not yet oversold. The MACD histogram at -71.68 indicates negative momentum. ATR is 399.64, and volume is 1.31 times the average (7,047 vs. 5,374) – selling pressure is strong. Support is 80,622; resistance is 83,157.9.
The SHORT signal is confirmed. ATR-based scenario levels (not guaranteed):
Entry range: 81,639.35 – 81,759.25 (midpoint 81,699.3)
Stop-Loss: 82,238.81
TP1: 81,299.66 | TP2: 81,099.85 | TP3: 80,900.03 | TP4: 80,500.39
Risk: The EMAs are flat, and the MACD signal line (25.95) is above – a short-term pullback is possible. Adjust position size according to ATR.
Discussion: Around 81,700, would you prefer a limit order or a market order?
🇬🇧 ENGLISH
BTCUSDT 1h shows a STRONG BEARISH trend (score 18). Price 81,699.3 USDT sits below EMA20 (82,037.5) and EMA50 (81,966.3); EMA200 (82,295.3) caps upside. RSI 41.22 – not oversold yet. MACD histogram -71.68 confirms negative momentum. ATR 399.64, volume 1.31× average (7,048 vs 5,374) – selling pressure elevated. Support 80,622, resistance 83,157.9.
SHORT signal confirmed. ATR-based scenario levels (not guaranteed outcomes):
Entry range: 81,639.35 – 81,759.25 (mid 81,699.3)
Stop-Loss: 82,238.81
TP1: 81,299.66 | TP2: 81,099.85 | TP3: 80,900.03 | TP4: 80,500.39
Risk: EMAs flat, MACD signal line (25.95) above – short-term pullback possible. Size position per ATR.
Discussion: At ~81,700 do you prefer a limit order or market entry?
#BTCUSDT #Bitcoin #SHORT #Futures #TeknikAnaliz
43


·
--
📊 BTC/USDT Technical Outlook
🔹 Price: $97,267
🔹 Support: $96,000
🔹 Resistance: $98,000
The price has made a strong recovery from the short-term bottom and is approaching the resistance zone. 🎯
➡️ Rise: If it breaks above 98.000$ , target $99,500-100,000
➡️ Fall: If it falls below 96.000$ , target 94.500$
📈 Pay attention to critical levels!
#BTC☀ #KriptoAnaliz #TeknikAnaliz
📊 BTC/USDT Technical Outlook
🔹 Price: $97,267
🔹 Support: $96,000
🔹 Resistance: $98,000
The price has made a strong recovery from the short-term bottom and is approaching the resistance zone. 🎯
➡️ Rise: If it breaks above 98.000$ , target $99,500-100,000
➡️ Fall: If it falls below 96.000$ , target 94.500$
📈 Pay attention to critical levels!
#BTC☀ #KriptoAnaliz #TeknikAnaliz
🔹 Price: $97,267
🔹 Support: $96,000
🔹 Resistance: $98,000
The price has made a strong recovery from the short-term bottom and is approaching the resistance zone. 🎯
➡️ Rise: If it breaks above 98.000$ , target $99,500-100,000
➡️ Fall: If it falls below 96.000$ , target 94.500$
📈 Pay attention to critical levels!
#BTC☀ #KriptoAnaliz #TeknikAnaliz
2
2
4
426

·
--
$TRUTH While celebrating the rise, whales have already headed for the exit gate. The +37% green candle may whet the appetite, but the data points to a much more calculated scenario. With 120 whales in long positions and only 54 in short, this pushes the Long/Short ratio to a staggering 183.53%.
{future}(TRUTHUSDT)
Institutional players entered the game with an average of 0.0178 and are currently sitting on over $280,000 in unrealized profit. The funding rate rising to 0.0493% is increasing the cost of holding these positions. This usually heralds a volatility wave aimed at shaking out late retail investors.
I'm keeping an eye on the 0.021 level. If this area holds, we could see a squeeze targeting 0.025. However, if we lose 0.020, it's likely the price will quickly revert to the whale entry level of 0.0178.
My plan:
Entry Idea: $0.0208
Take Profit: $0.0245
Stop Loss: $0.0192
Invalidation: 4-hour close below $0.0185
#TRUTH #WhaleWatch #Crypto #TeknikAnaliz
$TRUTH While celebrating the rise, whales have already headed for the exit gate. The +37% green candle may whet the appetite, but the data points to a much more calculated scenario. With 120 whales in long positions and only 54 in short, this pushes the Long/Short ratio to a staggering 183.53%.
Institutional players entered the game with an average of 0.0178 and are currently sitting on over $280,000 in unrealized profit. The funding rate rising to 0.0493% is increasing the cost of holding these positions. This usually heralds a volatility wave aimed at shaking out late retail investors.
I'm keeping an eye on the 0.021 level. If this area holds, we could see a squeeze targeting 0.025. However, if we lose 0.020, it's likely the price will quickly revert to the whale entry level of 0.0178.
My plan:
Entry Idea: $0.0208
Take Profit: $0.0245
Stop Loss: $0.0192
Invalidation: 4-hour close below $0.0185
#TRUTH #WhaleWatch #Crypto #TeknikAnaliz
Institutional players entered the game with an average of 0.0178 and are currently sitting on over $280,000 in unrealized profit. The funding rate rising to 0.0493% is increasing the cost of holding these positions. This usually heralds a volatility wave aimed at shaking out late retail investors.
I'm keeping an eye on the 0.021 level. If this area holds, we could see a squeeze targeting 0.025. However, if we lose 0.020, it's likely the price will quickly revert to the whale entry level of 0.0178.
My plan:
Entry Idea: $0.0208
Take Profit: $0.0245
Stop Loss: $0.0192
Invalidation: 4-hour close below $0.0185
#TRUTH #WhaleWatch #Crypto #TeknikAnaliz
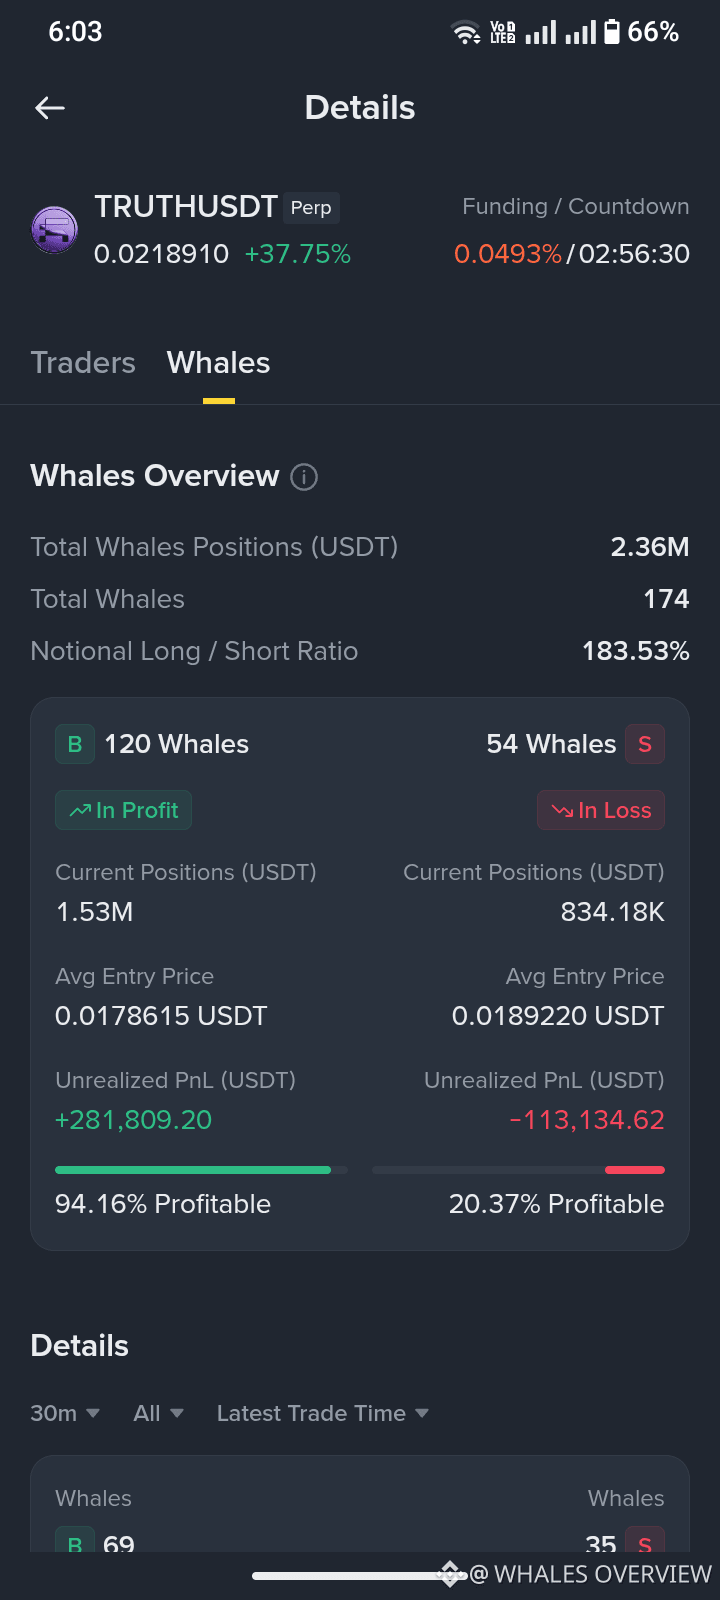
124
Log in to explore more content
Join global crypto users on Binance Square
⚡️ Get latest and useful information about crypto.
💬 Trusted by the world’s largest crypto exchange.
👍 Discover real insights from verified creators.
Email / Phone number
Trending Topics
1
#BinanceReports80%Recoveryof$6.3BillioninLossesfromHackIncident
18,334 views
170 Discussing
2
#HeYiSaysWithdrawalsExpectedtoResumeWithin42Hours
32,910 views
646 Discussing
3
#CZSaysCompensationIsinPlaceUsersAreProtected
38,571 views
512 Discussing
4
#RichardTengSaysBinanceWillCoverAllHackedLosseswithCompanyFunds
6,315 views
37 Discussing
5
#IntelHasItsWorstDaySince1974
5,982 views
176 Discussing
6
#TRMCambodianCasinosReceived$1.07BInCrypto
1,491 views
46 Discussing
7
#USDCCirculationFallsAbout800MInSevenDays
22,546 views
350 Discussing
8
#SuspectedNorthKoreaAttacksAccountForNearly89%OfCryptoHackLosses
8,439 views
74 Discussing
9
#OpenAICutsFundraisingTargetBy$10B
1,727 views
58 Discussing
10
#ASICHasReceivedNoPredictionMarketApplications
34,081 views
775 Discussing