
#kriptoanaliz
kriptoanaliz
9,607 views
35 Discussing
Hot
Latest

·
--
Is there calm before the storm in the cryptocurrency market, or are we on the verge of a major breakout?
Bitcoin Analysis and Crypto Market Observations
In recent days, we have observed a narrowing of volumes in Bitcoin and major altcoin projects, with price action squeezed into a tight band. According to technical analysis data, this kind of consolidation on the charts has historically been accompanied by a significant volatility move. While investors are currently waiting quietly on the sidelines, the funding rates on the derivatives side indicate that uncertainty in the market is continuing. During this period, it is critical to avoid panic trades and closely monitor areas where liquidity is concentrated on Binance. Remember, we are entering a period where patience pays; determine your strategy not with your emotions, but with chart data.
#BTC #KriptoAnaliz #Binance #Altcoin
Is there calm before the storm in the cryptocurrency market, or are we on the verge of a major breakout?
Bitcoin Analysis and Crypto Market Observations
In recent days, we have observed a narrowing of volumes in Bitcoin and major altcoin projects, with price action squeezed into a tight band. According to technical analysis data, this kind of consolidation on the charts has historically been accompanied by a significant volatility move. While investors are currently waiting quietly on the sidelines, the funding rates on the derivatives side indicate that uncertainty in the market is continuing. During this period, it is critical to avoid panic trades and closely monitor areas where liquidity is concentrated on Binance. Remember, we are entering a period where patience pays; determine your strategy not with your emotions, but with chart data.
#BTC #KriptoAnaliz #Binance #Altcoin
Bitcoin Analysis and Crypto Market Observations
In recent days, we have observed a narrowing of volumes in Bitcoin and major altcoin projects, with price action squeezed into a tight band. According to technical analysis data, this kind of consolidation on the charts has historically been accompanied by a significant volatility move. While investors are currently waiting quietly on the sidelines, the funding rates on the derivatives side indicate that uncertainty in the market is continuing. During this period, it is critical to avoid panic trades and closely monitor areas where liquidity is concentrated on Binance. Remember, we are entering a period where patience pays; determine your strategy not with your emotions, but with chart data.
#BTC #KriptoAnaliz #Binance #Altcoin
62
·
--
Is there a calm before the storm in the cryptocurrency market—or is a major rally on the doorstep?
Bitcoin analysis and current altcoin opportunity expectations
While the leading crypto, Bitcoin, is stuck in a narrow range, one question is on everyone’s mind: What’s next? Compression on technical charts has historically been a sign of a major breakout. During this period, closely tracking dominance levels is critical for predicting possible moves in altcoin projects. In particular, support and resistance zones in high-volume projects provide clues for determining short-term direction. We are in a time when investors should avoid panic trades and patiently follow the direction of the main trend. Remember, risk management is your best friend until the market direction becomes clear.
#Bitcoin #Binance #KriptoAnaliz #Altcoin
Is there a calm before the storm in the cryptocurrency market—or is a major rally on the doorstep?
Bitcoin analysis and current altcoin opportunity expectations
While the leading crypto, Bitcoin, is stuck in a narrow range, one question is on everyone’s mind: What’s next? Compression on technical charts has historically been a sign of a major breakout. During this period, closely tracking dominance levels is critical for predicting possible moves in altcoin projects. In particular, support and resistance zones in high-volume projects provide clues for determining short-term direction. We are in a time when investors should avoid panic trades and patiently follow the direction of the main trend. Remember, risk management is your best friend until the market direction becomes clear.
#Bitcoin #Binance #KriptoAnaliz #Altcoin
Bitcoin analysis and current altcoin opportunity expectations
While the leading crypto, Bitcoin, is stuck in a narrow range, one question is on everyone’s mind: What’s next? Compression on technical charts has historically been a sign of a major breakout. During this period, closely tracking dominance levels is critical for predicting possible moves in altcoin projects. In particular, support and resistance zones in high-volume projects provide clues for determining short-term direction. We are in a time when investors should avoid panic trades and patiently follow the direction of the main trend. Remember, risk management is your best friend until the market direction becomes clear.
#Bitcoin #Binance #KriptoAnaliz #Altcoin
22
·
--
Is the crypto market quietly preparing for a major storm, or is this just a bear-trap?
BTC Price Forecast and Altcoin Opportunity Analysis
In Binance order books, increased trading volume over the past few days stands out. While the Bitcoin price is testing critical support levels, we are observing changes in fund flows in the altcoin market. Many investors are focused on BTC price predictions, but the real movement may be happening quietly in projects that have been accumulating. During these periods when market makers are gathering liquidity, it’s important to closely follow technical indicators and on-chain data rather than making rushed decisions. In particular, volume support should be sought during resistance breakouts. In this ecosystem where the patient are the ones who win, the biggest analysis is the research you do yourself. Define your own strategy and manage your risk.
#BTC #Binance #KriptoAnaliz #Altcoin
Is the crypto market quietly preparing for a major storm, or is this just a bear-trap?
BTC Price Forecast and Altcoin Opportunity Analysis
In Binance order books, increased trading volume over the past few days stands out. While the Bitcoin price is testing critical support levels, we are observing changes in fund flows in the altcoin market. Many investors are focused on BTC price predictions, but the real movement may be happening quietly in projects that have been accumulating. During these periods when market makers are gathering liquidity, it’s important to closely follow technical indicators and on-chain data rather than making rushed decisions. In particular, volume support should be sought during resistance breakouts. In this ecosystem where the patient are the ones who win, the biggest analysis is the research you do yourself. Define your own strategy and manage your risk.
#BTC #Binance #KriptoAnaliz #Altcoin
BTC Price Forecast and Altcoin Opportunity Analysis
In Binance order books, increased trading volume over the past few days stands out. While the Bitcoin price is testing critical support levels, we are observing changes in fund flows in the altcoin market. Many investors are focused on BTC price predictions, but the real movement may be happening quietly in projects that have been accumulating. During these periods when market makers are gathering liquidity, it’s important to closely follow technical indicators and on-chain data rather than making rushed decisions. In particular, volume support should be sought during resistance breakouts. In this ecosystem where the patient are the ones who win, the biggest analysis is the research you do yourself. Define your own strategy and manage your risk.
#BTC #Binance #KriptoAnaliz #Altcoin
21
·
--
While everyone expects a major surge, why are whales quietly changing positions?
A Critical Turning Point for Bitcoin Analysis and Altcoin Opportunities
As waters heat up in the crypto market, technical indicators are whispering a different scenario than ever. Even though making a Bitcoin price forecast is becoming harder, smart money movements are providing clear clues. In recent days, when we look at volume distribution on Binance, we can see that large investors are starting to shift liquidity toward altcoin projects. However, this does not mean a blind bull run. Instead, the market is now much more selective. Tokens with solid fundamentals and real-world use cases are coming to the forefront, while those that rise purely on speculation are falling behind. When doing your own research, don’t just look at charts—also examine on-chain activity. Risk management will always be your biggest advantage.
#Bitcoin #Binance #CryptoAnalysis
While everyone expects a major surge, why are whales quietly changing positions?
A Critical Turning Point for Bitcoin Analysis and Altcoin Opportunities
As waters heat up in the crypto market, technical indicators are whispering a different scenario than ever. Even though making a Bitcoin price forecast is becoming harder, smart money movements are providing clear clues. In recent days, when we look at volume distribution on Binance, we can see that large investors are starting to shift liquidity toward altcoin projects. However, this does not mean a blind bull run. Instead, the market is now much more selective. Tokens with solid fundamentals and real-world use cases are coming to the forefront, while those that rise purely on speculation are falling behind. When doing your own research, don’t just look at charts—also examine on-chain activity. Risk management will always be your biggest advantage.
#Bitcoin #Binance #CryptoAnalysis
A Critical Turning Point for Bitcoin Analysis and Altcoin Opportunities
As waters heat up in the crypto market, technical indicators are whispering a different scenario than ever. Even though making a Bitcoin price forecast is becoming harder, smart money movements are providing clear clues. In recent days, when we look at volume distribution on Binance, we can see that large investors are starting to shift liquidity toward altcoin projects. However, this does not mean a blind bull run. Instead, the market is now much more selective. Tokens with solid fundamentals and real-world use cases are coming to the forefront, while those that rise purely on speculation are falling behind. When doing your own research, don’t just look at charts—also examine on-chain activity. Risk management will always be your biggest advantage.
#Bitcoin #Binance #CryptoAnalysis
22

·
--
$HOME — opportunity 🚨
Price $0.00790, +%11.74! In 24 hours we’re seeing a massive volume of %157 — $60 million. But watch out: max supply is 10 billion, only 4.95 billion in circulation. Concentration is 15.71 — that’s very high, meaning there are big whales.
Down 88% from ATH of $0.070. The bottom came yesterday at $0.0068. Tagged as a DeFi App project, but the data is highly speculative.
Buy or sell? The risk is very high! Do your own research.
Follow these levels—don’t lose! 👇
Don’t forget to follow! 🔥
#HOME #DeFi #KriptoAnaliz
{future}(HOMEUSDT)
{future}(SEIUSDT)
{future}(ZBTUSDT)
$HOME — opportunity 🚨
Price $0.00790, +%11.74! In 24 hours we’re seeing a massive volume of %157 — $60 million. But watch out: max supply is 10 billion, only 4.95 billion in circulation. Concentration is 15.71 — that’s very high, meaning there are big whales.
Down 88% from ATH of $0.070. The bottom came yesterday at $0.0068. Tagged as a DeFi App project, but the data is highly speculative.
Buy or sell? The risk is very high! Do your own research.
Follow these levels—don’t lose! 👇
Don’t forget to follow! 🔥
#HOME #DeFi #KriptoAnaliz
Price $0.00790, +%11.74! In 24 hours we’re seeing a massive volume of %157 — $60 million. But watch out: max supply is 10 billion, only 4.95 billion in circulation. Concentration is 15.71 — that’s very high, meaning there are big whales.
Down 88% from ATH of $0.070. The bottom came yesterday at $0.0068. Tagged as a DeFi App project, but the data is highly speculative.
Buy or sell? The risk is very high! Do your own research.
Follow these levels—don’t lose! 👇
Don’t forget to follow! 🔥
#HOME #DeFi #KriptoAnaliz
309

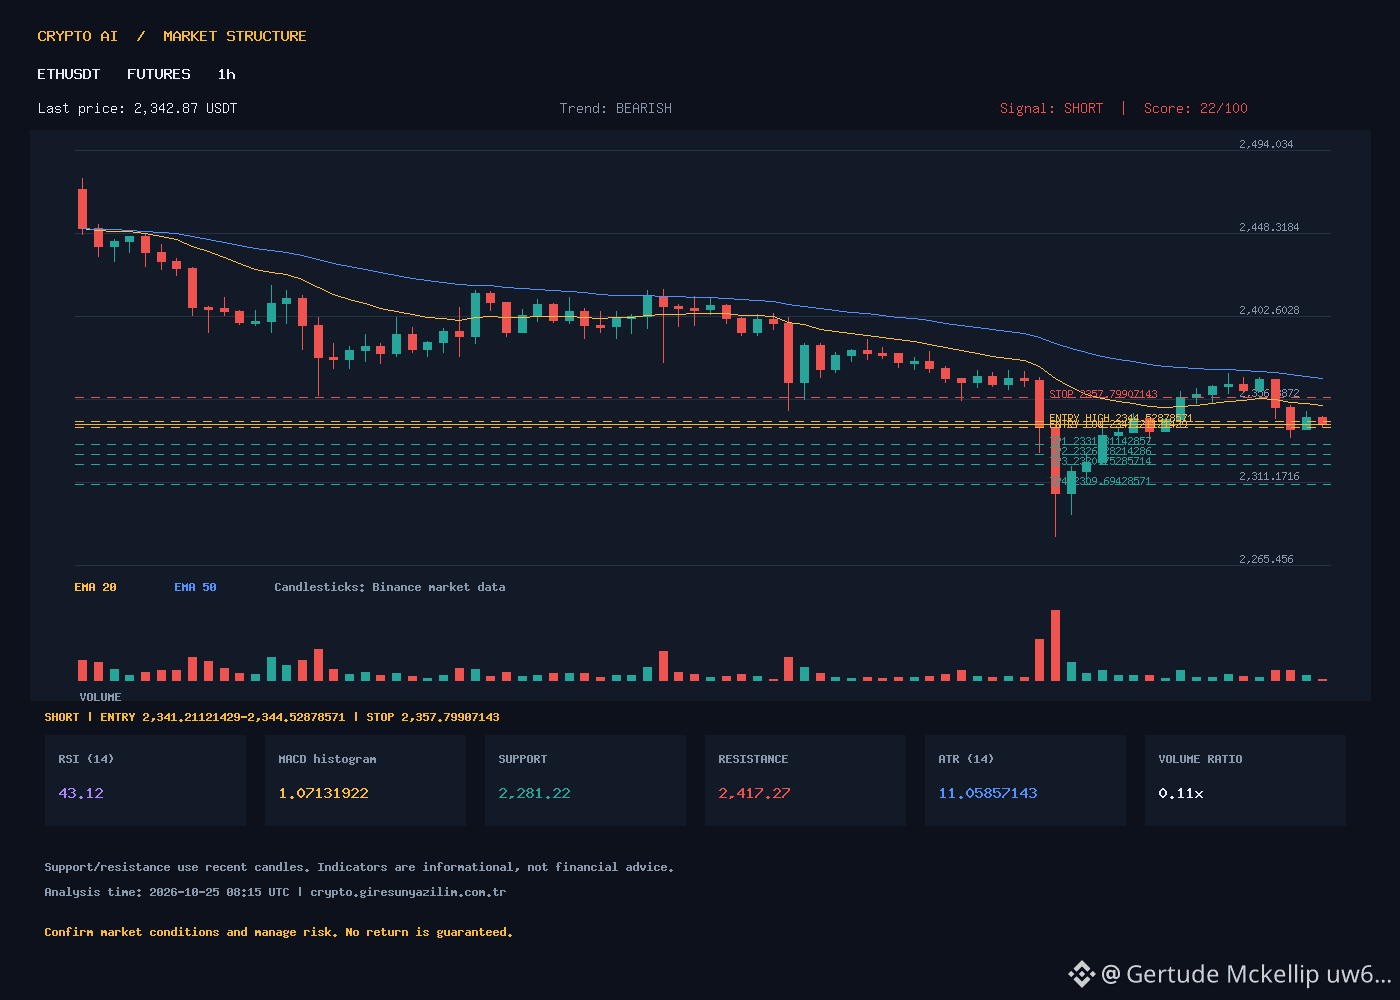
ETHUSDT 1-Hour SHORT Signal: ATR-Based Entry/Exit Levels | ETHUSDT 1H SHORT Signal: ATR-Based Entry/Exit Levels
🇹🇷 TURKISH
ETHUSDT 1h: BEARISH trend, score 22, SHORT signal. Price 2342.87, below EMA20 (2353.16), EMA50 (2368.46), and EMA200 (2400.11). RSI 43.12, MACD -5.08 (signal -6.15), histogram +1.07 indicates mild bullish divergence. ATR 11.06, volume is 11% of average (14.8K vs 139.6K) – low liquidity risk. Support 2281.22, resistance 2417.27.
Trade Plan (ATR-based scenario, not guaranteed):
Direction: SHORT
Entry range: 2341.21121429 – 2344.52878571 (mid 2342.87)
Stop-Loss: 2357.79907143
TP1: 2331.81142857
TP2: 2326.28214286
TP3: 2320.75285714
TP4: 2309.69428571
Risk: Low volume and a positive MACD histogram suggest a chance of a pullback. Will support at 2281 be tested?
🇬🇧 ENGLISH
ETHUSDT 1h: BEARISH trend, score 22, SHORT signal. Price 2342.87 below EMA20 (2353.16), EMA50 (2368.46), EMA200 (2400.11). RSI 43.12, MACD -5.08 (signal -6.15), histogram +1.07 hints mild bullish divergence. ATR 11.06, volume only 11% of average (14.8K vs 139.6K) – low liquidity risk. Support 2281.22, resistance 2417.27.
Trade Plan (ATR-based scenario, not guaranteed):
Direction: SHORT
Entry range: 2341.21121429 – 2344.52878571 (mid 2342.87)
Stop-Loss: 2357.79907143
TP1: 2331.81142857
TP2: 2326.28214286
TP3: 2320.75285714
TP4: 2309.69428571
Risk: Low volume and positive MACD histogram suggest pullback chance. Will 2281 support be tested?
#ETHUSDT #Short #TechnicalAnalysis #BinanceFutures #KriptoAnaliz
ETHUSDT 1-Hour SHORT Signal: ATR-Based Entry/Exit Levels | ETHUSDT 1H SHORT Signal: ATR-Based Entry/Exit Levels
🇹🇷 TURKISH
ETHUSDT 1h: BEARISH trend, score 22, SHORT signal. Price 2342.87, below EMA20 (2353.16), EMA50 (2368.46), and EMA200 (2400.11). RSI 43.12, MACD -5.08 (signal -6.15), histogram +1.07 indicates mild bullish divergence. ATR 11.06, volume is 11% of average (14.8K vs 139.6K) – low liquidity risk. Support 2281.22, resistance 2417.27.
Trade Plan (ATR-based scenario, not guaranteed):
Direction: SHORT
Entry range: 2341.21121429 – 2344.52878571 (mid 2342.87)
Stop-Loss: 2357.79907143
TP1: 2331.81142857
TP2: 2326.28214286
TP3: 2320.75285714
TP4: 2309.69428571
Risk: Low volume and a positive MACD histogram suggest a chance of a pullback. Will support at 2281 be tested?
🇬🇧 ENGLISH
ETHUSDT 1h: BEARISH trend, score 22, SHORT signal. Price 2342.87 below EMA20 (2353.16), EMA50 (2368.46), EMA200 (2400.11). RSI 43.12, MACD -5.08 (signal -6.15), histogram +1.07 hints mild bullish divergence. ATR 11.06, volume only 11% of average (14.8K vs 139.6K) – low liquidity risk. Support 2281.22, resistance 2417.27.
Trade Plan (ATR-based scenario, not guaranteed):
Direction: SHORT
Entry range: 2341.21121429 – 2344.52878571 (mid 2342.87)
Stop-Loss: 2357.79907143
TP1: 2331.81142857
TP2: 2326.28214286
TP3: 2320.75285714
TP4: 2309.69428571
Risk: Low volume and positive MACD histogram suggest pullback chance. Will 2281 support be tested?
#ETHUSDT #Short #TechnicalAnalysis #BinanceFutures #KriptoAnaliz
🇹🇷 TURKISH
ETHUSDT 1h: BEARISH trend, score 22, SHORT signal. Price 2342.87, below EMA20 (2353.16), EMA50 (2368.46), and EMA200 (2400.11). RSI 43.12, MACD -5.08 (signal -6.15), histogram +1.07 indicates mild bullish divergence. ATR 11.06, volume is 11% of average (14.8K vs 139.6K) – low liquidity risk. Support 2281.22, resistance 2417.27.
Trade Plan (ATR-based scenario, not guaranteed):
Direction: SHORT
Entry range: 2341.21121429 – 2344.52878571 (mid 2342.87)
Stop-Loss: 2357.79907143
TP1: 2331.81142857
TP2: 2326.28214286
TP3: 2320.75285714
TP4: 2309.69428571
Risk: Low volume and a positive MACD histogram suggest a chance of a pullback. Will support at 2281 be tested?
🇬🇧 ENGLISH
ETHUSDT 1h: BEARISH trend, score 22, SHORT signal. Price 2342.87 below EMA20 (2353.16), EMA50 (2368.46), EMA200 (2400.11). RSI 43.12, MACD -5.08 (signal -6.15), histogram +1.07 hints mild bullish divergence. ATR 11.06, volume only 11% of average (14.8K vs 139.6K) – low liquidity risk. Support 2281.22, resistance 2417.27.
Trade Plan (ATR-based scenario, not guaranteed):
Direction: SHORT
Entry range: 2341.21121429 – 2344.52878571 (mid 2342.87)
Stop-Loss: 2357.79907143
TP1: 2331.81142857
TP2: 2326.28214286
TP3: 2320.75285714
TP4: 2309.69428571
Risk: Low volume and positive MACD histogram suggest pullback chance. Will 2281 support be tested?
#ETHUSDT #Short #TechnicalAnalysis #BinanceFutures #KriptoAnaliz
5
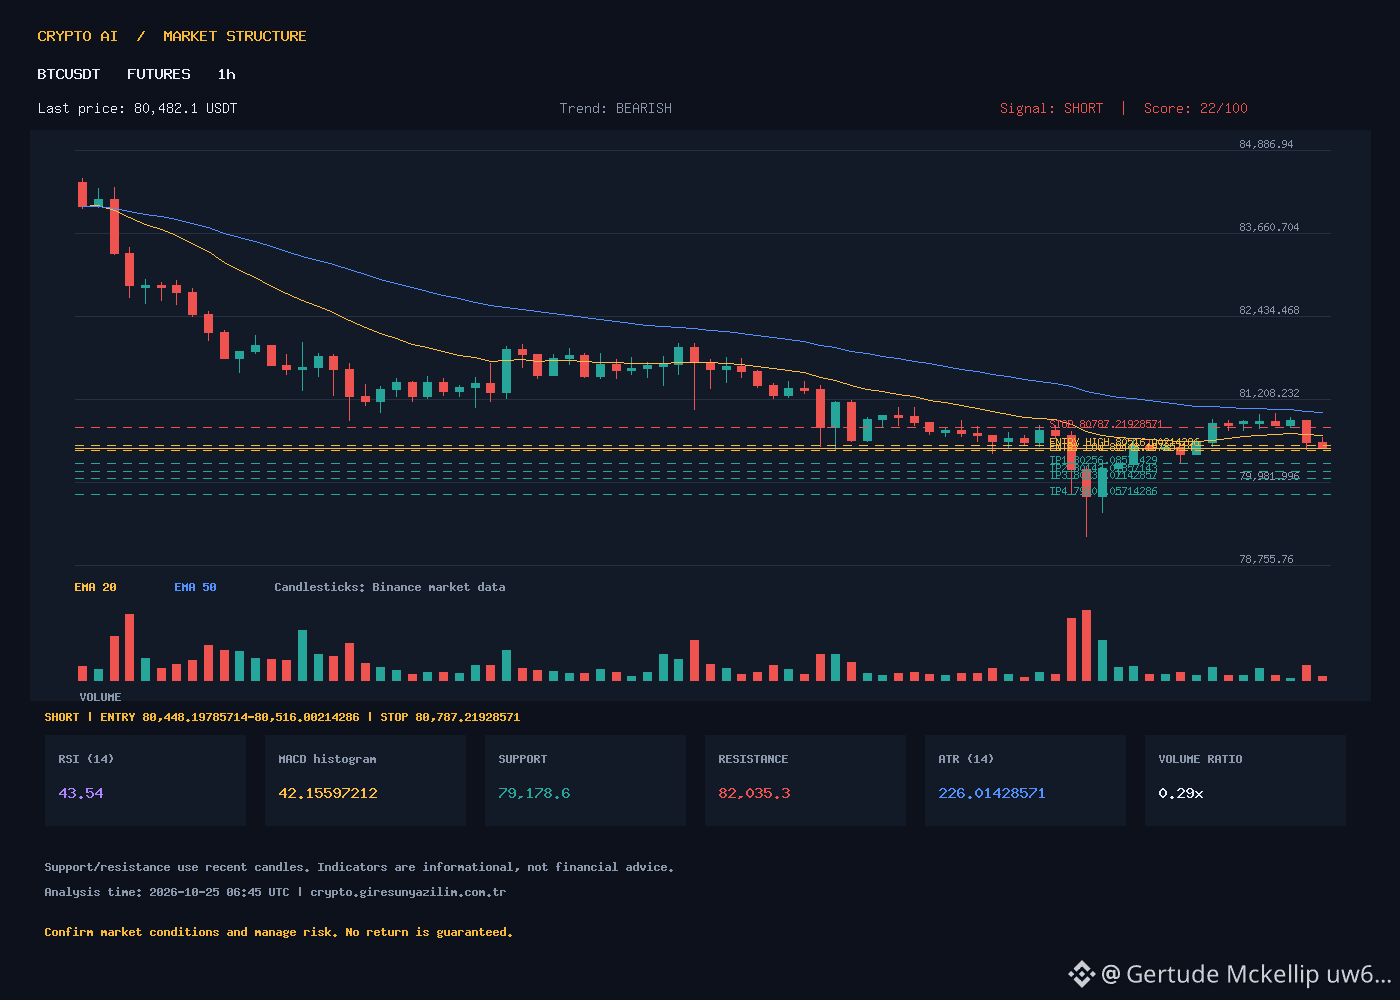
BTCUSDT 1H SHORT Signal: Downside Scenario with ATR-Based Levels | BTCUSDT 1H SHORT Signal: ATR-Based Levels for Downside Scenario
🇹🇷 TURKISH
Analysis: BTCUSDT 1-hour chart shows a BEARISH trend, score 22/100. Current price is 80,482.1 USDT. RSI 43.54 (neutral-leaning), EMA20 (80,671) and EMA50 (80,973) are below the price, while EMA200 (81,615) is strong resistance. MACD histogram is positive (+42.16), but the MACD line is below the signal line. ATR 226. Volume is 29% of average (low). Support 79,178.6; resistance 82,035.3.
SHORT signal confirmed. ATR-based levels (not guaranteed):
Entry range: 80,448.20 – 80,516.00 (mid 80,482.10)
Stop-Loss: 80,787.22
TP1: 80,256.09
TP2: 80,143.08
TP3: 80,030.07
TP4: 79,804.06
Risk: Low volume and a positive MACD histogram create a risk of a short-term pullback. Adjust position size according to risk.
Discussion: Does it make sense to take a SHORT position in low volume, or should we wait for volume to increase?
🇬🇧 ENGLISH
Analysis: BTCUSDT 1H chart shows BEARISH trend, score 22/100. Current price 80,482.1 USDT. RSI 43.54 (neutral-leaning), EMA20 (80,671) and EMA50 (80,973) above price while EMA200 (81,615) acts as strong resistance. MACD histogram positive (+42.16) but MACD line below signal line. ATR 226. Volume at 29% of average (low). Support 79,178.6; resistance 82,035.3.
SHORT signal confirmed. ATR-based levels (not guaranteed):
Entry range: 80,448.20 – 80,516.00 (mid 80,482.10)
Stop-Loss: 80,787.22
TP1: 80,256.09
TP2: 80,143.08
TP3: 80,030.07
TP4: 79,804.06
Risk: Low volume and positive MACD histogram suggest short-term pullback risk. Size position according to risk tolerance.
Discussion: Is taking a SHORT in low volume sensible, or should we wait for volume expansion?
#BTCUSDT #Bitcoin #KriptoAnaliz #FuturesTrading #ShortSinyali
BTCUSDT 1H SHORT Signal: Downside Scenario with ATR-Based Levels | BTCUSDT 1H SHORT Signal: ATR-Based Levels for Downside Scenario
🇹🇷 TURKISH
Analysis: BTCUSDT 1-hour chart shows a BEARISH trend, score 22/100. Current price is 80,482.1 USDT. RSI 43.54 (neutral-leaning), EMA20 (80,671) and EMA50 (80,973) are below the price, while EMA200 (81,615) is strong resistance. MACD histogram is positive (+42.16), but the MACD line is below the signal line. ATR 226. Volume is 29% of average (low). Support 79,178.6; resistance 82,035.3.
SHORT signal confirmed. ATR-based levels (not guaranteed):
Entry range: 80,448.20 – 80,516.00 (mid 80,482.10)
Stop-Loss: 80,787.22
TP1: 80,256.09
TP2: 80,143.08
TP3: 80,030.07
TP4: 79,804.06
Risk: Low volume and a positive MACD histogram create a risk of a short-term pullback. Adjust position size according to risk.
Discussion: Does it make sense to take a SHORT position in low volume, or should we wait for volume to increase?
🇬🇧 ENGLISH
Analysis: BTCUSDT 1H chart shows BEARISH trend, score 22/100. Current price 80,482.1 USDT. RSI 43.54 (neutral-leaning), EMA20 (80,671) and EMA50 (80,973) above price while EMA200 (81,615) acts as strong resistance. MACD histogram positive (+42.16) but MACD line below signal line. ATR 226. Volume at 29% of average (low). Support 79,178.6; resistance 82,035.3.
SHORT signal confirmed. ATR-based levels (not guaranteed):
Entry range: 80,448.20 – 80,516.00 (mid 80,482.10)
Stop-Loss: 80,787.22
TP1: 80,256.09
TP2: 80,143.08
TP3: 80,030.07
TP4: 79,804.06
Risk: Low volume and positive MACD histogram suggest short-term pullback risk. Size position according to risk tolerance.
Discussion: Is taking a SHORT in low volume sensible, or should we wait for volume expansion?
#BTCUSDT #Bitcoin #KriptoAnaliz #FuturesTrading #ShortSinyali
🇹🇷 TURKISH
Analysis: BTCUSDT 1-hour chart shows a BEARISH trend, score 22/100. Current price is 80,482.1 USDT. RSI 43.54 (neutral-leaning), EMA20 (80,671) and EMA50 (80,973) are below the price, while EMA200 (81,615) is strong resistance. MACD histogram is positive (+42.16), but the MACD line is below the signal line. ATR 226. Volume is 29% of average (low). Support 79,178.6; resistance 82,035.3.
SHORT signal confirmed. ATR-based levels (not guaranteed):
Entry range: 80,448.20 – 80,516.00 (mid 80,482.10)
Stop-Loss: 80,787.22
TP1: 80,256.09
TP2: 80,143.08
TP3: 80,030.07
TP4: 79,804.06
Risk: Low volume and a positive MACD histogram create a risk of a short-term pullback. Adjust position size according to risk.
Discussion: Does it make sense to take a SHORT position in low volume, or should we wait for volume to increase?
🇬🇧 ENGLISH
Analysis: BTCUSDT 1H chart shows BEARISH trend, score 22/100. Current price 80,482.1 USDT. RSI 43.54 (neutral-leaning), EMA20 (80,671) and EMA50 (80,973) above price while EMA200 (81,615) acts as strong resistance. MACD histogram positive (+42.16) but MACD line below signal line. ATR 226. Volume at 29% of average (low). Support 79,178.6; resistance 82,035.3.
SHORT signal confirmed. ATR-based levels (not guaranteed):
Entry range: 80,448.20 – 80,516.00 (mid 80,482.10)
Stop-Loss: 80,787.22
TP1: 80,256.09
TP2: 80,143.08
TP3: 80,030.07
TP4: 79,804.06
Risk: Low volume and positive MACD histogram suggest short-term pullback risk. Size position according to risk tolerance.
Discussion: Is taking a SHORT in low volume sensible, or should we wait for volume expansion?
#BTCUSDT #Bitcoin #KriptoAnaliz #FuturesTrading #ShortSinyali
4
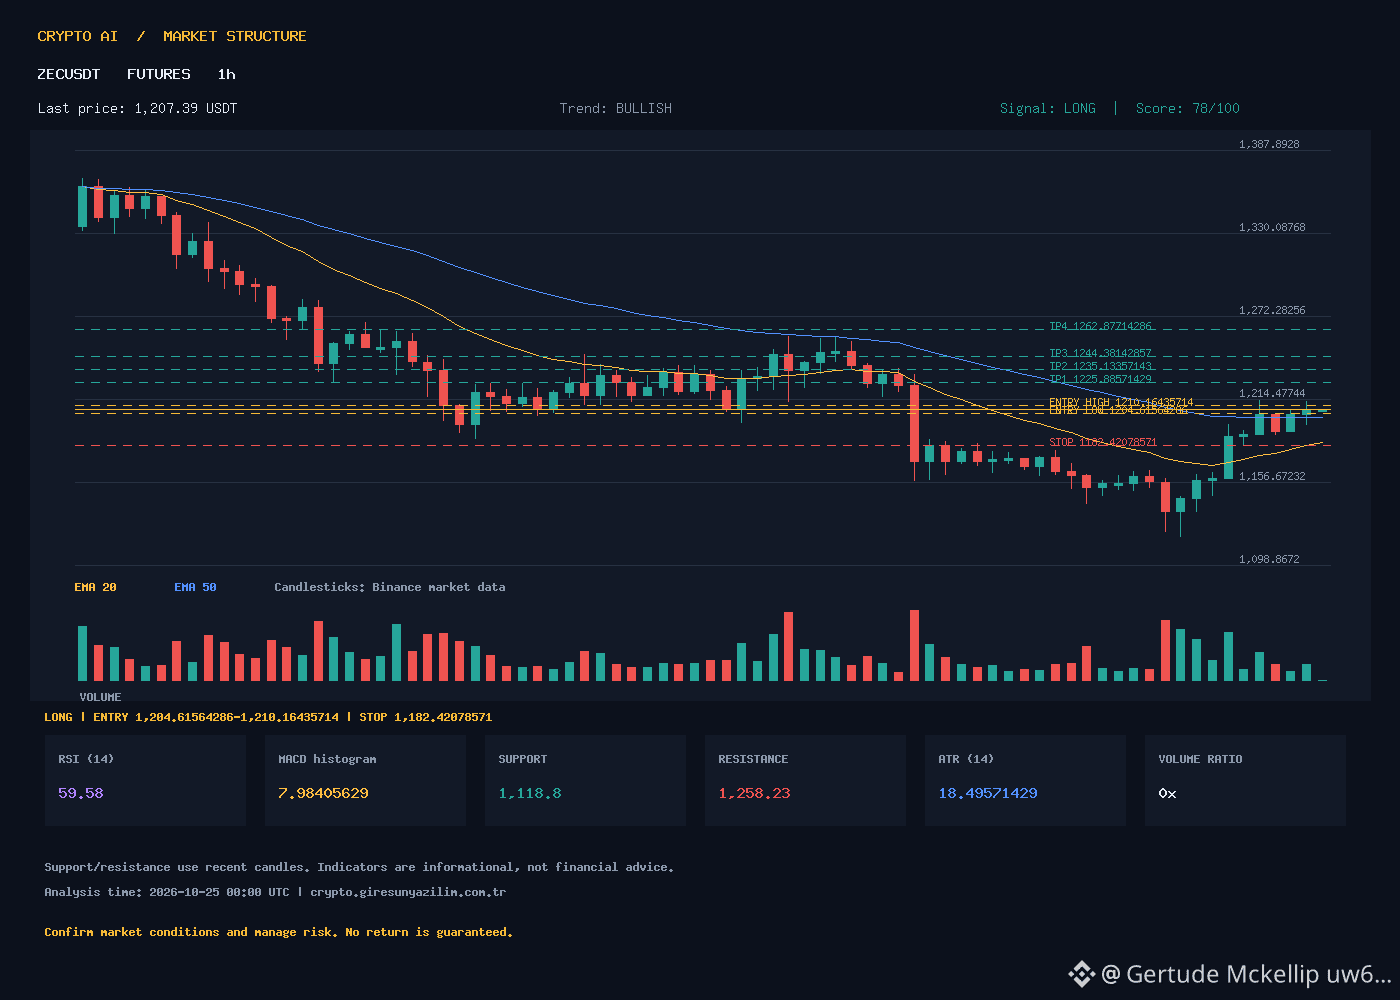
ZECUSDT 1-Hour Chart: ATR-Based LONG Scenario | ZECUSDT 1H Chart: ATR-Based LONG Scenario
🇹🇷 TURKISH
The trend on the ZECUSDT 1-hour chart is **BULLISH**, with a score of 78/100 and a **LONG** signal. Current price: 1207.39 USDT. RSI 59.58 (neutral-bullish), EMA20 1184.42, EMA50 1196.40, EMA200 1188.88 – price is above all three EMAs. MACD histogram +7.98, above the MACD signal line; momentum is upward. ATR 18.50, support 1118.80, resistance 1258.23. Volume on the last candle is 23.00 (average 49,522) – extremely low, confirmation pending.
**Trade Plan (ATR-based illustrative levels, not guaranteed):**
- Direction: LONG
- Entry range: 1204.62 – 1210.16 (midpoint 1207.39)
- Stop-Loss: 1182.42
- TP1: 1225.89
- TP2: 1235.13
- TP3: 1244.38
- TP4: 1262.88
Risk/reward depends on the entry price; adjust position size according to your risk tolerance. Low volume means confirmation is pending; watch candle closes.
🇬🇧 ENGLISH
ZECUSDT 1-hour chart shows **BULLISH** trend, score 78/100, signal **LONG**. Current price 1207.39 USDT. RSI 59.58 (neutral-bullish), EMA20 1184.42, EMA50 1196.40, EMA200 1188.88 – price above all three EMAs. MACD histogram +7.98 above signal line; momentum up. ATR 18.50, support 1118.80, resistance 1258.23. Volume on last candle 23.00 (avg 49,522) – extremely low, awaiting confirmation.
**Trade Plan (ATR-based illustrative levels, not guaranteed):**
- Direction: LONG
- Entry range: 1204.62 – 1210.16 (mid 1207.39)
- Stop-Loss: 1182.42
- TP1: 1225.89
- TP2: 1235.13
- TP3: 1244.38
- TP4: 1262.88
Risk/reward depends on actual entry; size position to your risk tolerance. Low volume awaits confirmation; watch candle closes.
#ZECUSDT #Zcash #KriptoAnaliz #CryptoAnalysis #FuturesTrading
ZECUSDT 1-Hour Chart: ATR-Based LONG Scenario | ZECUSDT 1H Chart: ATR-Based LONG Scenario
🇹🇷 TURKISH
The trend on the ZECUSDT 1-hour chart is **BULLISH**, with a score of 78/100 and a **LONG** signal. Current price: 1207.39 USDT. RSI 59.58 (neutral-bullish), EMA20 1184.42, EMA50 1196.40, EMA200 1188.88 – price is above all three EMAs. MACD histogram +7.98, above the MACD signal line; momentum is upward. ATR 18.50, support 1118.80, resistance 1258.23. Volume on the last candle is 23.00 (average 49,522) – extremely low, confirmation pending.
**Trade Plan (ATR-based illustrative levels, not guaranteed):**
- Direction: LONG
- Entry range: 1204.62 – 1210.16 (midpoint 1207.39)
- Stop-Loss: 1182.42
- TP1: 1225.89
- TP2: 1235.13
- TP3: 1244.38
- TP4: 1262.88
Risk/reward depends on the entry price; adjust position size according to your risk tolerance. Low volume means confirmation is pending; watch candle closes.
🇬🇧 ENGLISH
ZECUSDT 1-hour chart shows **BULLISH** trend, score 78/100, signal **LONG**. Current price 1207.39 USDT. RSI 59.58 (neutral-bullish), EMA20 1184.42, EMA50 1196.40, EMA200 1188.88 – price above all three EMAs. MACD histogram +7.98 above signal line; momentum up. ATR 18.50, support 1118.80, resistance 1258.23. Volume on last candle 23.00 (avg 49,522) – extremely low, awaiting confirmation.
**Trade Plan (ATR-based illustrative levels, not guaranteed):**
- Direction: LONG
- Entry range: 1204.62 – 1210.16 (mid 1207.39)
- Stop-Loss: 1182.42
- TP1: 1225.89
- TP2: 1235.13
- TP3: 1244.38
- TP4: 1262.88
Risk/reward depends on actual entry; size position to your risk tolerance. Low volume awaits confirmation; watch candle closes.
#ZECUSDT #Zcash #KriptoAnaliz #CryptoAnalysis #FuturesTrading
🇹🇷 TURKISH
The trend on the ZECUSDT 1-hour chart is **BULLISH**, with a score of 78/100 and a **LONG** signal. Current price: 1207.39 USDT. RSI 59.58 (neutral-bullish), EMA20 1184.42, EMA50 1196.40, EMA200 1188.88 – price is above all three EMAs. MACD histogram +7.98, above the MACD signal line; momentum is upward. ATR 18.50, support 1118.80, resistance 1258.23. Volume on the last candle is 23.00 (average 49,522) – extremely low, confirmation pending.
**Trade Plan (ATR-based illustrative levels, not guaranteed):**
- Direction: LONG
- Entry range: 1204.62 – 1210.16 (midpoint 1207.39)
- Stop-Loss: 1182.42
- TP1: 1225.89
- TP2: 1235.13
- TP3: 1244.38
- TP4: 1262.88
Risk/reward depends on the entry price; adjust position size according to your risk tolerance. Low volume means confirmation is pending; watch candle closes.
🇬🇧 ENGLISH
ZECUSDT 1-hour chart shows **BULLISH** trend, score 78/100, signal **LONG**. Current price 1207.39 USDT. RSI 59.58 (neutral-bullish), EMA20 1184.42, EMA50 1196.40, EMA200 1188.88 – price above all three EMAs. MACD histogram +7.98 above signal line; momentum up. ATR 18.50, support 1118.80, resistance 1258.23. Volume on last candle 23.00 (avg 49,522) – extremely low, awaiting confirmation.
**Trade Plan (ATR-based illustrative levels, not guaranteed):**
- Direction: LONG
- Entry range: 1204.62 – 1210.16 (mid 1207.39)
- Stop-Loss: 1182.42
- TP1: 1225.89
- TP2: 1235.13
- TP3: 1244.38
- TP4: 1262.88
Risk/reward depends on actual entry; size position to your risk tolerance. Low volume awaits confirmation; watch candle closes.
#ZECUSDT #Zcash #KriptoAnaliz #CryptoAnalysis #FuturesTrading
66
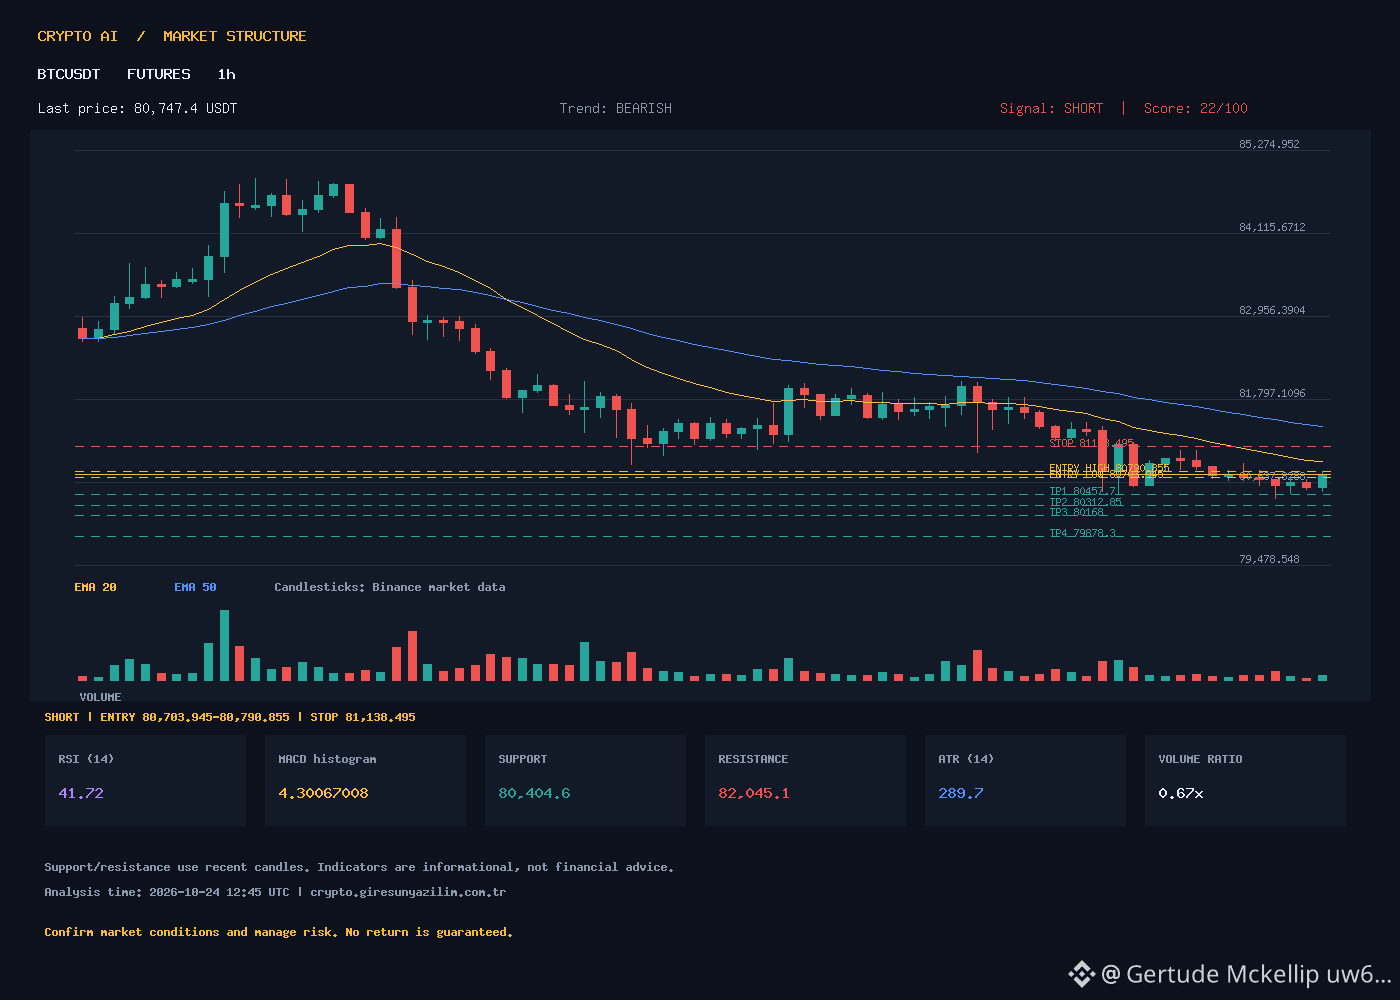
BTCUSDT Technical Analysis: Bearish Trend Dominates | BTCUSDT Technical Analysis: Bearish Trend Dominates
🇹🇷 TURKISH
BTC is in a clear downtrend on the 1-hour chart. The price (80747.4) is trading below EMA20 (80923.28), EMA50 (81394.82), and EMA200 (81824.34), confirming strong selling pressure. RSI at 41.72 indicates weak momentum, while MACD remains in negative territory. Volume is below average (67%), indicating low participation. Support is at 80404.6, while resistance is at 82045.1.
Signal: SHORT (Duration: 1H)
Entry Range: 80703.945 - 80790.855
Stop-Loss: 81138.495
TP1: 80457.7
TP2: 80312.85
TP3: 80168
TP4: 79878.3
These levels are ATR-based scenarios, not guaranteed outcomes or personalized investment advice.
Do you think BTC can stay below the 80,000 psychological threshold?
🇬🇧 ENGLISH
BTC is in a distinct downtrend on the 1h timeframe. The price (80747.4) is trading below EMA20 (80923.28), EMA50 (81394.82), and EMA200 (81824.34), confirming strong selling pressure. RSI at 41.72 indicates weak momentum, while MACD remains in negative territory. Volume is below average (67% ratio), suggesting low participation. Support is at 80404.6 and resistance at 82045.1.
Signal: SHORT (Timeframe: 1H)
Entry Range: 80703.945 - 80790.855
Stop-Loss: 81138.495
TP1: 80457.7
TP2: 80312.85
TP3: 80168
TP4: 79878.3
These levels are ATR-based scenarios, not guaranteed outcomes or personalized financial advice.
Do you think BTC will maintain its position below the 80,000 psychological threshold?
#BTC #Bitcoin #KriptoAnaliz #Trading #TechnicalAnalysis
BTCUSDT Technical Analysis: Bearish Trend Dominates | BTCUSDT Technical Analysis: Bearish Trend Dominates
🇹🇷 TURKISH
BTC is in a clear downtrend on the 1-hour chart. The price (80747.4) is trading below EMA20 (80923.28), EMA50 (81394.82), and EMA200 (81824.34), confirming strong selling pressure. RSI at 41.72 indicates weak momentum, while MACD remains in negative territory. Volume is below average (67%), indicating low participation. Support is at 80404.6, while resistance is at 82045.1.
Signal: SHORT (Duration: 1H)
Entry Range: 80703.945 - 80790.855
Stop-Loss: 81138.495
TP1: 80457.7
TP2: 80312.85
TP3: 80168
TP4: 79878.3
These levels are ATR-based scenarios, not guaranteed outcomes or personalized investment advice.
Do you think BTC can stay below the 80,000 psychological threshold?
🇬🇧 ENGLISH
BTC is in a distinct downtrend on the 1h timeframe. The price (80747.4) is trading below EMA20 (80923.28), EMA50 (81394.82), and EMA200 (81824.34), confirming strong selling pressure. RSI at 41.72 indicates weak momentum, while MACD remains in negative territory. Volume is below average (67% ratio), suggesting low participation. Support is at 80404.6 and resistance at 82045.1.
Signal: SHORT (Timeframe: 1H)
Entry Range: 80703.945 - 80790.855
Stop-Loss: 81138.495
TP1: 80457.7
TP2: 80312.85
TP3: 80168
TP4: 79878.3
These levels are ATR-based scenarios, not guaranteed outcomes or personalized financial advice.
Do you think BTC will maintain its position below the 80,000 psychological threshold?
#BTC #Bitcoin #KriptoAnaliz #Trading #TechnicalAnalysis
🇹🇷 TURKISH
BTC is in a clear downtrend on the 1-hour chart. The price (80747.4) is trading below EMA20 (80923.28), EMA50 (81394.82), and EMA200 (81824.34), confirming strong selling pressure. RSI at 41.72 indicates weak momentum, while MACD remains in negative territory. Volume is below average (67%), indicating low participation. Support is at 80404.6, while resistance is at 82045.1.
Signal: SHORT (Duration: 1H)
Entry Range: 80703.945 - 80790.855
Stop-Loss: 81138.495
TP1: 80457.7
TP2: 80312.85
TP3: 80168
TP4: 79878.3
These levels are ATR-based scenarios, not guaranteed outcomes or personalized investment advice.
Do you think BTC can stay below the 80,000 psychological threshold?
🇬🇧 ENGLISH
BTC is in a distinct downtrend on the 1h timeframe. The price (80747.4) is trading below EMA20 (80923.28), EMA50 (81394.82), and EMA200 (81824.34), confirming strong selling pressure. RSI at 41.72 indicates weak momentum, while MACD remains in negative territory. Volume is below average (67% ratio), suggesting low participation. Support is at 80404.6 and resistance at 82045.1.
Signal: SHORT (Timeframe: 1H)
Entry Range: 80703.945 - 80790.855
Stop-Loss: 81138.495
TP1: 80457.7
TP2: 80312.85
TP3: 80168
TP4: 79878.3
These levels are ATR-based scenarios, not guaranteed outcomes or personalized financial advice.
Do you think BTC will maintain its position below the 80,000 psychological threshold?
#BTC #Bitcoin #KriptoAnaliz #Trading #TechnicalAnalysis
3
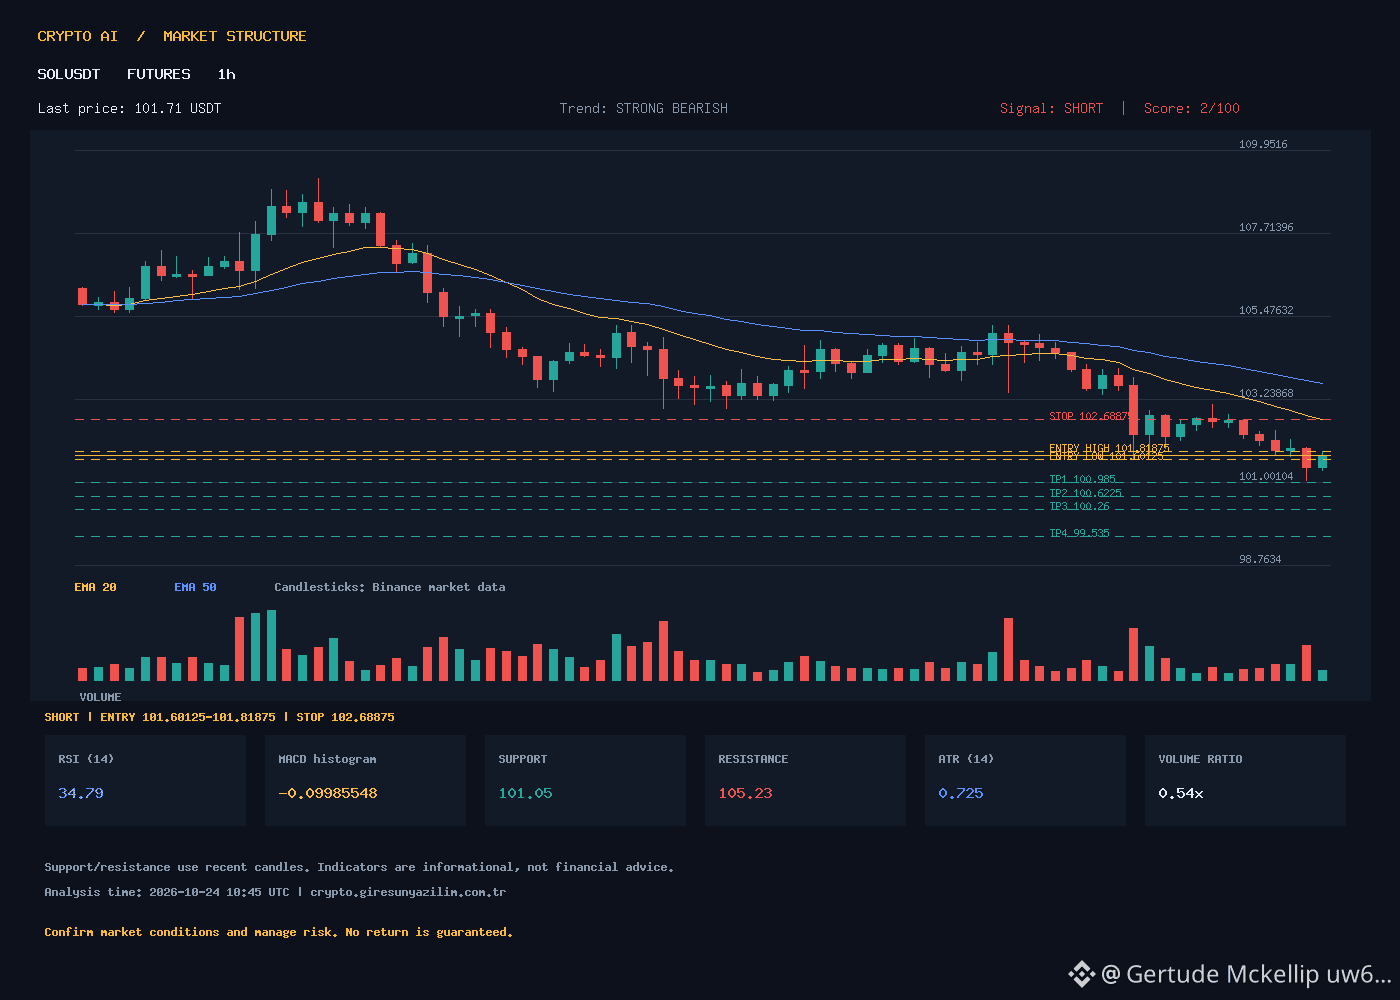
SOLUSDT 1H STRONG BEARISH SHORT Signal | SOLUSDT 1H STRONG BEARISH SHORT Signal
🇹🇷 TURKISH
SOLUSDT is continuing its STRONG BEARISH trend on the 1-hour chart (score 2). Price is 101.71, and RSI is 34.79 (close to oversold territory). Price is below EMA20 at 102.69, EMA50 at 103.63, and EMA200 at 104.41; MACD is -0.67, signal is -0.57, and histogram is negative at -0.10. ATR is 0.725, and the volume ratio is 0.54 (below average). Support is 101.05, and resistance is 105.23.
SHORT signal confirmed. ATR-based levels (not guaranteed):
Entry range: 101.60125 – 101.81875 (midpoint 101.71)
Stop-Loss: 102.68875
TP1: 100.985 | TP2: 100.6225 | TP3: 100.26 | TP4: 99.535
Risk management should not be overlooked. These levels are for illustrative scenarios only, not guaranteed outcomes.
Discussion: Can the current downside momentum test the 101.05 support?
🇬🇧 ENGLISH
SOLUSDT 1H shows STRONG BEARISH trend (score 2). Price 101.71, RSI 34.79 near oversold. EMA20 102.69, EMA50 103.63, EMA200 104.41 all above price; MACD -0.67, signal -0.57, histogram -0.10 negative. ATR 0.725, volume ratio 0.54 below average. Support 101.05, resistance 105.23.
SHORT signal confirmed. ATR-based levels (not guaranteed):
Entry range: 101.60125 – 101.81875 (mid 101.71)
Stop-Loss: 102.68875
TP1: 100.985 | TP2: 100.6225 | TP3: 100.26 | TP4: 99.535
Risk management essential. Levels are illustrative scenarios only.
Discussion: Can current downside momentum test the 101.05 support?
#SOLUSDT #ShortSignal #TechnicalAnalysis #KriptoAnaliz #BinanceFutures
SOLUSDT 1H STRONG BEARISH SHORT Signal | SOLUSDT 1H STRONG BEARISH SHORT Signal
🇹🇷 TURKISH
SOLUSDT is continuing its STRONG BEARISH trend on the 1-hour chart (score 2). Price is 101.71, and RSI is 34.79 (close to oversold territory). Price is below EMA20 at 102.69, EMA50 at 103.63, and EMA200 at 104.41; MACD is -0.67, signal is -0.57, and histogram is negative at -0.10. ATR is 0.725, and the volume ratio is 0.54 (below average). Support is 101.05, and resistance is 105.23.
SHORT signal confirmed. ATR-based levels (not guaranteed):
Entry range: 101.60125 – 101.81875 (midpoint 101.71)
Stop-Loss: 102.68875
TP1: 100.985 | TP2: 100.6225 | TP3: 100.26 | TP4: 99.535
Risk management should not be overlooked. These levels are for illustrative scenarios only, not guaranteed outcomes.
Discussion: Can the current downside momentum test the 101.05 support?
🇬🇧 ENGLISH
SOLUSDT 1H shows STRONG BEARISH trend (score 2). Price 101.71, RSI 34.79 near oversold. EMA20 102.69, EMA50 103.63, EMA200 104.41 all above price; MACD -0.67, signal -0.57, histogram -0.10 negative. ATR 0.725, volume ratio 0.54 below average. Support 101.05, resistance 105.23.
SHORT signal confirmed. ATR-based levels (not guaranteed):
Entry range: 101.60125 – 101.81875 (mid 101.71)
Stop-Loss: 102.68875
TP1: 100.985 | TP2: 100.6225 | TP3: 100.26 | TP4: 99.535
Risk management essential. Levels are illustrative scenarios only.
Discussion: Can current downside momentum test the 101.05 support?
#SOLUSDT #ShortSignal #TechnicalAnalysis #KriptoAnaliz #BinanceFutures
🇹🇷 TURKISH
SOLUSDT is continuing its STRONG BEARISH trend on the 1-hour chart (score 2). Price is 101.71, and RSI is 34.79 (close to oversold territory). Price is below EMA20 at 102.69, EMA50 at 103.63, and EMA200 at 104.41; MACD is -0.67, signal is -0.57, and histogram is negative at -0.10. ATR is 0.725, and the volume ratio is 0.54 (below average). Support is 101.05, and resistance is 105.23.
SHORT signal confirmed. ATR-based levels (not guaranteed):
Entry range: 101.60125 – 101.81875 (midpoint 101.71)
Stop-Loss: 102.68875
TP1: 100.985 | TP2: 100.6225 | TP3: 100.26 | TP4: 99.535
Risk management should not be overlooked. These levels are for illustrative scenarios only, not guaranteed outcomes.
Discussion: Can the current downside momentum test the 101.05 support?
🇬🇧 ENGLISH
SOLUSDT 1H shows STRONG BEARISH trend (score 2). Price 101.71, RSI 34.79 near oversold. EMA20 102.69, EMA50 103.63, EMA200 104.41 all above price; MACD -0.67, signal -0.57, histogram -0.10 negative. ATR 0.725, volume ratio 0.54 below average. Support 101.05, resistance 105.23.
SHORT signal confirmed. ATR-based levels (not guaranteed):
Entry range: 101.60125 – 101.81875 (mid 101.71)
Stop-Loss: 102.68875
TP1: 100.985 | TP2: 100.6225 | TP3: 100.26 | TP4: 99.535
Risk management essential. Levels are illustrative scenarios only.
Discussion: Can current downside momentum test the 101.05 support?
#SOLUSDT #ShortSignal #TechnicalAnalysis #KriptoAnaliz #BinanceFutures
8
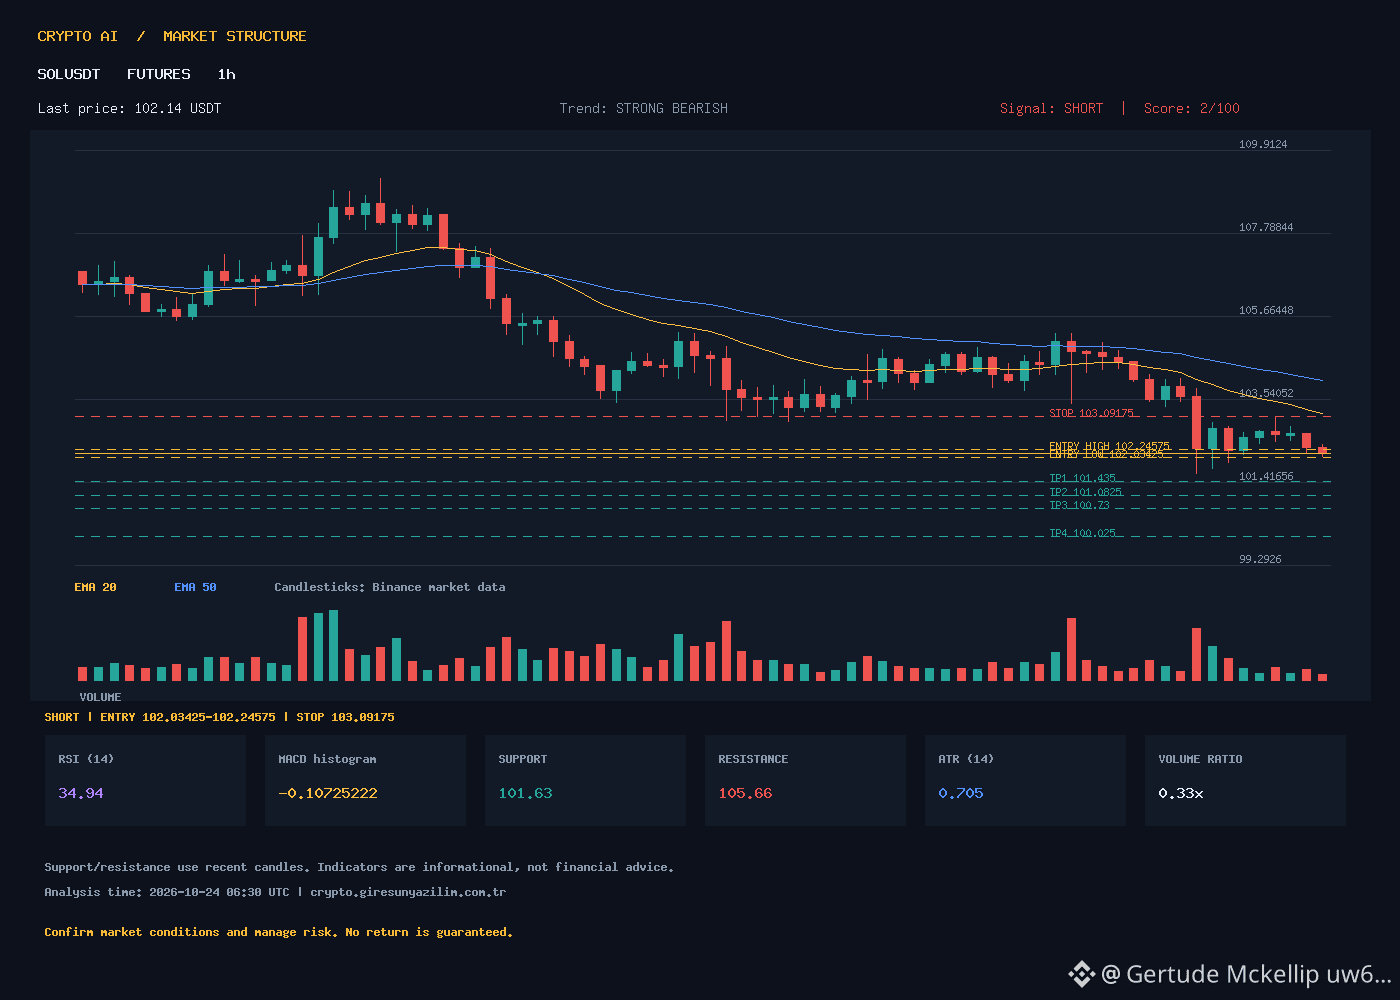
SOLUSDT 1H Short Position Opportunity | SOLUSDT 1H Short Setup
🇹🇷 TURKISH
SOLUSDT 1-hour chart shows a strong downtrend (STRONG BEARISH, score 2/10). Price is at 102.14, below EMA20 (103.17), EMA50 (103.96) and EMA200 (104.54). RSI at 34.94 is approaching oversold territory; the MACD histogram at -0.107 indicates negative momentum continues. ATR is 0.705, support is 101.63, and resistance is 105.66. Volume is 33% of average (147K vs. 447K avg.) — low liquidity increases the risk of false breakout signals.
⚠️ SIGNAL: SHORT (ATR-based scenario, not guaranteed)
Entry range: 102.03425 – 102.24575
Stop-Loss: 103.09175
TP1: 101.435 | TP2: 101.0825 | TP3: 100.73 | TP4: 100.025
🇬🇧 ENGLISH
SOLUSDT 1H shows a strong downtrend (STRONG BEARISH, score 2/10). Price at 102.14 sits below EMA20 (103.17), EMA50 (103.96) and EMA200 (104.54). RSI 34.94 nearing oversold; MACD histogram -0.107 confirms negative momentum. ATR 0.705, support 101.63, resistance 105.66. Volume only 33% of average (147K vs 447K avg) – low liquidity raises false-break risk.
⚠️ SIGNAL: SHORT (ATR-based scenario, not guaranteed)
Entry range: 102.03425 – 102.24575
Stop-Loss: 103.09175
TP1: 101.435 | TP2: 101.0825 | TP3: 100.73 | TP4: 100.025
Low volume pullback near 102.5 could offer better risk/reward — what’s your take?
#SOLUSDT #Solana #KriptoAnaliz #FuturesTrading #ShortSetup
SOLUSDT 1H Short Position Opportunity | SOLUSDT 1H Short Setup
🇹🇷 TURKISH
SOLUSDT 1-hour chart shows a strong downtrend (STRONG BEARISH, score 2/10). Price is at 102.14, below EMA20 (103.17), EMA50 (103.96) and EMA200 (104.54). RSI at 34.94 is approaching oversold territory; the MACD histogram at -0.107 indicates negative momentum continues. ATR is 0.705, support is 101.63, and resistance is 105.66. Volume is 33% of average (147K vs. 447K avg.) — low liquidity increases the risk of false breakout signals.
⚠️ SIGNAL: SHORT (ATR-based scenario, not guaranteed)
Entry range: 102.03425 – 102.24575
Stop-Loss: 103.09175
TP1: 101.435 | TP2: 101.0825 | TP3: 100.73 | TP4: 100.025
🇬🇧 ENGLISH
SOLUSDT 1H shows a strong downtrend (STRONG BEARISH, score 2/10). Price at 102.14 sits below EMA20 (103.17), EMA50 (103.96) and EMA200 (104.54). RSI 34.94 nearing oversold; MACD histogram -0.107 confirms negative momentum. ATR 0.705, support 101.63, resistance 105.66. Volume only 33% of average (147K vs 447K avg) – low liquidity raises false-break risk.
⚠️ SIGNAL: SHORT (ATR-based scenario, not guaranteed)
Entry range: 102.03425 – 102.24575
Stop-Loss: 103.09175
TP1: 101.435 | TP2: 101.0825 | TP3: 100.73 | TP4: 100.025
Low volume pullback near 102.5 could offer better risk/reward — what’s your take?
#SOLUSDT #Solana #KriptoAnaliz #FuturesTrading #ShortSetup
🇹🇷 TURKISH
SOLUSDT 1-hour chart shows a strong downtrend (STRONG BEARISH, score 2/10). Price is at 102.14, below EMA20 (103.17), EMA50 (103.96) and EMA200 (104.54). RSI at 34.94 is approaching oversold territory; the MACD histogram at -0.107 indicates negative momentum continues. ATR is 0.705, support is 101.63, and resistance is 105.66. Volume is 33% of average (147K vs. 447K avg.) — low liquidity increases the risk of false breakout signals.
⚠️ SIGNAL: SHORT (ATR-based scenario, not guaranteed)
Entry range: 102.03425 – 102.24575
Stop-Loss: 103.09175
TP1: 101.435 | TP2: 101.0825 | TP3: 100.73 | TP4: 100.025
🇬🇧 ENGLISH
SOLUSDT 1H shows a strong downtrend (STRONG BEARISH, score 2/10). Price at 102.14 sits below EMA20 (103.17), EMA50 (103.96) and EMA200 (104.54). RSI 34.94 nearing oversold; MACD histogram -0.107 confirms negative momentum. ATR 0.705, support 101.63, resistance 105.66. Volume only 33% of average (147K vs 447K avg) – low liquidity raises false-break risk.
⚠️ SIGNAL: SHORT (ATR-based scenario, not guaranteed)
Entry range: 102.03425 – 102.24575
Stop-Loss: 103.09175
TP1: 101.435 | TP2: 101.0825 | TP3: 100.73 | TP4: 100.025
Low volume pullback near 102.5 could offer better risk/reward — what’s your take?
#SOLUSDT #Solana #KriptoAnaliz #FuturesTrading #ShortSetup
1
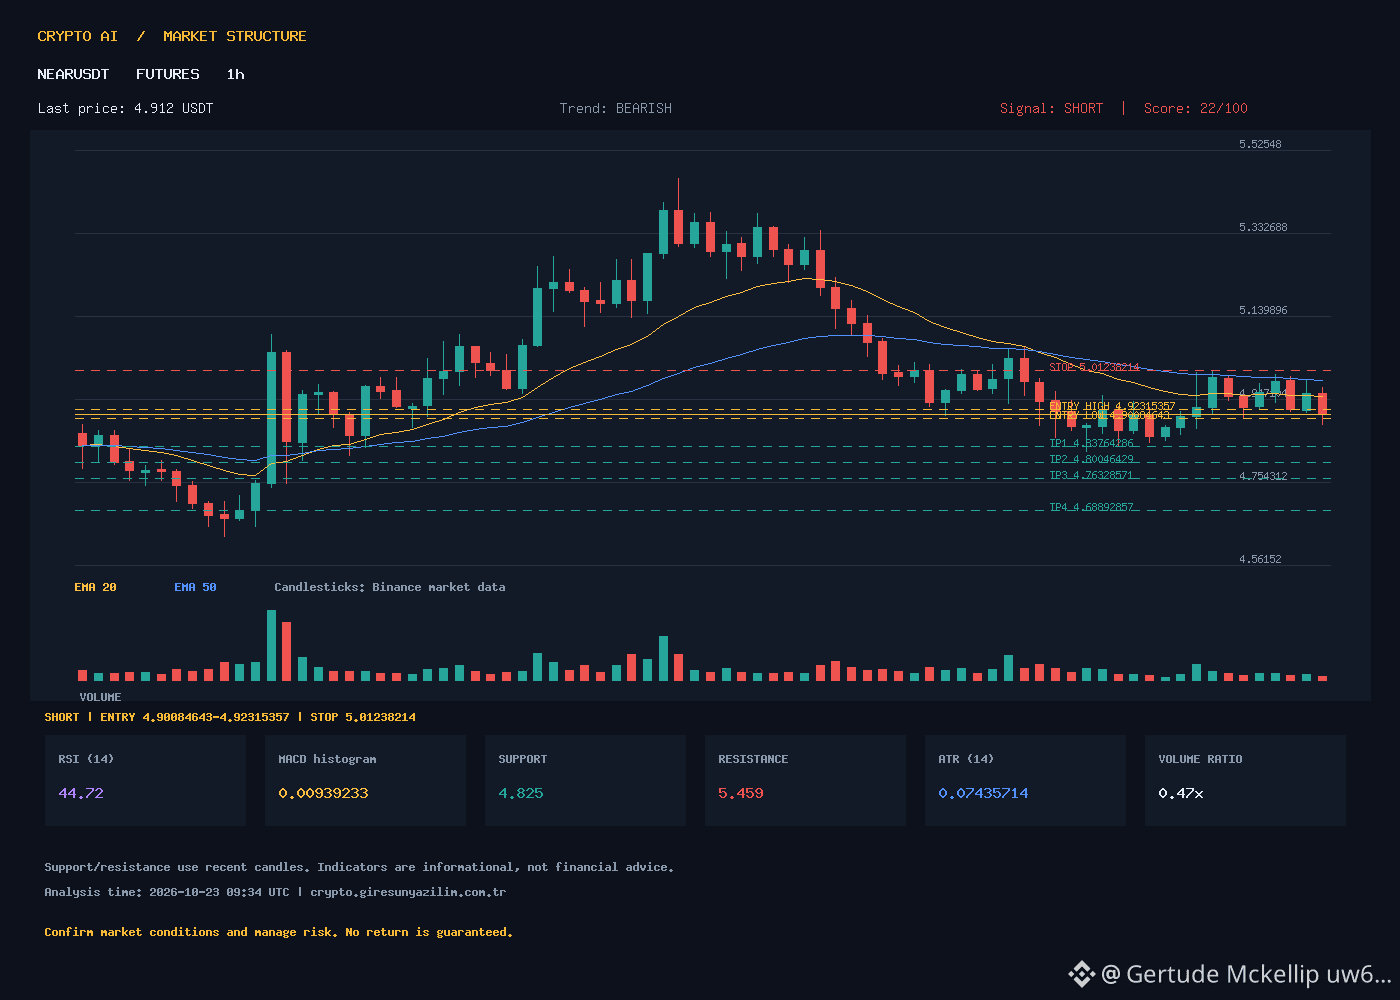
NEARUSDT 1-Hour SHORT Signal: Risk Management with ATR-Based Levels | NEARUSDT 1H SHORT Signal: ATR-Based Levels for Risk Management
🇹🇷 TURKISH
The BEARISH trend (score 22/100) continues on the NEARUSDT 1-hour chart. The current price is 4.912, below EMA20 (4.952) and EMA50 (4.994); EMA200 (5.013) is also overhead, acting as resistance. RSI is 44.72, in the neutral-bearish zone. The MACD histogram is positive (+0.0094), but the MACD line is below the signal line (-0.0243 vs -0.0337). Volume is at 47% of average (2.08M vs 4.43M average) — weak participation. Support is 4.825, resistance is 5.459. ATR is 0.0744.
The SHORT signal is confirmed. ATR-based illustrative levels (not guaranteed):
- Entry zone: 4.9008 – 4.9232 (midpoint 4.912)
- Stop-Loss: 5.0124
- TP1: 4.8376 | TP2: 4.8005 | TP3: 4.7633 | TP4: 4.6889
Risk/reward is around 1:1.3. Low volume increases the risk of a failed breakout. The EMA20/EMA50 crossover is approaching — could momentum be shifting?
🇬🇧 ENGLISH
NEARUSDT 1H chart shows BEARISH trend (score 22/100). Price 4.912 sits below EMA20 (4.952) and EMA50 (4.994); EMA200 (5.013) caps upside. RSI 44.72 neutral-bearish, MACD histogram positive (+0.0094) yet MACD line below signal (-0.0243 vs -0.0337). Volume at 47% of average (2.08M vs 4.43M avg) – weak participation. Support 4.825, resistance 5.459. ATR 0.0744.
SHORT signal confirmed. ATR-based illustrative levels (not guaranteed):
- Entry zone: 4.9008 – 4.9232 (mid 4.912)
- Stop-Loss: 5.0124
- TP1: 4.8376 | TP2: 4.8005 | TP3: 4.7633 | TP4: 4.6889
Risk/reward ~1:1.3. Low volume raises breakout-failure risk. EMA20/EMA50 convergence nearing – could momentum shift?
#NEARUSDT #NEAR #BinanceFutures #KriptoAnaliz #TechnicalAnalysis
NEARUSDT 1-Hour SHORT Signal: Risk Management with ATR-Based Levels | NEARUSDT 1H SHORT Signal: ATR-Based Levels for Risk Management
🇹🇷 TURKISH
The BEARISH trend (score 22/100) continues on the NEARUSDT 1-hour chart. The current price is 4.912, below EMA20 (4.952) and EMA50 (4.994); EMA200 (5.013) is also overhead, acting as resistance. RSI is 44.72, in the neutral-bearish zone. The MACD histogram is positive (+0.0094), but the MACD line is below the signal line (-0.0243 vs -0.0337). Volume is at 47% of average (2.08M vs 4.43M average) — weak participation. Support is 4.825, resistance is 5.459. ATR is 0.0744.
The SHORT signal is confirmed. ATR-based illustrative levels (not guaranteed):
- Entry zone: 4.9008 – 4.9232 (midpoint 4.912)
- Stop-Loss: 5.0124
- TP1: 4.8376 | TP2: 4.8005 | TP3: 4.7633 | TP4: 4.6889
Risk/reward is around 1:1.3. Low volume increases the risk of a failed breakout. The EMA20/EMA50 crossover is approaching — could momentum be shifting?
🇬🇧 ENGLISH
NEARUSDT 1H chart shows BEARISH trend (score 22/100). Price 4.912 sits below EMA20 (4.952) and EMA50 (4.994); EMA200 (5.013) caps upside. RSI 44.72 neutral-bearish, MACD histogram positive (+0.0094) yet MACD line below signal (-0.0243 vs -0.0337). Volume at 47% of average (2.08M vs 4.43M avg) – weak participation. Support 4.825, resistance 5.459. ATR 0.0744.
SHORT signal confirmed. ATR-based illustrative levels (not guaranteed):
- Entry zone: 4.9008 – 4.9232 (mid 4.912)
- Stop-Loss: 5.0124
- TP1: 4.8376 | TP2: 4.8005 | TP3: 4.7633 | TP4: 4.6889
Risk/reward ~1:1.3. Low volume raises breakout-failure risk. EMA20/EMA50 convergence nearing – could momentum shift?
#NEARUSDT #NEAR #BinanceFutures #KriptoAnaliz #TechnicalAnalysis
🇹🇷 TURKISH
The BEARISH trend (score 22/100) continues on the NEARUSDT 1-hour chart. The current price is 4.912, below EMA20 (4.952) and EMA50 (4.994); EMA200 (5.013) is also overhead, acting as resistance. RSI is 44.72, in the neutral-bearish zone. The MACD histogram is positive (+0.0094), but the MACD line is below the signal line (-0.0243 vs -0.0337). Volume is at 47% of average (2.08M vs 4.43M average) — weak participation. Support is 4.825, resistance is 5.459. ATR is 0.0744.
The SHORT signal is confirmed. ATR-based illustrative levels (not guaranteed):
- Entry zone: 4.9008 – 4.9232 (midpoint 4.912)
- Stop-Loss: 5.0124
- TP1: 4.8376 | TP2: 4.8005 | TP3: 4.7633 | TP4: 4.6889
Risk/reward is around 1:1.3. Low volume increases the risk of a failed breakout. The EMA20/EMA50 crossover is approaching — could momentum be shifting?
🇬🇧 ENGLISH
NEARUSDT 1H chart shows BEARISH trend (score 22/100). Price 4.912 sits below EMA20 (4.952) and EMA50 (4.994); EMA200 (5.013) caps upside. RSI 44.72 neutral-bearish, MACD histogram positive (+0.0094) yet MACD line below signal (-0.0243 vs -0.0337). Volume at 47% of average (2.08M vs 4.43M avg) – weak participation. Support 4.825, resistance 5.459. ATR 0.0744.
SHORT signal confirmed. ATR-based illustrative levels (not guaranteed):
- Entry zone: 4.9008 – 4.9232 (mid 4.912)
- Stop-Loss: 5.0124
- TP1: 4.8376 | TP2: 4.8005 | TP3: 4.7633 | TP4: 4.6889
Risk/reward ~1:1.3. Low volume raises breakout-failure risk. EMA20/EMA50 convergence nearing – could momentum shift?
#NEARUSDT #NEAR #BinanceFutures #KriptoAnaliz #TechnicalAnalysis
1
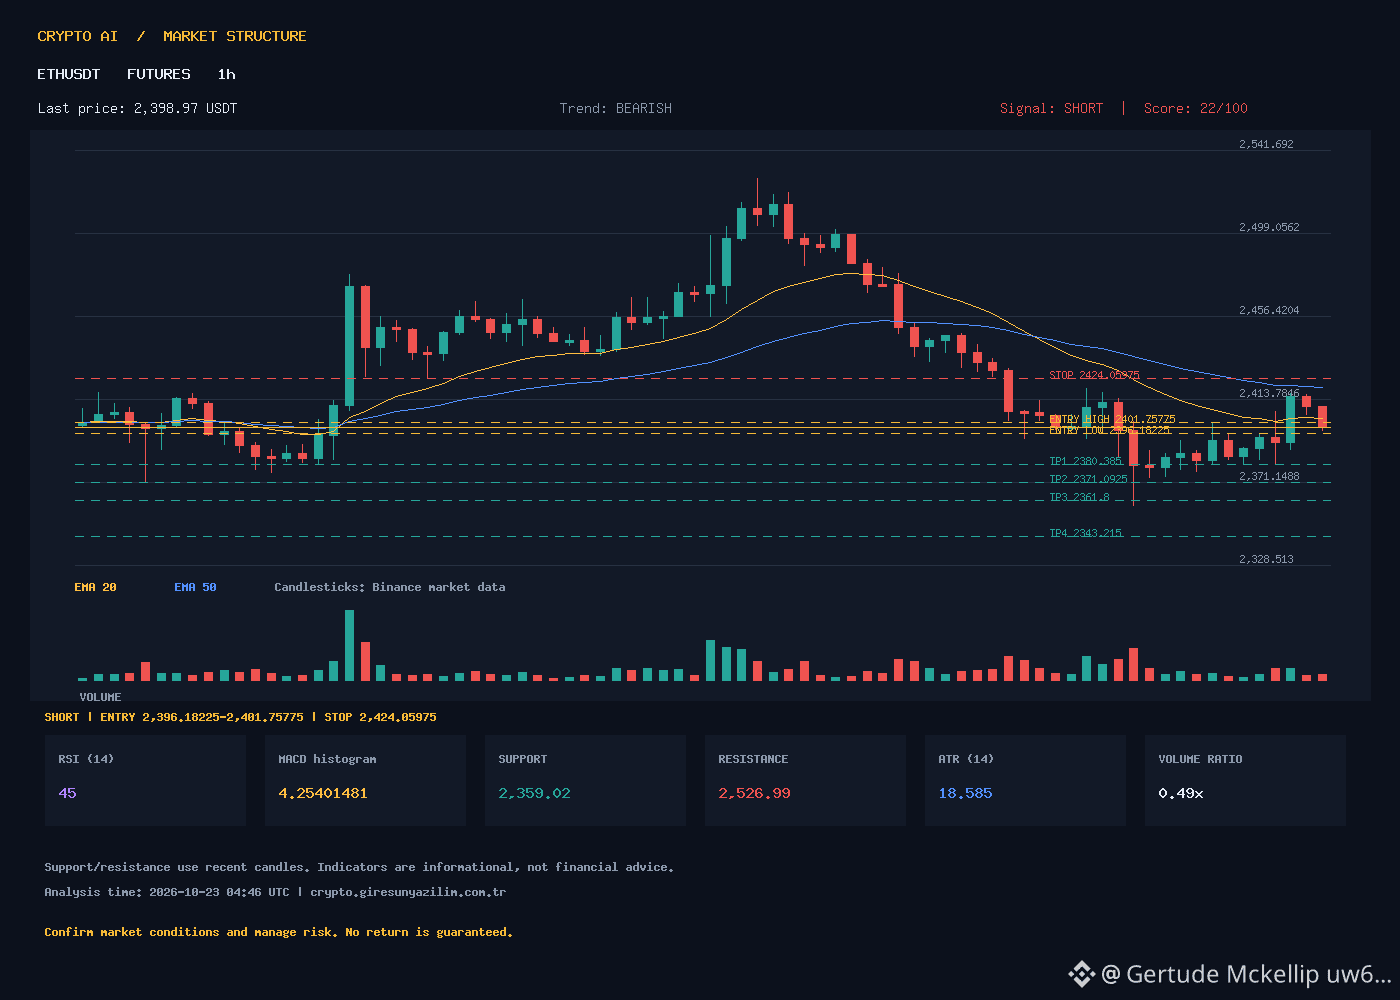
ETH/USDT 1H: BEARISH Trend, SHORT Signal | ETH/USDT 1H: Bearish Trend, Short Signal
🇹🇷 TURKISH
Technical indicators on the ETH/USDT 1-hour chart signal further downside. The MACD histogram is in positive territory (4.254), while the price is below EMA20/50/200 (2403.70 / 2419.77 / 2433.63). RSI is at 45, in a weak bearish zone. Volume on the last candle was 49% of the average. Trend: BEARISH, Score: 22.
The SHORT signal is confirmed; entry range: **2396.18 – 2401.76**, stop-loss: **2424.06**, targets:
TP1: 2380.39 | TP2: 2371.09 | TP3: 2361.80 | TP4: 2343.22
These levels are based on an ATR scenario and are not guaranteed.
🇬🇧 ENGLISH
ETH/USDT 1-hour chart shows bearish continuation signals. MACD histogram is positive at 4.254, price below EMA20/50/200 (2403.70 / 2419.77 / 2433.63). RSI at 45 in weak bullish zone. Volume at 49% of average. Trend: BEARISH, Score: 22.
Confirmed SHORT signal; entry range: **2396.18 – 2401.76**, stop-loss: **2424.06**, targets:
TP1: 2380.39 | TP2: 2371.09 | TP3: 2361.80 | TP4: 2343.22
These are ATR-based illustrative levels, not guaranteed outcomes.
#ETHUSDT #ETH #BinanceFutures #KriptoAnaliz #ShortSignal
ETH/USDT 1H: BEARISH Trend, SHORT Signal | ETH/USDT 1H: Bearish Trend, Short Signal
🇹🇷 TURKISH
Technical indicators on the ETH/USDT 1-hour chart signal further downside. The MACD histogram is in positive territory (4.254), while the price is below EMA20/50/200 (2403.70 / 2419.77 / 2433.63). RSI is at 45, in a weak bearish zone. Volume on the last candle was 49% of the average. Trend: BEARISH, Score: 22.
The SHORT signal is confirmed; entry range: **2396.18 – 2401.76**, stop-loss: **2424.06**, targets:
TP1: 2380.39 | TP2: 2371.09 | TP3: 2361.80 | TP4: 2343.22
These levels are based on an ATR scenario and are not guaranteed.
🇬🇧 ENGLISH
ETH/USDT 1-hour chart shows bearish continuation signals. MACD histogram is positive at 4.254, price below EMA20/50/200 (2403.70 / 2419.77 / 2433.63). RSI at 45 in weak bullish zone. Volume at 49% of average. Trend: BEARISH, Score: 22.
Confirmed SHORT signal; entry range: **2396.18 – 2401.76**, stop-loss: **2424.06**, targets:
TP1: 2380.39 | TP2: 2371.09 | TP3: 2361.80 | TP4: 2343.22
These are ATR-based illustrative levels, not guaranteed outcomes.
#ETHUSDT #ETH #BinanceFutures #KriptoAnaliz #ShortSignal
🇹🇷 TURKISH
Technical indicators on the ETH/USDT 1-hour chart signal further downside. The MACD histogram is in positive territory (4.254), while the price is below EMA20/50/200 (2403.70 / 2419.77 / 2433.63). RSI is at 45, in a weak bearish zone. Volume on the last candle was 49% of the average. Trend: BEARISH, Score: 22.
The SHORT signal is confirmed; entry range: **2396.18 – 2401.76**, stop-loss: **2424.06**, targets:
TP1: 2380.39 | TP2: 2371.09 | TP3: 2361.80 | TP4: 2343.22
These levels are based on an ATR scenario and are not guaranteed.
🇬🇧 ENGLISH
ETH/USDT 1-hour chart shows bearish continuation signals. MACD histogram is positive at 4.254, price below EMA20/50/200 (2403.70 / 2419.77 / 2433.63). RSI at 45 in weak bullish zone. Volume at 49% of average. Trend: BEARISH, Score: 22.
Confirmed SHORT signal; entry range: **2396.18 – 2401.76**, stop-loss: **2424.06**, targets:
TP1: 2380.39 | TP2: 2371.09 | TP3: 2361.80 | TP4: 2343.22
These are ATR-based illustrative levels, not guaranteed outcomes.
#ETHUSDT #ETH #BinanceFutures #KriptoAnaliz #ShortSignal
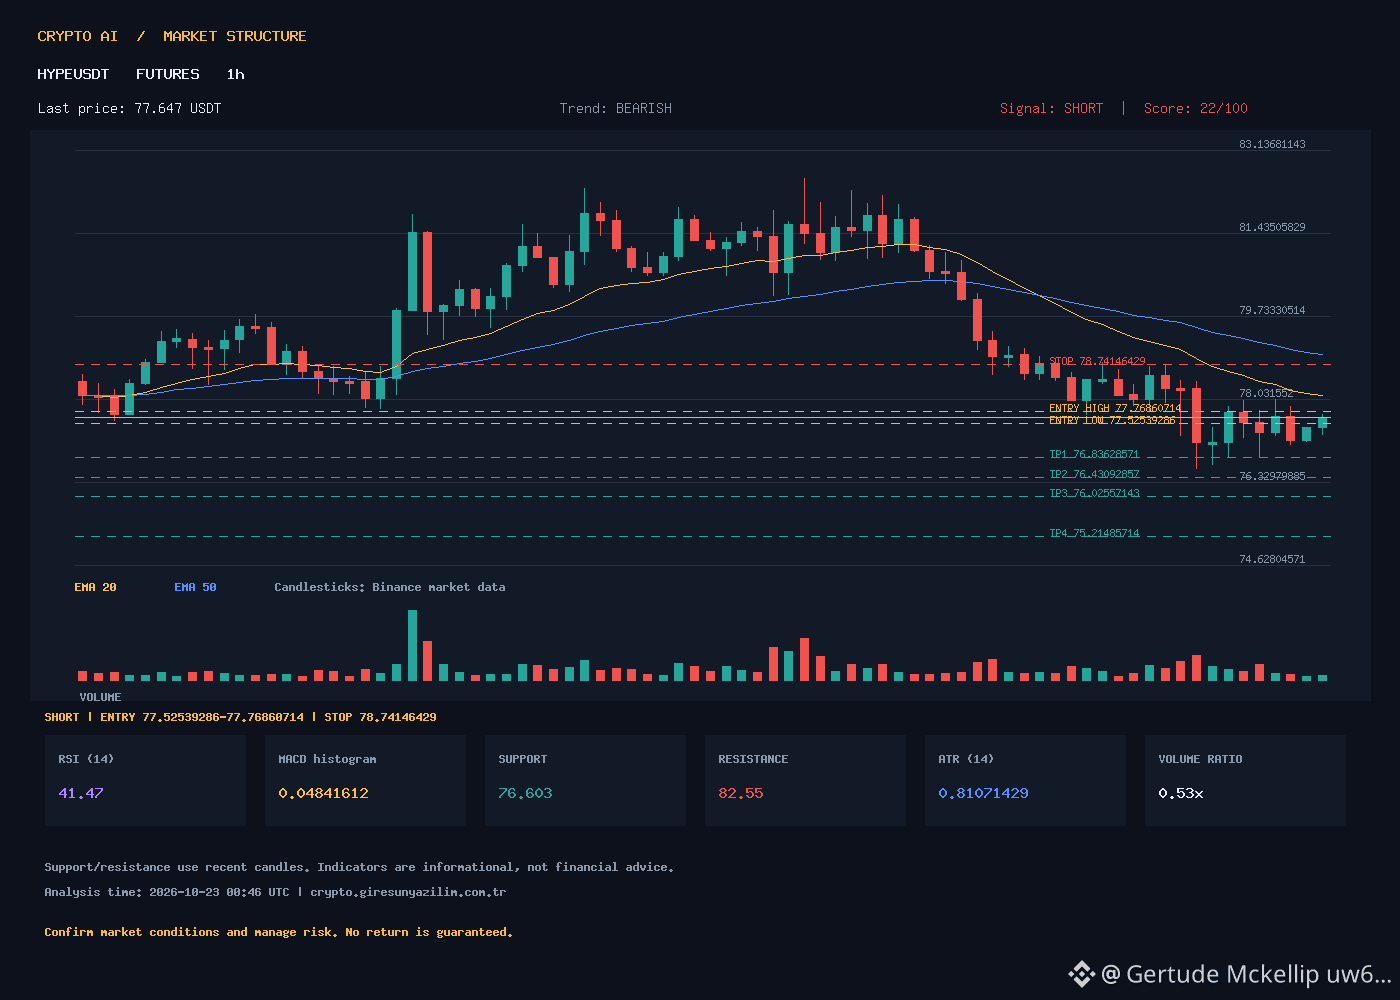
HYPE/USDT 1H: BEARISH TREND — SHORT POSITION | HYPE/USDT 1H: BEARISH TREND — SHORT POSITION
🇹🇷 TURKISH
On the HYPE/USDT 1-hour chart, technical indicators collectively signal a bearish (downward) trend. Price is below EMA20 (78.094) and EMA50 (78.978), and above EMA200 (79.934). RSI is 41.47, not in oversold territory. The MACD histogram is positive (0.04841612), but the MACD line is below the signal line. ATR is at 0.81071429. Volume has decreased by 53% compared with average volume (0.53). Support: 76.603, resistance: 82.55.
Position: SHORT
Timeframe: 1H
Score: 22
Price: 77.647
Entry range: 77.52539286 – 77.76860714
Stop-loss: 78.74146429
TP1: 76.83628571
TP2: 76.43092857
TP3: 76.02557143
TP4: 75.21485714
These levels are ATR-based illustrative scenarios and are not guaranteed.
🇬🇧 ENGLISH
On the HYPE/USDT 1-hour chart, technical indicators collectively suggest a bearish (downward) signal. Price is below EMA20 (78.094) and EMA50 (78.978), while trading above EMA200 (79.934). RSI stands at 41.47, not yet in oversold territory. MACD histogram is positive (0.04841612), but the MACD line remains below the signal line. ATR is at 0.81071429. Volume is at 53% of its average (ratio: 0.53). Support: 76.603, resistance: 82.55.
Position: SHORT
Timeframe: 1H
Score: 22
Price: 77.647
Entry range: 77.52539286 – 77.76860714
Stop-loss: 78.74146429
TP1: 76.83628571
TP2: 76.43092857
TP3: 76.02557143
TP4: 75.21485714
These levels are ATR-based illustrative scenarios and are not guaranteed outcomes.
#HYPEUSDT #BinanceFutures #KriptoAnaliz #SHORT #TechnicalAnalysis
HYPE/USDT 1H: BEARISH TREND — SHORT POSITION | HYPE/USDT 1H: BEARISH TREND — SHORT POSITION
🇹🇷 TURKISH
On the HYPE/USDT 1-hour chart, technical indicators collectively signal a bearish (downward) trend. Price is below EMA20 (78.094) and EMA50 (78.978), and above EMA200 (79.934). RSI is 41.47, not in oversold territory. The MACD histogram is positive (0.04841612), but the MACD line is below the signal line. ATR is at 0.81071429. Volume has decreased by 53% compared with average volume (0.53). Support: 76.603, resistance: 82.55.
Position: SHORT
Timeframe: 1H
Score: 22
Price: 77.647
Entry range: 77.52539286 – 77.76860714
Stop-loss: 78.74146429
TP1: 76.83628571
TP2: 76.43092857
TP3: 76.02557143
TP4: 75.21485714
These levels are ATR-based illustrative scenarios and are not guaranteed.
🇬🇧 ENGLISH
On the HYPE/USDT 1-hour chart, technical indicators collectively suggest a bearish (downward) signal. Price is below EMA20 (78.094) and EMA50 (78.978), while trading above EMA200 (79.934). RSI stands at 41.47, not yet in oversold territory. MACD histogram is positive (0.04841612), but the MACD line remains below the signal line. ATR is at 0.81071429. Volume is at 53% of its average (ratio: 0.53). Support: 76.603, resistance: 82.55.
Position: SHORT
Timeframe: 1H
Score: 22
Price: 77.647
Entry range: 77.52539286 – 77.76860714
Stop-loss: 78.74146429
TP1: 76.83628571
TP2: 76.43092857
TP3: 76.02557143
TP4: 75.21485714
These levels are ATR-based illustrative scenarios and are not guaranteed outcomes.
#HYPEUSDT #BinanceFutures #KriptoAnaliz #SHORT #TechnicalAnalysis
🇹🇷 TURKISH
On the HYPE/USDT 1-hour chart, technical indicators collectively signal a bearish (downward) trend. Price is below EMA20 (78.094) and EMA50 (78.978), and above EMA200 (79.934). RSI is 41.47, not in oversold territory. The MACD histogram is positive (0.04841612), but the MACD line is below the signal line. ATR is at 0.81071429. Volume has decreased by 53% compared with average volume (0.53). Support: 76.603, resistance: 82.55.
Position: SHORT
Timeframe: 1H
Score: 22
Price: 77.647
Entry range: 77.52539286 – 77.76860714
Stop-loss: 78.74146429
TP1: 76.83628571
TP2: 76.43092857
TP3: 76.02557143
TP4: 75.21485714
These levels are ATR-based illustrative scenarios and are not guaranteed.
🇬🇧 ENGLISH
On the HYPE/USDT 1-hour chart, technical indicators collectively suggest a bearish (downward) signal. Price is below EMA20 (78.094) and EMA50 (78.978), while trading above EMA200 (79.934). RSI stands at 41.47, not yet in oversold territory. MACD histogram is positive (0.04841612), but the MACD line remains below the signal line. ATR is at 0.81071429. Volume is at 53% of its average (ratio: 0.53). Support: 76.603, resistance: 82.55.
Position: SHORT
Timeframe: 1H
Score: 22
Price: 77.647
Entry range: 77.52539286 – 77.76860714
Stop-loss: 78.74146429
TP1: 76.83628571
TP2: 76.43092857
TP3: 76.02557143
TP4: 75.21485714
These levels are ATR-based illustrative scenarios and are not guaranteed outcomes.
#HYPEUSDT #BinanceFutures #KriptoAnaliz #SHORT #TechnicalAnalysis
32
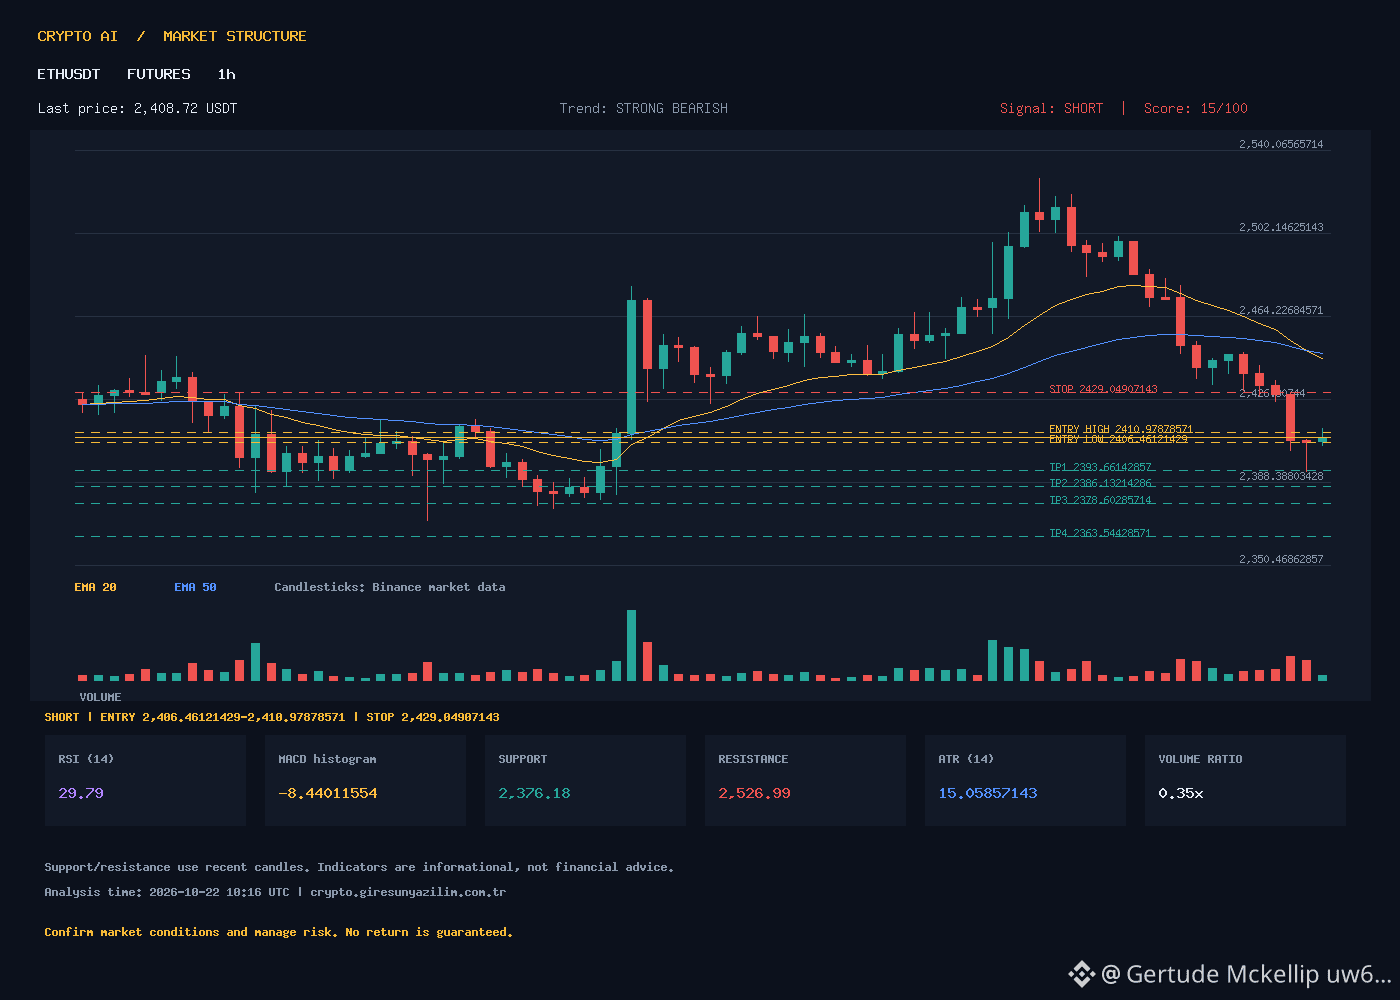
ETHUSDT 1H Short Position Signal | ETHUSDT 1H Short Signal
🇹🇷 TURKISH
The STRONG BEARISH trend (score 15) continues on the ETHUSDT 1-hour chart. Price is 2408.72, below EMA20 (2444.85), EMA50 (2446.23), and EMA200 (2447.32). RSI is 29.79, in oversold territory, and the MACD histogram at -8.44 indicates strong negative momentum. ATR is 15.06, and volume is 35% of average (58.2K vs. 166K) – low liquidity. Support is 2376.18, resistance is 2526.99.
SHORT signal confirmed. ATR-based scenario levels (not guaranteed):
Entry range: 2406.46 – 2410.98
Stop-Loss: 2429.05
TP1: 2393.66 | TP2: 2386.13 | TP3: 2378.60 | TP4: 2363.54
Risk: RSI is near the bottom, so a technical bounce is possible; volume is low. Adjust position size according to ATR.
Discussion: When RSI drops below 30 into oversold territory, do you expect a short-term pullback, or do you trust the trend to continue?
🇬🇧 ENGLISH
ETHUSDT 1H shows a STRONG BEARISH trend (score 15). Price 2408.72 sits below EMA20 (2444.85), EMA50 (2446.23), EMA200 (2447.32). RSI 29.79 in oversold territory, MACD histogram -8.44 confirms strong negative momentum. ATR 15.06, volume only 35% of average (58.2K vs 166K) – thin liquidity. Support 2376.18, resistance 2526.99.
SHORT signal confirmed. ATR-based scenario levels (not guaranteed outcomes):
Entry range: 2406.46 – 2410.98
Stop-Loss: 2429.05
TP1: 2393.66 | TP2: 2386.13 | TP3: 2378.60 | TP4: 2363.54
Risk: RSI oversold bounce possible; low volume. Size position per ATR.
Discussion: When RSI drops below 30 in oversold conditions, do you anticipate a short-term pullback or trust the trend continuation?
#ETHUSDT #Ethereum #KriptoAnaliz #ShortSinyali #FuturesTrading
ETHUSDT 1H Short Position Signal | ETHUSDT 1H Short Signal
🇹🇷 TURKISH
The STRONG BEARISH trend (score 15) continues on the ETHUSDT 1-hour chart. Price is 2408.72, below EMA20 (2444.85), EMA50 (2446.23), and EMA200 (2447.32). RSI is 29.79, in oversold territory, and the MACD histogram at -8.44 indicates strong negative momentum. ATR is 15.06, and volume is 35% of average (58.2K vs. 166K) – low liquidity. Support is 2376.18, resistance is 2526.99.
SHORT signal confirmed. ATR-based scenario levels (not guaranteed):
Entry range: 2406.46 – 2410.98
Stop-Loss: 2429.05
TP1: 2393.66 | TP2: 2386.13 | TP3: 2378.60 | TP4: 2363.54
Risk: RSI is near the bottom, so a technical bounce is possible; volume is low. Adjust position size according to ATR.
Discussion: When RSI drops below 30 into oversold territory, do you expect a short-term pullback, or do you trust the trend to continue?
🇬🇧 ENGLISH
ETHUSDT 1H shows a STRONG BEARISH trend (score 15). Price 2408.72 sits below EMA20 (2444.85), EMA50 (2446.23), EMA200 (2447.32). RSI 29.79 in oversold territory, MACD histogram -8.44 confirms strong negative momentum. ATR 15.06, volume only 35% of average (58.2K vs 166K) – thin liquidity. Support 2376.18, resistance 2526.99.
SHORT signal confirmed. ATR-based scenario levels (not guaranteed outcomes):
Entry range: 2406.46 – 2410.98
Stop-Loss: 2429.05
TP1: 2393.66 | TP2: 2386.13 | TP3: 2378.60 | TP4: 2363.54
Risk: RSI oversold bounce possible; low volume. Size position per ATR.
Discussion: When RSI drops below 30 in oversold conditions, do you anticipate a short-term pullback or trust the trend continuation?
#ETHUSDT #Ethereum #KriptoAnaliz #ShortSinyali #FuturesTrading
🇹🇷 TURKISH
The STRONG BEARISH trend (score 15) continues on the ETHUSDT 1-hour chart. Price is 2408.72, below EMA20 (2444.85), EMA50 (2446.23), and EMA200 (2447.32). RSI is 29.79, in oversold territory, and the MACD histogram at -8.44 indicates strong negative momentum. ATR is 15.06, and volume is 35% of average (58.2K vs. 166K) – low liquidity. Support is 2376.18, resistance is 2526.99.
SHORT signal confirmed. ATR-based scenario levels (not guaranteed):
Entry range: 2406.46 – 2410.98
Stop-Loss: 2429.05
TP1: 2393.66 | TP2: 2386.13 | TP3: 2378.60 | TP4: 2363.54
Risk: RSI is near the bottom, so a technical bounce is possible; volume is low. Adjust position size according to ATR.
Discussion: When RSI drops below 30 into oversold territory, do you expect a short-term pullback, or do you trust the trend to continue?
🇬🇧 ENGLISH
ETHUSDT 1H shows a STRONG BEARISH trend (score 15). Price 2408.72 sits below EMA20 (2444.85), EMA50 (2446.23), EMA200 (2447.32). RSI 29.79 in oversold territory, MACD histogram -8.44 confirms strong negative momentum. ATR 15.06, volume only 35% of average (58.2K vs 166K) – thin liquidity. Support 2376.18, resistance 2526.99.
SHORT signal confirmed. ATR-based scenario levels (not guaranteed outcomes):
Entry range: 2406.46 – 2410.98
Stop-Loss: 2429.05
TP1: 2393.66 | TP2: 2386.13 | TP3: 2378.60 | TP4: 2363.54
Risk: RSI oversold bounce possible; low volume. Size position per ATR.
Discussion: When RSI drops below 30 in oversold conditions, do you anticipate a short-term pullback or trust the trend continuation?
#ETHUSDT #Ethereum #KriptoAnaliz #ShortSinyali #FuturesTrading
29
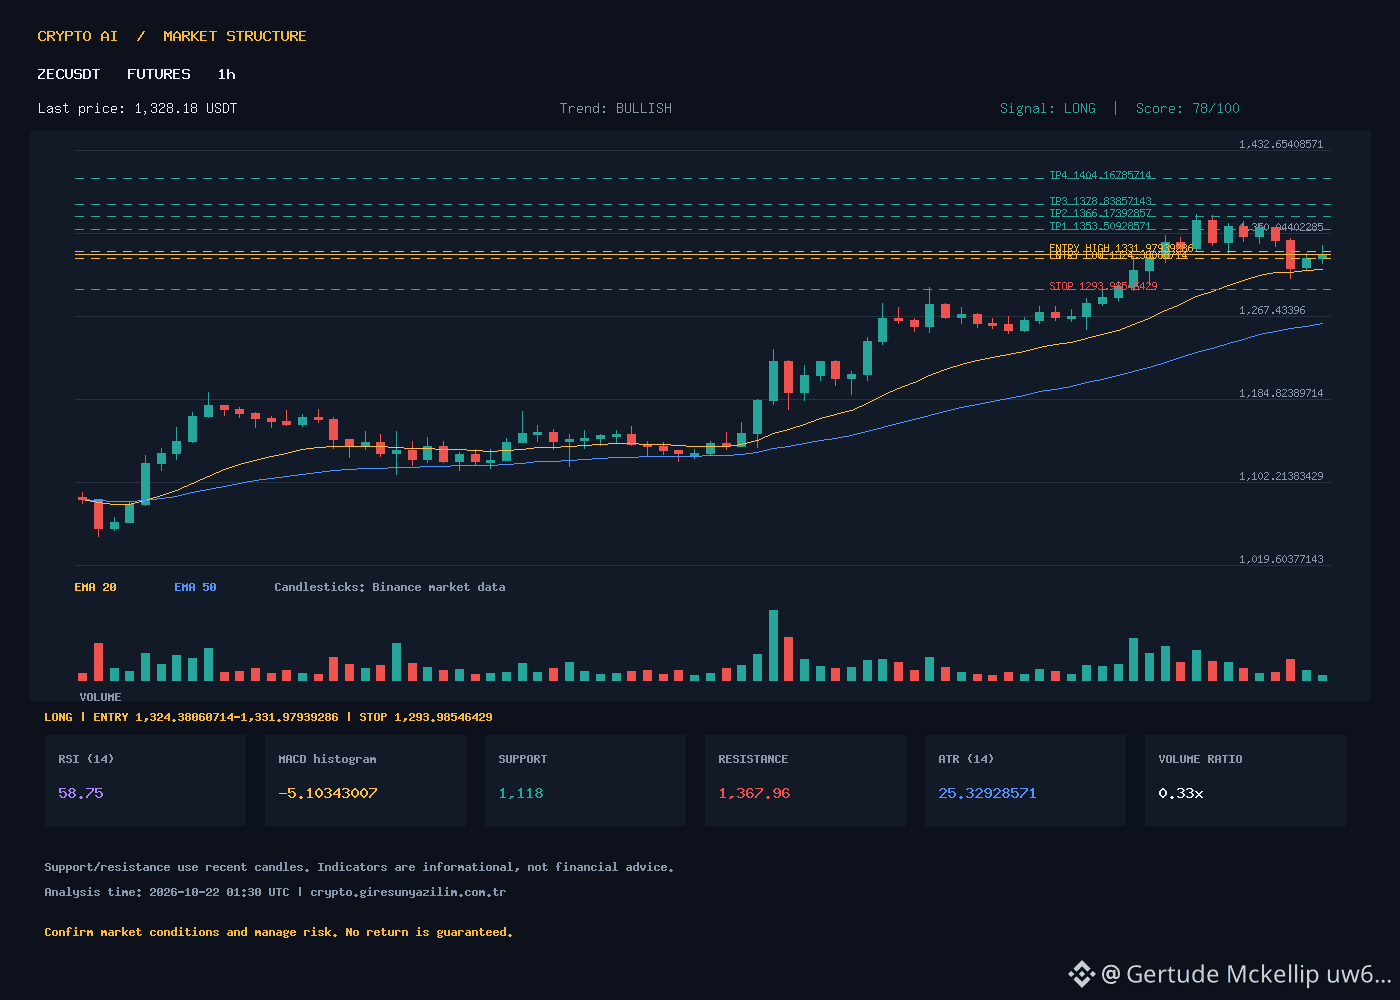
ZECUSDT 1H LONG Signal: Breakout Potential with ATR-Based Levels | ZECUSDT 1H LONG Signal: Breakout Potential with ATR-Based Levels
🇹🇷 TURKISH
ZECUSDT continues its BULLISH trend (score 78) on the 1-hour chart. Price is 1,328.18 USDT, above EMA20 (1,313.99) and EMA50 (1,262.51); EMA200 (1,211.63) also provides support. RSI 58.75 – not overbought. MACD (25.80) is below the signal line (30.90), with a histogram of -5.10, indicating slightly negative momentum, but the trend is upward. ATR 25.33, support 1,118, resistance 1,367.96. Volume is 33% of average (22,167 vs. 67,465) – a breakout on low volume carries risk.
Signal: LONG (1H). The trade plan uses ATR-based scenarios; outcomes are not guaranteed.
Entry range: 1,324.38 – 1,331.98 (midpoint 1,328.18)
Stop-Loss: 1,293.99
TP1: 1,353.51 | TP2: 1,366.17 | TP3: 1,378.84 | TP4: 1,404.17
Risk: Low volume and the negative MACD histogram may delay a breakout. Adjust position size according to your risk tolerance.
🇬🇧 ENGLISH
ZECUSDT 1H shows a BULLISH trend (score 78). Price 1,328.18 USDT sits above EMA20 (1,313.99) and EMA50 (1,262.51); EMA200 (1,211.63) adds support. RSI 58.75 – not overbought. MACD (25.80) below signal (30.90), histogram -5.10 indicates slight negative momentum but trend remains up. ATR 25.33, support 1,118, resistance 1,367.96. Volume only 33% of average (22,167 vs 67,465) – breakout on low volume carries risk.
Signal: LONG (1H). Levels are ATR-based scenarios, not guaranteed outcomes.
Entry range: 1,324.38 – 1,331.98 (mid 1,328.18)
Stop-Loss: 1,293.99
TP1: 1,353.51 | TP2: 1,366.17 | TP3: 1,378.84 | TP4: 1,404.17
Risk: Low volume and negative MACD histogram may delay breakout. Size position according to risk tolerance.
#ZECUSDT #ZEC #KriptoAnaliz #CryptoAnalysis #BinanceFutures
ZECUSDT 1H LONG Signal: Breakout Potential with ATR-Based Levels | ZECUSDT 1H LONG Signal: Breakout Potential with ATR-Based Levels
🇹🇷 TURKISH
ZECUSDT continues its BULLISH trend (score 78) on the 1-hour chart. Price is 1,328.18 USDT, above EMA20 (1,313.99) and EMA50 (1,262.51); EMA200 (1,211.63) also provides support. RSI 58.75 – not overbought. MACD (25.80) is below the signal line (30.90), with a histogram of -5.10, indicating slightly negative momentum, but the trend is upward. ATR 25.33, support 1,118, resistance 1,367.96. Volume is 33% of average (22,167 vs. 67,465) – a breakout on low volume carries risk.
Signal: LONG (1H). The trade plan uses ATR-based scenarios; outcomes are not guaranteed.
Entry range: 1,324.38 – 1,331.98 (midpoint 1,328.18)
Stop-Loss: 1,293.99
TP1: 1,353.51 | TP2: 1,366.17 | TP3: 1,378.84 | TP4: 1,404.17
Risk: Low volume and the negative MACD histogram may delay a breakout. Adjust position size according to your risk tolerance.
🇬🇧 ENGLISH
ZECUSDT 1H shows a BULLISH trend (score 78). Price 1,328.18 USDT sits above EMA20 (1,313.99) and EMA50 (1,262.51); EMA200 (1,211.63) adds support. RSI 58.75 – not overbought. MACD (25.80) below signal (30.90), histogram -5.10 indicates slight negative momentum but trend remains up. ATR 25.33, support 1,118, resistance 1,367.96. Volume only 33% of average (22,167 vs 67,465) – breakout on low volume carries risk.
Signal: LONG (1H). Levels are ATR-based scenarios, not guaranteed outcomes.
Entry range: 1,324.38 – 1,331.98 (mid 1,328.18)
Stop-Loss: 1,293.99
TP1: 1,353.51 | TP2: 1,366.17 | TP3: 1,378.84 | TP4: 1,404.17
Risk: Low volume and negative MACD histogram may delay breakout. Size position according to risk tolerance.
#ZECUSDT #ZEC #KriptoAnaliz #CryptoAnalysis #BinanceFutures
🇹🇷 TURKISH
ZECUSDT continues its BULLISH trend (score 78) on the 1-hour chart. Price is 1,328.18 USDT, above EMA20 (1,313.99) and EMA50 (1,262.51); EMA200 (1,211.63) also provides support. RSI 58.75 – not overbought. MACD (25.80) is below the signal line (30.90), with a histogram of -5.10, indicating slightly negative momentum, but the trend is upward. ATR 25.33, support 1,118, resistance 1,367.96. Volume is 33% of average (22,167 vs. 67,465) – a breakout on low volume carries risk.
Signal: LONG (1H). The trade plan uses ATR-based scenarios; outcomes are not guaranteed.
Entry range: 1,324.38 – 1,331.98 (midpoint 1,328.18)
Stop-Loss: 1,293.99
TP1: 1,353.51 | TP2: 1,366.17 | TP3: 1,378.84 | TP4: 1,404.17
Risk: Low volume and the negative MACD histogram may delay a breakout. Adjust position size according to your risk tolerance.
🇬🇧 ENGLISH
ZECUSDT 1H shows a BULLISH trend (score 78). Price 1,328.18 USDT sits above EMA20 (1,313.99) and EMA50 (1,262.51); EMA200 (1,211.63) adds support. RSI 58.75 – not overbought. MACD (25.80) below signal (30.90), histogram -5.10 indicates slight negative momentum but trend remains up. ATR 25.33, support 1,118, resistance 1,367.96. Volume only 33% of average (22,167 vs 67,465) – breakout on low volume carries risk.
Signal: LONG (1H). Levels are ATR-based scenarios, not guaranteed outcomes.
Entry range: 1,324.38 – 1,331.98 (mid 1,328.18)
Stop-Loss: 1,293.99
TP1: 1,353.51 | TP2: 1,366.17 | TP3: 1,378.84 | TP4: 1,404.17
Risk: Low volume and negative MACD histogram may delay breakout. Size position according to risk tolerance.
#ZECUSDT #ZEC #KriptoAnaliz #CryptoAnalysis #BinanceFutures
46
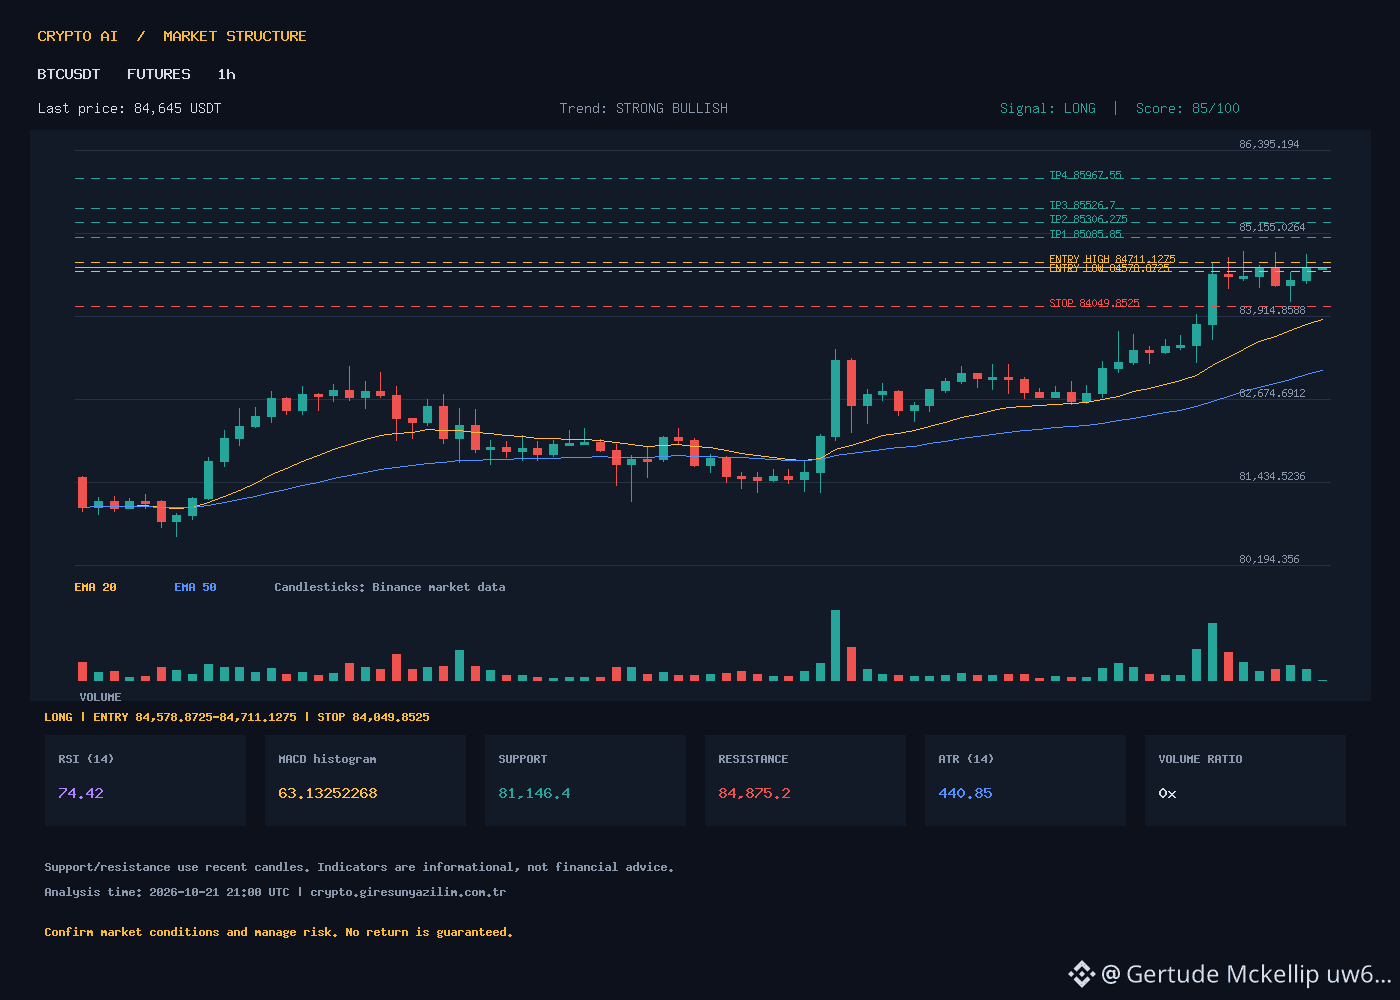
BTCUSDT 1H Futures — Strong Bullish Setup | Bitcoin Long Entry Plan
🇹🇷 TURKISH
BTCUSDT 1-hour futures show a STRONG BULLISH trend, an 85/100 score, and a LONG signal, offering an accumulation opportunity. Price is 84,645; RSI is 74.42 (upward momentum); price is rising toward EMA20/50/200; the MACD histogram appears green. ATR is 440.85; support is 81,146.4; price is approaching resistance at 84,875.2.
Signal: LONG. Entry range: 84.5788725 – 84.7111275 (midpoint 84.645). Stop loss: 84.0498525. TP1: 85.08585, TP2: 85.306275, TP3: 85.5267, TP4: 85.96755. Note: stay alert when relying on this setup; these are ATR-based scenarios, not guaranteed outcomes. Do not neglect risk management.
🇬🇧 ENGLISH
BTCUSDT 1-hour futures show a STRONG BULLISH trend with an 85/100 score and a LONG signal, offering accumulation opportunities. Price at 84,645; RSI 74.42 shows upward momentum; price rises above EMA20/50/200; MACD histogram positive. ATR 440.85; support 81,146.4; resistance 84,875.2.
Signal: LONG. Entry range 84,578.8725 – 84,711.1275 (midpoint 84,645). Stop loss: 84,049.8525. TP1: 85,08585; TP2: 85,306275; TP3: 85,5267; TP4: 85,96755. Note: these are ATR-based scenarios, not guaranteed outcomes. Manage risk carefully.
#BTCUSDT #BitcoinFutures #KriptoAnaliz #LONGSetup #CryptoTrading
BTCUSDT 1H Futures — Strong Bullish Setup | Bitcoin Long Entry Plan
🇹🇷 TURKISH
BTCUSDT 1-hour futures show a STRONG BULLISH trend, an 85/100 score, and a LONG signal, offering an accumulation opportunity. Price is 84,645; RSI is 74.42 (upward momentum); price is rising toward EMA20/50/200; the MACD histogram appears green. ATR is 440.85; support is 81,146.4; price is approaching resistance at 84,875.2.
Signal: LONG. Entry range: 84.5788725 – 84.7111275 (midpoint 84.645). Stop loss: 84.0498525. TP1: 85.08585, TP2: 85.306275, TP3: 85.5267, TP4: 85.96755. Note: stay alert when relying on this setup; these are ATR-based scenarios, not guaranteed outcomes. Do not neglect risk management.
🇬🇧 ENGLISH
BTCUSDT 1-hour futures show a STRONG BULLISH trend with an 85/100 score and a LONG signal, offering accumulation opportunities. Price at 84,645; RSI 74.42 shows upward momentum; price rises above EMA20/50/200; MACD histogram positive. ATR 440.85; support 81,146.4; resistance 84,875.2.
Signal: LONG. Entry range 84,578.8725 – 84,711.1275 (midpoint 84,645). Stop loss: 84,049.8525. TP1: 85,08585; TP2: 85,306275; TP3: 85,5267; TP4: 85,96755. Note: these are ATR-based scenarios, not guaranteed outcomes. Manage risk carefully.
#BTCUSDT #BitcoinFutures #KriptoAnaliz #LONGSetup #CryptoTrading
🇹🇷 TURKISH
BTCUSDT 1-hour futures show a STRONG BULLISH trend, an 85/100 score, and a LONG signal, offering an accumulation opportunity. Price is 84,645; RSI is 74.42 (upward momentum); price is rising toward EMA20/50/200; the MACD histogram appears green. ATR is 440.85; support is 81,146.4; price is approaching resistance at 84,875.2.
Signal: LONG. Entry range: 84.5788725 – 84.7111275 (midpoint 84.645). Stop loss: 84.0498525. TP1: 85.08585, TP2: 85.306275, TP3: 85.5267, TP4: 85.96755. Note: stay alert when relying on this setup; these are ATR-based scenarios, not guaranteed outcomes. Do not neglect risk management.
🇬🇧 ENGLISH
BTCUSDT 1-hour futures show a STRONG BULLISH trend with an 85/100 score and a LONG signal, offering accumulation opportunities. Price at 84,645; RSI 74.42 shows upward momentum; price rises above EMA20/50/200; MACD histogram positive. ATR 440.85; support 81,146.4; resistance 84,875.2.
Signal: LONG. Entry range 84,578.8725 – 84,711.1275 (midpoint 84,645). Stop loss: 84,049.8525. TP1: 85,08585; TP2: 85,306275; TP3: 85,5267; TP4: 85,96755. Note: these are ATR-based scenarios, not guaranteed outcomes. Manage risk carefully.
#BTCUSDT #BitcoinFutures #KriptoAnaliz #LONGSetup #CryptoTrading
1
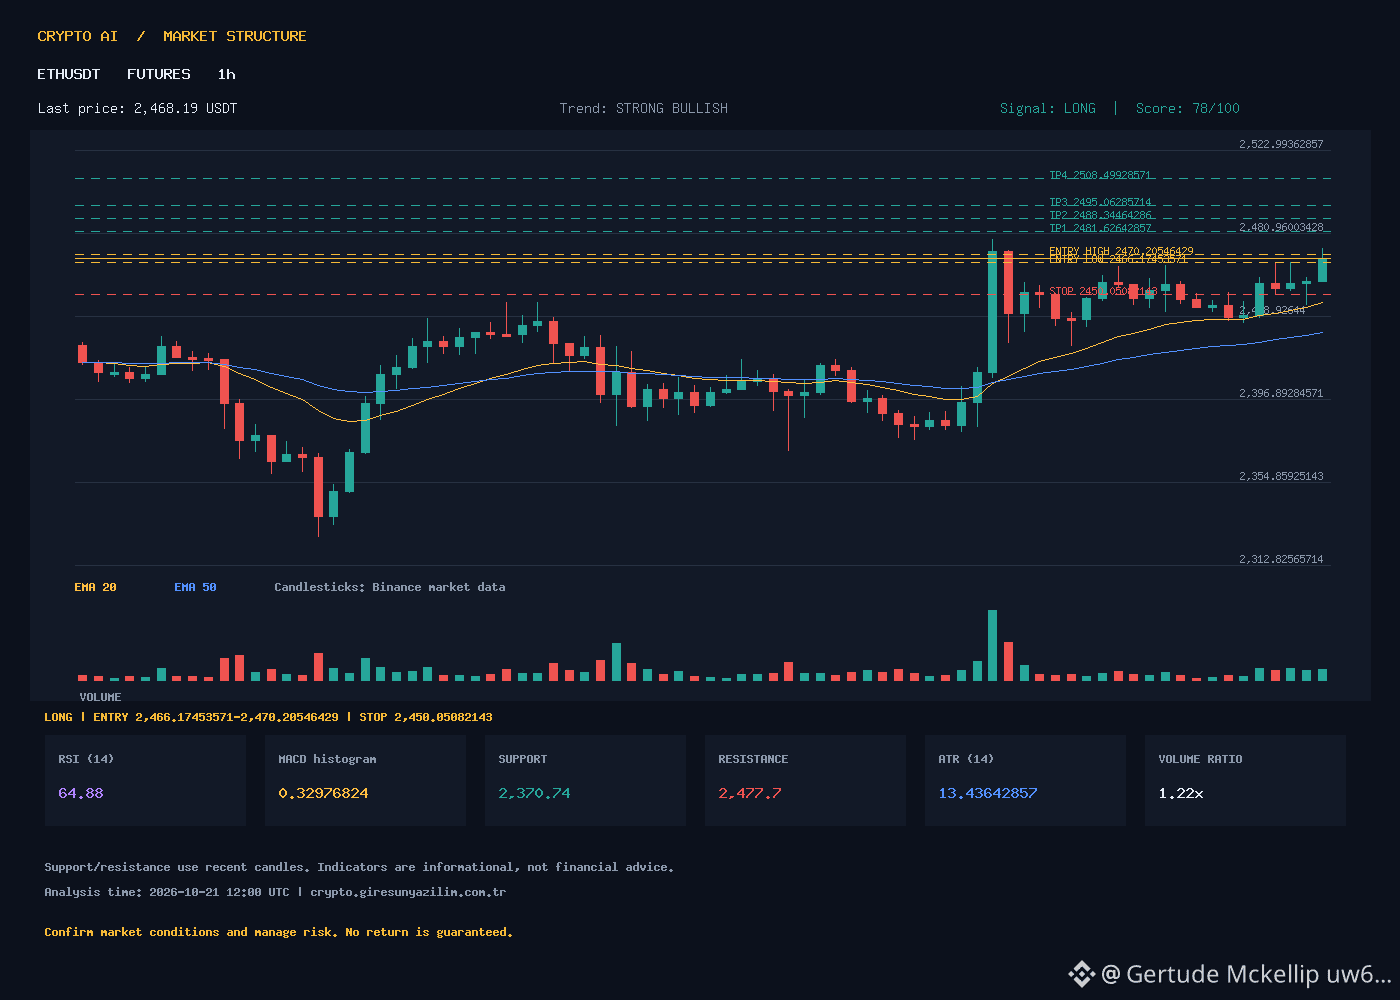
ETHUSDT 1H LONG Signal: Strong Uptrend Continues | ETHUSDT 1H LONG Signal: Strong Uptrend Continues
🇹🇷 TURKISH
ETHUSDT is continuing its STRONG BULLISH trend (score 78) on the 1-hour chart. Price is 2468.19, above EMA20 (2445.62) and EMA50 (2430.87); EMA200 (2444.87) is also providing support. RSI is 64.88 – not overbought. MACD histogram is positive (0.33), with upward momentum. ATR is 13.44, and volume is 22% above average (1.22x). Support: 2370.74; resistance: 2477.70.
Signal: LONG (ATR-based scenario, not guaranteed).
Entry range: 2466.17 – 2470.21 | Stop-Loss: 2450.05
TP1: 2481.63 | TP2: 2488.34 | TP3: 2495.06 | TP4: 2508.50
Risk: Resistance at 2477.70 will be tested; failure to break through could trigger a pullback. Adjust position size according to your risk tolerance.
💭 If resistance at 2477.70 breaks, how realistic are targets above 2500?
🇬🇧 ENGLISH
ETHUSDT 1H shows STRONG BULLISH trend (score 78). Price 2468.19 above EMA20 (2445.62) and EMA50 (2430.87); EMA200 (2444.87) also supportive. RSI 64.88 – no overbought. MACD histogram positive (0.33), upside momentum. ATR 13.44, volume 22% above average (1.22x). Support 2370.74, resistance 2477.70.
Signal: LONG (ATR-based scenario, not guaranteed).
Entry range: 2466.17 – 2470.21 | Stop-Loss: 2450.05
TP1: 2481.63 | TP2: 2488.34 | TP3: 2495.06 | TP4: 2508.50
Risk: Resistance at 2477.70 will be tested; failure to break may trigger pullback. Size position per your risk tolerance.
💭 If 2477.70 breaks, how realistic are 2500+ targets?
#ETHUSDT #Ethereum #KriptoAnaliz #TeknikAnaliz #BinanceFutures
ETHUSDT 1H LONG Signal: Strong Uptrend Continues | ETHUSDT 1H LONG Signal: Strong Uptrend Continues
🇹🇷 TURKISH
ETHUSDT is continuing its STRONG BULLISH trend (score 78) on the 1-hour chart. Price is 2468.19, above EMA20 (2445.62) and EMA50 (2430.87); EMA200 (2444.87) is also providing support. RSI is 64.88 – not overbought. MACD histogram is positive (0.33), with upward momentum. ATR is 13.44, and volume is 22% above average (1.22x). Support: 2370.74; resistance: 2477.70.
Signal: LONG (ATR-based scenario, not guaranteed).
Entry range: 2466.17 – 2470.21 | Stop-Loss: 2450.05
TP1: 2481.63 | TP2: 2488.34 | TP3: 2495.06 | TP4: 2508.50
Risk: Resistance at 2477.70 will be tested; failure to break through could trigger a pullback. Adjust position size according to your risk tolerance.
💭 If resistance at 2477.70 breaks, how realistic are targets above 2500?
🇬🇧 ENGLISH
ETHUSDT 1H shows STRONG BULLISH trend (score 78). Price 2468.19 above EMA20 (2445.62) and EMA50 (2430.87); EMA200 (2444.87) also supportive. RSI 64.88 – no overbought. MACD histogram positive (0.33), upside momentum. ATR 13.44, volume 22% above average (1.22x). Support 2370.74, resistance 2477.70.
Signal: LONG (ATR-based scenario, not guaranteed).
Entry range: 2466.17 – 2470.21 | Stop-Loss: 2450.05
TP1: 2481.63 | TP2: 2488.34 | TP3: 2495.06 | TP4: 2508.50
Risk: Resistance at 2477.70 will be tested; failure to break may trigger pullback. Size position per your risk tolerance.
💭 If 2477.70 breaks, how realistic are 2500+ targets?
#ETHUSDT #Ethereum #KriptoAnaliz #TeknikAnaliz #BinanceFutures
🇹🇷 TURKISH
ETHUSDT is continuing its STRONG BULLISH trend (score 78) on the 1-hour chart. Price is 2468.19, above EMA20 (2445.62) and EMA50 (2430.87); EMA200 (2444.87) is also providing support. RSI is 64.88 – not overbought. MACD histogram is positive (0.33), with upward momentum. ATR is 13.44, and volume is 22% above average (1.22x). Support: 2370.74; resistance: 2477.70.
Signal: LONG (ATR-based scenario, not guaranteed).
Entry range: 2466.17 – 2470.21 | Stop-Loss: 2450.05
TP1: 2481.63 | TP2: 2488.34 | TP3: 2495.06 | TP4: 2508.50
Risk: Resistance at 2477.70 will be tested; failure to break through could trigger a pullback. Adjust position size according to your risk tolerance.
💭 If resistance at 2477.70 breaks, how realistic are targets above 2500?
🇬🇧 ENGLISH
ETHUSDT 1H shows STRONG BULLISH trend (score 78). Price 2468.19 above EMA20 (2445.62) and EMA50 (2430.87); EMA200 (2444.87) also supportive. RSI 64.88 – no overbought. MACD histogram positive (0.33), upside momentum. ATR 13.44, volume 22% above average (1.22x). Support 2370.74, resistance 2477.70.
Signal: LONG (ATR-based scenario, not guaranteed).
Entry range: 2466.17 – 2470.21 | Stop-Loss: 2450.05
TP1: 2481.63 | TP2: 2488.34 | TP3: 2495.06 | TP4: 2508.50
Risk: Resistance at 2477.70 will be tested; failure to break may trigger pullback. Size position per your risk tolerance.
💭 If 2477.70 breaks, how realistic are 2500+ targets?
#ETHUSDT #Ethereum #KriptoAnaliz #TeknikAnaliz #BinanceFutures
5
ETHUSDT 1H Strong Downtrend – SHORT Signal | ETHUSDT 1H Strong Bearish Trend – SHORT Signal
🇹🇷 TURKISH
The STRONG BEARISH trend (score 2/10) continues on the ETHUSDT 1-hour chart. Price is 2391.04, below EMA20 (2403.72) and EMA50 (2406.96); EMA200 (2444.88) is also overhead resistance. RSI 42.42 – not yet oversold. MACD histogram at -0.87 indicates negative momentum. ATR 14.39, volume is 39% of average (low). Support 2327.32, resistance 2445.97.
SHORT signal confirmed. ATR-based scenario (not guaranteed):
Entry range: 2388.88 – 2393.20
Stop-Loss: 2410.46
TP1: 2376.65 | TP2: 2369.46 | TP3: 2362.27 | TP4: 2347.88
Risk: Low volume increases the risk of a breakout; the SL is tight. EMAs are flat – a volume-backed close is needed for a trend reversal. Staying below 2391 keeps the downside targets in play.
Discussion: If support at 2327 is tested, will price hold there or accelerate toward 2300?
🇬🇧 ENGLISH
ETHUSDT 1H shows a STRONG BEARISH trend (score 2/10). Price 2391.04 sits below EMA20 (2403.72) and EMA50 (2406.96); EMA200 (2444.88) caps upside. RSI 42.42 – not yet oversold. MACD histogram -0.87 confirms negative momentum. ATR 14.39, volume only 39% of average. Support 2327.32, resistance 2445.97.
SHORT signal confirmed. ATR-based scenario (not guaranteed):
Entry range: 2388.88 – 2393.20
Stop-Loss: 2410.46
TP1: 2376.65 | TP2: 2369.46 | TP3: 2362.27 | TP4: 2347.88
Risk: Low volume raises breakout risk; SL is tight. EMAs flat – a volume-backed close needed for trend flip. Holding below 2391 keeps downside targets alive.
Discussion: If 2327 support is tested, will price hold or accelerate toward 2300?
#ETHUSDT #Ethereum #KriptoAnaliz #TeknikAnaliz #SHORT
ETHUSDT 1H Strong Downtrend – SHORT Signal | ETHUSDT 1H Strong Bearish Trend – SHORT Signal
🇹🇷 TURKISH
The STRONG BEARISH trend (score 2/10) continues on the ETHUSDT 1-hour chart. Price is 2391.04, below EMA20 (2403.72) and EMA50 (2406.96); EMA200 (2444.88) is also overhead resistance. RSI 42.42 – not yet oversold. MACD histogram at -0.87 indicates negative momentum. ATR 14.39, volume is 39% of average (low). Support 2327.32, resistance 2445.97.
SHORT signal confirmed. ATR-based scenario (not guaranteed):
Entry range: 2388.88 – 2393.20
Stop-Loss: 2410.46
TP1: 2376.65 | TP2: 2369.46 | TP3: 2362.27 | TP4: 2347.88
Risk: Low volume increases the risk of a breakout; the SL is tight. EMAs are flat – a volume-backed close is needed for a trend reversal. Staying below 2391 keeps the downside targets in play.
Discussion: If support at 2327 is tested, will price hold there or accelerate toward 2300?
🇬🇧 ENGLISH
ETHUSDT 1H shows a STRONG BEARISH trend (score 2/10). Price 2391.04 sits below EMA20 (2403.72) and EMA50 (2406.96); EMA200 (2444.88) caps upside. RSI 42.42 – not yet oversold. MACD histogram -0.87 confirms negative momentum. ATR 14.39, volume only 39% of average. Support 2327.32, resistance 2445.97.
SHORT signal confirmed. ATR-based scenario (not guaranteed):
Entry range: 2388.88 – 2393.20
Stop-Loss: 2410.46
TP1: 2376.65 | TP2: 2369.46 | TP3: 2362.27 | TP4: 2347.88
Risk: Low volume raises breakout risk; SL is tight. EMAs flat – a volume-backed close needed for trend flip. Holding below 2391 keeps downside targets alive.
Discussion: If 2327 support is tested, will price hold or accelerate toward 2300?
#ETHUSDT #Ethereum #KriptoAnaliz #TeknikAnaliz #SHORT
🇹🇷 TURKISH
The STRONG BEARISH trend (score 2/10) continues on the ETHUSDT 1-hour chart. Price is 2391.04, below EMA20 (2403.72) and EMA50 (2406.96); EMA200 (2444.88) is also overhead resistance. RSI 42.42 – not yet oversold. MACD histogram at -0.87 indicates negative momentum. ATR 14.39, volume is 39% of average (low). Support 2327.32, resistance 2445.97.
SHORT signal confirmed. ATR-based scenario (not guaranteed):
Entry range: 2388.88 – 2393.20
Stop-Loss: 2410.46
TP1: 2376.65 | TP2: 2369.46 | TP3: 2362.27 | TP4: 2347.88
Risk: Low volume increases the risk of a breakout; the SL is tight. EMAs are flat – a volume-backed close is needed for a trend reversal. Staying below 2391 keeps the downside targets in play.
Discussion: If support at 2327 is tested, will price hold there or accelerate toward 2300?
🇬🇧 ENGLISH
ETHUSDT 1H shows a STRONG BEARISH trend (score 2/10). Price 2391.04 sits below EMA20 (2403.72) and EMA50 (2406.96); EMA200 (2444.88) caps upside. RSI 42.42 – not yet oversold. MACD histogram -0.87 confirms negative momentum. ATR 14.39, volume only 39% of average. Support 2327.32, resistance 2445.97.
SHORT signal confirmed. ATR-based scenario (not guaranteed):
Entry range: 2388.88 – 2393.20
Stop-Loss: 2410.46
TP1: 2376.65 | TP2: 2369.46 | TP3: 2362.27 | TP4: 2347.88
Risk: Low volume raises breakout risk; SL is tight. EMAs flat – a volume-backed close needed for trend flip. Holding below 2391 keeps downside targets alive.
Discussion: If 2327 support is tested, will price hold or accelerate toward 2300?
#ETHUSDT #Ethereum #KriptoAnaliz #TeknikAnaliz #SHORT
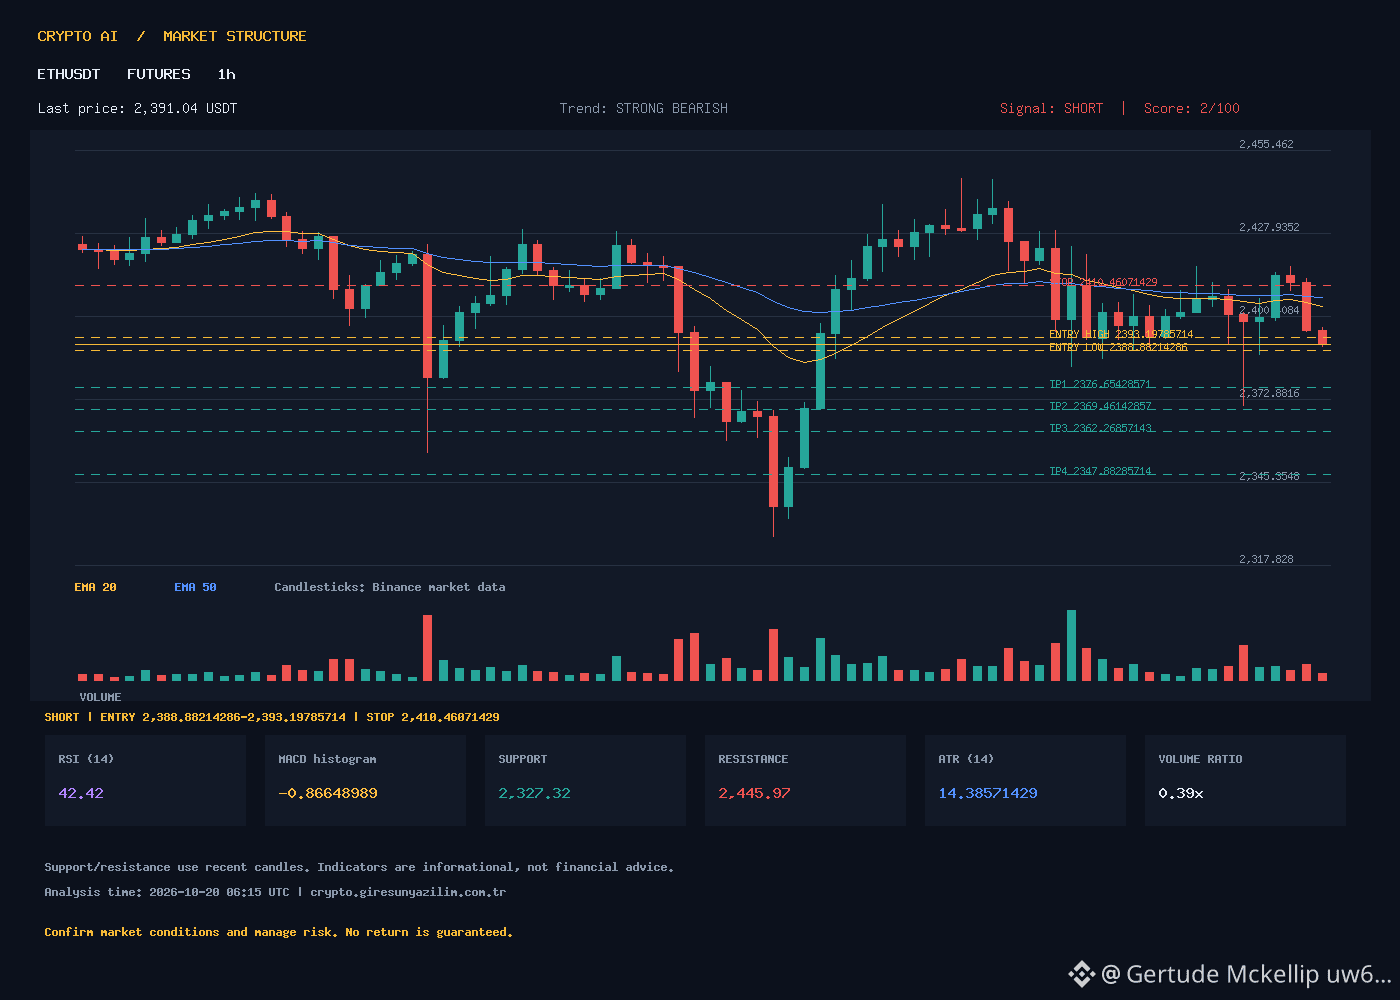
3
SOLUSDT 1H SHORT Signal: ATR-Based Levels | SOLUSDT 1H SHORT Signal: ATR-Based Levels
🇹🇷 TURKISH
Signal: SHORT (1h), Trend: BEARISH, Score: 22. Price 103.71, RSI 43.14 (downward momentum). EMA20 104.47, EMA50 104.29, EMA200 105.94 – price is below all EMAs. MACD 0.073, signal 0.153, histogram -0.080 (bearish crossover). ATR 0.937. Volume 283K (avg. 518K, ratio 0.55) – low. Support 100.35, Resistance 106.22. Trade plan (ATR-based scenario, not guaranteed): Entry range 103.56942857–103.85057143, Stop-Loss 104.97514286, TP1 102.77285714, TP2 102.30428571, TP3 101.83571429, TP4 100.89857143. Could an increase in volume at these levels signal a trend reversal?
🇬🇧 ENGLISH
Signal: SHORT (1h), Trend: BEARISH, Score: 22. Price 103.71, RSI 43.14 (bearish momentum). EMA20 104.47, EMA50 104.29, EMA200 105.94 – price below all EMAs. MACD 0.073, signal 0.153, histogram -0.080 (bearish crossover). ATR 0.937. Volume 283K (avg 518K, ratio 0.55) – low. Support 100.35, Resistance 106.22. Trade plan (ATR-based illustrative scenario, not guaranteed): Entry range 103.56942857–103.85057143, Stop-Loss 104.97514286, TP1 102.77285714, TP2 102.30428571, TP3 101.83571429, TP4 100.89857143. Could a volume spike at these levels trigger a reversal?
#SOLUSDT #Short #TechnicalAnalysis #BinanceFutures #KriptoAnaliz
SOLUSDT 1H SHORT Signal: ATR-Based Levels | SOLUSDT 1H SHORT Signal: ATR-Based Levels
🇹🇷 TURKISH
Signal: SHORT (1h), Trend: BEARISH, Score: 22. Price 103.71, RSI 43.14 (downward momentum). EMA20 104.47, EMA50 104.29, EMA200 105.94 – price is below all EMAs. MACD 0.073, signal 0.153, histogram -0.080 (bearish crossover). ATR 0.937. Volume 283K (avg. 518K, ratio 0.55) – low. Support 100.35, Resistance 106.22. Trade plan (ATR-based scenario, not guaranteed): Entry range 103.56942857–103.85057143, Stop-Loss 104.97514286, TP1 102.77285714, TP2 102.30428571, TP3 101.83571429, TP4 100.89857143. Could an increase in volume at these levels signal a trend reversal?
🇬🇧 ENGLISH
Signal: SHORT (1h), Trend: BEARISH, Score: 22. Price 103.71, RSI 43.14 (bearish momentum). EMA20 104.47, EMA50 104.29, EMA200 105.94 – price below all EMAs. MACD 0.073, signal 0.153, histogram -0.080 (bearish crossover). ATR 0.937. Volume 283K (avg 518K, ratio 0.55) – low. Support 100.35, Resistance 106.22. Trade plan (ATR-based illustrative scenario, not guaranteed): Entry range 103.56942857–103.85057143, Stop-Loss 104.97514286, TP1 102.77285714, TP2 102.30428571, TP3 101.83571429, TP4 100.89857143. Could a volume spike at these levels trigger a reversal?
#SOLUSDT #Short #TechnicalAnalysis #BinanceFutures #KriptoAnaliz
🇹🇷 TURKISH
Signal: SHORT (1h), Trend: BEARISH, Score: 22. Price 103.71, RSI 43.14 (downward momentum). EMA20 104.47, EMA50 104.29, EMA200 105.94 – price is below all EMAs. MACD 0.073, signal 0.153, histogram -0.080 (bearish crossover). ATR 0.937. Volume 283K (avg. 518K, ratio 0.55) – low. Support 100.35, Resistance 106.22. Trade plan (ATR-based scenario, not guaranteed): Entry range 103.56942857–103.85057143, Stop-Loss 104.97514286, TP1 102.77285714, TP2 102.30428571, TP3 101.83571429, TP4 100.89857143. Could an increase in volume at these levels signal a trend reversal?
🇬🇧 ENGLISH
Signal: SHORT (1h), Trend: BEARISH, Score: 22. Price 103.71, RSI 43.14 (bearish momentum). EMA20 104.47, EMA50 104.29, EMA200 105.94 – price below all EMAs. MACD 0.073, signal 0.153, histogram -0.080 (bearish crossover). ATR 0.937. Volume 283K (avg 518K, ratio 0.55) – low. Support 100.35, Resistance 106.22. Trade plan (ATR-based illustrative scenario, not guaranteed): Entry range 103.56942857–103.85057143, Stop-Loss 104.97514286, TP1 102.77285714, TP2 102.30428571, TP3 101.83571429, TP4 100.89857143. Could a volume spike at these levels trigger a reversal?
#SOLUSDT #Short #TechnicalAnalysis #BinanceFutures #KriptoAnaliz
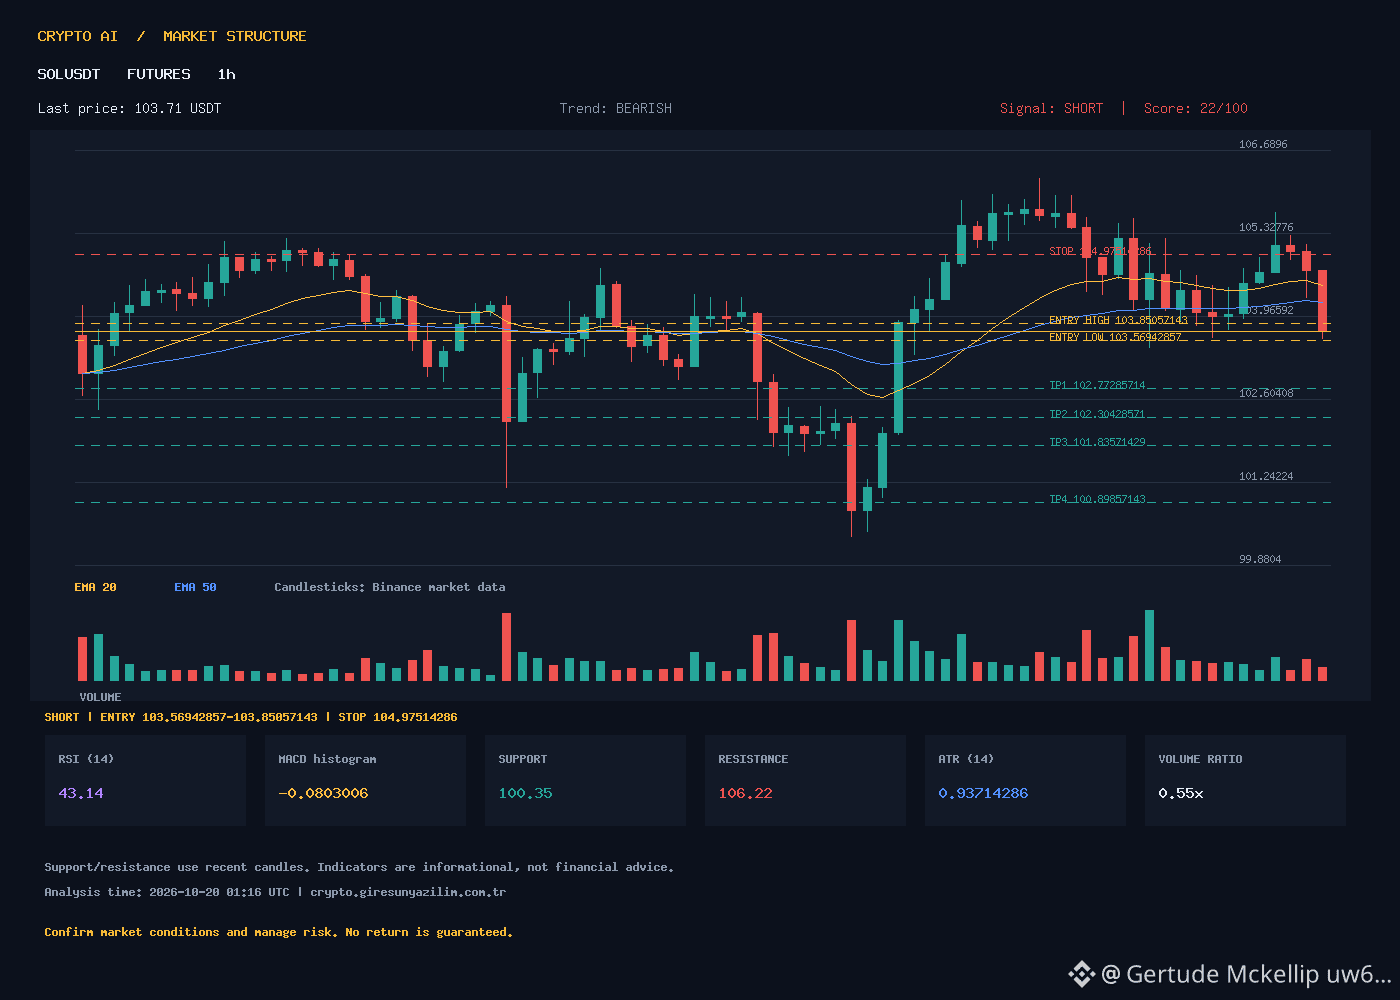
29
Log in to explore more content
Join global crypto users on Binance Square
⚡️ Get latest and useful information about crypto.
💬 Trusted by the world’s largest crypto exchange.
👍 Discover real insights from verified creators.
Email / Phone number
Trending Topics
1
#NvidiaInvestigatesAfterHuang’sAffairApology
185,736 views
1,641 Discussing
2
#BitcoinFiveWeeklyLosses
215,413 views
2,100 Discussing
3
#AIChipSlumpNasdaq
115,916 views
1,300 Discussing
4
#CPITestsDecemberRateOutlook
636,366 views
2,760 Discussing
5
#AnthropicRejectsIPODelayValuationinQuestion
32,663 views
379 Discussing
6
#CryptoLiquidationsReach$1.16BIn24Hours
8,773 views
43 Discussing
7
#BrentCrudeDrops3.8%To$94.56
8,134 views
23 Discussing
8
#EUInstitutionsInviteIndustryToSetTokenizedSecuritiesStandards
1,662 views
16 Discussing
9
#ChinaCACListsFiveIssuesAffectingBlockchainFilings
12,947 views
147 Discussing
10
#UKBanksCanNowApplyToConductCryptoAssetBusiness
11,348 views
105 Discussing