
#qqqb
qqqb
82,631 views
438 Discussing
Hot
Latest

·
--
Bearish
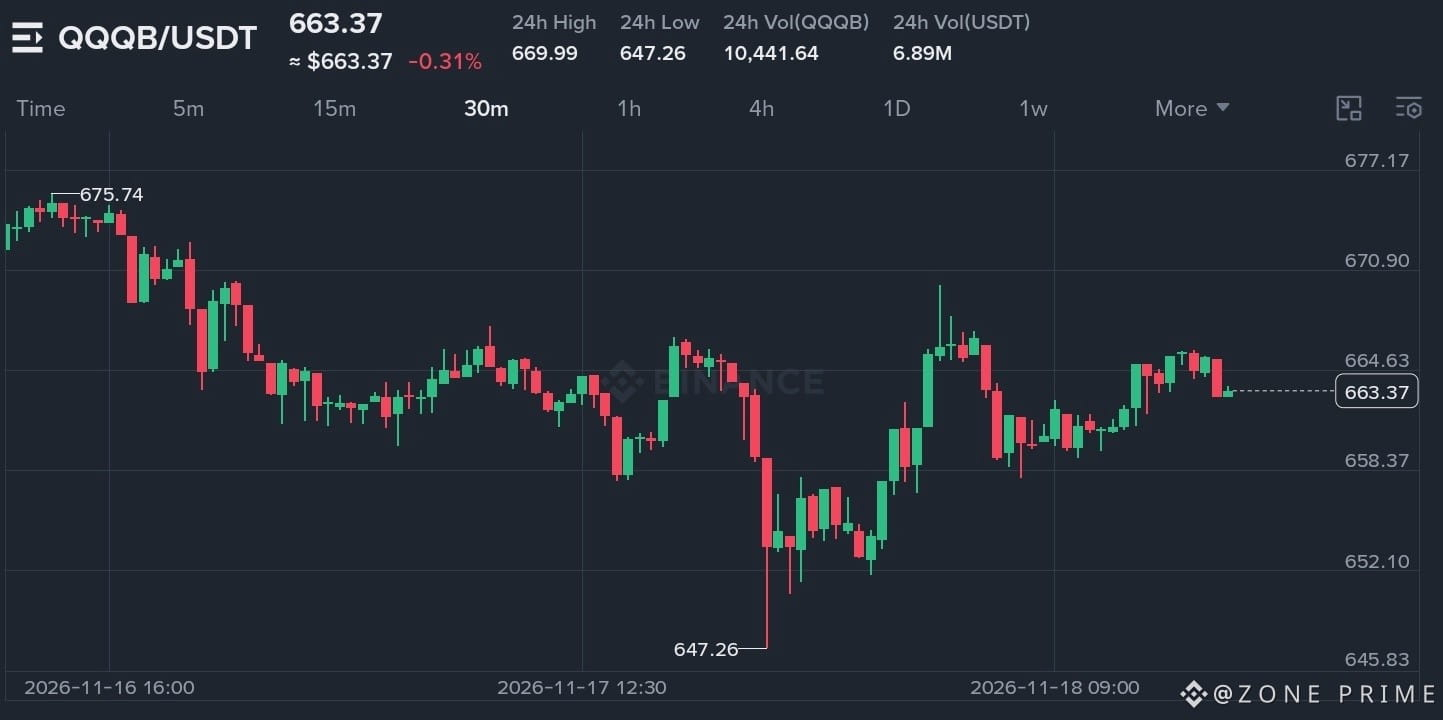
$QQQB /USDT — SHORT SETUP 📉 ✨ 💯
Entry: 667.00 - 670.50
TP1: 662.50
TP2: 658.00
TP3: 652.10
Stop: 673.20
Overhead supply density surrounding the 670.90 to 675.74 zone continues to cap broader upside expansion on the 30-minute chart. Fading volume on approach to upper resistance gives bears a clean vantage point to target a rotation back toward mid-range support.
#qqqb #qqqbusdt #crypto $QQQB
{spot}(QQQBUSDT)
$QQQB /USDT — SHORT SETUP 📉 ✨ 💯
Entry: 667.00 - 670.50
TP1: 662.50
TP2: 658.00
TP3: 652.10
Stop: 673.20
Overhead supply density surrounding the 670.90 to 675.74 zone continues to cap broader upside expansion on the 30-minute chart. Fading volume on approach to upper resistance gives bears a clean vantage point to target a rotation back toward mid-range support.
#qqqb #qqqbusdt #crypto $QQQB
Entry: 667.00 - 670.50
TP1: 662.50
TP2: 658.00
TP3: 652.10
Stop: 673.20
Overhead supply density surrounding the 670.90 to 675.74 zone continues to cap broader upside expansion on the 30-minute chart. Fading volume on approach to upper resistance gives bears a clean vantage point to target a rotation back toward mid-range support.
#qqqb #qqqbusdt #crypto $QQQB
2
178

·
--
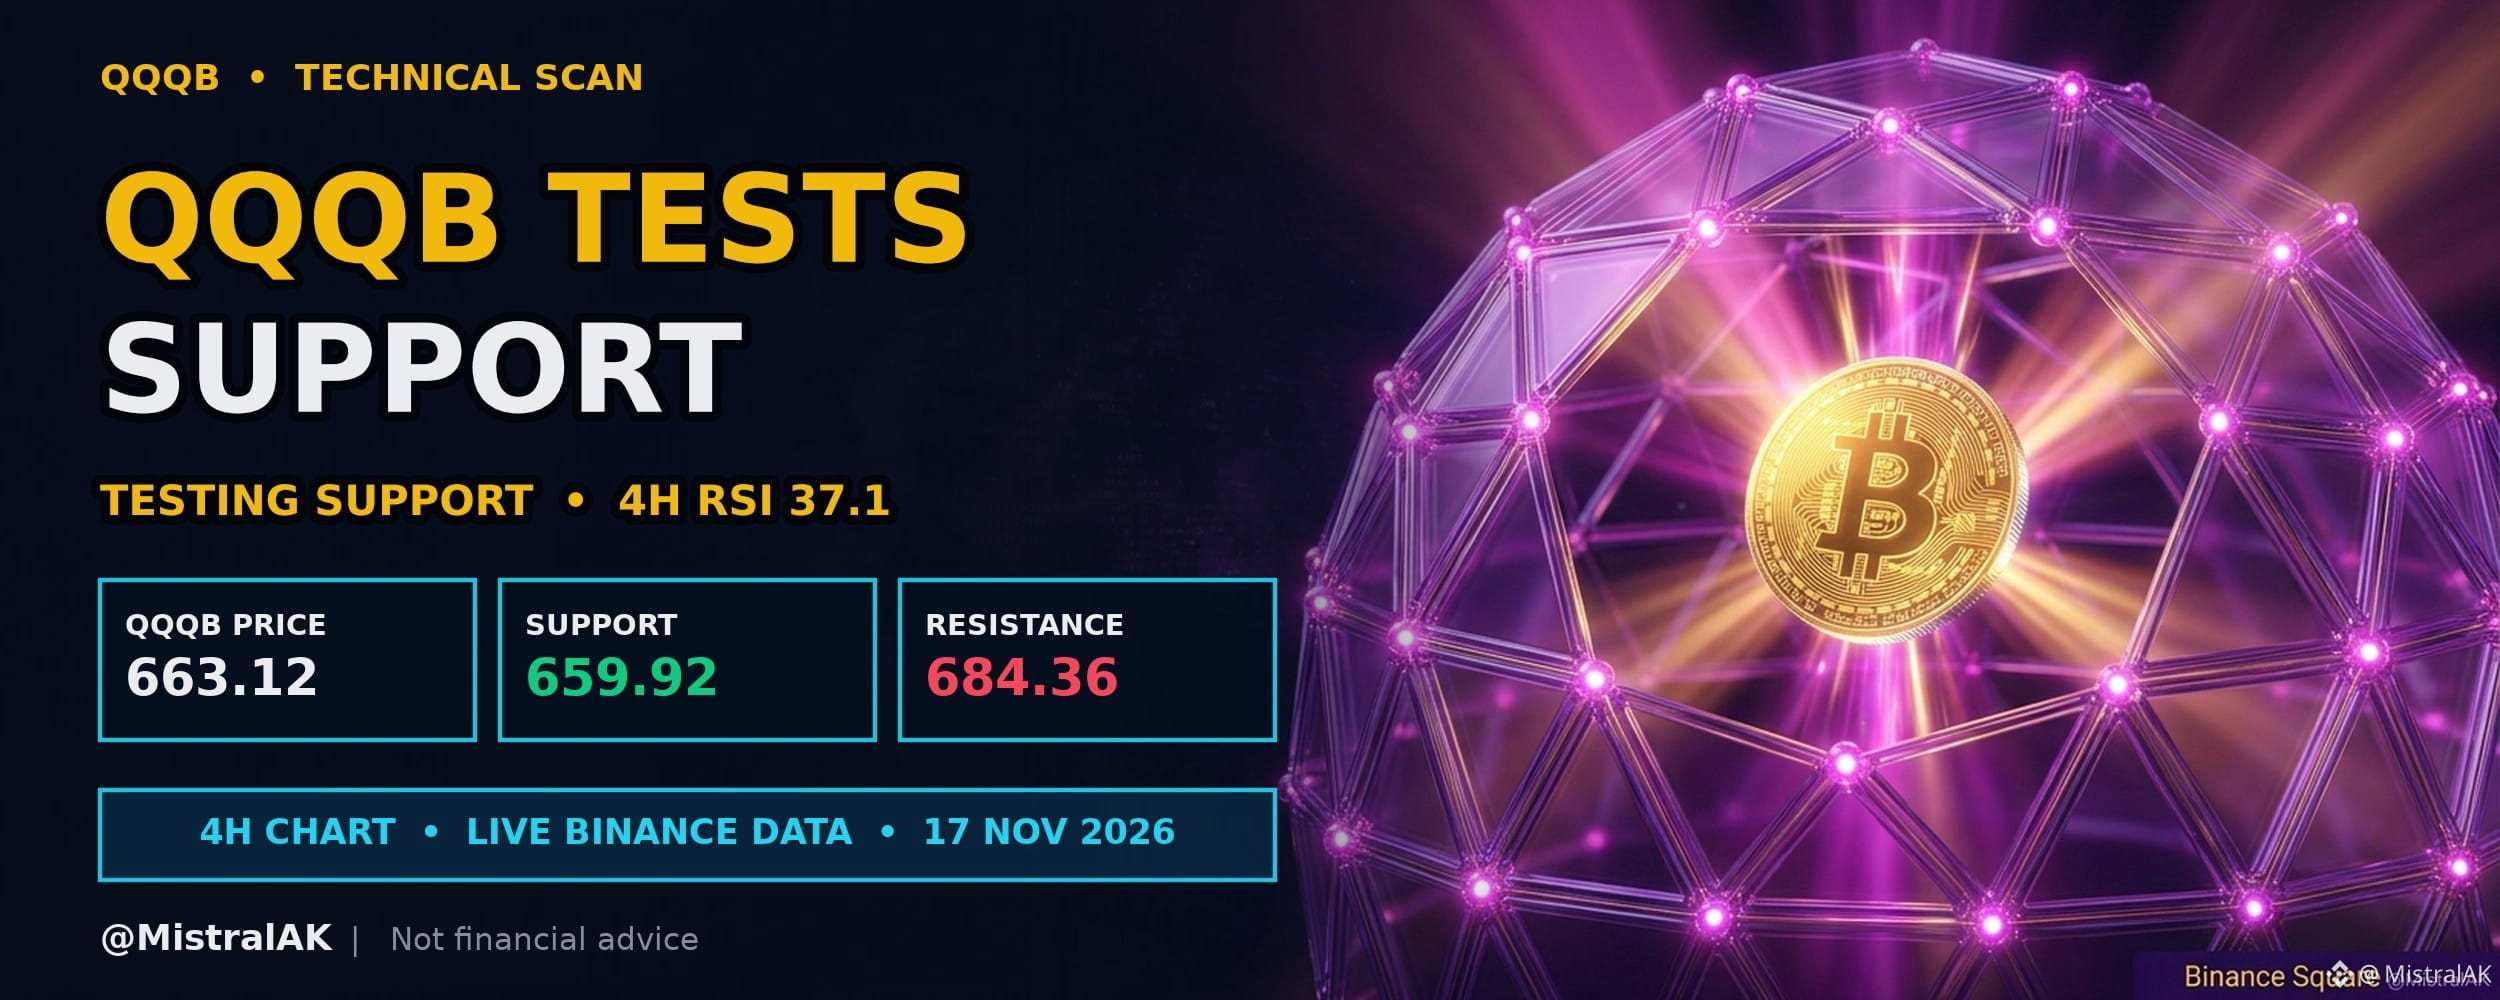
$QQQB Price Tests Twenty Candle Swing Low After Decline
$QQQB trades at 663.12 USD, down 2.8% over the past 24 hours, with 4H RSI at 37.1 (neutral).
Downward movement over the past twenty-four hours brings price to test its recent twenty-candle swing low. The four-hour relative strength index remains balanced, giving traders a clear baseline to watch for either a rebound or a breakdown.
TECHNICAL READ
▪️ Momentum: 4H RSI 37.1 sits in the neutral zone
▪️ Trend filter: EMA 20 is below EMA 50, and price is below EMA 20
▪️ Range: price is 3.2% below the range high and 0.5% above the range low
WHAT WOULD CONFIRM A HOLD
▪️ 4H candles defending 659.92 USD with a recovery above EMA 20 (672.33 USD)
▪️ RSI turning up from its lows
WHAT WOULD INVALIDATE IT
▪️ A 4H close below 659.92 USD
▪️ A bounce that stalls under EMA 20
Do you expect the recent swing low to hold or break on the four-hour chart?
Not financial advice. Always DYOR.
Like & Follow for Daily Trade Analytics & Insider News. @MistralAK
#QQQB #TradingSignals #HotTrends
$QQQB Price Tests Twenty Candle Swing Low After Decline
$QQQB trades at 663.12 USD, down 2.8% over the past 24 hours, with 4H RSI at 37.1 (neutral).
Downward movement over the past twenty-four hours brings price to test its recent twenty-candle swing low. The four-hour relative strength index remains balanced, giving traders a clear baseline to watch for either a rebound or a breakdown.
TECHNICAL READ
▪️ Momentum: 4H RSI 37.1 sits in the neutral zone
▪️ Trend filter: EMA 20 is below EMA 50, and price is below EMA 20
▪️ Range: price is 3.2% below the range high and 0.5% above the range low
WHAT WOULD CONFIRM A HOLD
▪️ 4H candles defending 659.92 USD with a recovery above EMA 20 (672.33 USD)
▪️ RSI turning up from its lows
WHAT WOULD INVALIDATE IT
▪️ A 4H close below 659.92 USD
▪️ A bounce that stalls under EMA 20
Do you expect the recent swing low to hold or break on the four-hour chart?
Not financial advice. Always DYOR.
Like & Follow for Daily Trade Analytics & Insider News. @MistralAK
#QQQB #TradingSignals #HotTrends
$QQQB trades at 663.12 USD, down 2.8% over the past 24 hours, with 4H RSI at 37.1 (neutral).
Downward movement over the past twenty-four hours brings price to test its recent twenty-candle swing low. The four-hour relative strength index remains balanced, giving traders a clear baseline to watch for either a rebound or a breakdown.
TECHNICAL READ
▪️ Momentum: 4H RSI 37.1 sits in the neutral zone
▪️ Trend filter: EMA 20 is below EMA 50, and price is below EMA 20
▪️ Range: price is 3.2% below the range high and 0.5% above the range low
WHAT WOULD CONFIRM A HOLD
▪️ 4H candles defending 659.92 USD with a recovery above EMA 20 (672.33 USD)
▪️ RSI turning up from its lows
WHAT WOULD INVALIDATE IT
▪️ A 4H close below 659.92 USD
▪️ A bounce that stalls under EMA 20
Do you expect the recent swing low to hold or break on the four-hour chart?
Not financial advice. Always DYOR.
Like & Follow for Daily Trade Analytics & Insider News. @MistralAK
#QQQB #TradingSignals #HotTrends
41


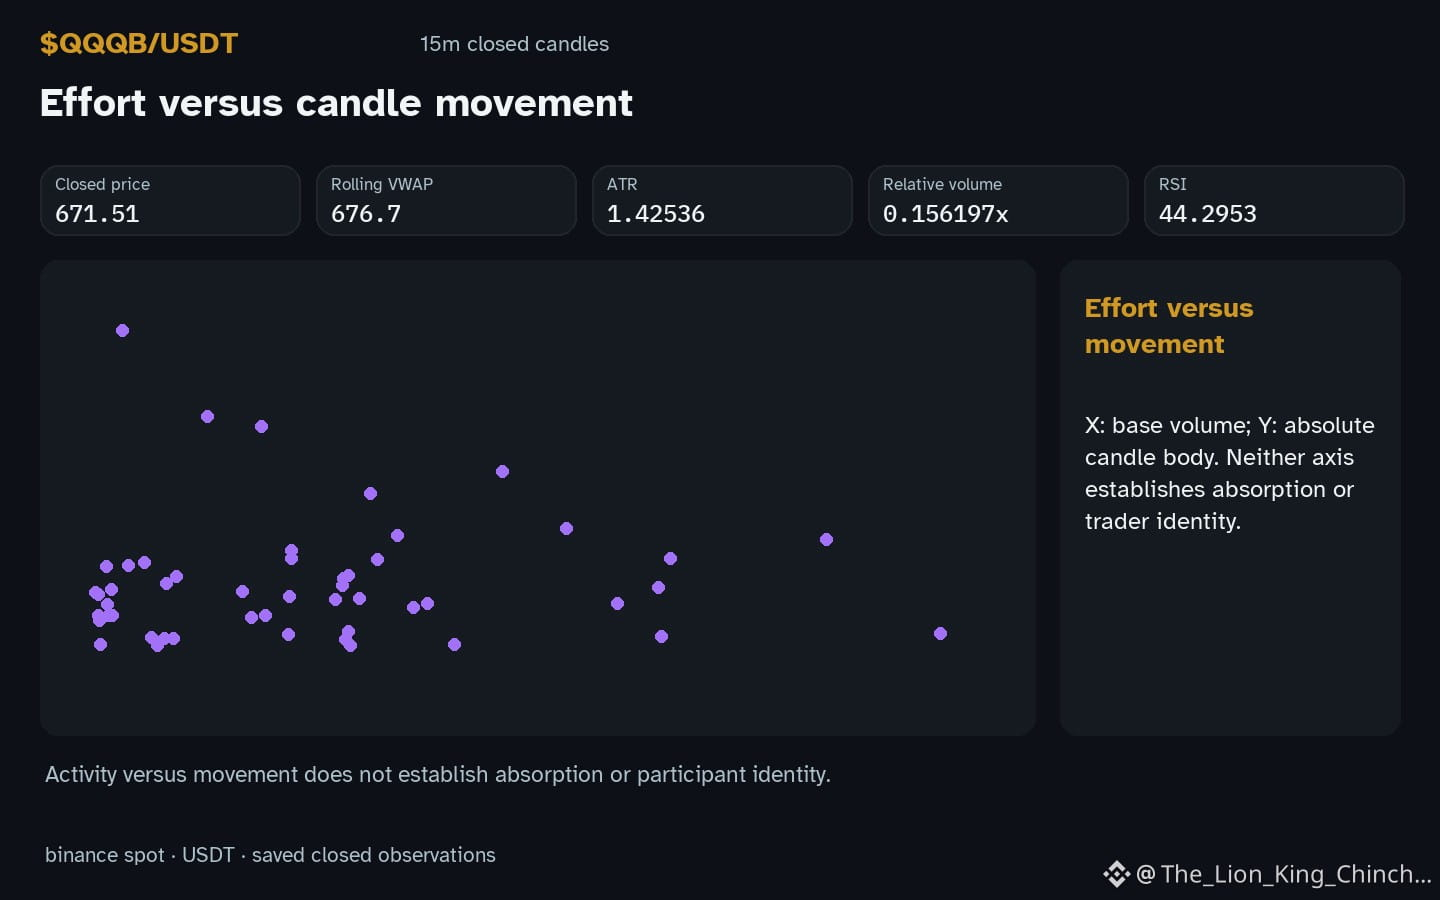
$QQQB: The Steady Hand in a Euphoric Feed
$QQQB: How does one maintain analytical composure when the timeline is flooded with euphoric predictions? The current observation for $QQQB shows an hourly direction of up, yet volume remains not above baseline. This divergence offers a natural laboratory for testing the claim that public sentiment always precedes price action. A common assumption is that visible excitement guarantees immediate follow-through, but the recorded data suggests otherwise. The counterexample to consider is a situation where enthusiasm peaks while actual participation lags. What could change the reading? A subsequent hourly candle closing with volume well above baseline would challenge the current quiet structure. Until then, the evidence supports a measured interpretation rather than a parabolic narrative. Treat this as a thought experiment about incentive structures, not a forecast for this asset. The dilemma lies in balancing the desire to join a trending conversation with the discipline to wait for confirmed participation. A self-check asks whether the analysis relies on the feeling of momentum or the recorded facts of volume and direction. By separating the emotional pull of the feed from the cold data of the chart, a writer can serve as a steady voice. This approach invites thoughtful disagreement without demanding agreement, focusing on the mechanism of evidence over the persuasion of hype.
Probabilistic market research, not a recommendation or guaranteed return.
#QQQB #CryptoCommunity
$QQQB : The Steady Hand in a Euphoric Feed
$QQQB : How does one maintain analytical composure when the timeline is flooded with euphoric predictions? The current observation for $QQQB shows an hourly direction of up, yet volume remains not above baseline. This divergence offers a natural laboratory for testing the claim that public sentiment always precedes price action. A common assumption is that visible excitement guarantees immediate follow-through, but the recorded data suggests otherwise. The counterexample to consider is a situation where enthusiasm peaks while actual participation lags. What could change the reading? A subsequent hourly candle closing with volume well above baseline would challenge the current quiet structure. Until then, the evidence supports a measured interpretation rather than a parabolic narrative. Treat this as a thought experiment about incentive structures, not a forecast for this asset. The dilemma lies in balancing the desire to join a trending conversation with the discipline to wait for confirmed participation. A self-check asks whether the analysis relies on the feeling of momentum or the recorded facts of volume and direction. By separating the emotional pull of the feed from the cold data of the chart, a writer can serve as a steady voice. This approach invites thoughtful disagreement without demanding agreement, focusing on the mechanism of evidence over the persuasion of hype.
Probabilistic market research, not a recommendation or guaranteed return.
#QQQB #CryptoCommunity
$QQQB : How does one maintain analytical composure when the timeline is flooded with euphoric predictions? The current observation for $QQQB shows an hourly direction of up, yet volume remains not above baseline. This divergence offers a natural laboratory for testing the claim that public sentiment always precedes price action. A common assumption is that visible excitement guarantees immediate follow-through, but the recorded data suggests otherwise. The counterexample to consider is a situation where enthusiasm peaks while actual participation lags. What could change the reading? A subsequent hourly candle closing with volume well above baseline would challenge the current quiet structure. Until then, the evidence supports a measured interpretation rather than a parabolic narrative. Treat this as a thought experiment about incentive structures, not a forecast for this asset. The dilemma lies in balancing the desire to join a trending conversation with the discipline to wait for confirmed participation. A self-check asks whether the analysis relies on the feeling of momentum or the recorded facts of volume and direction. By separating the emotional pull of the feed from the cold data of the chart, a writer can serve as a steady voice. This approach invites thoughtful disagreement without demanding agreement, focusing on the mechanism of evidence over the persuasion of hype.
Probabilistic market research, not a recommendation or guaranteed return.
#QQQB #CryptoCommunity
24
$QQQB: Why Same-Venue Comparisons Beat Mixing Prices From Different Exchanges
Why does $QQQB show a down hourly direction while both $BTC and $RARE are up on the same venue? The observation notes $QQQB hourly direction down with volume above baseline, contrasted with peer assets that share an up direction but lack elevated volume. This raises a data‑hygiene question: can we treat the shared direction as a meaningful signal, or does the differing volume structure undermine a joint interpretation?
A hypothetical decision framework treats each coin as an independent data stream. The hourly volume metric 3.63x baseline for $QQQB suggests heightened activity that may reflect a distinct market micro‑structure, whereas the peers’ volume sits at or below baseline, indicating a quieter backdrop. The RSI 45.1 provides a neutral momentum snapshot for $QQQB, further separating its short‑term bias from the peers.
Where the analogy helps is in reminding analysts to cleanly separate direction from intensity. A shared up trend does not guarantee a common driver; the volume divergence limits any inference of correlation. Where it fails is when one assumes that identical direction alone validates a combined forecast.
A self‑check would be to monitor the next closed hourly candle. If $QQQB’s volume falls to baseline while the direction remains down, the earlier heightened‑volume hypothesis weakens. Conversely, if peers suddenly exhibit volume spikes, the shared‑direction narrative may gain credibility. This conditional reassessment keeps the analysis grounded in observable metrics without over‑reaching.
Probabilistic market research, not a recommendation or guaranteed return.
Watchlist contrast: $BTC has hourly direction up and volume not above its baseline; $RARE has hourly direction up and volume not above its baseline. This alone does not establish correlation.
#QQQB #BTC #RARE
$QQQB : Why Same-Venue Comparisons Beat Mixing Prices From Different Exchanges
Why does $QQQB show a down hourly direction while both $BTC and $RARE are up on the same venue? The observation notes $QQQB hourly direction down with volume above baseline, contrasted with peer assets that share an up direction but lack elevated volume. This raises a data‑hygiene question: can we treat the shared direction as a meaningful signal, or does the differing volume structure undermine a joint interpretation?
A hypothetical decision framework treats each coin as an independent data stream. The hourly volume metric 3.63x baseline for $QQQB suggests heightened activity that may reflect a distinct market micro‑structure, whereas the peers’ volume sits at or below baseline, indicating a quieter backdrop. The RSI 45.1 provides a neutral momentum snapshot for $QQQB , further separating its short‑term bias from the peers.
Where the analogy helps is in reminding analysts to cleanly separate direction from intensity. A shared up trend does not guarantee a common driver; the volume divergence limits any inference of correlation. Where it fails is when one assumes that identical direction alone validates a combined forecast.
A self‑check would be to monitor the next closed hourly candle. If $QQQB ’s volume falls to baseline while the direction remains down, the earlier heightened‑volume hypothesis weakens. Conversely, if peers suddenly exhibit volume spikes, the shared‑direction narrative may gain credibility. This conditional reassessment keeps the analysis grounded in observable metrics without over‑reaching.
Probabilistic market research, not a recommendation or guaranteed return.
Watchlist contrast: $BTC has hourly direction up and volume not above its baseline; $RARE has hourly direction up and volume not above its baseline. This alone does not establish correlation.
#QQQB #BTC #RARE
Why does $QQQB show a down hourly direction while both $BTC and $RARE are up on the same venue? The observation notes $QQQB hourly direction down with volume above baseline, contrasted with peer assets that share an up direction but lack elevated volume. This raises a data‑hygiene question: can we treat the shared direction as a meaningful signal, or does the differing volume structure undermine a joint interpretation?
A hypothetical decision framework treats each coin as an independent data stream. The hourly volume metric 3.63x baseline for $QQQB suggests heightened activity that may reflect a distinct market micro‑structure, whereas the peers’ volume sits at or below baseline, indicating a quieter backdrop. The RSI 45.1 provides a neutral momentum snapshot for $QQQB , further separating its short‑term bias from the peers.
Where the analogy helps is in reminding analysts to cleanly separate direction from intensity. A shared up trend does not guarantee a common driver; the volume divergence limits any inference of correlation. Where it fails is when one assumes that identical direction alone validates a combined forecast.
A self‑check would be to monitor the next closed hourly candle. If $QQQB ’s volume falls to baseline while the direction remains down, the earlier heightened‑volume hypothesis weakens. Conversely, if peers suddenly exhibit volume spikes, the shared‑direction narrative may gain credibility. This conditional reassessment keeps the analysis grounded in observable metrics without over‑reaching.
Probabilistic market research, not a recommendation or guaranteed return.
Watchlist contrast: $BTC has hourly direction up and volume not above its baseline; $RARE has hourly direction up and volume not above its baseline. This alone does not establish correlation.
#QQQB #BTC #RARE
55

·
--
📊 TECHNICAL ANALYSIS $QQQB (QQQBUSDT) — 🟢 LONG
💰 Current price: 666.080 USDT (24h: -0.83% | Vol 24h: 17.77M USDT)
📈 24h range: Low 663.400 — High 684.360 | 4H timeframe (EMA7: 673.811 • RSI: 39)
🎯 Entry (Entry zone): 663.416 - 666.080
✅ TP1 (Take profit 1): 696.054
✅ TP2 (Take profit 2): 720.032
🛑 SL (Stop-loss): 651.426
📝 Technical outlook: On the 4H timeframe, $QQQB is trading around 666.080 USDT (-0.83% over 24h), with trading volume reaching 17.77M USDT. The price structure is holding firm above the 663.400 support zone (RSI 39), as active buying pressure is absorbing short-term selling pressure well, with a view toward the 684.360 resistance zone.
⚠️ Disclaimer: This analysis is for informational purposes only and does not constitute investment advice. Do your own research (DYOR) and manage your capital carefully before trading.
#QQQB #BinanceSquare #CryptoAnalysis
📊 TECHNICAL ANALYSIS $QQQB (QQQBUSDT) — 🟢 LONG
💰 Current price: 666.080 USDT (24h: -0.83% | Vol 24h: 17.77M USDT)
📈 24h range: Low 663.400 — High 684.360 | 4H timeframe (EMA7: 673.811 • RSI: 39)
🎯 Entry (Entry zone): 663.416 - 666.080
✅ TP1 (Take profit 1): 696.054
✅ TP2 (Take profit 2): 720.032
🛑 SL (Stop-loss): 651.426
📝 Technical outlook: On the 4H timeframe, $QQQB is trading around 666.080 USDT (-0.83% over 24h), with trading volume reaching 17.77M USDT. The price structure is holding firm above the 663.400 support zone (RSI 39), as active buying pressure is absorbing short-term selling pressure well, with a view toward the 684.360 resistance zone.
⚠️ Disclaimer: This analysis is for informational purposes only and does not constitute investment advice. Do your own research (DYOR) and manage your capital carefully before trading.
#QQQB #BinanceSquare #CryptoAnalysis
💰 Current price: 666.080 USDT (24h: -0.83% | Vol 24h: 17.77M USDT)
📈 24h range: Low 663.400 — High 684.360 | 4H timeframe (EMA7: 673.811 • RSI: 39)
🎯 Entry (Entry zone): 663.416 - 666.080
✅ TP1 (Take profit 1): 696.054
✅ TP2 (Take profit 2): 720.032
🛑 SL (Stop-loss): 651.426
📝 Technical outlook: On the 4H timeframe, $QQQB is trading around 666.080 USDT (-0.83% over 24h), with trading volume reaching 17.77M USDT. The price structure is holding firm above the 663.400 support zone (RSI 39), as active buying pressure is absorbing short-term selling pressure well, with a view toward the 684.360 resistance zone.
⚠️ Disclaimer: This analysis is for informational purposes only and does not constitute investment advice. Do your own research (DYOR) and manage your capital carefully before trading.
#QQQB #BinanceSquare #CryptoAnalysis

·
--
$QQQB -0.85% | $OPG -1.02% | $HMSTR -1.05%
#QQQB slipped to $670.20, down 0.85% on $3.2 M of volume. The dip is modest, but the relatively high turnover suggests traders are still active.
#OPG traded at $0.1361, easing 1.02% with $1.4 M changing hands. Its lower price movement paired with decent volume hints at a gradual re‑balancing.
#HMSTR sits at $0.00014070, down 1.05% on $1.3 M of volume. The tiny price shift alongside solid flow may keep it on the radar for short‑term players.
👀 Keep an eye on the narrowing volume spread between QQQB and OPG; any shift could signal the next short‑term trend.
#Write2Earn #Binance
$QQQB -0.85% | $OPG -1.02% | $HMSTR -1.05%
#QQQB slipped to $670.20, down 0.85% on $3.2 M of volume. The dip is modest, but the relatively high turnover suggests traders are still active.
#OPG traded at $0.1361, easing 1.02% with $1.4 M changing hands. Its lower price movement paired with decent volume hints at a gradual re‑balancing.
#HMSTR sits at $0.00014070, down 1.05% on $1.3 M of volume. The tiny price shift alongside solid flow may keep it on the radar for short‑term players.
👀 Keep an eye on the narrowing volume spread between QQQB and OPG; any shift could signal the next short‑term trend.
#Write2Earn #Binance
#QQQB slipped to $670.20, down 0.85% on $3.2 M of volume. The dip is modest, but the relatively high turnover suggests traders are still active.
#OPG traded at $0.1361, easing 1.02% with $1.4 M changing hands. Its lower price movement paired with decent volume hints at a gradual re‑balancing.
#HMSTR sits at $0.00014070, down 1.05% on $1.3 M of volume. The tiny price shift alongside solid flow may keep it on the radar for short‑term players.
👀 Keep an eye on the narrowing volume spread between QQQB and OPG; any shift could signal the next short‑term trend.
#Write2Earn #Binance
13

·
--
$QQQB -0.92% | $MUB -0.94% | $SKHYB -1.29%
#QQQB trades around $670.04, slipping 0.92% with $3.2 M changing hands. The modest pullback may simply reflect short‑term profit‑taking.
#MUB is at $755.74, down 0.94% on $3.7 M volume. Its movement tracks the broader tilt in fixed‑income ETFs, though the dip isn’t dramatic.
#SKHYB sits near $128.66, off 1.29% with $1.3 M traded. The larger percentage drop hints at a bit more pressure than the other two.
👀 Keep an eye on whether the slightly higher decline in SKHYB signals a sector‑specific shift rather than a market‑wide trend.
#Write2Earn #Binance
$QQQB -0.92% | $MUB -0.94% | $SKHYB -1.29%
#QQQB trades around $670.04, slipping 0.92% with $3.2 M changing hands. The modest pullback may simply reflect short‑term profit‑taking.
#MUB is at $755.74, down 0.94% on $3.7 M volume. Its movement tracks the broader tilt in fixed‑income ETFs, though the dip isn’t dramatic.
#SKHYB sits near $128.66, off 1.29% with $1.3 M traded. The larger percentage drop hints at a bit more pressure than the other two.
👀 Keep an eye on whether the slightly higher decline in SKHYB signals a sector‑specific shift rather than a market‑wide trend.
#Write2Earn #Binance
#QQQB trades around $670.04, slipping 0.92% with $3.2 M changing hands. The modest pullback may simply reflect short‑term profit‑taking.
#MUB is at $755.74, down 0.94% on $3.7 M volume. Its movement tracks the broader tilt in fixed‑income ETFs, though the dip isn’t dramatic.
#SKHYB sits near $128.66, off 1.29% with $1.3 M traded. The larger percentage drop hints at a bit more pressure than the other two.
👀 Keep an eye on whether the slightly higher decline in SKHYB signals a sector‑specific shift rather than a market‑wide trend.
#Write2Earn #Binance
13
·
--
$QQQB -1.18% | $PAXG -1.19% | $KITE -1.31%
#QQQB slipped to $671.15, down 1.18% on $3.0 M of trade. The dip hints at a brief pullback amid broader market softness.
#PAXG fell to $3,829.64, edging lower by 1.19% with $9.0 M changing hands. Gold‑backed tokens often mirror risk sentiment, and today’s move reflects that trend.
#KITE dropped to $0.1279, a 1.31% decline on $1.7 M volume. Its modest liquidity makes each sell‑off feel more pronounced. 📉
Keep an eye on the relative volume gaps—PAXG’s higher flow may cushion its next swing.
#Write2Earn #Binance
$QQQB -1.18% | $PAXG -1.19% | $KITE -1.31%
#QQQB slipped to $671.15, down 1.18% on $3.0 M of trade. The dip hints at a brief pullback amid broader market softness.
#PAXG fell to $3,829.64, edging lower by 1.19% with $9.0 M changing hands. Gold‑backed tokens often mirror risk sentiment, and today’s move reflects that trend.
#KITE dropped to $0.1279, a 1.31% decline on $1.7 M volume. Its modest liquidity makes each sell‑off feel more pronounced. 📉
Keep an eye on the relative volume gaps—PAXG’s higher flow may cushion its next swing.
#Write2Earn #Binance
#QQQB slipped to $671.15, down 1.18% on $3.0 M of trade. The dip hints at a brief pullback amid broader market softness.
#PAXG fell to $3,829.64, edging lower by 1.19% with $9.0 M changing hands. Gold‑backed tokens often mirror risk sentiment, and today’s move reflects that trend.
#KITE dropped to $0.1279, a 1.31% decline on $1.7 M volume. Its modest liquidity makes each sell‑off feel more pronounced. 📉
Keep an eye on the relative volume gaps—PAXG’s higher flow may cushion its next swing.
#Write2Earn #Binance
8

·
--
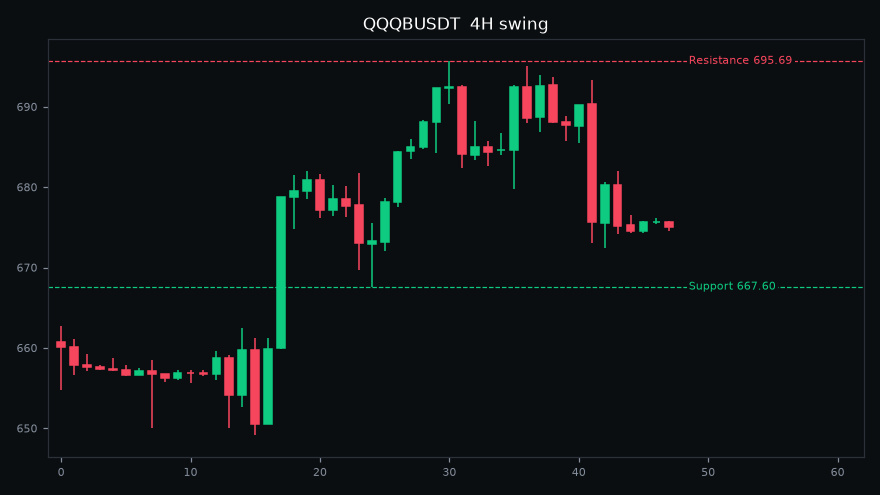
📉 $QQQB under heavy pressure, -2.4% in 24h
Price: 674.83
24h High: 691.25 | 24h Low: 672.49
24h Volume: $5.9M
Support: 667.60 | Resistance: 695.69
RSI 41 (4H swing)
Falling fast, wait for confirmation before catching it.
#QQQB #Trading #CryptoTrading #Crypto
⚠️ Educational only, not financial advice. DYOR.
📉 $QQQB under heavy pressure, -2.4% in 24h
Price: 674.83
24h High: 691.25 | 24h Low: 672.49
24h Volume: $5.9M
Support: 667.60 | Resistance: 695.69
RSI 41 (4H swing)
Falling fast, wait for confirmation before catching it.
#QQQB #Trading #CryptoTrading #Crypto
⚠️ Educational only, not financial advice. DYOR.
Price: 674.83
24h High: 691.25 | 24h Low: 672.49
24h Volume: $5.9M
Support: 667.60 | Resistance: 695.69
RSI 41 (4H swing)
Falling fast, wait for confirmation before catching it.
#QQQB #Trading #CryptoTrading #Crypto
⚠️ Educational only, not financial advice. DYOR.
8
·
--
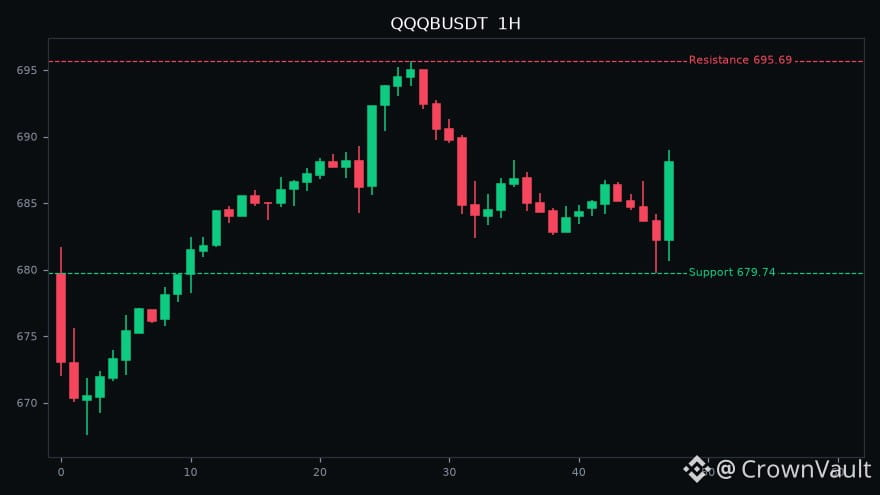
🚀 $QQQB among today's top gainers (+0.3%)
Price: 687.77
24h High: 695.69 | 24h Low: 679.74
24h Volume: $14.8M
Support: 679.74 | Resistance: 695.69
RSI 59 (1H)
Buyers are in control for now, stay careful.
#QQQB #Trading #CryptoTrading #BinanceSquare
⚠️ For education only. Trade at your own risk.
🚀 $QQQB among today's top gainers (+0.3%)
Price: 687.77
24h High: 695.69 | 24h Low: 679.74
24h Volume: $14.8M
Support: 679.74 | Resistance: 695.69
RSI 59 (1H)
Buyers are in control for now, stay careful.
#QQQB #Trading #CryptoTrading #BinanceSquare
⚠️ For education only. Trade at your own risk.
Price: 687.77
24h High: 695.69 | 24h Low: 679.74
24h Volume: $14.8M
Support: 679.74 | Resistance: 695.69
RSI 59 (1H)
Buyers are in control for now, stay careful.
#QQQB #Trading #CryptoTrading #BinanceSquare
⚠️ For education only. Trade at your own risk.
8

·
--
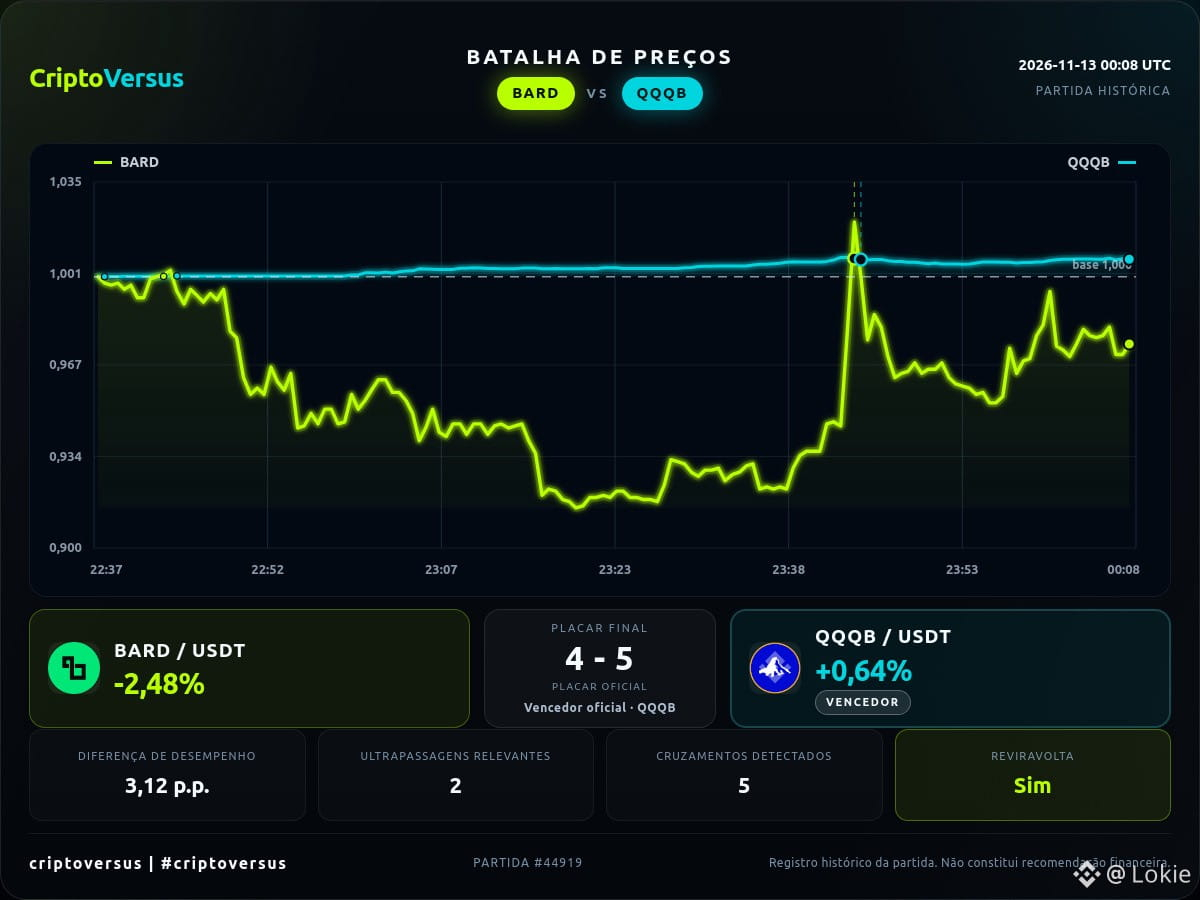
How the matchup between BARD and QQQB unfolded
The chart shows the time period that gave rise to this contest.
On the chart: Price Battle comeback: QQQB lagged in relative performance, took the lead, and finished the match ahead of BARD. BARD: -2.5% | QQQB: +0.6%.
What information should appear in the next matchup?
#CriptoVersus #PriceBattle #BARD #QQQB
Historical and informational content; not financial advice.
How the matchup between BARD and QQQB unfolded
The chart shows the time period that gave rise to this contest.
On the chart: Price Battle comeback: QQQB lagged in relative performance, took the lead, and finished the match ahead of BARD. BARD: -2.5% | QQQB: +0.6%.
What information should appear in the next matchup?
#CriptoVersus #PriceBattle #BARD #QQQB
Historical and informational content; not financial advice.
The chart shows the time period that gave rise to this contest.
On the chart: Price Battle comeback: QQQB lagged in relative performance, took the lead, and finished the match ahead of BARD. BARD: -2.5% | QQQB: +0.6%.
What information should appear in the next matchup?
#CriptoVersus #PriceBattle #BARD #QQQB
Historical and informational content; not financial advice.
134
·
--
QQQB tested both the upside and downside, then ended up back where it started. The move wasn’t huge, but it wasn’t small either.
A quick look at the numbers: intraday high 695.69, low 682.40, current price 686.28, up 0.02% over 24 hours. It closed in the lower part of the range, and the rebound was fairly modest.
The 7-day moving average is 671.17, with the price 2.3% above it. It’s down 8.1% from the 30-day high of 746.85. The range is still holding, but the center of gravity is gradually shifting lower. 695.69 is overhead resistance, so the rebound needs to clear that hurdle first.
There’s not much to say technically. I’ll wait for it to choose a direction. Since the price is above the moving average, I usually wait for a pullback and confirmation before making a move.
(The above is just my personal record, not investment advice.)
#QQQB #盘面观察 #TradingNotes
QQQB tested both the upside and downside, then ended up back where it started. The move wasn’t huge, but it wasn’t small either.
A quick look at the numbers: intraday high 695.69, low 682.40, current price 686.28, up 0.02% over 24 hours. It closed in the lower part of the range, and the rebound was fairly modest.
The 7-day moving average is 671.17, with the price 2.3% above it. It’s down 8.1% from the 30-day high of 746.85. The range is still holding, but the center of gravity is gradually shifting lower. 695.69 is overhead resistance, so the rebound needs to clear that hurdle first.
There’s not much to say technically. I’ll wait for it to choose a direction. Since the price is above the moving average, I usually wait for a pullback and confirmation before making a move.
(The above is just my personal record, not investment advice.)
#QQQB #盘面观察 #TradingNotes
A quick look at the numbers: intraday high 695.69, low 682.40, current price 686.28, up 0.02% over 24 hours. It closed in the lower part of the range, and the rebound was fairly modest.
The 7-day moving average is 671.17, with the price 2.3% above it. It’s down 8.1% from the 30-day high of 746.85. The range is still holding, but the center of gravity is gradually shifting lower. 695.69 is overhead resistance, so the rebound needs to clear that hurdle first.
There’s not much to say technically. I’ll wait for it to choose a direction. Since the price is above the moving average, I usually wait for a pullback and confirmation before making a move.
(The above is just my personal record, not investment advice.)
#QQQB #盘面观察 #TradingNotes
6
$QQQB: The VWAP Magnet Test: Why Price Keeps Returning to the Scene of the Volume
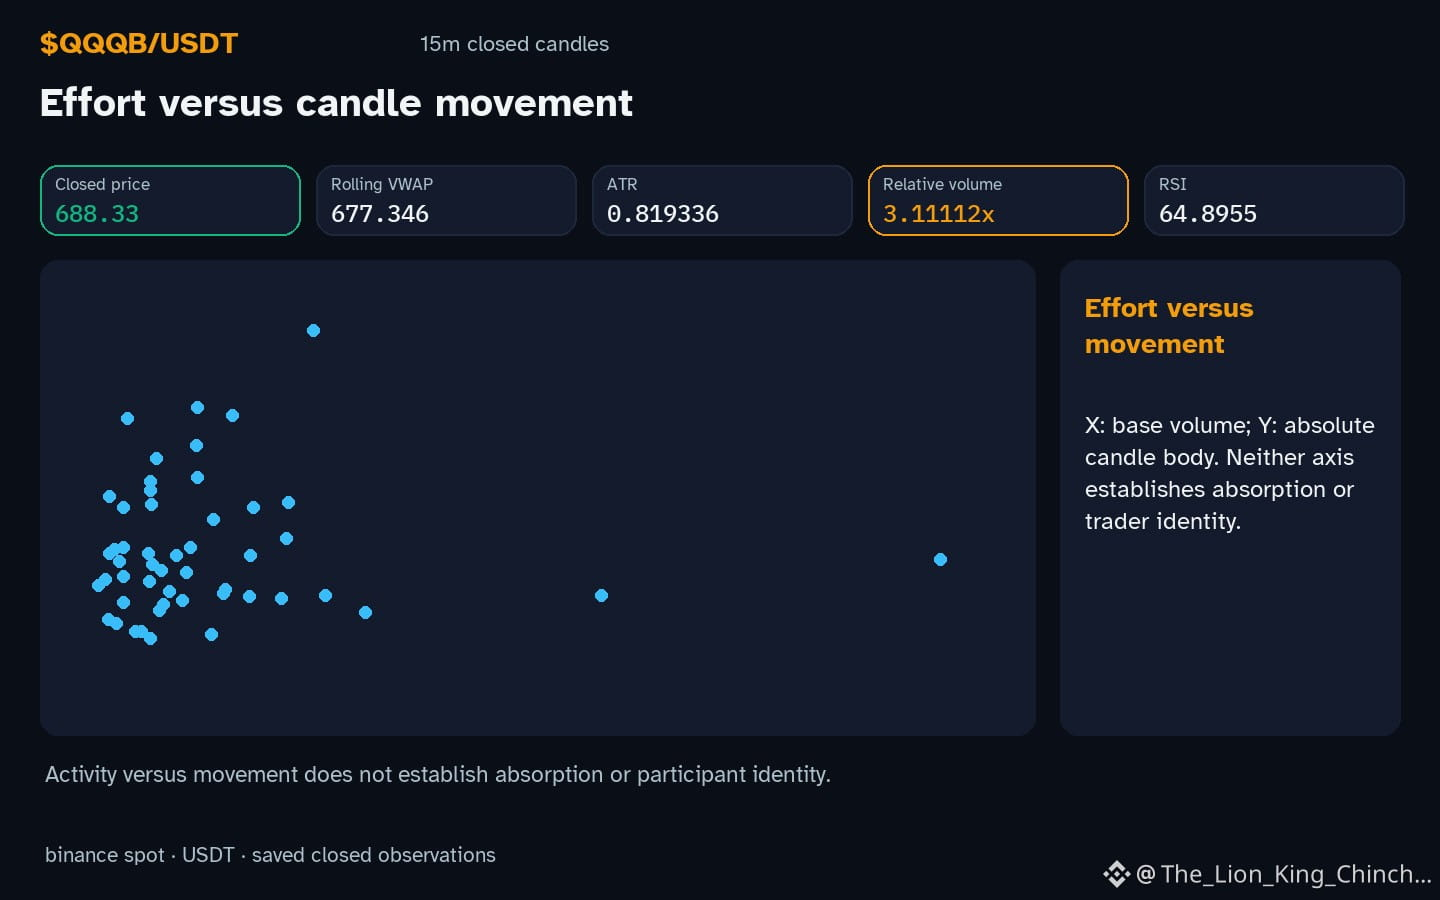
$QQQB: Does a clean close or a retest add stronger evidence? The current price is 688.33. Observations show the asset is inside its recorded 20 range. The hourly direction moves up with volume above baseline. This provides a factual starting point for the inquiry.
A hypothetical mechanism suggests volume-weighted price acts like an equilibrium anchor. Think of a pendulum swinging back to its resting point. The daily VWAP sits at 677.346. Relative volume is 3.11112. This concept treats high activity levels as gravity wells. Price might drift away due to short-term flows but tend to return. An alternative reading is that the anchor is purely structural. Recent sessions set the price path. The daily change is 1.7457. The short-interval change is 0.0872435. If volume spikes on a move away, it breaks the anchor assumption. Low volume on a return weakens the gravity idea. The provided RSI is 64.8955. This metric shows momentum but does not prove the mechanism. A clean close away from the VWAP suggests the anchor fails. A retest with declining volume supports the equilibrium view.
A self-check requires defining the invalidation level. If price closes above 688.7 with strength, the idea fails. If price stays within 684.72 and 688.7, it is neutral. The daily range spans 667.6 to 688.7. Using ATR of 0.819336 helps gauge normal noise. Do not confuse correlation with causation. This is a thought experiment, not a prediction. Verify the hypothesis by watching the next session. Track the exact relationship between quote volume at 6.55673e+06 and distance from the daily VWAP. If price stays far from the anchor despite normal volume, abandon the theory. Keep the analysis simple and testable.
Probabilistic market research, not a recommendation or guaranteed return.
A clean close or a retest: which would add evidence?
#QQQB #MarketAnalysis #CryptoLearning
$QQQB : The VWAP Magnet Test: Why Price Keeps Returning to the Scene of the Volume
$QQQB : Does a clean close or a retest add stronger evidence? The current price is 688.33. Observations show the asset is inside its recorded 20 range. The hourly direction moves up with volume above baseline. This provides a factual starting point for the inquiry.
A hypothetical mechanism suggests volume-weighted price acts like an equilibrium anchor. Think of a pendulum swinging back to its resting point. The daily VWAP sits at 677.346. Relative volume is 3.11112. This concept treats high activity levels as gravity wells. Price might drift away due to short-term flows but tend to return. An alternative reading is that the anchor is purely structural. Recent sessions set the price path. The daily change is 1.7457. The short-interval change is 0.0872435. If volume spikes on a move away, it breaks the anchor assumption. Low volume on a return weakens the gravity idea. The provided RSI is 64.8955. This metric shows momentum but does not prove the mechanism. A clean close away from the VWAP suggests the anchor fails. A retest with declining volume supports the equilibrium view.
A self-check requires defining the invalidation level. If price closes above 688.7 with strength, the idea fails. If price stays within 684.72 and 688.7, it is neutral. The daily range spans 667.6 to 688.7. Using ATR of 0.819336 helps gauge normal noise. Do not confuse correlation with causation. This is a thought experiment, not a prediction. Verify the hypothesis by watching the next session. Track the exact relationship between quote volume at 6.55673e+06 and distance from the daily VWAP. If price stays far from the anchor despite normal volume, abandon the theory. Keep the analysis simple and testable.
Probabilistic market research, not a recommendation or guaranteed return.
A clean close or a retest: which would add evidence?
#QQQB #MarketAnalysis #CryptoLearning
$QQQB : Does a clean close or a retest add stronger evidence? The current price is 688.33. Observations show the asset is inside its recorded 20 range. The hourly direction moves up with volume above baseline. This provides a factual starting point for the inquiry.
A hypothetical mechanism suggests volume-weighted price acts like an equilibrium anchor. Think of a pendulum swinging back to its resting point. The daily VWAP sits at 677.346. Relative volume is 3.11112. This concept treats high activity levels as gravity wells. Price might drift away due to short-term flows but tend to return. An alternative reading is that the anchor is purely structural. Recent sessions set the price path. The daily change is 1.7457. The short-interval change is 0.0872435. If volume spikes on a move away, it breaks the anchor assumption. Low volume on a return weakens the gravity idea. The provided RSI is 64.8955. This metric shows momentum but does not prove the mechanism. A clean close away from the VWAP suggests the anchor fails. A retest with declining volume supports the equilibrium view.
A self-check requires defining the invalidation level. If price closes above 688.7 with strength, the idea fails. If price stays within 684.72 and 688.7, it is neutral. The daily range spans 667.6 to 688.7. Using ATR of 0.819336 helps gauge normal noise. Do not confuse correlation with causation. This is a thought experiment, not a prediction. Verify the hypothesis by watching the next session. Track the exact relationship between quote volume at 6.55673e+06 and distance from the daily VWAP. If price stays far from the anchor despite normal volume, abandon the theory. Keep the analysis simple and testable.
Probabilistic market research, not a recommendation or guaranteed return.
A clean close or a retest: which would add evidence?
#QQQB #MarketAnalysis #CryptoLearning
25

ATH/ATL Watch 🎯
Getting close to all-time highs:
$QQQB - 11.0% away
$TSLAB - 13.8% away
Near all-time lows:
$XUSD - 0.4% away
ATH breakouts often signal strong momentum. ATL bounces can be interesting reversal plays. Always DYOR.
Are you buying, selling, or holding?
#QQQB #XUSD #TSLAB #Trending #Breaking
📱 Follow @PoorCryptoMan
ATH/ATL Watch 🎯
Getting close to all-time highs:
$QQQB - 11.0% away
$TSLAB - 13.8% away
Near all-time lows:
$XUSD - 0.4% away
ATH breakouts often signal strong momentum. ATL bounces can be interesting reversal plays. Always DYOR.
Are you buying, selling, or holding?
#QQQB #XUSD #TSLAB #Trending #Breaking
📱 Follow @PoorCryptoMan
Getting close to all-time highs:
$QQQB - 11.0% away
$TSLAB - 13.8% away
Near all-time lows:
$XUSD - 0.4% away
ATH breakouts often signal strong momentum. ATL bounces can be interesting reversal plays. Always DYOR.
Are you buying, selling, or holding?
#QQQB #XUSD #TSLAB #Trending #Breaking
📱 Follow @PoorCryptoMan
2
Questioning the Volume Expansion in $QQQB
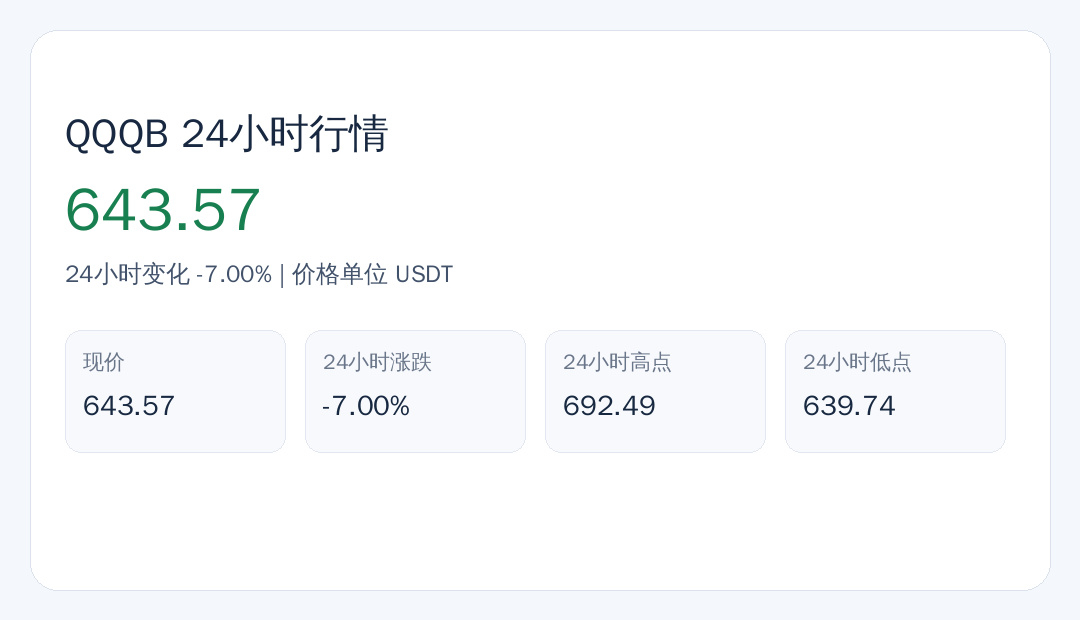
Does a sudden increase in trading activity always confirm a price direction? Currently, $QQQB is trading below its primary support level. While the hourly price change is -0.0502123, the most notable clue is that volume has risen above the baseline. Normally, high volume during a move lower suggests strong conviction from sellers. This could imply that the market is actively seeking a lower valuation rather than simply drifting.
However, there is an alternative reading. Sometimes a volume spike below support represents a preliminary floor where buyers start to absorb the sell-off. If this is a exhaustion move, the increased activity might signal that the downward momentum is nearing a temporary end. We observe that the daily price change stands at -0.302032, while the relative volume is 3.94226.
What would weaken these interpretations? The bearish view loses its strength if the price quickly recovers to the 658.265 level on lower volume, suggesting the break below support was a false start. Conversely, the idea of a local floor weakens if the price continues to slide while the RSI remains at 35.7847 without showing any divergence. A key way to reassess this situation is to watch if $QQQB can hold the 656.99 level during the next daily candle. Monitoring the relationship between the 657.277 and the current price will help distinguish a sustained trend from a brief volatility spike 📉.
Probabilistic market research, not a recommendation or guaranteed return.
Which observation would make you change your reading?
#QQQB #MarketAnalysis
Questioning the Volume Expansion in $QQQB
Does a sudden increase in trading activity always confirm a price direction? Currently, $QQQB is trading below its primary support level. While the hourly price change is -0.0502123, the most notable clue is that volume has risen above the baseline. Normally, high volume during a move lower suggests strong conviction from sellers. This could imply that the market is actively seeking a lower valuation rather than simply drifting.
However, there is an alternative reading. Sometimes a volume spike below support represents a preliminary floor where buyers start to absorb the sell-off. If this is a exhaustion move, the increased activity might signal that the downward momentum is nearing a temporary end. We observe that the daily price change stands at -0.302032, while the relative volume is 3.94226.
What would weaken these interpretations? The bearish view loses its strength if the price quickly recovers to the 658.265 level on lower volume, suggesting the break below support was a false start. Conversely, the idea of a local floor weakens if the price continues to slide while the RSI remains at 35.7847 without showing any divergence. A key way to reassess this situation is to watch if $QQQB can hold the 656.99 level during the next daily candle. Monitoring the relationship between the 657.277 and the current price will help distinguish a sustained trend from a brief volatility spike 📉.
Probabilistic market research, not a recommendation or guaranteed return.
Which observation would make you change your reading?
#QQQB #MarketAnalysis
Does a sudden increase in trading activity always confirm a price direction? Currently, $QQQB is trading below its primary support level. While the hourly price change is -0.0502123, the most notable clue is that volume has risen above the baseline. Normally, high volume during a move lower suggests strong conviction from sellers. This could imply that the market is actively seeking a lower valuation rather than simply drifting.
However, there is an alternative reading. Sometimes a volume spike below support represents a preliminary floor where buyers start to absorb the sell-off. If this is a exhaustion move, the increased activity might signal that the downward momentum is nearing a temporary end. We observe that the daily price change stands at -0.302032, while the relative volume is 3.94226.
What would weaken these interpretations? The bearish view loses its strength if the price quickly recovers to the 658.265 level on lower volume, suggesting the break below support was a false start. Conversely, the idea of a local floor weakens if the price continues to slide while the RSI remains at 35.7847 without showing any divergence. A key way to reassess this situation is to watch if $QQQB can hold the 656.99 level during the next daily candle. Monitoring the relationship between the 657.277 and the current price will help distinguish a sustained trend from a brief volatility spike 📉.
Probabilistic market research, not a recommendation or guaranteed return.
Which observation would make you change your reading?
#QQQB #MarketAnalysis
48


·
--
$QQQB – The Next Wave of Crypto Innovation 🚀
$QQQB is building excitement in the crypto space with a vision focused on innovation, community, and future growth. In a rapidly evolving blockchain world, projects like $QQQB represent the growing opportunities within the decentralized economy.
With a strong community-driven spirit and ambitious potential, QQQB is a project worth keeping an eye on. The journey is just beginning, and the future could bring exciting possibilities.
QQQB is more than a coin — it's a vision for what's next! 🔥
#QQQB #USMidterms-WhatAreMarketsExpecting? #USClearsSingleStockPerpetualFutures
{spot}(QQQBUSDT)
$QQQB – The Next Wave of Crypto Innovation 🚀
$QQQB is building excitement in the crypto space with a vision focused on innovation, community, and future growth. In a rapidly evolving blockchain world, projects like $QQQB represent the growing opportunities within the decentralized economy.
With a strong community-driven spirit and ambitious potential, QQQB is a project worth keeping an eye on. The journey is just beginning, and the future could bring exciting possibilities.
QQQB is more than a coin — it's a vision for what's next! 🔥
#QQQB #USMidterms-WhatAreMarketsExpecting? #USClearsSingleStockPerpetualFutures
$QQQB is building excitement in the crypto space with a vision focused on innovation, community, and future growth. In a rapidly evolving blockchain world, projects like $QQQB represent the growing opportunities within the decentralized economy.
With a strong community-driven spirit and ambitious potential, QQQB is a project worth keeping an eye on. The journey is just beginning, and the future could bring exciting possibilities.
QQQB is more than a coin — it's a vision for what's next! 🔥
#QQQB #USMidterms-WhatAreMarketsExpecting? #USClearsSingleStockPerpetualFutures
1
275
ATH/ATL Watch 🎯
Getting close to all-time highs:
$BFUSD - 0.1% away
$QQQB - 10.7% away
Near all-time lows:
$BFUSD - 0.5% away
ATH breakouts often signal strong momentum. ATL bounces can be interesting reversal plays. Always DYOR.
Drop your favorite coin below
#QQQB #BFUSD #CryptoNews #News #CryptoCommunity
📱 Follow @PoorCryptoMan
ATH/ATL Watch 🎯
Getting close to all-time highs:
$BFUSD - 0.1% away
$QQQB - 10.7% away
Near all-time lows:
$BFUSD - 0.5% away
ATH breakouts often signal strong momentum. ATL bounces can be interesting reversal plays. Always DYOR.
Drop your favorite coin below
#QQQB #BFUSD #CryptoNews #News #CryptoCommunity
📱 Follow @PoorCryptoMan
Getting close to all-time highs:
$BFUSD - 0.1% away
$QQQB - 10.7% away
Near all-time lows:
$BFUSD - 0.5% away
ATH breakouts often signal strong momentum. ATL bounces can be interesting reversal plays. Always DYOR.
Drop your favorite coin below
#QQQB #BFUSD #CryptoNews #News #CryptoCommunity
📱 Follow @PoorCryptoMan
11

·
--
Look here, look here!
$QQQB has broken below support 🧊 The 30-day low has been decisively breached!
Current price: 674.47. The previous low of 680 couldn't hold…
Use less leverage—it’s easier to stay calm amid volatility. How are you handling this?
#QQQB
Look here, look here!
$QQQB has broken below support 🧊 The 30-day low has been decisively breached!
Current price: 674.47. The previous low of 680 couldn't hold…
Use less leverage—it’s easier to stay calm amid volatility. How are you handling this?
#QQQB
$QQQB has broken below support 🧊 The 30-day low has been decisively breached!
Current price: 674.47. The previous low of 680 couldn't hold…
Use less leverage—it’s easier to stay calm amid volatility. How are you handling this?
#QQQB
63

·
--
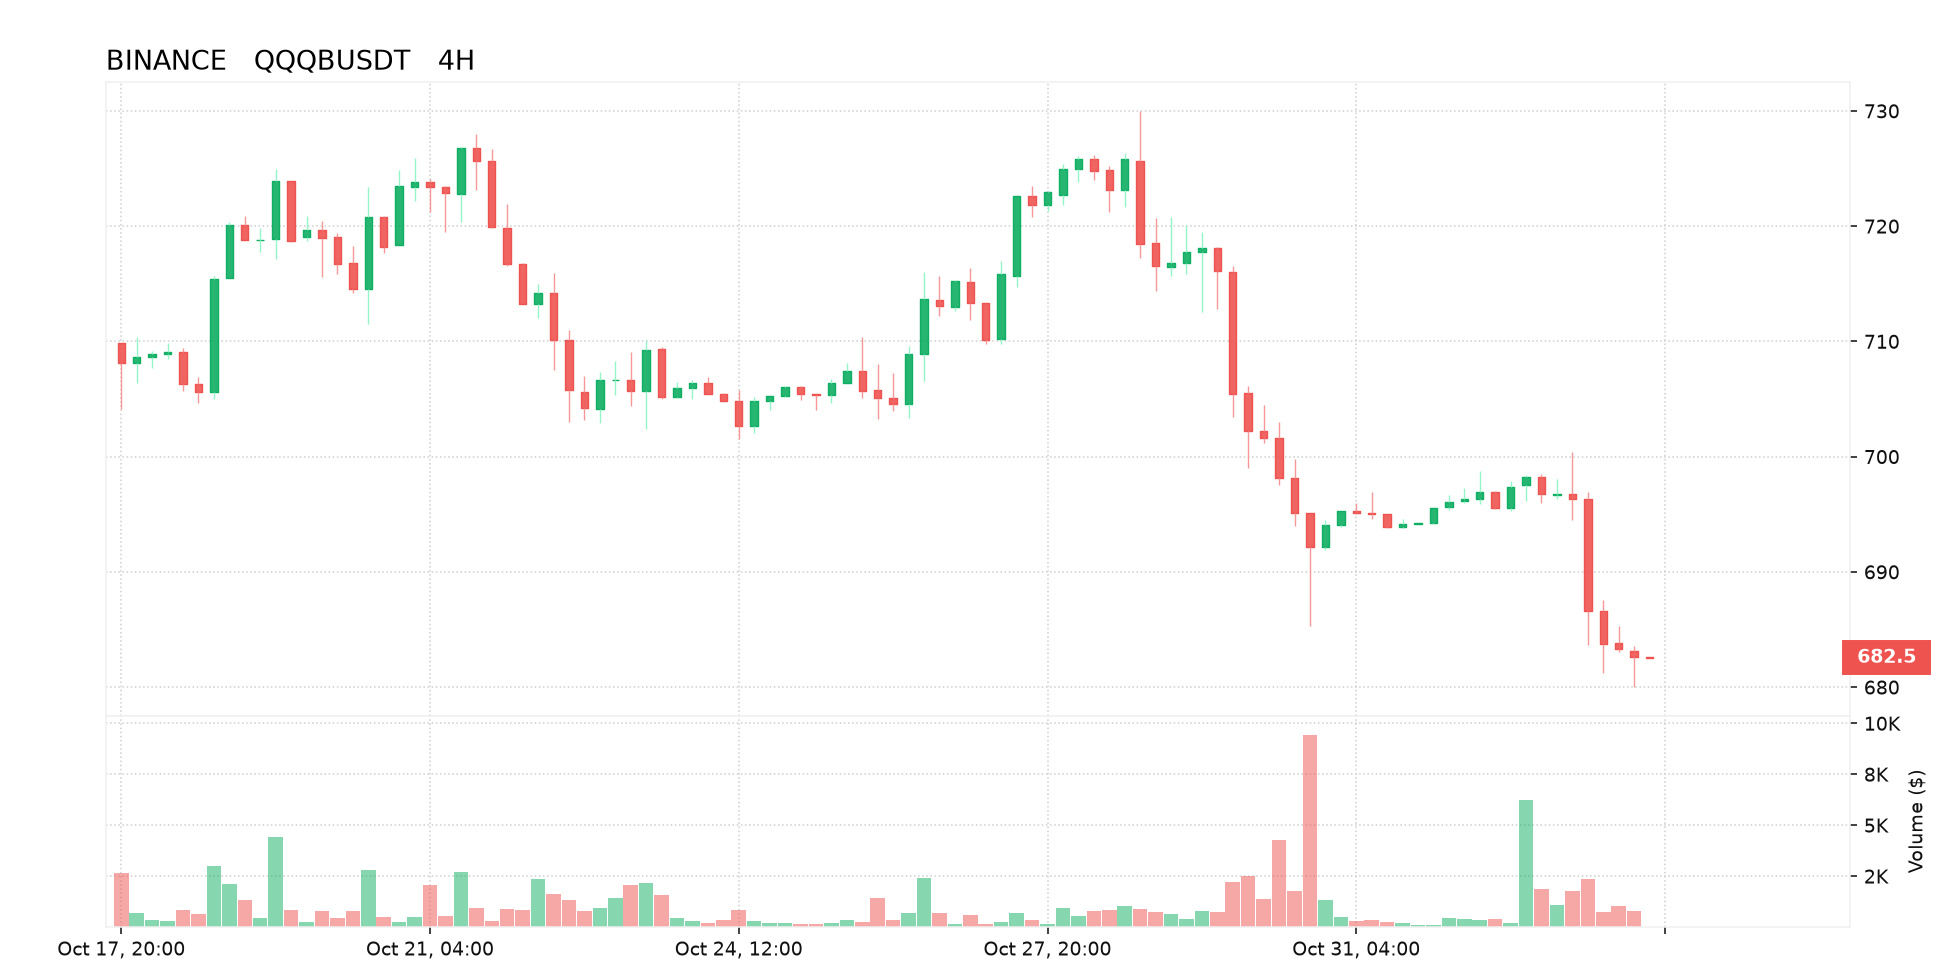
No QQQB-specific news—it’s a tokenized QQQ mirror. The move tracks a Nasdaq-100 tech rally on strong earnings/AI optimism; thin liquidity magnifies it.
$QQQB #QQQB
Not a financial advice. Be responsible for your own financial decision.
No QQQB-specific news—it’s a tokenized QQQ mirror. The move tracks a Nasdaq-100 tech rally on strong earnings/AI optimism; thin liquidity magnifies it.
$QQQB #QQQB
Not a financial advice. Be responsible for your own financial decision.
$QQQB #QQQB
Not a financial advice. Be responsible for your own financial decision.
145
Log in to explore more content
Join global crypto users on Binance Square
⚡️ Get latest and useful information about crypto.
💬 Trusted by the world’s largest crypto exchange.
👍 Discover real insights from verified creators.
Email / Phone number
Trending Topics
1
#MoreHikesExpectedIsBTCUnderPressure
11,947 views
157 Discussing
2
#NvidiaBeatsEstimatesWith$130BQ4Outlook
78,660 views
316 Discussing
3
#AnthropicIPOPriceCouldExceed$80
76,078 views
259 Discussing
4
#RussiaCentralBankAddsAlfaBankToCryptoExchangeRegister
5,702 views
70 Discussing
5
#VisaPlansStablecoinPrefundingForAPACCrossBorderPayments
5,889 views
57 Discussing
6
#CanadaAndUSLaunchOperationNiagaraAgainstApprovalPhishing
49,458 views
66 Discussing
7
#BankOfEnglandUnveilsClearingHousePathwayCoveringDLTFirms
4,926 views
69 Discussing
8
#DBSAndCirclePartnerToExpandAsianInstitutionsUSDCAccess
6,356 views
68 Discussing
9
#LedgerHardwareImplantReportsExtendToDubai
113,591 views
960 Discussing
10
#NvidiaBoardNotConsideringHuang’sReturnasCEO
290,714 views
1,733 Discussing