

#mub
mub
62,007 views
1,332 Discussing
Hot
Latest

·
--
Memory Lane Rally: $MUB Holds Ground 🛡️
Price action: $MUB trades at $896.94 on Binance Spot (MUB/USDT), up 1.12% in the past 24 hours, sentiment stays neutral.
Why it matters: Micron’s DRAM and NAND products stay in demand as AI workloads and data‑center expansion keep memory utilization high.
Key levels: Immediate support sits around $880, a mid‑range pivot near $895, while the nearest resistance caps the move at $910. A break below $880 could invite a deeper correction, whereas holding the floor may allow a test of the $910 barrier.
Outlook: From a support‑defense perspective, buyers need to defend the $880 floor; failure would likely open a broader downside, while a firm hold could set the stage for a modest upside toward resistance.
#MUB #Stocks #BinanceSquare

·
--
Volume divergence meets a tight range: $MUB trades at $896.01 with a modest +2.50% 24h gain and $10.41M in volume.
The latest hourly close sits at 896.38, while the broader 23-hour session spans from a low of 862.77 to a high of 907.25.
A bullish confirmation scenario requires a strong volume-backed push past the 907.25 high. Conversely, losing the 862.77 low signals downside risk and invalidates immediate breakout continuation.
Will you wait for a confirmed hourly close above 907.25 before acting, or does a drop below 862.77 invalidate the setup for you?
Tap $MUB for the live chart. #MUB #BinanceSquare
3

·
--
$MUB holds near $899.95 on $13.20M volume, but hourly activity has cooled.
The asset recently peaked near 907.25 while finding a session floor down at 862.77.
A sustained push back above the 907.25 upper boundary signals continuation potential. Conversely, failure to hold the 862.77 floor invalidates the immediate bullish structure and increases downside exposure.
Will buyers reclaim the upper range high before support gives way?
Tap $MUB for the live chart. #MUB #BinanceSquare
1

·
--
$MUB
🔻 $MUB SHORT SETUP 🔴 Sellers are stepping in — here's the setup. ⚡
$MUB is showing significant bearish momentum with a sharp 6.87% decline over the last 24 hours. The price is currently hovering near its daily lows, suggesting strong selling pressure as $MUB struggles to find support above the $860 level.
📊 24h: -6.87% | Vol: $18,300,364.52
📉 TRADE PLAN
🔹 Entry: 866.50
🛑 Stop Loss: 885.00
🎯 TP1: 838.75
🎯 TP2: 820.00
🎯 TP3: 800.00
⚖️ Risk:Reward (TP1): 1:1.50
🔔 Trigger: A confirmed breakdown and hourly candle close below the $862.77 support level would validate this bearish outlook.
⚠️ Risk Note: High volatility is present; ensure your position size is managed according to your risk tolerance.
Always wait for clear price action confirmation before committing to a position in this volatile market.
Click below 👇🏻 to trade
$MUB
Follow @T4_TZX for more updates...
#MUB #CryptoTrading #MarketAnalysis #BinanceSquare
$MUB
🔻 $MUB SHORT SETUP 🔴 Sellers are stepping in — here's the setup. ⚡
$MUB is showing significant bearish momentum with a sharp 6.87% decline over the last 24 hours. The price is currently hovering near its daily lows, suggesting strong selling pressure as $MUB struggles to find support above the $860 level.
📊 24h: -6.87% | Vol: $18,300,364.52
📉 TRADE PLAN
🔹 Entry: 866.50
🛑 Stop Loss: 885.00
🎯 TP1: 838.75
🎯 TP2: 820.00
🎯 TP3: 800.00
⚖️ Risk:Reward (TP1): 1:1.50
🔔 Trigger: A confirmed breakdown and hourly candle close below the $862.77 support level would validate this bearish outlook.
⚠️ Risk Note: High volatility is present; ensure your position size is managed according to your risk tolerance.
Always wait for clear price action confirmation before committing to a position in this volatile market.
Click below 👇🏻 to trade
$MUB
Follow @T4_TZX for more updates...
#MUB #CryptoTrading #MarketAnalysis #BinanceSquare


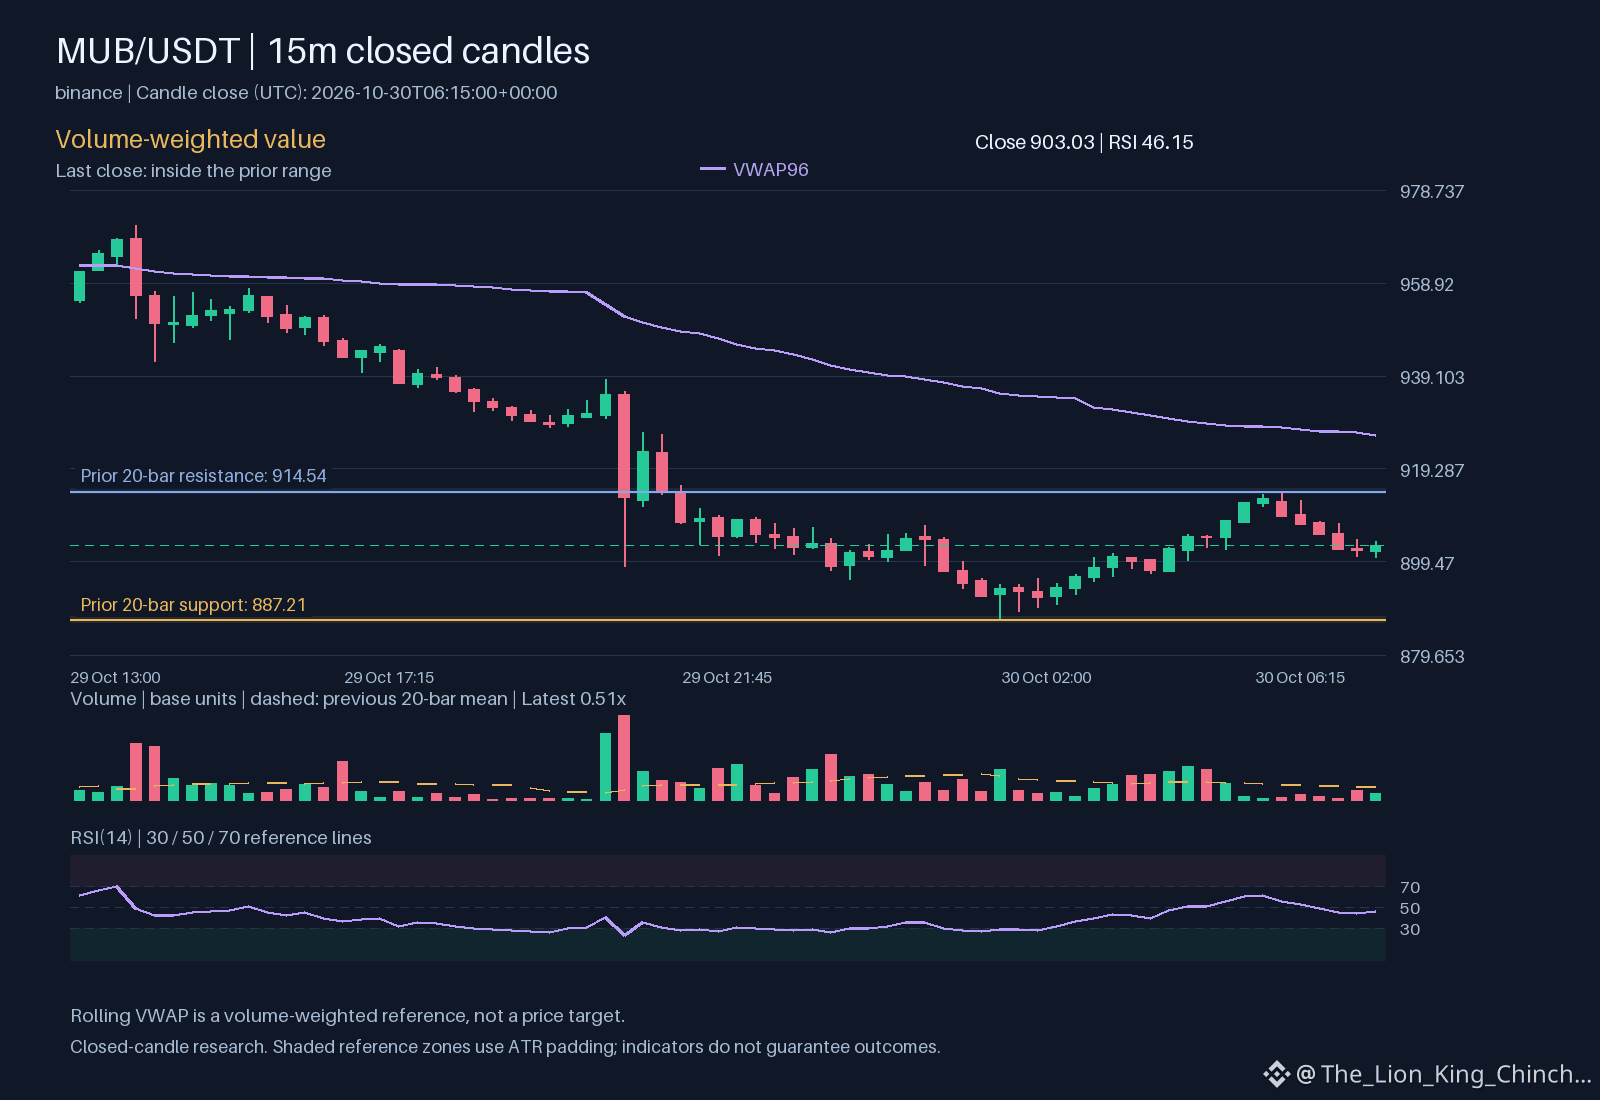
$MUB: Why the Close Matters More Than the Headline
The hourly candle closed lower while quoted volume stayed below its recent baseline. The opening question is whether a down move on thin volume signals conviction or simply a lack of buyers willing to defend higher prices.
The clue sits in the volume reading. When price declines and volume does not rise above baseline it often means sellers are not aggressive either they are just meeting weak bid liquidity. This can look like a controlled drift rather than a panic exit. The limit of this clue is that low volume also hides the true depth of the order book a sudden bid withdrawal could accelerate the move without a volume spike.
An alternative reading treats the same candle as a healthy pause inside a broader range. Price has been inside the recorded range and the hourly direction down may only reflect mean reversion toward the session VWAP. In this view the close is noise and the next test of support will reveal real intent.
What would weaken the drift interpretation A close back above the hourly VWAP with volume climbing above baseline would suggest buyers are returning. What would weaken the pause view A break of the recorded range low on expanding volume would confirm sellers have taken control. The single observation that would flip the reading is the next hourly close relative to VWAP and whether volume confirms the direction.
Probabilistic market research, not a recommendation or guaranteed return.
Which observation would make you change your reading?
#MUB #MarketAnalysis
$MUB : Why the Close Matters More Than the Headline
The hourly candle closed lower while quoted volume stayed below its recent baseline. The opening question is whether a down move on thin volume signals conviction or simply a lack of buyers willing to defend higher prices.
The clue sits in the volume reading. When price declines and volume does not rise above baseline it often means sellers are not aggressive either they are just meeting weak bid liquidity. This can look like a controlled drift rather than a panic exit. The limit of this clue is that low volume also hides the true depth of the order book a sudden bid withdrawal could accelerate the move without a volume spike.
An alternative reading treats the same candle as a healthy pause inside a broader range. Price has been inside the recorded range and the hourly direction down may only reflect mean reversion toward the session VWAP. In this view the close is noise and the next test of support will reveal real intent.
What would weaken the drift interpretation A close back above the hourly VWAP with volume climbing above baseline would suggest buyers are returning. What would weaken the pause view A break of the recorded range low on expanding volume would confirm sellers have taken control. The single observation that would flip the reading is the next hourly close relative to VWAP and whether volume confirms the direction.
Probabilistic market research, not a recommendation or guaranteed return.
Which observation would make you change your reading?
#MUB #MarketAnalysis
36
·
--
Memory Momentum: $MUB Slides on Binance Spot 📉
Price action – $MUB trades at $912.39, down 3.90% over the past 24 h on Binance Spot (MUB/USDT). The move follows a broader pullback in semiconductor equities amid mixed earnings outlooks.
Why it matters – Micron’s DRAM and NAND pricing cycles are key barometers for data‑center spending and consumer electronics demand, keeping the stock in focus despite the quiet news flow.
Key levels – Immediate support sits near $885.00, a pivot that held last week. Resistance is anchored at $935.00, the top of the recent range. Mid‑range around $910.00 acts as a balance point where price has repeatedly bounced.
Short outlook – With neutral crypto sentiment and no catalyst, the bStock is likely to consolidate between $885‑$935. Traders should watch for a decisive break above $935 for bullish bias or a slip below $885 for downside pressure before committing.
#MUB #Stocks #BinanceSquare
26

·
--
🔻 $MUB SHORT SETUP 🔴
$MUB is losing ground fast.
Trade Plan
Entry: 933.73
Stop Loss: 947.74
TP1: 915.06
TP2: 905.72
TP3: 896.38
⚖️ Risk:Reward (TP1) 1:1.33
Trigger: Confirmation of sustained bearish momentum at current levels.
Risk Note: All trading involves substantial risk of loss and is not suitable for all investors. Only risk capital you can afford to lose.
Manage your risk and size positions wisely.
#MUB #mub
·
--
$MUB
🔻 $MUB SHORT SETUP 🔴 Sellers are stepping in — here's the setup. ⚡
$MUB is showing significant downward pressure, currently trading near its 24-hour low of $933.69 with a 24-hour decline of -3.86%. This persistent selling volume suggests bearish momentum is likely to continue as $MUB tests key support levels.
📊 24h: -3.86% | Vol: $16,560,917.07
📉 TRADE PLAN
🔹 Entry: $933.77
🛑 Stop Loss: $949.77
🎯 TP1: $909.77
🎯 TP2: $897.77
🎯 TP3: $885.77
⚖️ Risk:Reward (TP1): 1:1.50
🔔 Trigger: A confirmed hourly close below $933.69 would indicate further downside potential for $MUB.
⚠️ Risk Note: Cryptocurrency markets are highly volatile; ensure you utilize proper stop-loss placement to manage potential downside.
Always wait for a clear breakdown on the lower timeframes before committing to a position.
Click below 👇🏻 to trade
$MUB
Follow @T4_TZX for more updates...
#MUB #CryptoTrading #MarketAnalysis #BinanceSquare
$MUB
🔻 $MUB SHORT SETUP 🔴 Sellers are stepping in — here's the setup. ⚡
$MUB is showing significant downward pressure, currently trading near its 24-hour low of $933.69 with a 24-hour decline of -3.86%. This persistent selling volume suggests bearish momentum is likely to continue as $MUB tests key support levels.
📊 24h: -3.86% | Vol: $16,560,917.07
📉 TRADE PLAN
🔹 Entry: $933.77
🛑 Stop Loss: $949.77
🎯 TP1: $909.77
🎯 TP2: $897.77
🎯 TP3: $885.77
⚖️ Risk:Reward (TP1): 1:1.50
🔔 Trigger: A confirmed hourly close below $933.69 would indicate further downside potential for $MUB .
⚠️ Risk Note: Cryptocurrency markets are highly volatile; ensure you utilize proper stop-loss placement to manage potential downside.
Always wait for a clear breakdown on the lower timeframes before committing to a position.
Click below 👇🏻 to trade
$MUB
Follow @T4_TZX for more updates...
#MUB #CryptoTrading #MarketAnalysis #BinanceSquare

·
--
$MUB
🔻 $MUB SHORT SETUP 🔴 Sellers are stepping in — here's the setup. ⚡
$MUB is showing significant weakness as it hovers near its 24-hour low, indicating that sellers are currently maintaining control of the price action. The downward momentum suggests further potential for a slide if the immediate support fails to attract buyers.
📊 24h: -3.20% | Vol: $16,630,865.62
📉 TRADE PLAN
🔹 Entry: 937.83
🛑 Stop Loss: 948.00
🎯 TP1: 922.50
🎯 TP2: 910.00
🎯 TP3: 895.00
⚖️ Risk:Reward (TP1): 1:1.51
🔔 Trigger: A confirmed break and sustained trading below the current 24h low of 936.73.
⚠️ Risk Note: Low-cap assets can experience sudden volatility; always manage your position size strictly.
Keep a close eye on the tape and wait for clear bearish confirmation before entering.
Click below 👇🏻 to trade
$MUB
Follow @TZX_Crypto for more updates...
#MUB #CryptoTrading #MarketAnalysis #BinanceSquare
$MUB
🔻 $MUB SHORT SETUP 🔴 Sellers are stepping in — here's the setup. ⚡
$MUB is showing significant weakness as it hovers near its 24-hour low, indicating that sellers are currently maintaining control of the price action. The downward momentum suggests further potential for a slide if the immediate support fails to attract buyers.
📊 24h: -3.20% | Vol: $16,630,865.62
📉 TRADE PLAN
🔹 Entry: 937.83
🛑 Stop Loss: 948.00
🎯 TP1: 922.50
🎯 TP2: 910.00
🎯 TP3: 895.00
⚖️ Risk:Reward (TP1): 1:1.51
🔔 Trigger: A confirmed break and sustained trading below the current 24h low of 936.73.
⚠️ Risk Note: Low-cap assets can experience sudden volatility; always manage your position size strictly.
Keep a close eye on the tape and wait for clear bearish confirmation before entering.
Click below 👇🏻 to trade
$MUB
Follow @TZX_Crypto for more updates...
#MUB #CryptoTrading #MarketAnalysis #BinanceSquare
1

·
--
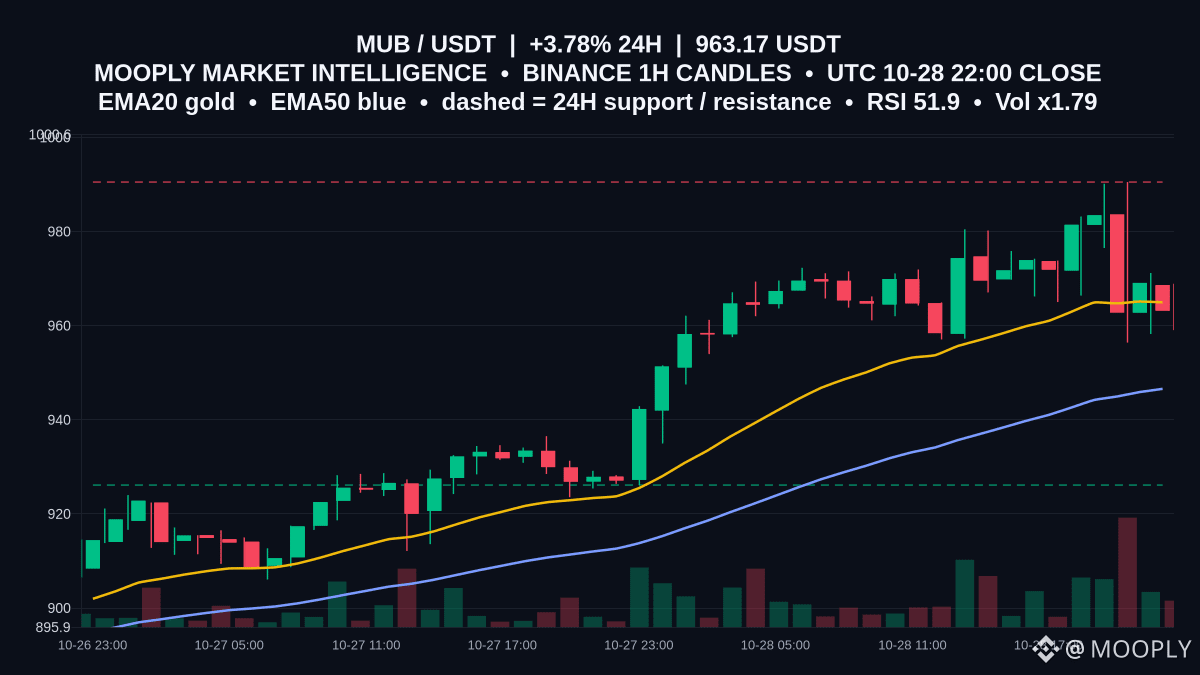
$MUB — The chart looks like a corridor more than a trend: price 963.17 sits just below EMA20 964.94 and above EMA50 946.57, inside the 24h dashed bands (support 926.12 / resistance 990.5). ATR14 = 12.63 shows modest hourly volatility, while volRatio 1.79 signals above-average activity. MACD (7.83) below its signal (10.14) hints momentum softness.
tradePlan = RANGE (confidence: wait; method: ATR14 and completed Binance 1h candles). Wait for a clear 1h close beyond 990.5 to consider a breakout confirmation, or a decisive close below 926.12 to invalidate the range—which 1h close will you watch first?
Not financial advice.
#MUB #ChartStructure #RangeWatch
25
·
--
$MUB volume spikes 1.86x as price climbs to $979.21.
Volume is surging 86% above its daily average while MUB gains 5.00% to trade near $979.21, following a 23-hour high breakout above 980.47. This points to heavy participation, though sharp participation increases the risk of a swift reversal if momentum fades.
If buyers sustain acceptance above the 980.47 high, continuation toward new local highs remains possible. Conversely, a drop back below the 923.54 session low would invalidate this bullish setup.
Will momentum push past the 980.47 high, or will fading volume trigger a slide back toward 923.54?
Tap $MUB for the live chart. #MUB #BinanceSquare
2
·
--
Volume spikes double the norm as $MUB tests session highs. 📊
At $970.83, MUB shows a 4.38% daily gain alongside heavy volume scaling at 2.08x the prior average. This activity highlights rising participation, though extreme turnover near the top of its $923.54 to $980.47 range also points to elevated execution risk.
Watch for a sustained hourly close above $980.47 to confirm continuing buyer intent, whereas a drop back under $969.59 would signal fading momentum.
Will a clean break past the 980.47 high confirm the breakout, or does rejection there invalidate the move?
Tap $MUB for the live chart. #MUB #BinanceSquare
2
$MUB: Does a Loud Candle Tell the Whole Story?: Without Rushing the Conclusion
Common Question
Many traders believe a large volume spike confirms a breakout. They see the hourly direction move up and assume the move is finished. The assumption is simple: more participation equals certainty. This belief often leads to chasing entries without checking context.
The Mechanism
Volume measures participation, not direction. A spike shows that many orders cleared within the period. It does not prove that buyers controlled the remainder of the session. When volume sits above the baseline while price trades inside the recorded range, it may reflect profit-taking or range trading rather than a new trend. The relative volume metric helps identify unusual activity, but it cannot distinguish between aggressive buying and liquidations. Observing the price near support helps frame the scenario. If the price holds above support while volume increases, bullish participation is plausible. If price fails to convert upward, the high volume may have absorbed sellers. This distinction matters because volume explains effort, not outcome. Traders must look for price acceptance above prior resistance to confirm a breakout. Until then, the move remains a test, not a validated shift.
Where It Stops Applying
This logic changes if price reclaims key levels with sustained momentum. The current setup relies on price staying within bounds. If the asset breaks out, the previous interpretation becomes invalid. Risk remains because volatility can expand quickly. Always reassess based on live price action rather than initial volume data.
Probabilistic market research, not a recommendation or guaranteed return.
Which trading assumption would you like to question next?
#MUB #CryptoLearning
$MUB : Does a Loud Candle Tell the Whole Story?: Without Rushing the Conclusion
Common Question
Many traders believe a large volume spike confirms a breakout. They see the hourly direction move up and assume the move is finished. The assumption is simple: more participation equals certainty. This belief often leads to chasing entries without checking context.
The Mechanism
Volume measures participation, not direction. A spike shows that many orders cleared within the period. It does not prove that buyers controlled the remainder of the session. When volume sits above the baseline while price trades inside the recorded range, it may reflect profit-taking or range trading rather than a new trend. The relative volume metric helps identify unusual activity, but it cannot distinguish between aggressive buying and liquidations. Observing the price near support helps frame the scenario. If the price holds above support while volume increases, bullish participation is plausible. If price fails to convert upward, the high volume may have absorbed sellers. This distinction matters because volume explains effort, not outcome. Traders must look for price acceptance above prior resistance to confirm a breakout. Until then, the move remains a test, not a validated shift.
Where It Stops Applying
This logic changes if price reclaims key levels with sustained momentum. The current setup relies on price staying within bounds. If the asset breaks out, the previous interpretation becomes invalid. Risk remains because volatility can expand quickly. Always reassess based on live price action rather than initial volume data.
Probabilistic market research, not a recommendation or guaranteed return.
Which trading assumption would you like to question next?
#MUB #CryptoLearning
57

·
--
$MUB +6.36% | $PARTI +6.28% | $HFT +6.28%
#MUB nudged to $978.22, up +6.36% on $13.2 M volume. The jump suggests fresh buying interest, though the move is still modest relative to its larger market cap.
#PARTI rose to $0.0389, gaining +6.28% with $1.1 M traded. Momentum is notable for a lower‑priced token, but the thin volume could limit durability.
#HFT climbed to $0.00711000, also up +6.28% on $2.3 M volume. The parallel rise with PARTI hints at a broader micro‑cap rally.
👀 Watch if these simultaneous gains hold as larger‑cap assets settle, which may reveal whether the micro‑cap surge is a short‑term flare or a deeper shift.
#Write2Earn #Binance
5

·
--
$MUB +5.24% | $XPL +5.19% | $EWYB +4.97%
#MUB pushed up to $973.89, gaining +5.24% on $12.7 M of volume. The move feels supported by solid turnover.
#XPL rose to $0.0768, climbing +5.19% with $4.8 M changing hands. Its focus on stablecoin infrastructure adds a layer‑1 narrative to the rally.
#EWYB ticked higher to $164.00, up +4.97% on $3.0 M of volume. The modest flow suggests a quieter but steady interest.
👀 The spread in trading volume—from double‑digit millions for MUB down to low‑single‑digit for EWYB—may hint at which price gains could persist.
#Write2Earn #Binance
4

·
--
$MUB
{spot}(MUBUSDT)
$MUB - The Real RWA Gem on Binance! 🚀
What is MUB?
MUB = Micron Technology (bStocks) Tokenized Stock on BSC
It's not a meme, it's tokenized REAL stock of Micron - US chip giant!
Why I'm Bullish:
✅ Live on Binance & trading around $970
✅ RWA narrative is HOT
✅ Backed by real Micron equity (NASDAQ: MU)
✅ Low supply - Only ~72K MUB circulating
This is how Wall Street comes to Web3.
Not financial advice. DYOR!
#MUB #BİNANCESQUARE #bStocks #RWA #Micron
$MUB
$MUB - The Real RWA Gem on Binance! 🚀
What is MUB?
MUB = Micron Technology (bStocks) Tokenized Stock on BSC
It's not a meme, it's tokenized REAL stock of Micron - US chip giant!
Why I'm Bullish:
✅ Live on Binance & trading around $970
✅ RWA narrative is HOT
✅ Backed by real Micron equity (NASDAQ: MU)
✅ Low supply - Only ~72K MUB circulating
This is how Wall Street comes to Web3.
Not financial advice. DYOR!
#MUB #BİNANCESQUARE #bStocks #RWA #Micron

86

·
--
Article
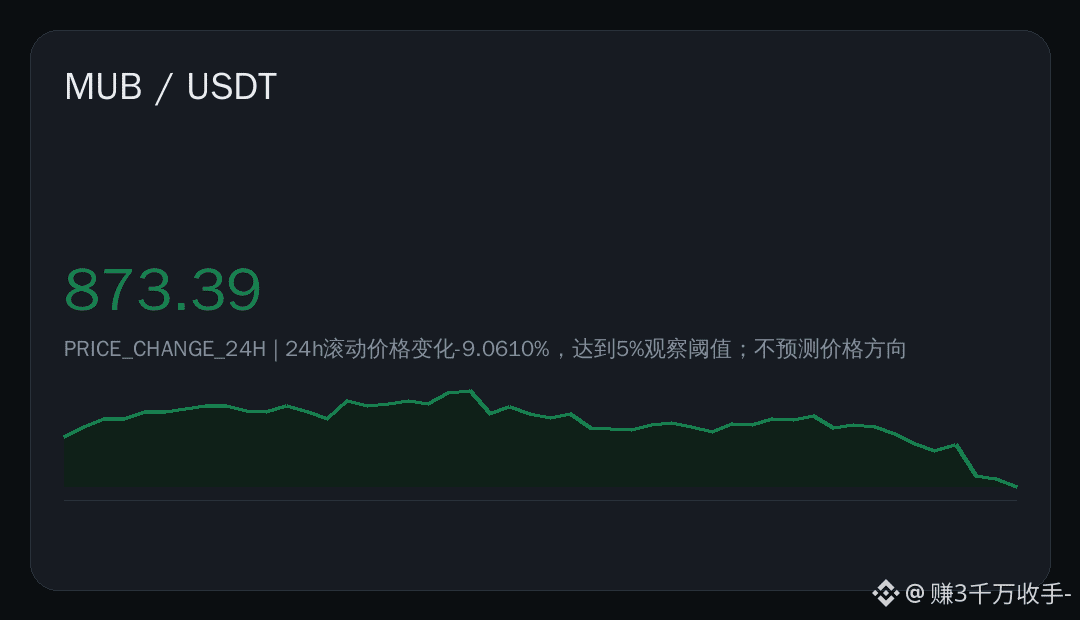
MUB | Data Checklist | 2026-10-30Let the data lead: $MUB PRICE_CHANGE_24H = 873.39. The 24-hour rolling price change is -9.0610%, reaching the 5% observation threshold; this does not predict price direction
📊 Data Snapshot
· Metric: PRICE_CHANGE_24H
· Reading: 873.39
· Methodology: Based on a sequence of closed candlesticks
Volume matters more than price
Join the discussion in the comments 👇
## How to Read This Data
This observation is calculated from a sequence of closed candlesticks provided by the source API. The metric is a mathematical transformation of historical prices; it describes only the time of observation, does not predict price direction, and is not a buy or sell instruction.
#市场观察 #MUB #Binance
MUB | Data Checklist | 2026-10-30
Let the data lead: $MUB PRICE_CHANGE_24H = 873.39. The 24-hour rolling price change is -9.0610%, reaching the 5% observation threshold; this does not predict price direction
📊 Data Snapshot
· Metric: PRICE_CHANGE_24H
· Reading: 873.39
· Methodology: Based on a sequence of closed candlesticks
Volume matters more than price
Join the discussion in the comments 👇
## How to Read This Data
This observation is calculated from a sequence of closed candlesticks provided by the source API. The metric is a mathematical transformation of historical prices; it describes only the time of observation, does not predict price direction, and is not a buy or sell instruction.
#市场观察 #MUB #Binance
1

·
--
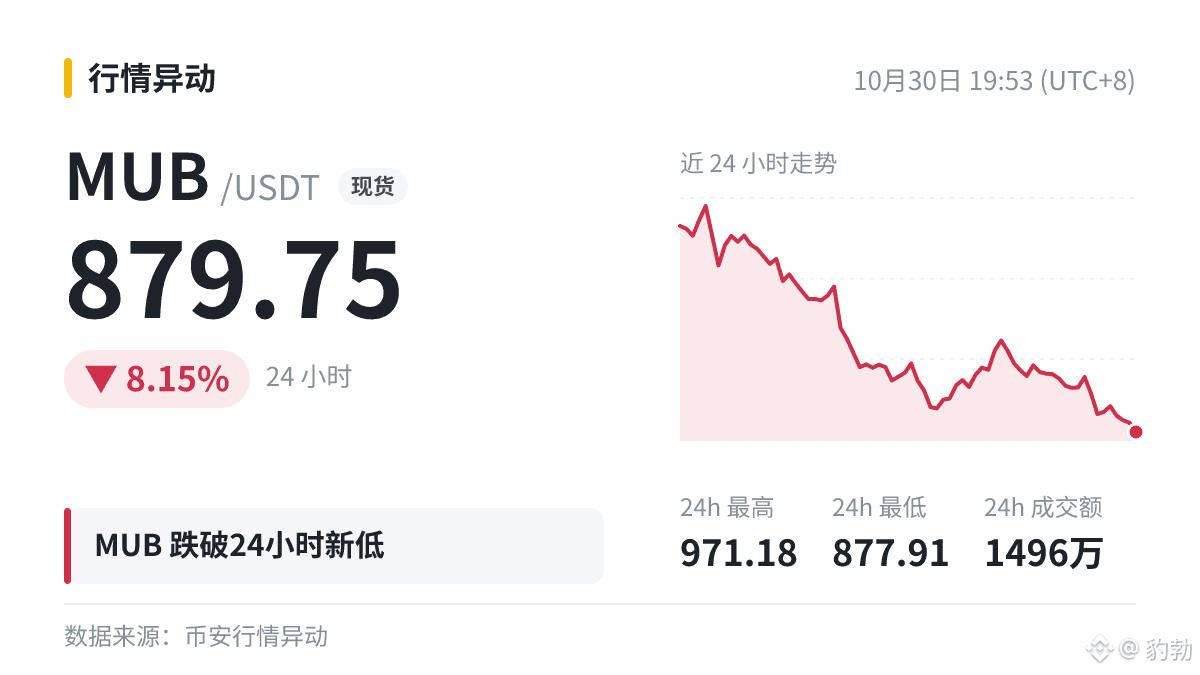
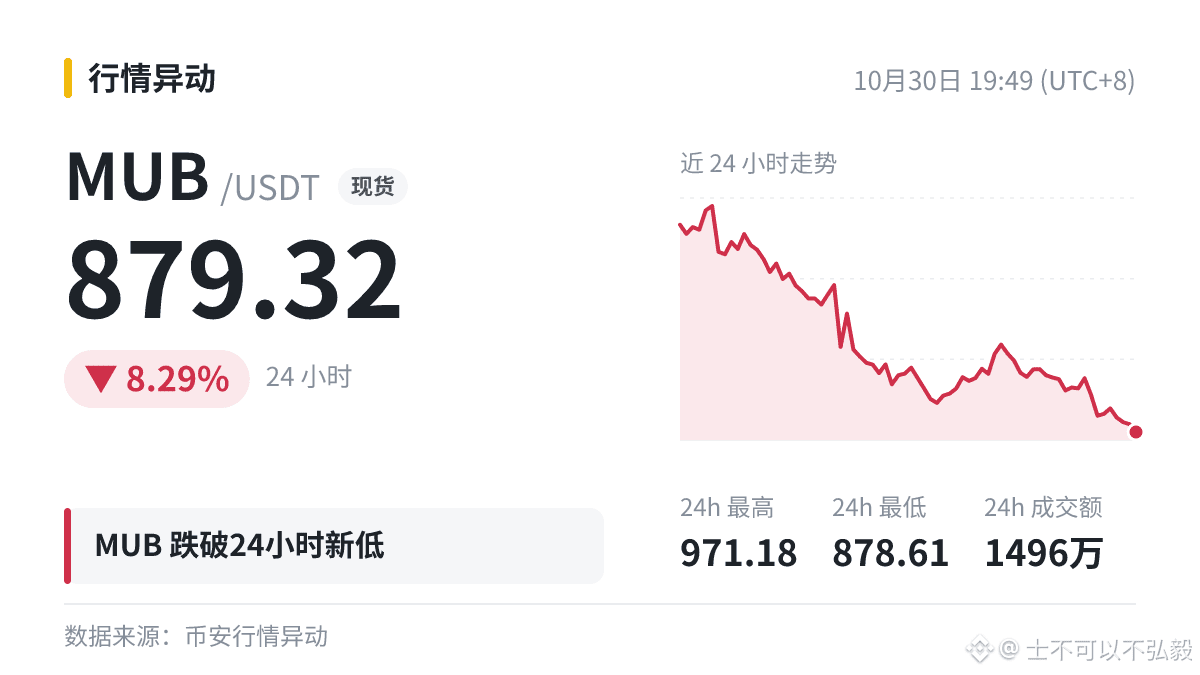
$MUB broke below the 24-hour low: current price 879.75, previous low 884.5.
After the breakdown, watch for two things:
· Will the previous low of 884.5 turn from support into resistance (price fails to break through on a rebound)?
· Did trading volume increase during the breakdown? A break on low volume may be a false signal.
What do you think will happen next?
#MUB
Make your own trading decisions—don’t follow blindly.
1

·
--
🥶 $MUB set a new 24-hour low of 879.32, breaking below the previous low of 884.5.
Panic selling is starting to pour in. After emotions have run their course, prices usually take a few days to recover. How high do you think the rebound will go?
#MUB
Just a note, not trading advice.
🥶 $MUB set a new 24-hour low of 879.32, breaking below the previous low of 884.5.
Panic selling is starting to pour in. After emotions have run their course, prices usually take a few days to recover. How high do you think the rebound will go?
#MUB
Just a note, not trading advice.
Panic selling is starting to pour in. After emotions have run their course, prices usually take a few days to recover. How high do you think the rebound will go?
#MUB
Just a note, not trading advice.
1
·
--
Micron Momentum: $MUB Coils for a Breakout 🚀
Price action – Micron Technology’s bStock $MUB opened the European session at $965.29, up 5.87 % over the past 24 hours on Binance Spot (MUB/USDT). The candle stayed bullish, testing the upper band of its recent range.
Key levels – Immediate support sits near $945.00, a zone that held during the last pull‑back and aligns with the 20‑period EMA. Resistance clusters around $975.00, the prior swing high where price has repeatedly stalled. Mid‑range bias is roughly $960.00, acting as a pivot for short‑term traders.
Why it matters – The memory sector is benefiting from AI‑driven data center demand, and Micron’s upcoming earnings could amplify the move.
Outlook – With price coiling near $975 resistance, a volume spike could trigger a breakout to the upside. Traders should watch order‑book depth; a clean surge may push $MUB into the $985‑$1,000 corridor, while a failure could see a retest of $945 support. 🌐
#MUB #Stocks #BinanceSquare
Log in to explore more content
Join global crypto users on Binance Square
⚡️ Get latest and useful information about crypto.
💬 Trusted by the world’s largest crypto exchange.
👍 Discover real insights from verified creators.
Email / Phone number
Trending Topics
1
#BinanceSAFUFundTransferCompleted7499BTC
28,042 views
676 Discussing
2
#BinanceRecovery90% of stolen assets
111,978 views
153 Discussing
3
#YiHe:ProofOfReserves:10TokensAt100%Backing
119,782 views
678 Discussing
4
#BackedNotBroken:RichardTengSaysUsersBearNoLoss
28,398 views
417 Discussing
5
#CZSaysCompensationIsinPlaceUsersAreProtected
113,232 views
1,328 Discussing
6
#IntelHasItsWorstDaySince1974
40,975 views
665 Discussing
7
#TRMCambodianCasinosReceived$1.07BInCrypto
10,829 views
66 Discussing
8
#USDCCirculationFallsAbout800MInSevenDays
64,421 views
702 Discussing
9
#SuspectedNorthKoreaAttacksAccountForNearly89%OfCryptoHackLosses
13,941 views
94 Discussing
10
#OpenAICutsFundraisingTargetBy$10B
3,337 views
73 Discussing