
#bitcoinfiveweeklylosses
bitcoinfiveweeklylosses
Bitcoin has closed lower for five straight weeks, trading around $75,950 on Nov 9. Last week's AI stock selloff spread to crypto: more than $1B in liquidations over 24 hours, and BTC fell 5.3%. IBIT's ETF outflow streak reached five sessions. Fed funds futures price about an 80% chance of a December hike. US CPI is due Tuesday. Does $75,000 hold? 👇
Hot
Latest


·
--
Article
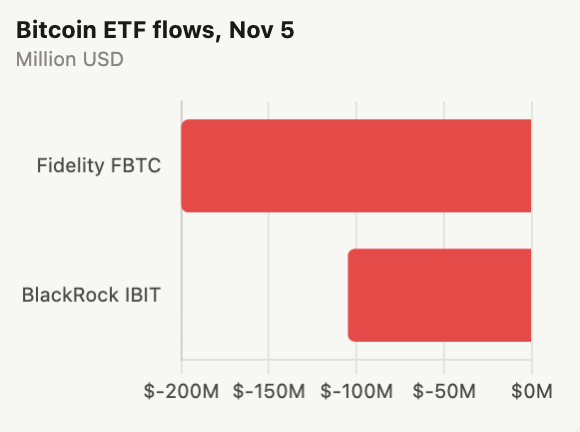
Bitcoin News | Bitcoin Slides for Five Straight Weeks as AI Stock Rout Spills Into CryptoBitcoin has closed lower for five straight weeks, and last week’s sharp selloff in AI stocks added to the pressure. The price now sits between its 50-day moving average at $81,800 and its 200-day average at $73,200, trading around $75,950 on November 8.AI Stock Selloff Spreads to CryptoThe Nasdaq Composite fell about 5.5% on November 5, its worst day since April 2025, on concerns that Democratic control of Congress could slow the AI data center buildout. Chip stocks had their worst session since the March 2020 Covid selloff.The losses hit AI hardware hardest. For the week:Sandisk fell 27.4%Micron dropped 22%The VanEck Semiconductor ETF (SMH) fell 11.2%The Nasdaq lost 3.4% overallThe selling spread to crypto. More than $1 billion in leveraged positions were liquidated over 24 hours, according to CoinGlass. Bitcoin liquidations reached $1.27 billion, about $1.1 billion of it from long positions. Over the same period, bitcoin fell 5.3% and ether 7.3%.Wall Street Cut Risk Across the BoardMorgan Stanley’s derivatives team said leveraged ETFs sold a record $57 billion of US stocks on November 5, the most since data began in 2007. Hedge fund net leverage fell 5 points in a single day, the fifth-largest drop since 2010, and retail selling in the first 90 minutes was the second-largest since 2016.Morgan Stanley also noted that stocks are moving more closely together, a sign that risk-cutting is spreading. Bitcoin has followed the same pattern: it fell with stocks during the selloff but did not join Friday’s rebound in chip stocks.Bitcoin ETFs See OutflowsBitcoin ETFs saw withdrawals as markets fell. On November 5, Fidelity’s FBTC lost about $200 million and BlackRock’s IBIT lost $105 million, extending IBIT’s outflow streak to five sessions, according to Farside Investors.Rate Hike Bets Add PressureA strong US jobs report added to the strain. The US added 165,000 jobs in October, far above the 65,000 forecast, and unemployment fell to 4.1%. Fed funds futures now price about an 80% chance of a December rate hike, according to LSEG. Higher rates tend to weigh on riskier assets such as tech stocks and crypto.US October CPI data, due Tuesday at 13:30 UTC, is the next test.Funding Rates Turn NeutralDerivatives data shows the selling has calmed. BTC funding rates are in the neutral range at 0.0081% to 0.0087%, according to CoinGlass, and ETH funding has also risen into neutral territory.On-chain data still shows heavy short positioning. Analyst KillaXBT noted that long-to-short ratios are at extremes that have coincided with past market bottoms.Key Levels: $90,000 Upside, $72,000 DownsideLevelWhat it is~$90,000Upside target if support holds, some analysts say~$82,000Trapped long positions that could cap a rebound$81,80050-day moving average$75,000–77,000This week’s key range$73,200200-day moving average$72,000–73,000Downside target if $75,000 breaksA rebound could be helped by oversold signals and buy orders below the price, while a break under $75,000 would open the way to the 200-day average.
Bitcoin News | Bitcoin Slides for Five Straight Weeks as AI Stock Rout Spills Into Crypto
Bitcoin has closed lower for five straight weeks, and last week’s sharp selloff in AI stocks added to the pressure. The price now sits between its 50-day moving average at $81,800 and its 200-day average at $73,200, trading around $75,950 on November 8.AI Stock Selloff Spreads to CryptoThe Nasdaq Composite fell about 5.5% on November 5, its worst day since April 2025, on concerns that Democratic control of Congress could slow the AI data center buildout. Chip stocks had their worst session since the March 2020 Covid selloff.The losses hit AI hardware hardest. For the week:Sandisk fell 27.4%Micron dropped 22%The VanEck Semiconductor ETF (SMH) fell 11.2%The Nasdaq lost 3.4% overallThe selling spread to crypto. More than $1 billion in leveraged positions were liquidated over 24 hours, according to CoinGlass. Bitcoin liquidations reached $1.27 billion, about $1.1 billion of it from long positions. Over the same period, bitcoin fell 5.3% and ether 7.3%.Wall Street Cut Risk Across the BoardMorgan Stanley’s derivatives team said leveraged ETFs sold a record $57 billion of US stocks on November 5, the most since data began in 2007. Hedge fund net leverage fell 5 points in a single day, the fifth-largest drop since 2010, and retail selling in the first 90 minutes was the second-largest since 2016.Morgan Stanley also noted that stocks are moving more closely together, a sign that risk-cutting is spreading. Bitcoin has followed the same pattern: it fell with stocks during the selloff but did not join Friday’s rebound in chip stocks.Bitcoin ETFs See OutflowsBitcoin ETFs saw withdrawals as markets fell. On November 5, Fidelity’s FBTC lost about $200 million and BlackRock’s IBIT lost $105 million, extending IBIT’s outflow streak to five sessions, according to Farside Investors.Rate Hike Bets Add PressureA strong US jobs report added to the strain. The US added 165,000 jobs in October, far above the 65,000 forecast, and unemployment fell to 4.1%. Fed funds futures now price about an 80% chance of a December rate hike, according to LSEG. Higher rates tend to weigh on riskier assets such as tech stocks and crypto.US October CPI data, due Tuesday at 13:30 UTC, is the next test.Funding Rates Turn NeutralDerivatives data shows the selling has calmed. BTC funding rates are in the neutral range at 0.0081% to 0.0087%, according to CoinGlass, and ETH funding has also risen into neutral territory.On-chain data still shows heavy short positioning. Analyst KillaXBT noted that long-to-short ratios are at extremes that have coincided with past market bottoms.Key Levels: $90,000 Upside, $72,000 DownsideLevelWhat it is~$90,000Upside target if support holds, some analysts say~$82,000Trapped long positions that could cap a rebound$81,80050-day moving average$75,000–77,000This week’s key range$73,200200-day moving average$72,000–73,000Downside target if $75,000 breaksA rebound could be helped by oversold signals and buy orders below the price, while a break under $75,000 would open the way to the 200-day average.
6
6.8k

#BitcoinFiveWeeklyLosses 🚨 BITCOIN FACES FIFTH CONSECUTIVE WEEKLY LOSS — IS $70K NEXT?
Bitcoin is under serious selling pressure, trading near $76,000, approximately 40% below its October peak.
📉 WHAT'S DRIVING THE DECLINE?
💸 ETF Outflows: $1.28 billion in weekly Bitcoin ETF outflows.
🏦 Fed Rate Fears: Strong U.S. jobs data is increasing expectations of higher interest rates.
🤖 AI Stock Sell-Off: Technology market weakness is spreading into crypto.
⚠️ Massive Liquidations: More than $1 billion in crypto liquidations has intensified selling pressure.
🎯 CRITICAL BTC PRICE LEVELS
PriceSignificance$87,000Recovery target$81K–$82KKey resistance$76,000Immediate support$73,779Major support$70,000Critical downside target
🔥 WHAT HAPPENS NEXT?
Bullish Scenario: Bitcoin reclaims $81K–$82K, potentially opening the door toward $87K.
Bearish Scenario: A confirmed breakdown below $75K could expose BTC to $73K–$70K, with deeper downside risk if selling accelerates.
⚠️ THE BIG QUESTION: Is Bitcoin approaching a major macro bottom, or is another correction waiting ahead?
The next weekly close could be critical for market direction.
💬 What do you expect next?
BTC rebounds toward $87K?
BTC falls toward $70K?
👇 Share your analysis in the comments.
#Bitcoin #BTC #CryptoMarket #BitcoinPrice #CryptoNews #ETFOutflows #FederalReserve #MarketCrash #Binance #CryptoTrading
Not financial advice. Cryptocurrency markets are highly volatile. Manage risk carefully and avoid excessive leverage.
#BitcoinFiveWeeklyLosses 🚨 BITCOIN FACES FIFTH CONSECUTIVE WEEKLY LOSS — IS $70K NEXT?
Bitcoin is under serious selling pressure, trading near $76,000, approximately 40% below its October peak.
📉 WHAT'S DRIVING THE DECLINE?
💸 ETF Outflows: $1.28 billion in weekly Bitcoin ETF outflows.
🏦 Fed Rate Fears: Strong U.S. jobs data is increasing expectations of higher interest rates.
🤖 AI Stock Sell-Off: Technology market weakness is spreading into crypto.
⚠️ Massive Liquidations: More than $1 billion in crypto liquidations has intensified selling pressure.
🎯 CRITICAL BTC PRICE LEVELS
PriceSignificance$87,000Recovery target$81K–$82KKey resistance$76,000Immediate support$73,779Major support$70,000Critical downside target
🔥 WHAT HAPPENS NEXT?
Bullish Scenario: Bitcoin reclaims $81K–$82K, potentially opening the door toward $87K.
Bearish Scenario: A confirmed breakdown below $75K could expose BTC to $73K–$70K, with deeper downside risk if selling accelerates.
⚠️ THE BIG QUESTION: Is Bitcoin approaching a major macro bottom, or is another correction waiting ahead?
The next weekly close could be critical for market direction.
💬 What do you expect next?
BTC rebounds toward $87K?
BTC falls toward $70K?
👇 Share your analysis in the comments.
#Bitcoin #BTC #CryptoMarket #BitcoinPrice #CryptoNews #ETFOutflows #FederalReserve #MarketCrash #Binance #CryptoTrading
Not financial advice. Cryptocurrency markets are highly volatile. Manage risk carefully and avoid excessive leverage.
Bitcoin is under serious selling pressure, trading near $76,000, approximately 40% below its October peak.
📉 WHAT'S DRIVING THE DECLINE?
💸 ETF Outflows: $1.28 billion in weekly Bitcoin ETF outflows.
🏦 Fed Rate Fears: Strong U.S. jobs data is increasing expectations of higher interest rates.
🤖 AI Stock Sell-Off: Technology market weakness is spreading into crypto.
⚠️ Massive Liquidations: More than $1 billion in crypto liquidations has intensified selling pressure.
🎯 CRITICAL BTC PRICE LEVELS
PriceSignificance$87,000Recovery target$81K–$82KKey resistance$76,000Immediate support$73,779Major support$70,000Critical downside target
🔥 WHAT HAPPENS NEXT?
Bullish Scenario: Bitcoin reclaims $81K–$82K, potentially opening the door toward $87K.
Bearish Scenario: A confirmed breakdown below $75K could expose BTC to $73K–$70K, with deeper downside risk if selling accelerates.
⚠️ THE BIG QUESTION: Is Bitcoin approaching a major macro bottom, or is another correction waiting ahead?
The next weekly close could be critical for market direction.
💬 What do you expect next?
BTC rebounds toward $87K?
BTC falls toward $70K?
👇 Share your analysis in the comments.
#Bitcoin #BTC #CryptoMarket #BitcoinPrice #CryptoNews #ETFOutflows #FederalReserve #MarketCrash #Binance #CryptoTrading
Not financial advice. Cryptocurrency markets are highly volatile. Manage risk carefully and avoid excessive leverage.
40

NEW WEEK: $BTC BIAS (Nov 9, 2026)
#BitcoinFiveWeeklyLosses
Last week, price fell from 81,100 to 73,500 and the week closed below last month's low. Lower highs and lower lows on the weekly.
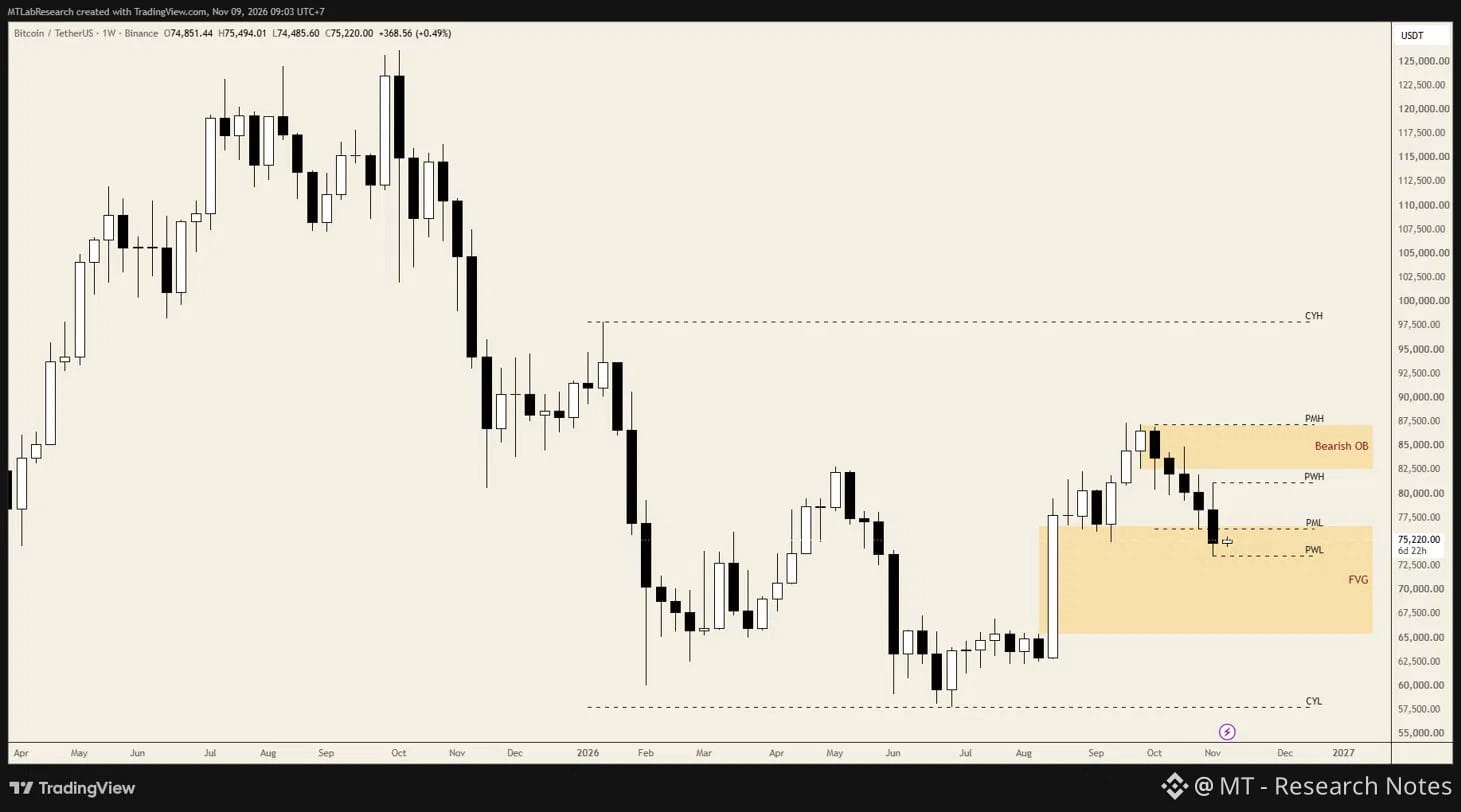
Weekly: 5 red candles in a row, each with a lower high and a lower low. Price is reaching the price gap (FVG) left by the big August candle, about 65,400 to 76,500. A break below last week's low likely means a 6th red week. Bulls only get confident again if price takes back last month's high and the zone sellers defended (bearish order block), about 82,500 to 87,200.
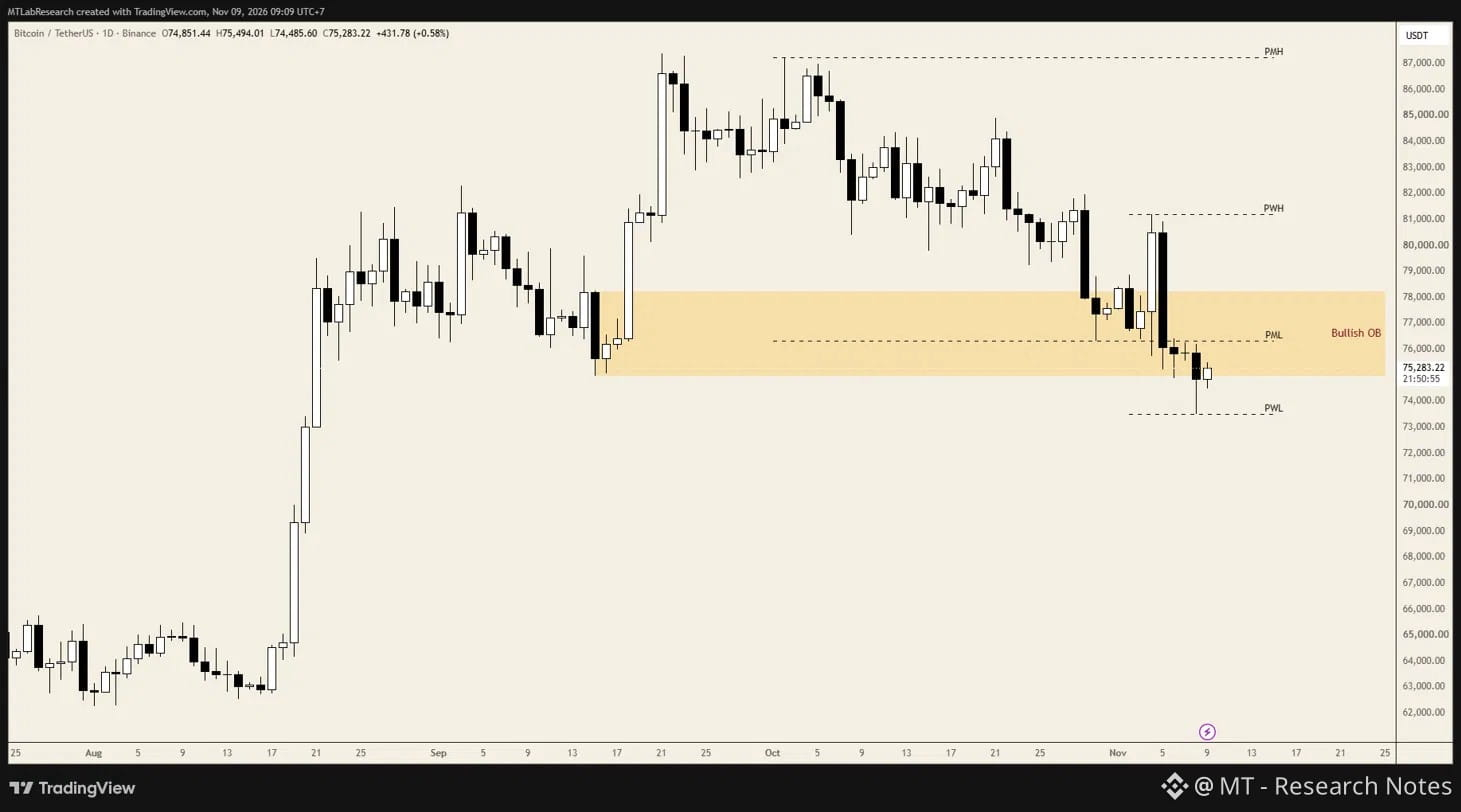
Daily: Price is sitting in the zone buyers defended before (bullish order block), about 75,000 to 78,200. If it can't hold inside the zone or start to recover, the next few days can get worse.
Key levels:
- Resistance:
87,200 (PMH, last month's high)
81,100 (PWH, last week's high)
76,300 (PML, last month's low)
- Support:
73,500 (PWL, last week's low)
Experience, not financial advice.
{future}(BTCUSDT)
NEW WEEK: $BTC BIAS (Nov 9, 2026)
#BitcoinFiveWeeklyLosses
Last week, price fell from 81,100 to 73,500 and the week closed below last month's low. Lower highs and lower lows on the weekly.
Weekly: 5 red candles in a row, each with a lower high and a lower low. Price is reaching the price gap (FVG) left by the big August candle, about 65,400 to 76,500. A break below last week's low likely means a 6th red week. Bulls only get confident again if price takes back last month's high and the zone sellers defended (bearish order block), about 82,500 to 87,200.
Daily: Price is sitting in the zone buyers defended before (bullish order block), about 75,000 to 78,200. If it can't hold inside the zone or start to recover, the next few days can get worse.
Key levels:
- Resistance:
87,200 (PMH, last month's high)
81,100 (PWH, last week's high)
76,300 (PML, last month's low)
- Support:
73,500 (PWL, last week's low)
Experience, not financial advice.
#BitcoinFiveWeeklyLosses
Last week, price fell from 81,100 to 73,500 and the week closed below last month's low. Lower highs and lower lows on the weekly.
Weekly: 5 red candles in a row, each with a lower high and a lower low. Price is reaching the price gap (FVG) left by the big August candle, about 65,400 to 76,500. A break below last week's low likely means a 6th red week. Bulls only get confident again if price takes back last month's high and the zone sellers defended (bearish order block), about 82,500 to 87,200.
Daily: Price is sitting in the zone buyers defended before (bullish order block), about 75,000 to 78,200. If it can't hold inside the zone or start to recover, the next few days can get worse.
Key levels:
- Resistance:
87,200 (PMH, last month's high)
81,100 (PWH, last week's high)
76,300 (PML, last month's low)
- Support:
73,500 (PWL, last week's low)
Experience, not financial advice.
45
#BitcoinFiveWeeklyLosses 🚨 BITCOIN FACES FIVE CONSECUTIVE WEEKLY LOSSES!
📉 Bitcoin is extending its painful downtrend, approaching the $76,000 level and marking its fifth consecutive weekly loss.
⚠️ BTC is now approximately 40% below its October peak, raising concerns about continued selling pressure, weakening market sentiment, and further downside risk.
🔴 KEY MARKET SIGNALS:
Five consecutive weekly losses.
Price approaching $76,000.
Approximately 40% below its October high.
Bearish momentum remains a major concern.
🔥 IS THIS THE BEGINNING OF A DEEPER BEAR MARKET, OR A POTENTIAL BUYING OPPORTUNITY?
Watch key support levels, market liquidity, and institutional demand. Avoid excessive leverage during high volatility.
💬 What is your prediction for Bitcoin's next move?
#BitcoinFiveWeeklyLosses #Bitcoin #BTC #CryptoMarket #BitcoinCrash #CryptoNews #Binance #BTCAnalysis
Not financial advice. Cryptocurrency markets involve significant risk.
#BitcoinFiveWeeklyLosses 🚨 BITCOIN FACES FIVE CONSECUTIVE WEEKLY LOSSES!
📉 Bitcoin is extending its painful downtrend, approaching the $76,000 level and marking its fifth consecutive weekly loss.
⚠️ BTC is now approximately 40% below its October peak, raising concerns about continued selling pressure, weakening market sentiment, and further downside risk.
🔴 KEY MARKET SIGNALS:
Five consecutive weekly losses.
Price approaching $76,000.
Approximately 40% below its October high.
Bearish momentum remains a major concern.
🔥 IS THIS THE BEGINNING OF A DEEPER BEAR MARKET, OR A POTENTIAL BUYING OPPORTUNITY?
Watch key support levels, market liquidity, and institutional demand. Avoid excessive leverage during high volatility.
💬 What is your prediction for Bitcoin's next move?
#BitcoinFiveWeeklyLosses #Bitcoin #BTC #CryptoMarket #BitcoinCrash #CryptoNews #Binance #BTCAnalysis
Not financial advice. Cryptocurrency markets involve significant risk.
📉 Bitcoin is extending its painful downtrend, approaching the $76,000 level and marking its fifth consecutive weekly loss.
⚠️ BTC is now approximately 40% below its October peak, raising concerns about continued selling pressure, weakening market sentiment, and further downside risk.
🔴 KEY MARKET SIGNALS:
Five consecutive weekly losses.
Price approaching $76,000.
Approximately 40% below its October high.
Bearish momentum remains a major concern.
🔥 IS THIS THE BEGINNING OF A DEEPER BEAR MARKET, OR A POTENTIAL BUYING OPPORTUNITY?
Watch key support levels, market liquidity, and institutional demand. Avoid excessive leverage during high volatility.
💬 What is your prediction for Bitcoin's next move?
#BitcoinFiveWeeklyLosses #Bitcoin #BTC #CryptoMarket #BitcoinCrash #CryptoNews #Binance #BTCAnalysis
Not financial advice. Cryptocurrency markets involve significant risk.
10

·
--
#BitcoinFiveWeeklyLosses
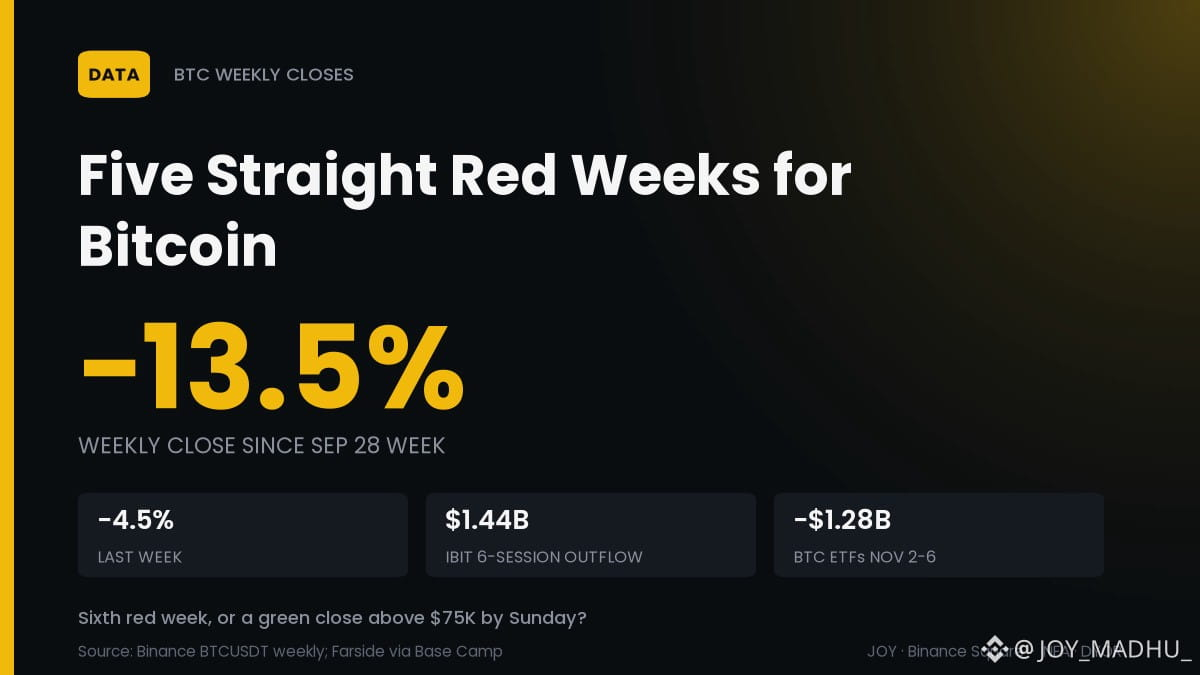
📉 Five Red Weekly Candles Took Bitcoin From $86.5K to $74.9K
BTC has now closed lower five weeks running, and this week opens with ETF selling and Tuesday's CPI ahead.
📊 Weekly close fell 13.5%, from $86,530 (Sep 28 week) to $74,851
📉 Last week alone: -4.5%, from a $78,354 open
🏦 IBIT: six straight outflow sessions, about $1.44B in total
⚠️ US spot BTC ETFs lost $1.28B from Nov 2 to Nov 6
The catch: Fidelity's FBTC still took in $93.1M that week, so not every buyer left.
Sixth red week, or a green close above $75K by Sunday? 👇
$BTC
#BitcoinFiveWeeklyLosses #Bitcoin #ETF
#BitcoinFiveWeeklyLosses
📉 Five Red Weekly Candles Took Bitcoin From $86.5K to $74.9K
BTC has now closed lower five weeks running, and this week opens with ETF selling and Tuesday's CPI ahead.
📊 Weekly close fell 13.5%, from $86,530 (Sep 28 week) to $74,851
📉 Last week alone: -4.5%, from a $78,354 open
🏦 IBIT: six straight outflow sessions, about $1.44B in total
⚠️ US spot BTC ETFs lost $1.28B from Nov 2 to Nov 6
The catch: Fidelity's FBTC still took in $93.1M that week, so not every buyer left.
Sixth red week, or a green close above $75K by Sunday? 👇
$BTC
#BitcoinFiveWeeklyLosses #Bitcoin #ETF
📉 Five Red Weekly Candles Took Bitcoin From $86.5K to $74.9K
BTC has now closed lower five weeks running, and this week opens with ETF selling and Tuesday's CPI ahead.
📊 Weekly close fell 13.5%, from $86,530 (Sep 28 week) to $74,851
📉 Last week alone: -4.5%, from a $78,354 open
🏦 IBIT: six straight outflow sessions, about $1.44B in total
⚠️ US spot BTC ETFs lost $1.28B from Nov 2 to Nov 6
The catch: Fidelity's FBTC still took in $93.1M that week, so not every buyer left.
Sixth red week, or a green close above $75K by Sunday? 👇
$BTC
#BitcoinFiveWeeklyLosses #Bitcoin #ETF
10

·
--
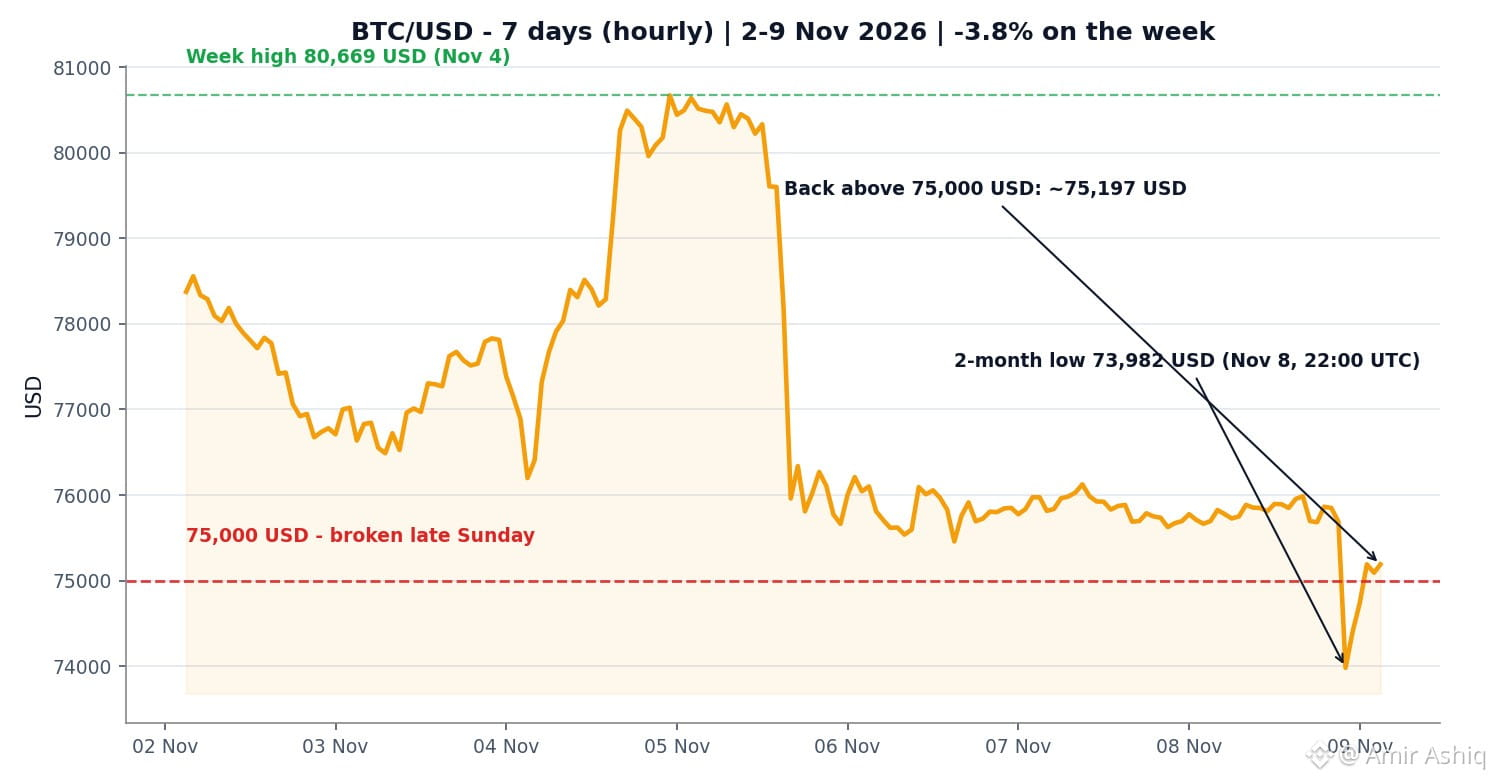
🚨 $BTC JUST BROKE BELOW 75,000 USD — BUT THE BOUNCE BACK SAYS MORE THAN THE DIP
Bitcoin slipped to 73,982 USD late on Sunday — its lowest in more than two months — then clawed back above 75,000 USD by morning.
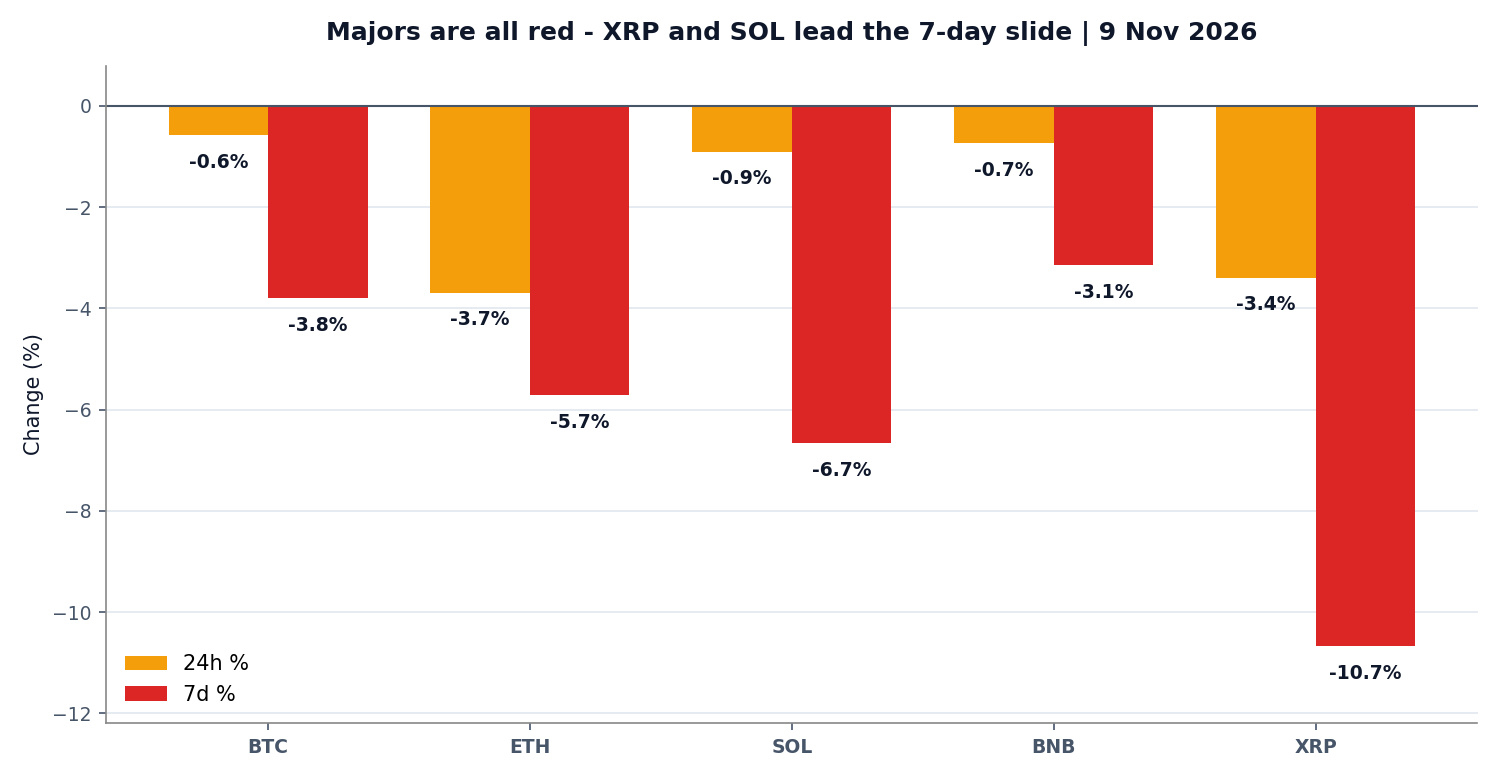
$ETH fell harder, down 3.7% in 24 hours to 2,147 USD, and $XRP slid 3.4% to 1.12 USD. The market is now nursing a fifth straight weekly loss.
Here's what the data shows:
📉 About 856 million USD liquidated in 24 hours, mostly longs — forced selling, not a quiet drift
📊 Fear & Greed at 29 (Fear) — five straight weeks in the red for $BTC
💧 US spot $BTC ETFs are now 914 million USD negative for 2026 after a 1.28 billion USD outflow week
Thin weekend liquidity makes moves bigger in both directions — a watched level breaks fast, and bounces back just as fast.
CPI lands Tuesday at 8:30 ET, the last big inflation read before the December Fed meeting. Volatility usually stays elevated around prints like that.
Did the overnight dip shake you out, or did you hold through it? 👇
Not financial advice — educational purposes only.
#BitcoinFiveWeeklyLosses #Bitcoin #Ethereum #crypto
🚨 $BTC JUST BROKE BELOW 75,000 USD — BUT THE BOUNCE BACK SAYS MORE THAN THE DIP
Bitcoin slipped to 73,982 USD late on Sunday — its lowest in more than two months — then clawed back above 75,000 USD by morning.
$ETH fell harder, down 3.7% in 24 hours to 2,147 USD, and $XRP slid 3.4% to 1.12 USD. The market is now nursing a fifth straight weekly loss.
Here's what the data shows:
📉 About 856 million USD liquidated in 24 hours, mostly longs — forced selling, not a quiet drift
📊 Fear & Greed at 29 (Fear) — five straight weeks in the red for $BTC
💧 US spot $BTC ETFs are now 914 million USD negative for 2026 after a 1.28 billion USD outflow week
Thin weekend liquidity makes moves bigger in both directions — a watched level breaks fast, and bounces back just as fast.
CPI lands Tuesday at 8:30 ET, the last big inflation read before the December Fed meeting. Volatility usually stays elevated around prints like that.
Did the overnight dip shake you out, or did you hold through it? 👇
Not financial advice — educational purposes only.
#BitcoinFiveWeeklyLosses #Bitcoin #Ethereum #crypto
Bitcoin slipped to 73,982 USD late on Sunday — its lowest in more than two months — then clawed back above 75,000 USD by morning.
$ETH fell harder, down 3.7% in 24 hours to 2,147 USD, and $XRP slid 3.4% to 1.12 USD. The market is now nursing a fifth straight weekly loss.
Here's what the data shows:
📉 About 856 million USD liquidated in 24 hours, mostly longs — forced selling, not a quiet drift
📊 Fear & Greed at 29 (Fear) — five straight weeks in the red for $BTC
💧 US spot $BTC ETFs are now 914 million USD negative for 2026 after a 1.28 billion USD outflow week
Thin weekend liquidity makes moves bigger in both directions — a watched level breaks fast, and bounces back just as fast.
CPI lands Tuesday at 8:30 ET, the last big inflation read before the December Fed meeting. Volatility usually stays elevated around prints like that.
Did the overnight dip shake you out, or did you hold through it? 👇
Not financial advice — educational purposes only.
#BitcoinFiveWeeklyLosses #Bitcoin #Ethereum #crypto
67

·
--
Five red weeks in a row and my feed is still full of 'bottom is in' calls 😅
$BTC is parked around $75K, squeezed between the 50 day average up near $81.8K and the 200 day down at ~$73.2K. Last week's AI stock sell off spilled straight into crypto and honestly nobody escaped that one.
The real test now is Tuesday's US CPI print. That decides where December rate expectations go from here.
So what's your move buying this dip, waiting for CPI, or just sitting on your hands?
#BitcoinFiveWeeklyLosses
Five red weeks in a row and my feed is still full of 'bottom is in' calls 😅
$BTC is parked around $75K, squeezed between the 50 day average up near $81.8K and the 200 day down at ~$73.2K. Last week's AI stock sell off spilled straight into crypto and honestly nobody escaped that one.
The real test now is Tuesday's US CPI print. That decides where December rate expectations go from here.
So what's your move buying this dip, waiting for CPI, or just sitting on your hands?
#BitcoinFiveWeeklyLosses
$BTC is parked around $75K, squeezed between the 50 day average up near $81.8K and the 200 day down at ~$73.2K. Last week's AI stock sell off spilled straight into crypto and honestly nobody escaped that one.
The real test now is Tuesday's US CPI print. That decides where December rate expectations go from here.
So what's your move buying this dip, waiting for CPI, or just sitting on your hands?
#BitcoinFiveWeeklyLosses

1
38

·
--
#BitcoinFiveWeeklyLosses
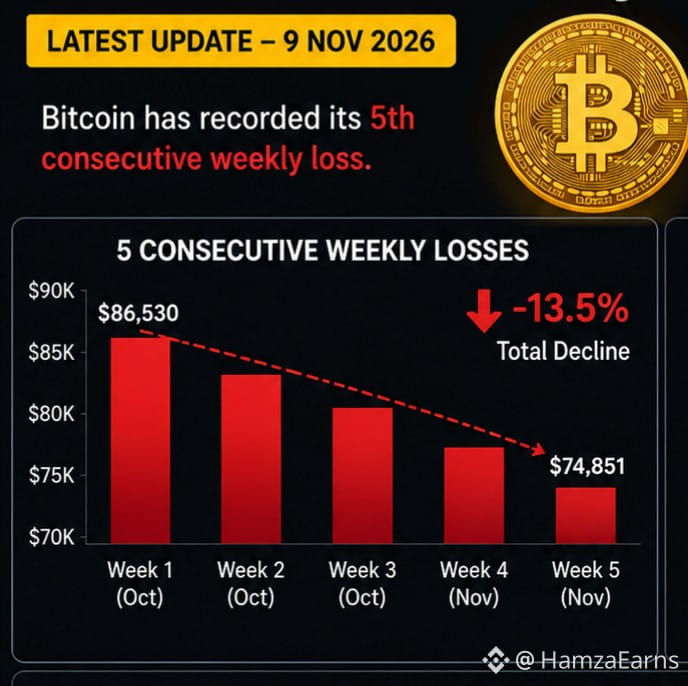
Bitcoin's 5 weeks of losses — explained simply 📉
Imagine you own Bitcoin.$BTC
For five weeks in a row, its price has gone down instead of up. This is called 5 consecutive losing weeks.
Why is Bitcoin falling?
💰 Investors are selling Bitcoin.
🏦 Big investment funds are taking money out.
😟 People are worried about the economy.
📉 Traders who borrowed money are being forced to sell.
What could happen next?
🟢 Bitcoin goes up: Buyers return and the price recovers.$BTC
🔴 Bitcoin goes down: More people sell and the price falls further.
🟡 Bitcoin stays sideways: Buyers and sellers balance each other.
Remember: Five red weeks do not mean Bitcoin must keep falling. A recovery is still possible.
Note: The infographic uses the figures from the previous update; treat them as reported figures, not independently verified live prices.
{spot}(BTCUSDT)
#BitcoinFiveWeeklyLosses
Bitcoin's 5 weeks of losses — explained simply 📉
Imagine you own Bitcoin.$BTC
For five weeks in a row, its price has gone down instead of up. This is called 5 consecutive losing weeks.
Why is Bitcoin falling?
💰 Investors are selling Bitcoin.
🏦 Big investment funds are taking money out.
😟 People are worried about the economy.
📉 Traders who borrowed money are being forced to sell.
What could happen next?
🟢 Bitcoin goes up: Buyers return and the price recovers.$BTC
🔴 Bitcoin goes down: More people sell and the price falls further.
🟡 Bitcoin stays sideways: Buyers and sellers balance each other.
Remember: Five red weeks do not mean Bitcoin must keep falling. A recovery is still possible.
Note: The infographic uses the figures from the previous update; treat them as reported figures, not independently verified live prices.
Bitcoin's 5 weeks of losses — explained simply 📉
Imagine you own Bitcoin.$BTC
For five weeks in a row, its price has gone down instead of up. This is called 5 consecutive losing weeks.
Why is Bitcoin falling?
💰 Investors are selling Bitcoin.
🏦 Big investment funds are taking money out.
😟 People are worried about the economy.
📉 Traders who borrowed money are being forced to sell.
What could happen next?
🟢 Bitcoin goes up: Buyers return and the price recovers.$BTC
🔴 Bitcoin goes down: More people sell and the price falls further.
🟡 Bitcoin stays sideways: Buyers and sellers balance each other.
Remember: Five red weeks do not mean Bitcoin must keep falling. A recovery is still possible.
Note: The infographic uses the figures from the previous update; treat them as reported figures, not independently verified live prices.
8


Bitcoin has just experienced its fifth consecutive week of losses, a significant downturn that has investors watching closely. This streak highlights a period of considerable bearish pressure in the market. While past performance is not indicative of future results, such prolonged downturns often precede periods of consolidation or potential reversals as market sentiment shifts. Traders are now assessing whether this trend will continue or if $BTC will find a bottom and begin a recovery. The current sentiment suggests caution, but opportunities may arise for those who can navigate the volatility.
Always do your own research before trading cryptocurrencies.
#BitcoinFiveWeeklyLosses $BTC
Bitcoin has just experienced its fifth consecutive week of losses, a significant downturn that has investors watching closely. This streak highlights a period of considerable bearish pressure in the market. While past performance is not indicative of future results, such prolonged downturns often precede periods of consolidation or potential reversals as market sentiment shifts. Traders are now assessing whether this trend will continue or if $BTC will find a bottom and begin a recovery. The current sentiment suggests caution, but opportunities may arise for those who can navigate the volatility.
Always do your own research before trading cryptocurrencies.
#BitcoinFiveWeeklyLosses $BTC
Always do your own research before trading cryptocurrencies.
#BitcoinFiveWeeklyLosses $BTC
24

·
--
Sunday night tried to liquidate the whole market in ten minutes, darling, and $BTC is still standing. $BTC touched $73,708 late Sunday, the lowest since August, before bouncing back to ~$75,074. About $745M in positions got wiped out in a single hour, 96% of them longs, and CoinGlass counts $856M liquidated in 24 hours across 140,000 traders. That closes a fifth straight weekly loss, down about 5% from Monday's $78,232 open. The alts bled harder: $ETH ~$2,135, down about 4.3% after dipping to $2,100, SOL ~$87, XRP $1.11, BNB $684. Total market cap $2.48T, down 5.3% in a day, Fear & Greed 28, Fear, and $BTC dominance is up near 60% as money hides in the biggest name. The one name refusing to join the funeral: ZEC ~$1,228, down less than 2%. The exits are institutional: spot $BTC ETFs lost $1.28B last week, the biggest weekly outflow since June, with $411.9M leaving on Friday alone. October jobs came in hot at 165K vs 65K expected, jobless 4.1%, and December hike odds are pushing toward 80%. Washington is not helping the mood: Democrats swept both chambers in the midterms, and crypto-backed candidates lost 9 of 12 competitive races. Off the charts: the $6.3B Binance heist is still echoing, the FBI blaming North Korea's TraderTraitor, about $2.85B frozen, 98% of tokens replenished, withdrawals reopening for HYPE and APT. FinCEN cut MEXC off from the US financial system on Friday. And quietly, Russia opens retail crypto on November 17, capped at $3,700 a year, with Moscow Exchange piloting from December 1. CPI lands Tuesday, the next big test before the Fed meets December 9. $BTC is parked just under the short-term holder cost near $75,700, with the 200-day average near $73,100 underneath. So which line decides this week, the floor or the ceiling? #BitcoinFiveWeeklyLosses #CPITestsDecemberRateOutlook #JobsReportRaisesHikeOdds
Sunday night tried to liquidate the whole market in ten minutes, darling, and $BTC is still standing. $BTC touched $73,708 late Sunday, the lowest since August, before bouncing back to ~$75,074. About $745M in positions got wiped out in a single hour, 96% of them longs, and CoinGlass counts $856M liquidated in 24 hours across 140,000 traders. That closes a fifth straight weekly loss, down about 5% from Monday's $78,232 open. The alts bled harder: $ETH ~$2,135, down about 4.3% after dipping to $2,100, SOL ~$87, XRP $1.11, BNB $684. Total market cap $2.48T, down 5.3% in a day, Fear & Greed 28, Fear, and $BTC dominance is up near 60% as money hides in the biggest name. The one name refusing to join the funeral: ZEC ~$1,228, down less than 2%. The exits are institutional: spot $BTC ETFs lost $1.28B last week, the biggest weekly outflow since June, with $411.9M leaving on Friday alone. October jobs came in hot at 165K vs 65K expected, jobless 4.1%, and December hike odds are pushing toward 80%. Washington is not helping the mood: Democrats swept both chambers in the midterms, and crypto-backed candidates lost 9 of 12 competitive races. Off the charts: the $6.3B Binance heist is still echoing, the FBI blaming North Korea's TraderTraitor, about $2.85B frozen, 98% of tokens replenished, withdrawals reopening for HYPE and APT. FinCEN cut MEXC off from the US financial system on Friday. And quietly, Russia opens retail crypto on November 17, capped at $3,700 a year, with Moscow Exchange piloting from December 1. CPI lands Tuesday, the next big test before the Fed meets December 9. $BTC is parked just under the short-term holder cost near $75,700, with the 200-day average near $73,100 underneath. So which line decides this week, the floor or the ceiling? #BitcoinFiveWeeklyLosses #CPITestsDecemberRateOutlook #JobsReportRaisesHikeOdds
87

·
--
Bearish
#BitcoinFiveWeeklyLosses Bitcoin’s Five Consecutive Weekly Losses: Is This a Warning Sign or a Buying Opportunity?
$BTC
Bitcoin has always been known for its volatility, but five consecutive weeks of losses are something investors cannot simply ignore.
When the market continues to close red week after week, the question becomes bigger than just price movement: Are we witnessing the beginning of a deeper correction, or is the market preparing for its next major recovery?
For long-term investors, falling prices might look like an opportunity to accumulate Bitcoin at lower levels. However, for short-term traders, the situation is considerably more difficult. Uncertainty, sudden price movements, liquidations and emotional decisions can quickly turn a small loss into a much bigger one.
One of the biggest mistakes traders make during periods like this is trying to predict the exact bottom. They keep buying because the price looks cheap, only to watch it fall further. On the other hand, selling everything out of fear can mean missing a potential recovery.
The real question is whether market confidence is weakening or whether this is simply a temporary correction within a larger market cycle.
Personally, I believe this is a time for patience rather than impulsive decisions. A falling market does not automatically mean Bitcoin is finished, just as a lower price does not automatically make it a good investment.
Let’s discuss:
1. Do five consecutive weekly losses suggest a deeper bear market?
2. Would you buy Bitcoin at these levels, or wait for stronger confirmation of a recovery?
3. Are long-term holders making the right decision by holding, or should they reconsider their positions?
4. What would convince you that the market has finally reached its bottom?
Sometimes the most profitable decision in trading isn’t buying or selling. It’s knowing when to wait.
What’s your strategy right now: BUY, SELL, or WAIT?
#BitcoinFiveWeeklyLosses Bitcoin’s Five Consecutive Weekly Losses: Is This a Warning Sign or a Buying Opportunity?
$BTC
Bitcoin has always been known for its volatility, but five consecutive weeks of losses are something investors cannot simply ignore.
When the market continues to close red week after week, the question becomes bigger than just price movement: Are we witnessing the beginning of a deeper correction, or is the market preparing for its next major recovery?
For long-term investors, falling prices might look like an opportunity to accumulate Bitcoin at lower levels. However, for short-term traders, the situation is considerably more difficult. Uncertainty, sudden price movements, liquidations and emotional decisions can quickly turn a small loss into a much bigger one.
One of the biggest mistakes traders make during periods like this is trying to predict the exact bottom. They keep buying because the price looks cheap, only to watch it fall further. On the other hand, selling everything out of fear can mean missing a potential recovery.
The real question is whether market confidence is weakening or whether this is simply a temporary correction within a larger market cycle.
Personally, I believe this is a time for patience rather than impulsive decisions. A falling market does not automatically mean Bitcoin is finished, just as a lower price does not automatically make it a good investment.
Let’s discuss:
1. Do five consecutive weekly losses suggest a deeper bear market?
2. Would you buy Bitcoin at these levels, or wait for stronger confirmation of a recovery?
3. Are long-term holders making the right decision by holding, or should they reconsider their positions?
4. What would convince you that the market has finally reached its bottom?
Sometimes the most profitable decision in trading isn’t buying or selling. It’s knowing when to wait.
What’s your strategy right now: BUY, SELL, or WAIT?
$BTC
Bitcoin has always been known for its volatility, but five consecutive weeks of losses are something investors cannot simply ignore.
When the market continues to close red week after week, the question becomes bigger than just price movement: Are we witnessing the beginning of a deeper correction, or is the market preparing for its next major recovery?
For long-term investors, falling prices might look like an opportunity to accumulate Bitcoin at lower levels. However, for short-term traders, the situation is considerably more difficult. Uncertainty, sudden price movements, liquidations and emotional decisions can quickly turn a small loss into a much bigger one.
One of the biggest mistakes traders make during periods like this is trying to predict the exact bottom. They keep buying because the price looks cheap, only to watch it fall further. On the other hand, selling everything out of fear can mean missing a potential recovery.
The real question is whether market confidence is weakening or whether this is simply a temporary correction within a larger market cycle.
Personally, I believe this is a time for patience rather than impulsive decisions. A falling market does not automatically mean Bitcoin is finished, just as a lower price does not automatically make it a good investment.
Let’s discuss:
1. Do five consecutive weekly losses suggest a deeper bear market?
2. Would you buy Bitcoin at these levels, or wait for stronger confirmation of a recovery?
3. Are long-term holders making the right decision by holding, or should they reconsider their positions?
4. What would convince you that the market has finally reached its bottom?
Sometimes the most profitable decision in trading isn’t buying or selling. It’s knowing when to wait.
What’s your strategy right now: BUY, SELL, or WAIT?
28

·
--

Article
📉 Bitcoin's Five Weekly Losses: What the Streak Really Means 🪙#BitcoinFiveWeeklyLosses
## 🔍 Introduction
In crypto, a single red candle rarely causes panic. A string of them is different. When Bitcoin closed five consecutive weekly candles in the red, traders around the world started asking the same question: is this a healthy pause or the start of something deeper? 🤔
Bitcoin was on track for its fifth straight weekly decline in February 2026, the first streak of this kind since March to May 2022. That alone made it a headline event. Let's look at what happened, why it matters, and what traders can learn from it. 💡
## 📊 What Exactly Happened?
A weekly losing streak means Bitcoin closed lower than it opened for several weeks in a row. Five in a row is rare. Bitcoin had already posted its fourth consecutive weekly loss in mid-February 2026 and struggled to find direction after a weekend rally fizzled. One more red week then completed the five. 😬
The pain was not limited to weekly charts. Bitcoin also recorded five consecutive monthly declines by the end of February 2026, a first in its history, with February alone down about 14.8%. Weekly and monthly weakness together showed that the pressure was broad, not a short-term blip. 📆
## 🧠 Why Did Bitcoin Keep Falling?
No single reason explains a streak like this. Several forces tend to stack up:
- 🌍 **Macro pressure:** When investors move into risk-off mode, speculative assets like crypto are often sold first.
- 💸 **Realized losses:** Roughly $8.7 billion in Bitcoin losses were realized in a single week, the second-largest loss event on record after the Three Arrows Capital collapse. That shows how many holders gave up and sold.
- 📉 **Falling volume:** Trading volume dropped about 61% week over week during the worst of the selloff. Thin volume means fewer buyers are willing to step in.
- 😨 **Weak sentiment:** After a big rally, confidence turns to fear quickly once support levels break.
## 🕰️ How Does This Compare to History?
Five weeks is painful, but it is not the worst Bitcoin has seen.
- 🐻 In 2022, Bitcoin had a much longer run of weekly losses. Some reports count nine consecutive weeks between March and May.
- 📅 In 2021, a five-week losing streak from May to June cut the price roughly in half, from about $58,000 to about $29,000. That was a 50% correction.
- 🐂 Streaks also happen in bull markets. Bitcoin has had multi-week losing streaks during every bull market in its history.
So a streak by itself does not prove a bear market. What matters is what the price does next, and how deep the drop goes. 🧩
## 🎯 What Did Analysts Watch?
During the decline, traders focused on key levels. Bitcoin was trading below $67,000 and was down about 50% from its peak. Some technical analysts pointed to the $50,000 to $56,000 zone as a possible target based on larger weekly and monthly patterns. Others noted that Bitcoin has bounced from deep drawdowns before. 🔄
Another point from the analysis: shrinking weekly losses can signal that sellers are running out, which is often a precondition for a reversal. In other words, if each red week is smaller than the last, the selling pressure may be fading. 🌱
## 🛡️ Lessons for Traders and Investors
1. 🧘 **Stay calm.** Emotional selling at the lows is how most people lose money.
2. 📏 **Use risk management.** Position size and stop-losses matter more in a downtrend than any prediction.
3. 🗓️ **Think in time frames.** A weekly streak tells you about the medium term, not tomorrow's move.
4. 🔎 **Watch volume and levels.** A bounce on weak volume is less trustworthy than one with strong buying.
5. 💰 **Avoid leverage.** Streaks like this are when over-leveraged traders get liquidated first.
## 🔮 What Comes Next?
Nobody can say for sure. A losing streak can end with a sharp rebound, or it can be one chapter of a longer slide. 🎢 The reasonable approach is to track the weekly close, key support and resistance, and the broader macro picture, rather than bet on a single outcome.
## ✅ Conclusion
Five weekly losses in a row is a serious signal of weak momentum, but not a verdict on Bitcoin's future. History shows that fear peaks and selling exhaustion often come before recoveries, and also that some downtrends run longer than expected. 📚 The best defense is a plan, discipline, and patience. 🚀
⚠️ *This article is for education only and is not financial advice. Always do your own research.*
**** #Bitcoin 🪙 #CryptoMarket 📉 #BTCAnalysis 📊 #CryptoTrading 💹 #BearMarket 🐻
#AIChipSlumpNasdaq #BinanceReopensWithdrawalsForHYPE&APT #SouthKoreaDraftLawTargets15To20%ShareholderCap #TradFiForBeginners
Sources:
- [Bitcoin's 5-Week Decline Matches 2022 Bear Market Streak](https://www.publish0x.com/cryptotrendseer/bitcoins-five-week-decline-matches-2022-bear-market-streak-xxrvqde)
- [Bitcoin Faces Unprecedented Fifth Month of Losses](https://www.mexc.com/news/833702)
- [Bitcoin Looks for Direction After Four Straight Weekly Losses (Bloomberg)](https://www.bloomberg.com/news/articles/2026-02-16/bitcoin-looks-for-direction-after-four-straight-weekly-losses)
- [Bitcoin Searches for Direction After Fourth Straight Weekly Loss](https://blocklr.pages.dev/news/bitcoin-four-weekly-losses-direction/)
- [Bitcoin Set for First Five-Week Decline Since 2022](https://www.mexc.com/news/748768)
📉 Bitcoin's Five Weekly Losses: What the Streak Really Means 🪙
#BitcoinFiveWeeklyLosses
## 🔍 Introduction
In crypto, a single red candle rarely causes panic. A string of them is different. When Bitcoin closed five consecutive weekly candles in the red, traders around the world started asking the same question: is this a healthy pause or the start of something deeper? 🤔
Bitcoin was on track for its fifth straight weekly decline in February 2026, the first streak of this kind since March to May 2022. That alone made it a headline event. Let's look at what happened, why it matters, and what traders can learn from it. 💡
## 📊 What Exactly Happened?
A weekly losing streak means Bitcoin closed lower than it opened for several weeks in a row. Five in a row is rare. Bitcoin had already posted its fourth consecutive weekly loss in mid-February 2026 and struggled to find direction after a weekend rally fizzled. One more red week then completed the five. 😬
The pain was not limited to weekly charts. Bitcoin also recorded five consecutive monthly declines by the end of February 2026, a first in its history, with February alone down about 14.8%. Weekly and monthly weakness together showed that the pressure was broad, not a short-term blip. 📆
## 🧠 Why Did Bitcoin Keep Falling?
No single reason explains a streak like this. Several forces tend to stack up:
- 🌍 **Macro pressure:** When investors move into risk-off mode, speculative assets like crypto are often sold first.
- 💸 **Realized losses:** Roughly $8.7 billion in Bitcoin losses were realized in a single week, the second-largest loss event on record after the Three Arrows Capital collapse. That shows how many holders gave up and sold.
- 📉 **Falling volume:** Trading volume dropped about 61% week over week during the worst of the selloff. Thin volume means fewer buyers are willing to step in.
- 😨 **Weak sentiment:** After a big rally, confidence turns to fear quickly once support levels break.
## 🕰️ How Does This Compare to History?
Five weeks is painful, but it is not the worst Bitcoin has seen.
- 🐻 In 2022, Bitcoin had a much longer run of weekly losses. Some reports count nine consecutive weeks between March and May.
- 📅 In 2021, a five-week losing streak from May to June cut the price roughly in half, from about $58,000 to about $29,000. That was a 50% correction.
- 🐂 Streaks also happen in bull markets. Bitcoin has had multi-week losing streaks during every bull market in its history.
So a streak by itself does not prove a bear market. What matters is what the price does next, and how deep the drop goes. 🧩
## 🎯 What Did Analysts Watch?
During the decline, traders focused on key levels. Bitcoin was trading below $67,000 and was down about 50% from its peak. Some technical analysts pointed to the $50,000 to $56,000 zone as a possible target based on larger weekly and monthly patterns. Others noted that Bitcoin has bounced from deep drawdowns before. 🔄
Another point from the analysis: shrinking weekly losses can signal that sellers are running out, which is often a precondition for a reversal. In other words, if each red week is smaller than the last, the selling pressure may be fading. 🌱
## 🛡️ Lessons for Traders and Investors
1. 🧘 **Stay calm.** Emotional selling at the lows is how most people lose money.
2. 📏 **Use risk management.** Position size and stop-losses matter more in a downtrend than any prediction.
3. 🗓️ **Think in time frames.** A weekly streak tells you about the medium term, not tomorrow's move.
4. 🔎 **Watch volume and levels.** A bounce on weak volume is less trustworthy than one with strong buying.
5. 💰 **Avoid leverage.** Streaks like this are when over-leveraged traders get liquidated first.
## 🔮 What Comes Next?
Nobody can say for sure. A losing streak can end with a sharp rebound, or it can be one chapter of a longer slide. 🎢 The reasonable approach is to track the weekly close, key support and resistance, and the broader macro picture, rather than bet on a single outcome.
## ✅ Conclusion
Five weekly losses in a row is a serious signal of weak momentum, but not a verdict on Bitcoin's future. History shows that fear peaks and selling exhaustion often come before recoveries, and also that some downtrends run longer than expected. 📚 The best defense is a plan, discipline, and patience. 🚀
⚠️ *This article is for education only and is not financial advice. Always do your own research.*
**** #Bitcoin 🪙 #CryptoMarket 📉 #BTCAnalysis 📊 #CryptoTrading 💹 #BearMarket 🐻
#AIChipSlumpNasdaq #BinanceReopensWithdrawalsForHYPE&APT #SouthKoreaDraftLawTargets15To20%ShareholderCap #TradFiForBeginners
Sources:
- [Bitcoin's 5-Week Decline Matches 2022 Bear Market Streak](https://www.publish0x.com/cryptotrendseer/bitcoins-five-week-decline-matches-2022-bear-market-streak-xxrvqde)
- [Bitcoin Faces Unprecedented Fifth Month of Losses](https://www.mexc.com/news/833702)
- [Bitcoin Looks for Direction After Four Straight Weekly Losses (Bloomberg)](https://www.bloomberg.com/news/articles/2026-02-16/bitcoin-looks-for-direction-after-four-straight-weekly-losses)
- [Bitcoin Searches for Direction After Fourth Straight Weekly Loss](https://blocklr.pages.dev/news/bitcoin-four-weekly-losses-direction/)
- [Bitcoin Set for First Five-Week Decline Since 2022](https://www.mexc.com/news/748768)
## 🔍 Introduction
In crypto, a single red candle rarely causes panic. A string of them is different. When Bitcoin closed five consecutive weekly candles in the red, traders around the world started asking the same question: is this a healthy pause or the start of something deeper? 🤔
Bitcoin was on track for its fifth straight weekly decline in February 2026, the first streak of this kind since March to May 2022. That alone made it a headline event. Let's look at what happened, why it matters, and what traders can learn from it. 💡
## 📊 What Exactly Happened?
A weekly losing streak means Bitcoin closed lower than it opened for several weeks in a row. Five in a row is rare. Bitcoin had already posted its fourth consecutive weekly loss in mid-February 2026 and struggled to find direction after a weekend rally fizzled. One more red week then completed the five. 😬
The pain was not limited to weekly charts. Bitcoin also recorded five consecutive monthly declines by the end of February 2026, a first in its history, with February alone down about 14.8%. Weekly and monthly weakness together showed that the pressure was broad, not a short-term blip. 📆
## 🧠 Why Did Bitcoin Keep Falling?
No single reason explains a streak like this. Several forces tend to stack up:
- 🌍 **Macro pressure:** When investors move into risk-off mode, speculative assets like crypto are often sold first.
- 💸 **Realized losses:** Roughly $8.7 billion in Bitcoin losses were realized in a single week, the second-largest loss event on record after the Three Arrows Capital collapse. That shows how many holders gave up and sold.
- 📉 **Falling volume:** Trading volume dropped about 61% week over week during the worst of the selloff. Thin volume means fewer buyers are willing to step in.
- 😨 **Weak sentiment:** After a big rally, confidence turns to fear quickly once support levels break.
## 🕰️ How Does This Compare to History?
Five weeks is painful, but it is not the worst Bitcoin has seen.
- 🐻 In 2022, Bitcoin had a much longer run of weekly losses. Some reports count nine consecutive weeks between March and May.
- 📅 In 2021, a five-week losing streak from May to June cut the price roughly in half, from about $58,000 to about $29,000. That was a 50% correction.
- 🐂 Streaks also happen in bull markets. Bitcoin has had multi-week losing streaks during every bull market in its history.
So a streak by itself does not prove a bear market. What matters is what the price does next, and how deep the drop goes. 🧩
## 🎯 What Did Analysts Watch?
During the decline, traders focused on key levels. Bitcoin was trading below $67,000 and was down about 50% from its peak. Some technical analysts pointed to the $50,000 to $56,000 zone as a possible target based on larger weekly and monthly patterns. Others noted that Bitcoin has bounced from deep drawdowns before. 🔄
Another point from the analysis: shrinking weekly losses can signal that sellers are running out, which is often a precondition for a reversal. In other words, if each red week is smaller than the last, the selling pressure may be fading. 🌱
## 🛡️ Lessons for Traders and Investors
1. 🧘 **Stay calm.** Emotional selling at the lows is how most people lose money.
2. 📏 **Use risk management.** Position size and stop-losses matter more in a downtrend than any prediction.
3. 🗓️ **Think in time frames.** A weekly streak tells you about the medium term, not tomorrow's move.
4. 🔎 **Watch volume and levels.** A bounce on weak volume is less trustworthy than one with strong buying.
5. 💰 **Avoid leverage.** Streaks like this are when over-leveraged traders get liquidated first.
## 🔮 What Comes Next?
Nobody can say for sure. A losing streak can end with a sharp rebound, or it can be one chapter of a longer slide. 🎢 The reasonable approach is to track the weekly close, key support and resistance, and the broader macro picture, rather than bet on a single outcome.
## ✅ Conclusion
Five weekly losses in a row is a serious signal of weak momentum, but not a verdict on Bitcoin's future. History shows that fear peaks and selling exhaustion often come before recoveries, and also that some downtrends run longer than expected. 📚 The best defense is a plan, discipline, and patience. 🚀
⚠️ *This article is for education only and is not financial advice. Always do your own research.*
**** #Bitcoin 🪙 #CryptoMarket 📉 #BTCAnalysis 📊 #CryptoTrading 💹 #BearMarket 🐻
#AIChipSlumpNasdaq #BinanceReopensWithdrawalsForHYPE&APT #SouthKoreaDraftLawTargets15To20%ShareholderCap #TradFiForBeginners
Sources:
- [Bitcoin's 5-Week Decline Matches 2022 Bear Market Streak](https://www.publish0x.com/cryptotrendseer/bitcoins-five-week-decline-matches-2022-bear-market-streak-xxrvqde)
- [Bitcoin Faces Unprecedented Fifth Month of Losses](https://www.mexc.com/news/833702)
- [Bitcoin Looks for Direction After Four Straight Weekly Losses (Bloomberg)](https://www.bloomberg.com/news/articles/2026-02-16/bitcoin-looks-for-direction-after-four-straight-weekly-losses)
- [Bitcoin Searches for Direction After Fourth Straight Weekly Loss](https://blocklr.pages.dev/news/bitcoin-four-weekly-losses-direction/)
- [Bitcoin Set for First Five-Week Decline Since 2022](https://www.mexc.com/news/748768)
66

·
--
Bitcoin has now experienced five consecutive weeks of losses, a significant downturn for the flagship cryptocurrency. This prolonged period of negative returns signals a potential shift in market sentiment or highlights prevailing bearish pressures. Investors are closely watching to see if this trend will continue or if a rebound is imminent. The sustained selling pressure suggests that either macroeconomic factors are heavily influencing the market, or specific on-chain metrics are indicating a lack of buying conviction at current levels. Understanding the underlying causes will be crucial for navigating the potential opportunities and risks ahead.
This extended losing streak warrants careful observation of key support levels and potential catalysts for a reversal. The market's reaction to upcoming economic data and any regulatory developments will likely play a pivotal role in shaping Bitcoin's short-term trajectory.
Disclaimer: This is not financial advice. Always do your own research.
#BitcoinFiveWeeklyLosses $BTC
Bitcoin has now experienced five consecutive weeks of losses, a significant downturn for the flagship cryptocurrency. This prolonged period of negative returns signals a potential shift in market sentiment or highlights prevailing bearish pressures. Investors are closely watching to see if this trend will continue or if a rebound is imminent. The sustained selling pressure suggests that either macroeconomic factors are heavily influencing the market, or specific on-chain metrics are indicating a lack of buying conviction at current levels. Understanding the underlying causes will be crucial for navigating the potential opportunities and risks ahead.
This extended losing streak warrants careful observation of key support levels and potential catalysts for a reversal. The market's reaction to upcoming economic data and any regulatory developments will likely play a pivotal role in shaping Bitcoin's short-term trajectory.
Disclaimer: This is not financial advice. Always do your own research.
#BitcoinFiveWeeklyLosses $BTC
This extended losing streak warrants careful observation of key support levels and potential catalysts for a reversal. The market's reaction to upcoming economic data and any regulatory developments will likely play a pivotal role in shaping Bitcoin's short-term trajectory.
Disclaimer: This is not financial advice. Always do your own research.
#BitcoinFiveWeeklyLosses $BTC

31

·
--
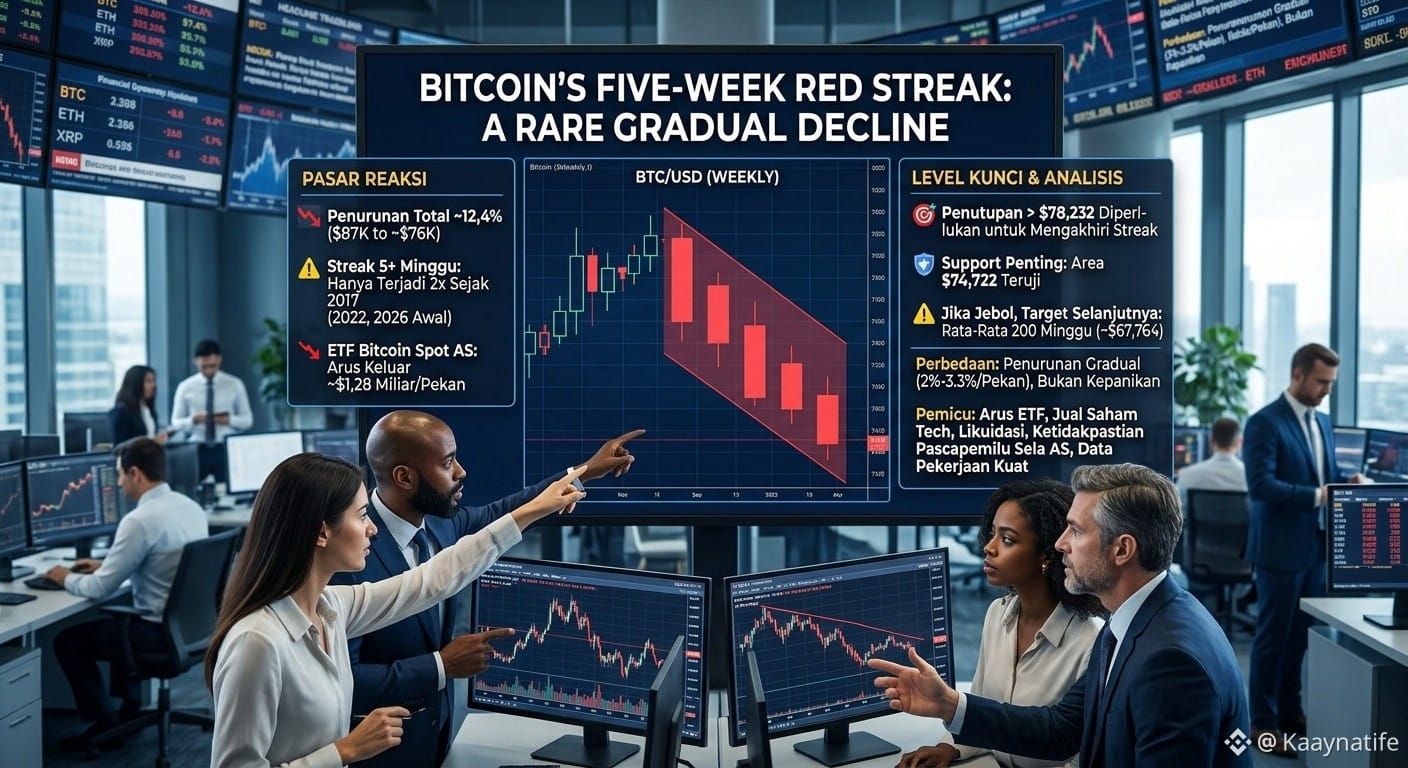
📉 Bitcoin’s Five Consecutive Red Weeks — Rare, But This Downtrend Is Different
What you need to know:
⚠️ $BTC fell from around $87,000 to the $76,000 range over five weeks, down about 12.4% in total
⚠️ A streak of five weeks or more has happened only twice since 2017: in 2022 and early 2026
⚠️ U.S. spot Bitcoin ETFs recorded about $1.28 billion in outflows over one week
✅ The price briefly touched $74,762 on Friday, its lowest since August 21, then recovered to around $76,000
Market reaction?
Key levels this week: a weekly close above $78,232 is needed to end the streak. Below that, the $74,722 area is support being tested. If that support breaks, analysts point to the 200-week average around $67,764 as the next level.
Why is this different from usual?
The early-2026 streak was much more brutal, with weekly declines of up to around 11%. This time, weekly losses have been small, just 2%–3.3% per week. It looks more like a slow, gradual decline than panic selling.
Main drivers:
There’s no single cause. Pressure is coming from ETF outflows, U.S. tech stock sell-offs, liquidations of leveraged positions, and uncertainty following the U.S. midterm elections. The market is also weighing Congress’s more skeptical stance toward crypto, along with strong jobs data that has increased concerns about the direction of interest rates.
Why it matters for crypto:
After a brief rebound following the election, sentiment has weakened again. U.S. inflation data (CPI) is scheduled for November 10 and could be the next catalyst.
{spot}(BTCUSDT)
— testing support, with direction depending on ETF flows and macro data
$ETH
{spot}(ETHUSDT)
— briefly touched a 10-week low
$XRP
{spot}(XRPUSDT)
— among the hardest hit in the latest downturn
History doesn’t automatically repeat itself: the two previous long streaks ended in very different ways. For now, keep an eye on ETF flows and tomorrow’s CPI. 👀
Not investment advice. DYOR.
#bitcoinfiveweeklylosses
#BitcoinWeeklyLosses
📉 Bitcoin’s Five Consecutive Red Weeks — Rare, But This Downtrend Is Different
What you need to know:
⚠️ $BTC fell from around $87,000 to the $76,000 range over five weeks, down about 12.4% in total
⚠️ A streak of five weeks or more has happened only twice since 2017: in 2022 and early 2026
⚠️ U.S. spot Bitcoin ETFs recorded about $1.28 billion in outflows over one week
✅ The price briefly touched $74,762 on Friday, its lowest since August 21, then recovered to around $76,000
Market reaction?
Key levels this week: a weekly close above $78,232 is needed to end the streak. Below that, the $74,722 area is support being tested. If that support breaks, analysts point to the 200-week average around $67,764 as the next level.
Why is this different from usual?
The early-2026 streak was much more brutal, with weekly declines of up to around 11%. This time, weekly losses have been small, just 2%–3.3% per week. It looks more like a slow, gradual decline than panic selling.
Main drivers:
There’s no single cause. Pressure is coming from ETF outflows, U.S. tech stock sell-offs, liquidations of leveraged positions, and uncertainty following the U.S. midterm elections. The market is also weighing Congress’s more skeptical stance toward crypto, along with strong jobs data that has increased concerns about the direction of interest rates.
Why it matters for crypto:
After a brief rebound following the election, sentiment has weakened again. U.S. inflation data (CPI) is scheduled for November 10 and could be the next catalyst.
— testing support, with direction depending on ETF flows and macro data
$ETH
— briefly touched a 10-week low
$XRP
— among the hardest hit in the latest downturn
History doesn’t automatically repeat itself: the two previous long streaks ended in very different ways. For now, keep an eye on ETF flows and tomorrow’s CPI. 👀
Not investment advice. DYOR.
#bitcoinfiveweeklylosses
#BitcoinWeeklyLosses
What you need to know:
⚠️ $BTC fell from around $87,000 to the $76,000 range over five weeks, down about 12.4% in total
⚠️ A streak of five weeks or more has happened only twice since 2017: in 2022 and early 2026
⚠️ U.S. spot Bitcoin ETFs recorded about $1.28 billion in outflows over one week
✅ The price briefly touched $74,762 on Friday, its lowest since August 21, then recovered to around $76,000
Market reaction?
Key levels this week: a weekly close above $78,232 is needed to end the streak. Below that, the $74,722 area is support being tested. If that support breaks, analysts point to the 200-week average around $67,764 as the next level.
Why is this different from usual?
The early-2026 streak was much more brutal, with weekly declines of up to around 11%. This time, weekly losses have been small, just 2%–3.3% per week. It looks more like a slow, gradual decline than panic selling.
Main drivers:
There’s no single cause. Pressure is coming from ETF outflows, U.S. tech stock sell-offs, liquidations of leveraged positions, and uncertainty following the U.S. midterm elections. The market is also weighing Congress’s more skeptical stance toward crypto, along with strong jobs data that has increased concerns about the direction of interest rates.
Why it matters for crypto:
After a brief rebound following the election, sentiment has weakened again. U.S. inflation data (CPI) is scheduled for November 10 and could be the next catalyst.
— testing support, with direction depending on ETF flows and macro data
$ETH
— briefly touched a 10-week low
$XRP
— among the hardest hit in the latest downturn
History doesn’t automatically repeat itself: the two previous long streaks ended in very different ways. For now, keep an eye on ETF flows and tomorrow’s CPI. 👀
Not investment advice. DYOR.
#bitcoinfiveweeklylosses
#BitcoinWeeklyLosses
305

#BitcoinFiveWeeklyLosses Bitcoin’s close in a bearish trend for five consecutive weeks represents an exogenous liquidity shock that is reshaping financing conditions in the interconnected derivatives and spot markets. The persistent contraction in monetary aggregates and the rise in the risk-free rate on U.S. Treasury bonds have substantially increased the cost of carry for quantitative arbitrage desks. This scenario has triggered coordinated deleveraging across consolidated order books, where rising funding rates and shrinking available collateral have forced the preemptive liquidation of long positions in perpetual contracts, temporarily widening the spread between the net asset value and its spot price.
From the perspective of microstructure analysis and the transmission channel of Authorized Participants (*APs*), the sequence of weekly losses has created a temporary asymmetry between the settlement of exchange-traded funds in traditional markets (*T+1*) and the immediate settlement of the underlying digital assets (*T+0*). This operational friction increases counterparty risk during periods of heightened macroeconomic volatility, widening bid-ask spreads and reducing order book depth on major trading platforms. In conclusion, the five-week correction reflects a process of structural rebalancing of systemic risk; in the short to medium term, the compression of the liquidity premium and the absorption of excess supply by institutional investors will lay the groundwork for price stabilization. $BTC $BNB $BCH
#BitcoinFiveWeeklyLosses Bitcoin’s close in a bearish trend for five consecutive weeks represents an exogenous liquidity shock that is reshaping financing conditions in the interconnected derivatives and spot markets. The persistent contraction in monetary aggregates and the rise in the risk-free rate on U.S. Treasury bonds have substantially increased the cost of carry for quantitative arbitrage desks. This scenario has triggered coordinated deleveraging across consolidated order books, where rising funding rates and shrinking available collateral have forced the preemptive liquidation of long positions in perpetual contracts, temporarily widening the spread between the net asset value and its spot price.
From the perspective of microstructure analysis and the transmission channel of Authorized Participants (*APs*), the sequence of weekly losses has created a temporary asymmetry between the settlement of exchange-traded funds in traditional markets (*T+1*) and the immediate settlement of the underlying digital assets (*T+0*). This operational friction increases counterparty risk during periods of heightened macroeconomic volatility, widening bid-ask spreads and reducing order book depth on major trading platforms. In conclusion, the five-week correction reflects a process of structural rebalancing of systemic risk; in the short to medium term, the compression of the liquidity premium and the absorption of excess supply by institutional investors will lay the groundwork for price stabilization. $BTC $BNB $BCH
From the perspective of microstructure analysis and the transmission channel of Authorized Participants (*APs*), the sequence of weekly losses has created a temporary asymmetry between the settlement of exchange-traded funds in traditional markets (*T+1*) and the immediate settlement of the underlying digital assets (*T+0*). This operational friction increases counterparty risk during periods of heightened macroeconomic volatility, widening bid-ask spreads and reducing order book depth on major trading platforms. In conclusion, the five-week correction reflects a process of structural rebalancing of systemic risk; in the short to medium term, the compression of the liquidity premium and the absorption of excess supply by institutional investors will lay the groundwork for price stabilization. $BTC $BNB $BCH
70

·
--
Corporate BTC holdings after five weekly closes lower | Price near the cost basis | Wait for official disclosure before drawing conclusions
My stance is cautious: I don’t treat social media hints from major corporate holders as confirmed buying. The current hot topic on Binance Square is #BitcoinFiveWeeklyLosses; after five consecutive UTC weekly closes lower, the market is naturally watching for Strategy’s next holdings disclosure. The latest report date listed in Strategy’s official ledger is still November 2, with 849327 BTC held at an average purchase cost of about $75451; its official filing that day disclosed an additional 811 BTC. At the time of writing, BTC/USDT on Binance is around $75248, already close to the company’s average book cost. “Near the cost basis” here is simply a comparison of two public figures. It is not a liquidation level that triggers forced selling, nor does it mean the company is about to sell its coins.
What really needs to be separated is expectation from fact. A holdings chart attributed to Saylor has recently circulated in the market, prompting a fresh round of speculation about additional purchases. At most, the image or its caption conveys a personal hint and market expectations. The latest Strategy ledger I’ve found does not yet show an additional amount for November 9, so I won’t write that it “has already bought.” Any subsequent purchase should be verified against company announcements and SEC filings for the amount, price, and funding source. More noteworthy is the company’s October 29 earnings report, which stated that it is authorized to sell some of its Bitcoin for purposes such as dollar reserves, preferred stock dividends, and buybacks, and disclosed cumulative sales of about $431.8 million through that point in 2026. This is a disclosed capital management arrangement; it does not mean the company sold again today. How corporate holdings affect prices depends on the net result of financing, buybacks, sales, and actual coin purchases. It is easy to misread the direction if you focus on a slogan alone.
Fund flows are another reason for me to stay restrained. Farside shows net outflows of about $411.9 million from U.S. spot BTC funds on November 6. That was the previous trading day’s figure; on Monday, it should not be presented as today’s flow. Over the past 24 hours, BTC traded in a Binance range of about $73510 to $76200; it is now around $75248, down about 0.59%. Kraken quoted about $75153 over the same period, confirming that the price is still fluctuating around $75,000. If the price holds above $76200 and fund outflows stop, and a new corporate disclosure confirms net buying, then the hot topic might shift from “weakness continuing” to “funds taking turns stepping in.” If it falls below $73500 again, even corporate buying should not automatically be assumed to provide enough support to reverse the trend.
If I were trading myself, I would stay out for now. I’d only consider a small spot long, with no leverage. I would enter in stages only if official documents confirm additional purchases, the price regains and holds above $76200, and a retest holds, using no more than 3% of my total capital. I’d first target $78000 and take half off there, with the remainder targeting $79500. If the daily close falls below $74900 after entry, I’d stop out. I’d also end the plan proactively if the disclosure turns out to be an old holdings chart, fund outflows continue, or there is no follow-through in volume within three days. If the conditions aren’t met, I’ll stay in cash. I won’t describe waiting as a trade, and I won’t add to a position based on rumors.
#BitcoinFiveWeeklyLosses #BTC
The above is solely my personal market observation and does not constitute investment advice.
Corporate BTC holdings after five weekly closes lower | Price near the cost basis | Wait for official disclosure before drawing conclusions
My stance is cautious: I don’t treat social media hints from major corporate holders as confirmed buying. The current hot topic on Binance Square is #BitcoinFiveWeeklyLosses; after five consecutive UTC weekly closes lower, the market is naturally watching for Strategy’s next holdings disclosure. The latest report date listed in Strategy’s official ledger is still November 2, with 849327 BTC held at an average purchase cost of about $75451; its official filing that day disclosed an additional 811 BTC. At the time of writing, BTC/USDT on Binance is around $75248, already close to the company’s average book cost. “Near the cost basis” here is simply a comparison of two public figures. It is not a liquidation level that triggers forced selling, nor does it mean the company is about to sell its coins.
What really needs to be separated is expectation from fact. A holdings chart attributed to Saylor has recently circulated in the market, prompting a fresh round of speculation about additional purchases. At most, the image or its caption conveys a personal hint and market expectations. The latest Strategy ledger I’ve found does not yet show an additional amount for November 9, so I won’t write that it “has already bought.” Any subsequent purchase should be verified against company announcements and SEC filings for the amount, price, and funding source. More noteworthy is the company’s October 29 earnings report, which stated that it is authorized to sell some of its Bitcoin for purposes such as dollar reserves, preferred stock dividends, and buybacks, and disclosed cumulative sales of about $431.8 million through that point in 2026. This is a disclosed capital management arrangement; it does not mean the company sold again today. How corporate holdings affect prices depends on the net result of financing, buybacks, sales, and actual coin purchases. It is easy to misread the direction if you focus on a slogan alone.
Fund flows are another reason for me to stay restrained. Farside shows net outflows of about $411.9 million from U.S. spot BTC funds on November 6. That was the previous trading day’s figure; on Monday, it should not be presented as today’s flow. Over the past 24 hours, BTC traded in a Binance range of about $73510 to $76200; it is now around $75248, down about 0.59%. Kraken quoted about $75153 over the same period, confirming that the price is still fluctuating around $75,000. If the price holds above $76200 and fund outflows stop, and a new corporate disclosure confirms net buying, then the hot topic might shift from “weakness continuing” to “funds taking turns stepping in.” If it falls below $73500 again, even corporate buying should not automatically be assumed to provide enough support to reverse the trend.
If I were trading myself, I would stay out for now. I’d only consider a small spot long, with no leverage. I would enter in stages only if official documents confirm additional purchases, the price regains and holds above $76200, and a retest holds, using no more than 3% of my total capital. I’d first target $78000 and take half off there, with the remainder targeting $79500. If the daily close falls below $74900 after entry, I’d stop out. I’d also end the plan proactively if the disclosure turns out to be an old holdings chart, fund outflows continue, or there is no follow-through in volume within three days. If the conditions aren’t met, I’ll stay in cash. I won’t describe waiting as a trade, and I won’t add to a position based on rumors.
#BitcoinFiveWeeklyLosses #BTC
The above is solely my personal market observation and does not constitute investment advice.
My stance is cautious: I don’t treat social media hints from major corporate holders as confirmed buying. The current hot topic on Binance Square is #BitcoinFiveWeeklyLosses; after five consecutive UTC weekly closes lower, the market is naturally watching for Strategy’s next holdings disclosure. The latest report date listed in Strategy’s official ledger is still November 2, with 849327 BTC held at an average purchase cost of about $75451; its official filing that day disclosed an additional 811 BTC. At the time of writing, BTC/USDT on Binance is around $75248, already close to the company’s average book cost. “Near the cost basis” here is simply a comparison of two public figures. It is not a liquidation level that triggers forced selling, nor does it mean the company is about to sell its coins.
What really needs to be separated is expectation from fact. A holdings chart attributed to Saylor has recently circulated in the market, prompting a fresh round of speculation about additional purchases. At most, the image or its caption conveys a personal hint and market expectations. The latest Strategy ledger I’ve found does not yet show an additional amount for November 9, so I won’t write that it “has already bought.” Any subsequent purchase should be verified against company announcements and SEC filings for the amount, price, and funding source. More noteworthy is the company’s October 29 earnings report, which stated that it is authorized to sell some of its Bitcoin for purposes such as dollar reserves, preferred stock dividends, and buybacks, and disclosed cumulative sales of about $431.8 million through that point in 2026. This is a disclosed capital management arrangement; it does not mean the company sold again today. How corporate holdings affect prices depends on the net result of financing, buybacks, sales, and actual coin purchases. It is easy to misread the direction if you focus on a slogan alone.
Fund flows are another reason for me to stay restrained. Farside shows net outflows of about $411.9 million from U.S. spot BTC funds on November 6. That was the previous trading day’s figure; on Monday, it should not be presented as today’s flow. Over the past 24 hours, BTC traded in a Binance range of about $73510 to $76200; it is now around $75248, down about 0.59%. Kraken quoted about $75153 over the same period, confirming that the price is still fluctuating around $75,000. If the price holds above $76200 and fund outflows stop, and a new corporate disclosure confirms net buying, then the hot topic might shift from “weakness continuing” to “funds taking turns stepping in.” If it falls below $73500 again, even corporate buying should not automatically be assumed to provide enough support to reverse the trend.
If I were trading myself, I would stay out for now. I’d only consider a small spot long, with no leverage. I would enter in stages only if official documents confirm additional purchases, the price regains and holds above $76200, and a retest holds, using no more than 3% of my total capital. I’d first target $78000 and take half off there, with the remainder targeting $79500. If the daily close falls below $74900 after entry, I’d stop out. I’d also end the plan proactively if the disclosure turns out to be an old holdings chart, fund outflows continue, or there is no follow-through in volume within three days. If the conditions aren’t met, I’ll stay in cash. I won’t describe waiting as a trade, and I won’t add to a position based on rumors.
#BitcoinFiveWeeklyLosses #BTC
The above is solely my personal market observation and does not constitute investment advice.

4

·
--
Article
Bitcoin’s five consecutive weekly losses: First confirm that the weekly downtrend has stopped; don’t mistake an intraday rebound for a reversalBitcoin’s five consecutive weekly losses: First confirm that the weekly downtrend has stopped; don’t mistake an intraday rebound for a reversal
On the morning of November 9, Beijing time, `#BitcoinFiveWeeklyLosses` appeared at No. 1 on Binance Square’s Trending list, with the page showing 81 people discussing it. The value of this topic isn’t in framing “five consecutive weekly losses” as a guarantee of a rebound, but in reminding us that Bitcoin has weakened for five consecutive fully closed weekly candles. The more important question now is whether selling pressure has truly stopped—not whether the intraday price has returned to a round-number level that would let us declare a reversal.
First, let’s clarify the timeframe. As of 08:00 Beijing time on November 9, the closing prices of the five most recent fully completed BTCUSDT weekly candles were approximately 83,773.12, 82,116.00, 80,154.09, 78,354.00, and 74,851.44 USDT, corresponding to weekly declines of approximately -1.98%, -2.39%, -2.24%, and -4.47% (calculated starting from the second candle). The new weekly candle that began after 08:00 on November 9 is still in progress, so it should not be counted prematurely as part of “five consecutive weekly losses,” nor should this week’s intraday performance be treated as a weekly conclusion.
Bitcoin’s five consecutive weekly losses: First confirm that the weekly downtrend has stopped; don’t mistake an intraday rebound for a reversal
Bitcoin’s five consecutive weekly losses: First confirm that the weekly downtrend has stopped; don’t mistake an intraday rebound for a reversal
On the morning of November 9, Beijing time, `#BitcoinFiveWeeklyLosses` appeared at No. 1 on Binance Square’s Trending list, with the page showing 81 people discussing it. The value of this topic isn’t in framing “five consecutive weekly losses” as a guarantee of a rebound, but in reminding us that Bitcoin has weakened for five consecutive fully closed weekly candles. The more important question now is whether selling pressure has truly stopped—not whether the intraday price has returned to a round-number level that would let us declare a reversal.
First, let’s clarify the timeframe. As of 08:00 Beijing time on November 9, the closing prices of the five most recent fully completed BTCUSDT weekly candles were approximately 83,773.12, 82,116.00, 80,154.09, 78,354.00, and 74,851.44 USDT, corresponding to weekly declines of approximately -1.98%, -2.39%, -2.24%, and -4.47% (calculated starting from the second candle). The new weekly candle that began after 08:00 on November 9 is still in progress, so it should not be counted prematurely as part of “five consecutive weekly losses,” nor should this week’s intraday performance be treated as a weekly conclusion.
On the morning of November 9, Beijing time, `#BitcoinFiveWeeklyLosses` appeared at No. 1 on Binance Square’s Trending list, with the page showing 81 people discussing it. The value of this topic isn’t in framing “five consecutive weekly losses” as a guarantee of a rebound, but in reminding us that Bitcoin has weakened for five consecutive fully closed weekly candles. The more important question now is whether selling pressure has truly stopped—not whether the intraday price has returned to a round-number level that would let us declare a reversal.
First, let’s clarify the timeframe. As of 08:00 Beijing time on November 9, the closing prices of the five most recent fully completed BTCUSDT weekly candles were approximately 83,773.12, 82,116.00, 80,154.09, 78,354.00, and 74,851.44 USDT, corresponding to weekly declines of approximately -1.98%, -2.39%, -2.24%, and -4.47% (calculated starting from the second candle). The new weekly candle that began after 08:00 on November 9 is still in progress, so it should not be counted prematurely as part of “five consecutive weekly losses,” nor should this week’s intraday performance be treated as a weekly conclusion.
73

·
--
At $73,708, Bitcoin hit its lowest level since August. It fell nearly 3% in an hour during Sunday’s overnight session, with about $856 million in liquidations across the crypto market over 24 hours. Long positions were wiped out overnight.
This drop wasn’t driven by a single negative factor: after the midterm elections, Democrats took control of both chambers, raising market concerns about tighter regulation. Bitcoin also fell below the $75,700 cost basis for short-term holders and lost its 50-week moving average. It opened the week at $78,232, and if it closes lower, that would mark five straight down weeks and a weekly loss of about 5%.
I think the key isn’t the $73,708 figure, but the 200-day moving average at $73,200. If it holds, this could still be seen as an emotional oversold dip. If it breaks, the rebound structure is invalidated, and bears will be looking directly at $70,000.
October CPI at 21:30 on Tuesday is the next test. First, let’s see how U.S. stocks open tonight.
Are you betting the 200-day moving average will hold, or break?
$BTC
#BitcoinFiveWeeklyLosses #BTC
At $73,708, Bitcoin hit its lowest level since August. It fell nearly 3% in an hour during Sunday’s overnight session, with about $856 million in liquidations across the crypto market over 24 hours. Long positions were wiped out overnight.
This drop wasn’t driven by a single negative factor: after the midterm elections, Democrats took control of both chambers, raising market concerns about tighter regulation. Bitcoin also fell below the $75,700 cost basis for short-term holders and lost its 50-week moving average. It opened the week at $78,232, and if it closes lower, that would mark five straight down weeks and a weekly loss of about 5%.
I think the key isn’t the $73,708 figure, but the 200-day moving average at $73,200. If it holds, this could still be seen as an emotional oversold dip. If it breaks, the rebound structure is invalidated, and bears will be looking directly at $70,000.
October CPI at 21:30 on Tuesday is the next test. First, let’s see how U.S. stocks open tonight.
Are you betting the 200-day moving average will hold, or break?
$BTC
#BitcoinFiveWeeklyLosses #BTC
This drop wasn’t driven by a single negative factor: after the midterm elections, Democrats took control of both chambers, raising market concerns about tighter regulation. Bitcoin also fell below the $75,700 cost basis for short-term holders and lost its 50-week moving average. It opened the week at $78,232, and if it closes lower, that would mark five straight down weeks and a weekly loss of about 5%.
I think the key isn’t the $73,708 figure, but the 200-day moving average at $73,200. If it holds, this could still be seen as an emotional oversold dip. If it breaks, the rebound structure is invalidated, and bears will be looking directly at $70,000.
October CPI at 21:30 on Tuesday is the next test. First, let’s see how U.S. stocks open tonight.
Are you betting the 200-day moving average will hold, or break?
$BTC
#BitcoinFiveWeeklyLosses #BTC
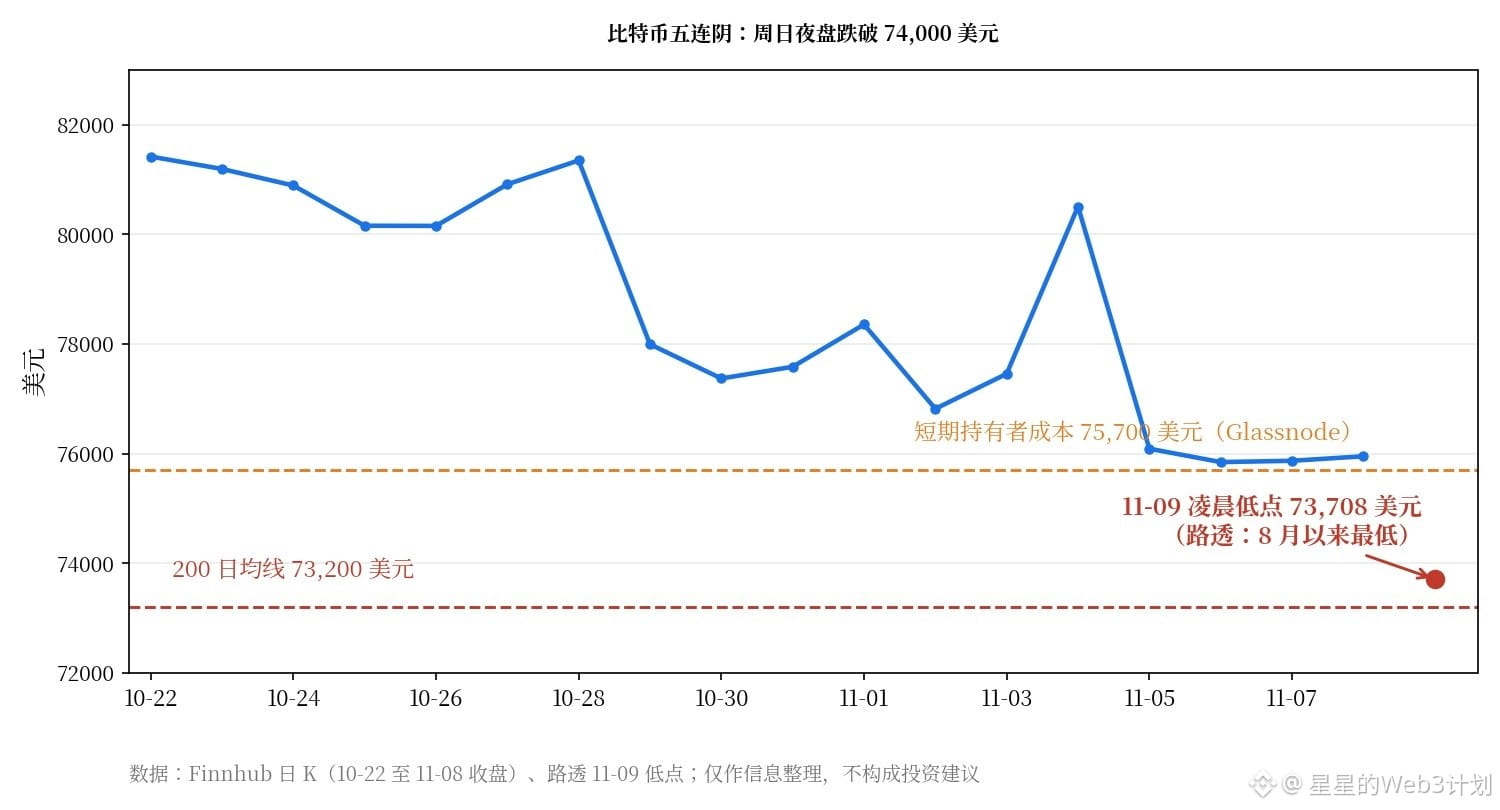
68

·
--
Bitcoin has declined for five consecutive weeks, falling below the $30,000 mark as market sentiment remains subdued. I believe this is mainly due to persistent global inflationary pressures and central banks tightening monetary policy. According to CoinDesk, U.S. CPI data came in below expectations, intensifying investors’ concerns about a recession and further weighing on the prices of Bitcoin and other cryptocurrencies. Although Bitcoin has the potential to hedge against inflation, the short-term risks appear considerable. Investors are advised to proceed with caution and manage their position sizes. #BitcoinFiveWeeklyLosses
$BTC
Bitcoin has declined for five consecutive weeks, falling below the $30,000 mark as market sentiment remains subdued. I believe this is mainly due to persistent global inflationary pressures and central banks tightening monetary policy. According to CoinDesk, U.S. CPI data came in below expectations, intensifying investors’ concerns about a recession and further weighing on the prices of Bitcoin and other cryptocurrencies. Although Bitcoin has the potential to hedge against inflation, the short-term risks appear considerable. Investors are advised to proceed with caution and manage their position sizes. #BitcoinFiveWeeklyLosses
$BTC
$BTC
74
#BitcoinFiveWeeklyLosses Bitcoin’s accumulation of five consecutive weekly candles in negative territory constitutes the longest-lasting bearish streak of the current cycle, reflecting a sustained contraction in global liquidity and persistently tighter credit conditions. This prolonged correction is driven by the confluence of unexpectedly firm U.S. inflation indicators, a rebound in long-term U.S. Treasury yields, and the resulting reassessment of expectations for Federal Reserve interest rate cuts. The gradual liquidation of leveraged positions in equity and digital asset derivatives markets has increased the cost of carry for market participants, prompting a defensive rotation of capital into fiat collateral and low-beta fixed-income assets.$BNB
From the perspective of market microstructure analysis and financial transmission channels, the five-week sequence of losses has widened bid-ask spreads in consolidated order books, eroding market depth at key support levels. Authorized Participants (*APs*) and quantitative arbitrage desks have adjusted their primary creation and redemption models for shares in exchange-traded vehicles (*spot ETFs*), absorbing capital outflows by widening liquidity premiums and contracting their operating balance sheets. In conclusion, Bitcoin’s cumulative decline this month represents a severe price-discovery process that eliminates excessive credit expansion; in the short to medium term, the stabilization of monetary aggregates and a reduction in implied volatility will restore predictability to strategic capital allocation.$BTC $ETH
#BitcoinFiveWeeklyLosses Bitcoin’s accumulation of five consecutive weekly candles in negative territory constitutes the longest-lasting bearish streak of the current cycle, reflecting a sustained contraction in global liquidity and persistently tighter credit conditions. This prolonged correction is driven by the confluence of unexpectedly firm U.S. inflation indicators, a rebound in long-term U.S. Treasury yields, and the resulting reassessment of expectations for Federal Reserve interest rate cuts. The gradual liquidation of leveraged positions in equity and digital asset derivatives markets has increased the cost of carry for market participants, prompting a defensive rotation of capital into fiat collateral and low-beta fixed-income assets.$BNB
From the perspective of market microstructure analysis and financial transmission channels, the five-week sequence of losses has widened bid-ask spreads in consolidated order books, eroding market depth at key support levels. Authorized Participants (*APs*) and quantitative arbitrage desks have adjusted their primary creation and redemption models for shares in exchange-traded vehicles (*spot ETFs*), absorbing capital outflows by widening liquidity premiums and contracting their operating balance sheets. In conclusion, Bitcoin’s cumulative decline this month represents a severe price-discovery process that eliminates excessive credit expansion; in the short to medium term, the stabilization of monetary aggregates and a reduction in implied volatility will restore predictability to strategic capital allocation.$BTC $ETH
From the perspective of market microstructure analysis and financial transmission channels, the five-week sequence of losses has widened bid-ask spreads in consolidated order books, eroding market depth at key support levels. Authorized Participants (*APs*) and quantitative arbitrage desks have adjusted their primary creation and redemption models for shares in exchange-traded vehicles (*spot ETFs*), absorbing capital outflows by widening liquidity premiums and contracting their operating balance sheets. In conclusion, Bitcoin’s cumulative decline this month represents a severe price-discovery process that eliminates excessive credit expansion; in the short to medium term, the stabilization of monetary aggregates and a reduction in implied volatility will restore predictability to strategic capital allocation.$BTC $ETH

101

$BTC Sell Everyone Big DownFull #BitcoinFiveWeeklyLosses
$BTC Sell Everyone Big DownFull #BitcoinFiveWeeklyLosses
Log in to explore more content
Join global crypto users on Binance Square
⚡️ Get latest and useful information about crypto.
💬 Trusted by the world’s largest crypto exchange.
👍 Discover real insights from verified creators.
Email / Phone number
Trending Topics
1
#BitcoinFiveWeeklyLosses
3,059 views
222 Discussing
2
#AIChipSlumpNasdaq
2,219 views
117 Discussing
3
#NvidiaInvestigatesAfterHuang’sAffairApology
786 views
34 Discussing
4
#BinanceReopensWithdrawalsForHYPE&APT
152,021 views
1,194 Discussing
5
#SouthKoreaDraftLawTargets15To20%ShareholderCap
152,712 views
795 Discussing
6
#TradFiForBeginners
225,121 views
2,039 Discussing
7
#KeplrAdvisesSocialLoginUsersToTransferAssets
71,098 views
600 Discussing
8
#TetherPlans€28.8MForJuventusCapitalIncrease
54,132 views
447 Discussing
9
#JobsReportRaisesHikeOdds
971,128 views
4,551 Discussing
10
#CPITestsDecemberRateOutlook
432,913 views
1,979 Discussing