
#wyckoff
wyckoff
184,141 views
386 Discussing
Hot
Latest

·
--
$FIL JUST ENTERED THE DANGER ZONE.
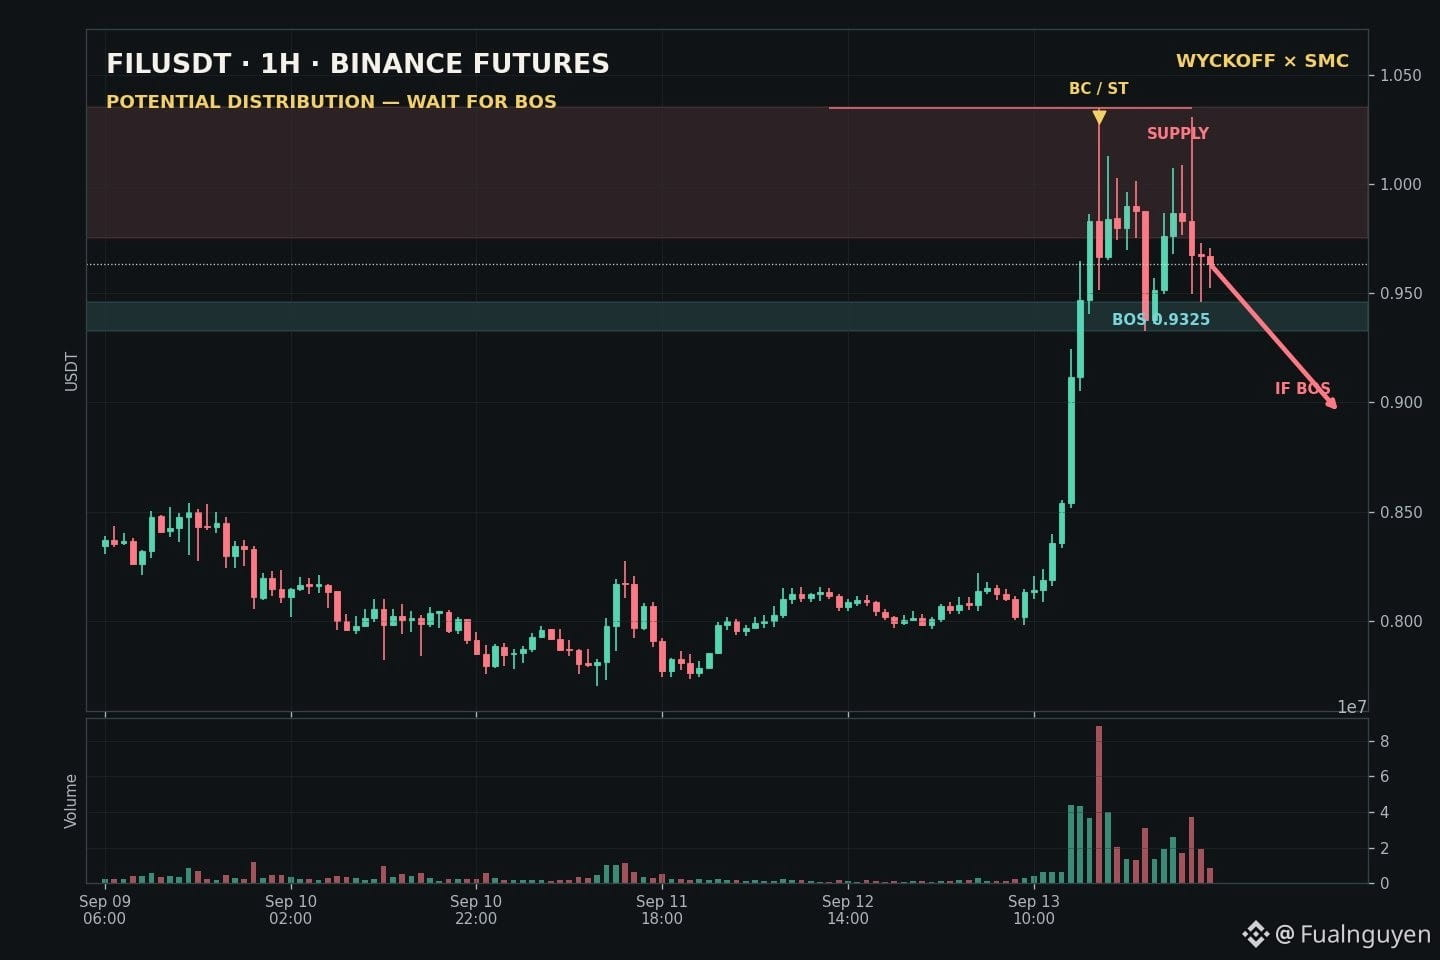
FILUSDT Futures exploded from roughly $0.80 into $1.03, but the H1 structure now looks less like a clean breakout and more like a potential Wyckoff distribution.
The buying climax printed near $1.0347 with the largest volume expansion in the sample. Price then rejected sharply to $0.9325, recovered, and tested the highs again—but failed to establish acceptance above the original peak.
From an SMC perspective, $0.975–$1.035 is now the key supply zone. The latest CLOSED H1 candle finished at $0.9633, below that supply, while momentum cooled.
But this is the important part: the bearish move is NOT confirmed yet.
My trigger is an H1 close below $0.9325. That would confirm a bearish BOS and open the path toward $0.90, followed by the $0.855–$0.82 breakout base where the imbalance began.
The invalidation is equally clear: an H1 close and acceptance above $1.035 would break the distribution thesis and put price discovery back on the table.
Current decision: WAIT — do not chase the pump, and do not front-run the breakdown.
Smart Money often creates maximum excitement near the exact area where risk quietly changes hands.
Which level breaks first: $1.035 or $0.9325? 👀
Paper analysis only. Not financial advice.
#FIL #Wyckoff #SMC
$FIL JUST ENTERED THE DANGER ZONE.
FILUSDT Futures exploded from roughly $0.80 into $1.03, but the H1 structure now looks less like a clean breakout and more like a potential Wyckoff distribution.
The buying climax printed near $1.0347 with the largest volume expansion in the sample. Price then rejected sharply to $0.9325, recovered, and tested the highs again—but failed to establish acceptance above the original peak.
From an SMC perspective, $0.975–$1.035 is now the key supply zone. The latest CLOSED H1 candle finished at $0.9633, below that supply, while momentum cooled.
But this is the important part: the bearish move is NOT confirmed yet.
My trigger is an H1 close below $0.9325. That would confirm a bearish BOS and open the path toward $0.90, followed by the $0.855–$0.82 breakout base where the imbalance began.
The invalidation is equally clear: an H1 close and acceptance above $1.035 would break the distribution thesis and put price discovery back on the table.
Current decision: WAIT — do not chase the pump, and do not front-run the breakdown.
Smart Money often creates maximum excitement near the exact area where risk quietly changes hands.
Which level breaks first: $1.035 or $0.9325? 👀
Paper analysis only. Not financial advice.
#FIL #Wyckoff #SMC
FILUSDT Futures exploded from roughly $0.80 into $1.03, but the H1 structure now looks less like a clean breakout and more like a potential Wyckoff distribution.
The buying climax printed near $1.0347 with the largest volume expansion in the sample. Price then rejected sharply to $0.9325, recovered, and tested the highs again—but failed to establish acceptance above the original peak.
From an SMC perspective, $0.975–$1.035 is now the key supply zone. The latest CLOSED H1 candle finished at $0.9633, below that supply, while momentum cooled.
But this is the important part: the bearish move is NOT confirmed yet.
My trigger is an H1 close below $0.9325. That would confirm a bearish BOS and open the path toward $0.90, followed by the $0.855–$0.82 breakout base where the imbalance began.
The invalidation is equally clear: an H1 close and acceptance above $1.035 would break the distribution thesis and put price discovery back on the table.
Current decision: WAIT — do not chase the pump, and do not front-run the breakdown.
Smart Money often creates maximum excitement near the exact area where risk quietly changes hands.
Which level breaks first: $1.035 or $0.9325? 👀
Paper analysis only. Not financial advice.
#FIL #Wyckoff #SMC
1
3
1.9k
·
--
THE MARKET JUST SWEPT $SUI — BUT THIS IS NOT A BUY SIGNAL YET.
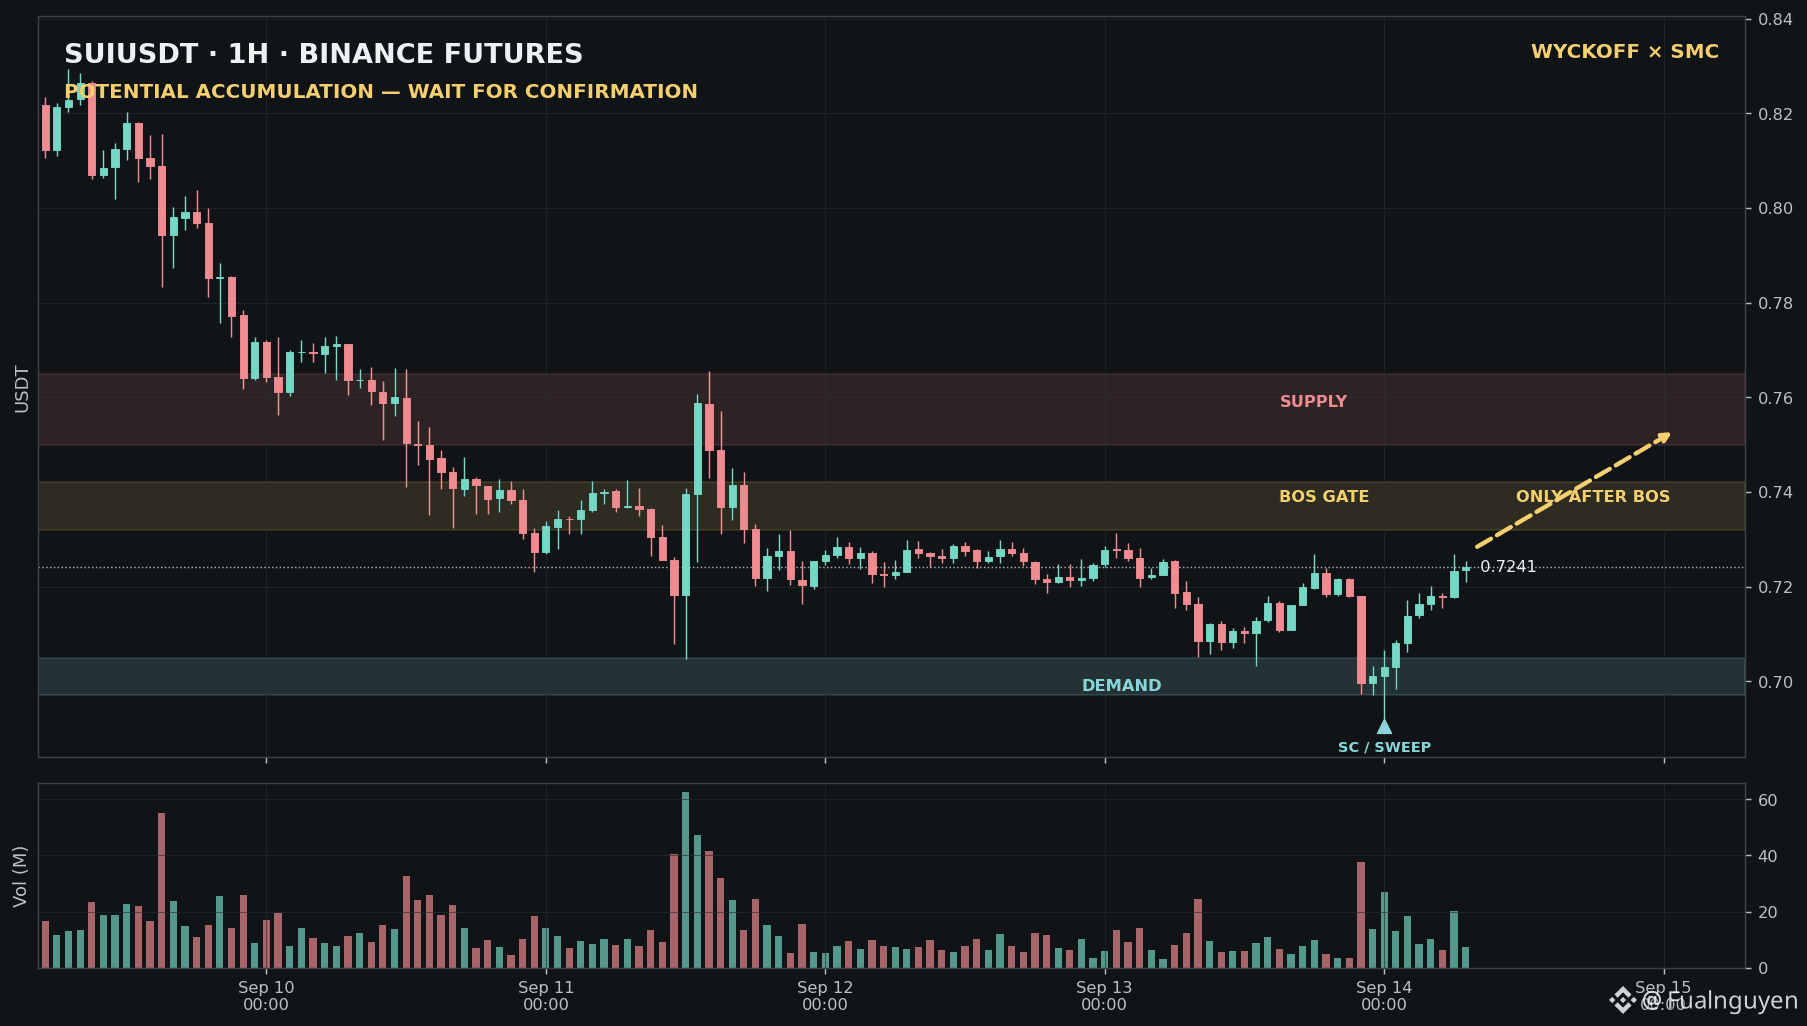
SUIUSDT H1 Futures has printed what may become a Wyckoff accumulation structure after an aggressive sell-off.
Price swept liquidity into $0.692, produced a sharp reaction, and recovered to a confirmed closed-candle price of $0.7241. In Wyckoff terms, that low may be acting as a Selling Climax or Spring candidate. In SMC terms, buyers have reclaimed nearby demand—but the larger bearish structure has not been fully broken.
The confirmation gate is clear:
🟢 An H1 close above $0.732–$0.742, followed by a successful retest, would confirm BOS and expose the $0.750–$0.765 supply zone.
🟡 Holding above $0.697–$0.705 keeps the accumulation thesis alive, but without BOS this remains WATCH—not TRADE READY.
🔴 A decisive H1 close below $0.692 invalidates the recovery thesis and raises the probability of markdown continuation.
The trap here is buying the bounce before confirmation—or shorting directly into recovered demand.
Smart Money may have tested the sell-side liquidity. Now I want proof that buyers can take control of structure.
Which happens first: BOS above $0.742 or another sweep below $0.692? 👀
Paper analysis only. Not financial advice.
#SUI #Wyckoff #SMC
THE MARKET JUST SWEPT $SUI — BUT THIS IS NOT A BUY SIGNAL YET.
SUIUSDT H1 Futures has printed what may become a Wyckoff accumulation structure after an aggressive sell-off.
Price swept liquidity into $0.692, produced a sharp reaction, and recovered to a confirmed closed-candle price of $0.7241. In Wyckoff terms, that low may be acting as a Selling Climax or Spring candidate. In SMC terms, buyers have reclaimed nearby demand—but the larger bearish structure has not been fully broken.
The confirmation gate is clear:
🟢 An H1 close above $0.732–$0.742, followed by a successful retest, would confirm BOS and expose the $0.750–$0.765 supply zone.
🟡 Holding above $0.697–$0.705 keeps the accumulation thesis alive, but without BOS this remains WATCH—not TRADE READY.
🔴 A decisive H1 close below $0.692 invalidates the recovery thesis and raises the probability of markdown continuation.
The trap here is buying the bounce before confirmation—or shorting directly into recovered demand.
Smart Money may have tested the sell-side liquidity. Now I want proof that buyers can take control of structure.
Which happens first: BOS above $0.742 or another sweep below $0.692? 👀
Paper analysis only. Not financial advice.
#SUI #Wyckoff #SMC
SUIUSDT H1 Futures has printed what may become a Wyckoff accumulation structure after an aggressive sell-off.
Price swept liquidity into $0.692, produced a sharp reaction, and recovered to a confirmed closed-candle price of $0.7241. In Wyckoff terms, that low may be acting as a Selling Climax or Spring candidate. In SMC terms, buyers have reclaimed nearby demand—but the larger bearish structure has not been fully broken.
The confirmation gate is clear:
🟢 An H1 close above $0.732–$0.742, followed by a successful retest, would confirm BOS and expose the $0.750–$0.765 supply zone.
🟡 Holding above $0.697–$0.705 keeps the accumulation thesis alive, but without BOS this remains WATCH—not TRADE READY.
🔴 A decisive H1 close below $0.692 invalidates the recovery thesis and raises the probability of markdown continuation.
The trap here is buying the bounce before confirmation—or shorting directly into recovered demand.
Smart Money may have tested the sell-side liquidity. Now I want proof that buyers can take control of structure.
Which happens first: BOS above $0.742 or another sweep below $0.692? 👀
Paper analysis only. Not financial advice.
#SUI #Wyckoff #SMC
Kmay2ts:
Hello Fual, e ko còn dùng tl kia nữa, có 1 số vấn đề bên square cần sự giup đỡ của anh, nếu có thể a kết nối lại với tl mới của em nha : @kmayyyy . Thank kiu anh
5
2
2.4k
·
--
$DOGE is bouncing—but the H1 structure has not escaped its potential distribution yet.
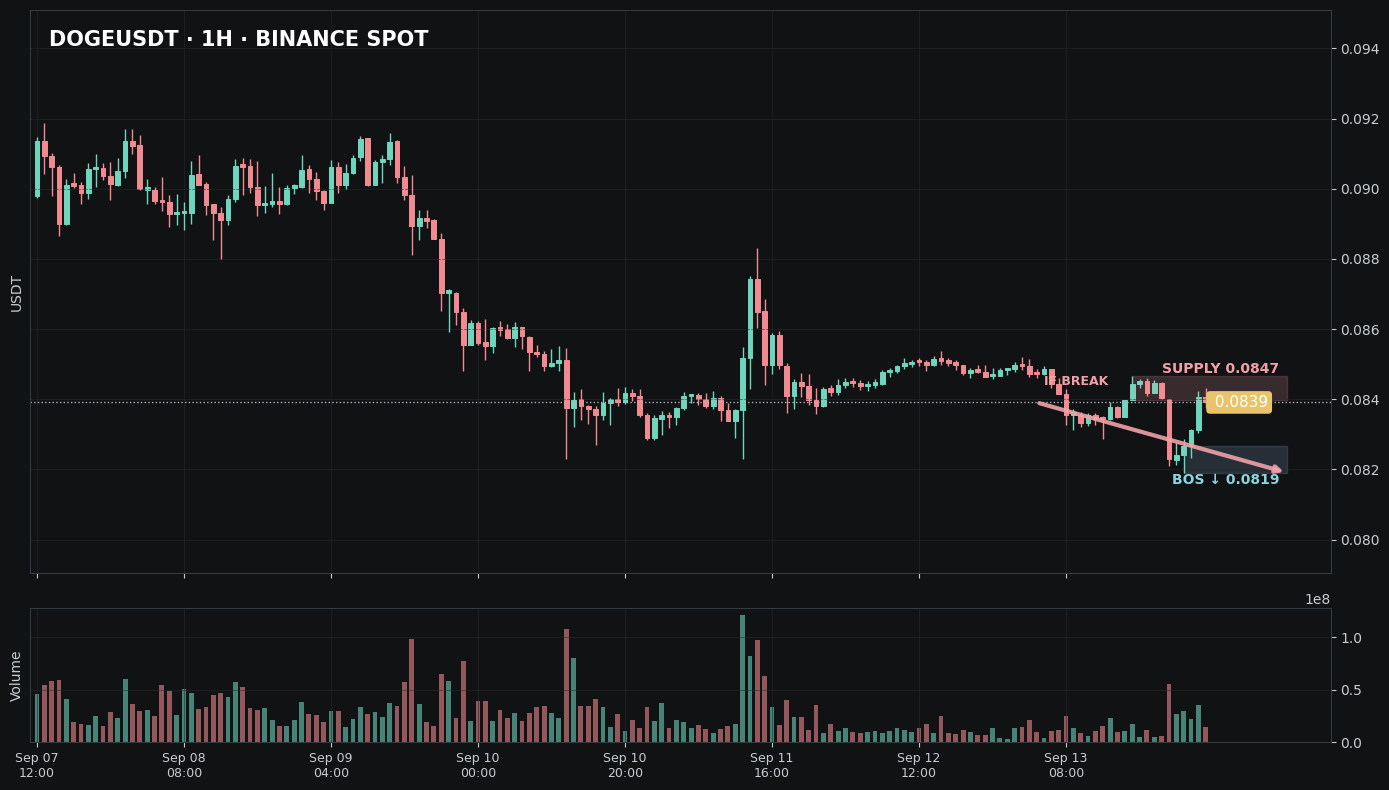
After failing near $0.091–$0.092, price expanded lower and began printing a sequence of weaker recoveries. The latest rebound from $0.08191 is strong enough to attract attention, but it is now pushing directly into the $0.08466 supply and swing-high barrier.
This is where traders usually get trapped: buying the bounce before the structure confirms the reversal.
My Wyckoff–SMC map:
🔴 H1 rejection below $0.08466 followed by a close under $0.08191 = bearish BOS and potential markdown continuation
🟡 Price trapped between $0.08191 and $0.08466 = NO TRADE; liquidity is still being built on both sides
🟢 H1 close and acceptance above $0.08466 = bearish thesis invalidated, with room to attack higher liquidity around $0.0860–$0.0875
The current close near $0.08391 sits almost exactly between confirmation and invalidation.
That means I am not chasing direction here.
For Spot, the safer play is to wait for DOGE to reclaim supply before considering a buy. If the weak low breaks first, the agent stays in AVOID_BUY mode rather than trying to catch a falling knife.
The next move could be fast—but the level that breaks first matters more than the prediction.
Which side gets taken first: $0.08466 or $0.08191? 👀
#DOGE #Wyckoff #SMC
Based on closed Binance Spot H1 candles. Not financial advice.
$DOGE is bouncing—but the H1 structure has not escaped its potential distribution yet.
After failing near $0.091–$0.092, price expanded lower and began printing a sequence of weaker recoveries. The latest rebound from $0.08191 is strong enough to attract attention, but it is now pushing directly into the $0.08466 supply and swing-high barrier.
This is where traders usually get trapped: buying the bounce before the structure confirms the reversal.
My Wyckoff–SMC map:
🔴 H1 rejection below $0.08466 followed by a close under $0.08191 = bearish BOS and potential markdown continuation
🟡 Price trapped between $0.08191 and $0.08466 = NO TRADE; liquidity is still being built on both sides
🟢 H1 close and acceptance above $0.08466 = bearish thesis invalidated, with room to attack higher liquidity around $0.0860–$0.0875
The current close near $0.08391 sits almost exactly between confirmation and invalidation.
That means I am not chasing direction here.
For Spot, the safer play is to wait for DOGE to reclaim supply before considering a buy. If the weak low breaks first, the agent stays in AVOID_BUY mode rather than trying to catch a falling knife.
The next move could be fast—but the level that breaks first matters more than the prediction.
Which side gets taken first: $0.08466 or $0.08191? 👀
#DOGE #Wyckoff #SMC
Based on closed Binance Spot H1 candles. Not financial advice.
After failing near $0.091–$0.092, price expanded lower and began printing a sequence of weaker recoveries. The latest rebound from $0.08191 is strong enough to attract attention, but it is now pushing directly into the $0.08466 supply and swing-high barrier.
This is where traders usually get trapped: buying the bounce before the structure confirms the reversal.
My Wyckoff–SMC map:
🔴 H1 rejection below $0.08466 followed by a close under $0.08191 = bearish BOS and potential markdown continuation
🟡 Price trapped between $0.08191 and $0.08466 = NO TRADE; liquidity is still being built on both sides
🟢 H1 close and acceptance above $0.08466 = bearish thesis invalidated, with room to attack higher liquidity around $0.0860–$0.0875
The current close near $0.08391 sits almost exactly between confirmation and invalidation.
That means I am not chasing direction here.
For Spot, the safer play is to wait for DOGE to reclaim supply before considering a buy. If the weak low breaks first, the agent stays in AVOID_BUY mode rather than trying to catch a falling knife.
The next move could be fast—but the level that breaks first matters more than the prediction.
Which side gets taken first: $0.08466 or $0.08191? 👀
#DOGE #Wyckoff #SMC
Based on closed Binance Spot H1 candles. Not financial advice.
1
2
1.2k
·
--
$ZEC is trying to bounce—but the H1 structure still looks like a potential distribution.
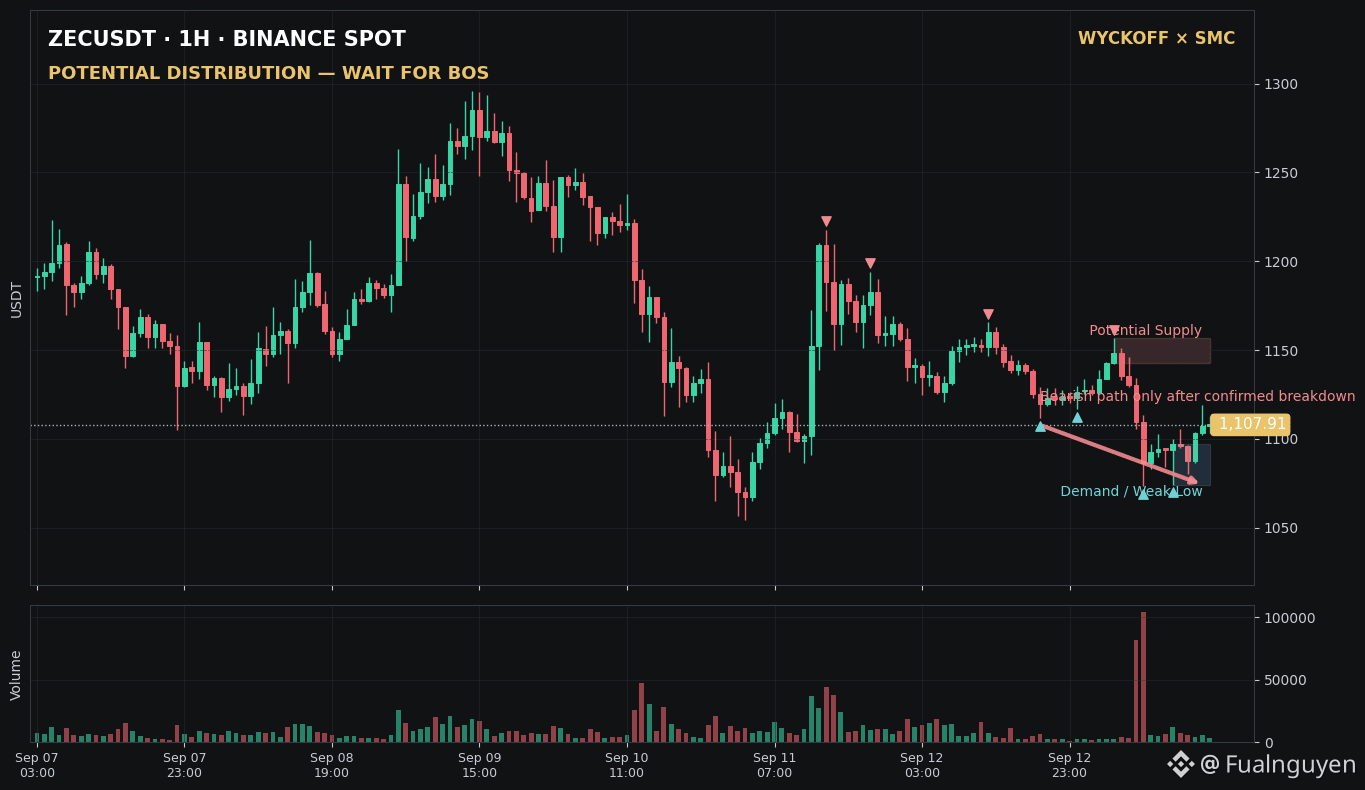
After the expansion toward $1,300, price began printing lower highs while every recovery attracted fresh supply. The latest rejection near $1,150–$1,157 strengthens the idea that Smart Money may still be distributing into strength rather than preparing an immediate breakout.
The key level is now $1,074.
As long as ZEC remains above it, the bearish thesis is NOT confirmed. This is still a range, not permission to chase a short.
But an H1 close below $1,074 would create the bearish BOS I am waiting for. That could open the path toward the $1,050 liquidity pocket first, followed by the psychological $1,000 zone if sellers maintain control.
My map:
🔴 Rejection below $1,150–$1,157 + H1 close under $1,074 = distribution confirmation and downside continuation
🟡 Holding $1,074 = no trade; price remains trapped inside the range
🟢 Reclaiming $1,157 with acceptance = bearish thesis invalidated and the market may attack higher liquidity again
I am not predicting a crash before confirmation. I am watching whether the weak low breaks after supply has already shown its hand.
Would you trade the breakdown below $1,074—or wait for a retest before acting? 👀
#ZEC #Wyckoff #SMC
Analysis based on closed Binance Spot H1 candles. Not financial advice.
$ZEC is trying to bounce—but the H1 structure still looks like a potential distribution.
After the expansion toward $1,300, price began printing lower highs while every recovery attracted fresh supply. The latest rejection near $1,150–$1,157 strengthens the idea that Smart Money may still be distributing into strength rather than preparing an immediate breakout.
The key level is now $1,074.
As long as ZEC remains above it, the bearish thesis is NOT confirmed. This is still a range, not permission to chase a short.
But an H1 close below $1,074 would create the bearish BOS I am waiting for. That could open the path toward the $1,050 liquidity pocket first, followed by the psychological $1,000 zone if sellers maintain control.
My map:
🔴 Rejection below $1,150–$1,157 + H1 close under $1,074 = distribution confirmation and downside continuation
🟡 Holding $1,074 = no trade; price remains trapped inside the range
🟢 Reclaiming $1,157 with acceptance = bearish thesis invalidated and the market may attack higher liquidity again
I am not predicting a crash before confirmation. I am watching whether the weak low breaks after supply has already shown its hand.
Would you trade the breakdown below $1,074—or wait for a retest before acting? 👀
#ZEC #Wyckoff #SMC
Analysis based on closed Binance Spot H1 candles. Not financial advice.
After the expansion toward $1,300, price began printing lower highs while every recovery attracted fresh supply. The latest rejection near $1,150–$1,157 strengthens the idea that Smart Money may still be distributing into strength rather than preparing an immediate breakout.
The key level is now $1,074.
As long as ZEC remains above it, the bearish thesis is NOT confirmed. This is still a range, not permission to chase a short.
But an H1 close below $1,074 would create the bearish BOS I am waiting for. That could open the path toward the $1,050 liquidity pocket first, followed by the psychological $1,000 zone if sellers maintain control.
My map:
🔴 Rejection below $1,150–$1,157 + H1 close under $1,074 = distribution confirmation and downside continuation
🟡 Holding $1,074 = no trade; price remains trapped inside the range
🟢 Reclaiming $1,157 with acceptance = bearish thesis invalidated and the market may attack higher liquidity again
I am not predicting a crash before confirmation. I am watching whether the weak low breaks after supply has already shown its hand.
Would you trade the breakdown below $1,074—or wait for a retest before acting? 👀
#ZEC #Wyckoff #SMC
Analysis based on closed Binance Spot H1 candles. Not financial advice.
1
5
1.9k
·
--
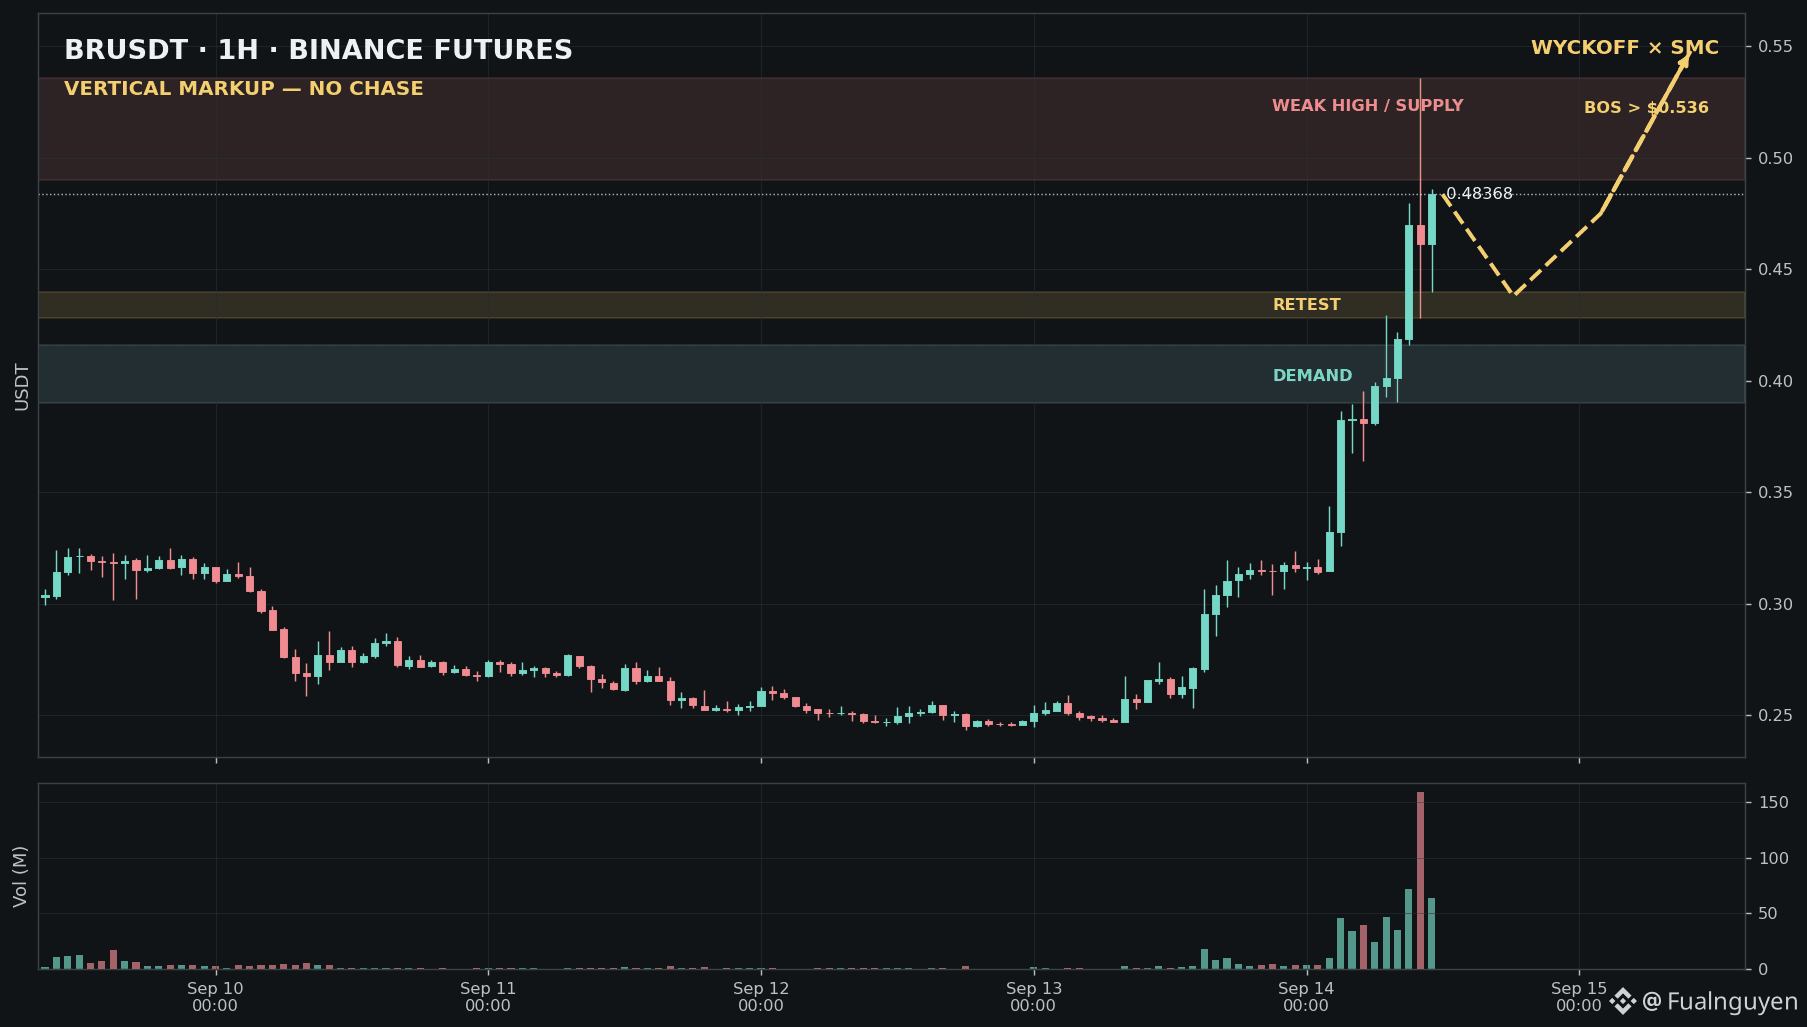
BR JUST ENTERED PRICE DISCOVERY — AND THIS IS WHERE FOMO BECOMES LIQUIDITY.
Using 299 closed H1 Futures candles, the Wyckoff–SMC agent found a vertical Markup phase—not a mature distribution yet.
$BR gained roughly 81.8% across the latest 24-hour window. The confirmed H1 close is $0.48368 after price printed a $0.536 high, while the latest closed-candle volume reached about 2.8× the prior 24-hour average.
That confirms aggressive demand—but it also confirms extreme extension.
Here is my market map:
🟢 An H1 close above $0.536 followed by a successful retest would confirm continuation into fresh price discovery
🟡 A controlled pullback into $0.428–$0.440 could provide the first structural retest worth watching
🔴 Losing that zone exposes deeper demand at $0.390–$0.416. A decisive close below $0.390 would damage the immediate Markup thesis
The Wyckoff warning is simple: vertical demand can continue longer than expected, but chasing after expansion often turns late buyers into exit liquidity
The SMC rule is even cleaner: bullish displacement is not the same as a low-risk entry
I am not calling a top. I am refusing to confuse momentum with permission to chase
What comes first: a confirmed BOS above $0.536—or a liquidity reset into $0.440? 👀
Paper analysis only. Not financial advice
#BR #Wyckoff #SMC
BR JUST ENTERED PRICE DISCOVERY — AND THIS IS WHERE FOMO BECOMES LIQUIDITY.
Using 299 closed H1 Futures candles, the Wyckoff–SMC agent found a vertical Markup phase—not a mature distribution yet.
$BR gained roughly 81.8% across the latest 24-hour window. The confirmed H1 close is $0.48368 after price printed a $0.536 high, while the latest closed-candle volume reached about 2.8× the prior 24-hour average.
That confirms aggressive demand—but it also confirms extreme extension.
Here is my market map:
🟢 An H1 close above $0.536 followed by a successful retest would confirm continuation into fresh price discovery
🟡 A controlled pullback into $0.428–$0.440 could provide the first structural retest worth watching
🔴 Losing that zone exposes deeper demand at $0.390–$0.416. A decisive close below $0.390 would damage the immediate Markup thesis
The Wyckoff warning is simple: vertical demand can continue longer than expected, but chasing after expansion often turns late buyers into exit liquidity
The SMC rule is even cleaner: bullish displacement is not the same as a low-risk entry
I am not calling a top. I am refusing to confuse momentum with permission to chase
What comes first: a confirmed BOS above $0.536—or a liquidity reset into $0.440? 👀
Paper analysis only. Not financial advice
#BR #Wyckoff #SMC
Using 299 closed H1 Futures candles, the Wyckoff–SMC agent found a vertical Markup phase—not a mature distribution yet.
$BR gained roughly 81.8% across the latest 24-hour window. The confirmed H1 close is $0.48368 after price printed a $0.536 high, while the latest closed-candle volume reached about 2.8× the prior 24-hour average.
That confirms aggressive demand—but it also confirms extreme extension.
Here is my market map:
🟢 An H1 close above $0.536 followed by a successful retest would confirm continuation into fresh price discovery
🟡 A controlled pullback into $0.428–$0.440 could provide the first structural retest worth watching
🔴 Losing that zone exposes deeper demand at $0.390–$0.416. A decisive close below $0.390 would damage the immediate Markup thesis
The Wyckoff warning is simple: vertical demand can continue longer than expected, but chasing after expansion often turns late buyers into exit liquidity
The SMC rule is even cleaner: bullish displacement is not the same as a low-risk entry
I am not calling a top. I am refusing to confuse momentum with permission to chase
What comes first: a confirmed BOS above $0.536—or a liquidity reset into $0.440? 👀
Paper analysis only. Not financial advice
#BR #Wyckoff #SMC
1
1
649

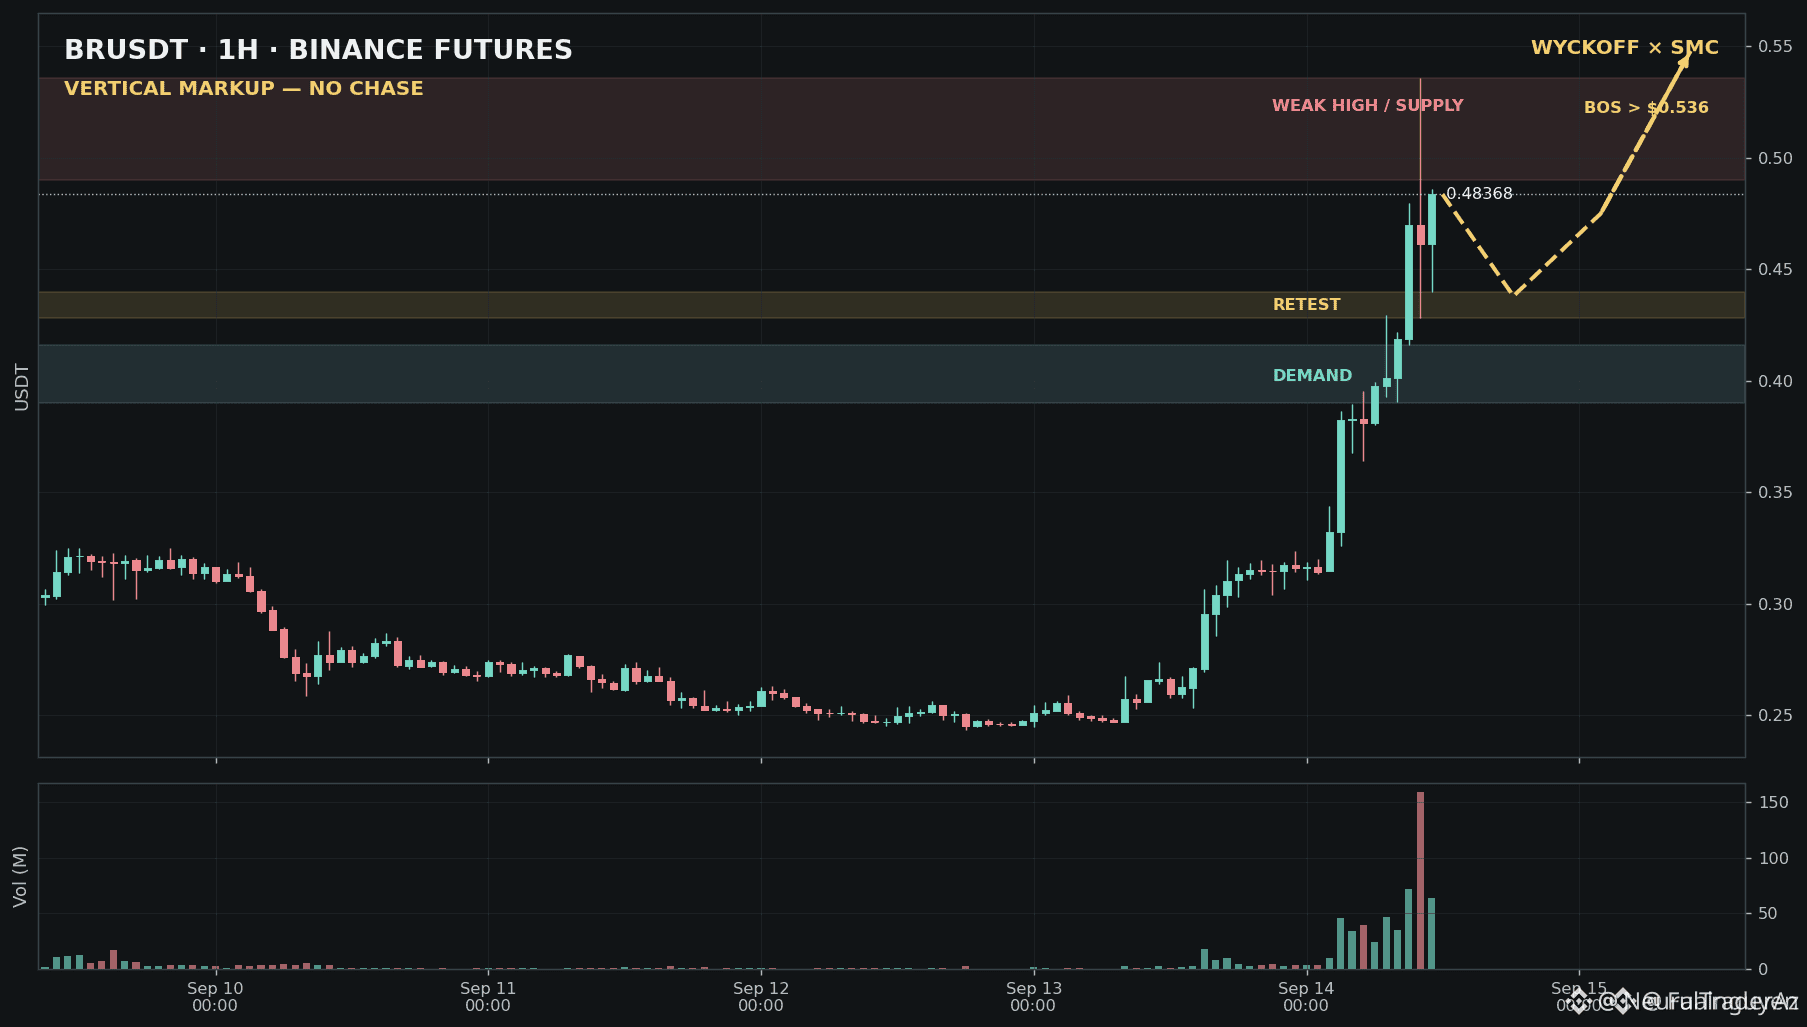
🚨 $BR EXPLODES 81% INTO PRICE DISCOVERY AS SMART MONEY HUNTS LIQUIDITY! 💥
Entry: 0.428 - 0.440 ⚡
Target: 0.536 🚀
Stop Loss: 0.390 ⚠️
After printing an 81.8% 24-hour expansion, $BR has officially entered vertical Wyckoff Markup mode. 📊 Aggressive buying volume expanded to 2.8x the daily average, driving price to a local high of $0.536 before settling near $0.483.
While institutional momentum is strong, entering after extreme extension carries a severe risk of becoming exit liquidity. 🔍 Smart money patience dictates waiting for either a clean structural breakout above $0.536 or a controlled liquidity reset into the $0.428–$0.440 demand block. 💬 What comes first: a confirmed BOS above the high or a liquidity sweep into demand? 👇
⚠️ Not financial advice. Always manage your risk. 🛡️
🏷️ #BR #Wyckoff #SMC #Crypto
🔥 💎
🚨 $BR EXPLODES 81% INTO PRICE DISCOVERY AS SMART MONEY HUNTS LIQUIDITY! 💥
Entry: 0.428 - 0.440 ⚡
Target: 0.536 🚀
Stop Loss: 0.390 ⚠️
After printing an 81.8% 24-hour expansion, $BR has officially entered vertical Wyckoff Markup mode. 📊 Aggressive buying volume expanded to 2.8x the daily average, driving price to a local high of $0.536 before settling near $0.483.
While institutional momentum is strong, entering after extreme extension carries a severe risk of becoming exit liquidity. 🔍 Smart money patience dictates waiting for either a clean structural breakout above $0.536 or a controlled liquidity reset into the $0.428–$0.440 demand block. 💬 What comes first: a confirmed BOS above the high or a liquidity sweep into demand? 👇
⚠️ Not financial advice. Always manage your risk. 🛡️
🏷️ #BR #Wyckoff #SMC #Crypto
🔥 💎
Entry: 0.428 - 0.440 ⚡
Target: 0.536 🚀
Stop Loss: 0.390 ⚠️
After printing an 81.8% 24-hour expansion, $BR has officially entered vertical Wyckoff Markup mode. 📊 Aggressive buying volume expanded to 2.8x the daily average, driving price to a local high of $0.536 before settling near $0.483.
While institutional momentum is strong, entering after extreme extension carries a severe risk of becoming exit liquidity. 🔍 Smart money patience dictates waiting for either a clean structural breakout above $0.536 or a controlled liquidity reset into the $0.428–$0.440 demand block. 💬 What comes first: a confirmed BOS above the high or a liquidity sweep into demand? 👇
⚠️ Not financial advice. Always manage your risk. 🛡️
🏷️ #BR #Wyckoff #SMC #Crypto
🔥 💎
87
·
--
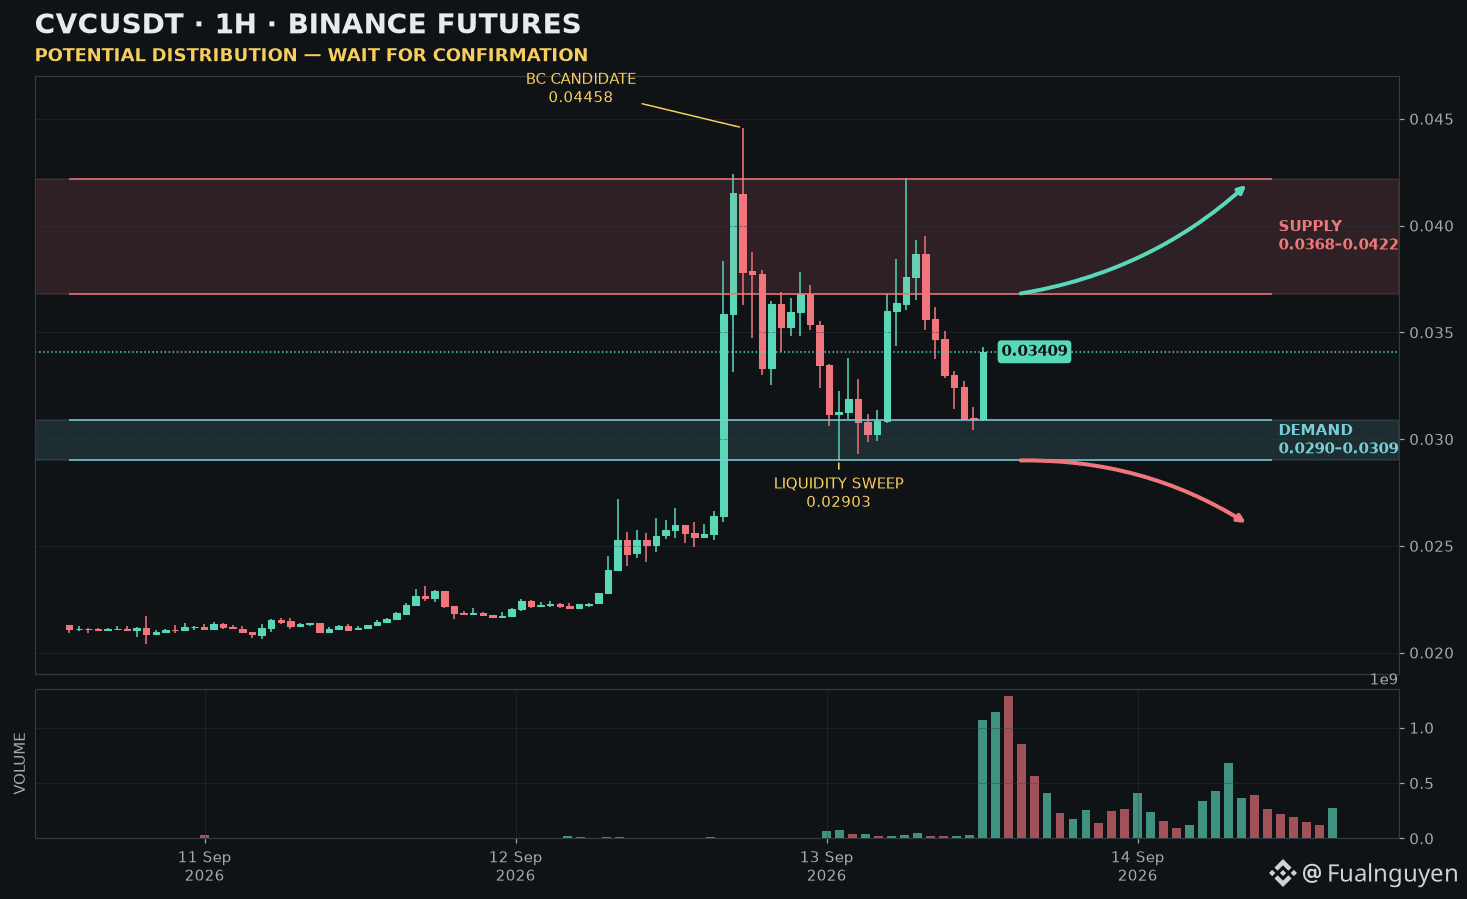
THE MARKET JUST SWEPT $CVC — BUT THIS IS NOT A BUY SIGNAL YET.
CVCUSDT H1 Futures has formed what may become a Wyckoff distribution range after an explosive markup.
Price accelerated from $0.0204 into a Buying Climax candidate at $0.04458, then reacted sharply toward $0.02903. The rebound stalled at $0.04223, leaving a lower high before price returned to demand.
The latest confirmed closed candle recovered to $0.03409 after testing $0.03086.
In Wyckoff terms, this may be a secondary test of demand inside a potential distribution range. In SMC terms, buyers defended nearby liquidity—but the larger bearish structure has not been broken.
The confirmation gate is clear:
🟢 An H1 close above $0.0368–$0.0385, followed by a successful retest, would confirm bullish BOS and expose the $0.0422–$0.0446 supply zone.
🟡 Holding $0.0290–$0.0309 keeps the recovery thesis alive, but without BOS this remains WATCH—not TRADE READY.
🔴 A decisive H1 close below $0.0290 invalidates the recovery thesis and could open a deeper move toward $0.026.
The trap is chasing the rebound before confirmation—or shorting directly into defended demand.
Smart Money may have tested sell-side liquidity. Now I want proof that buyers can reclaim structure.
Which happens first: BOS above $0.0385 or another sweep below $0.0290? 👀
Paper analysis only. Not financial advice.
#CVC #Wyckoff #SMC
THE MARKET JUST SWEPT $CVC — BUT THIS IS NOT A BUY SIGNAL YET.
CVCUSDT H1 Futures has formed what may become a Wyckoff distribution range after an explosive markup.
Price accelerated from $0.0204 into a Buying Climax candidate at $0.04458, then reacted sharply toward $0.02903. The rebound stalled at $0.04223, leaving a lower high before price returned to demand.
The latest confirmed closed candle recovered to $0.03409 after testing $0.03086.
In Wyckoff terms, this may be a secondary test of demand inside a potential distribution range. In SMC terms, buyers defended nearby liquidity—but the larger bearish structure has not been broken.
The confirmation gate is clear:
🟢 An H1 close above $0.0368–$0.0385, followed by a successful retest, would confirm bullish BOS and expose the $0.0422–$0.0446 supply zone.
🟡 Holding $0.0290–$0.0309 keeps the recovery thesis alive, but without BOS this remains WATCH—not TRADE READY.
🔴 A decisive H1 close below $0.0290 invalidates the recovery thesis and could open a deeper move toward $0.026.
The trap is chasing the rebound before confirmation—or shorting directly into defended demand.
Smart Money may have tested sell-side liquidity. Now I want proof that buyers can reclaim structure.
Which happens first: BOS above $0.0385 or another sweep below $0.0290? 👀
Paper analysis only. Not financial advice.
#CVC #Wyckoff #SMC
CVCUSDT H1 Futures has formed what may become a Wyckoff distribution range after an explosive markup.
Price accelerated from $0.0204 into a Buying Climax candidate at $0.04458, then reacted sharply toward $0.02903. The rebound stalled at $0.04223, leaving a lower high before price returned to demand.
The latest confirmed closed candle recovered to $0.03409 after testing $0.03086.
In Wyckoff terms, this may be a secondary test of demand inside a potential distribution range. In SMC terms, buyers defended nearby liquidity—but the larger bearish structure has not been broken.
The confirmation gate is clear:
🟢 An H1 close above $0.0368–$0.0385, followed by a successful retest, would confirm bullish BOS and expose the $0.0422–$0.0446 supply zone.
🟡 Holding $0.0290–$0.0309 keeps the recovery thesis alive, but without BOS this remains WATCH—not TRADE READY.
🔴 A decisive H1 close below $0.0290 invalidates the recovery thesis and could open a deeper move toward $0.026.
The trap is chasing the rebound before confirmation—or shorting directly into defended demand.
Smart Money may have tested sell-side liquidity. Now I want proof that buyers can reclaim structure.
Which happens first: BOS above $0.0385 or another sweep below $0.0290? 👀
Paper analysis only. Not financial advice.
#CVC #Wyckoff #SMC
1
1
216

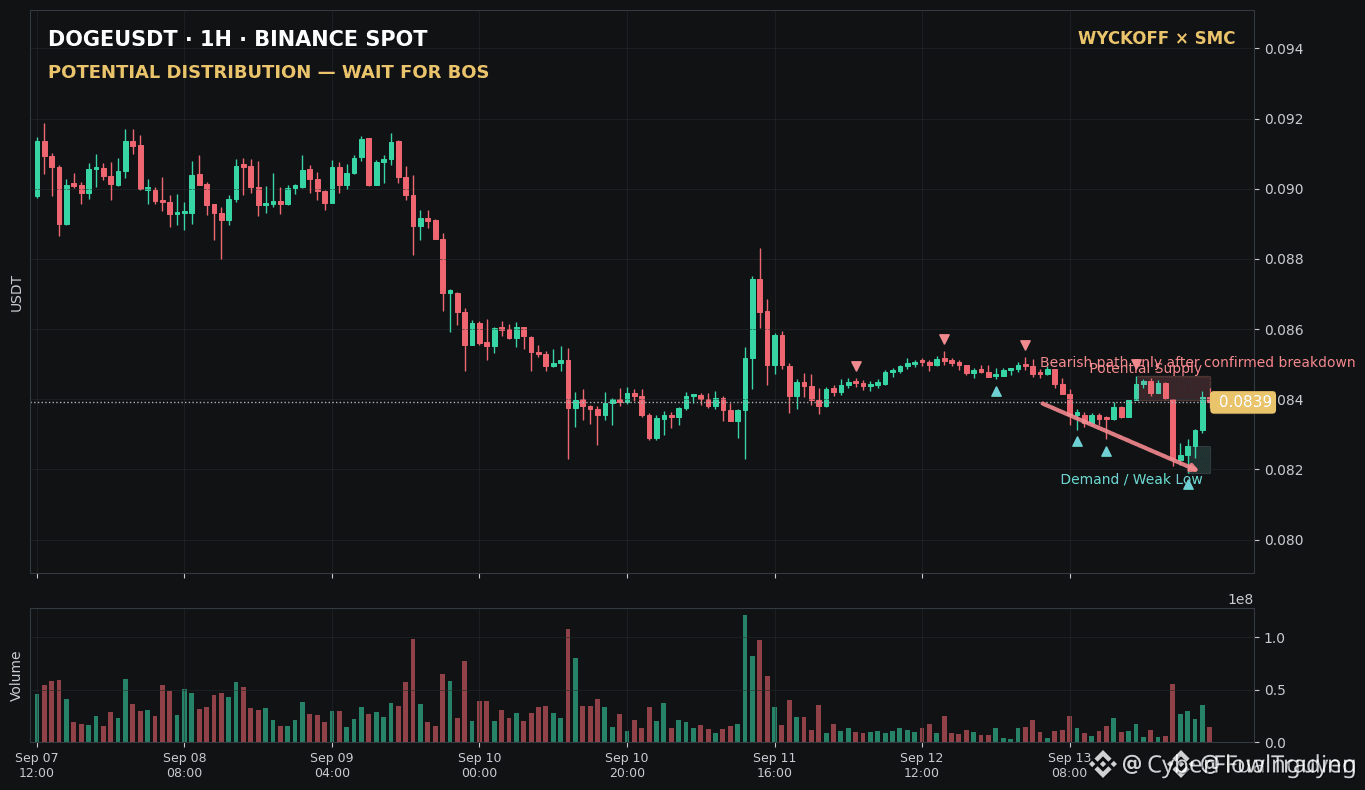
🚨 $DOGE DANCING AT THE EDGE OF A MASSIVE LIQUIDITY TRAP! 🦈
$DOGE is pushing straight into a critical supply wall at $0.08466 after a sharp bounce from $0.08191. 🔍 Late buyers are lining up to bid this recovery, but smart money sees an active Wyckoff distribution structure playing out on the hourly chart.
📌 Sitting right at $0.08391, price is squeezed inside a high-voltage liquidity trap. A clean H1 acceptance above $0.08466 clears the path toward $0.0860, while a breakdown under $0.08191 triggers a bearish structural shift. 🌊
Patience pays when order flow is this contested. 💡 Which side gets wiped out first: the $0.08466 supply wall or the $0.08191 liquidity pool? 👇
⚠️ Not financial advice. Always manage your risk. 🛡️
🏷️ #DOGE #Wyckoff #SmartMoney #Crypto
🔥 💎
🚨 $DOGE DANCING AT THE EDGE OF A MASSIVE LIQUIDITY TRAP! 🦈
$DOGE is pushing straight into a critical supply wall at $0.08466 after a sharp bounce from $0.08191. 🔍 Late buyers are lining up to bid this recovery, but smart money sees an active Wyckoff distribution structure playing out on the hourly chart.
📌 Sitting right at $0.08391, price is squeezed inside a high-voltage liquidity trap. A clean H1 acceptance above $0.08466 clears the path toward $0.0860, while a breakdown under $0.08191 triggers a bearish structural shift. 🌊
Patience pays when order flow is this contested. 💡 Which side gets wiped out first: the $0.08466 supply wall or the $0.08191 liquidity pool? 👇
⚠️ Not financial advice. Always manage your risk. 🛡️
🏷️ #DOGE #Wyckoff #SmartMoney #Crypto
🔥 💎
$DOGE is pushing straight into a critical supply wall at $0.08466 after a sharp bounce from $0.08191. 🔍 Late buyers are lining up to bid this recovery, but smart money sees an active Wyckoff distribution structure playing out on the hourly chart.
📌 Sitting right at $0.08391, price is squeezed inside a high-voltage liquidity trap. A clean H1 acceptance above $0.08466 clears the path toward $0.0860, while a breakdown under $0.08191 triggers a bearish structural shift. 🌊
Patience pays when order flow is this contested. 💡 Which side gets wiped out first: the $0.08466 supply wall or the $0.08191 liquidity pool? 👇
⚠️ Not financial advice. Always manage your risk. 🛡️
🏷️ #DOGE #Wyckoff #SmartMoney #Crypto
🔥 💎
40
·
--
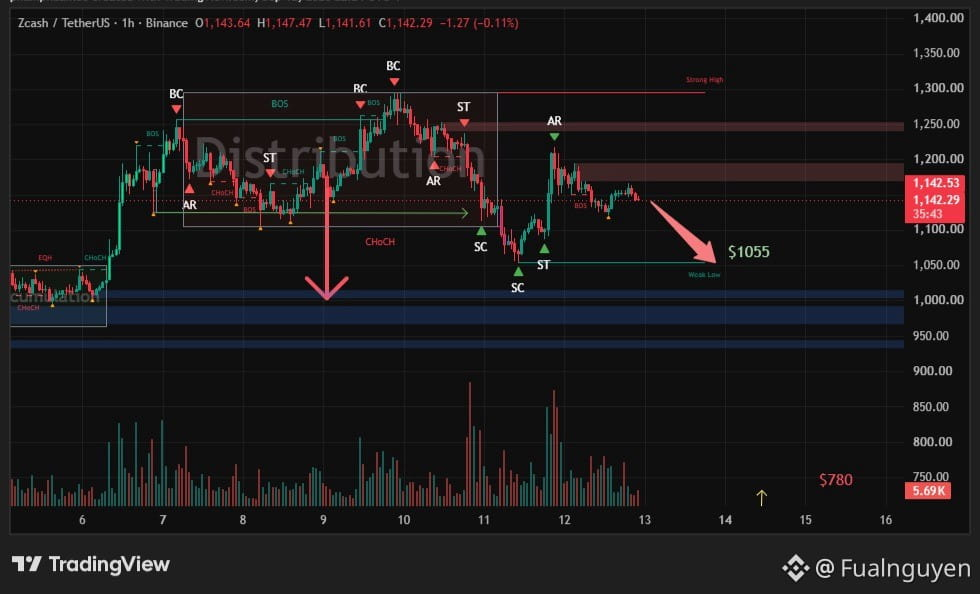
**Is $ZEC preparing for another markdown toward $1,055?**
Running the ZECUSDT H1 chart through my Wyckoff-smc-swing-agent reveals a potential distribution structure—not a clean bullish continuation
The larger range was repeatedly rejected near $1,250–$1,290, with multiple Buying Climax attempts followed by lower highs, CHoCH, and bearish BOS
After the first markdown, ZEC printed a Selling Climax near $1,055 and rallied toward $1,200
But the recovery failed to reclaim supply
Price is now consolidating around $1,142 beneath the $1,180–$1,200 resistance zone, while the previous low at $1,055 remains visibly weak
One distinction matters here
Smart Money does not need to wait until $1,055 to unload
The distribution likely happens during rallies into overhead supply. Once inventory has been transferred, the markdown can seek the sell-side liquidity resting beneath the weak low
A confirmed H1 breakdown below the current consolidation would make $1,055 the next logical liquidity target
But the reaction there matters more than simply reaching it
⚡ Sweep $1,055 and reclaim quickly: potential Spring and reversal setup
🔻 Accept below $1,055: the structure could expand toward the $1,000 demand area
The bearish thesis weakens if ZEC reclaims and holds above $1,200, while a recovery above $1,250 would invalidate the immediate distribution scenario
For a Spot-only strategy, the current output is **AVOID_BUY**, not a recommendation to short
Would you buy a Spring below $1,055—or wait for $1,200 to become support?
$ZEC #Wyckoff #SMC
**Is $ZEC preparing for another markdown toward $1,055?**
Running the ZECUSDT H1 chart through my Wyckoff-smc-swing-agent reveals a potential distribution structure—not a clean bullish continuation
The larger range was repeatedly rejected near $1,250–$1,290, with multiple Buying Climax attempts followed by lower highs, CHoCH, and bearish BOS
After the first markdown, ZEC printed a Selling Climax near $1,055 and rallied toward $1,200
But the recovery failed to reclaim supply
Price is now consolidating around $1,142 beneath the $1,180–$1,200 resistance zone, while the previous low at $1,055 remains visibly weak
One distinction matters here
Smart Money does not need to wait until $1,055 to unload
The distribution likely happens during rallies into overhead supply. Once inventory has been transferred, the markdown can seek the sell-side liquidity resting beneath the weak low
A confirmed H1 breakdown below the current consolidation would make $1,055 the next logical liquidity target
But the reaction there matters more than simply reaching it
⚡ Sweep $1,055 and reclaim quickly: potential Spring and reversal setup
🔻 Accept below $1,055: the structure could expand toward the $1,000 demand area
The bearish thesis weakens if ZEC reclaims and holds above $1,200, while a recovery above $1,250 would invalidate the immediate distribution scenario
For a Spot-only strategy, the current output is **AVOID_BUY**, not a recommendation to short
Would you buy a Spring below $1,055—or wait for $1,200 to become support?
$ZEC #Wyckoff #SMC
Running the ZECUSDT H1 chart through my Wyckoff-smc-swing-agent reveals a potential distribution structure—not a clean bullish continuation
The larger range was repeatedly rejected near $1,250–$1,290, with multiple Buying Climax attempts followed by lower highs, CHoCH, and bearish BOS
After the first markdown, ZEC printed a Selling Climax near $1,055 and rallied toward $1,200
But the recovery failed to reclaim supply
Price is now consolidating around $1,142 beneath the $1,180–$1,200 resistance zone, while the previous low at $1,055 remains visibly weak
One distinction matters here
Smart Money does not need to wait until $1,055 to unload
The distribution likely happens during rallies into overhead supply. Once inventory has been transferred, the markdown can seek the sell-side liquidity resting beneath the weak low
A confirmed H1 breakdown below the current consolidation would make $1,055 the next logical liquidity target
But the reaction there matters more than simply reaching it
⚡ Sweep $1,055 and reclaim quickly: potential Spring and reversal setup
🔻 Accept below $1,055: the structure could expand toward the $1,000 demand area
The bearish thesis weakens if ZEC reclaims and holds above $1,200, while a recovery above $1,250 would invalidate the immediate distribution scenario
For a Spot-only strategy, the current output is **AVOID_BUY**, not a recommendation to short
Would you buy a Spring below $1,055—or wait for $1,200 to become support?
$ZEC #Wyckoff #SMC
닥터 카므란 잘랄리:
Excellent breakdown of the Wyckoff structure, especially the distinction between a liquidity sweep and genuine acceptance below $1,055. That reaction could be more informative than the level itself. A quick reclaim after a sweep would suggest trapped sellers, while sustained trading below it would strengthen the markdown thesis toward $1,000. I also like the discipline of using $1,200 and $1,250 as clear invalidation levels. This is the kind of structure I look for before considering a setup.
2
3
1.9k
·
--
I don’t believe $BTC will print a deeper low this year
Not because downside risk has disappeared—but because the weekly structure has changed
When I ran this chart through my Wyckoff-smc-swing-agent, the most important signal was not the rebound toward $77.4K
It was what happened inside the $55K–$60K demand zone
BTC entered long-term weekly demand, formed a Secondary Test, failed to extend lower, and then reclaimed the $70K area
From a Wyckoff perspective, supply was tested without fresh downside follow-through
From an SMC perspective, weekly demand defended while price moved back toward the first supply zone around $77K–$82K
This does not mean BTC must rally in a straight line
A rejection could still trigger a retest of $70K—or even another visit to the weekly demand zone
But a retest is not the same as a deeper yearly bottom
My thesis remains constructive while weekly candles hold above $55K–$60K
A clean weekly acceptance below that zone would invalidate the setup and force the agent to switch from WATCH to AVOID_BUY
Until that happens, I see this structure as a re-accumulation candidate after markdown—not preparation for another major capitulation
I am not chasing a green candle
I simply believe the market may have already shown us where serious buyers are willing to defend
Do you see $55K–$60K as the cycle floor—or unfinished business?
$BTC #Wyckoff #SMC
I don’t believe $BTC will print a deeper low this year
Not because downside risk has disappeared—but because the weekly structure has changed
When I ran this chart through my Wyckoff-smc-swing-agent, the most important signal was not the rebound toward $77.4K
It was what happened inside the $55K–$60K demand zone
BTC entered long-term weekly demand, formed a Secondary Test, failed to extend lower, and then reclaimed the $70K area
From a Wyckoff perspective, supply was tested without fresh downside follow-through
From an SMC perspective, weekly demand defended while price moved back toward the first supply zone around $77K–$82K
This does not mean BTC must rally in a straight line
A rejection could still trigger a retest of $70K—or even another visit to the weekly demand zone
But a retest is not the same as a deeper yearly bottom
My thesis remains constructive while weekly candles hold above $55K–$60K
A clean weekly acceptance below that zone would invalidate the setup and force the agent to switch from WATCH to AVOID_BUY
Until that happens, I see this structure as a re-accumulation candidate after markdown—not preparation for another major capitulation
I am not chasing a green candle
I simply believe the market may have already shown us where serious buyers are willing to defend
Do you see $55K–$60K as the cycle floor—or unfinished business?
$BTC #Wyckoff #SMC
Not because downside risk has disappeared—but because the weekly structure has changed
When I ran this chart through my Wyckoff-smc-swing-agent, the most important signal was not the rebound toward $77.4K
It was what happened inside the $55K–$60K demand zone
BTC entered long-term weekly demand, formed a Secondary Test, failed to extend lower, and then reclaimed the $70K area
From a Wyckoff perspective, supply was tested without fresh downside follow-through
From an SMC perspective, weekly demand defended while price moved back toward the first supply zone around $77K–$82K
This does not mean BTC must rally in a straight line
A rejection could still trigger a retest of $70K—or even another visit to the weekly demand zone
But a retest is not the same as a deeper yearly bottom
My thesis remains constructive while weekly candles hold above $55K–$60K
A clean weekly acceptance below that zone would invalidate the setup and force the agent to switch from WATCH to AVOID_BUY
Until that happens, I see this structure as a re-accumulation candidate after markdown—not preparation for another major capitulation
I am not chasing a green candle
I simply believe the market may have already shown us where serious buyers are willing to defend
Do you see $55K–$60K as the cycle floor—or unfinished business?
$BTC #Wyckoff #SMC

닥터 카므란 잘랄리:
Excellent structural breakdown, especially the distinction between a retest and a genuine cycle low. The $55K to $60K demand zone becomes much more meaningful when combined with the weekly structure and the failure to extend lower after the secondary test. I’d also watch the reaction around $77K to $82K, because rejection there followed by a higher low could strengthen the re-accumulation thesis. Clear invalidation levels make this analysis much more actionable.
4
3
936

·
--
Bearish
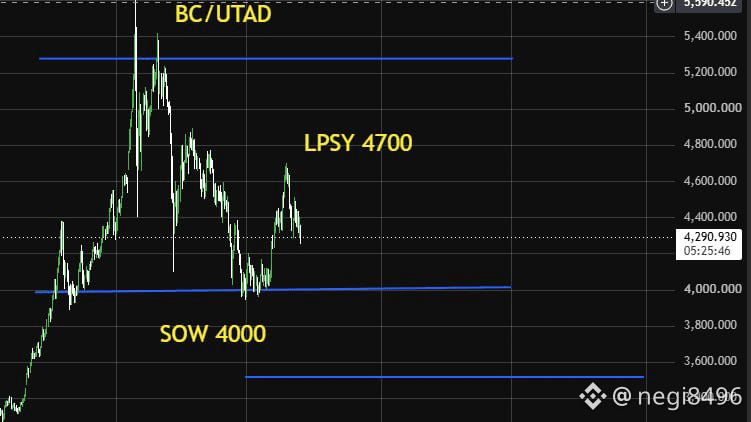
#GOLD 1D
Current price 4275$
The current structure is leaning more toward the Re-distribution scheme or Distribution at the top.
Main scenario (Downward move - Markdown):
Price continues to slide down to retest the lower edge of TR in the support zone at $4,000.
Confirm Phase E (Markdown): If the price closes with candle D1 decisively breaking the $4,000 level, the Distribution structure is completed.
Analysis based on price action Wait for a reaction at $4,000: This is the key boundary zone that determines the next trend direction.
Not investment advice . $GOLD #wyckoff #gold
#GOLD 1D
Current price 4275$
The current structure is leaning more toward the Re-distribution scheme or Distribution at the top.
Main scenario (Downward move - Markdown):
Price continues to slide down to retest the lower edge of TR in the support zone at $4,000.
Confirm Phase E (Markdown): If the price closes with candle D1 decisively breaking the $4,000 level, the Distribution structure is completed.
Analysis based on price action Wait for a reaction at $4,000: This is the key boundary zone that determines the next trend direction.
Not investment advice . $GOLD #wyckoff #gold
Current price 4275$
The current structure is leaning more toward the Re-distribution scheme or Distribution at the top.
Main scenario (Downward move - Markdown):
Price continues to slide down to retest the lower edge of TR in the support zone at $4,000.
Confirm Phase E (Markdown): If the price closes with candle D1 decisively breaking the $4,000 level, the Distribution structure is completed.
Analysis based on price action Wait for a reaction at $4,000: This is the key boundary zone that determines the next trend direction.
Not investment advice . $GOLD #wyckoff #gold
134

·
--
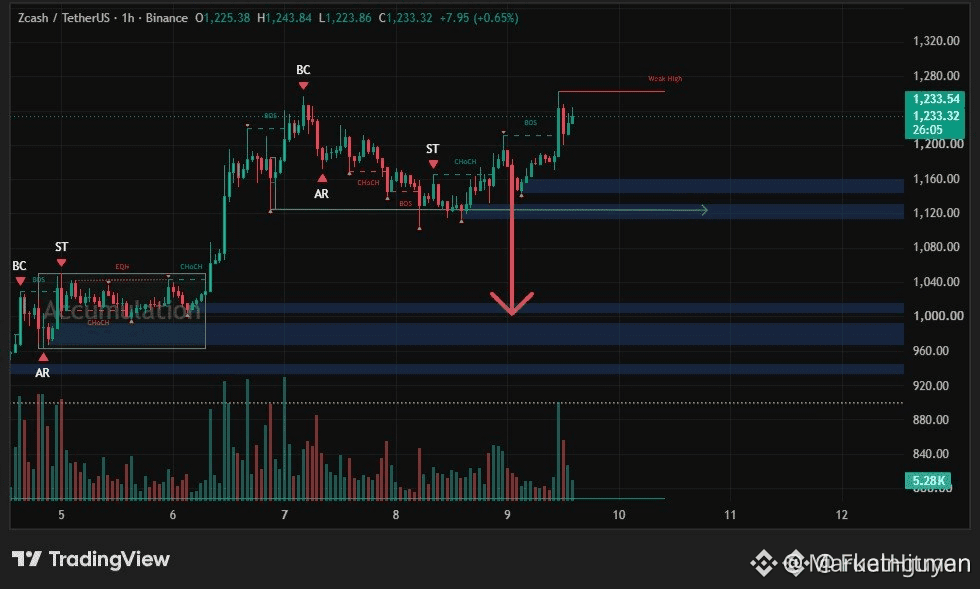
🚨 $ZEC FACES SHARP MARKDOWN BELOW $1260 RESISTANCE 💥
Entry: 1260 ⚡
Target: 1000 🚀
📊 The $1260 BC ceiling has slammed the market, exposing exhausted buyer momentum against a wall of overhead supply. A prior liquidity sweep at $1120 left trapped volume, signaling a Wyckoff distribution top in formation. 🌊
⚡ If resistance holds, institutional profit‑taking will likely cascade through the $1160 and $1120 buckets, driving ZEC straight toward the $1000‑$1015 accumulation zone. 📌 Keep positions tight and let volume validate the descent—avoid premature entries at distribution peaks. 💬 Are you ready to short the breakdown or waiting for the next liquidity trap? 👇
⚠️ Not financial advice. Always manage your risk. 🛡️
🏷️ #ZEC #ShortSetup #Wyckoff #Crypto
🦈 🔥
🚨 $ZEC FACES SHARP MARKDOWN BELOW $1260 RESISTANCE 💥
Entry: 1260 ⚡
Target: 1000 🚀
📊 The $1260 BC ceiling has slammed the market, exposing exhausted buyer momentum against a wall of overhead supply. A prior liquidity sweep at $1120 left trapped volume, signaling a Wyckoff distribution top in formation. 🌊
⚡ If resistance holds, institutional profit‑taking will likely cascade through the $1160 and $1120 buckets, driving ZEC straight toward the $1000‑$1015 accumulation zone. 📌 Keep positions tight and let volume validate the descent—avoid premature entries at distribution peaks. 💬 Are you ready to short the breakdown or waiting for the next liquidity trap? 👇
⚠️ Not financial advice. Always manage your risk. 🛡️
🏷️ #ZEC #ShortSetup #Wyckoff #Crypto
🦈 🔥
Entry: 1260 ⚡
Target: 1000 🚀
📊 The $1260 BC ceiling has slammed the market, exposing exhausted buyer momentum against a wall of overhead supply. A prior liquidity sweep at $1120 left trapped volume, signaling a Wyckoff distribution top in formation. 🌊
⚡ If resistance holds, institutional profit‑taking will likely cascade through the $1160 and $1120 buckets, driving ZEC straight toward the $1000‑$1015 accumulation zone. 📌 Keep positions tight and let volume validate the descent—avoid premature entries at distribution peaks. 💬 Are you ready to short the breakdown or waiting for the next liquidity trap? 👇
⚠️ Not financial advice. Always manage your risk. 🛡️
🏷️ #ZEC #ShortSetup #Wyckoff #Crypto
🦈 🔥
113

·
--
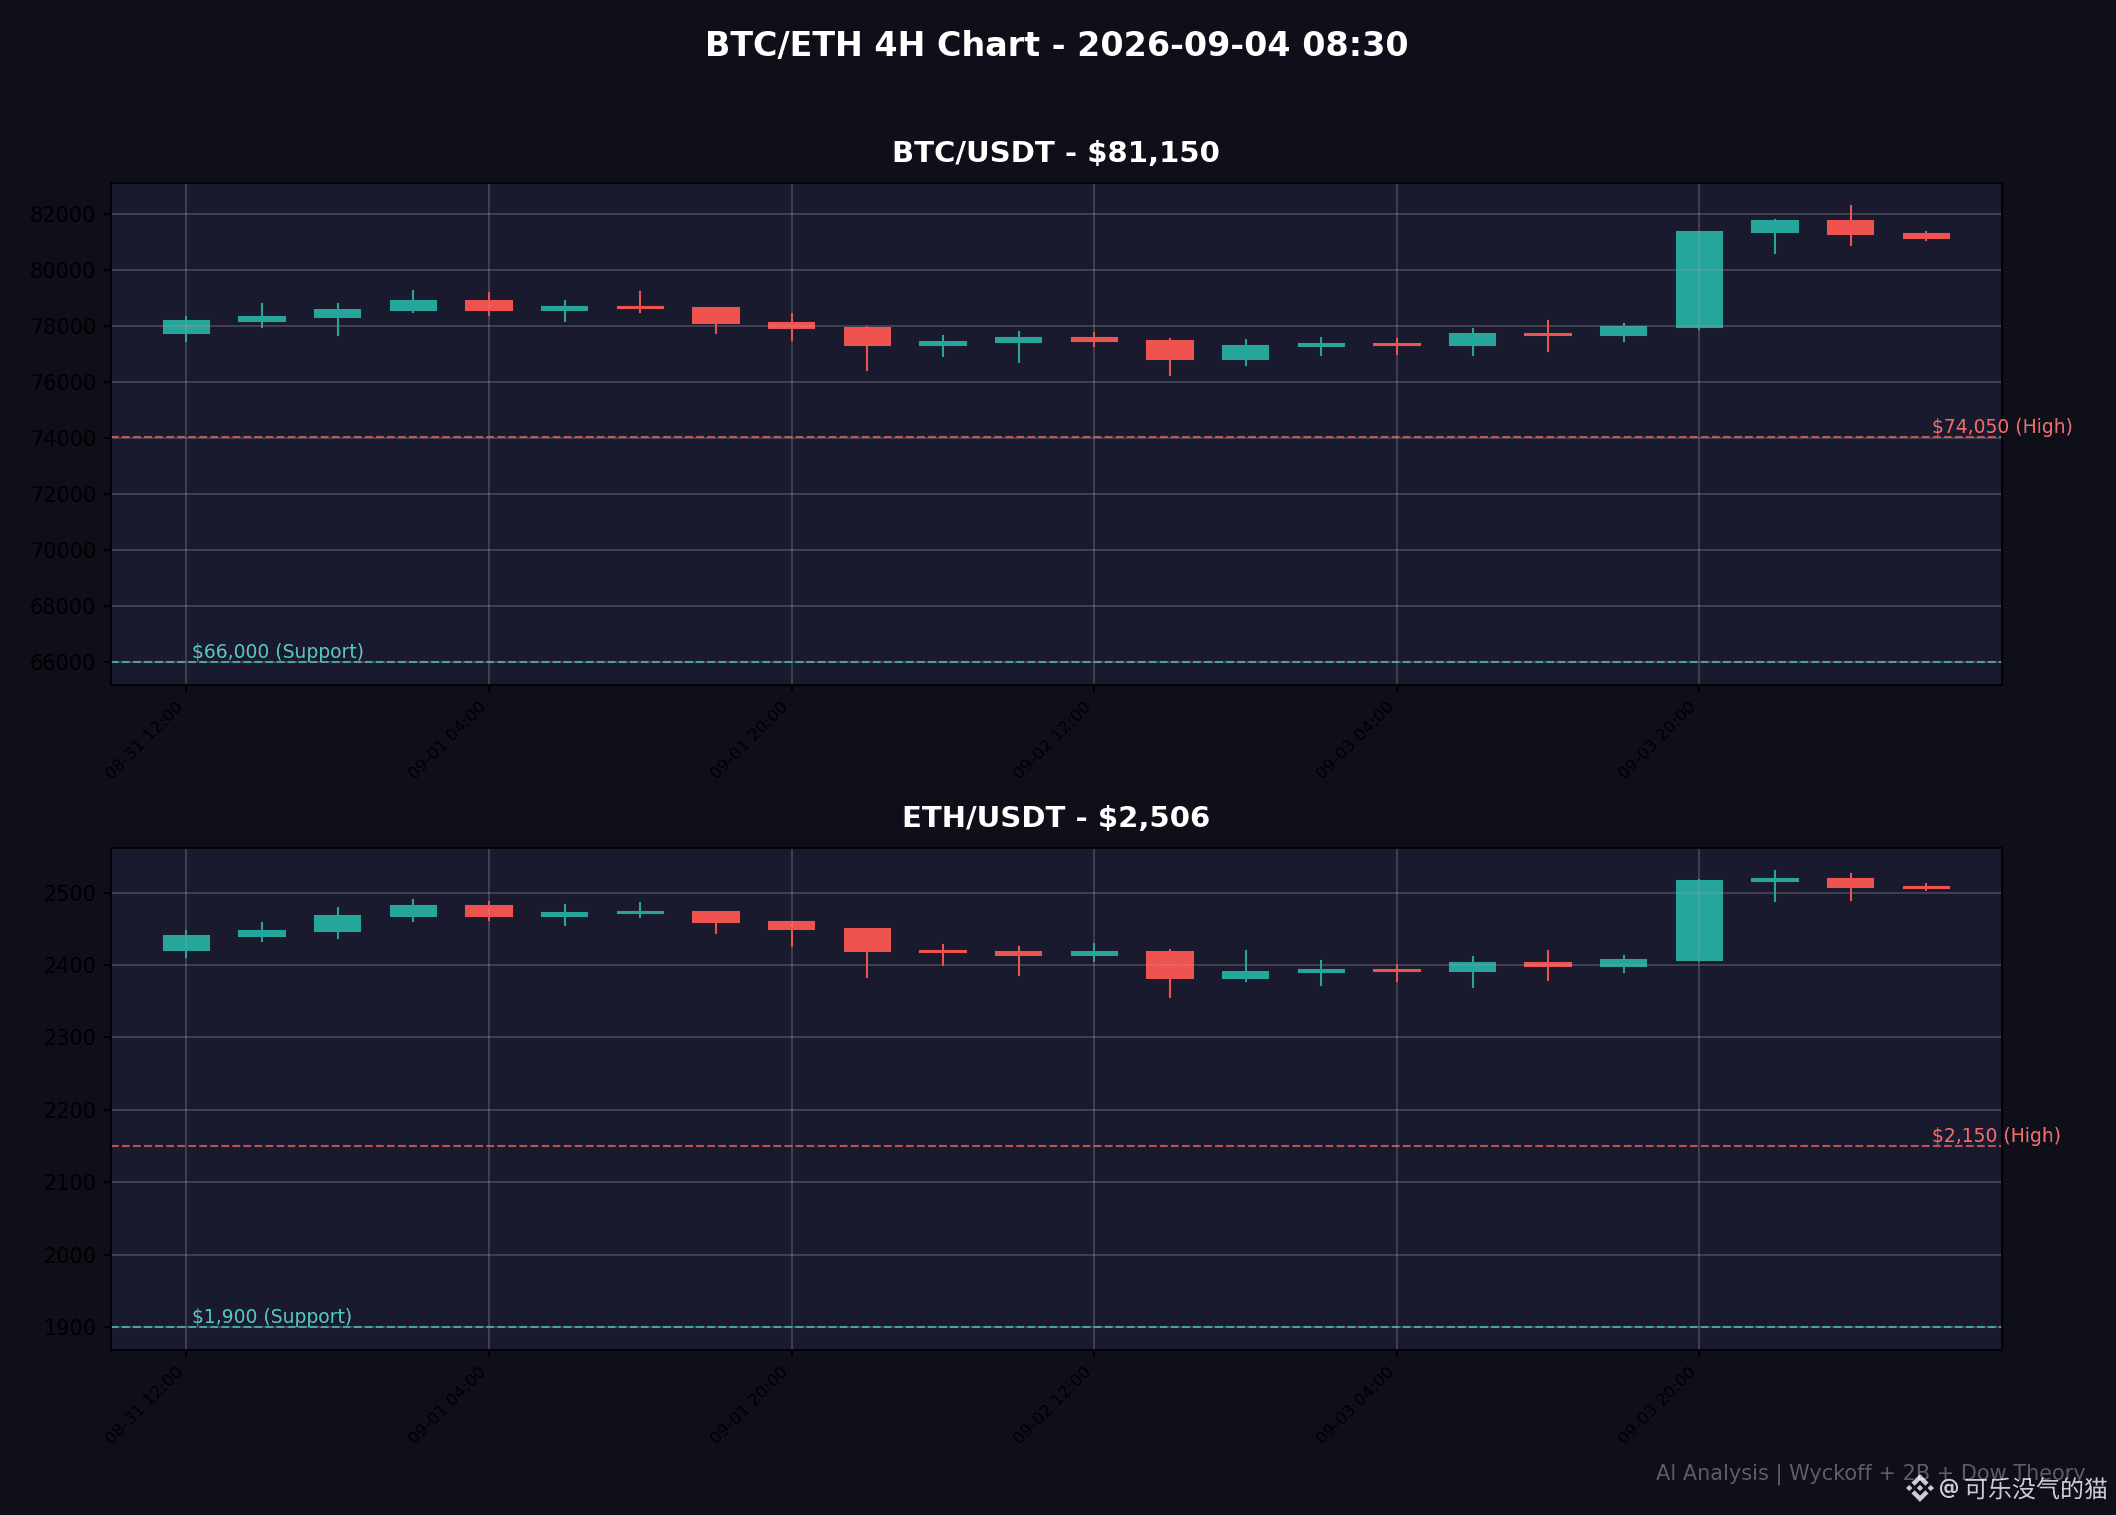
⚠️ BTC surges above 80,000! 82300 ahead meets resistance and pulls back, with fierce battles between bulls and bears in the 81,000-81,500 range
📊 Market Quick Glance
• BTC: $81,143 | 24h +5.35% | 4H range 80,984-82,300
• ETH: $2,504.9 | 24h +5.27% | 4H range 2,490-2,530
• BTC violently rallies from around 77,500 to 81,300+, with a high-volume 4H breakout—momentum is extremely strong
• ETH follows through, breaking above 2,400 and holding above 2,500, with good correlation
1️⃣ Wyckoff Perspective
BTC completed the accumulation phase in the 76,500-78,000 range (multiple tests of the 77,000 support that held), and then a clear “departure” wave appeared—high-volume long bullish candles broke out above 81,000 on the 4H chart, signaling demand influx after supply exhaustion. We are currently at the early stage of the markup phase. 82300 saw a supply test (push higher then pull back). If a retracement to 81,000-81,500 comes with declining volume and forms a stable base, the main upswing may not be over yet. ETH mirrored this: after accumulating 2,350-2,400, it broke out with aligned timing.
2️⃣ 2B Rule Assessment
BTC (4H): the prior high at 82,300 was tested but failed to hold effectively (the current candle closes at 81,143). If it attempts to rally to 82,300 again and fails, and then closes below 81,000, it will form a bearish 2B fake breakout signal. But if the pullback to 80,500-81,000 finds support and then breaks above 82,300, the bullish 2B structure is confirmed. We are currently in a critical observation window.
ETH likewise: 2530 is short-term resistance. If it pulls back to 2,500 without breaking, and then attacks again, the bullish trend continues.
3️⃣ Dow Theory
Daily level: BTC continues rising from the 76,000 low, breaking through the 80,000 psychological level, confirming the uptrend is ongoing. The prior secondary pullback between 77,000-78,000 has already played out. Now the main trend is gaining strength again. ETH has broken above the 2,400 resistance zone, confirming trend synchrony with BTC. Key defense levels: BTC 78,000 / ETH 2,400.
🛡️ Trading Strategy
• BTC (Bullish): on a pullback to 81,000-81,500, test long with a small position; stop loss 79,800; targets 83,000-85,000
• BTC (Wait-and-see): if 80,500 is lost, then wait until 78,000-79,000 to enter
• ETH (Bullish): on a pullback near 2,500, test long; stop loss 2,430; targets 2,600-2,700
• Risk control reminder: volatility is intense early in the breakout—keep position size at 3-5%, and don’t chase highs
#BTC走势分析 #ETH走势分析 #Wyckoff #道氏理论
⚠️ BTC surges above 80,000! 82300 ahead meets resistance and pulls back, with fierce battles between bulls and bears in the 81,000-81,500 range
📊 Market Quick Glance
• BTC: $81,143 | 24h +5.35% | 4H range 80,984-82,300
• ETH: $2,504.9 | 24h +5.27% | 4H range 2,490-2,530
• BTC violently rallies from around 77,500 to 81,300+, with a high-volume 4H breakout—momentum is extremely strong
• ETH follows through, breaking above 2,400 and holding above 2,500, with good correlation
1️⃣ Wyckoff Perspective
BTC completed the accumulation phase in the 76,500-78,000 range (multiple tests of the 77,000 support that held), and then a clear “departure” wave appeared—high-volume long bullish candles broke out above 81,000 on the 4H chart, signaling demand influx after supply exhaustion. We are currently at the early stage of the markup phase. 82300 saw a supply test (push higher then pull back). If a retracement to 81,000-81,500 comes with declining volume and forms a stable base, the main upswing may not be over yet. ETH mirrored this: after accumulating 2,350-2,400, it broke out with aligned timing.
2️⃣ 2B Rule Assessment
BTC (4H): the prior high at 82,300 was tested but failed to hold effectively (the current candle closes at 81,143). If it attempts to rally to 82,300 again and fails, and then closes below 81,000, it will form a bearish 2B fake breakout signal. But if the pullback to 80,500-81,000 finds support and then breaks above 82,300, the bullish 2B structure is confirmed. We are currently in a critical observation window.
ETH likewise: 2530 is short-term resistance. If it pulls back to 2,500 without breaking, and then attacks again, the bullish trend continues.
3️⃣ Dow Theory
Daily level: BTC continues rising from the 76,000 low, breaking through the 80,000 psychological level, confirming the uptrend is ongoing. The prior secondary pullback between 77,000-78,000 has already played out. Now the main trend is gaining strength again. ETH has broken above the 2,400 resistance zone, confirming trend synchrony with BTC. Key defense levels: BTC 78,000 / ETH 2,400.
🛡️ Trading Strategy
• BTC (Bullish): on a pullback to 81,000-81,500, test long with a small position; stop loss 79,800; targets 83,000-85,000
• BTC (Wait-and-see): if 80,500 is lost, then wait until 78,000-79,000 to enter
• ETH (Bullish): on a pullback near 2,500, test long; stop loss 2,430; targets 2,600-2,700
• Risk control reminder: volatility is intense early in the breakout—keep position size at 3-5%, and don’t chase highs
#BTC走势分析 #ETH走势分析 #Wyckoff #道氏理论
📊 Market Quick Glance
• BTC: $81,143 | 24h +5.35% | 4H range 80,984-82,300
• ETH: $2,504.9 | 24h +5.27% | 4H range 2,490-2,530
• BTC violently rallies from around 77,500 to 81,300+, with a high-volume 4H breakout—momentum is extremely strong
• ETH follows through, breaking above 2,400 and holding above 2,500, with good correlation
1️⃣ Wyckoff Perspective
BTC completed the accumulation phase in the 76,500-78,000 range (multiple tests of the 77,000 support that held), and then a clear “departure” wave appeared—high-volume long bullish candles broke out above 81,000 on the 4H chart, signaling demand influx after supply exhaustion. We are currently at the early stage of the markup phase. 82300 saw a supply test (push higher then pull back). If a retracement to 81,000-81,500 comes with declining volume and forms a stable base, the main upswing may not be over yet. ETH mirrored this: after accumulating 2,350-2,400, it broke out with aligned timing.
2️⃣ 2B Rule Assessment
BTC (4H): the prior high at 82,300 was tested but failed to hold effectively (the current candle closes at 81,143). If it attempts to rally to 82,300 again and fails, and then closes below 81,000, it will form a bearish 2B fake breakout signal. But if the pullback to 80,500-81,000 finds support and then breaks above 82,300, the bullish 2B structure is confirmed. We are currently in a critical observation window.
ETH likewise: 2530 is short-term resistance. If it pulls back to 2,500 without breaking, and then attacks again, the bullish trend continues.
3️⃣ Dow Theory
Daily level: BTC continues rising from the 76,000 low, breaking through the 80,000 psychological level, confirming the uptrend is ongoing. The prior secondary pullback between 77,000-78,000 has already played out. Now the main trend is gaining strength again. ETH has broken above the 2,400 resistance zone, confirming trend synchrony with BTC. Key defense levels: BTC 78,000 / ETH 2,400.
🛡️ Trading Strategy
• BTC (Bullish): on a pullback to 81,000-81,500, test long with a small position; stop loss 79,800; targets 83,000-85,000
• BTC (Wait-and-see): if 80,500 is lost, then wait until 78,000-79,000 to enter
• ETH (Bullish): on a pullback near 2,500, test long; stop loss 2,430; targets 2,600-2,700
• Risk control reminder: volatility is intense early in the breakout—keep position size at 3-5%, and don’t chase highs
#BTC走势分析 #ETH走势分析 #Wyckoff #道氏理论
252

·
--
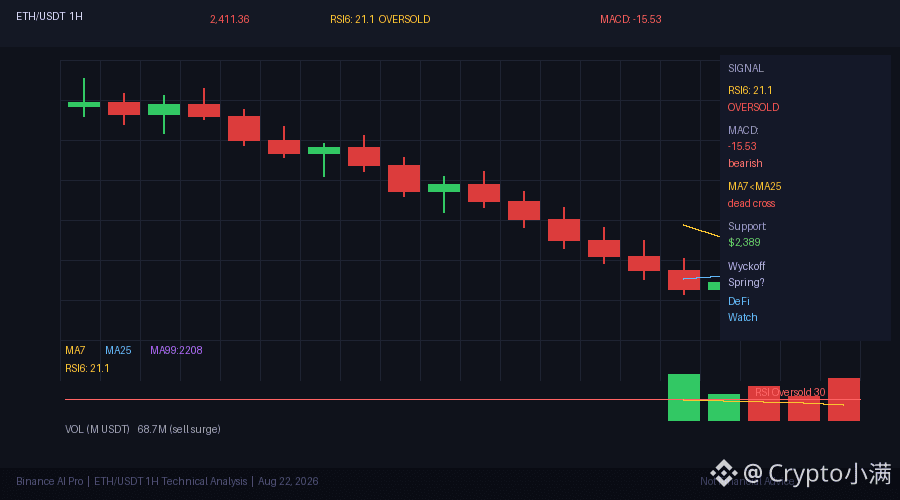
ETH is now $2411, and over the past 5 hours it has kept falling with not a single bullish candle.
But do you know this? RSI6 has already dropped to 21—that’s an extremely oversold zone. The most recent candlestick’s volume has surged to 68.7M, about 1.7 times higher than the previous candles. This kind of volume, combined with price making fresh lows, matches the classic traits of a Wyckoff spring trap.
The Wyckoff theory is very clear: near a key support level, the main force will use a fierce probing move to break through all the weak hands’ stop losses, then quickly pull the price back up. Currently, $2,389 is that critical support. If this drop is only a false break, the following rebound strength could exceed most people’s expectations.
Still, don’t get too optimistic. MA7 has already crossed below MA25 to form a dead cross, and the MACD histogram has been continuously expanding to -15.5. Short-term momentum remains bearish. Large DeFi funds usually don’t buy the dip right when the dead cross is first confirmed. They wait for the signal that RSI6 returns above 30 and the trading volume starts to contract.
My logic is simple: if $2389 hasn’t been broken down effectively, don’t rush to short; if it does break, don’t rush to buy either—wait until the volume shrinks. A real spring isn’t something everyone can sit on.
#ETH #DeFi #Wyckoff
ETH is now $2411, and over the past 5 hours it has kept falling with not a single bullish candle.
But do you know this? RSI6 has already dropped to 21—that’s an extremely oversold zone. The most recent candlestick’s volume has surged to 68.7M, about 1.7 times higher than the previous candles. This kind of volume, combined with price making fresh lows, matches the classic traits of a Wyckoff spring trap.
The Wyckoff theory is very clear: near a key support level, the main force will use a fierce probing move to break through all the weak hands’ stop losses, then quickly pull the price back up. Currently, $2,389 is that critical support. If this drop is only a false break, the following rebound strength could exceed most people’s expectations.
Still, don’t get too optimistic. MA7 has already crossed below MA25 to form a dead cross, and the MACD histogram has been continuously expanding to -15.5. Short-term momentum remains bearish. Large DeFi funds usually don’t buy the dip right when the dead cross is first confirmed. They wait for the signal that RSI6 returns above 30 and the trading volume starts to contract.
My logic is simple: if $2389 hasn’t been broken down effectively, don’t rush to short; if it does break, don’t rush to buy either—wait until the volume shrinks. A real spring isn’t something everyone can sit on.
#ETH #DeFi #Wyckoff
But do you know this? RSI6 has already dropped to 21—that’s an extremely oversold zone. The most recent candlestick’s volume has surged to 68.7M, about 1.7 times higher than the previous candles. This kind of volume, combined with price making fresh lows, matches the classic traits of a Wyckoff spring trap.
The Wyckoff theory is very clear: near a key support level, the main force will use a fierce probing move to break through all the weak hands’ stop losses, then quickly pull the price back up. Currently, $2,389 is that critical support. If this drop is only a false break, the following rebound strength could exceed most people’s expectations.
Still, don’t get too optimistic. MA7 has already crossed below MA25 to form a dead cross, and the MACD histogram has been continuously expanding to -15.5. Short-term momentum remains bearish. Large DeFi funds usually don’t buy the dip right when the dead cross is first confirmed. They wait for the signal that RSI6 returns above 30 and the trading volume starts to contract.
My logic is simple: if $2389 hasn’t been broken down effectively, don’t rush to short; if it does break, don’t rush to buy either—wait until the volume shrinks. A real spring isn’t something everyone can sit on.
#ETH #DeFi #Wyckoff
173

·
--
🚨 $ETH IS QUIETLY BUILDING SOMETHING BIG
Price just cleared $2,360 resistance... but don't get excited yet. This is textbook Wyckoff Accumulation, and Phase 1 isn't the fun part.
📊 What the structure is telling me:
ETH is completing its resistance test after the recent push. History says what comes next isn't a straight rally — it's a shakeout.
🗺️ My 3–6 Month Roadmap:
1️⃣ Decline → retest $1,750–$1,500 support
2️⃣ Breakdown → "Spring" flush near $1,300 (final shakeout)
3️⃣ Recovery → support retest confirms strength
4️⃣ Rally → "Sign of Strength" + "Backup" (BU)
5️⃣ Breakout → resistance clears → path to $4,000
🎯 Trade Plan (Spot)
📍 Entry Zone: $1,350 – $1,500 (post-Spring accumulation)
🎯 TP1: $2,360
🎯 TP2: $2,700
🎯 TP3: $4,000
🛑 Invalidation: Daily close below $1,250
⚡ Bottom line: Expect pain before the pump. A drop toward ~$1,300 looks likely first — that's the opportunity, not the exit signal. By year-end, we could already be sitting around $2,700 if Phase 4 plays out on schedule.
🔔 Don't chase this move. Turn on notifications — I'll flag the Spring when it hits.
⚠️ NFA. DYOR.
#ETH #Wyckoff #CryptoRoadmap
🚨 $ETH IS QUIETLY BUILDING SOMETHING BIG
Price just cleared $2,360 resistance... but don't get excited yet. This is textbook Wyckoff Accumulation, and Phase 1 isn't the fun part.
📊 What the structure is telling me:
ETH is completing its resistance test after the recent push. History says what comes next isn't a straight rally — it's a shakeout.
🗺️ My 3–6 Month Roadmap:
1️⃣ Decline → retest $1,750–$1,500 support
2️⃣ Breakdown → "Spring" flush near $1,300 (final shakeout)
3️⃣ Recovery → support retest confirms strength
4️⃣ Rally → "Sign of Strength" + "Backup" (BU)
5️⃣ Breakout → resistance clears → path to $4,000
🎯 Trade Plan (Spot)
📍 Entry Zone: $1,350 – $1,500 (post-Spring accumulation)
🎯 TP1: $2,360
🎯 TP2: $2,700
🎯 TP3: $4,000
🛑 Invalidation: Daily close below $1,250
⚡ Bottom line: Expect pain before the pump. A drop toward ~$1,300 looks likely first — that's the opportunity, not the exit signal. By year-end, we could already be sitting around $2,700 if Phase 4 plays out on schedule.
🔔 Don't chase this move. Turn on notifications — I'll flag the Spring when it hits.
⚠️ NFA. DYOR.
#ETH #Wyckoff #CryptoRoadmap
Price just cleared $2,360 resistance... but don't get excited yet. This is textbook Wyckoff Accumulation, and Phase 1 isn't the fun part.
📊 What the structure is telling me:
ETH is completing its resistance test after the recent push. History says what comes next isn't a straight rally — it's a shakeout.
🗺️ My 3–6 Month Roadmap:
1️⃣ Decline → retest $1,750–$1,500 support
2️⃣ Breakdown → "Spring" flush near $1,300 (final shakeout)
3️⃣ Recovery → support retest confirms strength
4️⃣ Rally → "Sign of Strength" + "Backup" (BU)
5️⃣ Breakout → resistance clears → path to $4,000
🎯 Trade Plan (Spot)
📍 Entry Zone: $1,350 – $1,500 (post-Spring accumulation)
🎯 TP1: $2,360
🎯 TP2: $2,700
🎯 TP3: $4,000
🛑 Invalidation: Daily close below $1,250
⚡ Bottom line: Expect pain before the pump. A drop toward ~$1,300 looks likely first — that's the opportunity, not the exit signal. By year-end, we could already be sitting around $2,700 if Phase 4 plays out on schedule.
🔔 Don't chase this move. Turn on notifications — I'll flag the Spring when it hits.
⚠️ NFA. DYOR.
#ETH #Wyckoff #CryptoRoadmap
1
13

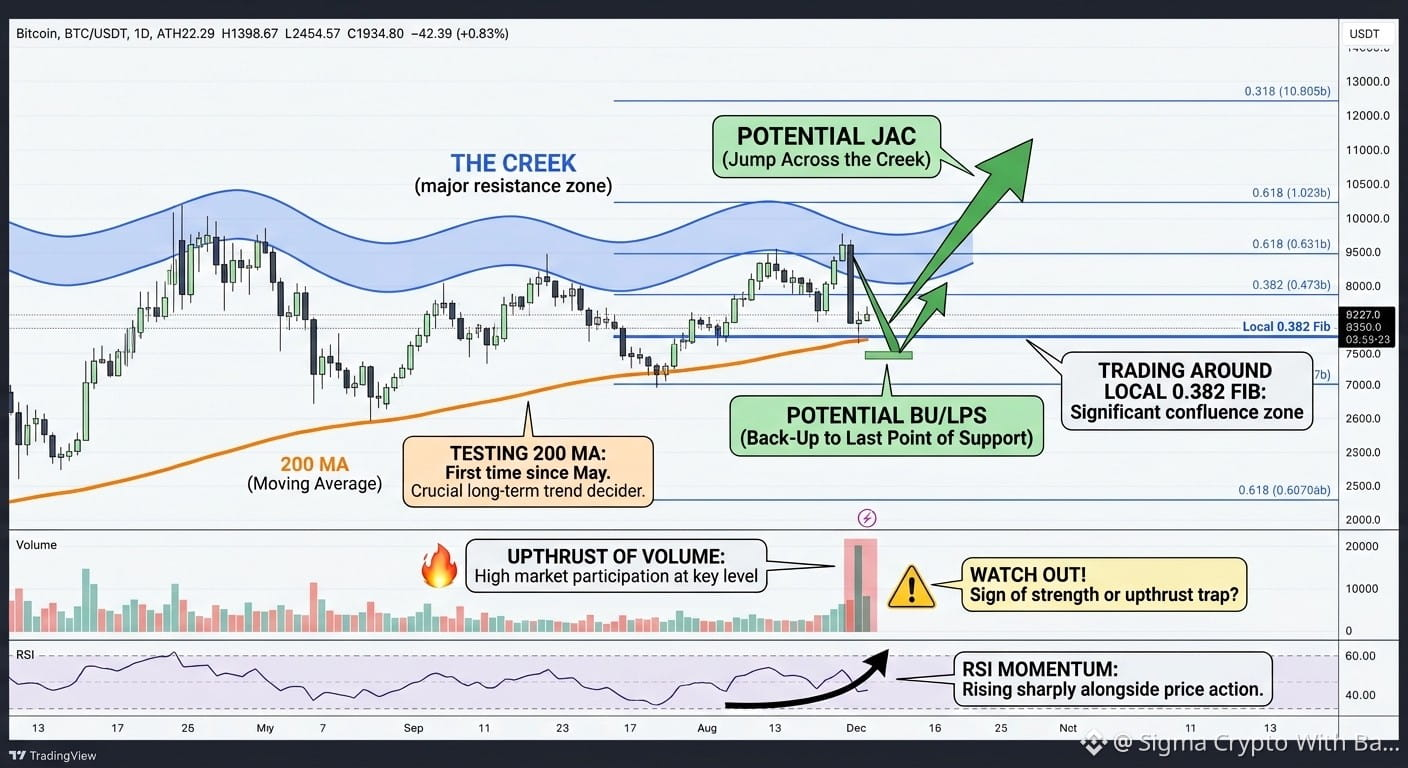
🚀 Bitcoin Testing Major Wyckoff Transition: Jump Across the Creek (JAC)?
#Bitcoin is currently testing key technical inflection points that could decide its next major direction.
💥 Here’s the breakdown:
1. Wyckoff Structure: Seeking a Sign of Strength (SOS)
The Setup: BTC is attempting a potential Jump Across the Creek (JAC). In Wyckoff terms, this represents a decisive breakout above a major resistance zone ("the creek").
What to Watch: If confirmed, we should expect a classic Back-Up (BU) / Last Point of Support (LPS) retest of former resistance to validate the breakout before markup continues.
2. Critical Technical Levels
200 MA Retest: Testing the 200-day Moving Average for the 1st time since May. Reclaiming this long-term trend indicator is vital for institutional macro confirmation.
0.382 Fibonacci Level: Hovering right around the local 0.382 Fib retracement, creating a tight confluence zone between moving average resistance and dynamic Fib levels.
3. Volume & Momentum: Surge vs. Trap
Volume Spike: A major upthrust in volume shows strong market participation, but where it closes matters most.
RSI Momentum: Relative Strength Index is accelerating upward alongside the price action.
👉 The Risk: High volume at resistance can signal institutional absorption (breakout fuel) OR an Upthrust (UT) designed to trap late buyers if the candle fails to hold above the level.
💡 Key Takeaway: We are at a make-or-break pivot. A daily close above the 200 MA and Fib confluence confirms a valid Wyckoff JAC. A sharp rejection on this heavy volume signals an Upthrust liquidity trap.
Are you buying the breakout or waiting for the pullback test? Drop your analysis below! 👇
#BTC #TechnicalAnalysis #wyckoff $BTC
🚀 Bitcoin Testing Major Wyckoff Transition: Jump Across the Creek (JAC)?
#Bitcoin is currently testing key technical inflection points that could decide its next major direction.
💥 Here’s the breakdown:
1. Wyckoff Structure: Seeking a Sign of Strength (SOS)
The Setup: BTC is attempting a potential Jump Across the Creek (JAC). In Wyckoff terms, this represents a decisive breakout above a major resistance zone ("the creek").
What to Watch: If confirmed, we should expect a classic Back-Up (BU) / Last Point of Support (LPS) retest of former resistance to validate the breakout before markup continues.
2. Critical Technical Levels
200 MA Retest: Testing the 200-day Moving Average for the 1st time since May. Reclaiming this long-term trend indicator is vital for institutional macro confirmation.
0.382 Fibonacci Level: Hovering right around the local 0.382 Fib retracement, creating a tight confluence zone between moving average resistance and dynamic Fib levels.
3. Volume & Momentum: Surge vs. Trap
Volume Spike: A major upthrust in volume shows strong market participation, but where it closes matters most.
RSI Momentum: Relative Strength Index is accelerating upward alongside the price action.
👉 The Risk: High volume at resistance can signal institutional absorption (breakout fuel) OR an Upthrust (UT) designed to trap late buyers if the candle fails to hold above the level.
💡 Key Takeaway: We are at a make-or-break pivot. A daily close above the 200 MA and Fib confluence confirms a valid Wyckoff JAC. A sharp rejection on this heavy volume signals an Upthrust liquidity trap.
Are you buying the breakout or waiting for the pullback test? Drop your analysis below! 👇
#BTC #TechnicalAnalysis #wyckoff $BTC
#Bitcoin is currently testing key technical inflection points that could decide its next major direction.
💥 Here’s the breakdown:
1. Wyckoff Structure: Seeking a Sign of Strength (SOS)
The Setup: BTC is attempting a potential Jump Across the Creek (JAC). In Wyckoff terms, this represents a decisive breakout above a major resistance zone ("the creek").
What to Watch: If confirmed, we should expect a classic Back-Up (BU) / Last Point of Support (LPS) retest of former resistance to validate the breakout before markup continues.
2. Critical Technical Levels
200 MA Retest: Testing the 200-day Moving Average for the 1st time since May. Reclaiming this long-term trend indicator is vital for institutional macro confirmation.
0.382 Fibonacci Level: Hovering right around the local 0.382 Fib retracement, creating a tight confluence zone between moving average resistance and dynamic Fib levels.
3. Volume & Momentum: Surge vs. Trap
Volume Spike: A major upthrust in volume shows strong market participation, but where it closes matters most.
RSI Momentum: Relative Strength Index is accelerating upward alongside the price action.
👉 The Risk: High volume at resistance can signal institutional absorption (breakout fuel) OR an Upthrust (UT) designed to trap late buyers if the candle fails to hold above the level.
💡 Key Takeaway: We are at a make-or-break pivot. A daily close above the 200 MA and Fib confluence confirms a valid Wyckoff JAC. A sharp rejection on this heavy volume signals an Upthrust liquidity trap.
Are you buying the breakout or waiting for the pullback test? Drop your analysis below! 👇
#BTC #TechnicalAnalysis #wyckoff $BTC
218

·
--
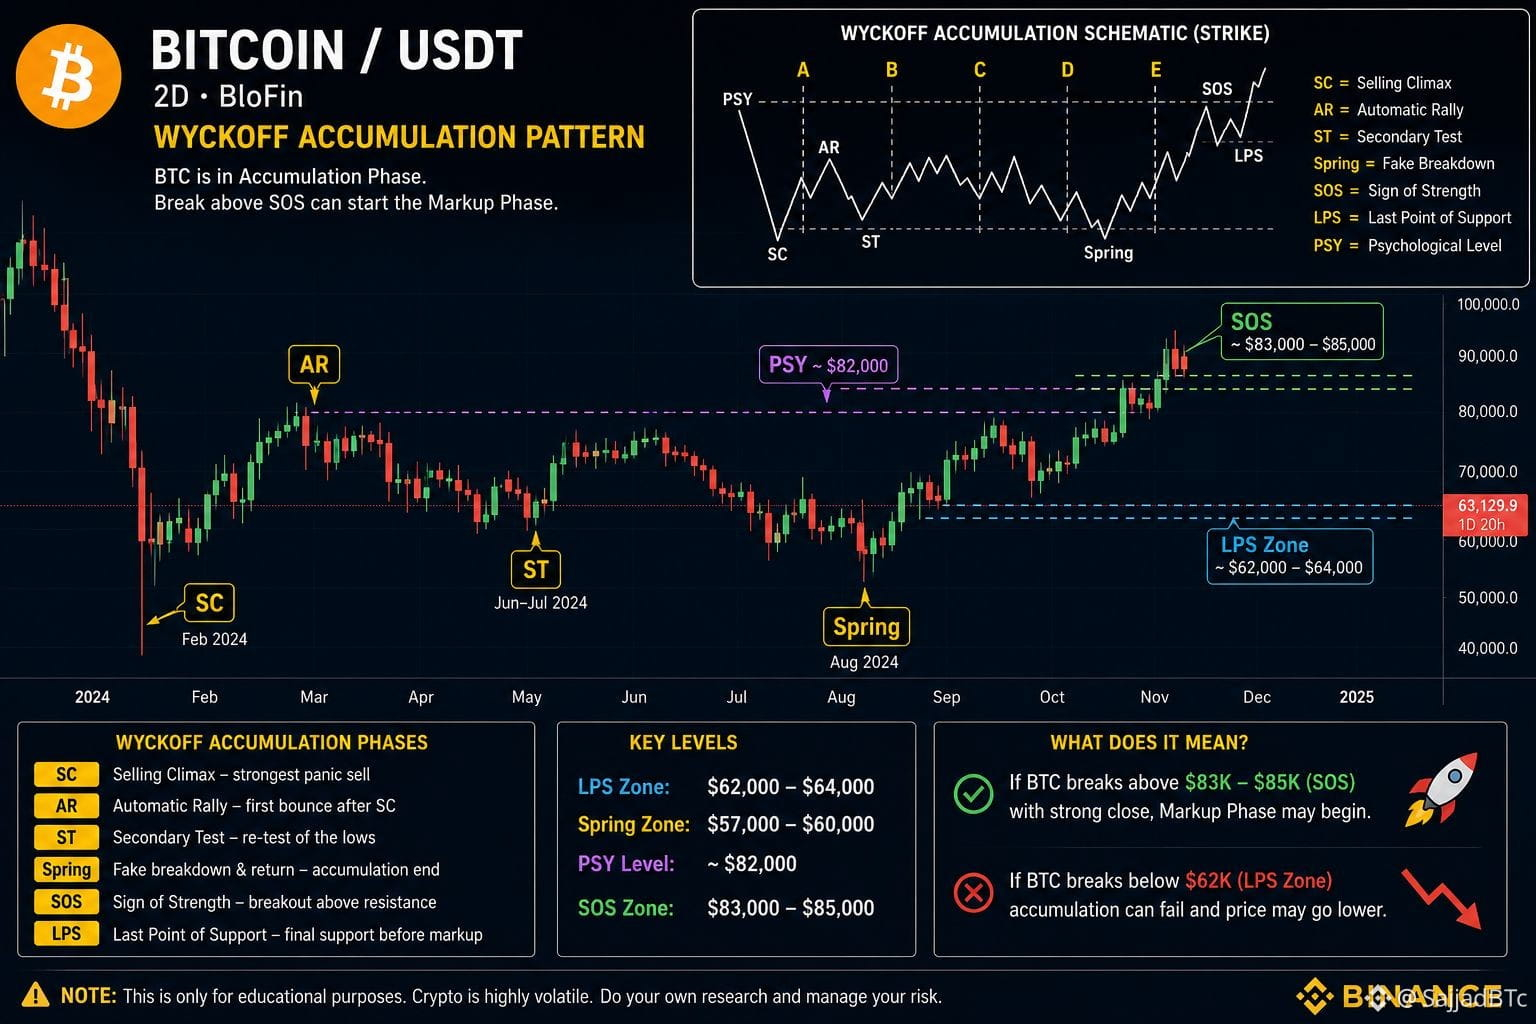
🚨$BTC BITCOIN ($BTC ) — WYCKOFF ACCUMULATION SETUP 📊
BTC is currently looking like it’s in an important Accumulation Phase.
🔹 $62K–$64K = key support / LPS zone
🔹 $57K–$60K = previous Spring zone
🔹 $83K–$85K = major breakout / SOS zone
If BTC gives a strong close above $83K–$85K, then according to Wyckoff structure, it could signal the Markup Phase. 🚀
⚠️ If the $62K support breaks decisively, the bullish setup may weaken.
#Bitcoin #BTC #Crypto #Wyckoff #Crypto
🚨$BTC BITCOIN ($BTC ) — WYCKOFF ACCUMULATION SETUP 📊
BTC is currently looking like it’s in an important Accumulation Phase.
🔹 $62K–$64K = key support / LPS zone
🔹 $57K–$60K = previous Spring zone
🔹 $83K–$85K = major breakout / SOS zone
If BTC gives a strong close above $83K–$85K, then according to Wyckoff structure, it could signal the Markup Phase. 🚀
⚠️ If the $62K support breaks decisively, the bullish setup may weaken.
#Bitcoin #BTC #Crypto #Wyckoff #Crypto
BTC is currently looking like it’s in an important Accumulation Phase.
🔹 $62K–$64K = key support / LPS zone
🔹 $57K–$60K = previous Spring zone
🔹 $83K–$85K = major breakout / SOS zone
If BTC gives a strong close above $83K–$85K, then according to Wyckoff structure, it could signal the Markup Phase. 🚀
⚠️ If the $62K support breaks decisively, the bullish setup may weaken.
#Bitcoin #BTC #Crypto #Wyckoff #Crypto
25

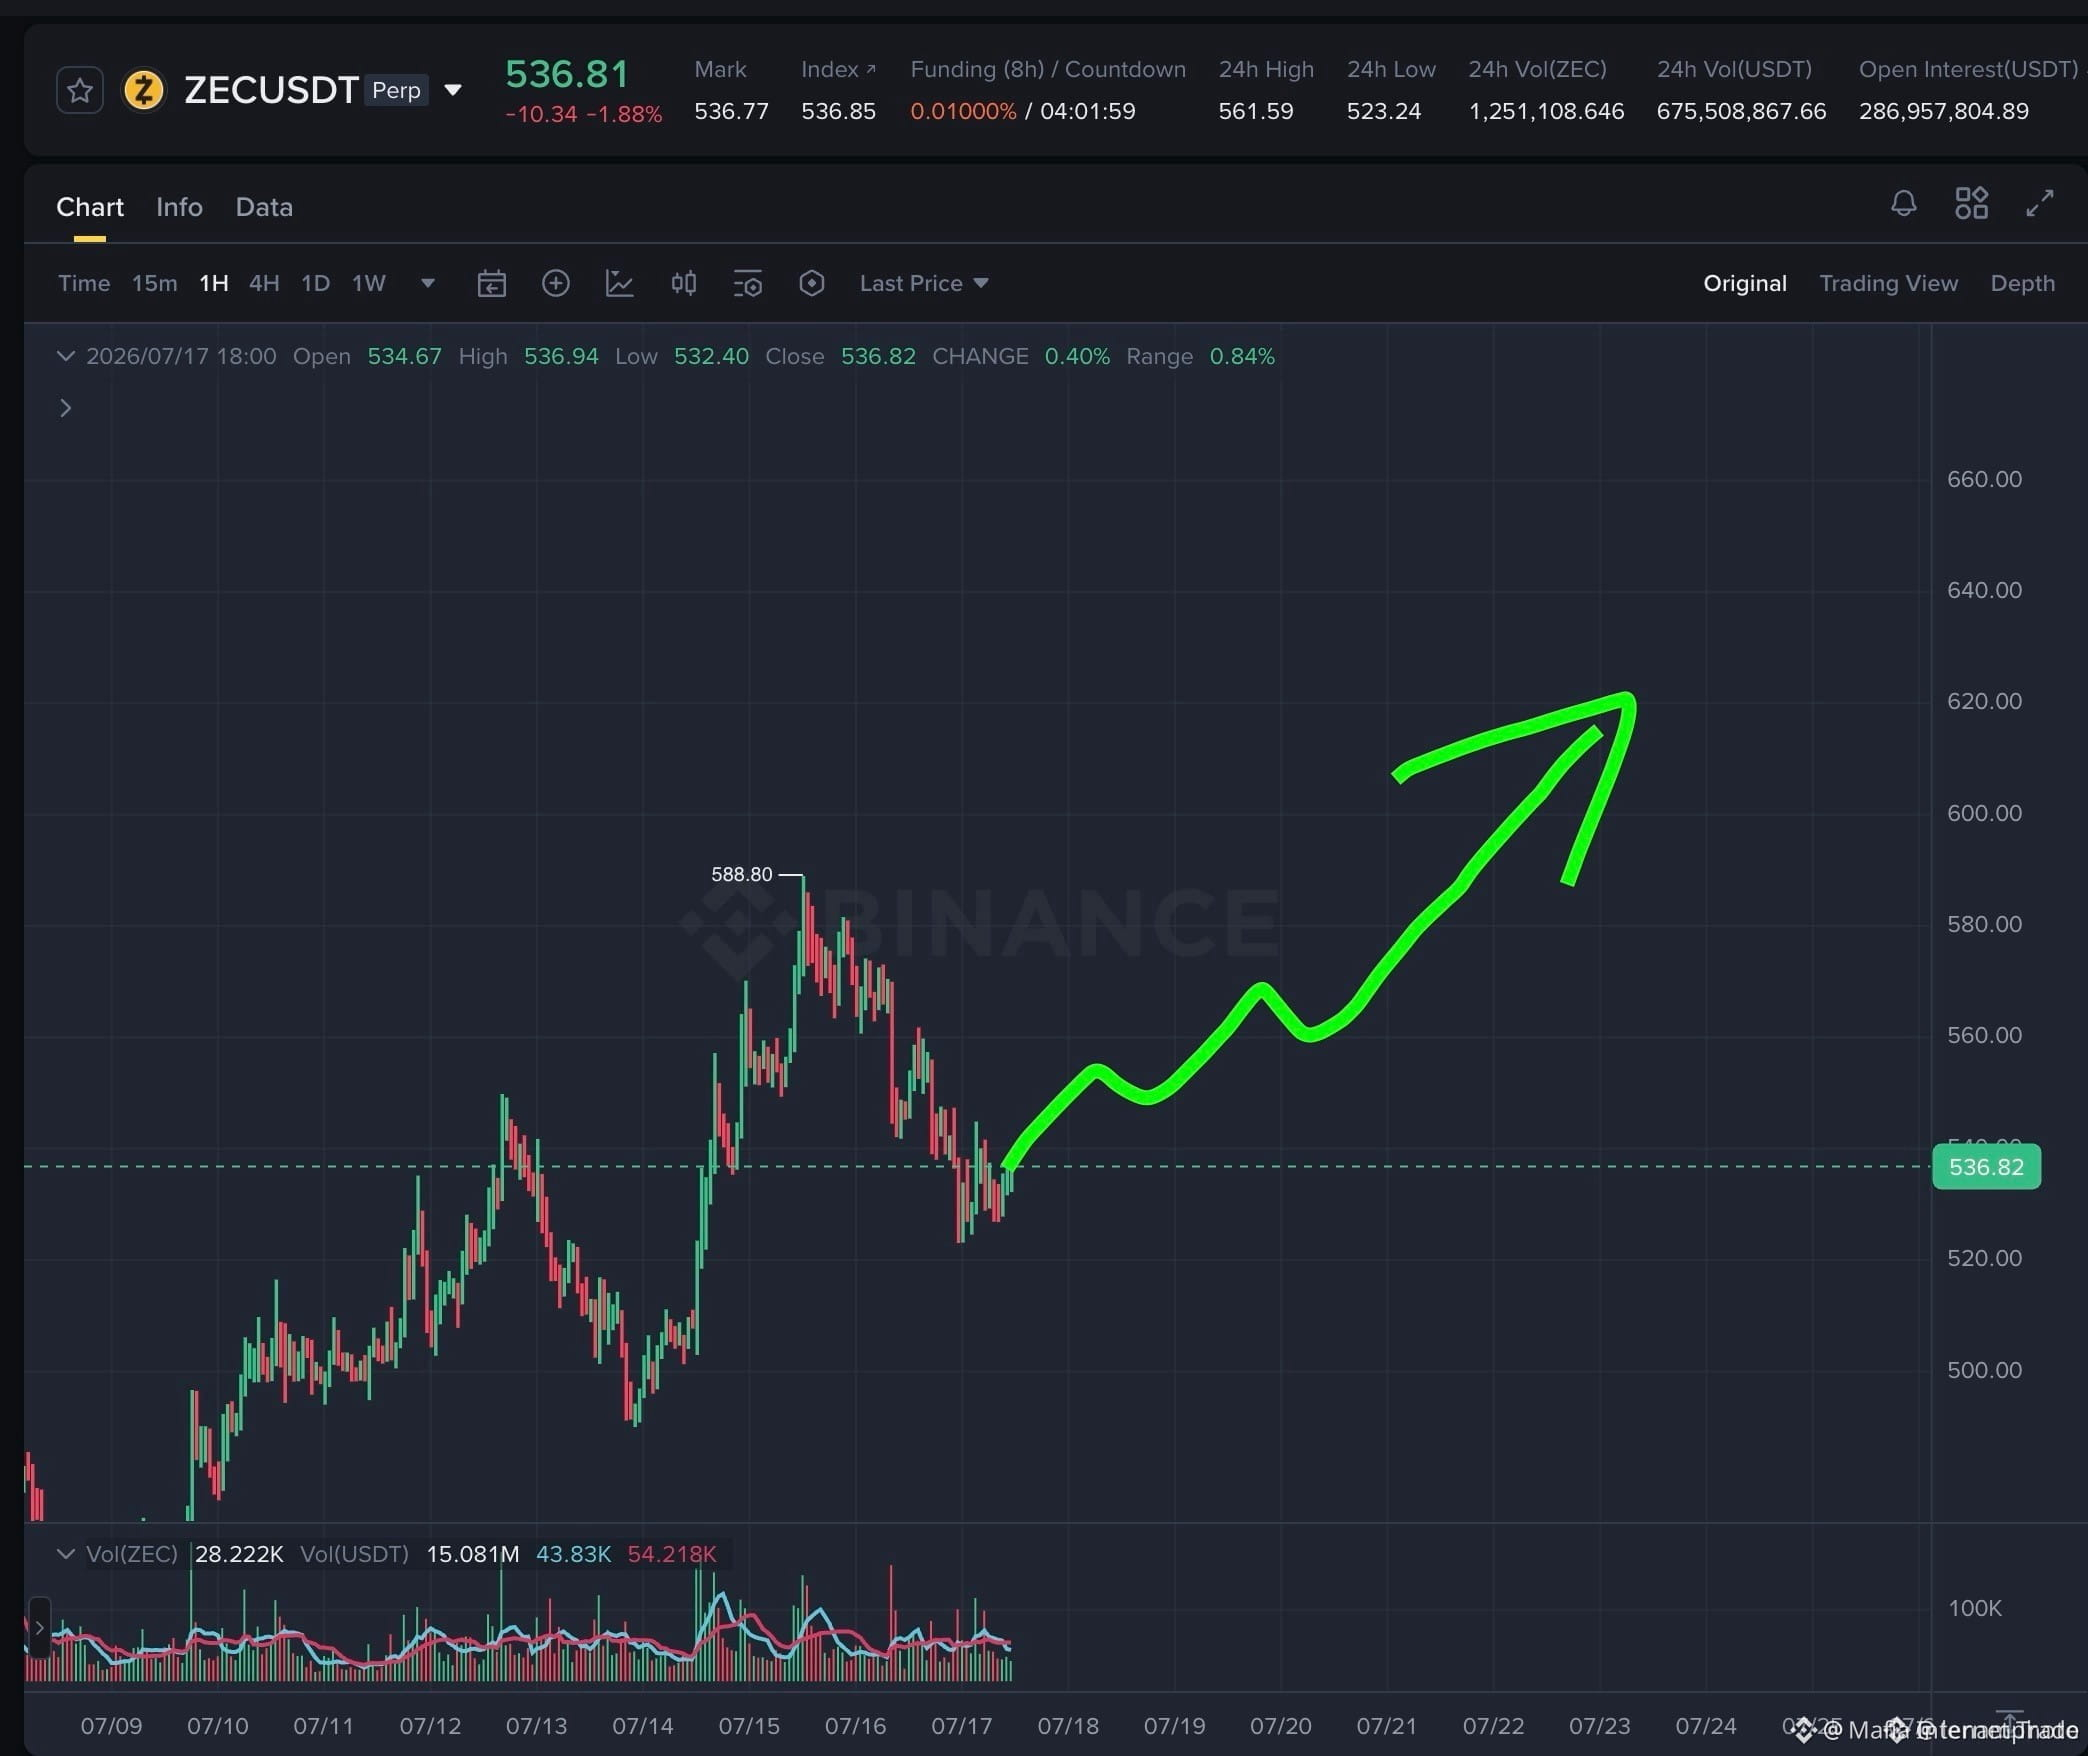
$ZEC WYCKOFF RE-ACCUMULATION ZONE – DIP BUYING ZONE 🔥
Entry: $525 - $537 🔥
Target: $565 🚀
Stop Loss: $505 ⚠️
ZEC just completed a textbook Wyckoff markup from $350 and ran to $588.80. Now it's pulling back into the re-accum zone on declining volume — that's how healthy corrections look. Open interest sits at $286M with funding at 0.01%, meaning no one's crowded into this yet.
The 4H structure points to $623 as the next target once the consolidation clears. $675M in 24H volume confirms real liquidity behind this move, not a low-cap pop. Are you catching this dip or waiting for a lower entry?
Not financial advice. Always manage your risk.
#ZEC #LongSetup #Wyckoff #Crypto
⚡
$ZEC WYCKOFF RE-ACCUMULATION ZONE – DIP BUYING ZONE 🔥
Entry: $525 - $537 🔥
Target: $565 🚀
Stop Loss: $505 ⚠️
ZEC just completed a textbook Wyckoff markup from $350 and ran to $588.80. Now it's pulling back into the re-accum zone on declining volume — that's how healthy corrections look. Open interest sits at $286M with funding at 0.01%, meaning no one's crowded into this yet.
The 4H structure points to $623 as the next target once the consolidation clears. $675M in 24H volume confirms real liquidity behind this move, not a low-cap pop. Are you catching this dip or waiting for a lower entry?
Not financial advice. Always manage your risk.
#ZEC #LongSetup #Wyckoff #Crypto
⚡
Entry: $525 - $537 🔥
Target: $565 🚀
Stop Loss: $505 ⚠️
ZEC just completed a textbook Wyckoff markup from $350 and ran to $588.80. Now it's pulling back into the re-accum zone on declining volume — that's how healthy corrections look. Open interest sits at $286M with funding at 0.01%, meaning no one's crowded into this yet.
The 4H structure points to $623 as the next target once the consolidation clears. $675M in 24H volume confirms real liquidity behind this move, not a low-cap pop. Are you catching this dip or waiting for a lower entry?
Not financial advice. Always manage your risk.
#ZEC #LongSetup #Wyckoff #Crypto
⚡
68

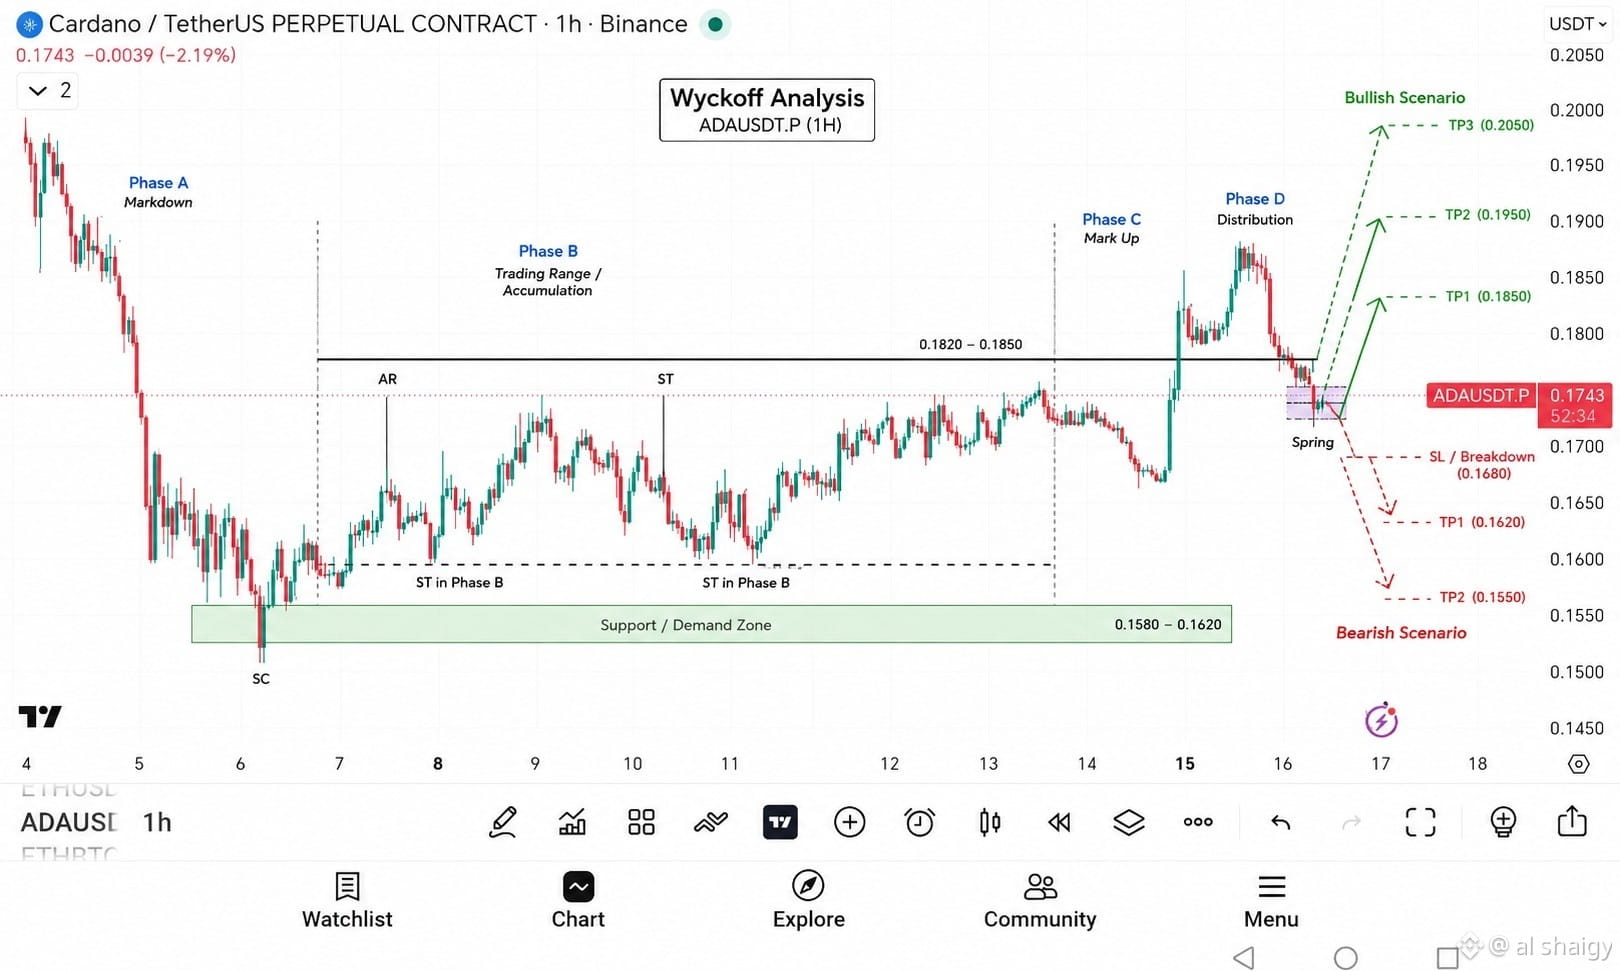
$ADA showing a potential Wyckoff Spring on the 1H candlestick.
✅ Above 0.168 → Targets: 0.185 → 0.195 → 0.205
❌ Below 0.168 → Risk of drop toward 0.162 and 0.155
Key level to watch: 0.168
#ADA #Cardano #Crypto #Wyckoff
#ADAUSDT | Wyckoff Analysis 📊
Looks like #Cardano has wrapped up the Accumulation phase and is now testing a key support area near 0.172-0.174.
🔹 Holding above 0.168 might push the price towards:
🎯 0.185
🎯 0.195
🎯 0.205
🔻 A clear break below 0.168 could open the gates to:
⚠️ 0.162
⚠️ 0.155
Currently, I'm treating the movement as a re-test (Spring) within the Wyckoff model until proven otherwise.
#Crypto #ADA #Cardano #Binance #TradingView #Wyckoff #Altcoins
$ADA showing a potential Wyckoff Spring on the 1H candlestick.
✅ Above 0.168 → Targets: 0.185 → 0.195 → 0.205
❌ Below 0.168 → Risk of drop toward 0.162 and 0.155
Key level to watch: 0.168
#ADA #Cardano #Crypto #Wyckoff
#ADAUSDT | Wyckoff Analysis 📊
Looks like #Cardano has wrapped up the Accumulation phase and is now testing a key support area near 0.172-0.174.
🔹 Holding above 0.168 might push the price towards:
🎯 0.185
🎯 0.195
🎯 0.205
🔻 A clear break below 0.168 could open the gates to:
⚠️ 0.162
⚠️ 0.155
Currently, I'm treating the movement as a re-test (Spring) within the Wyckoff model until proven otherwise.
#Crypto #ADA #Cardano #Binance #TradingView #Wyckoff #Altcoins
✅ Above 0.168 → Targets: 0.185 → 0.195 → 0.205
❌ Below 0.168 → Risk of drop toward 0.162 and 0.155
Key level to watch: 0.168
#ADA #Cardano #Crypto #Wyckoff
#ADAUSDT | Wyckoff Analysis 📊
Looks like #Cardano has wrapped up the Accumulation phase and is now testing a key support area near 0.172-0.174.
🔹 Holding above 0.168 might push the price towards:
🎯 0.185
🎯 0.195
🎯 0.205
🔻 A clear break below 0.168 could open the gates to:
⚠️ 0.162
⚠️ 0.155
Currently, I'm treating the movement as a re-test (Spring) within the Wyckoff model until proven otherwise.
#Crypto #ADA #Cardano #Binance #TradingView #Wyckoff #Altcoins
132

MOST traders are gonna keep LOSING money in crypto due to a simple mistake: focusing on the effect and ignoring the cause.
You see a coin pumping 20% in a day, the FOMO hits, and you rush to buy. That’s trading the effect. It’s the trail of money that’s already moved.
Real profits are made beforehand, at the cause.
According to Wyckoff's Law of Cause and Effect, the strength of a trend (effect) is directly proportional to the time the price spent preparing (cause).
Whales spend weeks quietly accumulating assets, making no noise. When the chart explodes, their work is done and your mistake begins.
Stop chasing giant green candlesticks. Monitor the consolidations with volume.
Are you just gonna keep buying the top or are you gonna learn to track the whales’ accumulation? Comment below.
$ID
#wyckoff
#TradingTips
MOST traders are gonna keep LOSING money in crypto due to a simple mistake: focusing on the effect and ignoring the cause.
You see a coin pumping 20% in a day, the FOMO hits, and you rush to buy. That’s trading the effect. It’s the trail of money that’s already moved.
Real profits are made beforehand, at the cause.
According to Wyckoff's Law of Cause and Effect, the strength of a trend (effect) is directly proportional to the time the price spent preparing (cause).
Whales spend weeks quietly accumulating assets, making no noise. When the chart explodes, their work is done and your mistake begins.
Stop chasing giant green candlesticks. Monitor the consolidations with volume.
Are you just gonna keep buying the top or are you gonna learn to track the whales’ accumulation? Comment below.
$ID
#wyckoff
#TradingTips
You see a coin pumping 20% in a day, the FOMO hits, and you rush to buy. That’s trading the effect. It’s the trail of money that’s already moved.
Real profits are made beforehand, at the cause.
According to Wyckoff's Law of Cause and Effect, the strength of a trend (effect) is directly proportional to the time the price spent preparing (cause).
Whales spend weeks quietly accumulating assets, making no noise. When the chart explodes, their work is done and your mistake begins.
Stop chasing giant green candlesticks. Monitor the consolidations with volume.
Are you just gonna keep buying the top or are you gonna learn to track the whales’ accumulation? Comment below.
$ID
#wyckoff
#TradingTips

211
Log in to explore more content
Join global crypto users on Binance Square
⚡️ Get latest and useful information about crypto.
💬 Trusted by the world’s largest crypto exchange.
👍 Discover real insights from verified creators.
Email / Phone number
Trending Topics
1
#BitcoinHoldsAbove$77000
2,080 views
91 Discussing
2
#FedHikeOddsRiseTo89%
7,925 views
344 Discussing
3
#BitcoinCrosses$78000
4,744 views
160 Discussing
4
#RLUSDSupplyHitsRecord$2.442B
73 views
10 Discussing
5
#AvalancheIntegratesIntoUAEPassDigitalVault
22,206 views
554 Discussing
6
#UKSeeksViewsOnTokenizingGold
15,017 views
380 Discussing
7
#AnthropicCEOCallsForAISlowdown
178,143 views
2,856 Discussing
8
#RevolutDataLeakReportedlyPostedAttackersThreatenDailyReleases
3,210 views
74 Discussing
9
#BrazilCentralBankRaisesVASPCapitalRequirements
22,737 views
593 Discussing
10
#BitcoinThirdSingleBlockReorgInFourWeeks
61,501 views
1,345 Discussing