
#tradingtips
tradingtips
9.8M views
22,684 Discussing
Hot
Latest

·
--
Bullish
Seeing TUT move up can create one dangerous feeling:
“I need to buy now!”
That's exactly when traders often enter late.
Instead, wait for a pullback, confirmation, or a clean breakout with volume.
The goal isn't to catch every candle.
The goal is to catch the right move. 🎯
#TUT #TradingTips #crypto #BinanceSquare $TUT $MUBARAK
Seeing TUT move up can create one dangerous feeling:
“I need to buy now!”
That's exactly when traders often enter late.
Instead, wait for a pullback, confirmation, or a clean breakout with volume.
The goal isn't to catch every candle.
The goal is to catch the right move. 🎯
#TUT #TradingTips #crypto #BinanceSquare $TUT $MUBARAK
“I need to buy now!”
That's exactly when traders often enter late.
Instead, wait for a pullback, confirmation, or a clean breakout with volume.
The goal isn't to catch every candle.
The goal is to catch the right move. 🎯
#TUT #TradingTips #crypto #BinanceSquare $TUT $MUBARAK
2
416

·
--
Beginner Mistake: Buying the Top of a Pump 📉
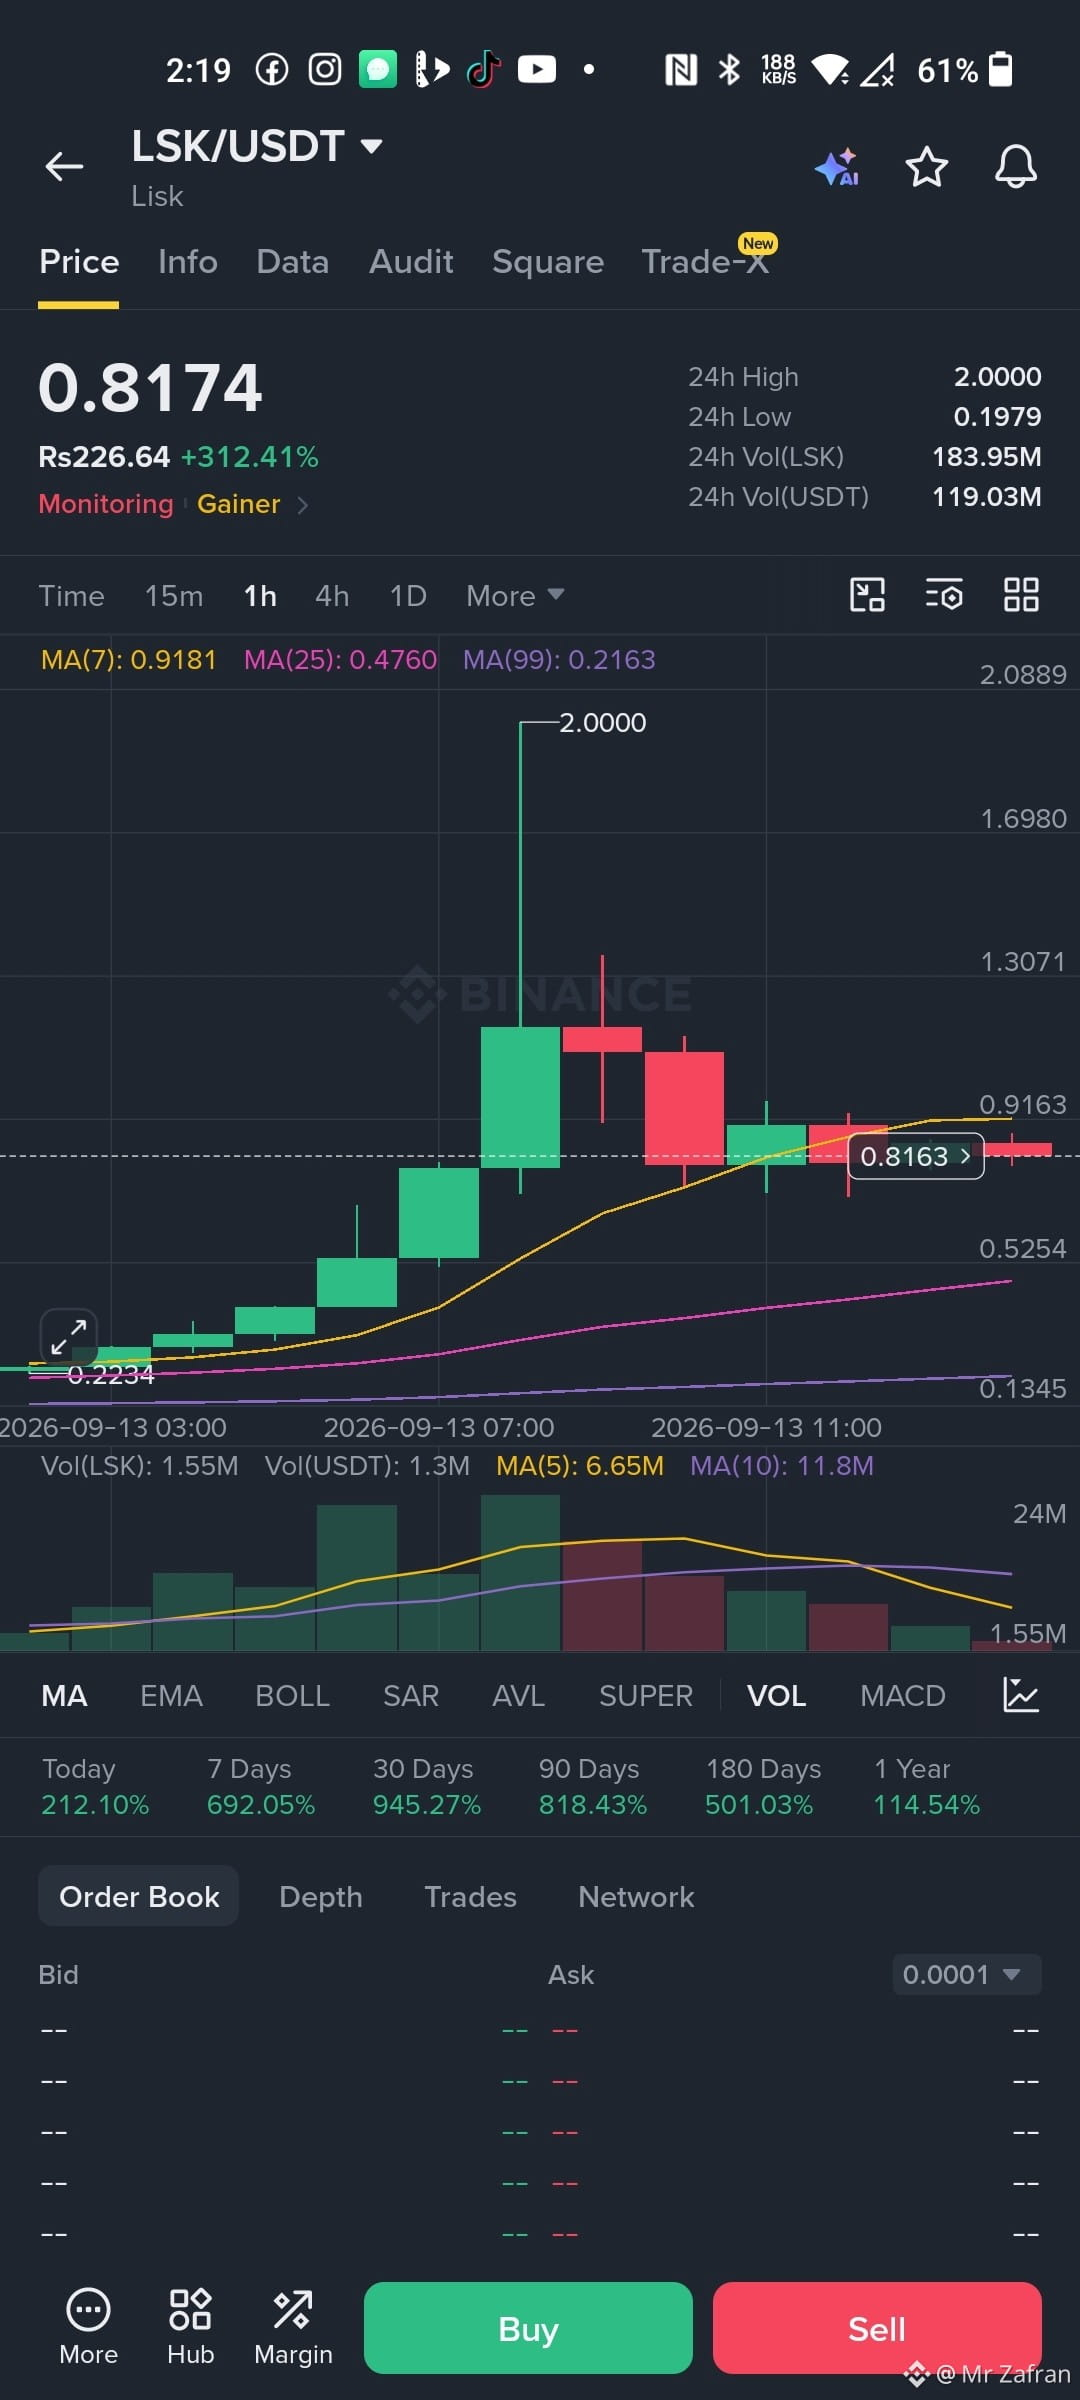
LSK pumped +312% today. Most beginners buy here out of FOMO, then panic when it dumps 50%.
Pro tip: Never chase vertical candles. Wait for consolidation, set a stop-loss, and only risk what you can afford to lose.
Did you ever buy the top? Be honest 👇
#CryptoEducation #TradingTips #BinanceSquare
$LSK
{spot}(LSKUSDT)
Beginner Mistake: Buying the Top of a Pump 📉
LSK pumped +312% today. Most beginners buy here out of FOMO, then panic when it dumps 50%.
Pro tip: Never chase vertical candles. Wait for consolidation, set a stop-loss, and only risk what you can afford to lose.
Did you ever buy the top? Be honest 👇
#CryptoEducation #TradingTips #BinanceSquare
$LSK
LSK pumped +312% today. Most beginners buy here out of FOMO, then panic when it dumps 50%.
Pro tip: Never chase vertical candles. Wait for consolidation, set a stop-loss, and only risk what you can afford to lose.
Did you ever buy the top? Be honest 👇
#CryptoEducation #TradingTips #BinanceSquare
$LSK
94

Demystifying Market Depth: How to Read Order Books and Measure Liquidity Beyond Price ChartsWhen most market participants look at cryptocurrency trading interfaces, their eyes naturally gravitate toward candlestick charts. These visual representations of historical price action—complete with moving averages, relative strength indicators, and trendlines—provide valuable context about where a market has been. However, candlestick charts only tell half the story. They display executed transactions from the past, but they reveal very little about the immediate structural liquidity waiting to absorb future trades.
To understand how prices actually move in real time, intermediate traders must look beneath the surface of chart patterns and examine market depth. Market depth offers a real-time window into the pending buy and sell orders residing within an exchange’s order book. By learning how to interpret order book structure, bid-ask spreads, and order density, traders can develop a clearer understanding of market liquidity, prospective slippage, and institutional order execution.
---
### Understanding the Order Book Mechanics
At its core, a centralized cryptocurrency exchange operates a continuous double-auction mechanism. This system matches buyers and sellers using an automated matching engine based on price and time priority.
The order book is divided into two main sides:
1. **The Bid Side (Buyers):** Located on one side of the order book, bids represent open limit orders from participants willing to buy an asset at specific prices below the current trading price. The highest bid is the highest price a buyer is currently willing to pay.
2. **The Ask/Offer Side (Sellers):** Located on the opposing side, asks represent open limit orders from participants willing to sell an asset at specific prices above the current trading price. The lowest ask is the cheapest price a seller is currently willing to accept.
The point where the highest bid meets the lowest ask is known as the **inside market**. The numerical difference between the lowest ask and the highest bid is called the **bid-ask spread**.
In highly liquid markets, such as high-volume spot trading pairs for Bitcoin or Ethereum, this spread is extremely narrow—often fractions of a cent or a single basis point. In lower-volume altcoins, the spread can be significantly wider, representing higher transactional friction for traders entering or exiting positions.
---
### What is Market Depth and How Is It Visualized?
Market depth refers to the market’s capacity to absorb relatively large market orders without causing significant price swings. It represents the total cumulative volume of pending limit orders at various price levels above and below the current market price.
Exchanges typically visualize market depth using a **Depth Chart** (often referred to as a market depth visualization). This chart features two opposing slopes:
* **The Green Slope (Cumulative Bids):** Displays the total amount of buying power available as price drops.
* **The Red Slope (Cumulative Asks):** Displays the total amount of selling supply available as price rises.
The steepness of these slopes provides immediate visual information about order density. A shallow, gradual slope indicates deep liquidity, meaning large orders can be executed with minimal impact on price. A steep wall or sudden drop in the slope indicates thin liquidity, where relatively small orders can push the market through multiple price levels rapidly.
---
### Key Concepts: Market Impact, Slippage, and Depth Metrics
To apply market depth effectively, traders must understand three interrelated concepts: market orders, market impact, and slippage.
#### 1. Limit Orders vs. Market Orders
* **Limit Orders** supply liquidity to the market. They sit in the order book waiting to be filled.
* **Market Orders** consume liquidity from the market. They execute immediately against the best available limit orders in the book.
#### 2. Slippage
When a trader submits a market buy order that exceeds the volume available at the lowest ask price, the matching engine automatically moves up the order book to fill the remainder at higher price levels. The difference between the expected execution price (the lowest ask at the time of submission) and the average actual execution price is called **slippage**.
#### 3. Assessing 1% and 2% Market Depth
Professional analytics platforms evaluate market depth by calculating the total dollar value of limit orders residing within a specific percentage distance from the mid-price—typically **+1% / -1%** or **+2% / -2%**.
For instance, if an asset has $5 million in buy-side depth within 2% of the current price, a sell order of $500,000 will move the price significantly less than it would if the 2% depth were only $600,000. Evaluating fixed-percentage depth allows traders to determine whether an asset’s current price is backed by robust structural support or if it is floating on fragile, thin liquidity.
---
### Practical Example: The Anatomy of an Liquidity-Driven Move
Consider a practical scenario involving an intermediate trader analyzing an altcoin asset with moderate volume.
The spot price is currently $10.00. The trader intends to place a $50,000 market buy order.
Upon reviewing the order book, the ask side appears as follows:
* $10.01: 1,000 tokens available ($10,010 value)
* $10.05: 1,500 tokens available ($15,075 value)
* $10.10: 1,000 tokens available ($10,100 value)
* $10.25: 3,000 tokens available ($30,750 value)
If the trader executes a $50,000 market buy without checking market depth:
1. The engine consumes 1,000 tokens at $10.01 ($10,010 used; $39,990 remains).
2. The engine consumes 1,500 tokens at $10.05 ($15,075 used; $24,915 remains).
3. The engine consumes 1,000 tokens at $10.10 ($10,100 used; $14,815 remains).
4. The engine consumes approximately 1,445 tokens at $10.25 ($14,815 used; order complete).
**Result:** The average fill price for this trade is roughly $10.11—over 1% higher than the expected $10.00 entry price. Furthermore, the market price on the exchange instantly jumps to $10.25 due to the depletion of ask liquidity. The trader experienced self-induced slippage by failing to assess market depth prior to execution.
---
### Risks, Limitations, and Spoofing Hazards
While market depth provides invaluable real-time insights, relying on order book visualizers without understanding their structural limitations can lead to costly errors. Order books are dynamic and subject to tactical manipulation.
#### 1. "Spoofing" and Fake Order Walls
Large limit orders visible in the order book are often referred to as "buy walls" or "sell walls." Retail traders frequently assume a large buy wall at $9.50 guarantees price support. However, unless an order is executed, it can be canceled at any millisecond.
Unscrupulous actors or automated algorithms sometimes practice **spoofing**—placing massive limit orders without the intention of execution, purely to create a false illusion of demand or supply. Once the market price approaches the order, the algorithm cancels it, leaving retail traders exposed to sudden price drops through thin liquidity underlying the removed wall.
#### 2. Iceberg Orders
Institutional participants trading large sizes rarely place massive limit orders directly into the visible order book, as doing so alerts the market to their intentions. Instead, they utilize **iceberg orders**. An iceberg order splits a large order into small, visible tranches. As soon as one visible tranche is filled, the system automatically posts the next tranche at the same price level. Consequently, an apparently small bid level on the surface depth chart might actually contain millions of dollars in hidden liquidity.
#### 3. Fragmented Liquidity Across Exchanges
Cryptocurrency liquidity is not centralized within a single order book; it is dispersed across dozens of exchanges, decentralized liquidity pools, and off-exchange over-the-counter (OTC) desks. An asset may appear to have thin depth on one platform while holding deep liquidity on another.
---
### Practical Guidelines for Risk Management
To integrate market depth into a disciplined risk management workflow, intermediate traders should observe the following guidelines:
* **Match Position Size to Available Depth:** Before placing a trade, check the 1% and 2% depth metrics. Ensure your intended position size represents a small fraction of the available liquidity within that range to avoid incurring self-inflicted slippage.
* **Utilize Algorithmic Execution Tools:** When executing positions that exceed immediate market depth, avoid raw market orders. Use execution strategies such as Time-Weighted Average Price (TWAP) or limit-order laddering to slice entries across time and price levels.
* **Look Beyond Visible Walls:** Treat large order walls with healthy skepticism. Do not base stop-loss placements solely behind an obvious buy or sell wall, as these walls can vanish instantly prior to tested contact.
* **Monitor Spread Conditions During Volatility:** During high-macro volatility (such as major economic announcements), market makers frequently widen their spreads or withdraw limit orders entirely to manage risk. Always re-check bid-ask spreads during high-impact events.
---
### Conclusion
Market depth represents the bridge between static historical chart patterns and real-time trade execution. While candlestick charts indicate where price momentum has traveled, the order book reveals the structural environment the price must traverse next. By understanding bids, asks, slippage, and liquidity density—while remaining mindful of order book spoofing and fragmentation—traders can transition from reactive visual analysis to proactive structural execution, substantially improving their overall market management.
#CryptoEducation #OrderBook #TradingTips
Demystifying Market Depth: How to Read Order Books and Measure Liquidity Beyond Price Charts
When most market participants look at cryptocurrency trading interfaces, their eyes naturally gravitate toward candlestick charts. These visual representations of historical price action—complete with moving averages, relative strength indicators, and trendlines—provide valuable context about where a market has been. However, candlestick charts only tell half the story. They display executed transactions from the past, but they reveal very little about the immediate structural liquidity waiting to absorb future trades.
To understand how prices actually move in real time, intermediate traders must look beneath the surface of chart patterns and examine market depth. Market depth offers a real-time window into the pending buy and sell orders residing within an exchange’s order book. By learning how to interpret order book structure, bid-ask spreads, and order density, traders can develop a clearer understanding of market liquidity, prospective slippage, and institutional order execution.
---
### Understanding the Order Book Mechanics
At its core, a centralized cryptocurrency exchange operates a continuous double-auction mechanism. This system matches buyers and sellers using an automated matching engine based on price and time priority.
The order book is divided into two main sides:
1. **The Bid Side (Buyers):** Located on one side of the order book, bids represent open limit orders from participants willing to buy an asset at specific prices below the current trading price. The highest bid is the highest price a buyer is currently willing to pay.
2. **The Ask/Offer Side (Sellers):** Located on the opposing side, asks represent open limit orders from participants willing to sell an asset at specific prices above the current trading price. The lowest ask is the cheapest price a seller is currently willing to accept.
The point where the highest bid meets the lowest ask is known as the **inside market**. The numerical difference between the lowest ask and the highest bid is called the **bid-ask spread**.
In highly liquid markets, such as high-volume spot trading pairs for Bitcoin or Ethereum, this spread is extremely narrow—often fractions of a cent or a single basis point. In lower-volume altcoins, the spread can be significantly wider, representing higher transactional friction for traders entering or exiting positions.
---
### What is Market Depth and How Is It Visualized?
Market depth refers to the market’s capacity to absorb relatively large market orders without causing significant price swings. It represents the total cumulative volume of pending limit orders at various price levels above and below the current market price.
Exchanges typically visualize market depth using a **Depth Chart** (often referred to as a market depth visualization). This chart features two opposing slopes:
* **The Green Slope (Cumulative Bids):** Displays the total amount of buying power available as price drops.
* **The Red Slope (Cumulative Asks):** Displays the total amount of selling supply available as price rises.
The steepness of these slopes provides immediate visual information about order density. A shallow, gradual slope indicates deep liquidity, meaning large orders can be executed with minimal impact on price. A steep wall or sudden drop in the slope indicates thin liquidity, where relatively small orders can push the market through multiple price levels rapidly.
---
### Key Concepts: Market Impact, Slippage, and Depth Metrics
To apply market depth effectively, traders must understand three interrelated concepts: market orders, market impact, and slippage.
#### 1. Limit Orders vs. Market Orders
* **Limit Orders** supply liquidity to the market. They sit in the order book waiting to be filled.
* **Market Orders** consume liquidity from the market. They execute immediately against the best available limit orders in the book.
#### 2. Slippage
When a trader submits a market buy order that exceeds the volume available at the lowest ask price, the matching engine automatically moves up the order book to fill the remainder at higher price levels. The difference between the expected execution price (the lowest ask at the time of submission) and the average actual execution price is called **slippage**.
#### 3. Assessing 1% and 2% Market Depth
Professional analytics platforms evaluate market depth by calculating the total dollar value of limit orders residing within a specific percentage distance from the mid-price—typically **+1% / -1%** or **+2% / -2%**.
For instance, if an asset has $5 million in buy-side depth within 2% of the current price, a sell order of $500,000 will move the price significantly less than it would if the 2% depth were only $600,000. Evaluating fixed-percentage depth allows traders to determine whether an asset’s current price is backed by robust structural support or if it is floating on fragile, thin liquidity.
---
### Practical Example: The Anatomy of an Liquidity-Driven Move
Consider a practical scenario involving an intermediate trader analyzing an altcoin asset with moderate volume.
The spot price is currently $10.00. The trader intends to place a $50,000 market buy order.
Upon reviewing the order book, the ask side appears as follows:
* $10.01: 1,000 tokens available ($10,010 value)
* $10.05: 1,500 tokens available ($15,075 value)
* $10.10: 1,000 tokens available ($10,100 value)
* $10.25: 3,000 tokens available ($30,750 value)
If the trader executes a $50,000 market buy without checking market depth:
1. The engine consumes 1,000 tokens at $10.01 ($10,010 used; $39,990 remains).
2. The engine consumes 1,500 tokens at $10.05 ($15,075 used; $24,915 remains).
3. The engine consumes 1,000 tokens at $10.10 ($10,100 used; $14,815 remains).
4. The engine consumes approximately 1,445 tokens at $10.25 ($14,815 used; order complete).
**Result:** The average fill price for this trade is roughly $10.11—over 1% higher than the expected $10.00 entry price. Furthermore, the market price on the exchange instantly jumps to $10.25 due to the depletion of ask liquidity. The trader experienced self-induced slippage by failing to assess market depth prior to execution.
---
### Risks, Limitations, and Spoofing Hazards
While market depth provides invaluable real-time insights, relying on order book visualizers without understanding their structural limitations can lead to costly errors. Order books are dynamic and subject to tactical manipulation.
#### 1. "Spoofing" and Fake Order Walls
Large limit orders visible in the order book are often referred to as "buy walls" or "sell walls." Retail traders frequently assume a large buy wall at $9.50 guarantees price support. However, unless an order is executed, it can be canceled at any millisecond.
Unscrupulous actors or automated algorithms sometimes practice **spoofing**—placing massive limit orders without the intention of execution, purely to create a false illusion of demand or supply. Once the market price approaches the order, the algorithm cancels it, leaving retail traders exposed to sudden price drops through thin liquidity underlying the removed wall.
#### 2. Iceberg Orders
Institutional participants trading large sizes rarely place massive limit orders directly into the visible order book, as doing so alerts the market to their intentions. Instead, they utilize **iceberg orders**. An iceberg order splits a large order into small, visible tranches. As soon as one visible tranche is filled, the system automatically posts the next tranche at the same price level. Consequently, an apparently small bid level on the surface depth chart might actually contain millions of dollars in hidden liquidity.
#### 3. Fragmented Liquidity Across Exchanges
Cryptocurrency liquidity is not centralized within a single order book; it is dispersed across dozens of exchanges, decentralized liquidity pools, and off-exchange over-the-counter (OTC) desks. An asset may appear to have thin depth on one platform while holding deep liquidity on another.
---
### Practical Guidelines for Risk Management
To integrate market depth into a disciplined risk management workflow, intermediate traders should observe the following guidelines:
* **Match Position Size to Available Depth:** Before placing a trade, check the 1% and 2% depth metrics. Ensure your intended position size represents a small fraction of the available liquidity within that range to avoid incurring self-inflicted slippage.
* **Utilize Algorithmic Execution Tools:** When executing positions that exceed immediate market depth, avoid raw market orders. Use execution strategies such as Time-Weighted Average Price (TWAP) or limit-order laddering to slice entries across time and price levels.
* **Look Beyond Visible Walls:** Treat large order walls with healthy skepticism. Do not base stop-loss placements solely behind an obvious buy or sell wall, as these walls can vanish instantly prior to tested contact.
* **Monitor Spread Conditions During Volatility:** During high-macro volatility (such as major economic announcements), market makers frequently widen their spreads or withdraw limit orders entirely to manage risk. Always re-check bid-ask spreads during high-impact events.
---
### Conclusion
Market depth represents the bridge between static historical chart patterns and real-time trade execution. While candlestick charts indicate where price momentum has traveled, the order book reveals the structural environment the price must traverse next. By understanding bids, asks, slippage, and liquidity density—while remaining mindful of order book spoofing and fragmentation—traders can transition from reactive visual analysis to proactive structural execution, substantially improving their overall market management.
#CryptoEducation #OrderBook #TradingTips
To understand how prices actually move in real time, intermediate traders must look beneath the surface of chart patterns and examine market depth. Market depth offers a real-time window into the pending buy and sell orders residing within an exchange’s order book. By learning how to interpret order book structure, bid-ask spreads, and order density, traders can develop a clearer understanding of market liquidity, prospective slippage, and institutional order execution.
---
### Understanding the Order Book Mechanics
At its core, a centralized cryptocurrency exchange operates a continuous double-auction mechanism. This system matches buyers and sellers using an automated matching engine based on price and time priority.
The order book is divided into two main sides:
1. **The Bid Side (Buyers):** Located on one side of the order book, bids represent open limit orders from participants willing to buy an asset at specific prices below the current trading price. The highest bid is the highest price a buyer is currently willing to pay.
2. **The Ask/Offer Side (Sellers):** Located on the opposing side, asks represent open limit orders from participants willing to sell an asset at specific prices above the current trading price. The lowest ask is the cheapest price a seller is currently willing to accept.
The point where the highest bid meets the lowest ask is known as the **inside market**. The numerical difference between the lowest ask and the highest bid is called the **bid-ask spread**.
In highly liquid markets, such as high-volume spot trading pairs for Bitcoin or Ethereum, this spread is extremely narrow—often fractions of a cent or a single basis point. In lower-volume altcoins, the spread can be significantly wider, representing higher transactional friction for traders entering or exiting positions.
---
### What is Market Depth and How Is It Visualized?
Market depth refers to the market’s capacity to absorb relatively large market orders without causing significant price swings. It represents the total cumulative volume of pending limit orders at various price levels above and below the current market price.
Exchanges typically visualize market depth using a **Depth Chart** (often referred to as a market depth visualization). This chart features two opposing slopes:
* **The Green Slope (Cumulative Bids):** Displays the total amount of buying power available as price drops.
* **The Red Slope (Cumulative Asks):** Displays the total amount of selling supply available as price rises.
The steepness of these slopes provides immediate visual information about order density. A shallow, gradual slope indicates deep liquidity, meaning large orders can be executed with minimal impact on price. A steep wall or sudden drop in the slope indicates thin liquidity, where relatively small orders can push the market through multiple price levels rapidly.
---
### Key Concepts: Market Impact, Slippage, and Depth Metrics
To apply market depth effectively, traders must understand three interrelated concepts: market orders, market impact, and slippage.
#### 1. Limit Orders vs. Market Orders
* **Limit Orders** supply liquidity to the market. They sit in the order book waiting to be filled.
* **Market Orders** consume liquidity from the market. They execute immediately against the best available limit orders in the book.
#### 2. Slippage
When a trader submits a market buy order that exceeds the volume available at the lowest ask price, the matching engine automatically moves up the order book to fill the remainder at higher price levels. The difference between the expected execution price (the lowest ask at the time of submission) and the average actual execution price is called **slippage**.
#### 3. Assessing 1% and 2% Market Depth
Professional analytics platforms evaluate market depth by calculating the total dollar value of limit orders residing within a specific percentage distance from the mid-price—typically **+1% / -1%** or **+2% / -2%**.
For instance, if an asset has $5 million in buy-side depth within 2% of the current price, a sell order of $500,000 will move the price significantly less than it would if the 2% depth were only $600,000. Evaluating fixed-percentage depth allows traders to determine whether an asset’s current price is backed by robust structural support or if it is floating on fragile, thin liquidity.
---
### Practical Example: The Anatomy of an Liquidity-Driven Move
Consider a practical scenario involving an intermediate trader analyzing an altcoin asset with moderate volume.
The spot price is currently $10.00. The trader intends to place a $50,000 market buy order.
Upon reviewing the order book, the ask side appears as follows:
* $10.01: 1,000 tokens available ($10,010 value)
* $10.05: 1,500 tokens available ($15,075 value)
* $10.10: 1,000 tokens available ($10,100 value)
* $10.25: 3,000 tokens available ($30,750 value)
If the trader executes a $50,000 market buy without checking market depth:
1. The engine consumes 1,000 tokens at $10.01 ($10,010 used; $39,990 remains).
2. The engine consumes 1,500 tokens at $10.05 ($15,075 used; $24,915 remains).
3. The engine consumes 1,000 tokens at $10.10 ($10,100 used; $14,815 remains).
4. The engine consumes approximately 1,445 tokens at $10.25 ($14,815 used; order complete).
**Result:** The average fill price for this trade is roughly $10.11—over 1% higher than the expected $10.00 entry price. Furthermore, the market price on the exchange instantly jumps to $10.25 due to the depletion of ask liquidity. The trader experienced self-induced slippage by failing to assess market depth prior to execution.
---
### Risks, Limitations, and Spoofing Hazards
While market depth provides invaluable real-time insights, relying on order book visualizers without understanding their structural limitations can lead to costly errors. Order books are dynamic and subject to tactical manipulation.
#### 1. "Spoofing" and Fake Order Walls
Large limit orders visible in the order book are often referred to as "buy walls" or "sell walls." Retail traders frequently assume a large buy wall at $9.50 guarantees price support. However, unless an order is executed, it can be canceled at any millisecond.
Unscrupulous actors or automated algorithms sometimes practice **spoofing**—placing massive limit orders without the intention of execution, purely to create a false illusion of demand or supply. Once the market price approaches the order, the algorithm cancels it, leaving retail traders exposed to sudden price drops through thin liquidity underlying the removed wall.
#### 2. Iceberg Orders
Institutional participants trading large sizes rarely place massive limit orders directly into the visible order book, as doing so alerts the market to their intentions. Instead, they utilize **iceberg orders**. An iceberg order splits a large order into small, visible tranches. As soon as one visible tranche is filled, the system automatically posts the next tranche at the same price level. Consequently, an apparently small bid level on the surface depth chart might actually contain millions of dollars in hidden liquidity.
#### 3. Fragmented Liquidity Across Exchanges
Cryptocurrency liquidity is not centralized within a single order book; it is dispersed across dozens of exchanges, decentralized liquidity pools, and off-exchange over-the-counter (OTC) desks. An asset may appear to have thin depth on one platform while holding deep liquidity on another.
---
### Practical Guidelines for Risk Management
To integrate market depth into a disciplined risk management workflow, intermediate traders should observe the following guidelines:
* **Match Position Size to Available Depth:** Before placing a trade, check the 1% and 2% depth metrics. Ensure your intended position size represents a small fraction of the available liquidity within that range to avoid incurring self-inflicted slippage.
* **Utilize Algorithmic Execution Tools:** When executing positions that exceed immediate market depth, avoid raw market orders. Use execution strategies such as Time-Weighted Average Price (TWAP) or limit-order laddering to slice entries across time and price levels.
* **Look Beyond Visible Walls:** Treat large order walls with healthy skepticism. Do not base stop-loss placements solely behind an obvious buy or sell wall, as these walls can vanish instantly prior to tested contact.
* **Monitor Spread Conditions During Volatility:** During high-macro volatility (such as major economic announcements), market makers frequently widen their spreads or withdraw limit orders entirely to manage risk. Always re-check bid-ask spreads during high-impact events.
---
### Conclusion
Market depth represents the bridge between static historical chart patterns and real-time trade execution. While candlestick charts indicate where price momentum has traveled, the order book reveals the structural environment the price must traverse next. By understanding bids, asks, slippage, and liquidity density—while remaining mindful of order book spoofing and fragmentation—traders can transition from reactive visual analysis to proactive structural execution, substantially improving their overall market management.
#CryptoEducation #OrderBook #TradingTips
22

·
--
Chasing the top gainer loses because you’re buying from the last person who sold.
$ONDO is down 0.9% today.
Price is $0.34750 right at 51% of its 24h range ($0.34110 to $0.35360).
That means half the buyers today already exited.
Volume is 0.6x the 7-day average low interest, not a breakout.
Last hour’s swing high was $0.35360. Anyone buying now at $0.34750 is paying more than 50% of today’s range they’re buying from sellers who took profit at the top.
I wait for volume to confirm momentum, not price hype.
What’s your rule for avoiding this trap?
#TradingTips #ONDO
Not financial advice. My levels, my risk.
Chasing the top gainer loses because you’re buying from the last person who sold.
$ONDO is down 0.9% today.
Price is $0.34750 right at 51% of its 24h range ($0.34110 to $0.35360).
That means half the buyers today already exited.
Volume is 0.6x the 7-day average low interest, not a breakout.
Last hour’s swing high was $0.35360. Anyone buying now at $0.34750 is paying more than 50% of today’s range they’re buying from sellers who took profit at the top.
I wait for volume to confirm momentum, not price hype.
What’s your rule for avoiding this trap?
#TradingTips #ONDO
Not financial advice. My levels, my risk.
$ONDO is down 0.9% today.
Price is $0.34750 right at 51% of its 24h range ($0.34110 to $0.35360).
That means half the buyers today already exited.
Volume is 0.6x the 7-day average low interest, not a breakout.
Last hour’s swing high was $0.35360. Anyone buying now at $0.34750 is paying more than 50% of today’s range they’re buying from sellers who took profit at the top.
I wait for volume to confirm momentum, not price hype.
What’s your rule for avoiding this trap?
#TradingTips #ONDO
Not financial advice. My levels, my risk.
2

·
--
🚨 Bitcoin Golden Cross: Confirmation Signal or Lagging Trap? 🚨
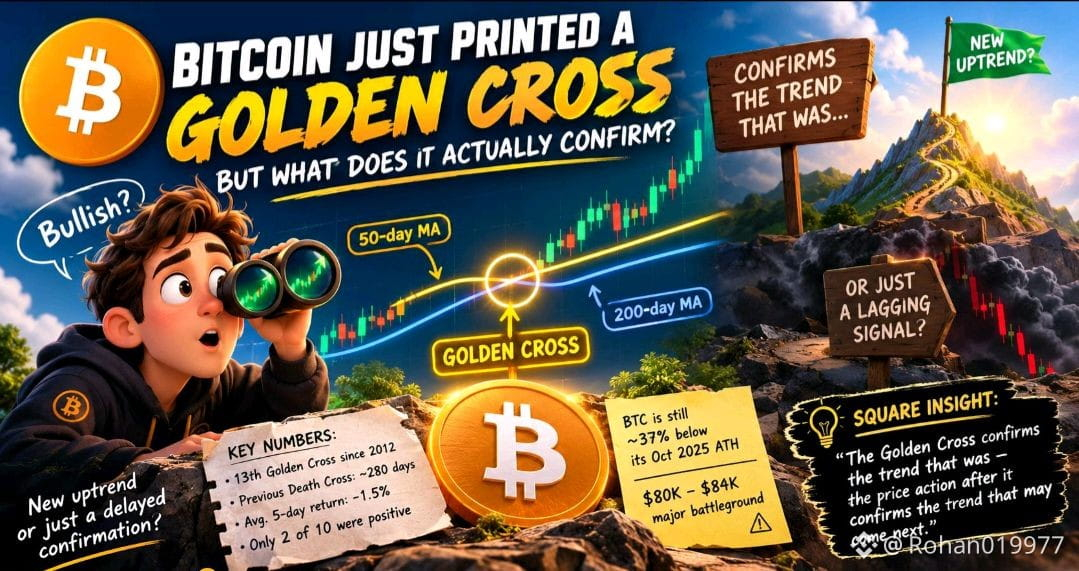
Bitcoin’s 50-day moving average recently surged above its 200-day moving average, printing the classic Golden Cross.
While market sentiment usually flips instant-bullish on this event, smart traders look deeper.
Here is what this iconic pattern actually tells us—and what it doesn't.
The Reality of the Golden Cross
A Golden Cross is a confirmation metric, not a predictive crystal ball. It simply proves that recent price action was strong enough to push short-term momentum above the long-term trend baseline.
Historically, the results are a mixed bag:
The Long-Term Bull Case: Out of the previous 12 historical crosses, only a quarter sustained a full year-long run—but those few produced massive structural gains.
The Short-Term Shakeout: Quantitative data shows short-term weakness right after the cross, with 5-day post-cross returns averaging -1.5% and positive outcomes in only 2 out of 10 instances.
The Core Takeaway
The Golden Cross confirms where price has been, not where price is guaranteed to go.
With BTC still trading significantly below its major October ATH and battling key resistance levels around the $80K–$84K zone, the real test lies ahead:
Can BTC establish a clean higher-high structure?
Can buyers hold the breakout and convert heavy resistance into support?
Or will this become another classic lagging indicator that traps late buyers?
💡 Square Perspective:
The cross validates past recovery. The market structure over the coming weeks will determine future direction.
How are you playing this setup? Are we at the threshold of a macro bull wave, or is this just a lagging confirmation of the initial bounce? Drop your thoughts below! 👇
#bitcoin #BTC #CryptoAnalysi #tradingtips
(Market commentary only. Not financial advice.)
{spot}(BTCUSDT)
🚨 Bitcoin Golden Cross: Confirmation Signal or Lagging Trap? 🚨
Bitcoin’s 50-day moving average recently surged above its 200-day moving average, printing the classic Golden Cross.
While market sentiment usually flips instant-bullish on this event, smart traders look deeper.
Here is what this iconic pattern actually tells us—and what it doesn't.
The Reality of the Golden Cross
A Golden Cross is a confirmation metric, not a predictive crystal ball. It simply proves that recent price action was strong enough to push short-term momentum above the long-term trend baseline.
Historically, the results are a mixed bag:
The Long-Term Bull Case: Out of the previous 12 historical crosses, only a quarter sustained a full year-long run—but those few produced massive structural gains.
The Short-Term Shakeout: Quantitative data shows short-term weakness right after the cross, with 5-day post-cross returns averaging -1.5% and positive outcomes in only 2 out of 10 instances.
The Core Takeaway
The Golden Cross confirms where price has been, not where price is guaranteed to go.
With BTC still trading significantly below its major October ATH and battling key resistance levels around the $80K–$84K zone, the real test lies ahead:
Can BTC establish a clean higher-high structure?
Can buyers hold the breakout and convert heavy resistance into support?
Or will this become another classic lagging indicator that traps late buyers?
💡 Square Perspective:
The cross validates past recovery. The market structure over the coming weeks will determine future direction.
How are you playing this setup? Are we at the threshold of a macro bull wave, or is this just a lagging confirmation of the initial bounce? Drop your thoughts below! 👇
#bitcoin #BTC #CryptoAnalysi #tradingtips
(Market commentary only. Not financial advice.)
Bitcoin’s 50-day moving average recently surged above its 200-day moving average, printing the classic Golden Cross.
While market sentiment usually flips instant-bullish on this event, smart traders look deeper.
Here is what this iconic pattern actually tells us—and what it doesn't.
The Reality of the Golden Cross
A Golden Cross is a confirmation metric, not a predictive crystal ball. It simply proves that recent price action was strong enough to push short-term momentum above the long-term trend baseline.
Historically, the results are a mixed bag:
The Long-Term Bull Case: Out of the previous 12 historical crosses, only a quarter sustained a full year-long run—but those few produced massive structural gains.
The Short-Term Shakeout: Quantitative data shows short-term weakness right after the cross, with 5-day post-cross returns averaging -1.5% and positive outcomes in only 2 out of 10 instances.
The Core Takeaway
The Golden Cross confirms where price has been, not where price is guaranteed to go.
With BTC still trading significantly below its major October ATH and battling key resistance levels around the $80K–$84K zone, the real test lies ahead:
Can BTC establish a clean higher-high structure?
Can buyers hold the breakout and convert heavy resistance into support?
Or will this become another classic lagging indicator that traps late buyers?
💡 Square Perspective:
The cross validates past recovery. The market structure over the coming weeks will determine future direction.
How are you playing this setup? Are we at the threshold of a macro bull wave, or is this just a lagging confirmation of the initial bounce? Drop your thoughts below! 👇
#bitcoin #BTC #CryptoAnalysi #tradingtips
(Market commentary only. Not financial advice.)
46
·
--
Most people ignore volume and chase price alone.
$CVC is up 69% in 24 hours but volume is 8.4x its 7-day average.
8.4x is calculated as $3.9M divided by 464K (which is $3.9M ÷ 8.4).
That’s not a breakout it’s a volume-backed breakout.
Without volume, a 69% move is noise. With 8x volume, it’s a signal.
Check it yourself: go to Binance, click 7D volume, divide 24H volume by it. Takes 20 seconds.
On the next trade, I wait for volume above 3x the 7-day average before considering the move meaningful.
What’s your rule for volume confirmation?
#TradingTips #CVC
Not financial advice. My levels, my risk.
Most people ignore volume and chase price alone.
$CVC is up 69% in 24 hours but volume is 8.4x its 7-day average.
8.4x is calculated as $3.9M divided by 464K (which is $3.9M ÷ 8.4).
That’s not a breakout it’s a volume-backed breakout.
Without volume, a 69% move is noise. With 8x volume, it’s a signal.
Check it yourself: go to Binance, click 7D volume, divide 24H volume by it. Takes 20 seconds.
On the next trade, I wait for volume above 3x the 7-day average before considering the move meaningful.
What’s your rule for volume confirmation?
#TradingTips #CVC
Not financial advice. My levels, my risk.
$CVC is up 69% in 24 hours but volume is 8.4x its 7-day average.
8.4x is calculated as $3.9M divided by 464K (which is $3.9M ÷ 8.4).
That’s not a breakout it’s a volume-backed breakout.
Without volume, a 69% move is noise. With 8x volume, it’s a signal.
Check it yourself: go to Binance, click 7D volume, divide 24H volume by it. Takes 20 seconds.
On the next trade, I wait for volume above 3x the 7-day average before considering the move meaningful.
What’s your rule for volume confirmation?
#TradingTips #CVC
Not financial advice. My levels, my risk.
28
·
--
Chasing the top gainer loses because you’re buying from whoever just sold.
$APT is down 2.9% today.
Price is $0.59500 sitting at 13% of its 24h range ($0.59100 to $0.62300).
That means 87% of today’s price action happened above where it is now.
Volume is 3.7M only 0.4x the 7-day average.
The last 1h swing high was $0.62300. Buyers there lost 4.5% in one hour.
Who’s selling to you at $0.59500? The same people who bought at $0.62300 and got stopped out.
Wait for volume to confirm direction not momentum.
What’s your rule for avoiding this trap? #TradingTips #APT
Not financial advice. My levels, my risk.
Chasing the top gainer loses because you’re buying from whoever just sold.
$APT is down 2.9% today.
Price is $0.59500 sitting at 13% of its 24h range ($0.59100 to $0.62300).
That means 87% of today’s price action happened above where it is now.
Volume is 3.7M only 0.4x the 7-day average.
The last 1h swing high was $0.62300. Buyers there lost 4.5% in one hour.
Who’s selling to you at $0.59500? The same people who bought at $0.62300 and got stopped out.
Wait for volume to confirm direction not momentum.
What’s your rule for avoiding this trap? #TradingTips #APT
Not financial advice. My levels, my risk.
$APT is down 2.9% today.
Price is $0.59500 sitting at 13% of its 24h range ($0.59100 to $0.62300).
That means 87% of today’s price action happened above where it is now.
Volume is 3.7M only 0.4x the 7-day average.
The last 1h swing high was $0.62300. Buyers there lost 4.5% in one hour.
Who’s selling to you at $0.59500? The same people who bought at $0.62300 and got stopped out.
Wait for volume to confirm direction not momentum.
What’s your rule for avoiding this trap? #TradingTips #APT
Not financial advice. My levels, my risk.
6

⚠️ FOMO can be your biggest enemy in CRYPTO!
Don't buy a coin just because it's pumping fast.
Ask yourself:
Why is the price increasing?
What is the volume like?
What is the news?
How much risk?
Remember: A missed trade is better than a bad trade.
#Crypto #TradingTips #FOMO #Binance
⚠️ FOMO can be your biggest enemy in CRYPTO!
Don't buy a coin just because it's pumping fast.
Ask yourself:
Why is the price increasing?
What is the volume like?
What is the news?
How much risk?
Remember: A missed trade is better than a bad trade.
#Crypto #TradingTips #FOMO #Binance
Don't buy a coin just because it's pumping fast.
Ask yourself:
Why is the price increasing?
What is the volume like?
What is the news?
How much risk?
Remember: A missed trade is better than a bad trade.
#Crypto #TradingTips #FOMO #Binance
54

·
--
Picture this: you are rushing to manage a high-leverage trade during extreme volatility, and a sudden security verification popup blocks your entire execution.
Missing an entry or failing to set a stop-loss because of unexpected verification loops is painful enough, but falling for sophisticated fake security prompts designed to drain wallets is far worse. Most traders focus entirely on price action while completely overlooking how timing delays and spoofed security checks create critical attack vectors.
A trader caught in a rapid drawdown on $BTC might hastily click through an unfamiliar verification prompt without checking the domain integrity, granting malicious permissions in seconds. Automated drainers often disguise themselves as routine bot-detection tests during high-traffic liquidations when traders are most distracted and urgent to protect their capital.
Even when interacting with legitimate verification layers to safeguard $BNB holdings against brute-force attacks, that extra 30-second friction can drastically alter trade execution when market depth shifts rapidly across $ETH pairs. Treating security checkpoints as an active operational risk rather than a minor annoyance is the difference between preserving capital and facing avoidable losses.
How do you manage authentication delays when rapid execution is critical to your risk strategy?
#CryptoSecurity #RiskManagement #TradingTips
Picture this: you are rushing to manage a high-leverage trade during extreme volatility, and a sudden security verification popup blocks your entire execution.
Missing an entry or failing to set a stop-loss because of unexpected verification loops is painful enough, but falling for sophisticated fake security prompts designed to drain wallets is far worse. Most traders focus entirely on price action while completely overlooking how timing delays and spoofed security checks create critical attack vectors.
A trader caught in a rapid drawdown on $BTC might hastily click through an unfamiliar verification prompt without checking the domain integrity, granting malicious permissions in seconds. Automated drainers often disguise themselves as routine bot-detection tests during high-traffic liquidations when traders are most distracted and urgent to protect their capital.
Even when interacting with legitimate verification layers to safeguard $BNB holdings against brute-force attacks, that extra 30-second friction can drastically alter trade execution when market depth shifts rapidly across $ETH pairs. Treating security checkpoints as an active operational risk rather than a minor annoyance is the difference between preserving capital and facing avoidable losses.
How do you manage authentication delays when rapid execution is critical to your risk strategy?
#CryptoSecurity #RiskManagement #TradingTips
Missing an entry or failing to set a stop-loss because of unexpected verification loops is painful enough, but falling for sophisticated fake security prompts designed to drain wallets is far worse. Most traders focus entirely on price action while completely overlooking how timing delays and spoofed security checks create critical attack vectors.
A trader caught in a rapid drawdown on $BTC might hastily click through an unfamiliar verification prompt without checking the domain integrity, granting malicious permissions in seconds. Automated drainers often disguise themselves as routine bot-detection tests during high-traffic liquidations when traders are most distracted and urgent to protect their capital.
Even when interacting with legitimate verification layers to safeguard $BNB holdings against brute-force attacks, that extra 30-second friction can drastically alter trade execution when market depth shifts rapidly across $ETH pairs. Treating security checkpoints as an active operational risk rather than a minor annoyance is the difference between preserving capital and facing avoidable losses.
How do you manage authentication delays when rapid execution is critical to your risk strategy?
#CryptoSecurity #RiskManagement #TradingTips
18
·
--
Most people put stops at round numbers. That’s not where the market cares.
For $FTM, the last 1h swing low is $0.69020.
That’s the level that proves the short-term trend broke.
The 1h ATR is 1.4% of $0.69940 = $0.00980.
A stop at $0.68900 is 1.3% below price tighter than normal hourly noise.
It will get clipped by random ticks, not real moves.
Put your stop below $0.69020 not below $0.69000.
What’s your rule for where a stop actually belongs?
#TradingTips #FTM
Not financial advice. My levels, my risk.
Most people put stops at round numbers. That’s not where the market cares.
For $FTM, the last 1h swing low is $0.69020.
That’s the level that proves the short-term trend broke.
The 1h ATR is 1.4% of $0.69940 = $0.00980.
A stop at $0.68900 is 1.3% below price tighter than normal hourly noise.
It will get clipped by random ticks, not real moves.
Put your stop below $0.69020 not below $0.69000.
What’s your rule for where a stop actually belongs?
#TradingTips #FTM
Not financial advice. My levels, my risk.
For $FTM, the last 1h swing low is $0.69020.
That’s the level that proves the short-term trend broke.
The 1h ATR is 1.4% of $0.69940 = $0.00980.
A stop at $0.68900 is 1.3% below price tighter than normal hourly noise.
It will get clipped by random ticks, not real moves.
Put your stop below $0.69020 not below $0.69000.
What’s your rule for where a stop actually belongs?
#TradingTips #FTM
Not financial advice. My levels, my risk.
·
--
Most people size positions based on how much they want to win, not how much they can afford to lose.
My account is $1000. I risk no more than 1% per trade = $10.
PUNDIX 1h ATR is 5.4% of price.
At 0.12440, that’s a 0.0067 stop distance.
To risk $10 with a 0.0067 stop: $10 ÷ 0.0067 = 1492.5 coins.
I’d take 1492 coins. Not more. Not less.
Next trade, I calculate stop distance first. Then size to risk 1%.
What’s your rule for position sizing? #TradingTips #PUNDIX
Not financial advice. My levels, my risk.
Most people size positions based on how much they want to win, not how much they can afford to lose.
My account is $1000. I risk no more than 1% per trade = $10.
PUNDIX 1h ATR is 5.4% of price.
At 0.12440, that’s a 0.0067 stop distance.
To risk $10 with a 0.0067 stop: $10 ÷ 0.0067 = 1492.5 coins.
I’d take 1492 coins. Not more. Not less.
Next trade, I calculate stop distance first. Then size to risk 1%.
What’s your rule for position sizing? #TradingTips #PUNDIX
Not financial advice. My levels, my risk.
My account is $1000. I risk no more than 1% per trade = $10.
PUNDIX 1h ATR is 5.4% of price.
At 0.12440, that’s a 0.0067 stop distance.
To risk $10 with a 0.0067 stop: $10 ÷ 0.0067 = 1492.5 coins.
I’d take 1492 coins. Not more. Not less.
Next trade, I calculate stop distance first. Then size to risk 1%.
What’s your rule for position sizing? #TradingTips #PUNDIX
Not financial advice. My levels, my risk.
18

·
--
Bullish
🚨 The #1 Mistake 90% of Traders Make in Crypto (Avoid This!) 📉
Most beginners don’t lose money because of bad coins—they lose because of poor psychology and zero risk management.
If you want to stay profitable and protect your hard-earned money, follow these 3 golden rules:
1️⃣ Never Go All-In (Preserve Your Capital)
Always keep 20–30% in USDT/USDC. When the market dumps, cash is your superpower to buy the dip at huge discounts.
2️⃣ Always Respect Your Stop-Loss
A small 2–3% loss is easy to recover. But holding a bag hoping it "bounces back" can wipe out 80% of your portfolio overnight. Cut losses quickly without emotions!
3️⃣ Take Profits on the Way Up
Unrealized profit is just a screenshot, not real money. Learn to take partial profits at key resistance levels and secure your gains.
---
💬 Question for you: What has hurt your portfolio the most—FOMO buying at the top or Panic Selling at the bottom? Drop your thoughts below! 👇
🔔 Hit that Follow button for daily market insights, trading strategies, and crypto survival tips!
$BTC $ETH $SOL
#BinanceSquareTalks #Write2Earn #CryptoTrading #tradingtips
🚨 The #1 Mistake 90% of Traders Make in Crypto (Avoid This!) 📉
Most beginners don’t lose money because of bad coins—they lose because of poor psychology and zero risk management.
If you want to stay profitable and protect your hard-earned money, follow these 3 golden rules:
1️⃣ Never Go All-In (Preserve Your Capital)
Always keep 20–30% in USDT/USDC. When the market dumps, cash is your superpower to buy the dip at huge discounts.
2️⃣ Always Respect Your Stop-Loss
A small 2–3% loss is easy to recover. But holding a bag hoping it "bounces back" can wipe out 80% of your portfolio overnight. Cut losses quickly without emotions!
3️⃣ Take Profits on the Way Up
Unrealized profit is just a screenshot, not real money. Learn to take partial profits at key resistance levels and secure your gains.
---
💬 Question for you: What has hurt your portfolio the most—FOMO buying at the top or Panic Selling at the bottom? Drop your thoughts below! 👇
🔔 Hit that Follow button for daily market insights, trading strategies, and crypto survival tips!
$BTC $ETH $SOL
#BinanceSquareTalks #Write2Earn #CryptoTrading #tradingtips
Most beginners don’t lose money because of bad coins—they lose because of poor psychology and zero risk management.
If you want to stay profitable and protect your hard-earned money, follow these 3 golden rules:
1️⃣ Never Go All-In (Preserve Your Capital)
Always keep 20–30% in USDT/USDC. When the market dumps, cash is your superpower to buy the dip at huge discounts.
2️⃣ Always Respect Your Stop-Loss
A small 2–3% loss is easy to recover. But holding a bag hoping it "bounces back" can wipe out 80% of your portfolio overnight. Cut losses quickly without emotions!
3️⃣ Take Profits on the Way Up
Unrealized profit is just a screenshot, not real money. Learn to take partial profits at key resistance levels and secure your gains.
---
💬 Question for you: What has hurt your portfolio the most—FOMO buying at the top or Panic Selling at the bottom? Drop your thoughts below! 👇
🔔 Hit that Follow button for daily market insights, trading strategies, and crypto survival tips!
$BTC $ETH $SOL
#BinanceSquareTalks #Write2Earn #CryptoTrading #tradingtips
108
·
--
Most people mistake price spikes for momentum.
They ignore volume.
$MTL is up 22.2% in 24 hours.
Volume is $4.7M.
7-day average volume is 111,600.
$4.7M ÷ 111,600 = 42.1x.
That’s not a spike. That’s conviction.
If volume was under 5x average, I’d ignore the move.
Above a large move? I start watching the structure.
Next time you see a price move, divide 24h volume by 7-day average.
Do it in 20 seconds.
What’s your volume rule?
#TradingTips #MTL
Not financial advice. My levels, my risk.
Most people mistake price spikes for momentum.
They ignore volume.
$MTL is up 22.2% in 24 hours.
Volume is $4.7M.
7-day average volume is 111,600.
$4.7M ÷ 111,600 = 42.1x.
That’s not a spike. That’s conviction.
If volume was under 5x average, I’d ignore the move.
Above a large move? I start watching the structure.
Next time you see a price move, divide 24h volume by 7-day average.
Do it in 20 seconds.
What’s your volume rule?
#TradingTips #MTL
Not financial advice. My levels, my risk.
They ignore volume.
$MTL is up 22.2% in 24 hours.
Volume is $4.7M.
7-day average volume is 111,600.
$4.7M ÷ 111,600 = 42.1x.
That’s not a spike. That’s conviction.
If volume was under 5x average, I’d ignore the move.
Above a large move? I start watching the structure.
Next time you see a price move, divide 24h volume by 7-day average.
Do it in 20 seconds.
What’s your volume rule?
#TradingTips #MTL
Not financial advice. My levels, my risk.
78

What's the #1 Mistake New Crypto Traders Make?
I've been learning more about crypto trading and one thing stands out:
Many beginners focus on how much they can make but forget to think about how much they can lose.
Here are some common mistakes:
Using too much leverage
Chasing pumps
Trading without a plan
Putting all your money into one coin
FOMO buying after a big move
For me, risk management comes before profit.
What do you think is the #1 mistake?
1 Leverage
2 FOMO
3 No risk management
4 No trading plan
Comment the number + your reason.
$BTC $ETH $SOL #Crypto #CryptoTrading #TradingTips #BinanceSquare
What's the #1 Mistake New Crypto Traders Make?
I've been learning more about crypto trading and one thing stands out:
Many beginners focus on how much they can make but forget to think about how much they can lose.
Here are some common mistakes:
Using too much leverage
Chasing pumps
Trading without a plan
Putting all your money into one coin
FOMO buying after a big move
For me, risk management comes before profit.
What do you think is the #1 mistake?
1 Leverage
2 FOMO
3 No risk management
4 No trading plan
Comment the number + your reason.
$BTC $ETH $SOL #Crypto #CryptoTrading #TradingTips #BinanceSquare
I've been learning more about crypto trading and one thing stands out:
Many beginners focus on how much they can make but forget to think about how much they can lose.
Here are some common mistakes:
Using too much leverage
Chasing pumps
Trading without a plan
Putting all your money into one coin
FOMO buying after a big move
For me, risk management comes before profit.
What do you think is the #1 mistake?
1 Leverage
2 FOMO
3 No risk management
4 No trading plan
Comment the number + your reason.
$BTC $ETH $SOL #Crypto #CryptoTrading #TradingTips #BinanceSquare
151
·
--
Most people ignore volume and chase price alone.
$ILV is up 15.5% in 24 hours.
Volume is $1.1M.
7-day average volume is 305K.
$1.1M ÷ 305K = 3.6x.
That’s not just a rally. That’s conviction.
A move without volume is noise.
A move with 3.6x volume is a shift in participation.
Check it yourself: go to Binance, open the 24h candle, grab volume, divide by 7-day avg.
On my next trade, I check the volume ratio before reacting to price.
What’s your rule for volume?
#TradingTips #ILV
Not financial advice. My levels, my risk.
Most people ignore volume and chase price alone.
$ILV is up 15.5% in 24 hours.
Volume is $1.1M.
7-day average volume is 305K.
$1.1M ÷ 305K = 3.6x.
That’s not just a rally. That’s conviction.
A move without volume is noise.
A move with 3.6x volume is a shift in participation.
Check it yourself: go to Binance, open the 24h candle, grab volume, divide by 7-day avg.
On my next trade, I check the volume ratio before reacting to price.
What’s your rule for volume?
#TradingTips #ILV
Not financial advice. My levels, my risk.
$ILV is up 15.5% in 24 hours.
Volume is $1.1M.
7-day average volume is 305K.
$1.1M ÷ 305K = 3.6x.
That’s not just a rally. That’s conviction.
A move without volume is noise.
A move with 3.6x volume is a shift in participation.
Check it yourself: go to Binance, open the 24h candle, grab volume, divide by 7-day avg.
On my next trade, I check the volume ratio before reacting to price.
What’s your rule for volume?
#TradingTips #ILV
Not financial advice. My levels, my risk.
1
52
·
--
Most traders ignore volume context and chase price.
$REZ is up 14.6% on $25.3M volume.
7-day average volume is 3.16M.
$25.3M ÷ 3.16M = 8.0x.
That’s not just high it’s extreme.
A move without volume is noise.
A move with 8x volume is a signal the market is actively participating.
Check this in 20 seconds:
Go to Binance, click 24h volume, divide by 7d average.
If it’s over 5x, pause and ask why.
On the next trade, I wait for volume to confirm the direction not just the price.
What’s your rule for volume?
#TradingTips #REZ
Not financial advice. My levels, my risk.
Most traders ignore volume context and chase price.
$REZ is up 14.6% on $25.3M volume.
7-day average volume is 3.16M.
$25.3M ÷ 3.16M = 8.0x.
That’s not just high it’s extreme.
A move without volume is noise.
A move with 8x volume is a signal the market is actively participating.
Check this in 20 seconds:
Go to Binance, click 24h volume, divide by 7d average.
If it’s over 5x, pause and ask why.
On the next trade, I wait for volume to confirm the direction not just the price.
What’s your rule for volume?
#TradingTips #REZ
Not financial advice. My levels, my risk.
$REZ is up 14.6% on $25.3M volume.
7-day average volume is 3.16M.
$25.3M ÷ 3.16M = 8.0x.
That’s not just high it’s extreme.
A move without volume is noise.
A move with 8x volume is a signal the market is actively participating.
Check this in 20 seconds:
Go to Binance, click 24h volume, divide by 7d average.
If it’s over 5x, pause and ask why.
On the next trade, I wait for volume to confirm the direction not just the price.
What’s your rule for volume?
#TradingTips #REZ
Not financial advice. My levels, my risk.
28

·
--
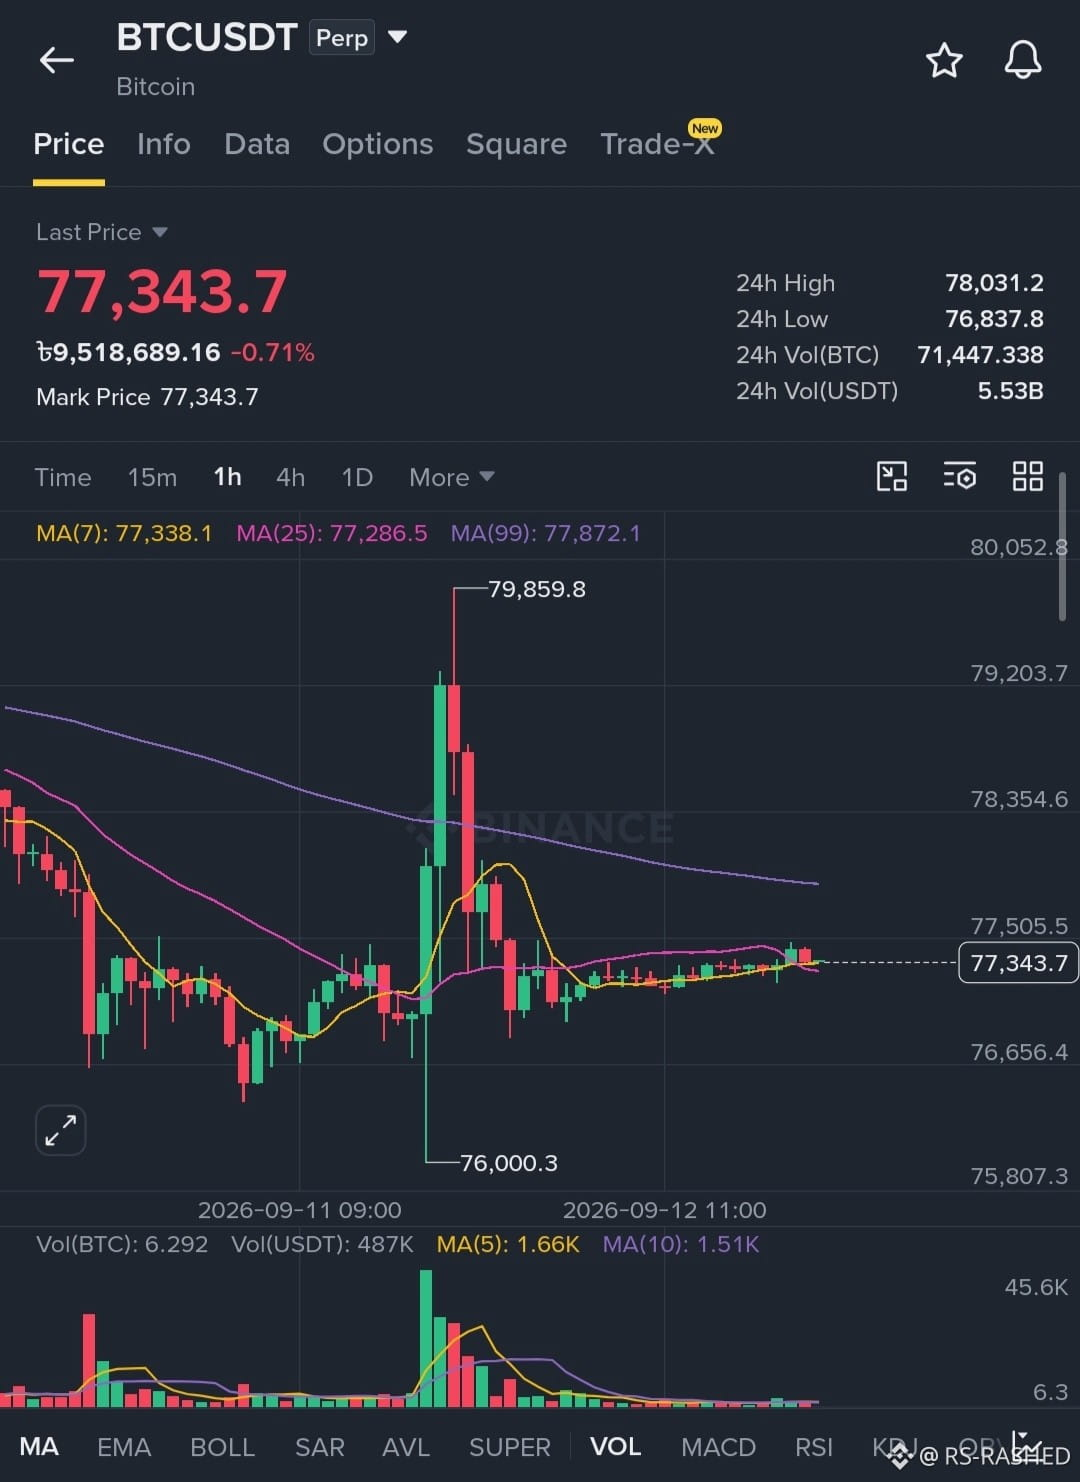
Is the market waiting for a massive $BTC breakout? 🚀
Bitcoin is testing major resistance levels right now. Institutional inflows and ETF volumes continue to show steady demand, but retail traders are still waiting for clear confirmation.
🔹 Next major support: Watch closely for consolidation zones
🔹 Resistance test: A breakout here could open doors to a fresh rally
Are you Bullish or Bearish for the coming week? Drop your targets below! 👇
#Bitcoin #CryptoMarkets #tradingtips
Is the market waiting for a massive $BTC breakout? 🚀
Bitcoin is testing major resistance levels right now. Institutional inflows and ETF volumes continue to show steady demand, but retail traders are still waiting for clear confirmation.
🔹 Next major support: Watch closely for consolidation zones
🔹 Resistance test: A breakout here could open doors to a fresh rally
Are you Bullish or Bearish for the coming week? Drop your targets below! 👇
#Bitcoin #CryptoMarkets #tradingtips
Bitcoin is testing major resistance levels right now. Institutional inflows and ETF volumes continue to show steady demand, but retail traders are still waiting for clear confirmation.
🔹 Next major support: Watch closely for consolidation zones
🔹 Resistance test: A breakout here could open doors to a fresh rally
Are you Bullish or Bearish for the coming week? Drop your targets below! 👇
#Bitcoin #CryptoMarkets #tradingtips
70

·
--
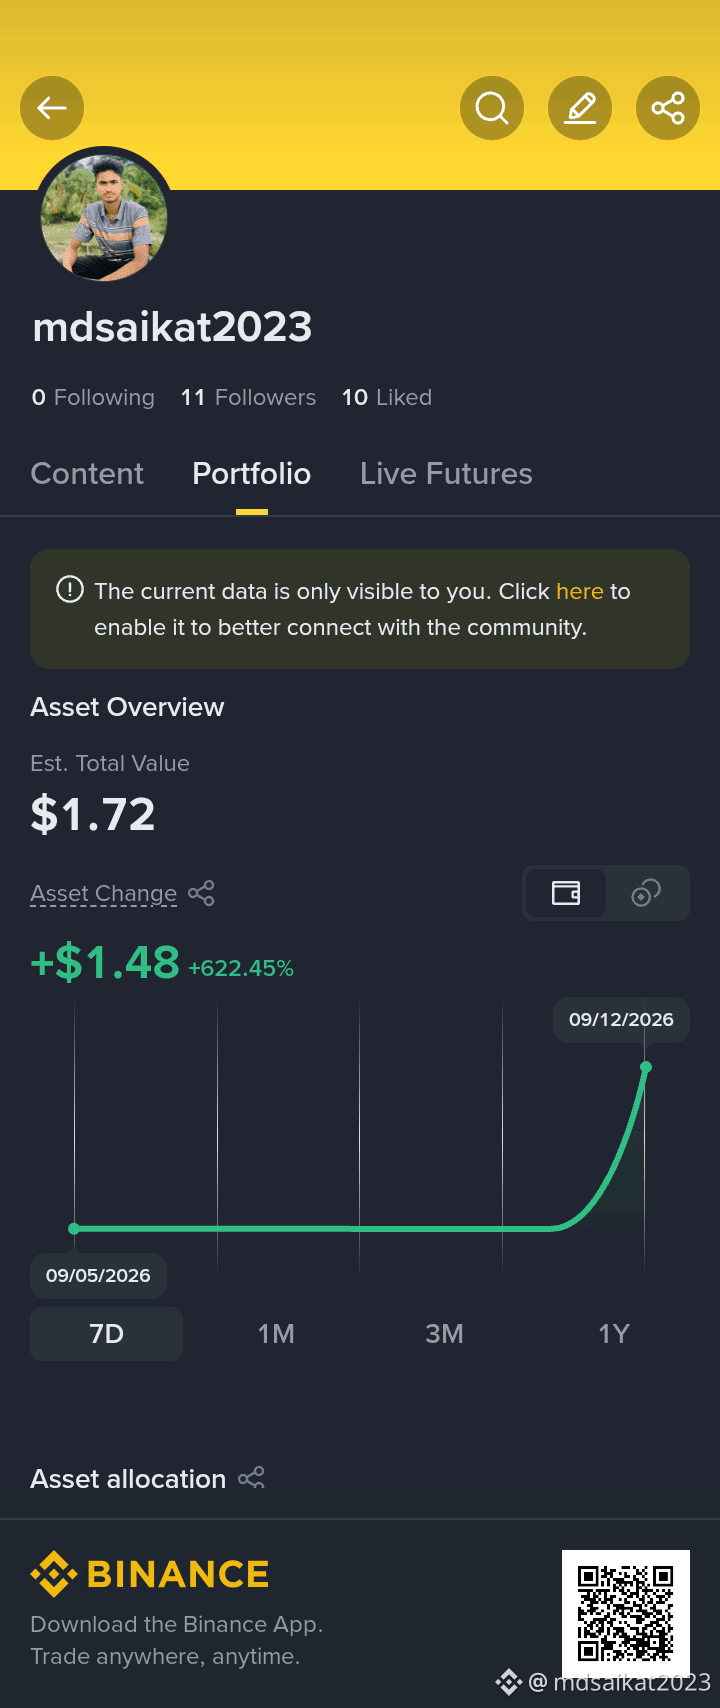
🚀 Small Capital, Big Percentage Gains! +622% Portfolio Growth! 🔥
Starting small is never a barrier in crypto when you follow proper risk management and market sentiment! 📈
Seeing a +622.45% increase in asset growth over the past week. It’s not always about the size of the balance, but the consistency of the strategy and patience!
💡 Key Takeaways for Beginners:
1️⃣ Risk Management First: Protect your capital before aiming for huge returns.
2️⃣ Focus on Percentages: Focus on gaining consistent % returns rather than chasing quick profits.
3️⃣ Stay Patient: Let your setup play out without panic selling.
👇 What’s your best percentage gain this week?
Share your stats or favourite coin in the comments below! 👇CryptoJourney #BinanceSquare #PortfolioGrowth #TradingTips #bitcoin
🚀 Small Capital, Big Percentage Gains! +622% Portfolio Growth! 🔥
Starting small is never a barrier in crypto when you follow proper risk management and market sentiment! 📈
Seeing a +622.45% increase in asset growth over the past week. It’s not always about the size of the balance, but the consistency of the strategy and patience!
💡 Key Takeaways for Beginners:
1️⃣ Risk Management First: Protect your capital before aiming for huge returns.
2️⃣ Focus on Percentages: Focus on gaining consistent % returns rather than chasing quick profits.
3️⃣ Stay Patient: Let your setup play out without panic selling.
👇 What’s your best percentage gain this week?
Share your stats or favourite coin in the comments below! 👇CryptoJourney #BinanceSquare #PortfolioGrowth #TradingTips #bitcoin
Starting small is never a barrier in crypto when you follow proper risk management and market sentiment! 📈
Seeing a +622.45% increase in asset growth over the past week. It’s not always about the size of the balance, but the consistency of the strategy and patience!
💡 Key Takeaways for Beginners:
1️⃣ Risk Management First: Protect your capital before aiming for huge returns.
2️⃣ Focus on Percentages: Focus on gaining consistent % returns rather than chasing quick profits.
3️⃣ Stay Patient: Let your setup play out without panic selling.
👇 What’s your best percentage gain this week?
Share your stats or favourite coin in the comments below! 👇CryptoJourney #BinanceSquare #PortfolioGrowth #TradingTips #bitcoin
76

·
--
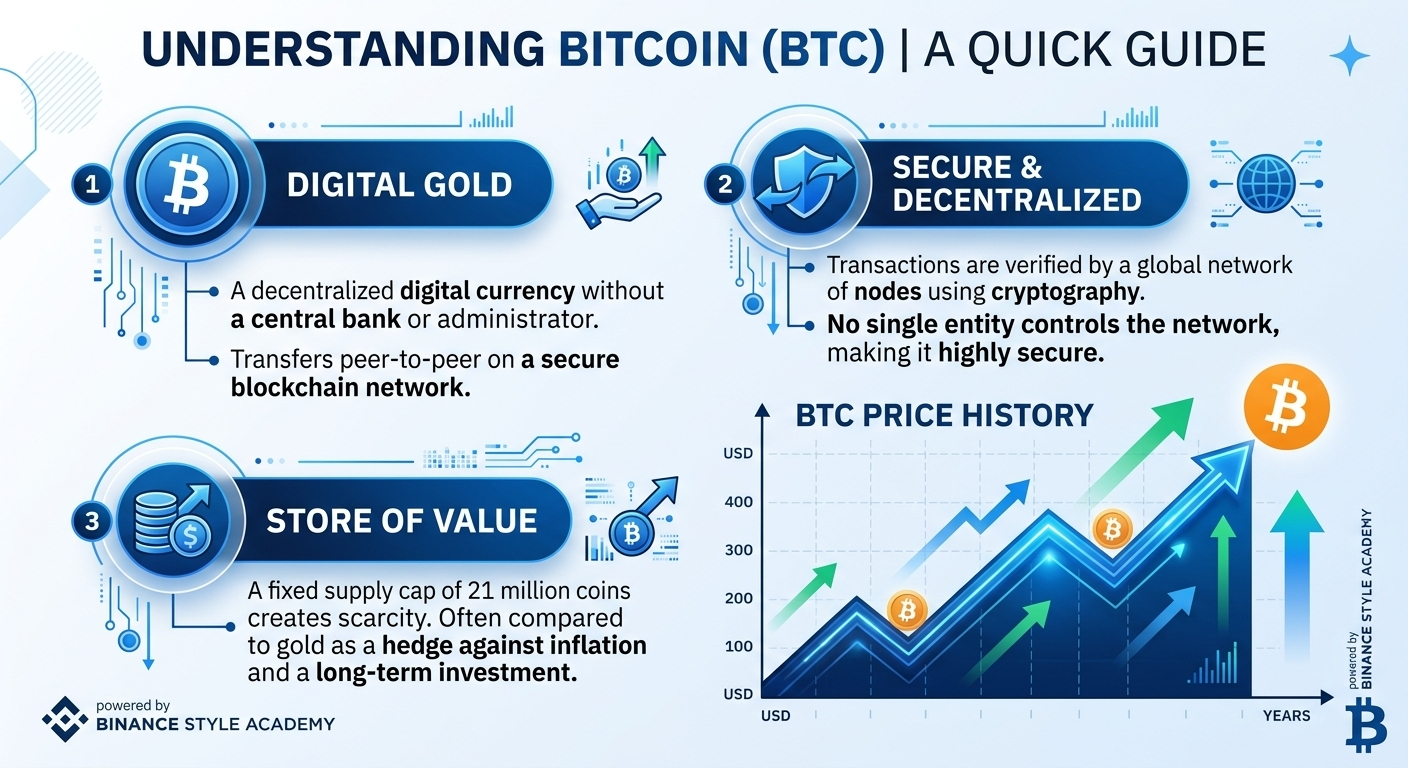
3 Signs of a $BTC Reversal Most Traders Miss 👇
1. Funding Rate flips negative
2. Whale wallets start accumulating
3. RSI divergence on 4H chart
Save this for next time you see a dip 📌
Which one do you watch the most?
#BTC #tradingtips #CryptoEducation #ta
3 Signs of a $BTC Reversal Most Traders Miss 👇
1. Funding Rate flips negative
2. Whale wallets start accumulating
3. RSI divergence on 4H chart
Save this for next time you see a dip 📌
Which one do you watch the most?
#BTC #tradingtips #CryptoEducation #ta
1. Funding Rate flips negative
2. Whale wallets start accumulating
3. RSI divergence on 4H chart
Save this for next time you see a dip 📌
Which one do you watch the most?
#BTC #tradingtips #CryptoEducation #ta
65

·
--
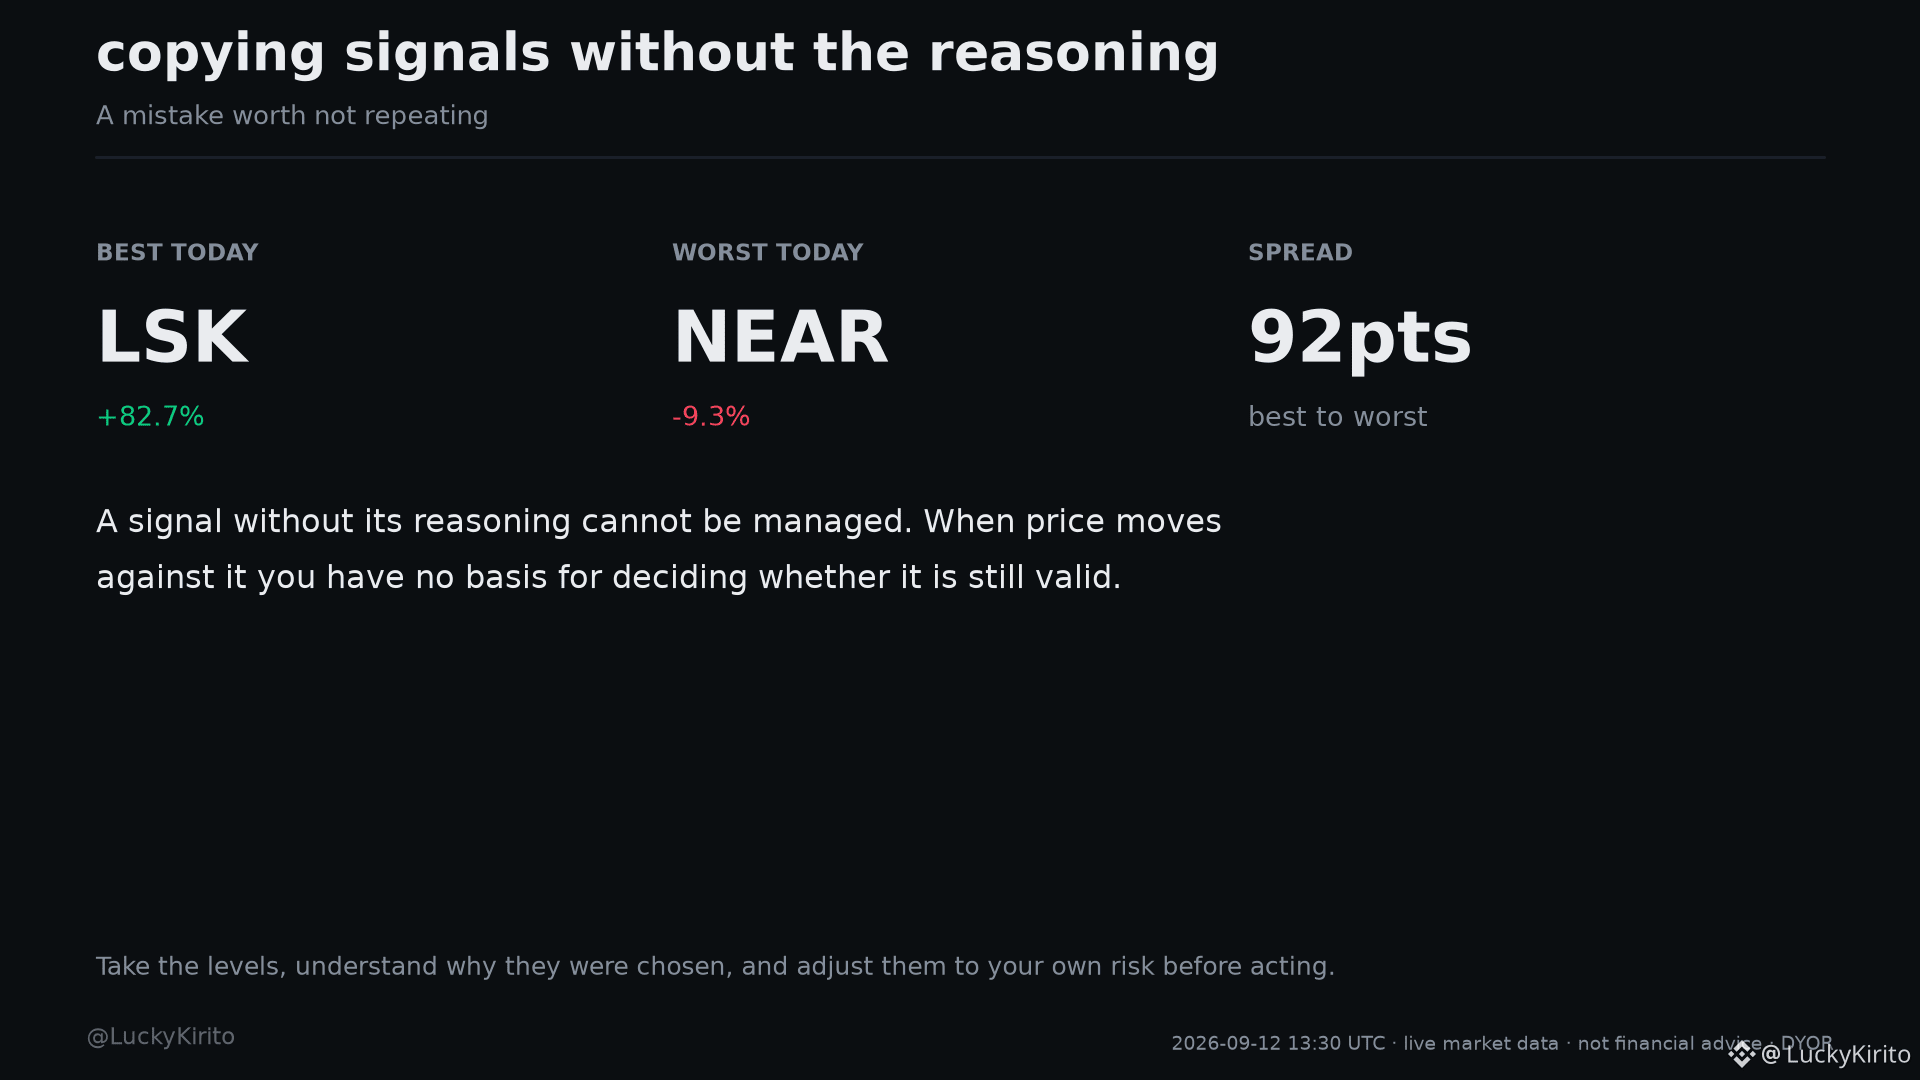
Worth saying plainly: copying signals without the reasoning.
A signal without its reasoning cannot be managed. When price moves against it you have no basis for deciding whether it is still valid.
Take the levels, understand why they were chosen, and adjust them to your own risk before acting.
Today's market makes the point: LSK is +82.7% while NEAR is -9.3%, a spread of 92 points across the same 60 liquid pairs on the same day.
#Write2Earn #TradingTips #RiskManagement #TradingBasics
Automated technical analysis, not financial advice. I am not responsible for your trades. DYOR.
Worth saying plainly: copying signals without the reasoning.
A signal without its reasoning cannot be managed. When price moves against it you have no basis for deciding whether it is still valid.
Take the levels, understand why they were chosen, and adjust them to your own risk before acting.
Today's market makes the point: LSK is +82.7% while NEAR is -9.3%, a spread of 92 points across the same 60 liquid pairs on the same day.
#Write2Earn #TradingTips #RiskManagement #TradingBasics
Automated technical analysis, not financial advice. I am not responsible for your trades. DYOR.
A signal without its reasoning cannot be managed. When price moves against it you have no basis for deciding whether it is still valid.
Take the levels, understand why they were chosen, and adjust them to your own risk before acting.
Today's market makes the point: LSK is +82.7% while NEAR is -9.3%, a spread of 92 points across the same 60 liquid pairs on the same day.
#Write2Earn #TradingTips #RiskManagement #TradingBasics
Automated technical analysis, not financial advice. I am not responsible for your trades. DYOR.
76
Log in to explore more content
Join global crypto users on Binance Square
⚡️ Get latest and useful information about crypto.
💬 Trusted by the world’s largest crypto exchange.
👍 Discover real insights from verified creators.
Email / Phone number
Trending Topics
1
#AnthropicCEOCallsForAISlowdown
16,058 views
321 Discussing
2
#AnthropicChoosesNasdaqForPotentialIPO
3,766 views
93 Discussing
3
#SECReceivesGrayscaleLitecoinTrustETFFiling
133,906 views
1,825 Discussing
4
#ClarityActFacesProceduralVoteSept15
268,460 views
2,705 Discussing
5
#US10YearTreasuryYieldNears5%
102,823 views
1,508 Discussing
6
#CryptoLiquidations$674MIn24H
25,824 views
221 Discussing
7
#TokenizedStockHoldersUp619.1%
77,814 views
1,223 Discussing
8
#RevolutConfirmsFakeGovEmailDataBreach
118,459 views
1,508 Discussing
9
#CanadaOSFISaysTokenizedDepositsEqualTraditionalDeposits
6,240 views
126 Discussing
10
#USBankCompletesCrossBorderPaymentPilotOnStellar
91,488 views
1,315 Discussing