
#tradingstatistics
tradingstatistics
19,750 views
23 Discussing
Hot
Latest

·
--
Bullish
📊 TRADING PERFORMANCE & FEAR AND GREED INDEX (FGI) REPORT – UPDATED 07/11/2026
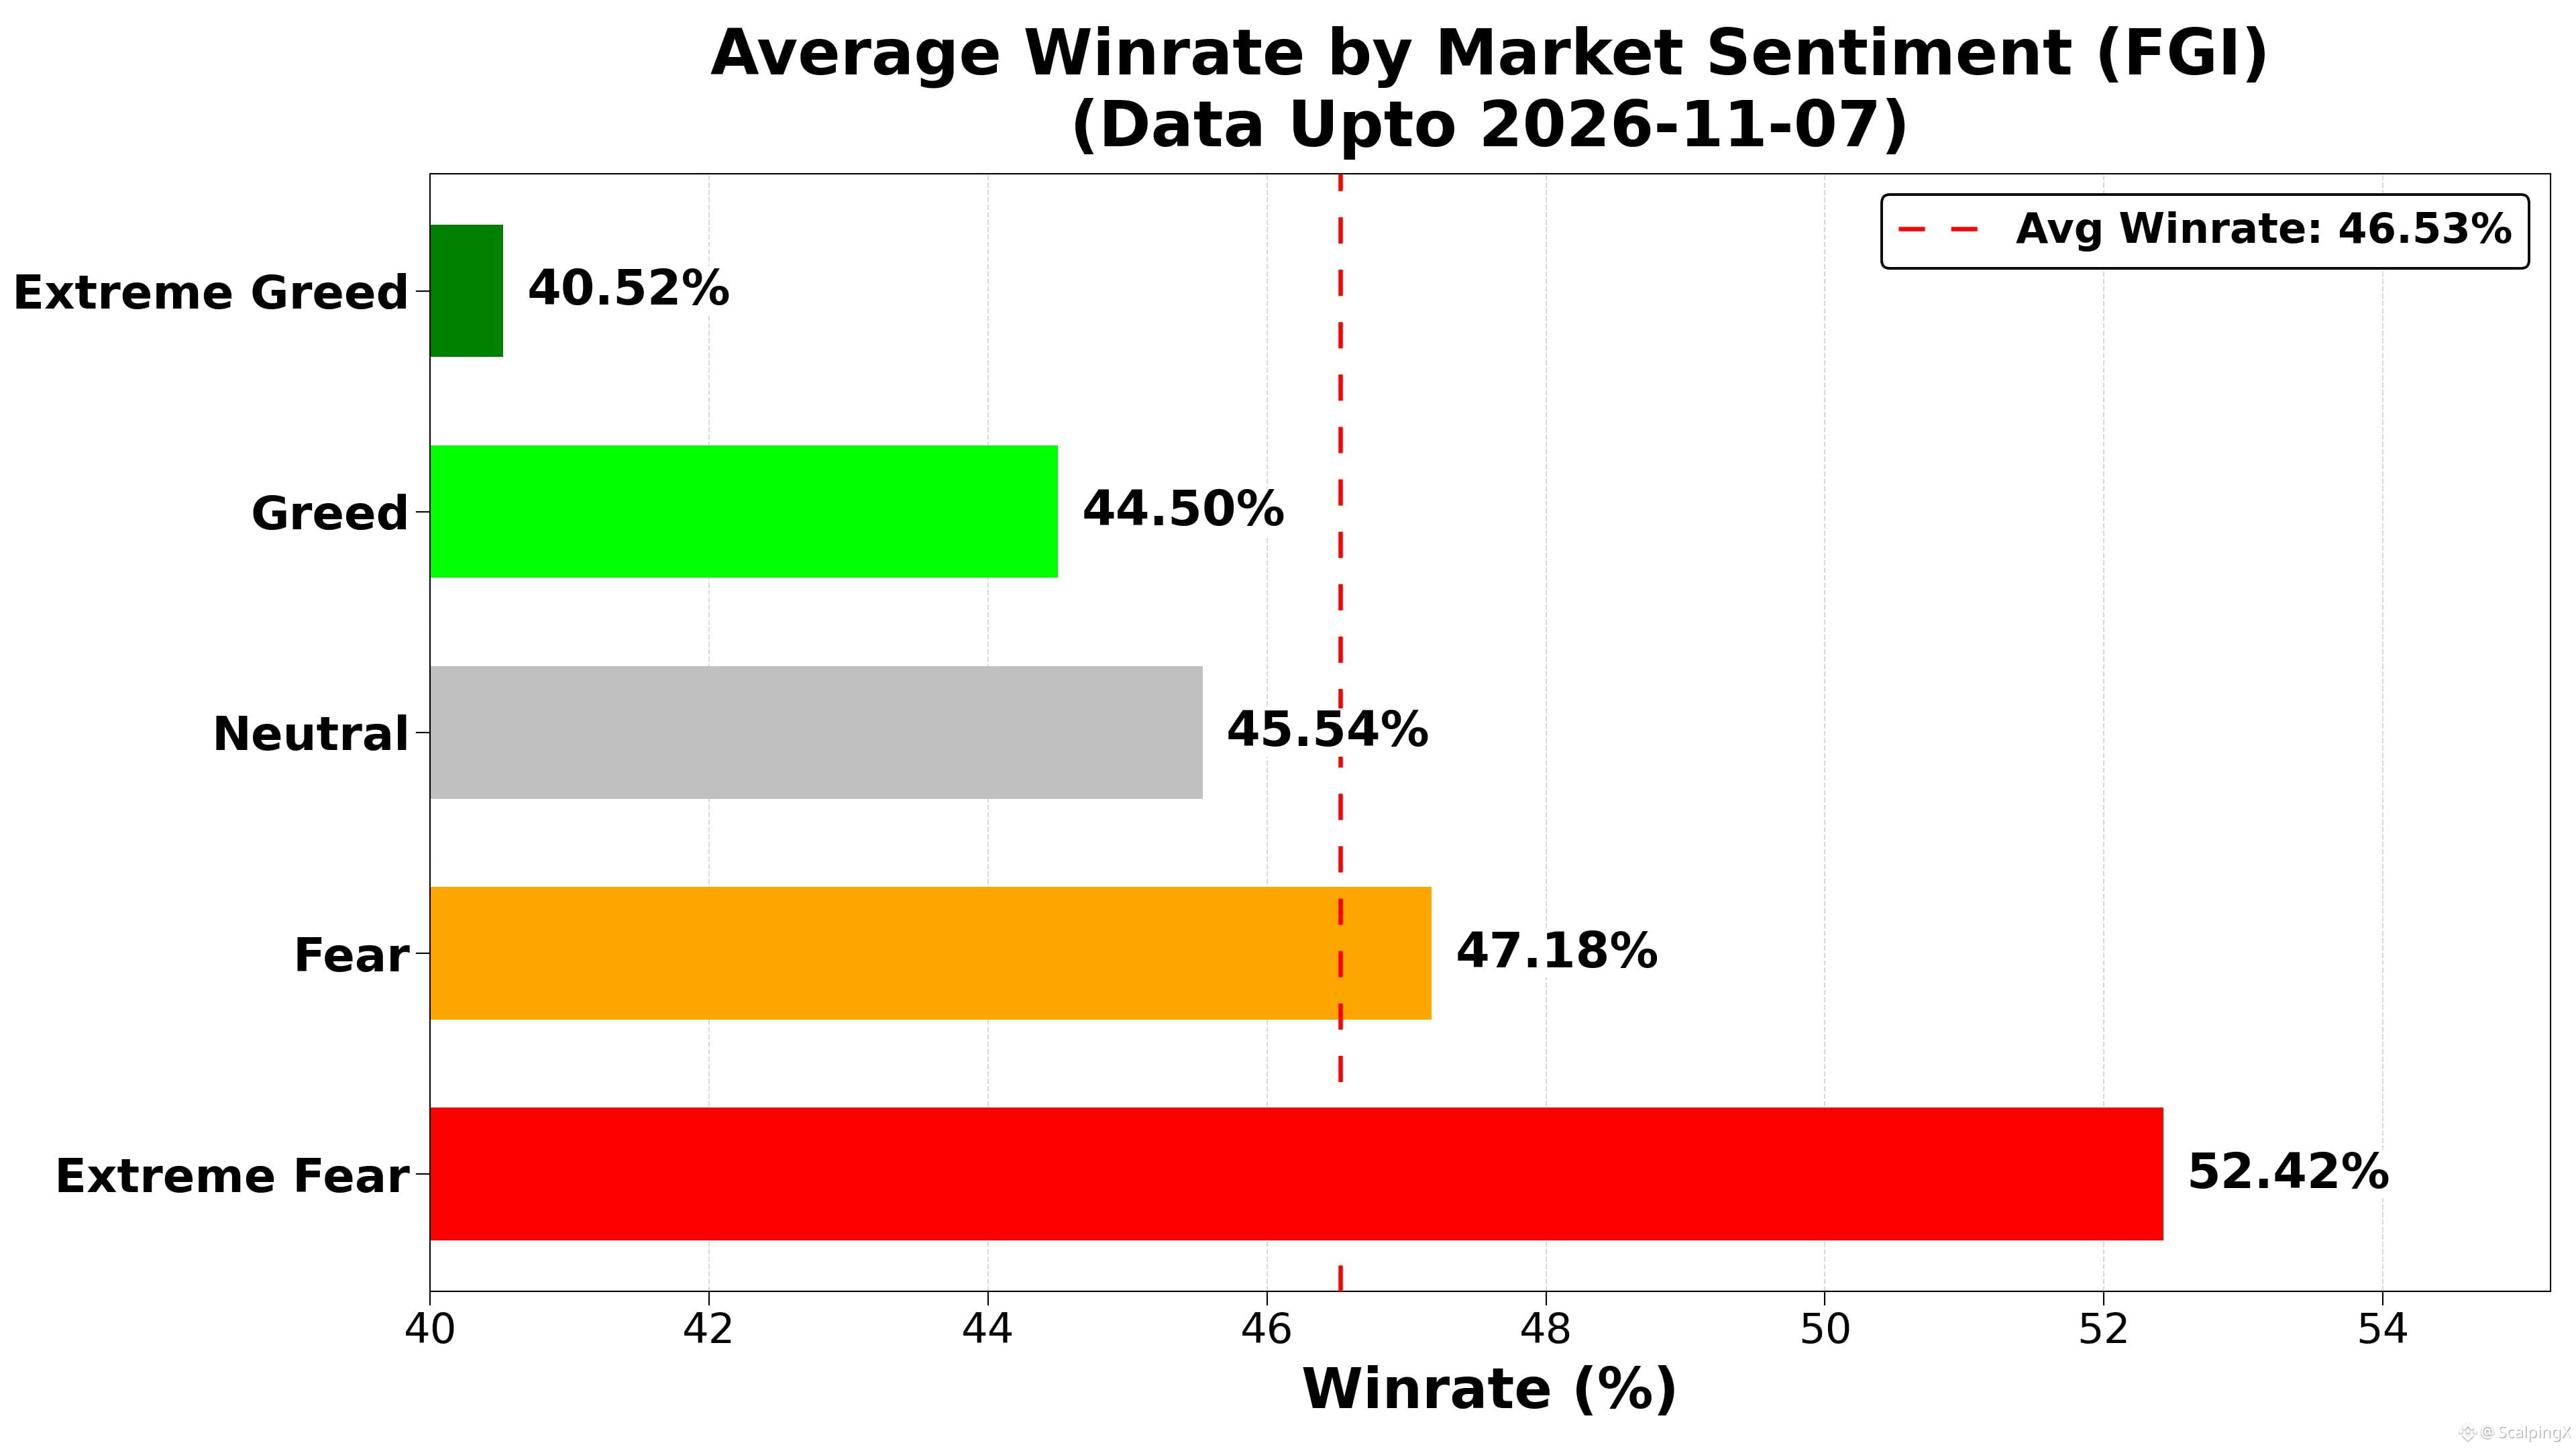
Data covering 858 days shows a correlation between FGI and Win Rate (WR) of r ≈ -0.291, slightly weaker than -0.293 on 31/10/2026. The relationship remains negative, with insufficient evidence to use FGI alone as a trade entry signal.
Trading performance in the sample tends to be lower during periods of greed, particularly extreme greed. FGI can provide context for assessing risk, but this correlation does not establish predictive ability or causation.
Below are the average daily win rate (WR), theoretical break-even R, and number of observed days (n) for each sentiment range. R is expressed as risk, excluding fees and slippage:
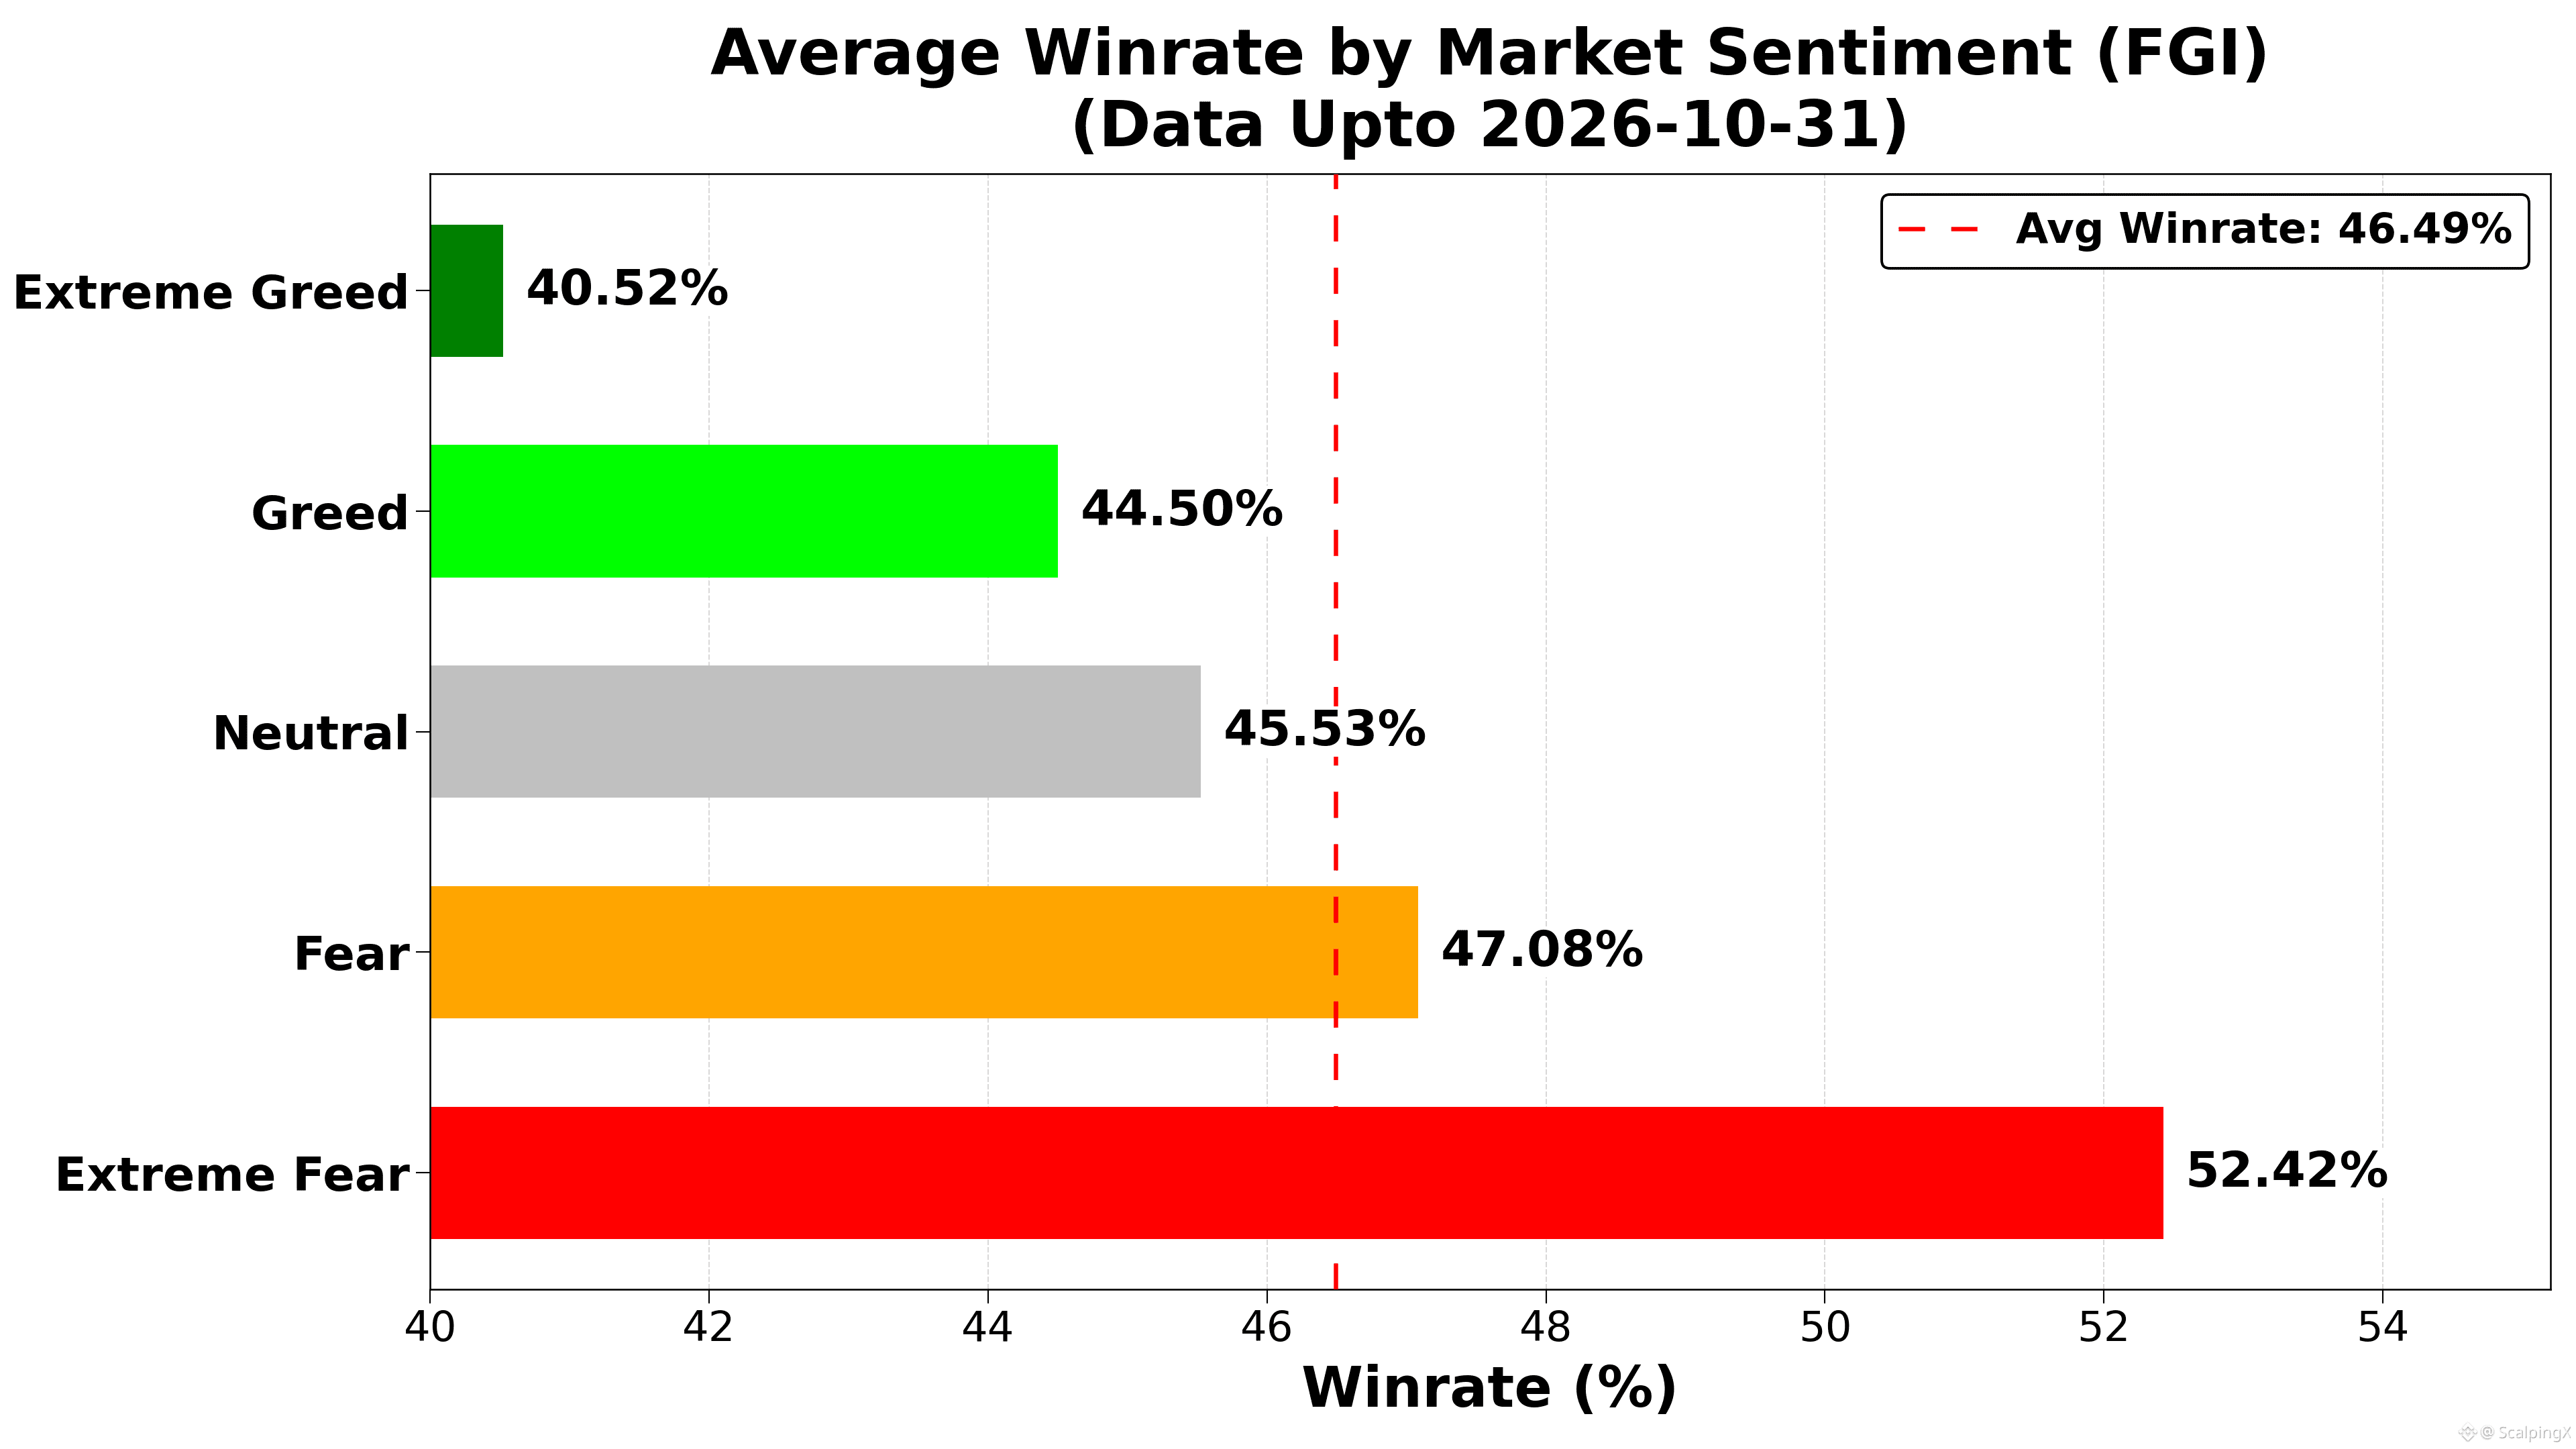
🤑 Extreme Greed (≥80): WR 40.5% • R=1:1.47 • n=25
😌 Greed (60–<80): WR 44.5% • R=1:1.25 • n=267
😐 Neutral (40–<60): WR 45.5% • R=1:1.20 • n=172
😰 Fear (20–<40): WR 47.2% • R=1:1.12 • n=279
😱 Extreme Fear (<20): WR 52.4% • R=1:0.91 • n=115
The percentage of days exceeding the full-sample average daily win rate of 46.53% within each sentiment range:
🤑 Extreme Greed: 8.0%
😌 Greed: 34.1%
😐 Neutral: 40.1%
😰 Fear: 55.2%
😱 Extreme Fear: 67.8%
➤ These statistics illustrate the relationship between win rate and the R required to break even.
📈 At higher FGI levels, historical WR is lower, implying a higher break-even R. However, setting more distant profit targets may itself change the win rate.
📉 At lower FGI levels, historical WR is higher, implying a lower break-even R. This alone does not establish that reducing profit targets would accelerate capital turnover or improve performance.
#TradingStatistics $BTC $BNB $GRAM
📊 TRADING PERFORMANCE & FEAR AND GREED INDEX (FGI) REPORT – UPDATED 07/11/2026
Data covering 858 days shows a correlation between FGI and Win Rate (WR) of r ≈ -0.291, slightly weaker than -0.293 on 31/10/2026. The relationship remains negative, with insufficient evidence to use FGI alone as a trade entry signal.
Trading performance in the sample tends to be lower during periods of greed, particularly extreme greed. FGI can provide context for assessing risk, but this correlation does not establish predictive ability or causation.
Below are the average daily win rate (WR), theoretical break-even R, and number of observed days (n) for each sentiment range. R is expressed as risk, excluding fees and slippage:
🤑 Extreme Greed (≥80): WR 40.5% • R=1:1.47 • n=25
😌 Greed (60–<80): WR 44.5% • R=1:1.25 • n=267
😐 Neutral (40–<60): WR 45.5% • R=1:1.20 • n=172
😰 Fear (20–<40): WR 47.2% • R=1:1.12 • n=279
😱 Extreme Fear (<20): WR 52.4% • R=1:0.91 • n=115
The percentage of days exceeding the full-sample average daily win rate of 46.53% within each sentiment range:
🤑 Extreme Greed: 8.0%
😌 Greed: 34.1%
😐 Neutral: 40.1%
😰 Fear: 55.2%
😱 Extreme Fear: 67.8%
➤ These statistics illustrate the relationship between win rate and the R required to break even.
📈 At higher FGI levels, historical WR is lower, implying a higher break-even R. However, setting more distant profit targets may itself change the win rate.
📉 At lower FGI levels, historical WR is higher, implying a lower break-even R. This alone does not establish that reducing profit targets would accelerate capital turnover or improve performance.
#TradingStatistics $BTC $BNB $GRAM
Data covering 858 days shows a correlation between FGI and Win Rate (WR) of r ≈ -0.291, slightly weaker than -0.293 on 31/10/2026. The relationship remains negative, with insufficient evidence to use FGI alone as a trade entry signal.
Trading performance in the sample tends to be lower during periods of greed, particularly extreme greed. FGI can provide context for assessing risk, but this correlation does not establish predictive ability or causation.
Below are the average daily win rate (WR), theoretical break-even R, and number of observed days (n) for each sentiment range. R is expressed as risk, excluding fees and slippage:
🤑 Extreme Greed (≥80): WR 40.5% • R=1:1.47 • n=25
😌 Greed (60–<80): WR 44.5% • R=1:1.25 • n=267
😐 Neutral (40–<60): WR 45.5% • R=1:1.20 • n=172
😰 Fear (20–<40): WR 47.2% • R=1:1.12 • n=279
😱 Extreme Fear (<20): WR 52.4% • R=1:0.91 • n=115
The percentage of days exceeding the full-sample average daily win rate of 46.53% within each sentiment range:
🤑 Extreme Greed: 8.0%
😌 Greed: 34.1%
😐 Neutral: 40.1%
😰 Fear: 55.2%
😱 Extreme Fear: 67.8%
➤ These statistics illustrate the relationship between win rate and the R required to break even.
📈 At higher FGI levels, historical WR is lower, implying a higher break-even R. However, setting more distant profit targets may itself change the win rate.
📉 At lower FGI levels, historical WR is higher, implying a lower break-even R. This alone does not establish that reducing profit targets would accelerate capital turnover or improve performance.
#TradingStatistics $BTC $BNB $GRAM
87
·
--
Updated 2026-11-07, community-wide trading
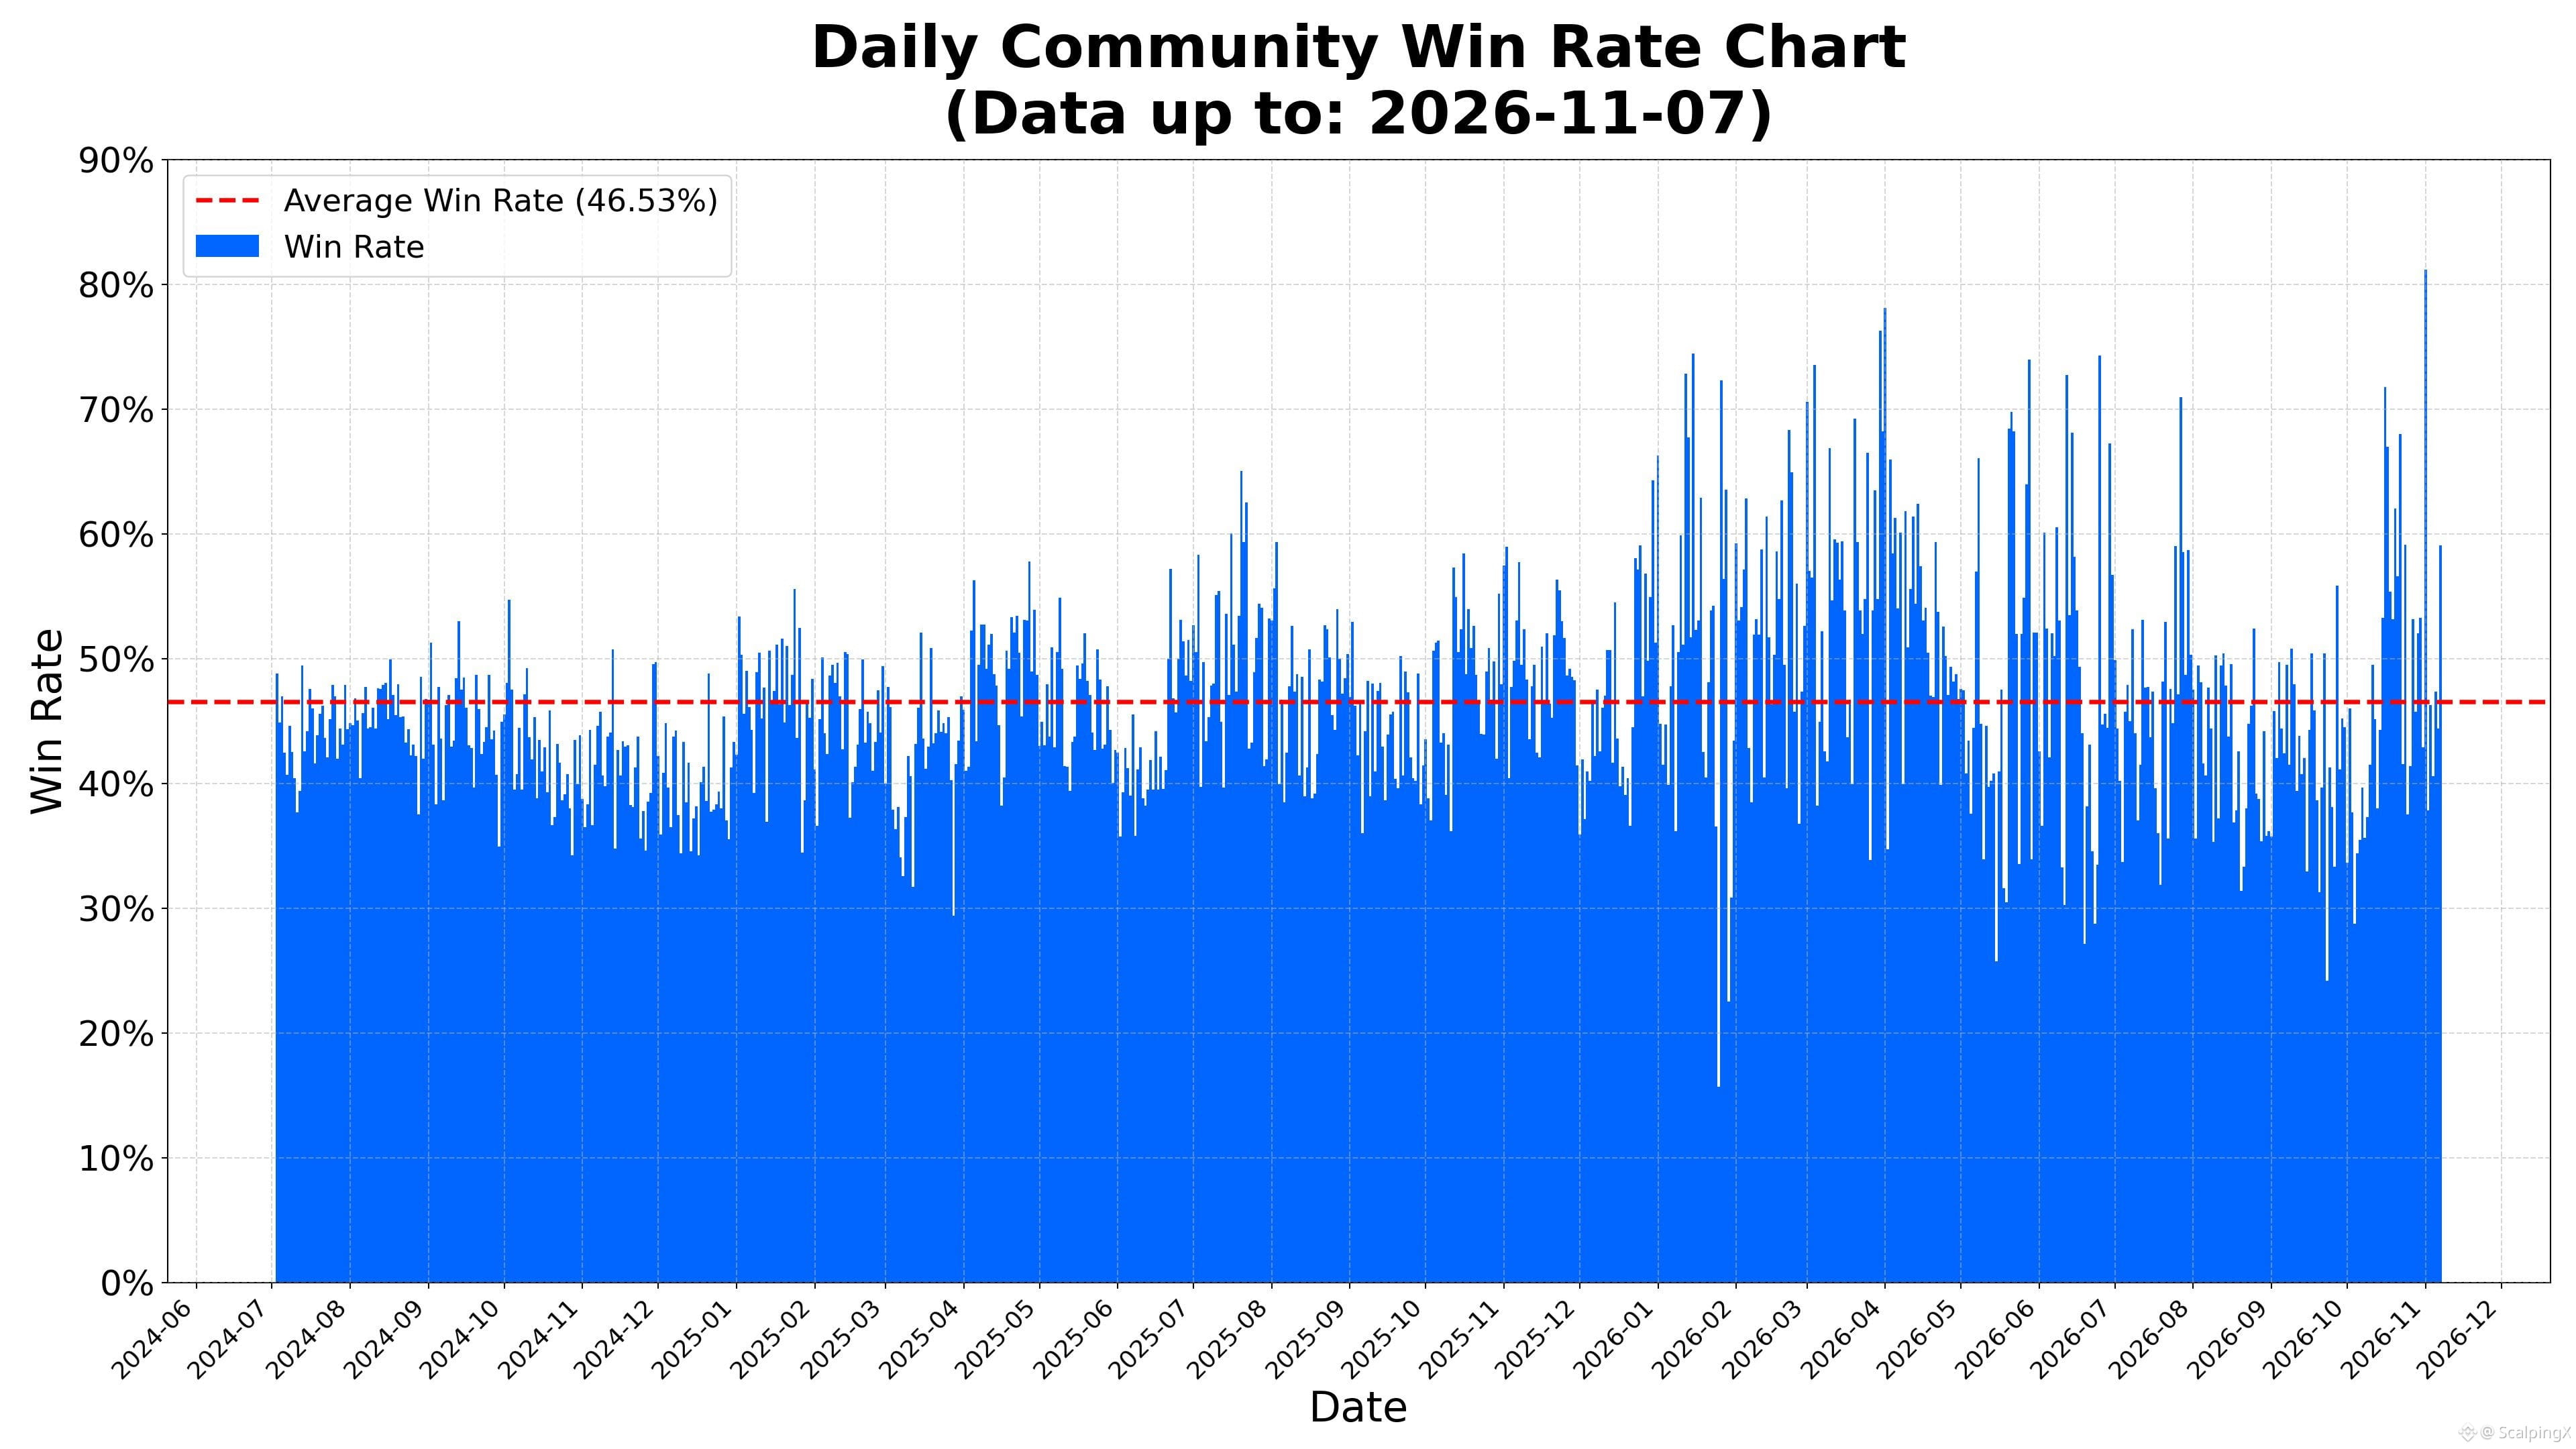
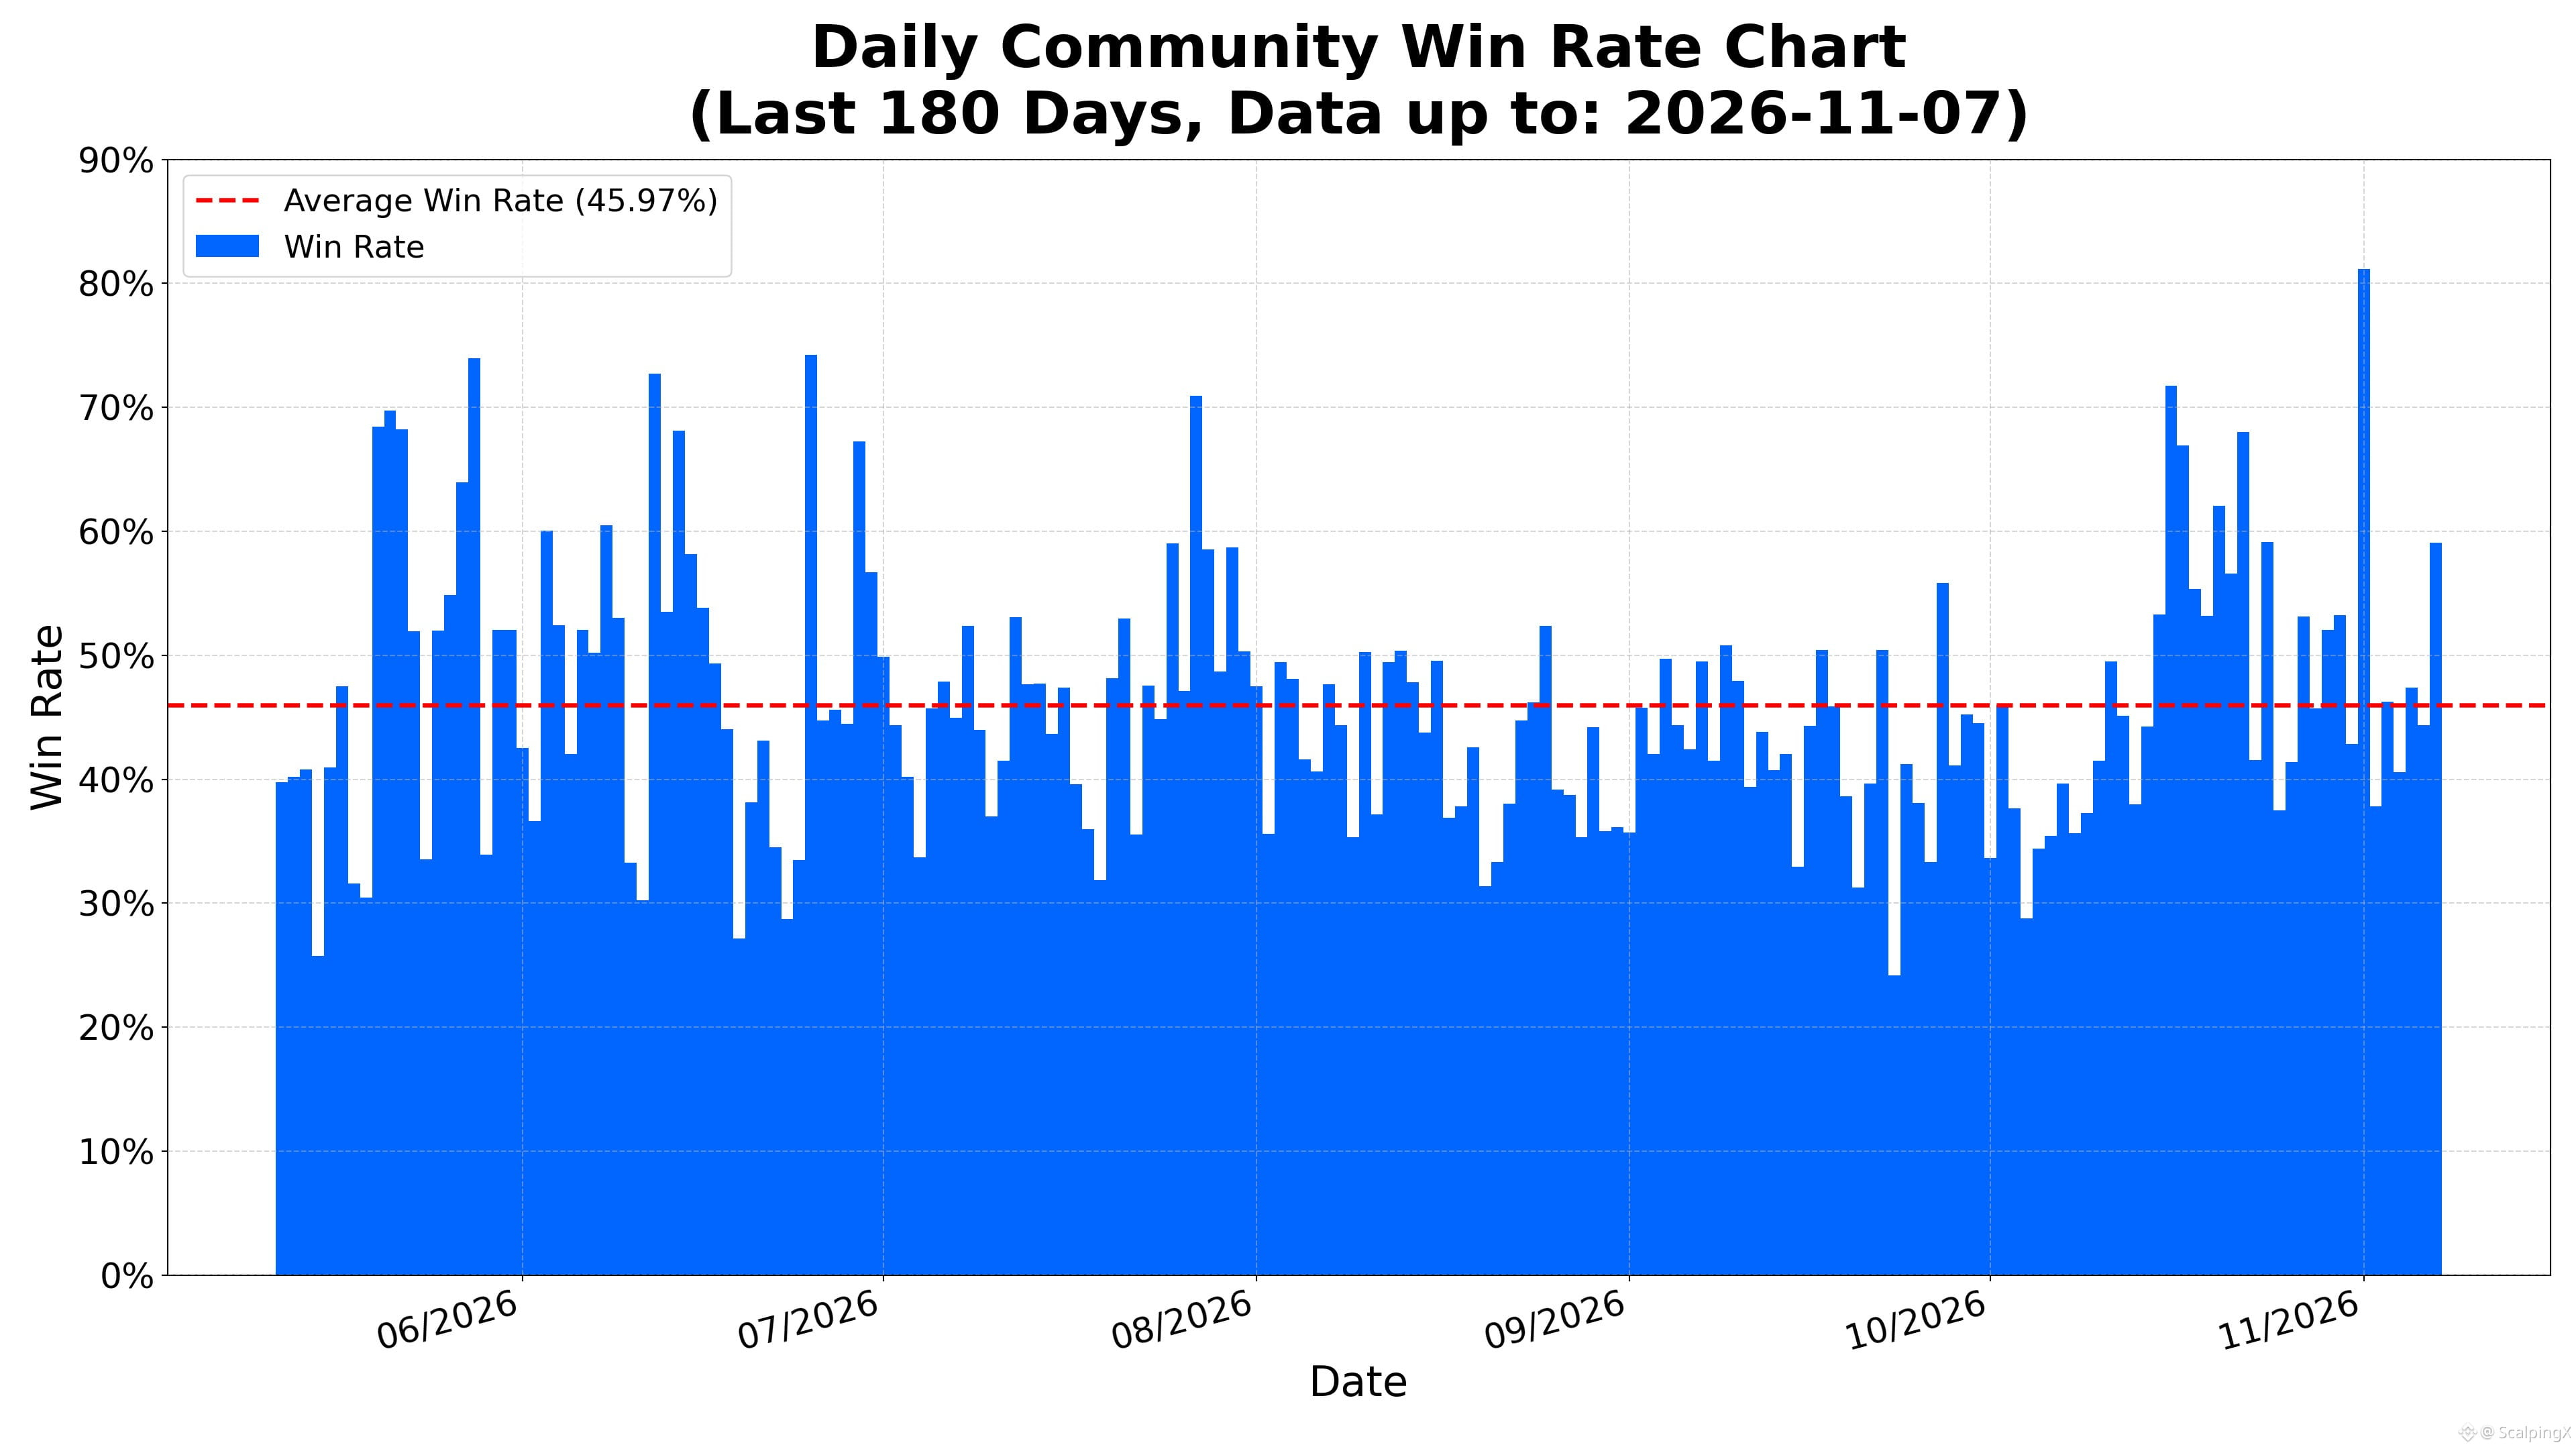
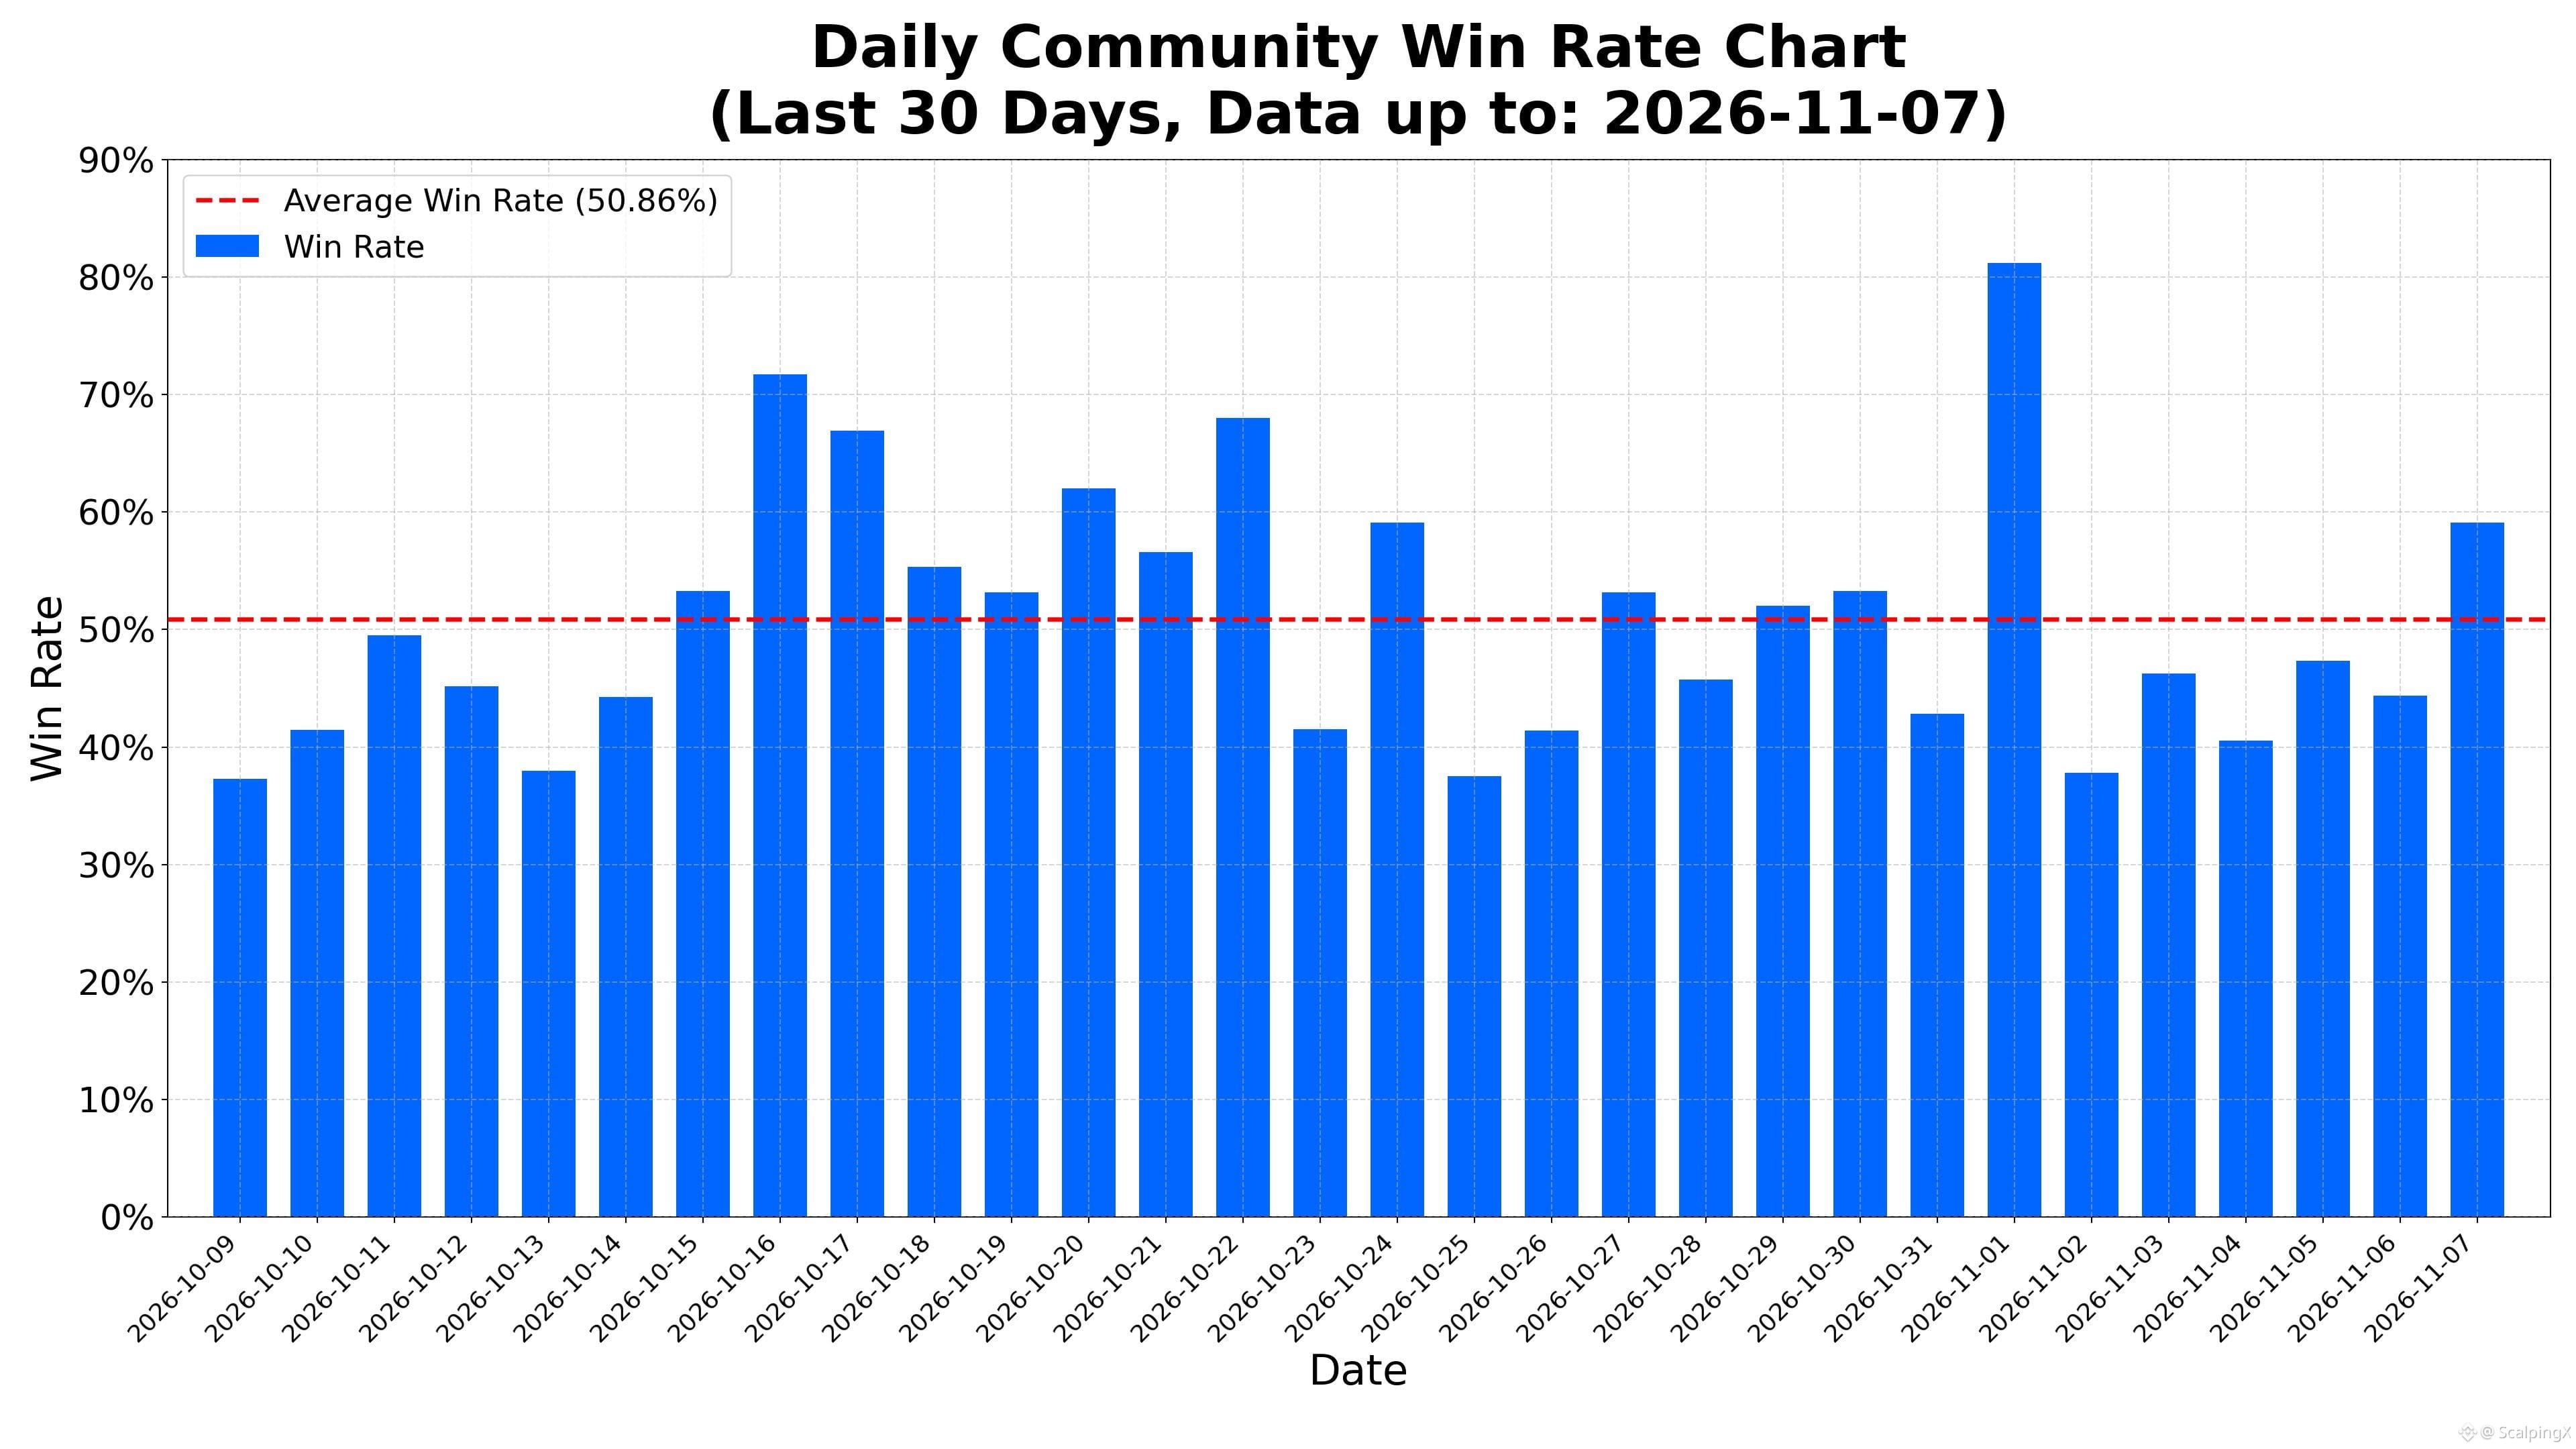
📊 The average daily win rate is 46.53%.
🏆 The highest daily win rate was 81.16% on 2026-11-01. The lowest was 15.69% on 2026-01-25.
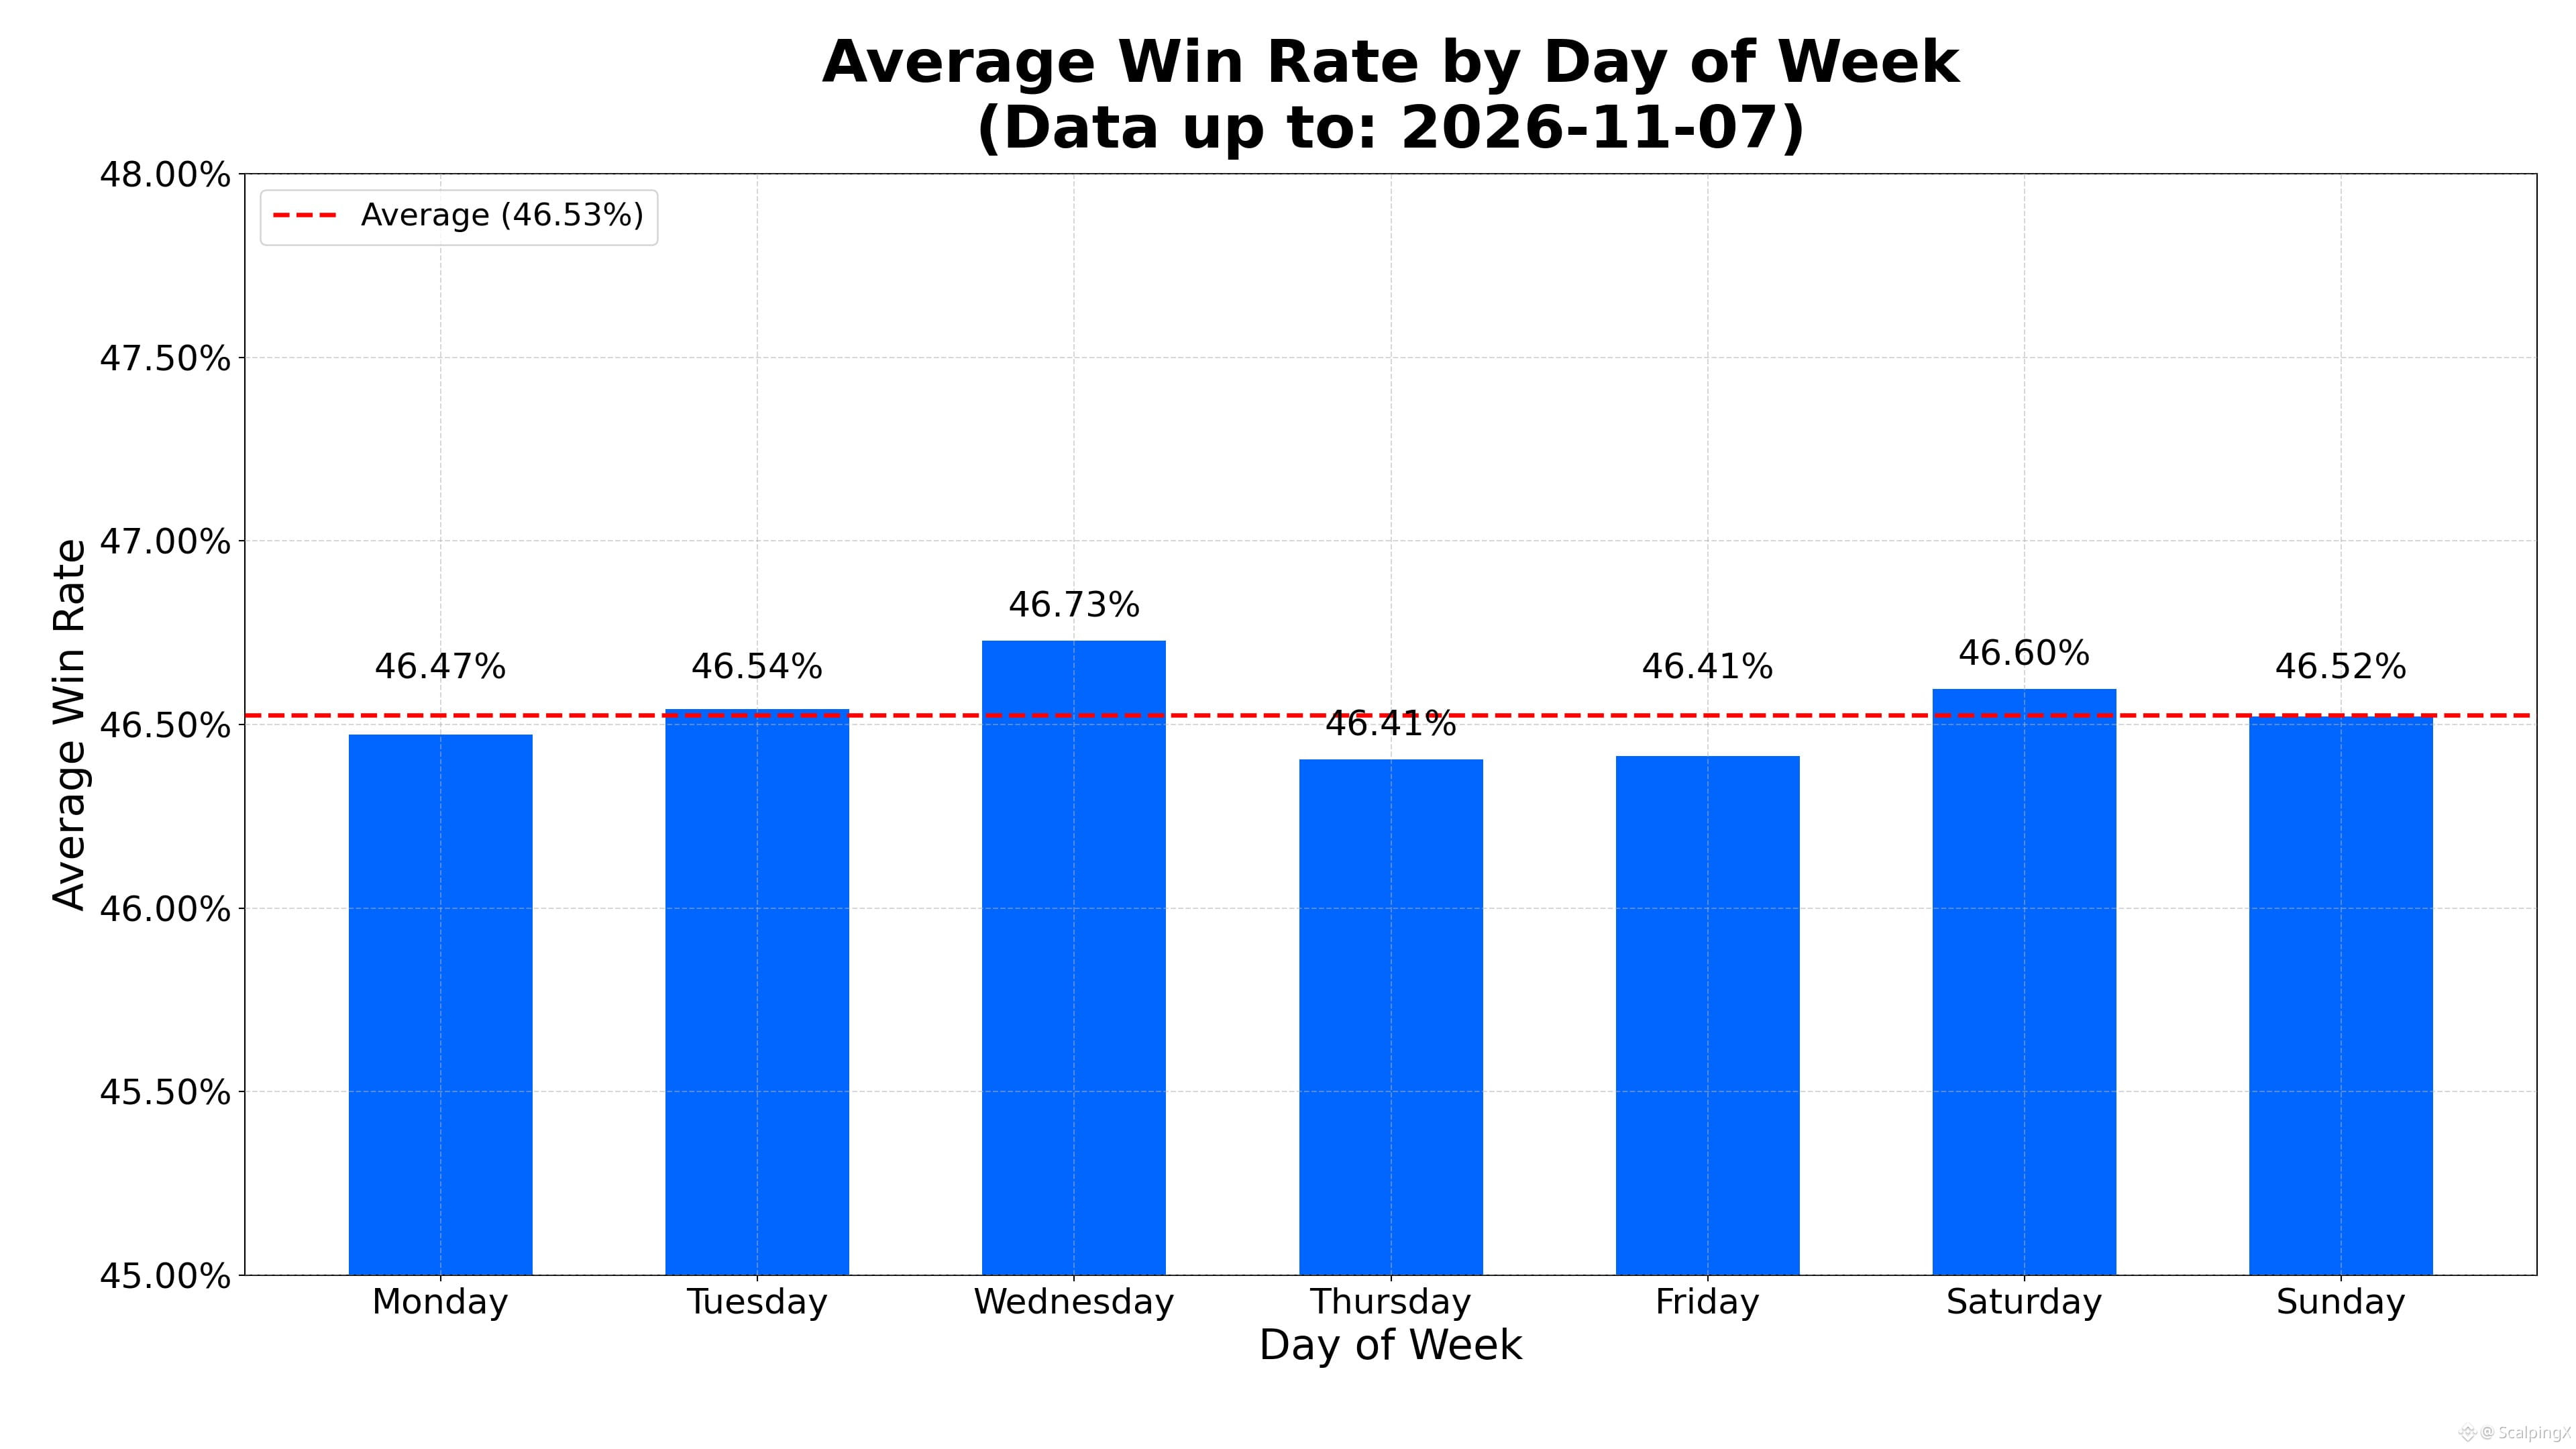
📅 Wednesday has the highest average win rate at 46.73%. Thursday has the lowest at 46.41%.
⏱️ The highest 7-day average win rate was 63.27%, ending on 2026-04-05. The lowest was 35.54%, ending on 2026-10-09.
⚖️ The number of days with an above-average win rate is 394. The number of days at or below the average is 464.
📈 The number of days with a win rate above 50% is 239. The number of days between 40% and 50%, inclusive, is 452. The number of days below 40% is 167.
#TradingStatistics $HYPE $XRP $GRAM
Updated 2026-11-07, community-wide trading
📊 The average daily win rate is 46.53%.
🏆 The highest daily win rate was 81.16% on 2026-11-01. The lowest was 15.69% on 2026-01-25.
📅 Wednesday has the highest average win rate at 46.73%. Thursday has the lowest at 46.41%.
⏱️ The highest 7-day average win rate was 63.27%, ending on 2026-04-05. The lowest was 35.54%, ending on 2026-10-09.
⚖️ The number of days with an above-average win rate is 394. The number of days at or below the average is 464.
📈 The number of days with a win rate above 50% is 239. The number of days between 40% and 50%, inclusive, is 452. The number of days below 40% is 167.
#TradingStatistics $HYPE $XRP $GRAM
📊 The average daily win rate is 46.53%.
🏆 The highest daily win rate was 81.16% on 2026-11-01. The lowest was 15.69% on 2026-01-25.
📅 Wednesday has the highest average win rate at 46.73%. Thursday has the lowest at 46.41%.
⏱️ The highest 7-day average win rate was 63.27%, ending on 2026-04-05. The lowest was 35.54%, ending on 2026-10-09.
⚖️ The number of days with an above-average win rate is 394. The number of days at or below the average is 464.
📈 The number of days with a win rate above 50% is 239. The number of days between 40% and 50%, inclusive, is 452. The number of days below 40% is 167.
#TradingStatistics $HYPE $XRP $GRAM
1
139
·
--
📊 TRADING PERFORMANCE & FEAR AND GREED INDEX (FGI) REPORT – UPDATED 31/10/2026
Across 851 days of data, the correlation between FGI and daily win rate stands at r ≈ -0.293, virtually unchanged from the 24/10/2026 update. The relationship remains negative and does not provide sufficient evidence to use FGI as a standalone entry signal.
Trading performance in the sample tends to be lower during periods of greed, particularly extreme greed. FGI may provide context for assessing risk, but this correlation does not establish predictive ability or causation.
Below are the average daily win rate (WR), theoretical break-even risk-to-reward ratio (R), and number of days (n) for each sentiment range. R is expressed as risk and excludes fees and slippage:
🤑 Extreme Greed (≥80): WR 40.5% • R=1:1.47 • n=25
😌 Greed (60–<80): WR 44.5% • R=1:1.25 • n=267
😐 Neutral (40–<60): WR 45.5% • R=1:1.20 • n=171
😰 Fear (20–<40): WR 47.1% • R=1:1.12 • n=273
😱 Extreme Fear (<20): WR 52.4% • R=1:0.91 • n=115
The percentage of days exceeding the overall average daily win rate of 46.49% in each sentiment range:
🤑 Extreme Greed: 8.0%
😌 Greed: 34.1%
😐 Neutral: 39.8%
😰 Fear: 55.7%
😱 Extreme Fear: 67.8%
➤ These statistics illustrate the relationship between win rate and the R required to break even.
📈 At higher FGI levels, historical win rates are lower, implying a higher theoretical break-even R. However, setting more distant profit targets may also change the win rate itself.
📉 At lower FGI levels, historical win rates are higher, implying a lower theoretical break-even R. This alone does not establish that reducing profit targets would accelerate capital turnover or improve performance.
#TradingStatistics $INIT $ETC $DOT
📊 TRADING PERFORMANCE & FEAR AND GREED INDEX (FGI) REPORT – UPDATED 31/10/2026
Across 851 days of data, the correlation between FGI and daily win rate stands at r ≈ -0.293, virtually unchanged from the 24/10/2026 update. The relationship remains negative and does not provide sufficient evidence to use FGI as a standalone entry signal.
Trading performance in the sample tends to be lower during periods of greed, particularly extreme greed. FGI may provide context for assessing risk, but this correlation does not establish predictive ability or causation.
Below are the average daily win rate (WR), theoretical break-even risk-to-reward ratio (R), and number of days (n) for each sentiment range. R is expressed as risk and excludes fees and slippage:
🤑 Extreme Greed (≥80): WR 40.5% • R=1:1.47 • n=25
😌 Greed (60–<80): WR 44.5% • R=1:1.25 • n=267
😐 Neutral (40–<60): WR 45.5% • R=1:1.20 • n=171
😰 Fear (20–<40): WR 47.1% • R=1:1.12 • n=273
😱 Extreme Fear (<20): WR 52.4% • R=1:0.91 • n=115
The percentage of days exceeding the overall average daily win rate of 46.49% in each sentiment range:
🤑 Extreme Greed: 8.0%
😌 Greed: 34.1%
😐 Neutral: 39.8%
😰 Fear: 55.7%
😱 Extreme Fear: 67.8%
➤ These statistics illustrate the relationship between win rate and the R required to break even.
📈 At higher FGI levels, historical win rates are lower, implying a higher theoretical break-even R. However, setting more distant profit targets may also change the win rate itself.
📉 At lower FGI levels, historical win rates are higher, implying a lower theoretical break-even R. This alone does not establish that reducing profit targets would accelerate capital turnover or improve performance.
#TradingStatistics $INIT $ETC $DOT
Across 851 days of data, the correlation between FGI and daily win rate stands at r ≈ -0.293, virtually unchanged from the 24/10/2026 update. The relationship remains negative and does not provide sufficient evidence to use FGI as a standalone entry signal.
Trading performance in the sample tends to be lower during periods of greed, particularly extreme greed. FGI may provide context for assessing risk, but this correlation does not establish predictive ability or causation.
Below are the average daily win rate (WR), theoretical break-even risk-to-reward ratio (R), and number of days (n) for each sentiment range. R is expressed as risk and excludes fees and slippage:
🤑 Extreme Greed (≥80): WR 40.5% • R=1:1.47 • n=25
😌 Greed (60–<80): WR 44.5% • R=1:1.25 • n=267
😐 Neutral (40–<60): WR 45.5% • R=1:1.20 • n=171
😰 Fear (20–<40): WR 47.1% • R=1:1.12 • n=273
😱 Extreme Fear (<20): WR 52.4% • R=1:0.91 • n=115
The percentage of days exceeding the overall average daily win rate of 46.49% in each sentiment range:
🤑 Extreme Greed: 8.0%
😌 Greed: 34.1%
😐 Neutral: 39.8%
😰 Fear: 55.7%
😱 Extreme Fear: 67.8%
➤ These statistics illustrate the relationship between win rate and the R required to break even.
📈 At higher FGI levels, historical win rates are lower, implying a higher theoretical break-even R. However, setting more distant profit targets may also change the win rate itself.
📉 At lower FGI levels, historical win rates are higher, implying a lower theoretical break-even R. This alone does not establish that reducing profit targets would accelerate capital turnover or improve performance.
#TradingStatistics $INIT $ETC $DOT
103
·
--
Bullish
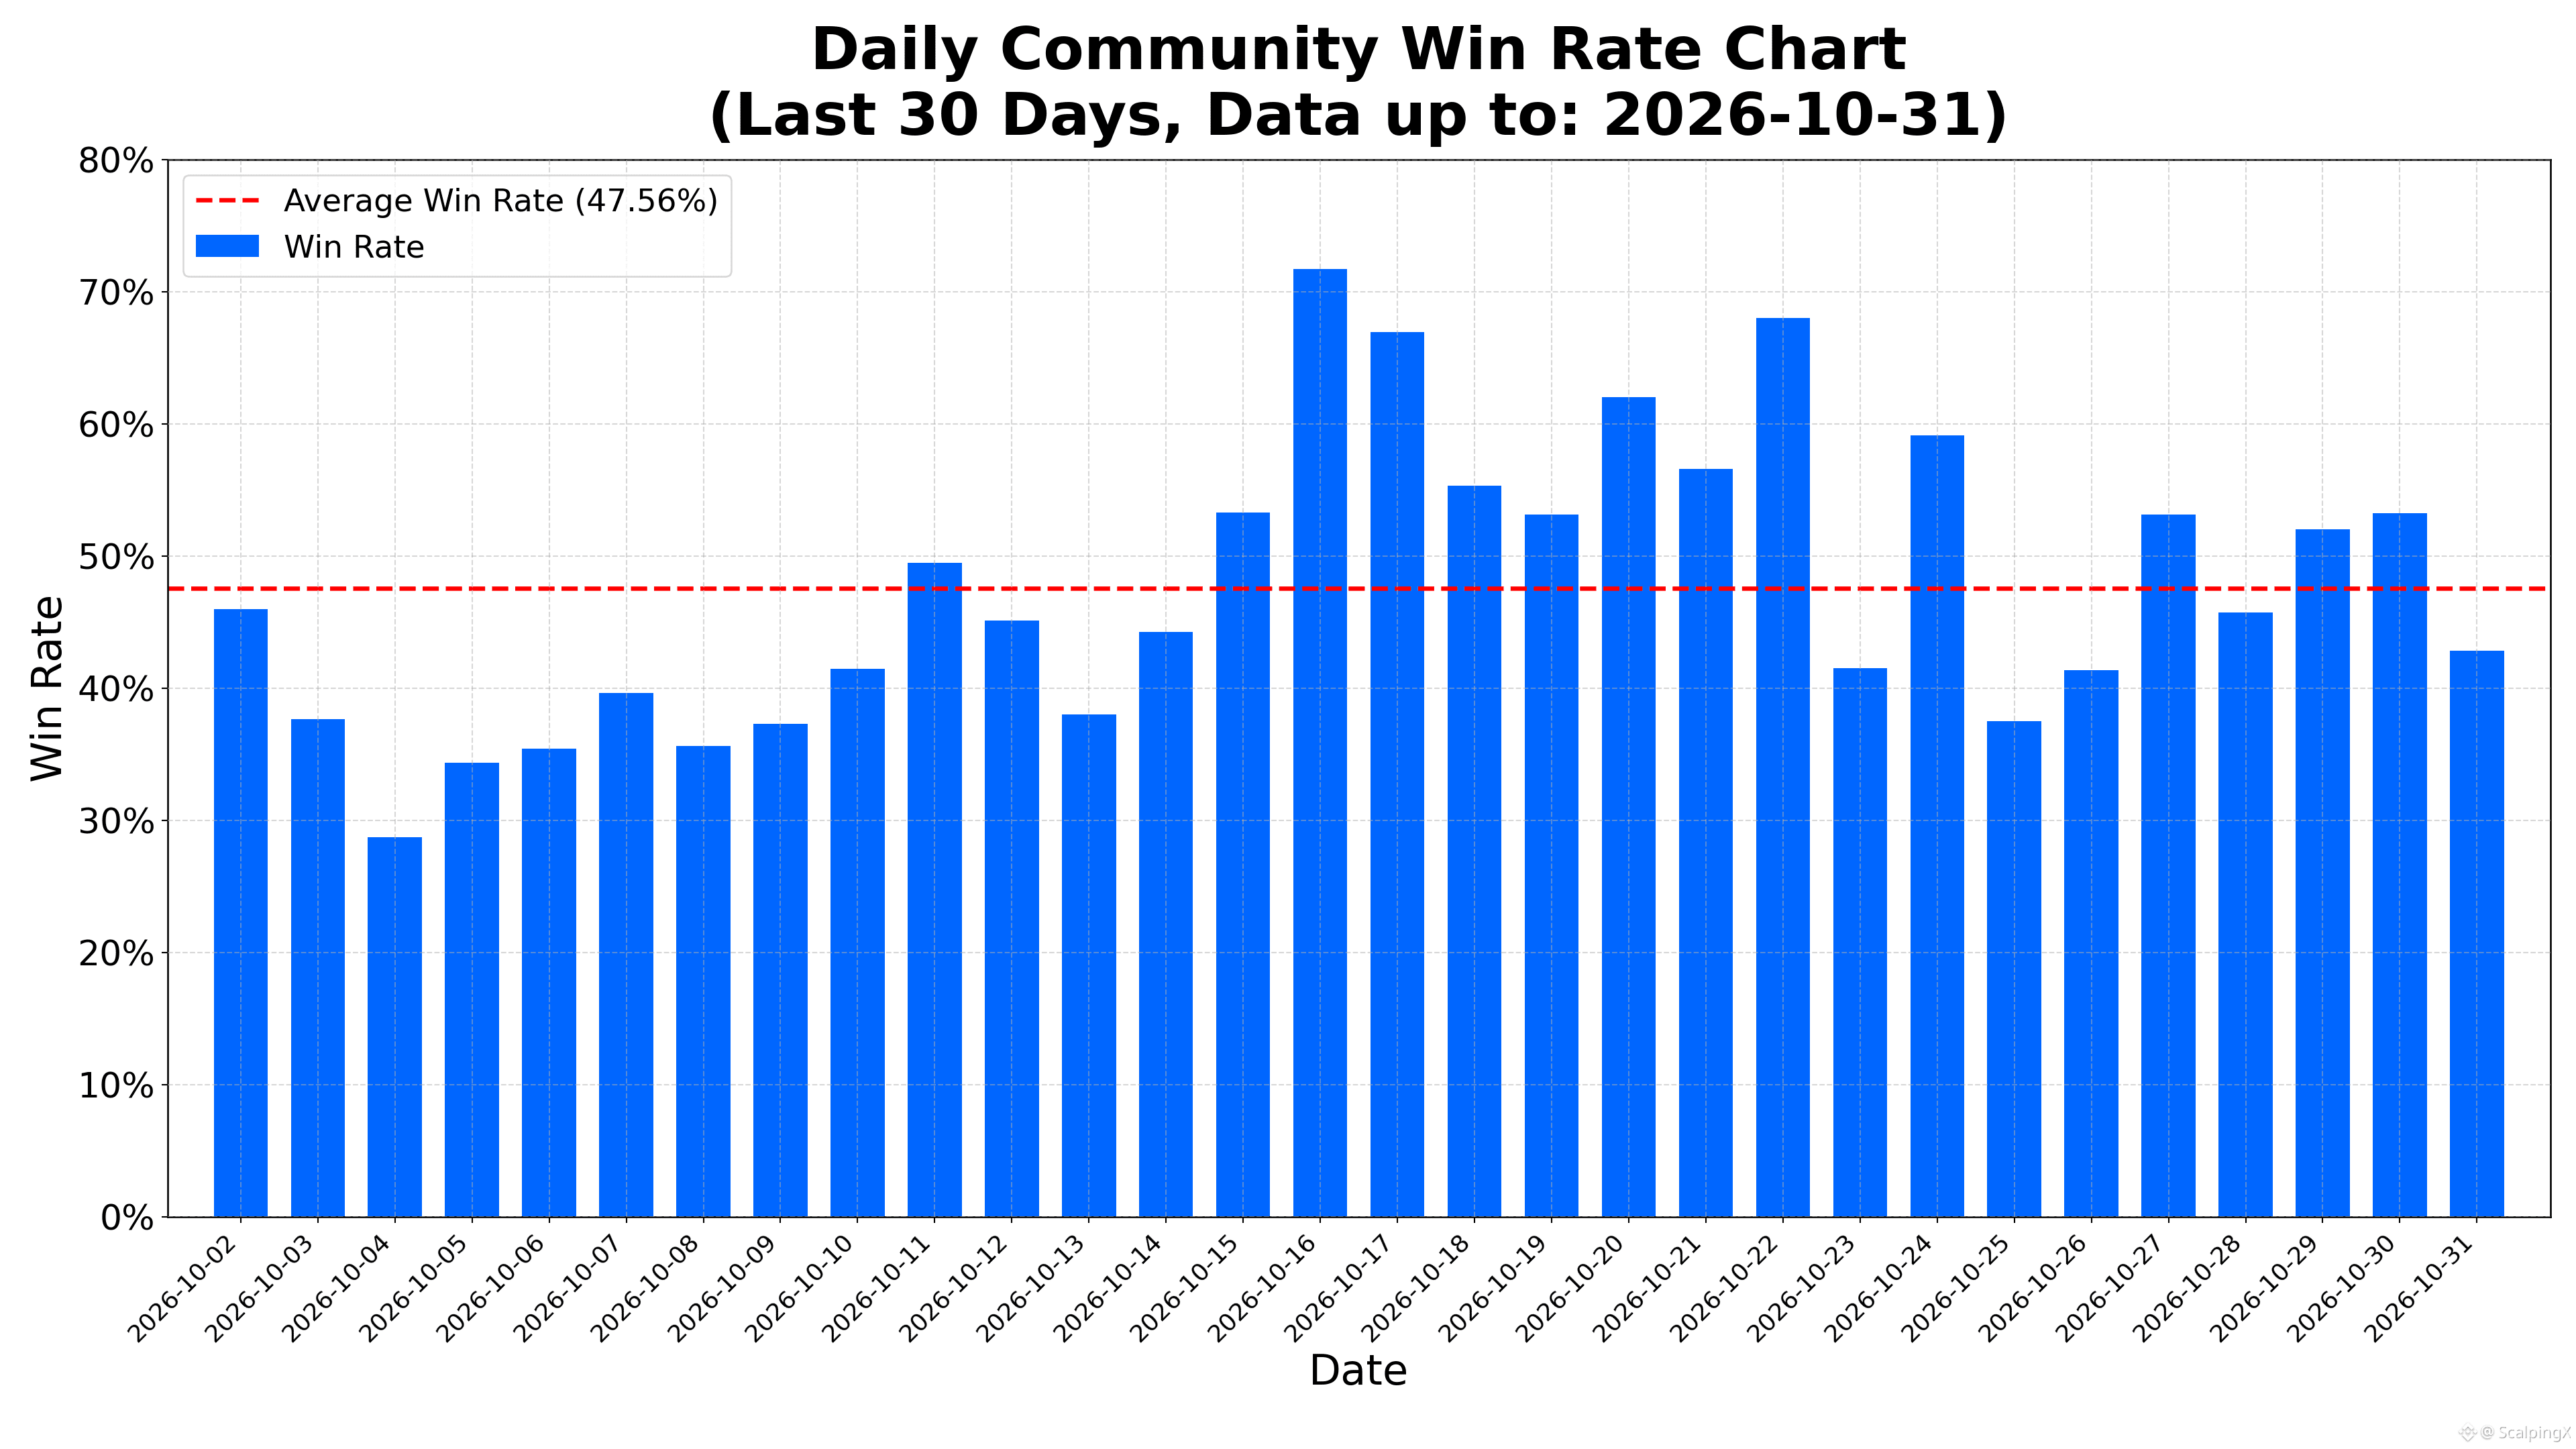
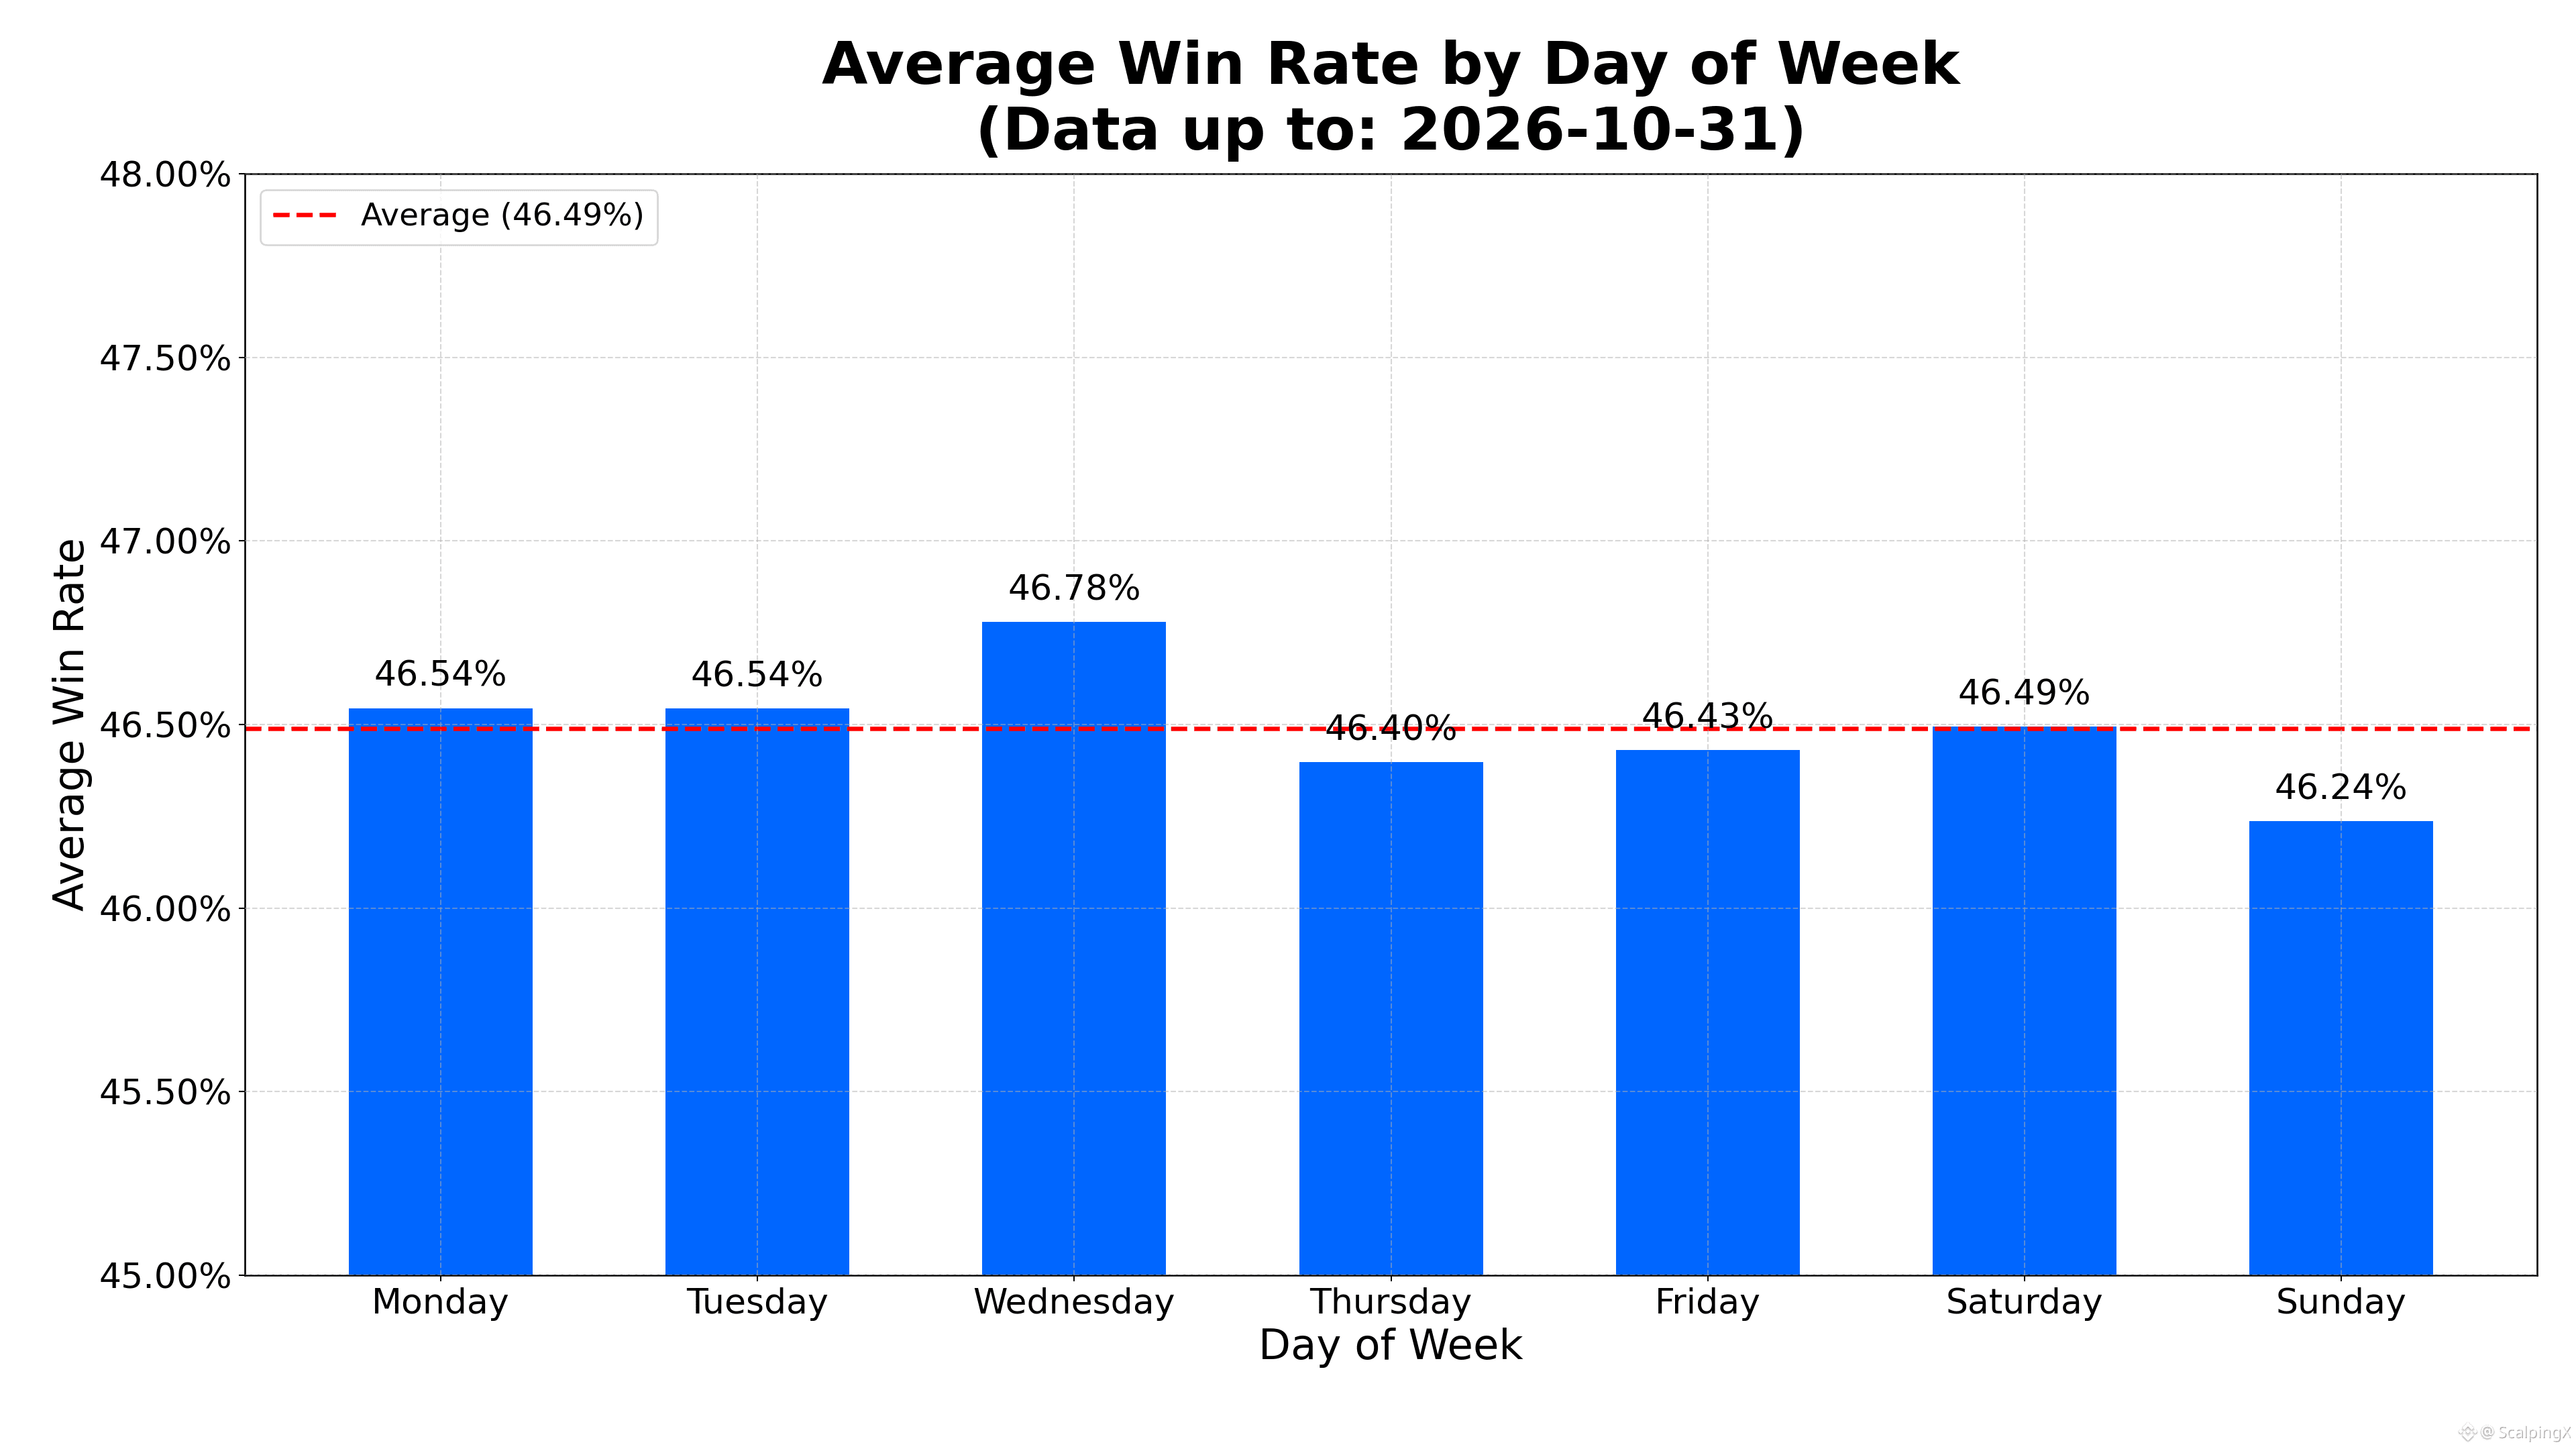
Updated 2026-10-31, community-wide trading
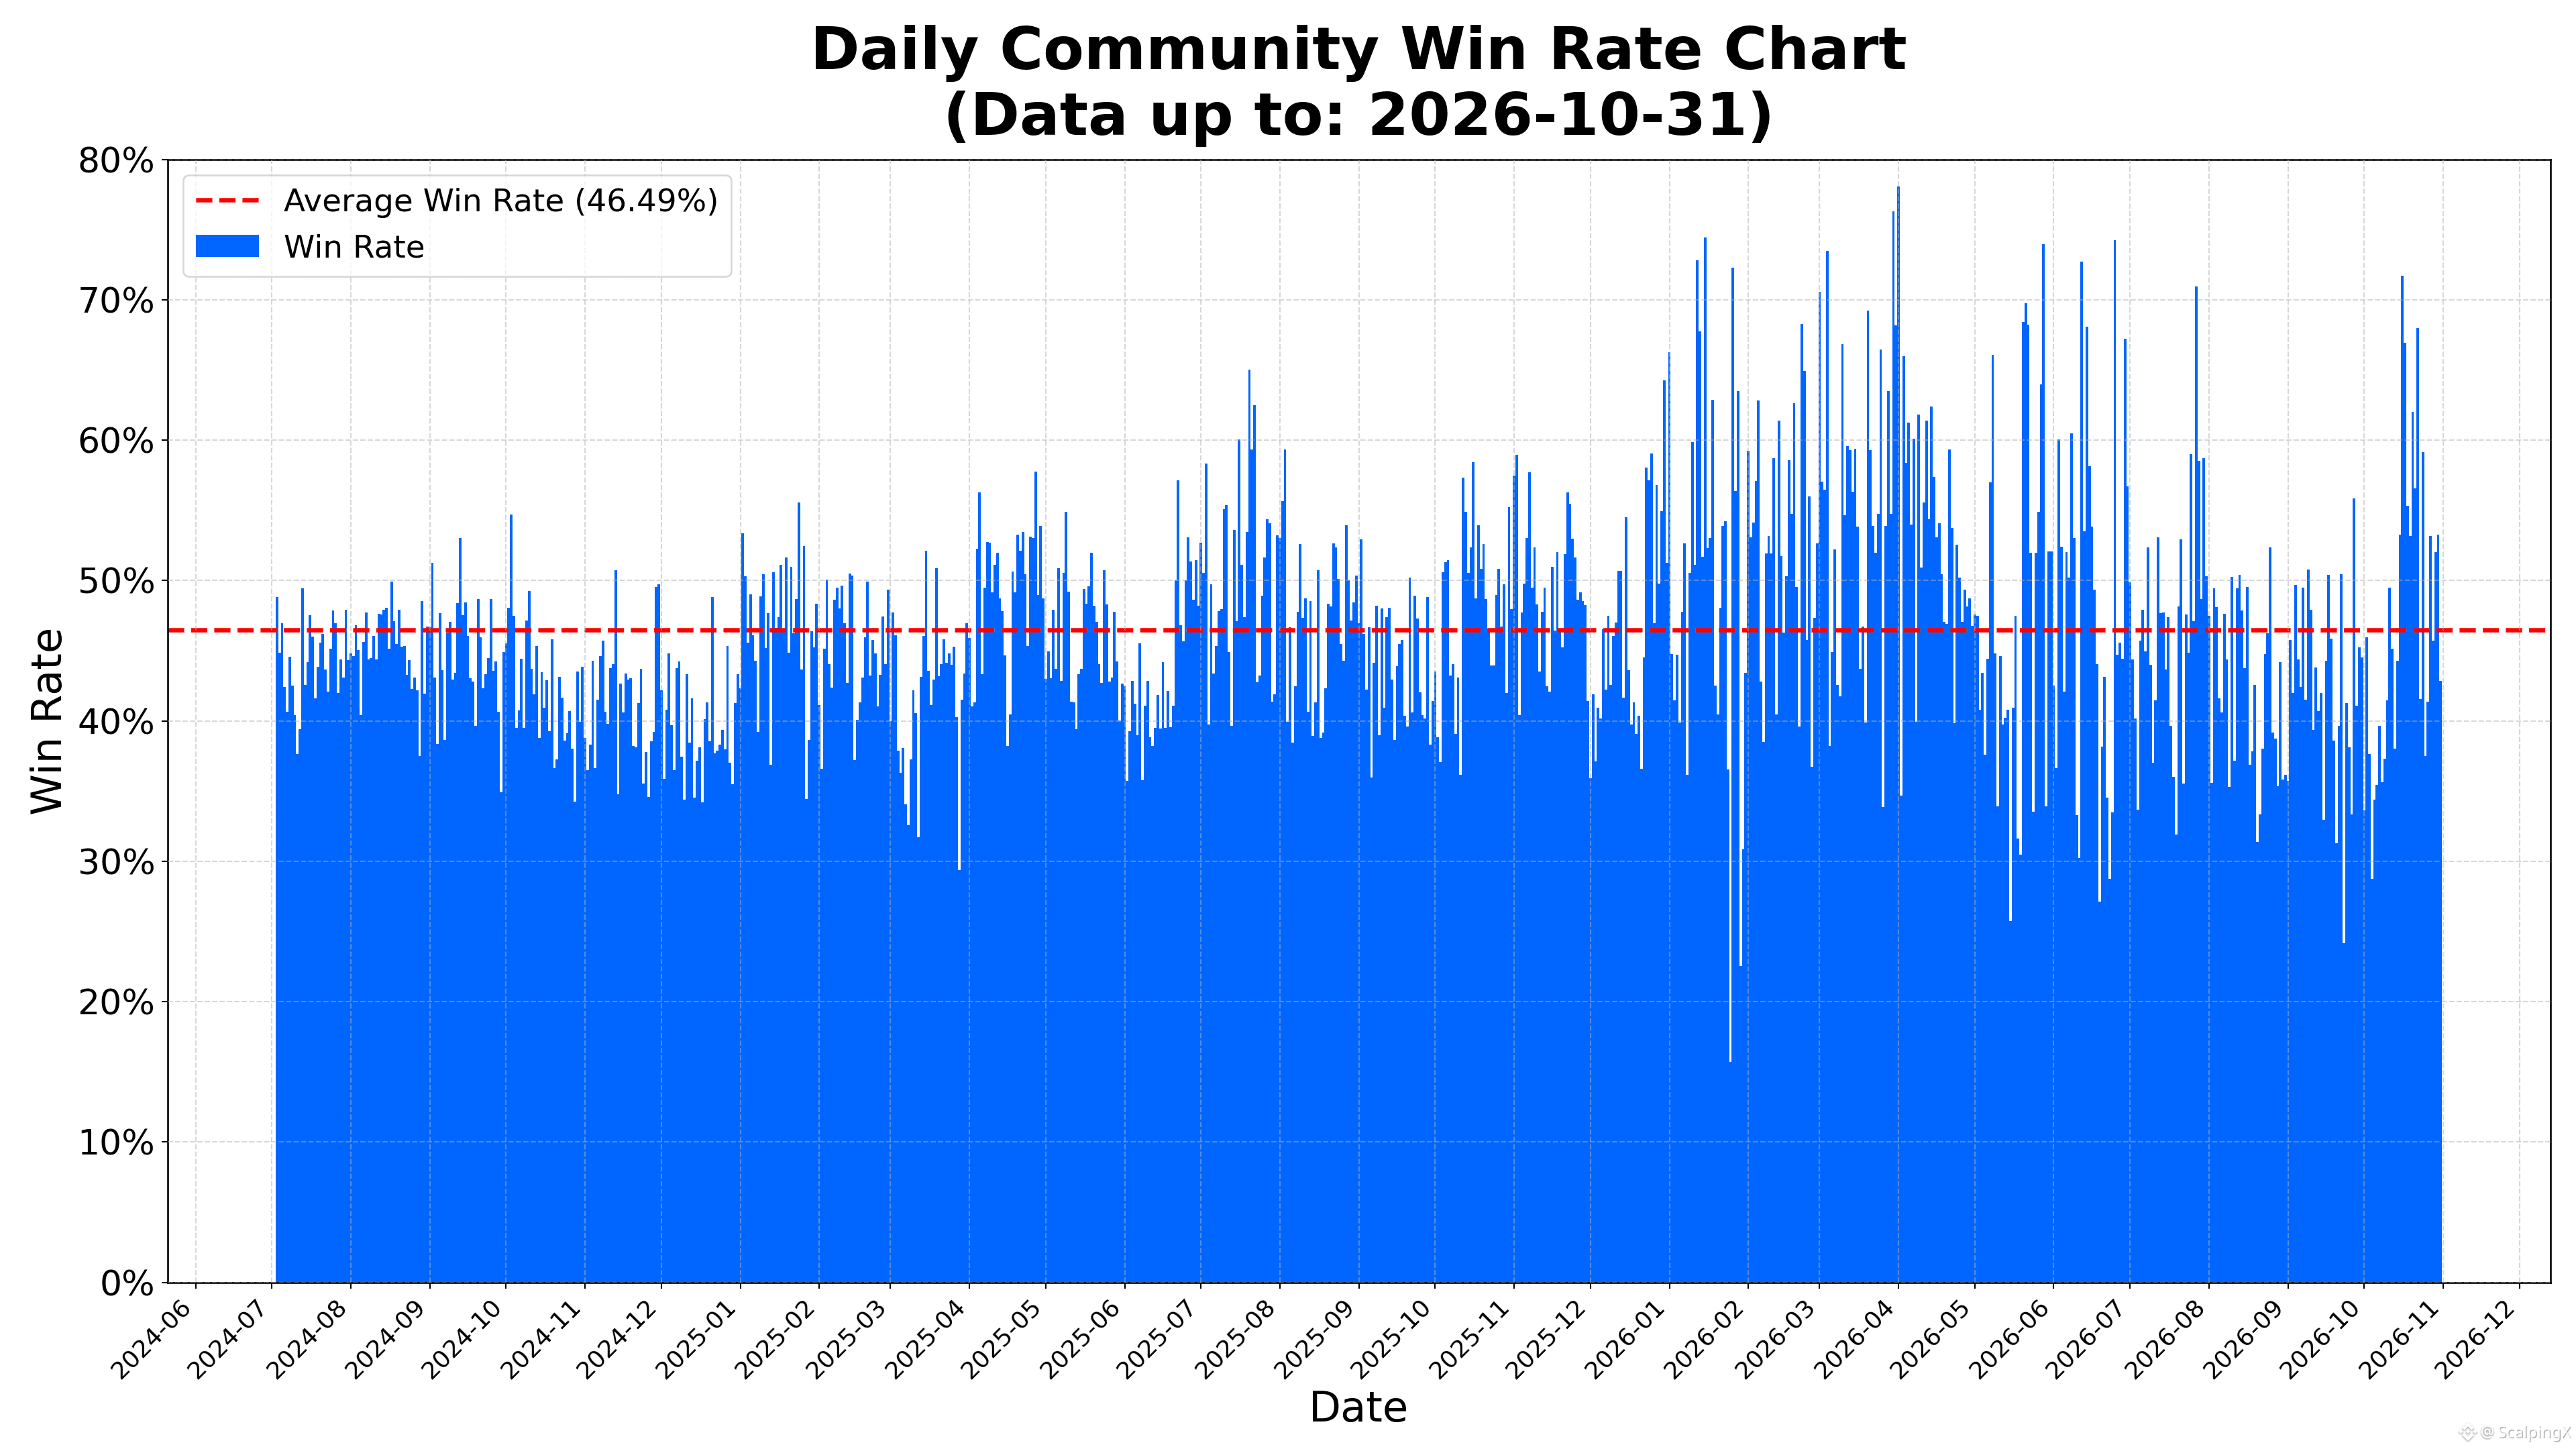
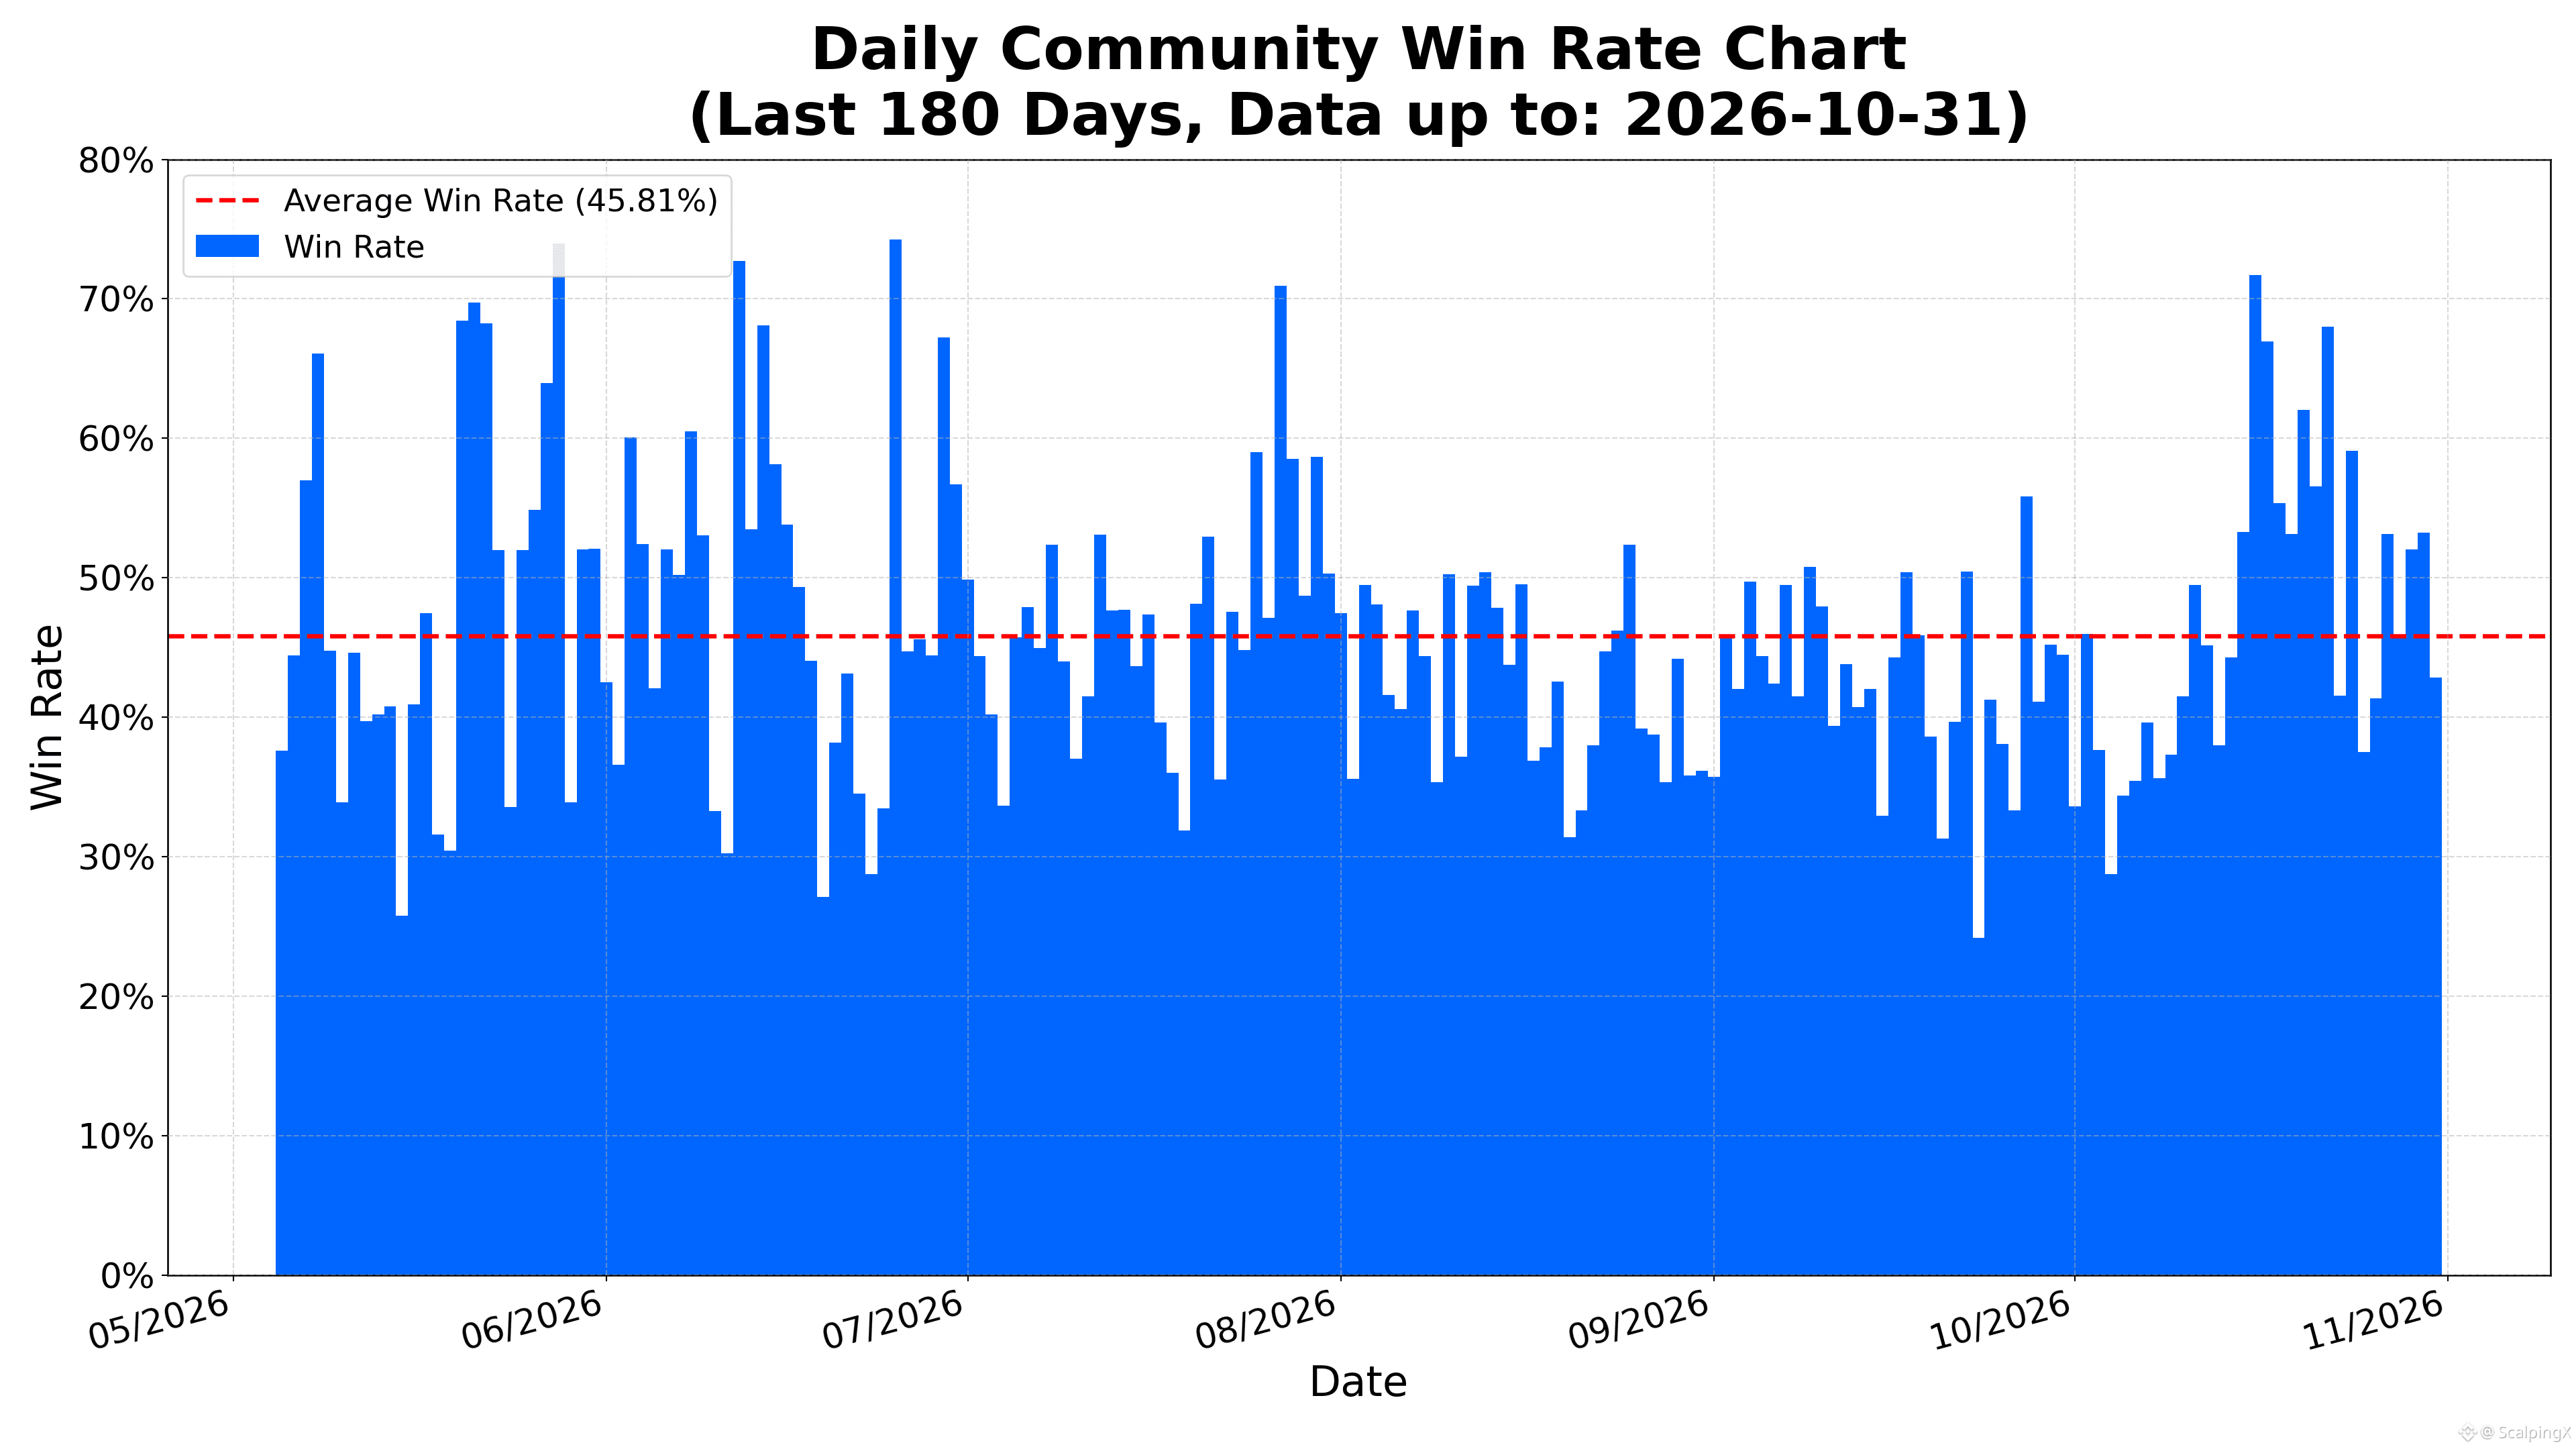
📊 The average daily win rate is 46.49%.
🏆 The highest daily win rate was 78.08% on 2026-04-01. The lowest was 15.69% on 2026-01-25.
📅 Wednesday has the highest average win rate at 46.78%. Sunday has the lowest at 46.24%.
⏱️ The 7-day period with the highest average daily win rate ended on 2026-04-05 at 63.27%. The lowest ended on 2026-10-09 at 35.54%.
⚖️ There were 391 days with a win rate above the overall daily average and 460 days at or below it.
📈 There were 237 days with a win rate above 50%, 448 days between 40% and 50% inclusive, and 166 days below 40%.
#TradingStatistics $BTC $SOL $LTC
Updated 2026-10-31, community-wide trading
📊 The average daily win rate is 46.49%.
🏆 The highest daily win rate was 78.08% on 2026-04-01. The lowest was 15.69% on 2026-01-25.
📅 Wednesday has the highest average win rate at 46.78%. Sunday has the lowest at 46.24%.
⏱️ The 7-day period with the highest average daily win rate ended on 2026-04-05 at 63.27%. The lowest ended on 2026-10-09 at 35.54%.
⚖️ There were 391 days with a win rate above the overall daily average and 460 days at or below it.
📈 There were 237 days with a win rate above 50%, 448 days between 40% and 50% inclusive, and 166 days below 40%.
#TradingStatistics $BTC $SOL $LTC
📊 The average daily win rate is 46.49%.
🏆 The highest daily win rate was 78.08% on 2026-04-01. The lowest was 15.69% on 2026-01-25.
📅 Wednesday has the highest average win rate at 46.78%. Sunday has the lowest at 46.24%.
⏱️ The 7-day period with the highest average daily win rate ended on 2026-04-05 at 63.27%. The lowest ended on 2026-10-09 at 35.54%.
⚖️ There were 391 days with a win rate above the overall daily average and 460 days at or below it.
📈 There were 237 days with a win rate above 50%, 448 days between 40% and 50% inclusive, and 166 days below 40%.
#TradingStatistics $BTC $SOL $LTC
122

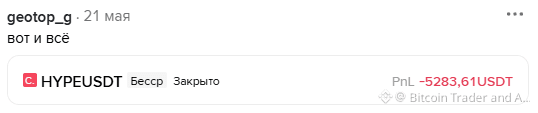
That's it!
📊 Recently, I came across some interesting trading stats that I want to share with you:
- Traders with less than 1 year of experience have a deposit loss risk of about 95-97%
- About 80% of traders throw in the towel after 2 years
- After 5 years, only about 5-7% of the original traders are still actively trading
- Approximately 97% of traders who have been trading for over 300 days are in the red, with only 1-3% consistently profitable in the long term
- The chances of losing a significant portion of your deposit over 5 years are around 90%
This is why trading is considered one of the toughest ways to earn money!
✅ But there’s a silver lining! Those who survive and become profitable (after 5 years) often say it’s one of the best ways to earn: freedom, flexible hours, and high income potential. The key is not to chase quick cash!
💲 For newbies, I recommend trading only $BTC !
#TradingStatistics
{spot}(BTCUSDT)
{future}(BTCUSDT)
That's it!
📊 Recently, I came across some interesting trading stats that I want to share with you:
- Traders with less than 1 year of experience have a deposit loss risk of about 95-97%
- About 80% of traders throw in the towel after 2 years
- After 5 years, only about 5-7% of the original traders are still actively trading
- Approximately 97% of traders who have been trading for over 300 days are in the red, with only 1-3% consistently profitable in the long term
- The chances of losing a significant portion of your deposit over 5 years are around 90%
This is why trading is considered one of the toughest ways to earn money!
✅ But there’s a silver lining! Those who survive and become profitable (after 5 years) often say it’s one of the best ways to earn: freedom, flexible hours, and high income potential. The key is not to chase quick cash!
💲 For newbies, I recommend trading only $BTC !
#TradingStatistics
📊 Recently, I came across some interesting trading stats that I want to share with you:
- Traders with less than 1 year of experience have a deposit loss risk of about 95-97%
- About 80% of traders throw in the towel after 2 years
- After 5 years, only about 5-7% of the original traders are still actively trading
- Approximately 97% of traders who have been trading for over 300 days are in the red, with only 1-3% consistently profitable in the long term
- The chances of losing a significant portion of your deposit over 5 years are around 90%
This is why trading is considered one of the toughest ways to earn money!
✅ But there’s a silver lining! Those who survive and become profitable (after 5 years) often say it’s one of the best ways to earn: freedom, flexible hours, and high income potential. The key is not to chase quick cash!
💲 For newbies, I recommend trading only $BTC !
#TradingStatistics
3
9
5.2k
·
--
Bullish
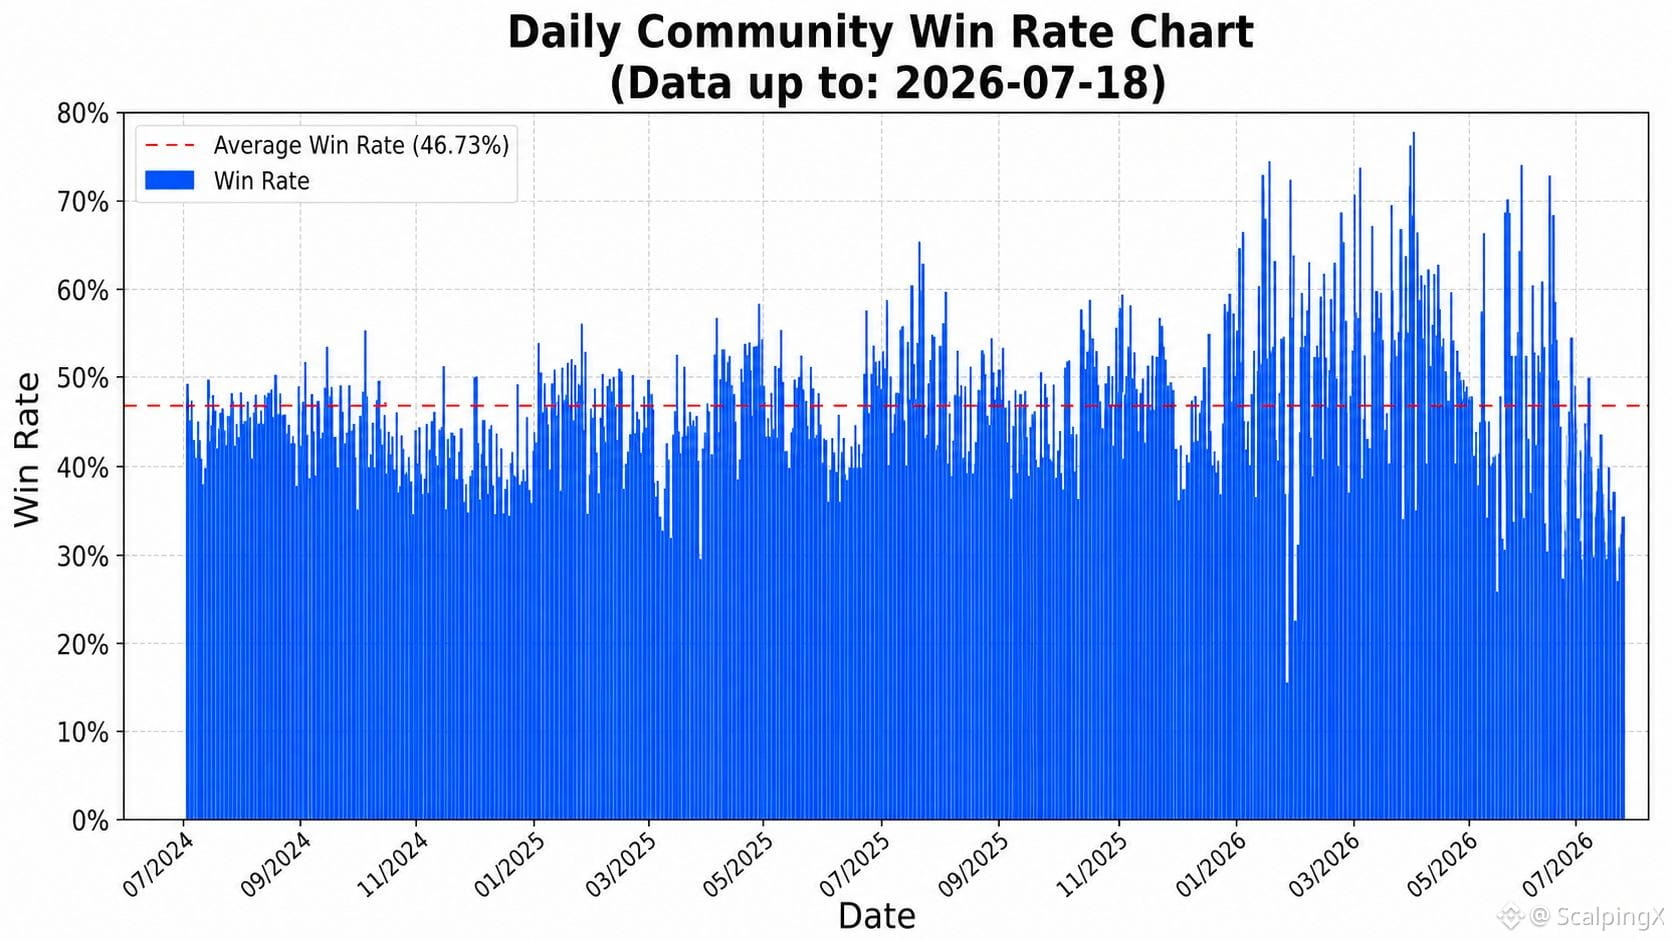
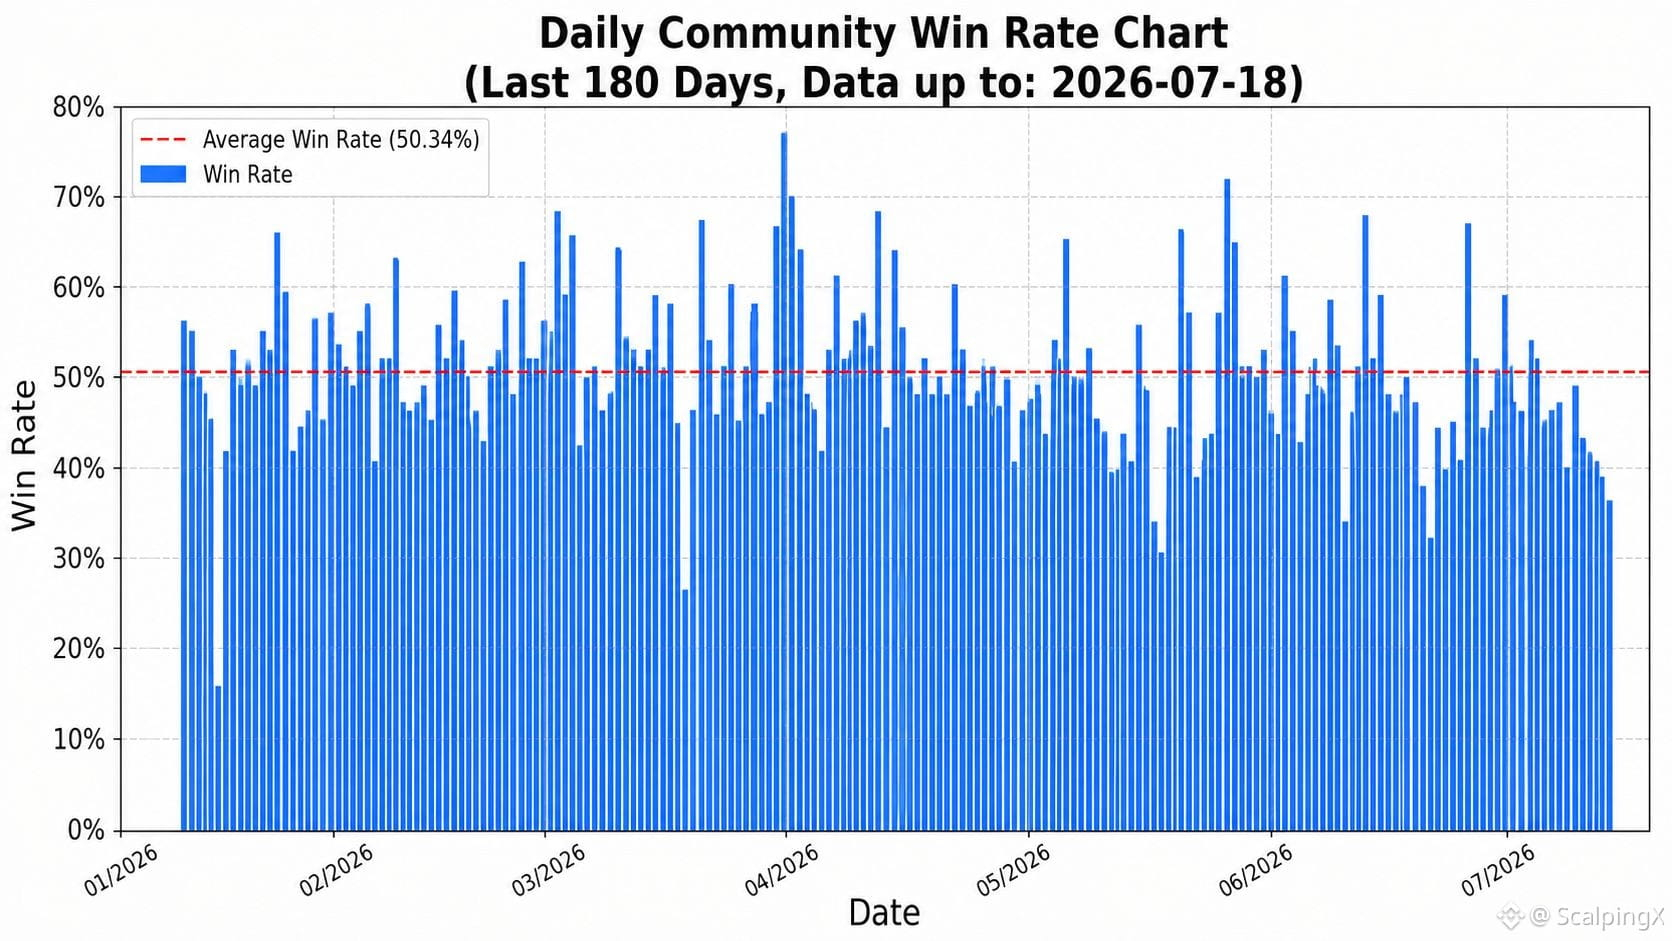
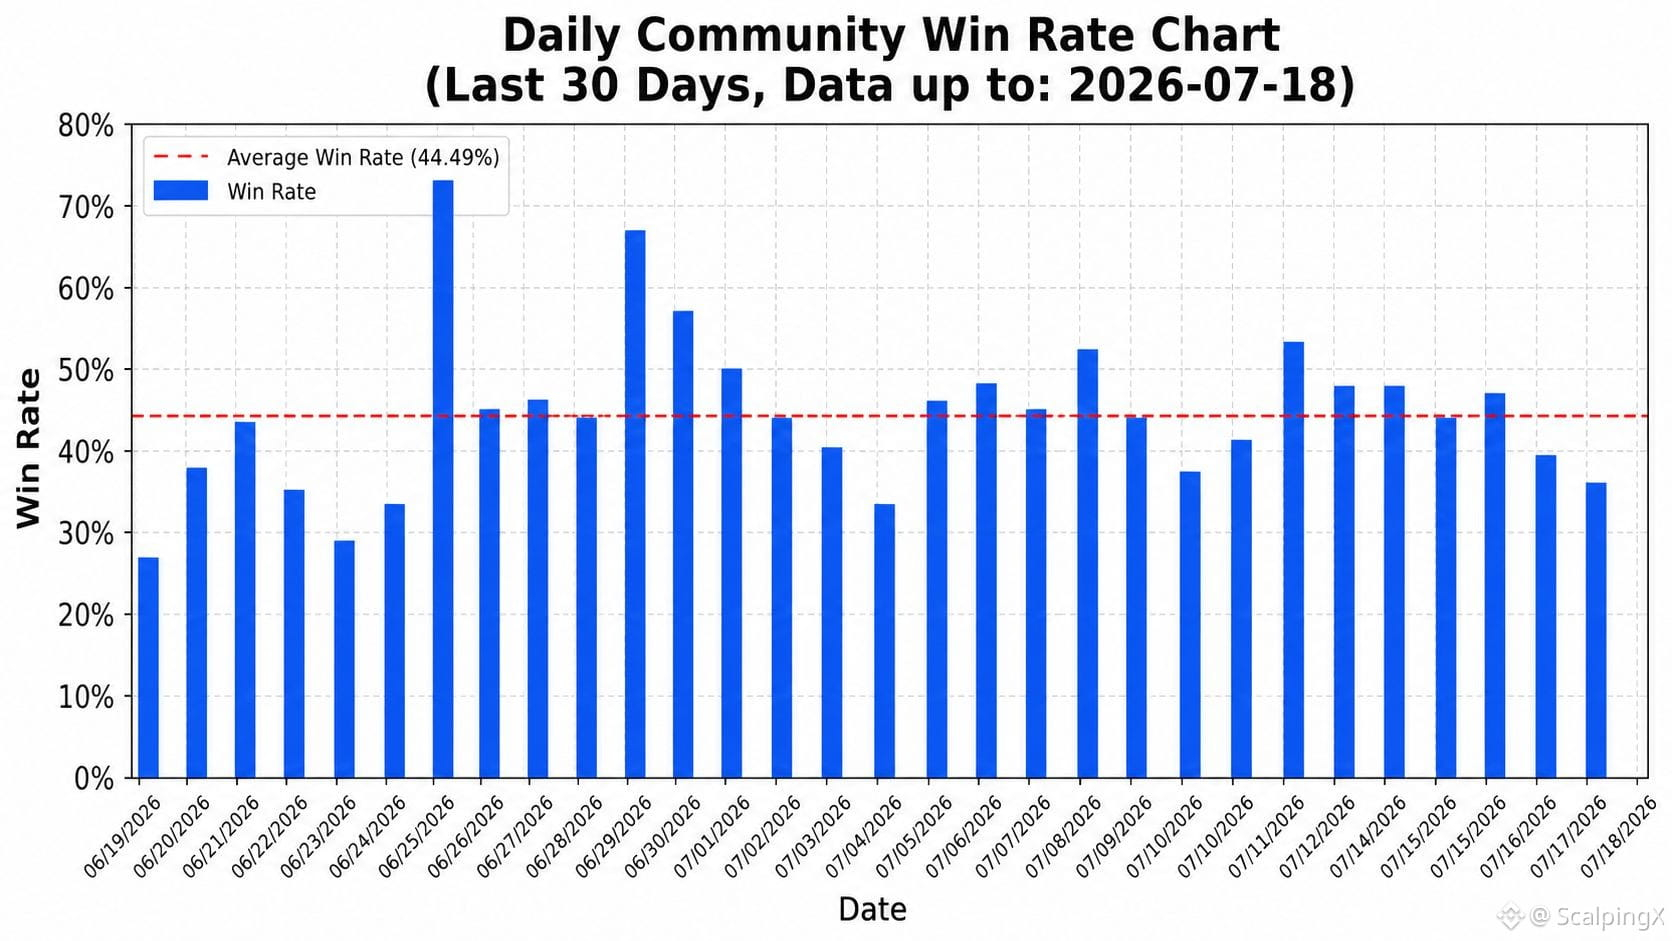
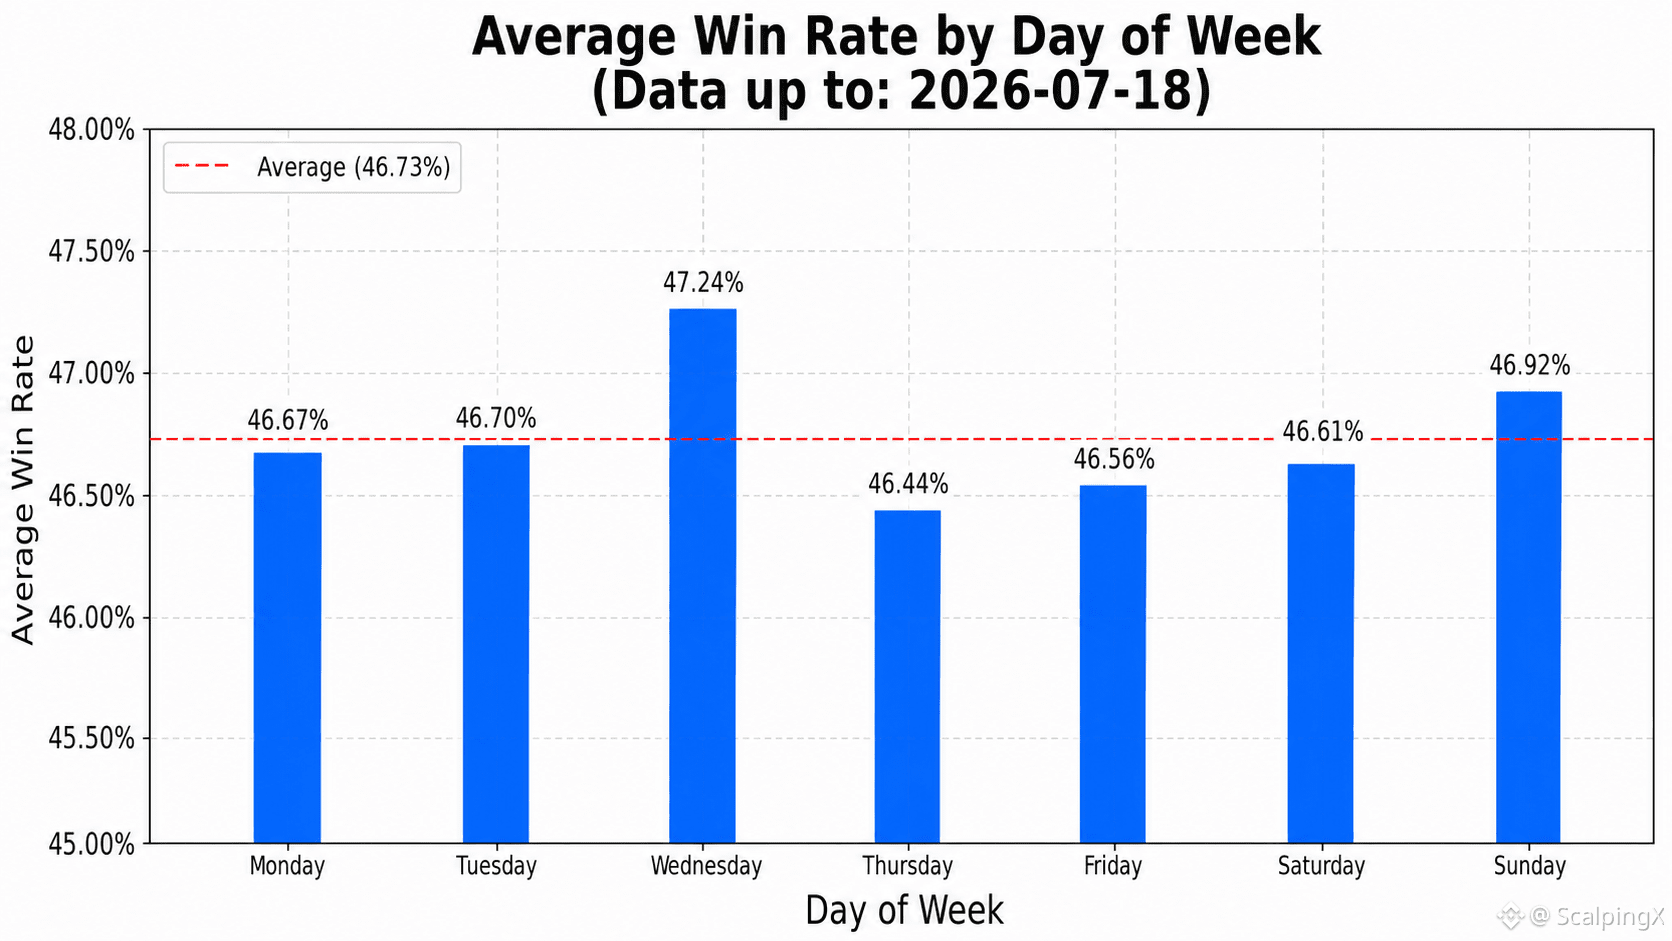
Updated as of 2026-07-18, based on community-wide trading
📊 The average win rate is 46.73%
🏆 The highest daily win rate was 78.08% on 2026-04-01. The lowest daily win rate was 15.69% on 2026-01-25
📅 Wednesday has the highest average win rate at 47.24%, while Thursday has the lowest at 46.44%
⏱️ The strongest 7-day period ended on 2026-04-05, with an average win rate of 63.27%. The weakest period ended on 2026-06-24, with an average of 35.60%
⚖️ There were 342 days with a win rate above the overall average and 404 days with a win rate at or below the average
📈 There were 212 days with a win rate above 50%, 402 days between 40% and 50%, and 132 days below 40%
#TradingStatistics $BTC $ETH $BNB
Updated as of 2026-07-18, based on community-wide trading
📊 The average win rate is 46.73%
🏆 The highest daily win rate was 78.08% on 2026-04-01. The lowest daily win rate was 15.69% on 2026-01-25
📅 Wednesday has the highest average win rate at 47.24%, while Thursday has the lowest at 46.44%
⏱️ The strongest 7-day period ended on 2026-04-05, with an average win rate of 63.27%. The weakest period ended on 2026-06-24, with an average of 35.60%
⚖️ There were 342 days with a win rate above the overall average and 404 days with a win rate at or below the average
📈 There were 212 days with a win rate above 50%, 402 days between 40% and 50%, and 132 days below 40%
#TradingStatistics $BTC $ETH $BNB
📊 The average win rate is 46.73%
🏆 The highest daily win rate was 78.08% on 2026-04-01. The lowest daily win rate was 15.69% on 2026-01-25
📅 Wednesday has the highest average win rate at 47.24%, while Thursday has the lowest at 46.44%
⏱️ The strongest 7-day period ended on 2026-04-05, with an average win rate of 63.27%. The weakest period ended on 2026-06-24, with an average of 35.60%
⚖️ There were 342 days with a win rate above the overall average and 404 days with a win rate at or below the average
📈 There were 212 days with a win rate above 50%, 402 days between 40% and 50%, and 132 days below 40%
#TradingStatistics $BTC $ETH $BNB
33
·
--
Bullish
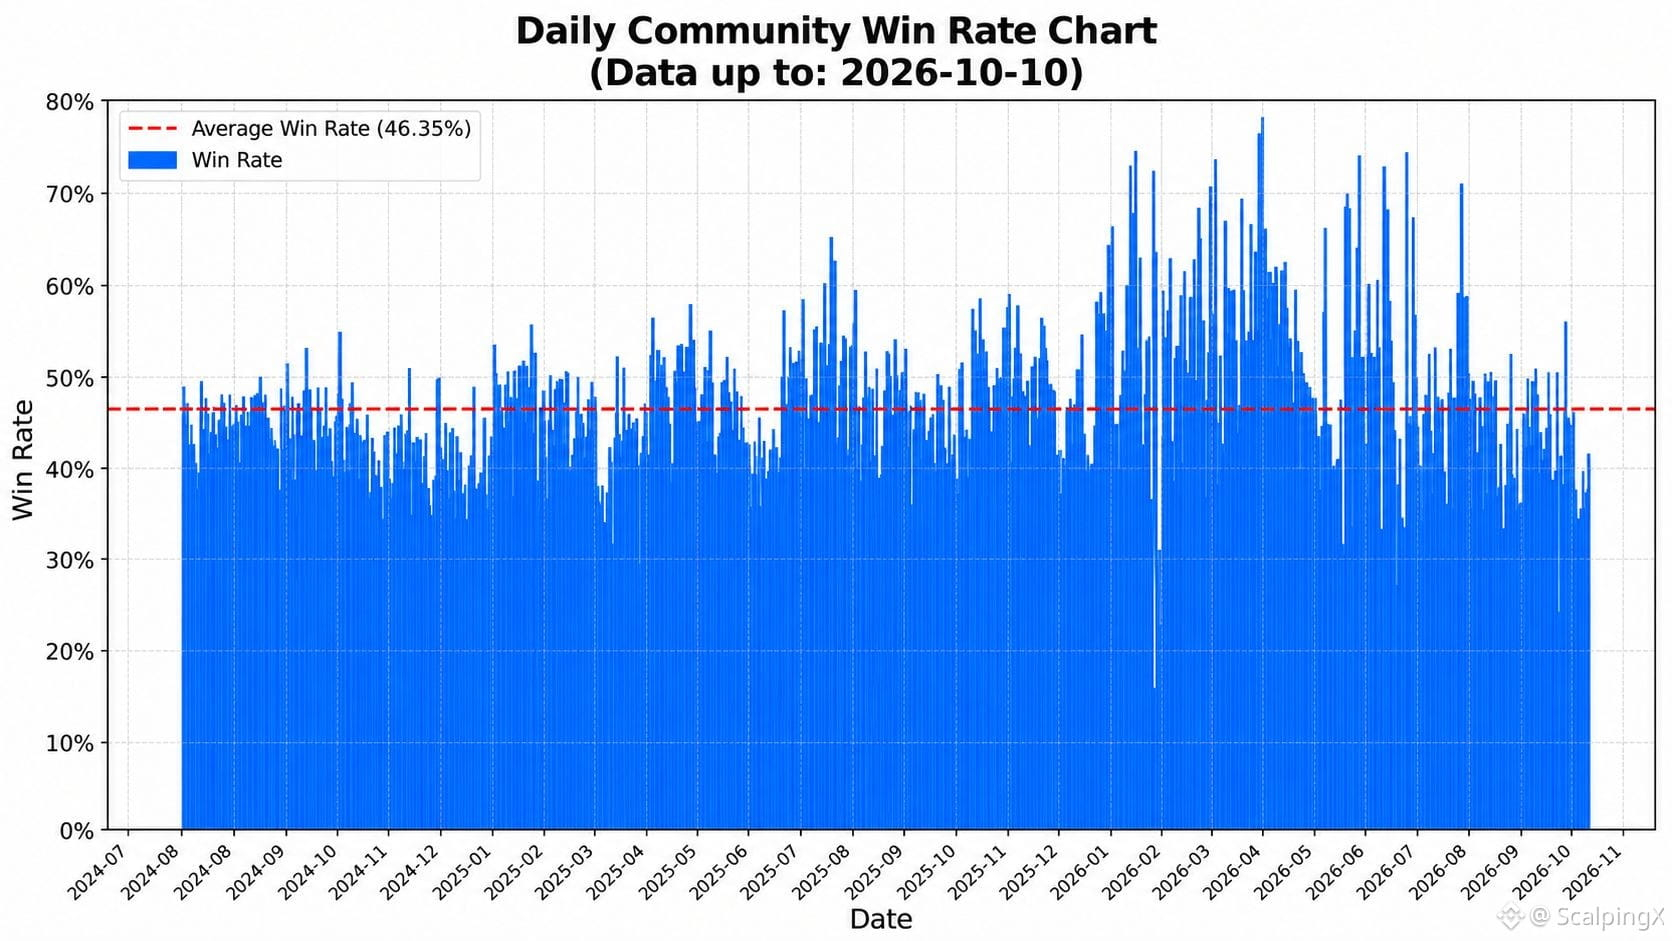
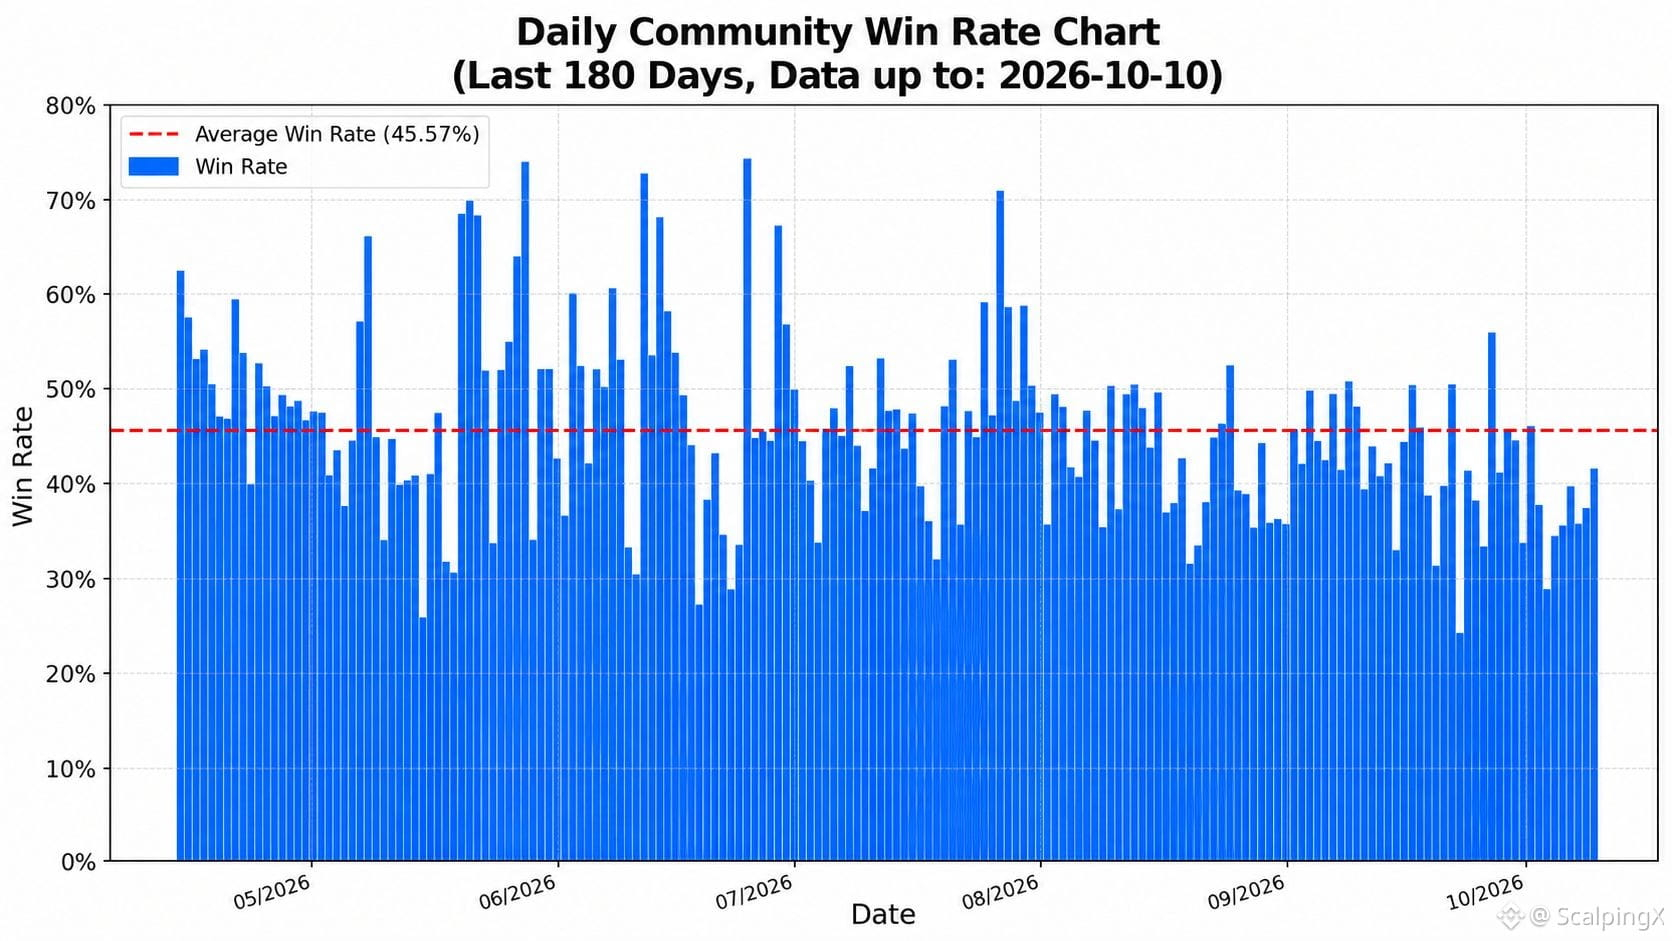
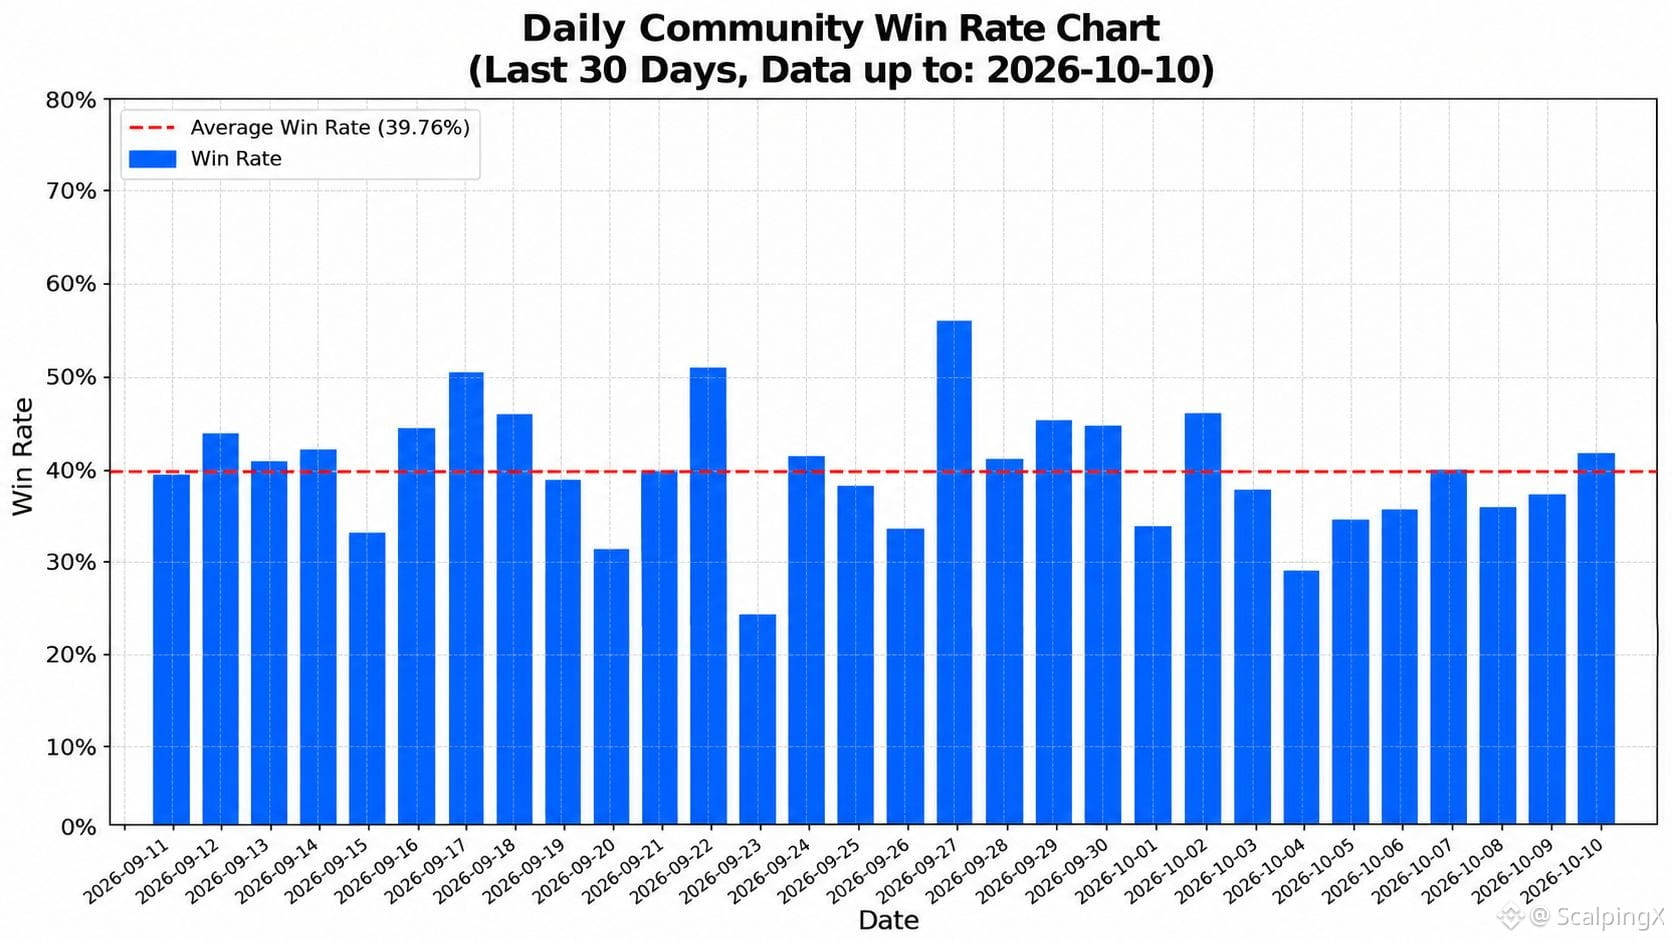
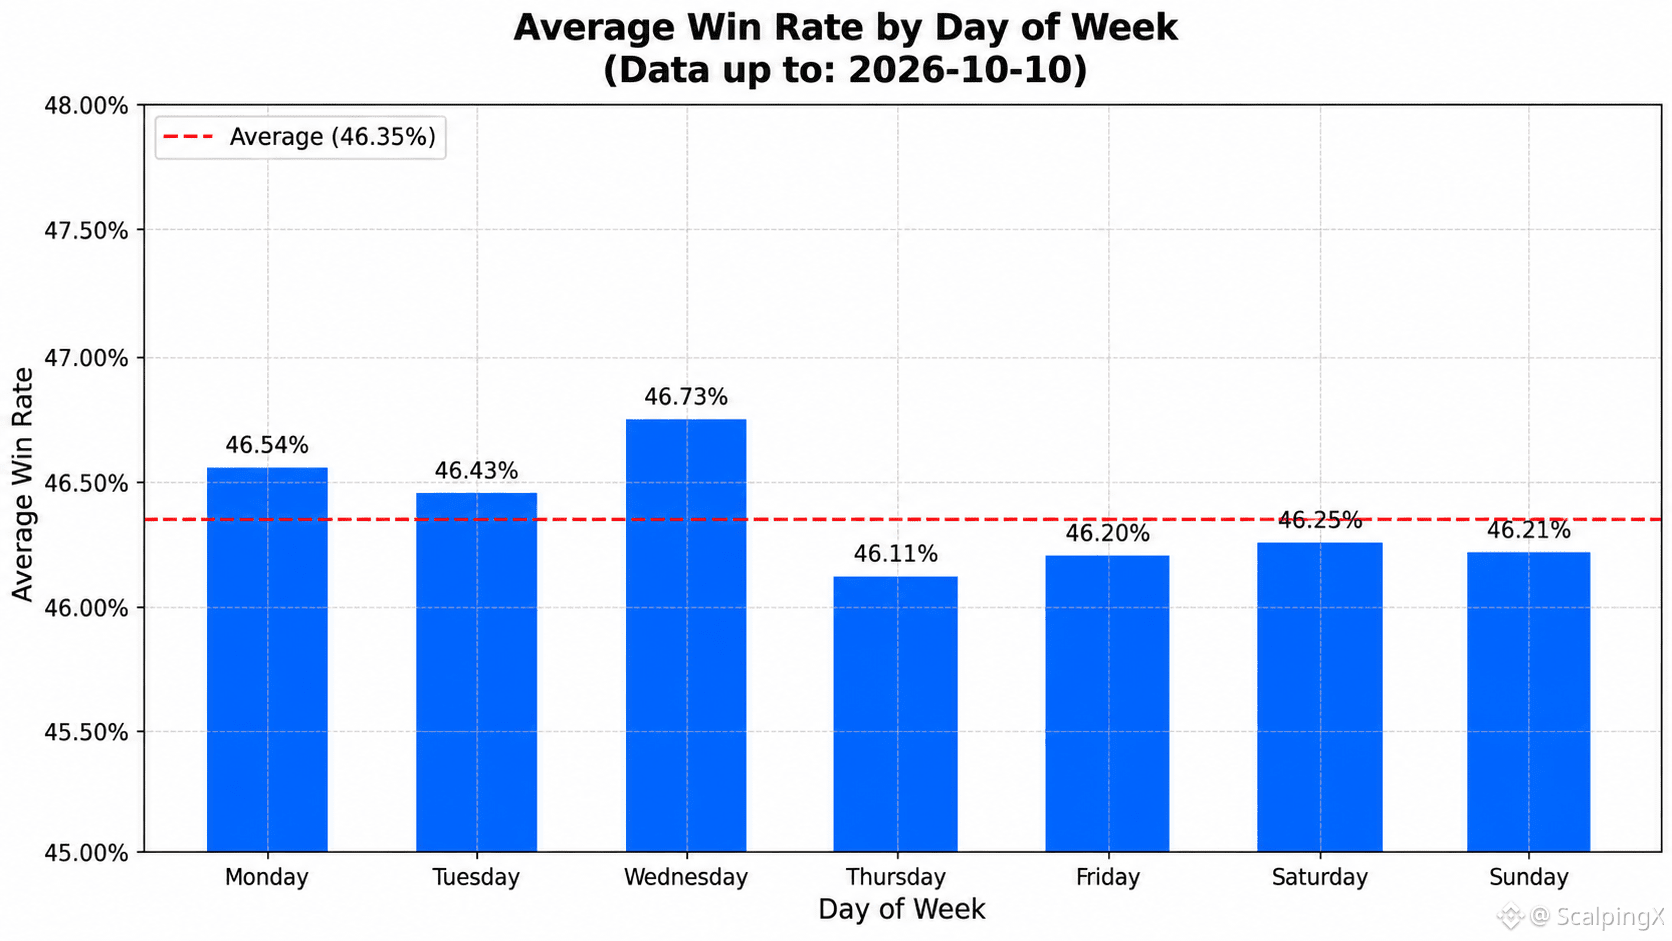
Community-Wide Trading Statistics – Updated October 10, 2026
📊 The average win rate is 46.35%.
🏆 The highest daily win rate was 78.08% on 2026-04-01, while the lowest was 15.69% on 2026-01-25.
📅 Wednesday had the highest average win rate at 46.73%, while Thursday had the lowest at 46.11%.
⏱️ The highest 7-day average win rate was 63.27%, for the period ending 2026-04-05. The lowest was 35.54%, for the period ending 2026-10-09.
⚖️ A total of 381 days recorded win rates above the overall average, while 449 days were at or below the average.
📈 There were 225 days with win rates above 50%, 441 days between 40% and 50%, and 164 days below 40%.
#TradingStatistics $ICP
Community-Wide Trading Statistics – Updated October 10, 2026
📊 The average win rate is 46.35%.
🏆 The highest daily win rate was 78.08% on 2026-04-01, while the lowest was 15.69% on 2026-01-25.
📅 Wednesday had the highest average win rate at 46.73%, while Thursday had the lowest at 46.11%.
⏱️ The highest 7-day average win rate was 63.27%, for the period ending 2026-04-05. The lowest was 35.54%, for the period ending 2026-10-09.
⚖️ A total of 381 days recorded win rates above the overall average, while 449 days were at or below the average.
📈 There were 225 days with win rates above 50%, 441 days between 40% and 50%, and 164 days below 40%.
#TradingStatistics $ICP
📊 The average win rate is 46.35%.
🏆 The highest daily win rate was 78.08% on 2026-04-01, while the lowest was 15.69% on 2026-01-25.
📅 Wednesday had the highest average win rate at 46.73%, while Thursday had the lowest at 46.11%.
⏱️ The highest 7-day average win rate was 63.27%, for the period ending 2026-04-05. The lowest was 35.54%, for the period ending 2026-10-09.
⚖️ A total of 381 days recorded win rates above the overall average, while 449 days were at or below the average.
📈 There were 225 days with win rates above 50%, 441 days between 40% and 50%, and 164 days below 40%.
#TradingStatistics $ICP
54
·
--
Bullish
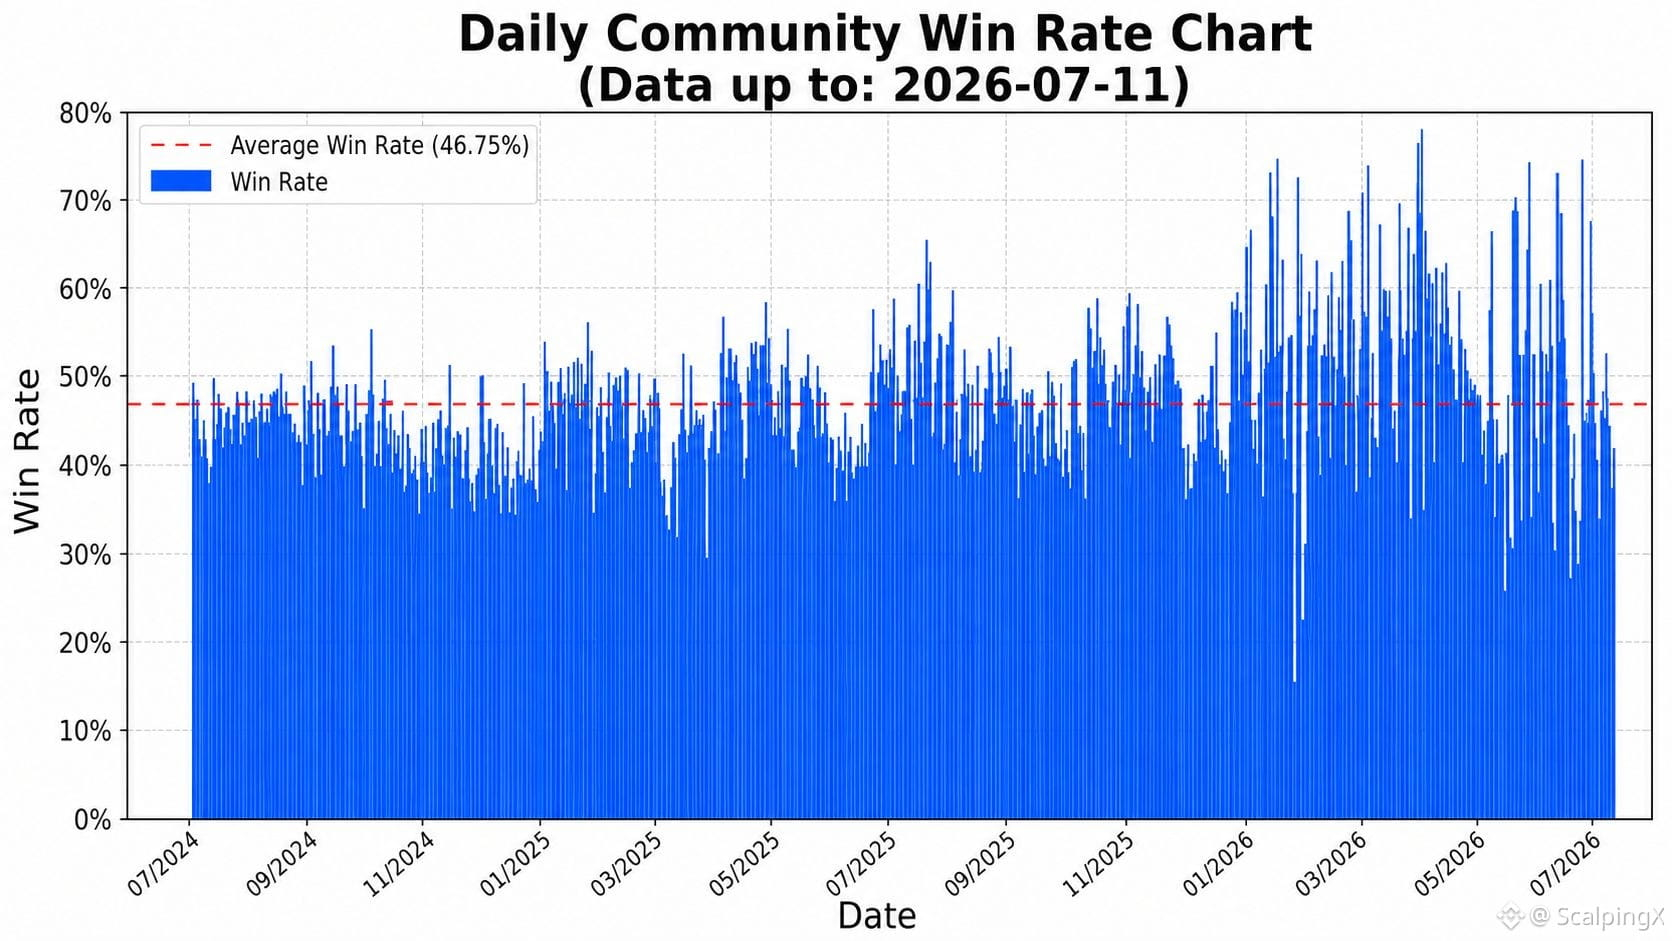
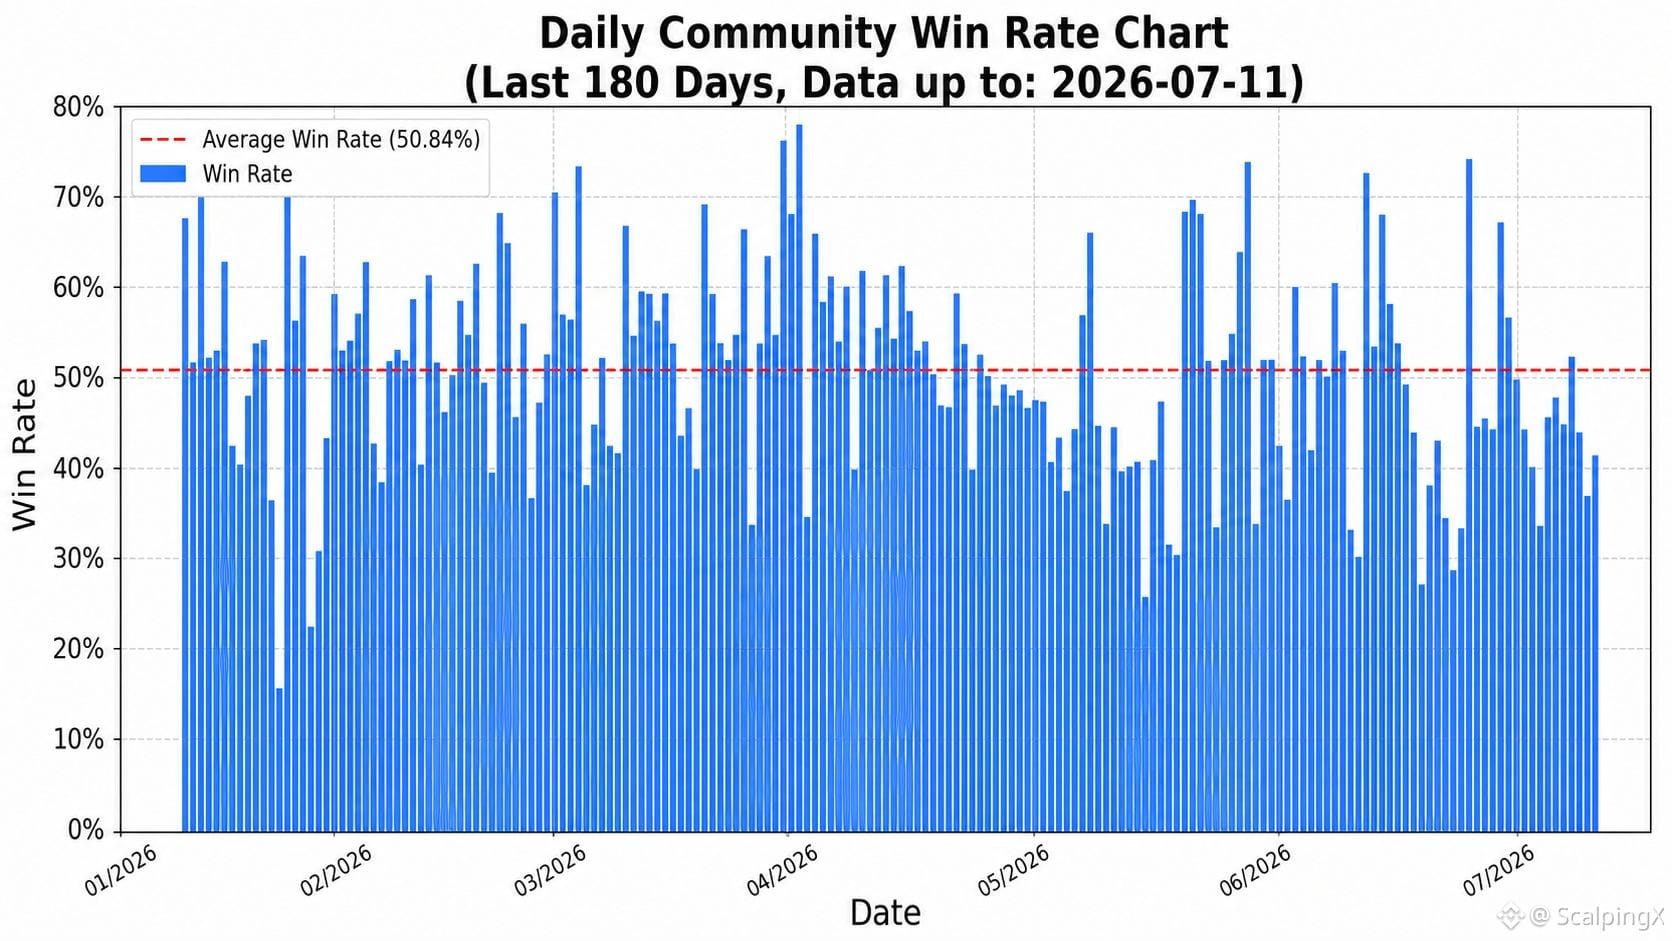
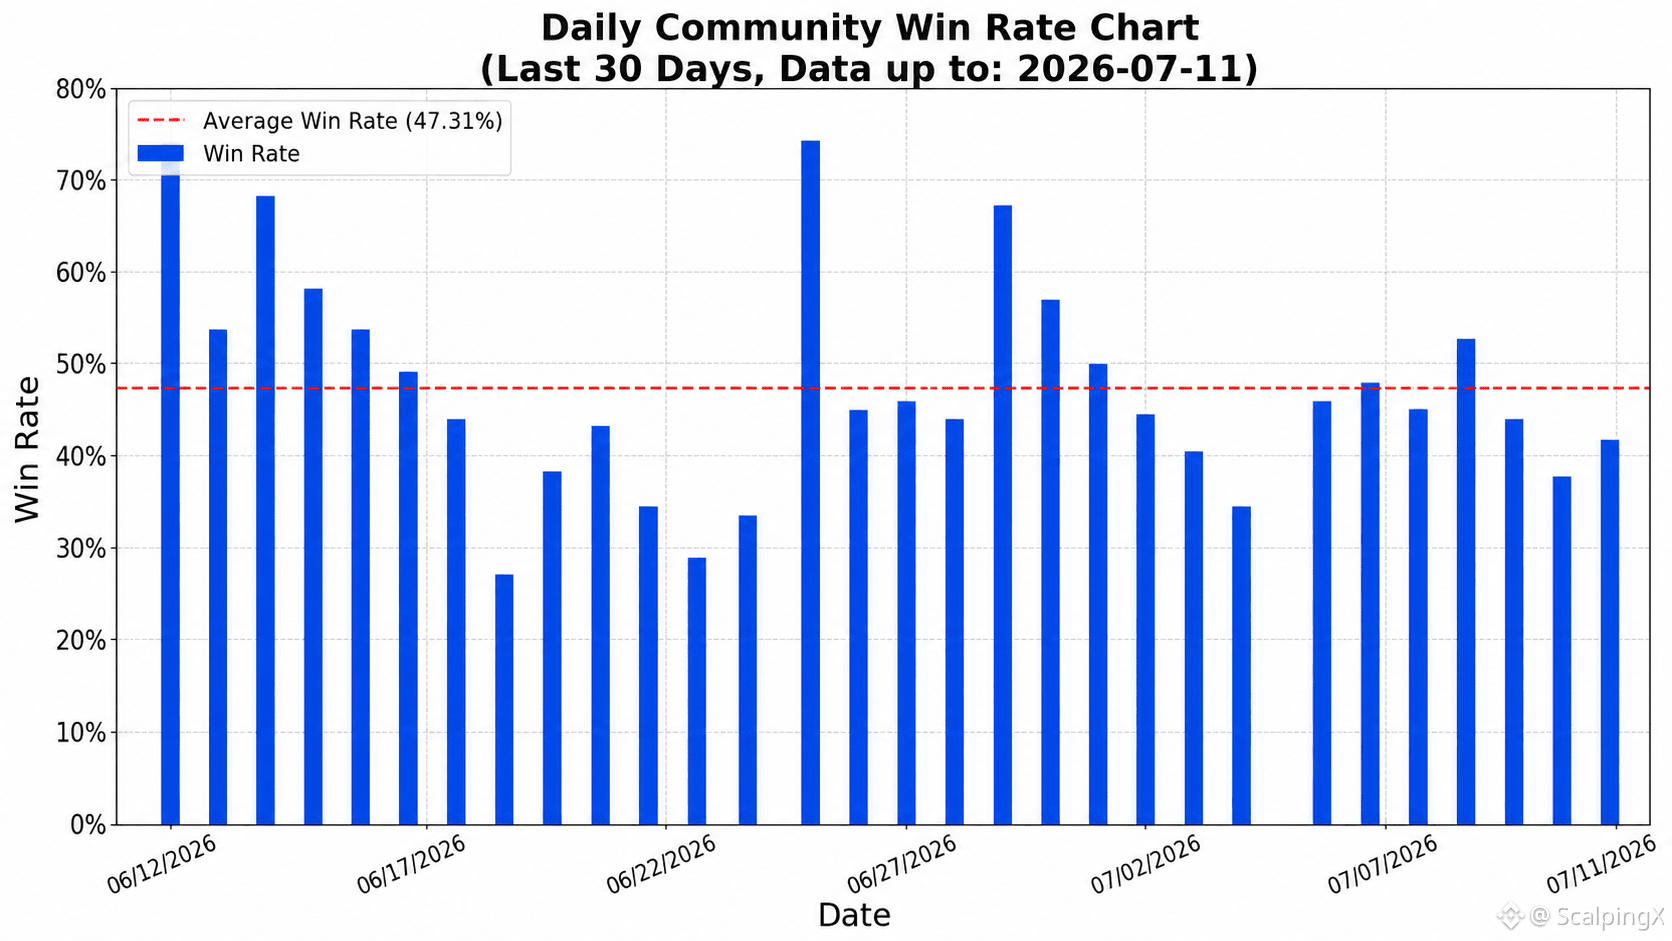
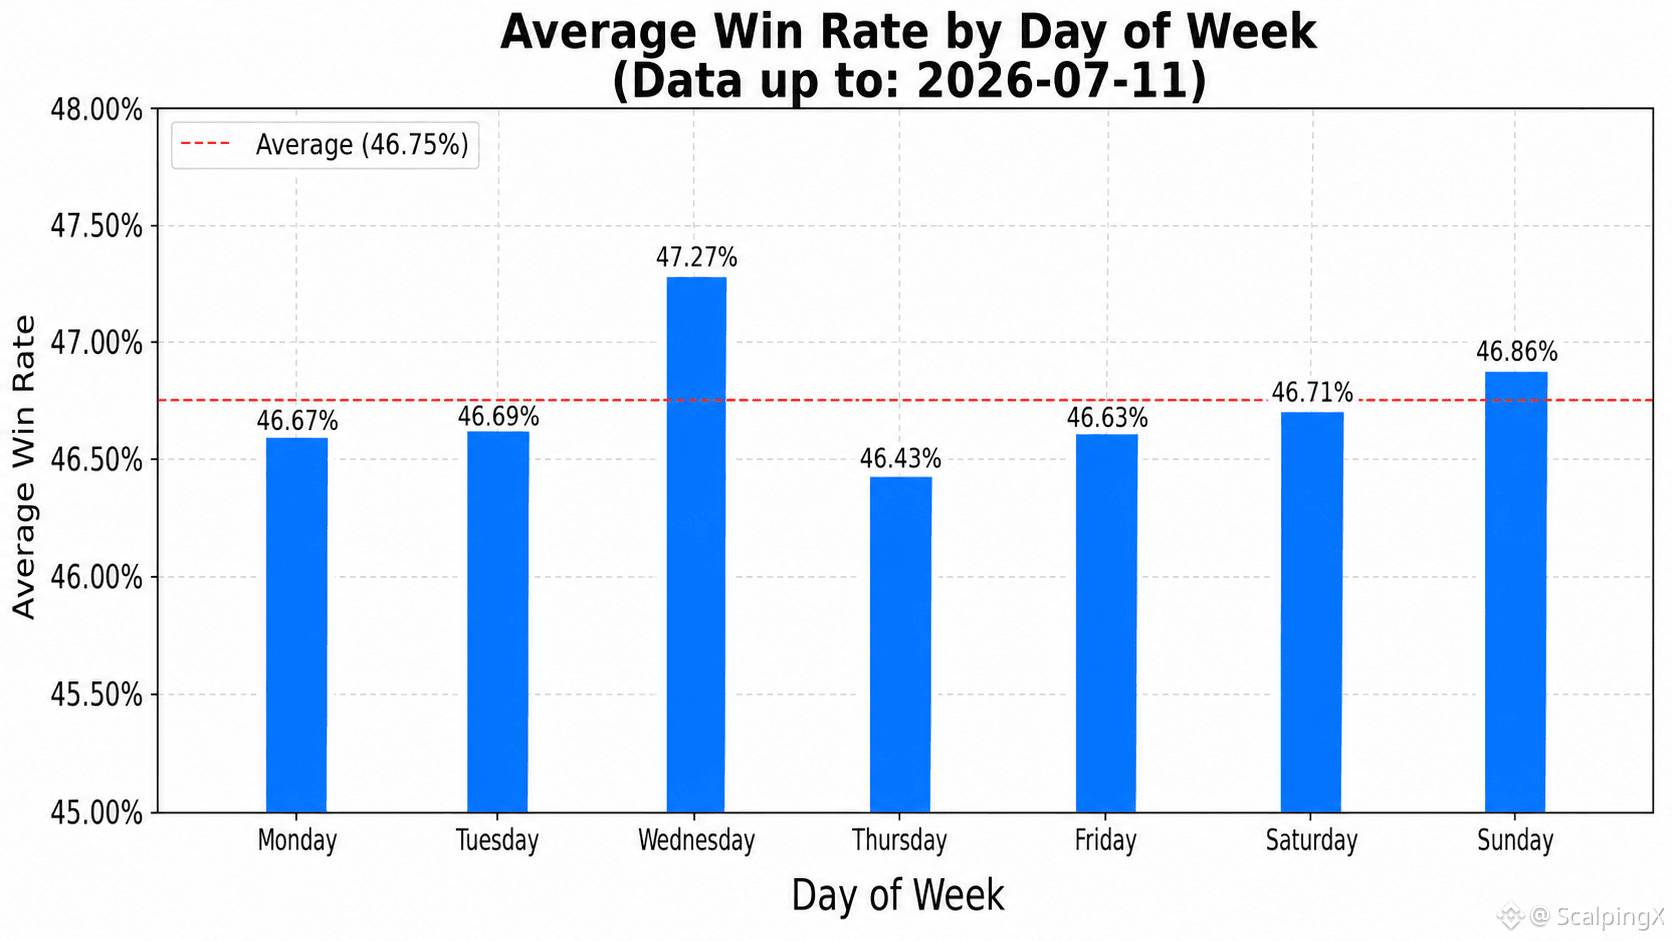
Updated as of 2026-07-11, based on community-wide trading
📊 The average win rate is 46.75%
🏆 The highest daily win rate was 78.08% on 2026-04-01. The lowest was 15.69% on 2026-01-25
📅 Wednesday has the highest average win rate at 47.27%, while Thursday has the lowest at 46.43%
⏱️ The highest 7-day average win rate was 63.27% for the period ending 2026-04-05. The lowest was 35.60% for the period ending 2026-06-24
⚖️ The number of days with a win rate above the overall average is 338, while 401 days recorded a win rate equal to or below the average
📈 There were 211 days with a win rate above 50%, 398 days between 40% and 50%, and 130 days below 40%
#TradingStatistics $BTC $BNB $GRAM
Updated as of 2026-07-11, based on community-wide trading
📊 The average win rate is 46.75%
🏆 The highest daily win rate was 78.08% on 2026-04-01. The lowest was 15.69% on 2026-01-25
📅 Wednesday has the highest average win rate at 47.27%, while Thursday has the lowest at 46.43%
⏱️ The highest 7-day average win rate was 63.27% for the period ending 2026-04-05. The lowest was 35.60% for the period ending 2026-06-24
⚖️ The number of days with a win rate above the overall average is 338, while 401 days recorded a win rate equal to or below the average
📈 There were 211 days with a win rate above 50%, 398 days between 40% and 50%, and 130 days below 40%
#TradingStatistics $BTC $BNB $GRAM
📊 The average win rate is 46.75%
🏆 The highest daily win rate was 78.08% on 2026-04-01. The lowest was 15.69% on 2026-01-25
📅 Wednesday has the highest average win rate at 47.27%, while Thursday has the lowest at 46.43%
⏱️ The highest 7-day average win rate was 63.27% for the period ending 2026-04-05. The lowest was 35.60% for the period ending 2026-06-24
⚖️ The number of days with a win rate above the overall average is 338, while 401 days recorded a win rate equal to or below the average
📈 There were 211 days with a win rate above 50%, 398 days between 40% and 50%, and 130 days below 40%
#TradingStatistics $BTC $BNB $GRAM
108
·
--
Bullish
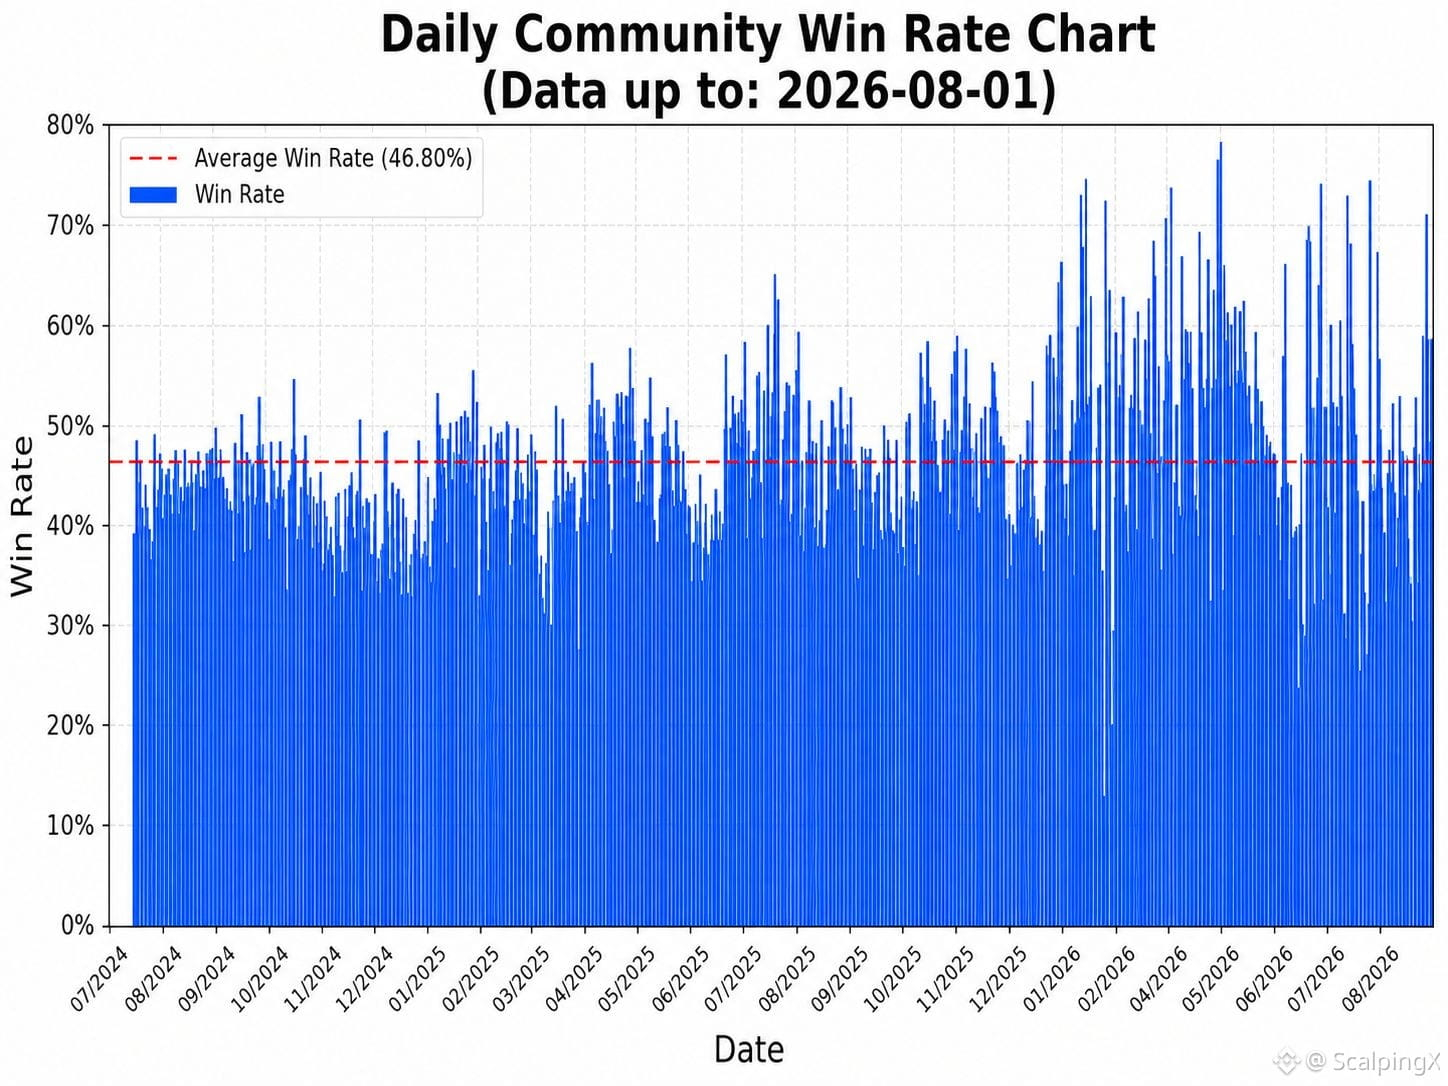
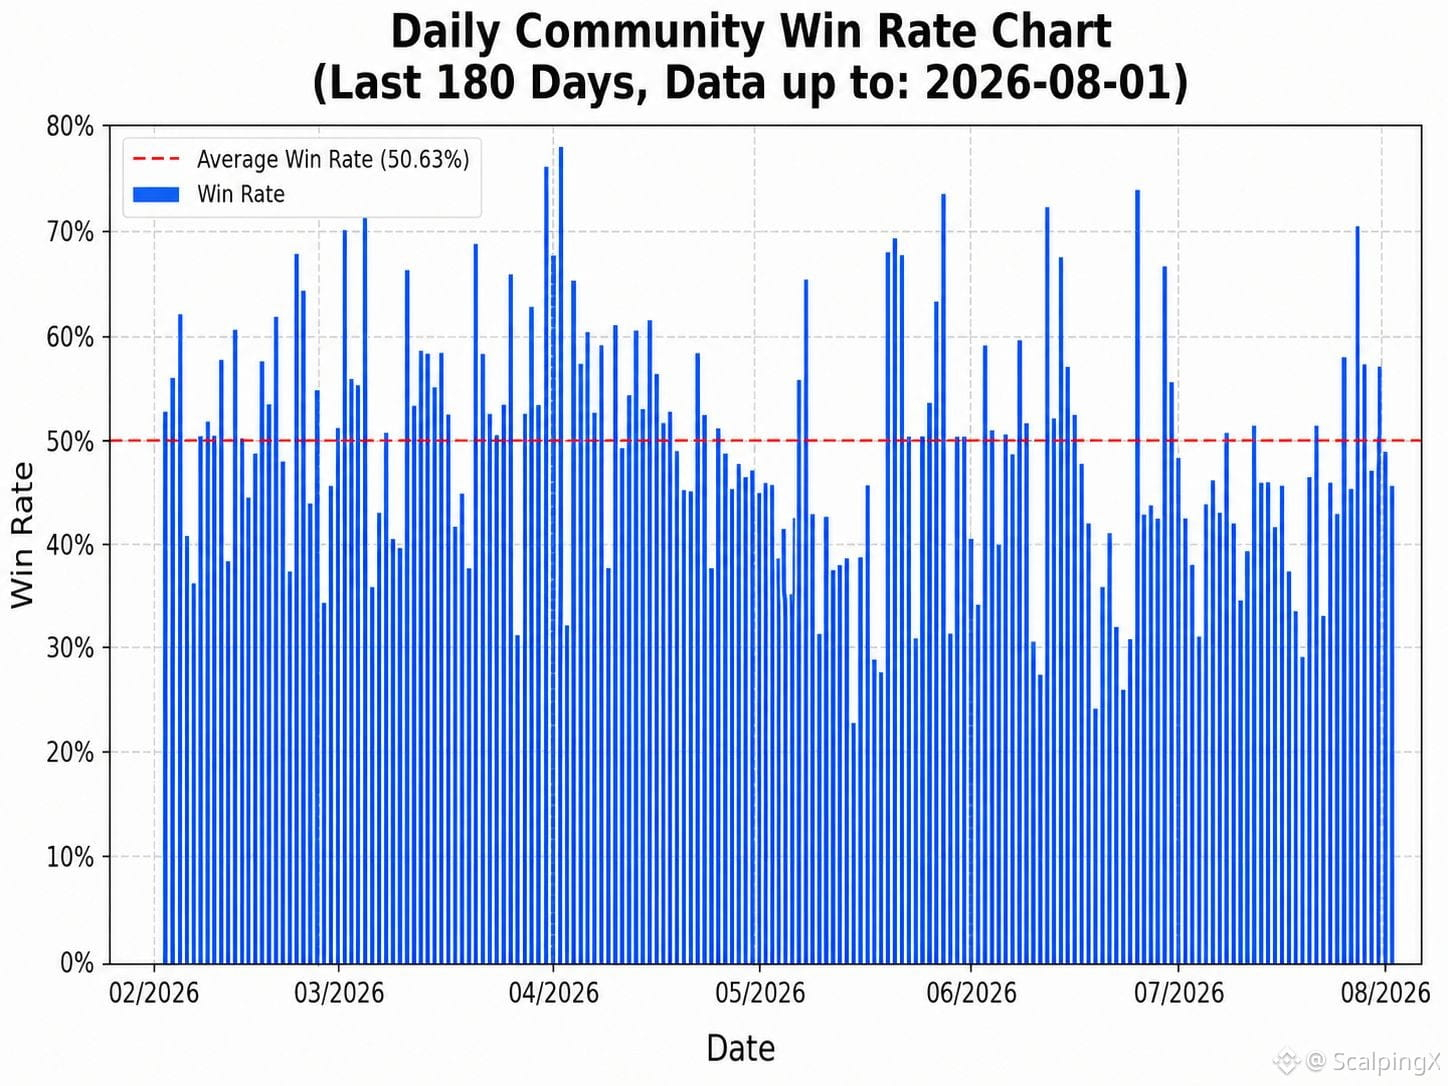
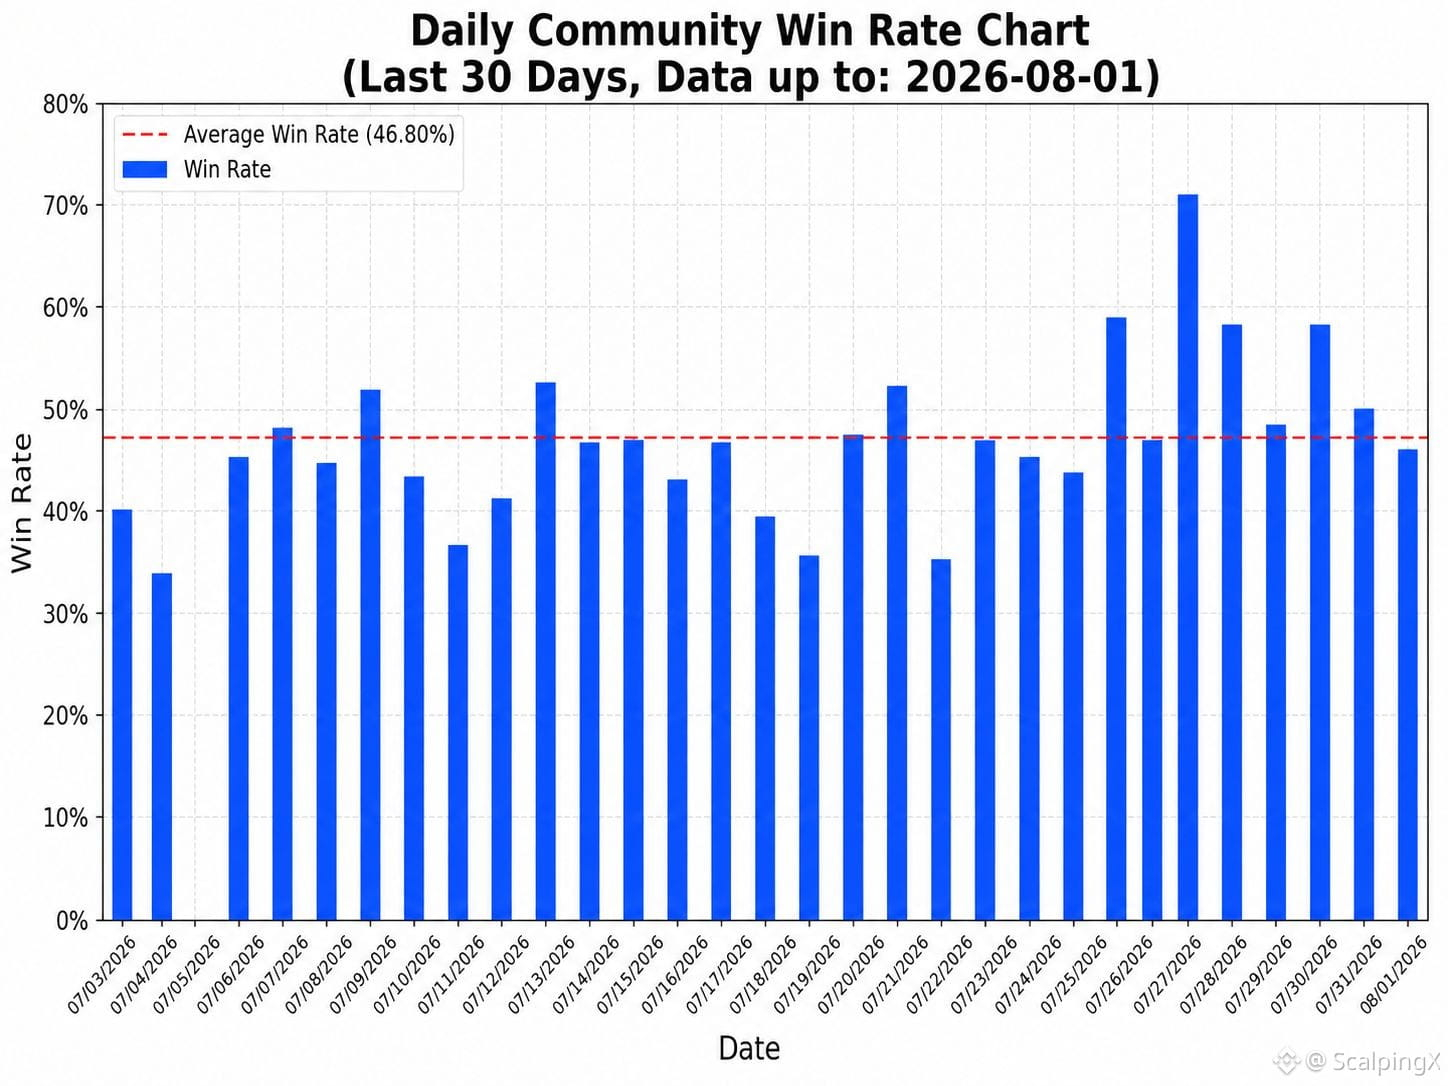
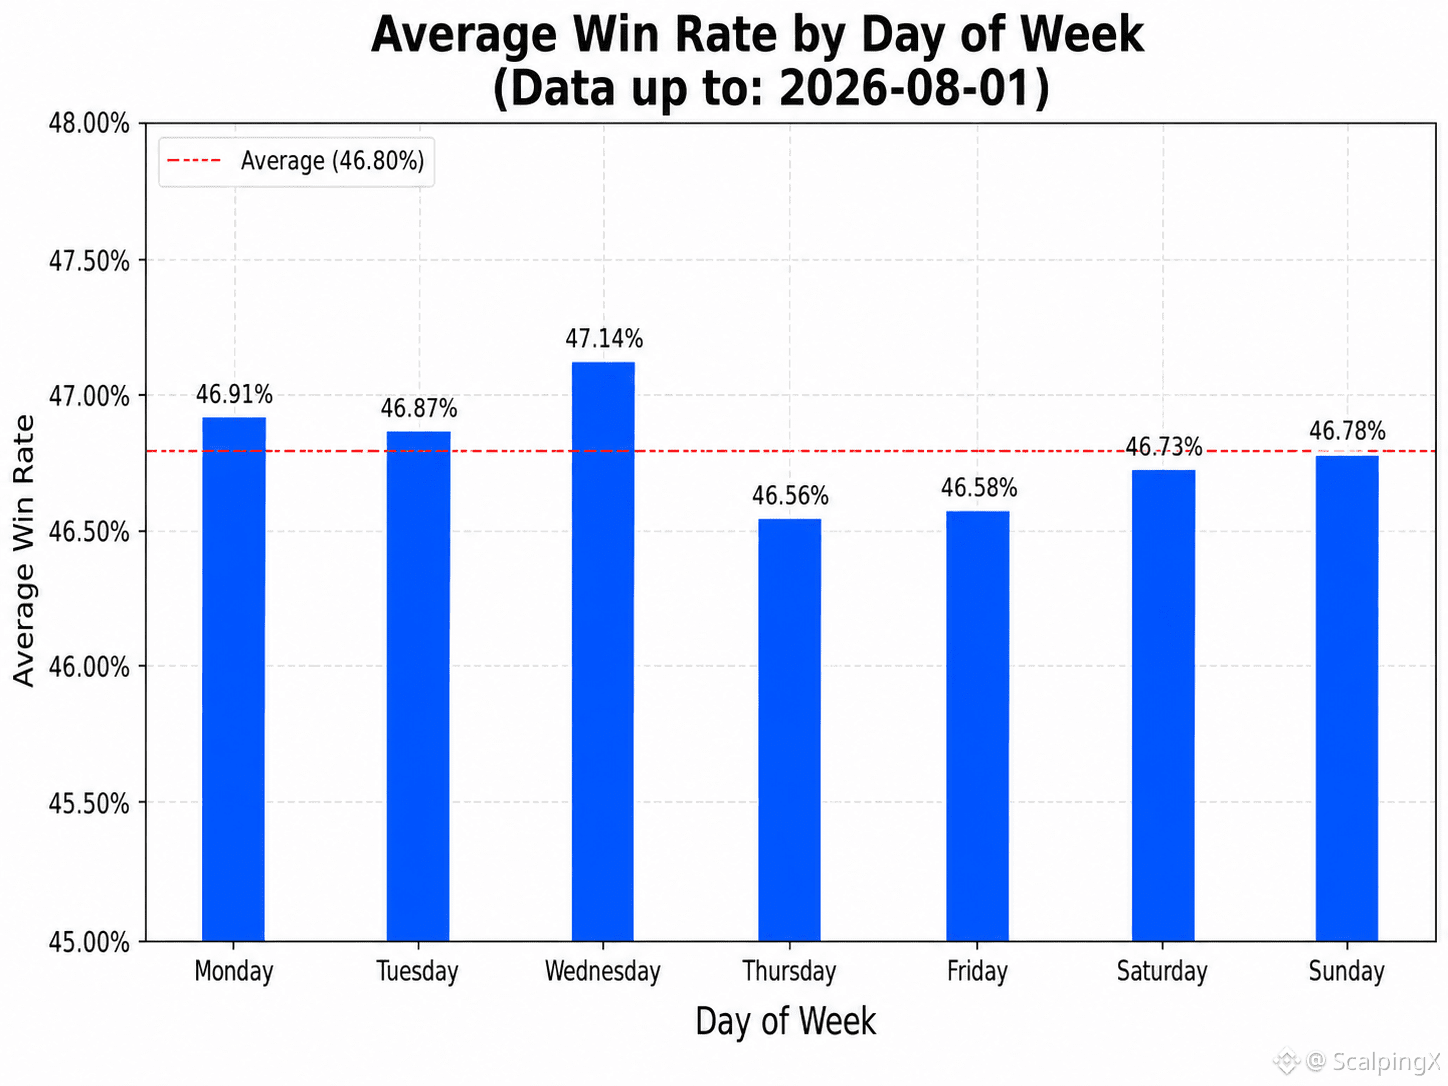
Updated as of 2026-08-01, based on community-wide trading
📊 The average win rate is 46.80%
🏆 The highest daily win rate was 78.08% on 2026-04-01. The lowest daily win rate was 15.69% on 2026-01-25
📅 Wednesday has the highest average win rate at 47.14%, while Thursday has the lowest average win rate at 46.56%
⏱️ The strongest 7-day period ended on 2026-04-05, with an average win rate of 63.27%. The weakest period ended on 2026-06-24, with an average win rate of 35.60%
⚖️ There were 352 days with a win rate above the overall average and 408 days with a win rate at or below the average
📈 The win rate exceeded 50% on 218 days, ranged from 40% to 50% on 408 days, and fell below 40% on 134 days
#TradingStatistics $BTC $BNB $GRAM
Updated as of 2026-08-01, based on community-wide trading
📊 The average win rate is 46.80%
🏆 The highest daily win rate was 78.08% on 2026-04-01. The lowest daily win rate was 15.69% on 2026-01-25
📅 Wednesday has the highest average win rate at 47.14%, while Thursday has the lowest average win rate at 46.56%
⏱️ The strongest 7-day period ended on 2026-04-05, with an average win rate of 63.27%. The weakest period ended on 2026-06-24, with an average win rate of 35.60%
⚖️ There were 352 days with a win rate above the overall average and 408 days with a win rate at or below the average
📈 The win rate exceeded 50% on 218 days, ranged from 40% to 50% on 408 days, and fell below 40% on 134 days
#TradingStatistics $BTC $BNB $GRAM
📊 The average win rate is 46.80%
🏆 The highest daily win rate was 78.08% on 2026-04-01. The lowest daily win rate was 15.69% on 2026-01-25
📅 Wednesday has the highest average win rate at 47.14%, while Thursday has the lowest average win rate at 46.56%
⏱️ The strongest 7-day period ended on 2026-04-05, with an average win rate of 63.27%. The weakest period ended on 2026-06-24, with an average win rate of 35.60%
⚖️ There were 352 days with a win rate above the overall average and 408 days with a win rate at or below the average
📈 The win rate exceeded 50% on 218 days, ranged from 40% to 50% on 408 days, and fell below 40% on 134 days
#TradingStatistics $BTC $BNB $GRAM
195
·
--
Bullish
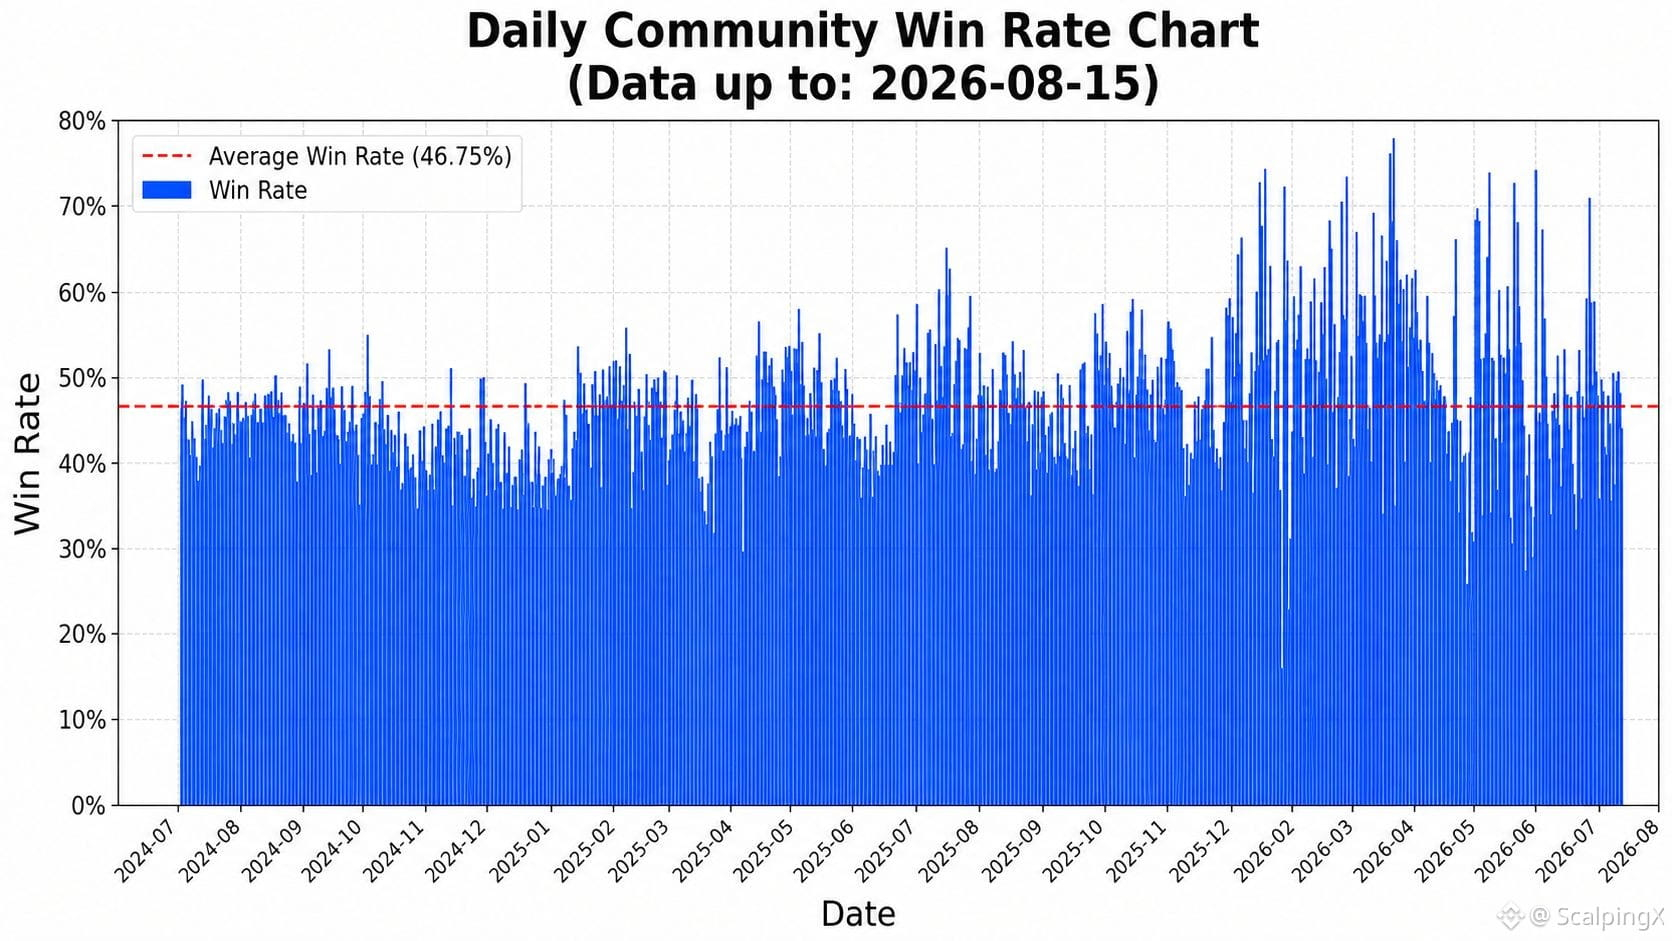
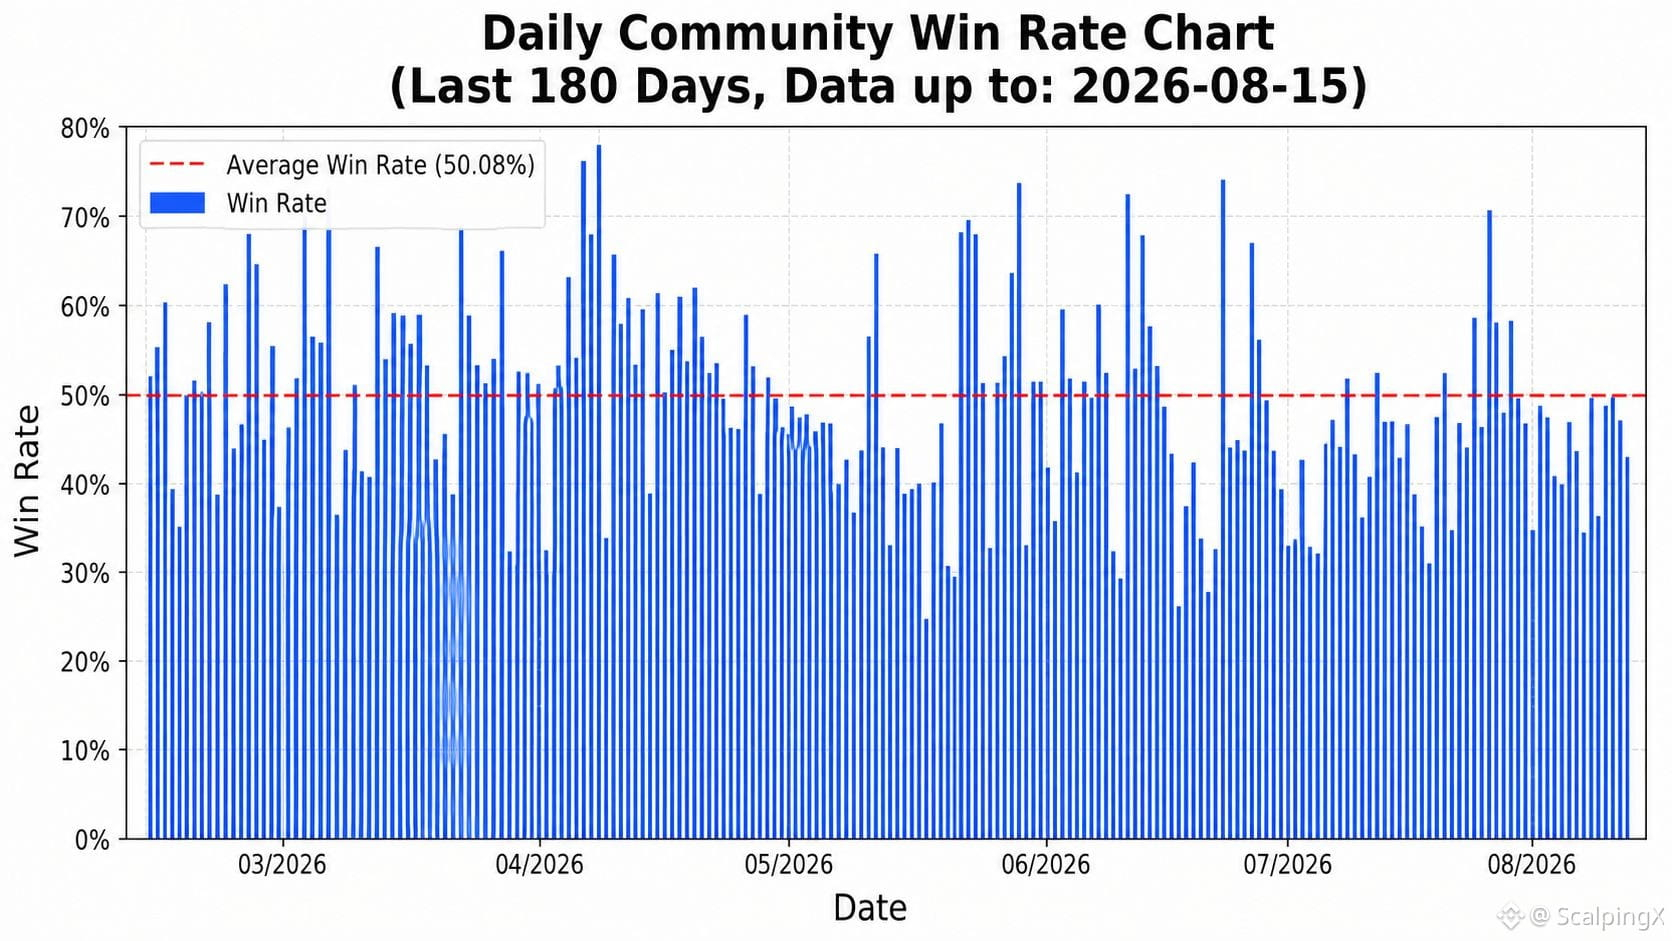
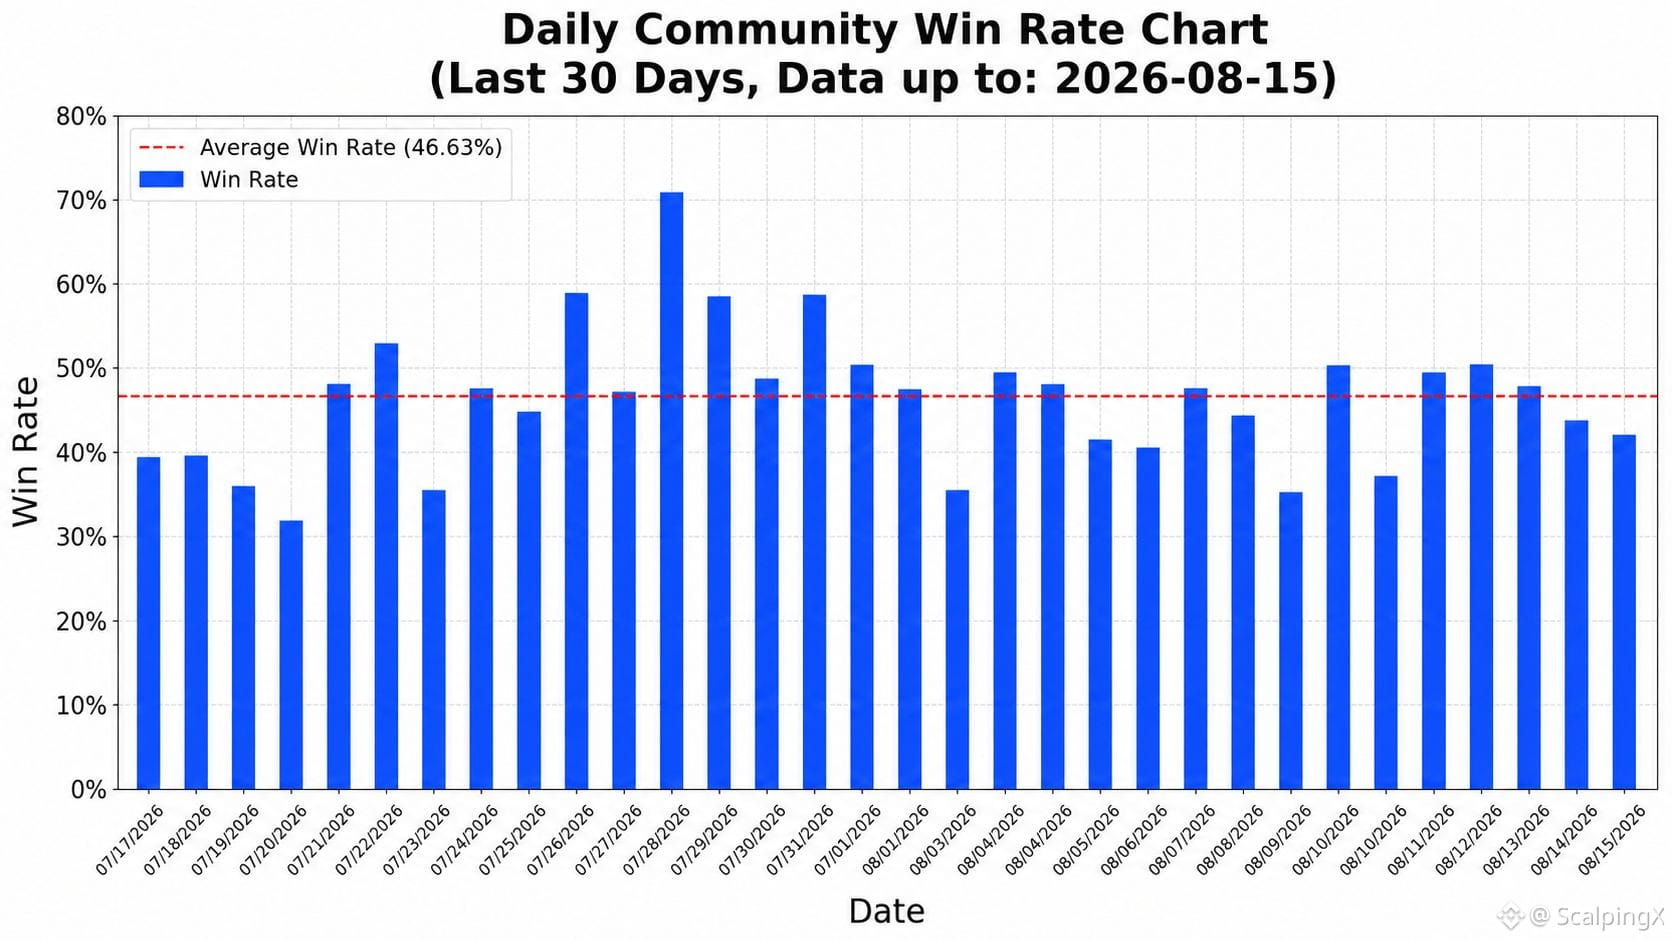
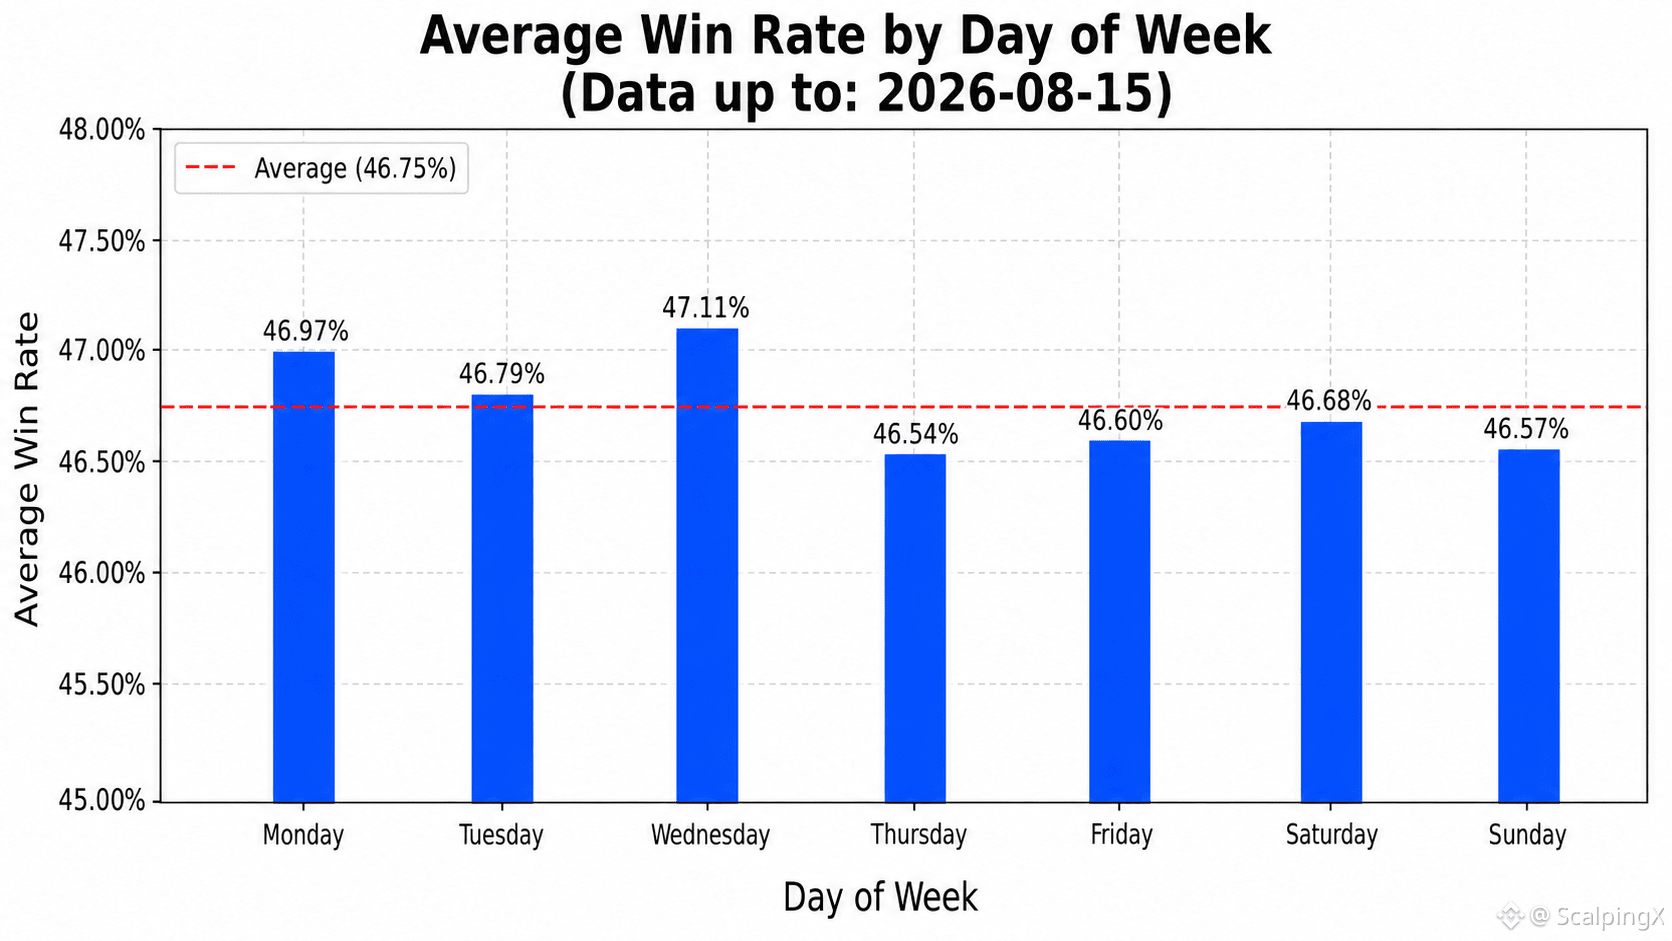
Update 2026-08-15, based on community-wide trading
📊 The average win rate is 46.75%
🏆 The highest daily win rate was 78.08% on 2026-04-01. The lowest daily win rate was 15.69% on 2026-01-25
📅 Wednesday has the highest average win rate at 47.11%. Sunday has the lowest average win rate at 46.57%
⏱️ The highest 7-day average win rate was 63.27% for the period ending 2026-04-05. The lowest was 35.60% for the period ending 2026-06-24
⚖️ The number of days with a win rate above the overall average is 360. The number of days with a win rate at or below the overall average is 414
📈 The number of days with a win rate above 50% is 220. The number of days with a win rate between 40% and 50% is 417. The number of days with a win rate below 40% is 137
#TradingStatistics $BNB $HYPE $SOL
Update 2026-08-15, based on community-wide trading
📊 The average win rate is 46.75%
🏆 The highest daily win rate was 78.08% on 2026-04-01. The lowest daily win rate was 15.69% on 2026-01-25
📅 Wednesday has the highest average win rate at 47.11%. Sunday has the lowest average win rate at 46.57%
⏱️ The highest 7-day average win rate was 63.27% for the period ending 2026-04-05. The lowest was 35.60% for the period ending 2026-06-24
⚖️ The number of days with a win rate above the overall average is 360. The number of days with a win rate at or below the overall average is 414
📈 The number of days with a win rate above 50% is 220. The number of days with a win rate between 40% and 50% is 417. The number of days with a win rate below 40% is 137
#TradingStatistics $BNB $HYPE $SOL
📊 The average win rate is 46.75%
🏆 The highest daily win rate was 78.08% on 2026-04-01. The lowest daily win rate was 15.69% on 2026-01-25
📅 Wednesday has the highest average win rate at 47.11%. Sunday has the lowest average win rate at 46.57%
⏱️ The highest 7-day average win rate was 63.27% for the period ending 2026-04-05. The lowest was 35.60% for the period ending 2026-06-24
⚖️ The number of days with a win rate above the overall average is 360. The number of days with a win rate at or below the overall average is 414
📈 The number of days with a win rate above 50% is 220. The number of days with a win rate between 40% and 50% is 417. The number of days with a win rate below 40% is 137
#TradingStatistics $BNB $HYPE $SOL
56

·
--
Bullish
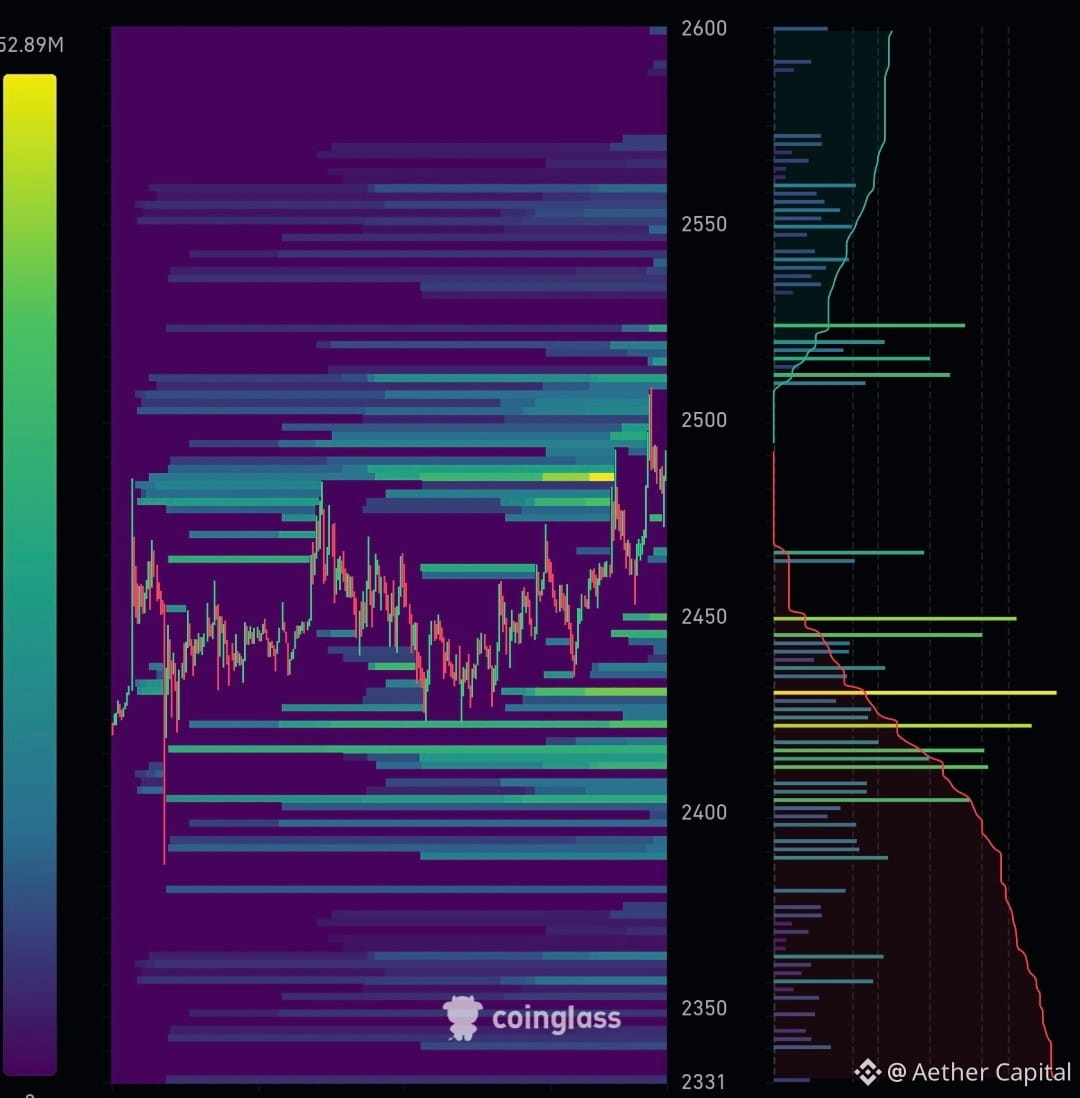
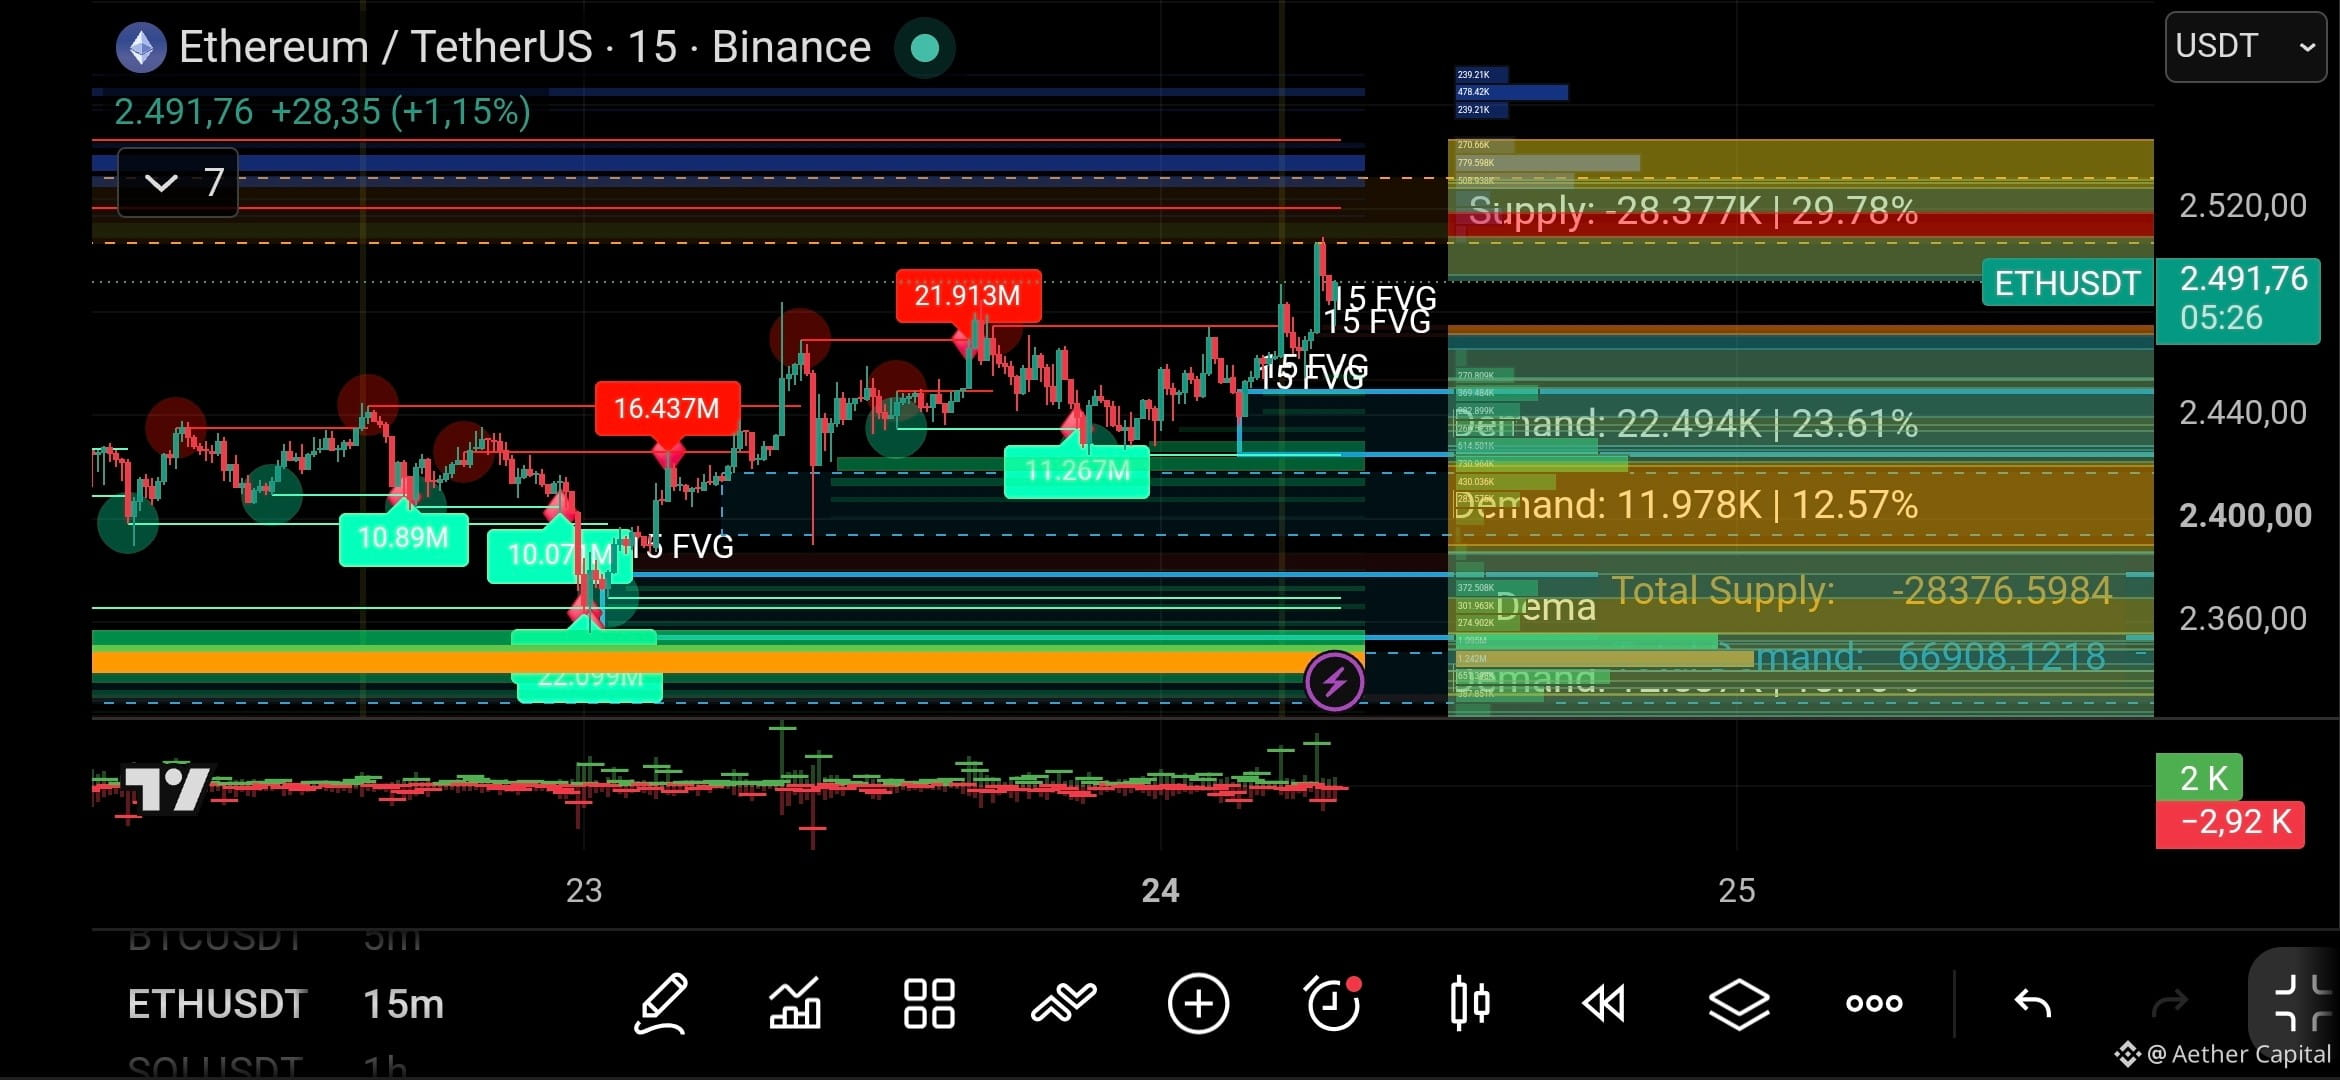
TECHNICAL ANALYSIS AND TRADING PLAN: ETH/USDT (15M)
The price is testing the key resistance of the current structure.
Support Concepts ⚖️
○ Support (Demand): Market zone ($2,440–$2,450) where buying pressure enters, supported by liquidity gaps (FVGs) to stop the drop.
○ Resistance (Supply): Market zone ($2,500–$2,520) with a high concentration of sell orders that block the bullish momentum.
○ Entry Setups (15m)
● Strategy 1: Pullback to Support
Entry Zone: $2,455.00 – $2,465.00
Stop Loss: $2,434.00
Take Profit 1: $2,500.00
Take Profit 2: $2,520.00
Take Profit 3: $2,580.00
R:R ratio: 1:3.5
● Strategy 2: Breakout of Resistance
Entry Zone: 15m candle close above $2,522.00 with volume
Stop Loss: $2,488.00
Take Profit 1: $2,560.00
Take Profit 2: $2,590.00
R:R ratio: 1:2.0
Risk Management ⚠️
Leverage: 10x – 15x
Suggested Risk: 1% to 2% of the account
Invalidation: A 15m candle close below $2,434 invalidates the bullish structure.
$ETH #tradingtechnique #TradingStatistics
{future}(ETHUSDT)
TECHNICAL ANALYSIS AND TRADING PLAN: ETH/USDT (15M)
The price is testing the key resistance of the current structure.
Support Concepts ⚖️
○ Support (Demand): Market zone ($2,440–$2,450) where buying pressure enters, supported by liquidity gaps (FVGs) to stop the drop.
○ Resistance (Supply): Market zone ($2,500–$2,520) with a high concentration of sell orders that block the bullish momentum.
○ Entry Setups (15m)
● Strategy 1: Pullback to Support
Entry Zone: $2,455.00 – $2,465.00
Stop Loss: $2,434.00
Take Profit 1: $2,500.00
Take Profit 2: $2,520.00
Take Profit 3: $2,580.00
R:R ratio: 1:3.5
● Strategy 2: Breakout of Resistance
Entry Zone: 15m candle close above $2,522.00 with volume
Stop Loss: $2,488.00
Take Profit 1: $2,560.00
Take Profit 2: $2,590.00
R:R ratio: 1:2.0
Risk Management ⚠️
Leverage: 10x – 15x
Suggested Risk: 1% to 2% of the account
Invalidation: A 15m candle close below $2,434 invalidates the bullish structure.
$ETH #tradingtechnique #TradingStatistics
The price is testing the key resistance of the current structure.
Support Concepts ⚖️
○ Support (Demand): Market zone ($2,440–$2,450) where buying pressure enters, supported by liquidity gaps (FVGs) to stop the drop.
○ Resistance (Supply): Market zone ($2,500–$2,520) with a high concentration of sell orders that block the bullish momentum.
○ Entry Setups (15m)
● Strategy 1: Pullback to Support
Entry Zone: $2,455.00 – $2,465.00
Stop Loss: $2,434.00
Take Profit 1: $2,500.00
Take Profit 2: $2,520.00
Take Profit 3: $2,580.00
R:R ratio: 1:3.5
● Strategy 2: Breakout of Resistance
Entry Zone: 15m candle close above $2,522.00 with volume
Stop Loss: $2,488.00
Take Profit 1: $2,560.00
Take Profit 2: $2,590.00
R:R ratio: 1:2.0
Risk Management ⚠️
Leverage: 10x – 15x
Suggested Risk: 1% to 2% of the account
Invalidation: A 15m candle close below $2,434 invalidates the bullish structure.
$ETH #tradingtechnique #TradingStatistics
526

📊 SPICY TRADING TRUTH: A 70% WIN RATE CAN STILL LOSE MONEY.
Imagine winning $100 on seven trades and losing $300 on three.
Total:
+$700 − $900 = −$200.
Now imagine a trader winning only 40% of trades but consistently earning more on winners than they lose on losers.
Win rate alone tells you almost nothing.
Track expectancy, average win, average loss, fees, drawdown, and sample size.
A trading edge must survive the numbers.
🔥 What matters more to you: win rate or expectancy?
#TradingEdge #TradingStatistics #RiskRewardRat #QuantTrading #BinanceSquare
📊 SPICY TRADING TRUTH: A 70% WIN RATE CAN STILL LOSE MONEY.
Imagine winning $100 on seven trades and losing $300 on three.
Total:
+$700 − $900 = −$200.
Now imagine a trader winning only 40% of trades but consistently earning more on winners than they lose on losers.
Win rate alone tells you almost nothing.
Track expectancy, average win, average loss, fees, drawdown, and sample size.
A trading edge must survive the numbers.
🔥 What matters more to you: win rate or expectancy?
#TradingEdge #TradingStatistics #RiskRewardRat #QuantTrading #BinanceSquare
Imagine winning $100 on seven trades and losing $300 on three.
Total:
+$700 − $900 = −$200.
Now imagine a trader winning only 40% of trades but consistently earning more on winners than they lose on losers.
Win rate alone tells you almost nothing.
Track expectancy, average win, average loss, fees, drawdown, and sample size.
A trading edge must survive the numbers.
🔥 What matters more to you: win rate or expectancy?
#TradingEdge #TradingStatistics #RiskRewardRat #QuantTrading #BinanceSquare
18

If a losing streak makes you completely doubt your strategy, your problem is not the system, it is your lack of statistical trust. Rely on long-term $BTC analysis and keep a steady course.#TradingStatistics #bitcoin
If a losing streak makes you completely doubt your strategy, your problem is not the system, it is your lack of statistical trust. Rely on long-term $BTC analysis and keep a steady course.#TradingStatistics #bitcoin
1
50
Log in to explore more content
Join global crypto users on Binance Square
⚡️ Get latest and useful information about crypto.
💬 Trusted by the world’s largest crypto exchange.
👍 Discover real insights from verified creators.
Email / Phone number
Trending Topics
1
#WhoWillSucceedJensenHuangatNvidia?
154,130 views
1,589 Discussing
2
#WhatWillDriveCryptoandStocks’NextRebound?
552,570 views
3,426 Discussing
3
#BitcoinActiveSupplyInProfitDropsBelow45%
67,656 views
671 Discussing
4
#KavaSaysAbnormalActivityLimitedToKavaLend
36,649 views
374 Discussing
5
#USSpotXRPETFsSeeLargestWeeklyOutflowIn8Months
28,401 views
329 Discussing
6
#USPPIMissMayEaseBTCPressure
286,043 views
2,229 Discussing
7
#WORPTLetsTouristsConvertCryptoToThaiBaht
9,587 views
89 Discussing
8
#TONStrategyReports$23.97MQ3NetLoss
10,250 views
42 Discussing
9
#PolkadotCommunityApprovesNewStrategyWith97%Vote
27,013 views
286 Discussing
10
#dYdXPlansV9.9UpgradeToShiftUSDCToInjective
25,084 views
246 Discussing