📊 TRADING PERFORMANCE & FEAR AND GREED INDEX (FGI) REPORT – UPDATED 07/11/2026
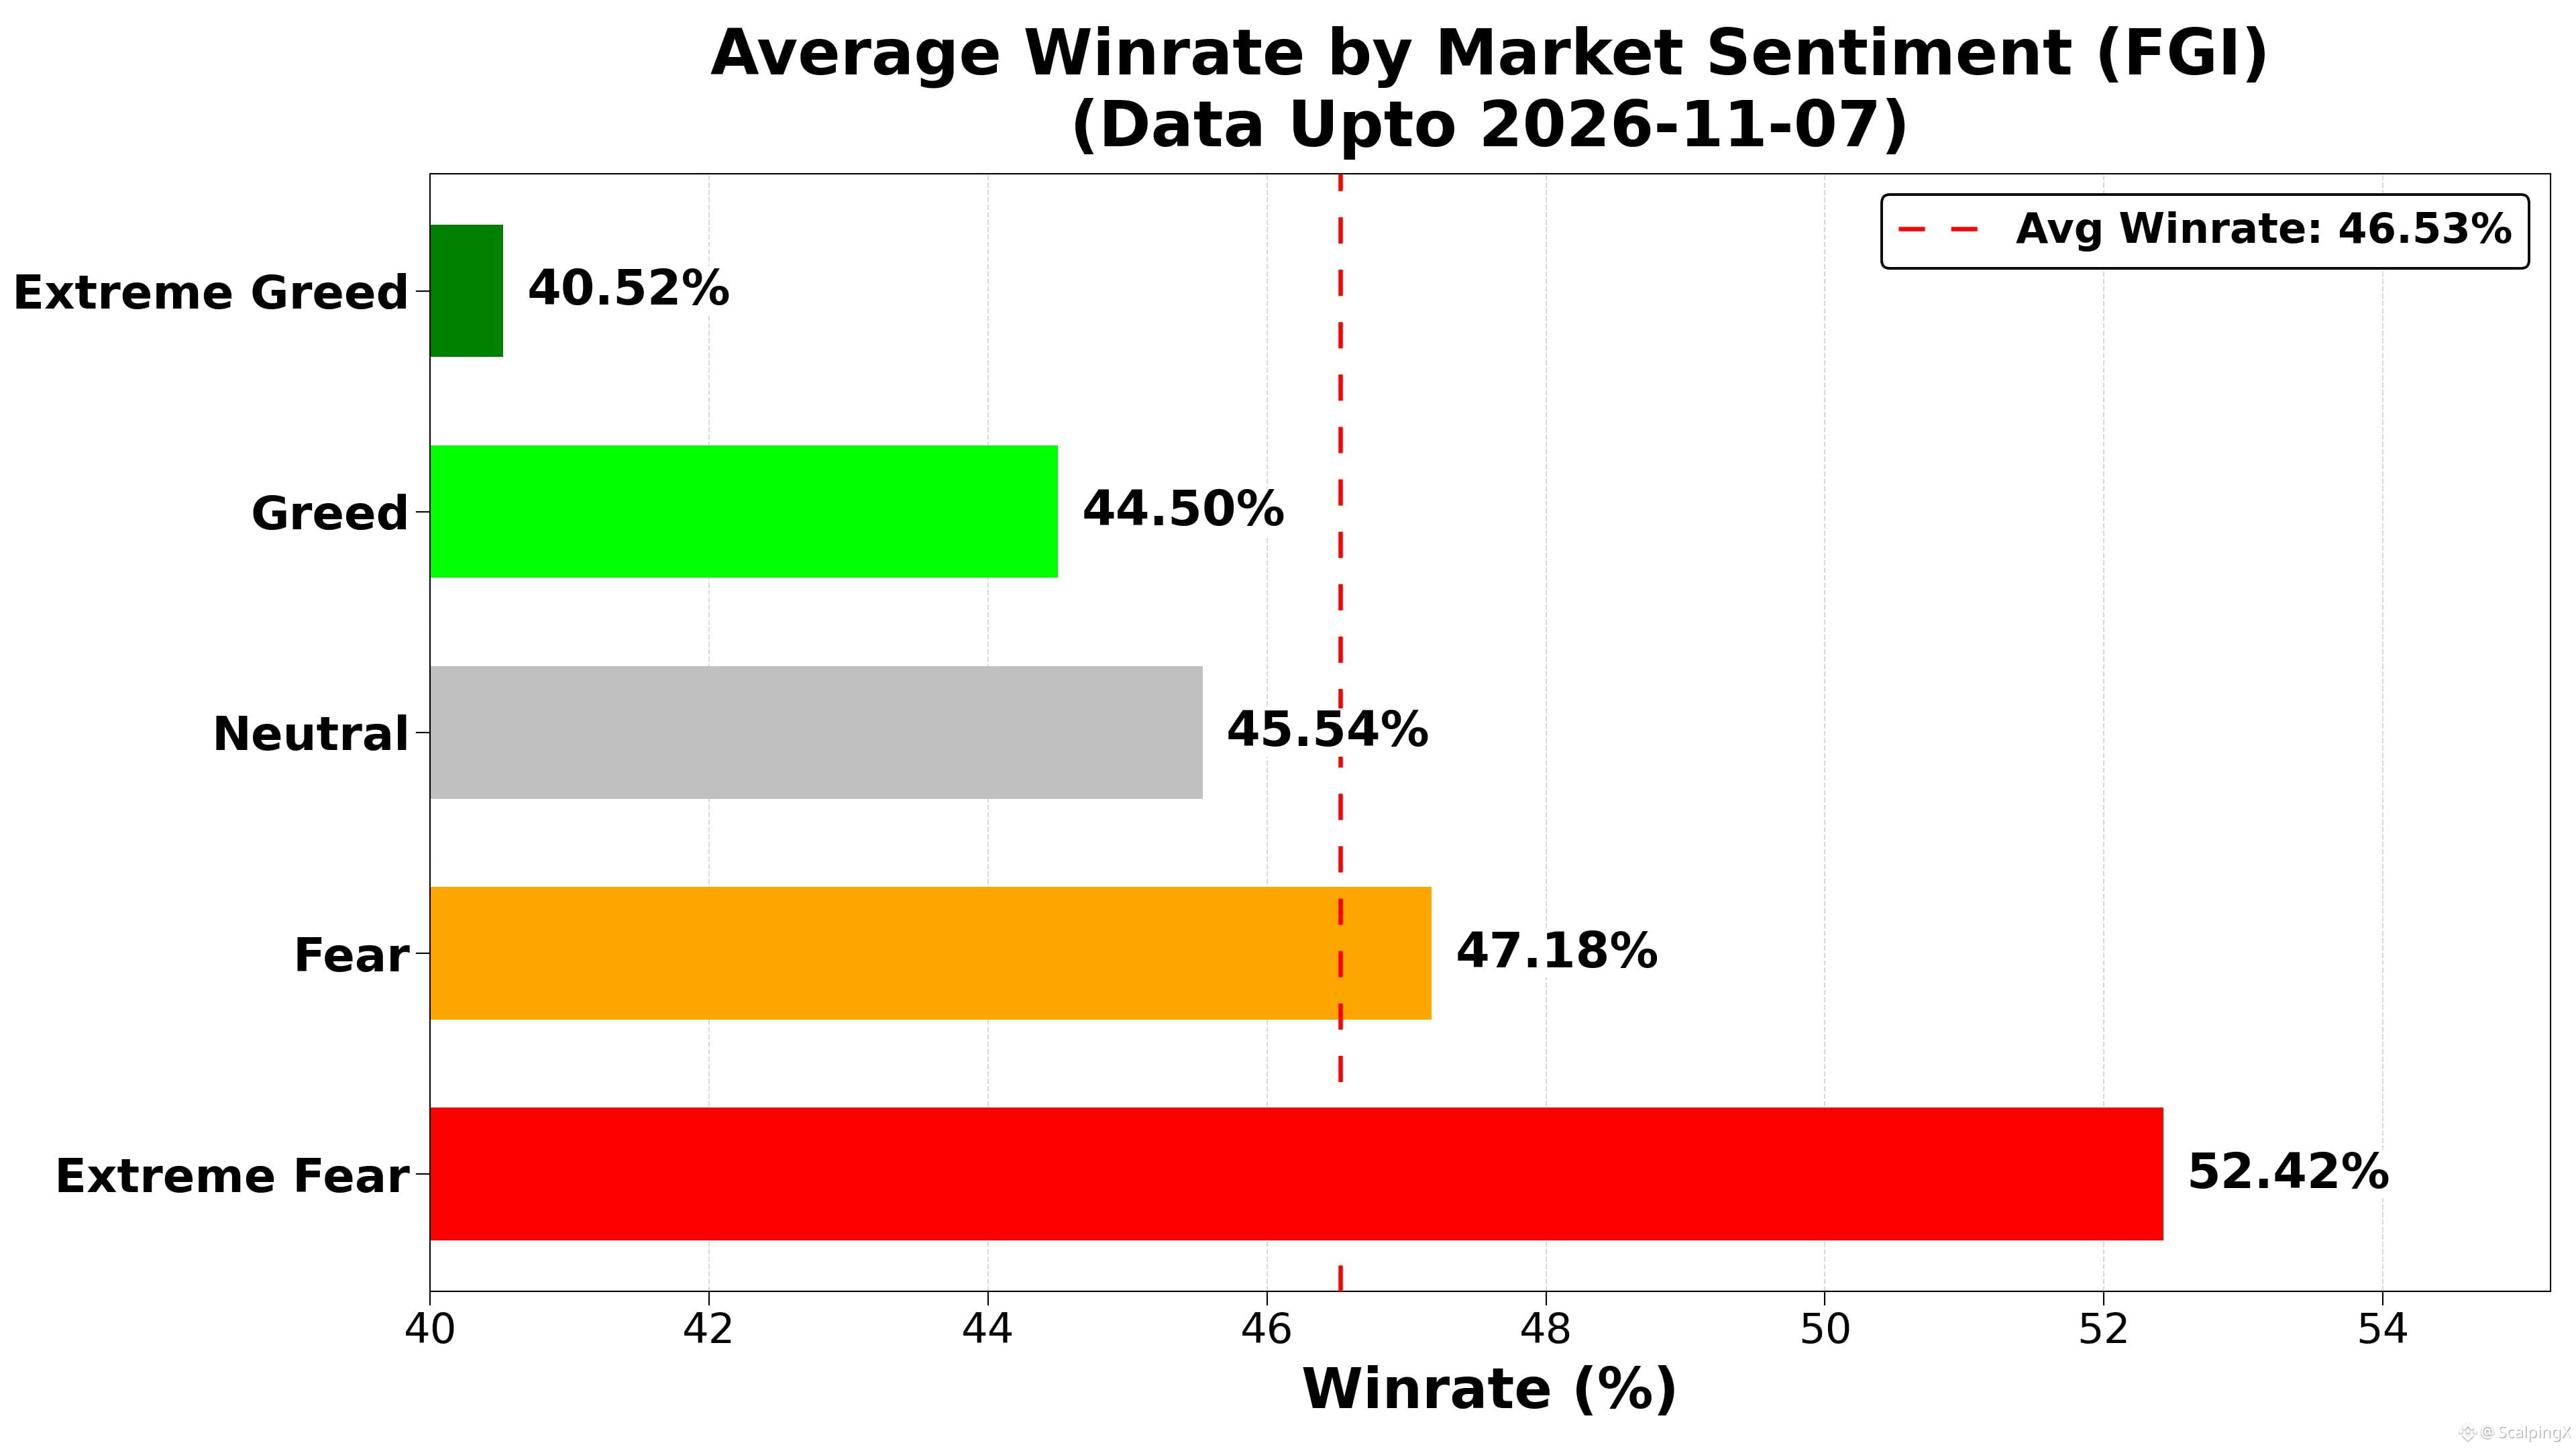
Data covering 858 days shows a correlation between FGI and Win Rate (WR) of r ≈ -0.291, slightly weaker than -0.293 on 31/10/2026. The relationship remains negative, with insufficient evidence to use FGI alone as a trade entry signal.
Trading performance in the sample tends to be lower during periods of greed, particularly extreme greed. FGI can provide context for assessing risk, but this correlation does not establish predictive ability or causation.
Below are the average daily win rate (WR), theoretical break-even R, and number of observed days (n) for each sentiment range. R is expressed as risk, excluding fees and slippage:
🤑 Extreme Greed (≥80): WR 40.5% • R=1:1.47 • n=25
😌 Greed (60–<80): WR 44.5% • R=1:1.25 • n=267
😐 Neutral (40–<60): WR 45.5% • R=1:1.20 • n=172
😰 Fear (20–<40): WR 47.2% • R=1:1.12 • n=279
😱 Extreme Fear (<20): WR 52.4% • R=1:0.91 • n=115
The percentage of days exceeding the full-sample average daily win rate of 46.53% within each sentiment range:
🤑 Extreme Greed: 8.0%
😌 Greed: 34.1%
😐 Neutral: 40.1%
😰 Fear: 55.2%
😱 Extreme Fear: 67.8%
➤ These statistics illustrate the relationship between win rate and the R required to break even.
📈 At higher FGI levels, historical WR is lower, implying a higher break-even R. However, setting more distant profit targets may itself change the win rate.
📉 At lower FGI levels, historical WR is higher, implying a lower break-even R. This alone does not establish that reducing profit targets would accelerate capital turnover or improve performance.
#TradingStatistics $BTC $BNB $GRAM
Data covering 858 days shows a correlation between FGI and Win Rate (WR) of r ≈ -0.291, slightly weaker than -0.293 on 31/10/2026. The relationship remains negative, with insufficient evidence to use FGI alone as a trade entry signal.
Trading performance in the sample tends to be lower during periods of greed, particularly extreme greed. FGI can provide context for assessing risk, but this correlation does not establish predictive ability or causation.
Below are the average daily win rate (WR), theoretical break-even R, and number of observed days (n) for each sentiment range. R is expressed as risk, excluding fees and slippage:
🤑 Extreme Greed (≥80): WR 40.5% • R=1:1.47 • n=25
😌 Greed (60–<80): WR 44.5% • R=1:1.25 • n=267
😐 Neutral (40–<60): WR 45.5% • R=1:1.20 • n=172
😰 Fear (20–<40): WR 47.2% • R=1:1.12 • n=279
😱 Extreme Fear (<20): WR 52.4% • R=1:0.91 • n=115
The percentage of days exceeding the full-sample average daily win rate of 46.53% within each sentiment range:
🤑 Extreme Greed: 8.0%
😌 Greed: 34.1%
😐 Neutral: 40.1%
😰 Fear: 55.2%
😱 Extreme Fear: 67.8%
➤ These statistics illustrate the relationship between win rate and the R required to break even.
📈 At higher FGI levels, historical WR is lower, implying a higher break-even R. However, setting more distant profit targets may itself change the win rate.
📉 At lower FGI levels, historical WR is higher, implying a lower break-even R. This alone does not establish that reducing profit targets would accelerate capital turnover or improve performance.
#TradingStatistics $BTC $BNB $GRAM