
#smcib
smcib
3,145 views
99 Discussing
Hot
Latest

🚀🟢 $SMCIB READY TO BREAK THROUGH 34.90 RESISTANCE!
Entry: 33.50-33.90 ⚡
Target: 34.50 🚀
Target: 35.20 🚀
Target: 36.00 🚀
Stop Loss: 32.70 ⚠️
Buyers have ripped the 32.40 floor and are now eyeing the 34.00‑34.90 ceiling. The order flow shows a clean absorption zone, and volume is spiking as the price tests the last barrier. 📊
If the candle punches through, the market flips into a higher‑momentum phase, targeting the 34.50‑35.20 corridor and even the 36.00 mark as liquidity pools melt away. 🦈
💬 Who’s ready to ride the next wave up?
⚠️ Not financial advice. Always manage your risk. 🛡️
🏷️ #SMCIB #LongSetup #Breakout #Crypto
🔥 💎
🚀🟢 $SMCIB READY TO BREAK THROUGH 34.90 RESISTANCE!
Entry: 33.50-33.90 ⚡
Target: 34.50 🚀
Target: 35.20 🚀
Target: 36.00 🚀
Stop Loss: 32.70 ⚠️
Buyers have ripped the 32.40 floor and are now eyeing the 34.00‑34.90 ceiling. The order flow shows a clean absorption zone, and volume is spiking as the price tests the last barrier. 📊
If the candle punches through, the market flips into a higher‑momentum phase, targeting the 34.50‑35.20 corridor and even the 36.00 mark as liquidity pools melt away. 🦈
💬 Who’s ready to ride the next wave up?
⚠️ Not financial advice. Always manage your risk. 🛡️
🏷️ #SMCIB #LongSetup #Breakout #Crypto
🔥 💎
Entry: 33.50-33.90 ⚡
Target: 34.50 🚀
Target: 35.20 🚀
Target: 36.00 🚀
Stop Loss: 32.70 ⚠️
Buyers have ripped the 32.40 floor and are now eyeing the 34.00‑34.90 ceiling. The order flow shows a clean absorption zone, and volume is spiking as the price tests the last barrier. 📊
If the candle punches through, the market flips into a higher‑momentum phase, targeting the 34.50‑35.20 corridor and even the 36.00 mark as liquidity pools melt away. 🦈
💬 Who’s ready to ride the next wave up?
⚠️ Not financial advice. Always manage your risk. 🛡️
🏷️ #SMCIB #LongSetup #Breakout #Crypto
🔥 💎
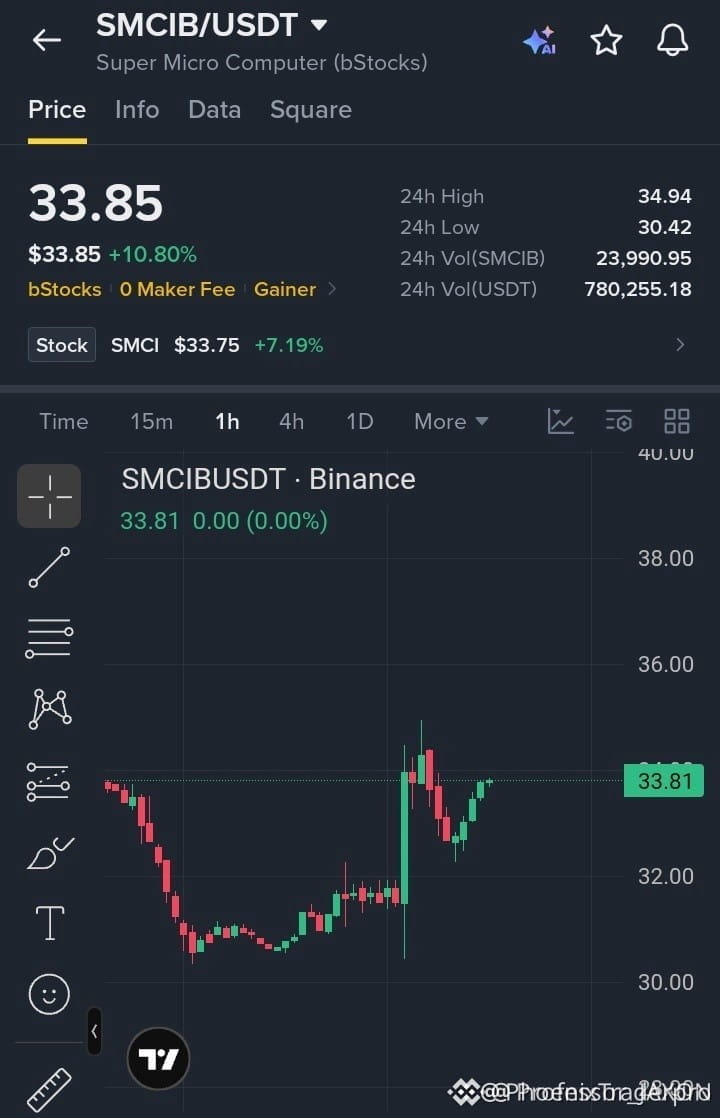

🚀 $SMCIB RECLAIMS BULLISH MOMENTUM AFTER POWERFUL RECOVERY! 🟢
Entry: 33.40-33.70 ⚡
Target: 34.00, 34.45, 34.90 🚀
Stop Loss: 32.90 ⚠️
📊 Smart money swept the 30.50‑31.00 basin, flipping the pressure into a clean bounce. Holding above 33.30 now acts as a fresh order block, letting the bulls stack liquidity for the next push. 🦈
⚡ Each step toward 34.00‑34.90 meets a fresh wave of buying, with volume expanding on the 4H chart. Confirmation comes as price steadies above the zone, signaling a potential breakout. 📌
💬 Are you ready to ride the surge or waiting for the next liquidity test? 👇
⚠️ Not financial advice. Always manage your risk. 🛡️
🏷️ #SMCIB #LongSetup #Bullish #Crypto
🔥 💎
🚀 $SMCIB RECLAIMS BULLISH MOMENTUM AFTER POWERFUL RECOVERY! 🟢
Entry: 33.40-33.70 ⚡
Target: 34.00, 34.45, 34.90 🚀
Stop Loss: 32.90 ⚠️
📊 Smart money swept the 30.50‑31.00 basin, flipping the pressure into a clean bounce. Holding above 33.30 now acts as a fresh order block, letting the bulls stack liquidity for the next push. 🦈
⚡ Each step toward 34.00‑34.90 meets a fresh wave of buying, with volume expanding on the 4H chart. Confirmation comes as price steadies above the zone, signaling a potential breakout. 📌
💬 Are you ready to ride the surge or waiting for the next liquidity test? 👇
⚠️ Not financial advice. Always manage your risk. 🛡️
🏷️ #SMCIB #LongSetup #Bullish #Crypto
🔥 💎
Entry: 33.40-33.70 ⚡
Target: 34.00, 34.45, 34.90 🚀
Stop Loss: 32.90 ⚠️
📊 Smart money swept the 30.50‑31.00 basin, flipping the pressure into a clean bounce. Holding above 33.30 now acts as a fresh order block, letting the bulls stack liquidity for the next push. 🦈
⚡ Each step toward 34.00‑34.90 meets a fresh wave of buying, with volume expanding on the 4H chart. Confirmation comes as price steadies above the zone, signaling a potential breakout. 📌
💬 Are you ready to ride the surge or waiting for the next liquidity test? 👇
⚠️ Not financial advice. Always manage your risk. 🛡️
🏷️ #SMCIB #LongSetup #Bullish #Crypto
🔥 💎
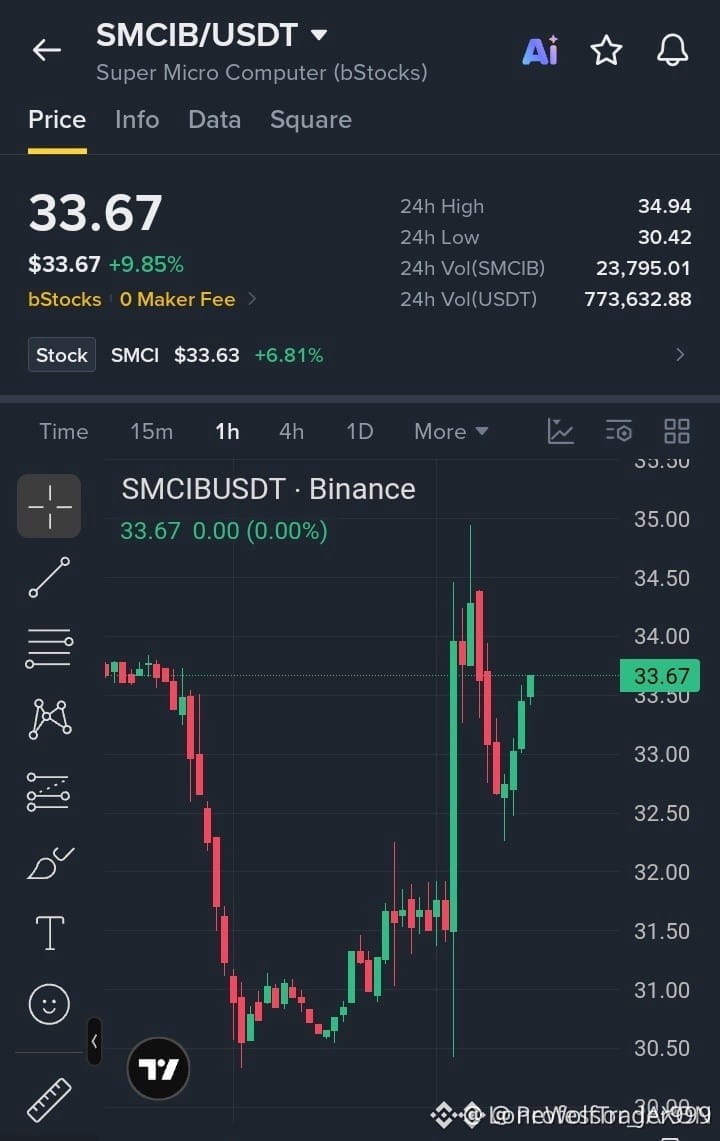
⚡ $SMCIB BUYERS SQUEEZE THE $38 CEILING AS EXPLOSIVE MOMENTUM ACCELERATES! 🐂
Entry: 37.30 - 37.70 ⚡
Target: 38.50 - 39.20 - 40.00 🚀
Stop Loss: 36.80 ⚠️
🌊 Relentless bid pressure launched price directly out of the $32 base, grinding thin offers away as aggressive market orders chew into the $38 resistance block.
📊 The order tape shows clean volume expansion on every dip, proving buyers are eager to front-run the major breakout rather than wait for deeper retests. 💬 Are you front-running this push into $40 or waiting for a clean daily close above $38? 👇
⚠️ Not financial advice. Always manage your risk. 🛡️
🏷️ #SMCIB #Breakout #LongSetup #Momentum #Crypto
🎯 🦈
⚡ $SMCIB BUYERS SQUEEZE THE $38 CEILING AS EXPLOSIVE MOMENTUM ACCELERATES! 🐂
Entry: 37.30 - 37.70 ⚡
Target: 38.50 - 39.20 - 40.00 🚀
Stop Loss: 36.80 ⚠️
🌊 Relentless bid pressure launched price directly out of the $32 base, grinding thin offers away as aggressive market orders chew into the $38 resistance block.
📊 The order tape shows clean volume expansion on every dip, proving buyers are eager to front-run the major breakout rather than wait for deeper retests. 💬 Are you front-running this push into $40 or waiting for a clean daily close above $38? 👇
⚠️ Not financial advice. Always manage your risk. 🛡️
🏷️ #SMCIB #Breakout #LongSetup #Momentum #Crypto
🎯 🦈
Entry: 37.30 - 37.70 ⚡
Target: 38.50 - 39.20 - 40.00 🚀
Stop Loss: 36.80 ⚠️
🌊 Relentless bid pressure launched price directly out of the $32 base, grinding thin offers away as aggressive market orders chew into the $38 resistance block.
📊 The order tape shows clean volume expansion on every dip, proving buyers are eager to front-run the major breakout rather than wait for deeper retests. 💬 Are you front-running this push into $40 or waiting for a clean daily close above $38? 👇
⚠️ Not financial advice. Always manage your risk. 🛡️
🏷️ #SMCIB #Breakout #LongSetup #Momentum #Crypto
🎯 🦈
1

·
--
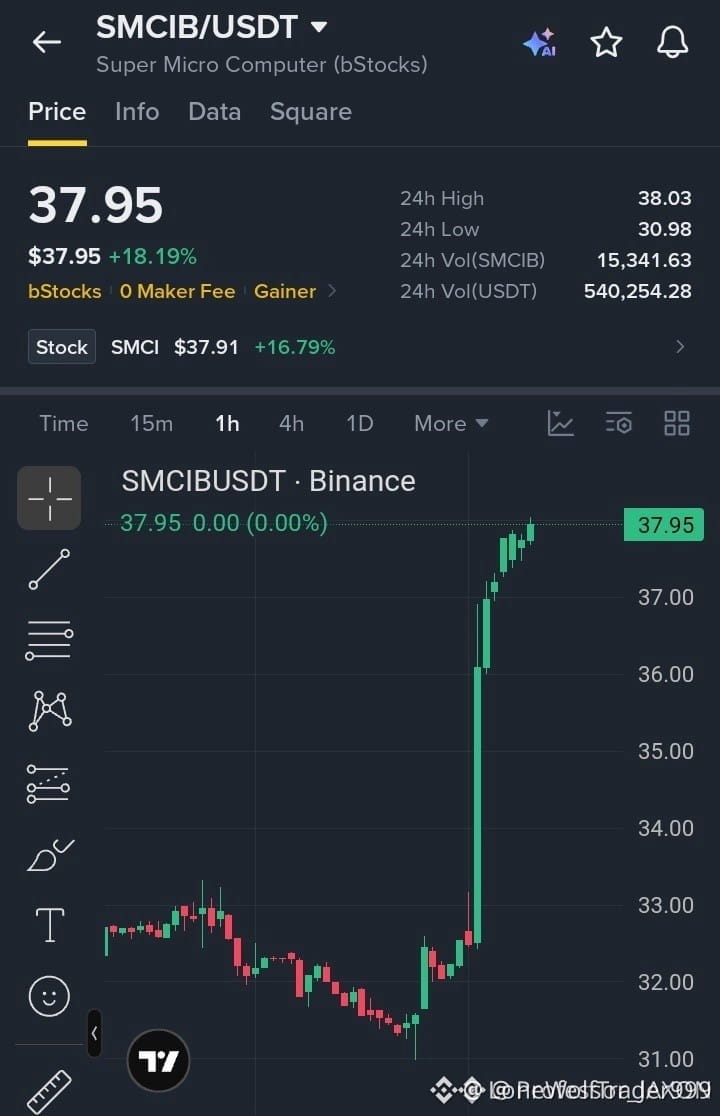
⚡ $SMCIB MOMENTUM EXPANDS TOWARD $38 RESISTANCE AS INSTITUTIONAL ACCUMULATION PRESSES HIGHER 📈
Entry: 37.30–37.70 ⚡
Target: 38.50, 39.20, 40.00 🎯
Stop Loss: 36.80 🛑
📌 Price action has engineered a deliberate sequence from the $32 base, steadily reclaiming supply and building an aggressive order flow posture against overhead structural resistance at $38. 📊 Sustained momentum reflects institutional absorption of sell-side inventory as market structure presses into the discount retest zone.
💡 Defending the 37.30 pivot protects the expansion thesis for a structural break above $38 toward untouched high-timeframe liquidity. 💬 Are you front-running the breakout above $38 or positioning on the discount mitigation? 👇
⚠️ Not financial advice. Always manage your risk. 🛡️
🏷️ #SMCIB #Breakout #TradingSetup #MarketStructure
🎯 🦈
⚡ $SMCIB MOMENTUM EXPANDS TOWARD $38 RESISTANCE AS INSTITUTIONAL ACCUMULATION PRESSES HIGHER 📈
Entry: 37.30–37.70 ⚡
Target: 38.50, 39.20, 40.00 🎯
Stop Loss: 36.80 🛑
📌 Price action has engineered a deliberate sequence from the $32 base, steadily reclaiming supply and building an aggressive order flow posture against overhead structural resistance at $38. 📊 Sustained momentum reflects institutional absorption of sell-side inventory as market structure presses into the discount retest zone.
💡 Defending the 37.30 pivot protects the expansion thesis for a structural break above $38 toward untouched high-timeframe liquidity. 💬 Are you front-running the breakout above $38 or positioning on the discount mitigation? 👇
⚠️ Not financial advice. Always manage your risk. 🛡️
🏷️ #SMCIB #Breakout #TradingSetup #MarketStructure
🎯 🦈
Entry: 37.30–37.70 ⚡
Target: 38.50, 39.20, 40.00 🎯
Stop Loss: 36.80 🛑
📌 Price action has engineered a deliberate sequence from the $32 base, steadily reclaiming supply and building an aggressive order flow posture against overhead structural resistance at $38. 📊 Sustained momentum reflects institutional absorption of sell-side inventory as market structure presses into the discount retest zone.
💡 Defending the 37.30 pivot protects the expansion thesis for a structural break above $38 toward untouched high-timeframe liquidity. 💬 Are you front-running the breakout above $38 or positioning on the discount mitigation? 👇
⚠️ Not financial advice. Always manage your risk. 🛡️
🏷️ #SMCIB #Breakout #TradingSetup #MarketStructure
🎯 🦈
4


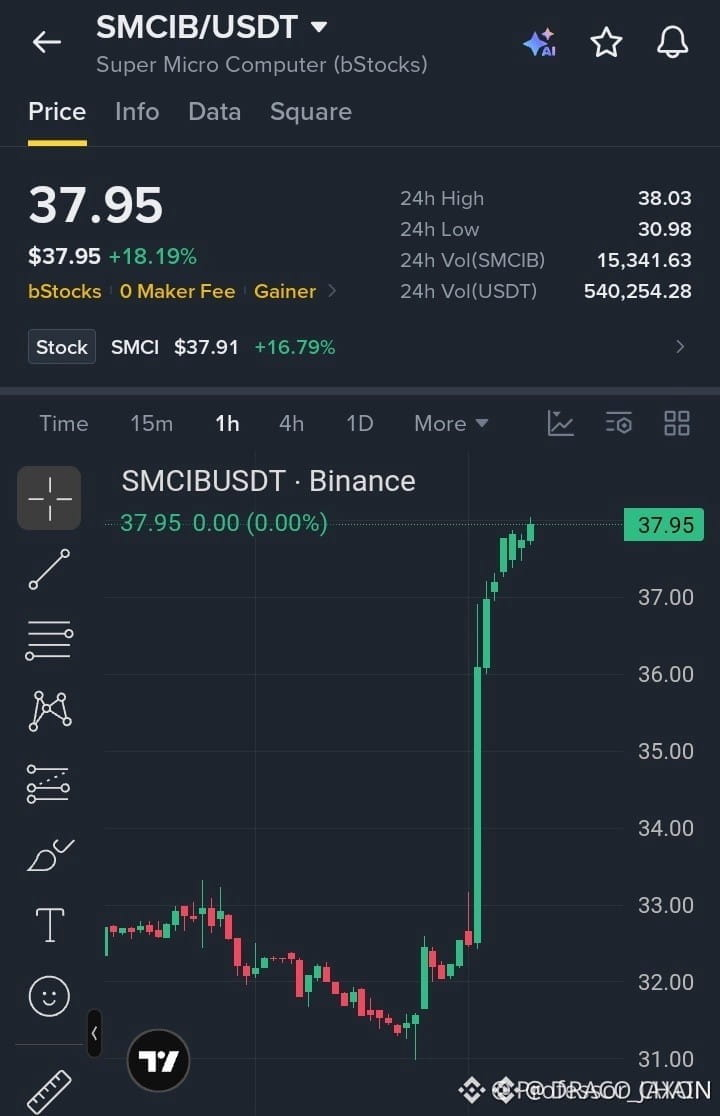
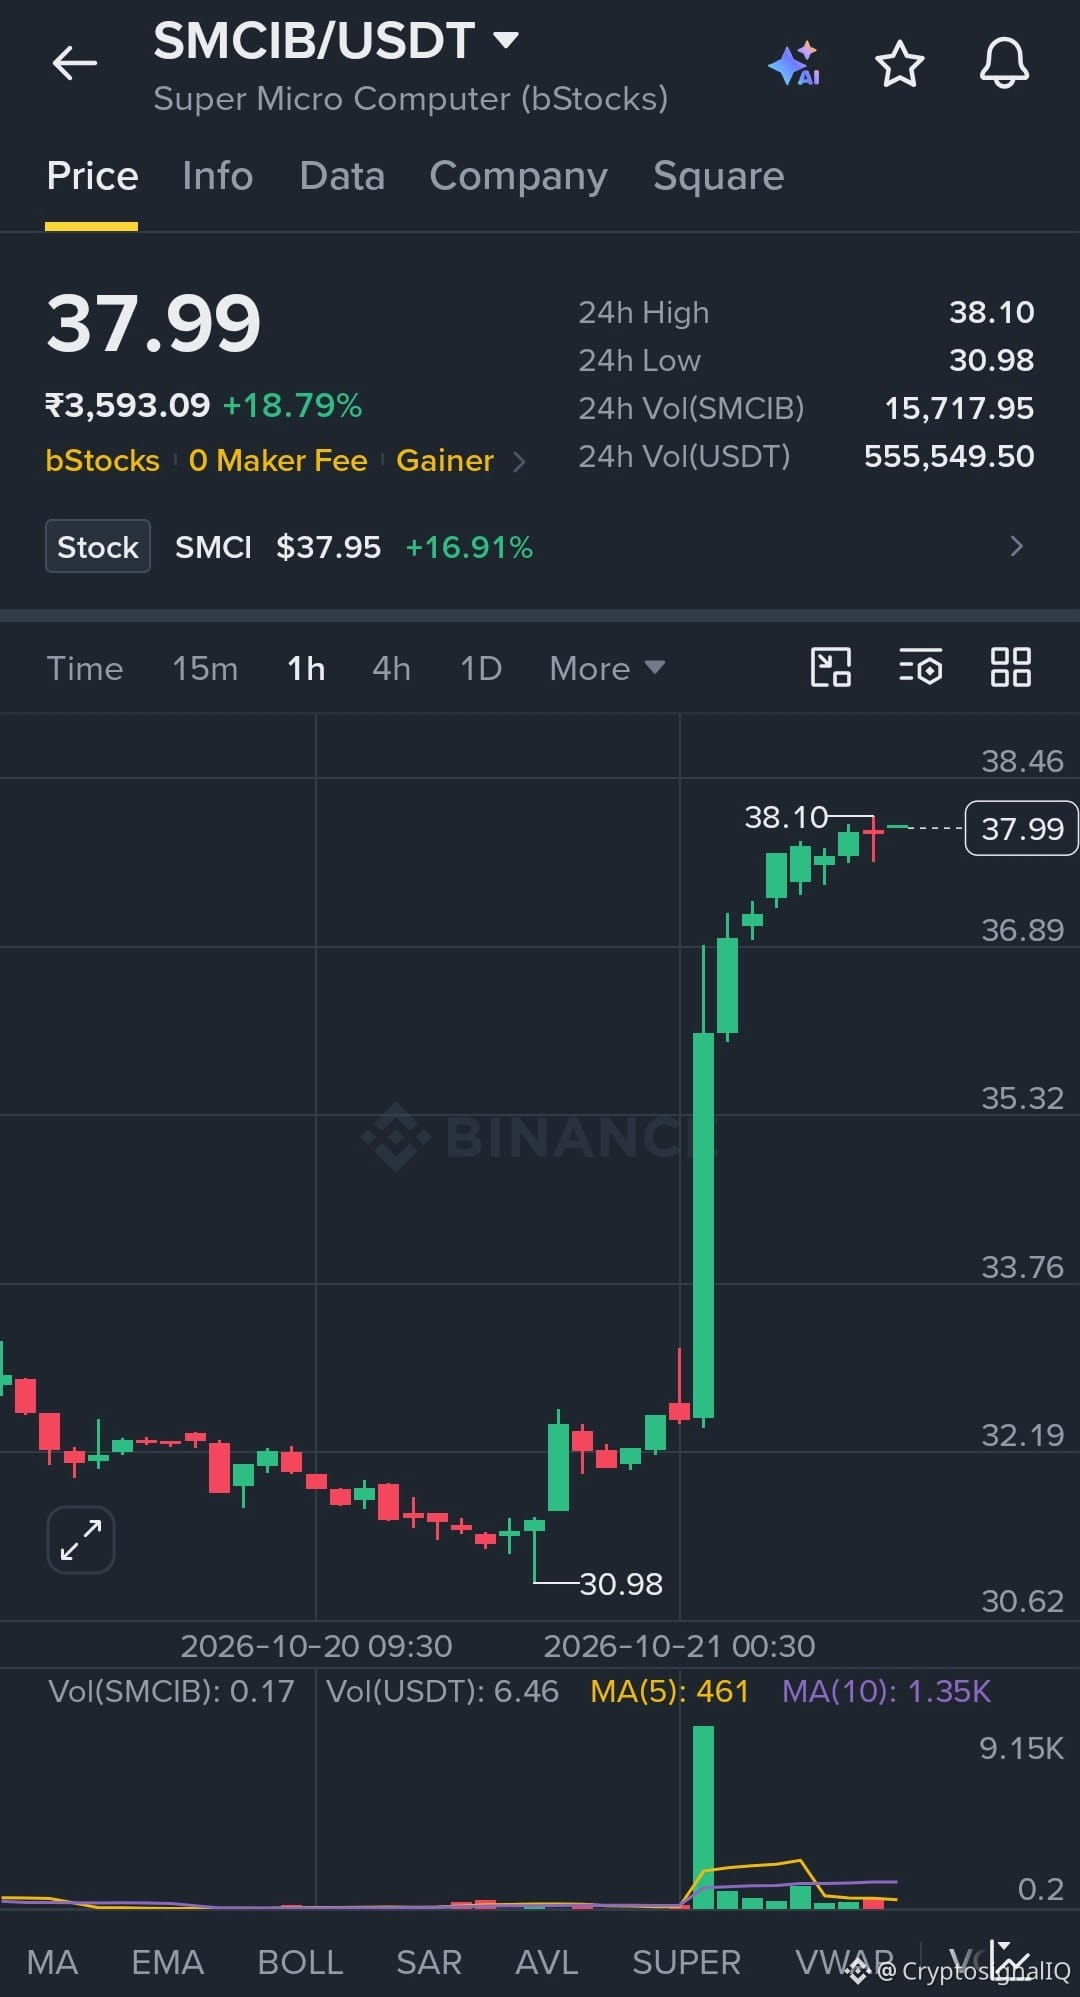
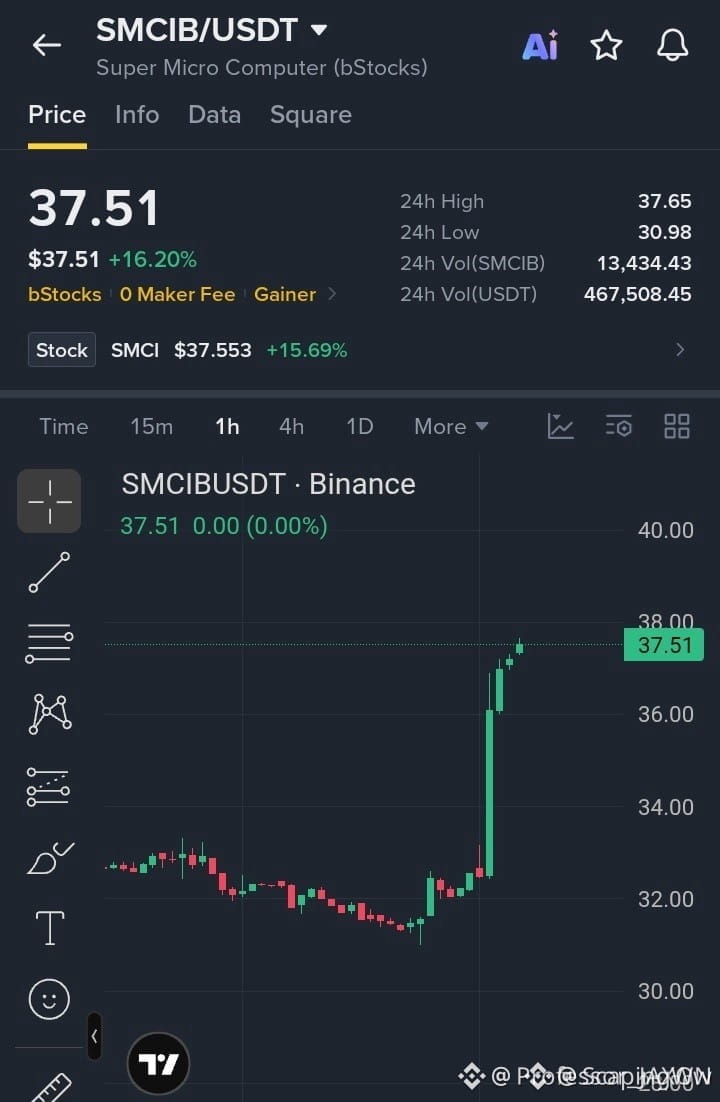
Guys, $SMCIB just surged +18.79% and is knocking on $38.10! 🚀🔥 One massive green candle changed the entire chart, and buyers are still holding near the highs. Is another breakout coming? 👀💥
🎯 TP1: $38.10
🎯 TP2: $39.00
🎯 TP3: $40.00
Don't FOMO into the spike, guys! ✅ The volume explosion confirms aggressive buying, but $38.10 is the immediate resistance to watch. A clean break could fuel another leg up — who's watching this move with me? 📈🔥
Trade #SMCIB here
{spot}(SMCIBUSDT)
$IOST
{future}(IOSTUSDT)
$JCT
{alpha}(560xea37a8de1de2d9d10772eeb569e28bfa5cb17707)
Guys, $SMCIB just surged +18.79% and is knocking on $38.10! 🚀🔥 One massive green candle changed the entire chart, and buyers are still holding near the highs. Is another breakout coming? 👀💥
🎯 TP1: $38.10
🎯 TP2: $39.00
🎯 TP3: $40.00
Don't FOMO into the spike, guys! ✅ The volume explosion confirms aggressive buying, but $38.10 is the immediate resistance to watch. A clean break could fuel another leg up — who's watching this move with me? 📈🔥
Trade #SMCIB here
$IOST
$JCT
🎯 TP1: $38.10
🎯 TP2: $39.00
🎯 TP3: $40.00
Don't FOMO into the spike, guys! ✅ The volume explosion confirms aggressive buying, but $38.10 is the immediate resistance to watch. A clean break could fuel another leg up — who's watching this move with me? 📈🔥
Trade #SMCIB here
$IOST
$JCT
1
54

·
--
Bullish
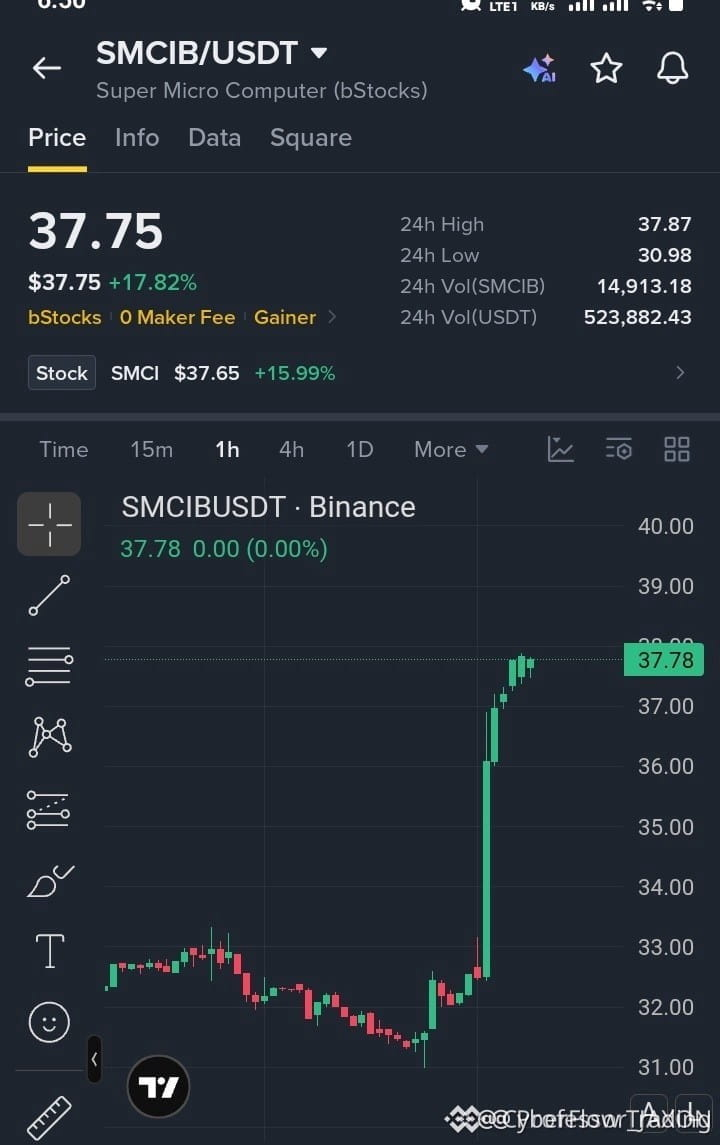
SMCIB/USDT Market Update (Strong Bullish Momentum!)
📈 Current Price: $37.94 (Rs 10,485.47)
🔥 24h Change: +18.16% 🚀
📊 24h High / Low: $38.03 / $30.98
💰 24h Volume: 15,340.04 SMCIB / 540,193.94 USDT Resistance / Support: Immediate resistance is at $38.03, while strong support lies between $30.98 and $33.28.
{spot}(SMCIBUSDT)
#SMCIB
SMCIB/USDT Market Update (Strong Bullish Momentum!)
📈 Current Price: $37.94 (Rs 10,485.47)
🔥 24h Change: +18.16% 🚀
📊 24h High / Low: $38.03 / $30.98
💰 24h Volume: 15,340.04 SMCIB / 540,193.94 USDT Resistance / Support: Immediate resistance is at $38.03, while strong support lies between $30.98 and $33.28.
#SMCIB
📈 Current Price: $37.94 (Rs 10,485.47)
🔥 24h Change: +18.16% 🚀
📊 24h High / Low: $38.03 / $30.98
💰 24h Volume: 15,340.04 SMCIB / 540,193.94 USDT Resistance / Support: Immediate resistance is at $38.03, while strong support lies between $30.98 and $33.28.
#SMCIB

1
51

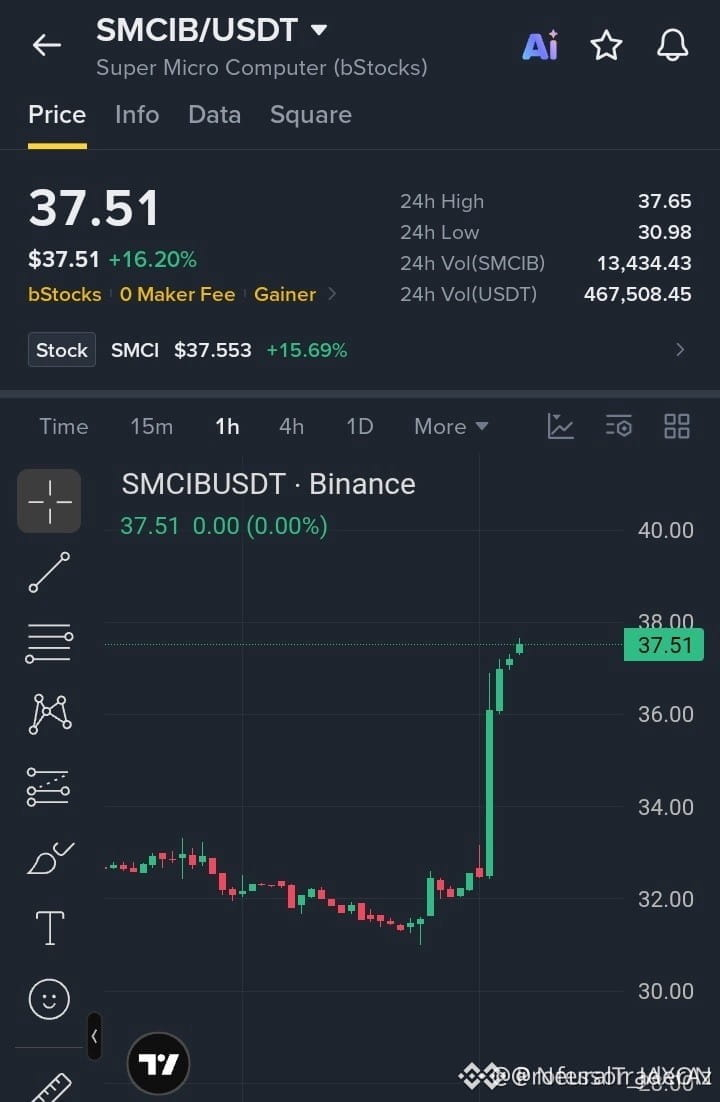
$SMCIB PRESSES THE $38 CEILING AS AGGRESSIVE BIDS UNLEASH CONTINUATION VELOCITY! ⚡📈
Entry: 37.20–37.60 🟢
Target: 38.20, 38.80, 39.50 🎯
Stop Loss: 36.70 🛑
📌 Buyers drove an unrelenting charge straight out of the $32 base, chewing through overhead supply and knocking squarely on the $38 breakout barrier. 📊 Order flow reveals relentless spot accumulation, turning prior resistance into a springboard for the next expansion leg.
💡 As long as bulls defend this consolidation pocket above the flip zone, momentum favors a decisive push past $39.50. 💬 Are you front-running this breakout candle, or waiting for the clean retest flip? 👇
⚠️ Not financial advice. Always manage your risk. 🛡️
🏷️ #SMCIB #Breakout #LongSetup #TradingSignals #Crypto
⚡ 🎯
$SMCIB PRESSES THE $38 CEILING AS AGGRESSIVE BIDS UNLEASH CONTINUATION VELOCITY! ⚡📈
Entry: 37.20–37.60 🟢
Target: 38.20, 38.80, 39.50 🎯
Stop Loss: 36.70 🛑
📌 Buyers drove an unrelenting charge straight out of the $32 base, chewing through overhead supply and knocking squarely on the $38 breakout barrier. 📊 Order flow reveals relentless spot accumulation, turning prior resistance into a springboard for the next expansion leg.
💡 As long as bulls defend this consolidation pocket above the flip zone, momentum favors a decisive push past $39.50. 💬 Are you front-running this breakout candle, or waiting for the clean retest flip? 👇
⚠️ Not financial advice. Always manage your risk. 🛡️
🏷️ #SMCIB #Breakout #LongSetup #TradingSignals #Crypto
⚡ 🎯
Entry: 37.20–37.60 🟢
Target: 38.20, 38.80, 39.50 🎯
Stop Loss: 36.70 🛑
📌 Buyers drove an unrelenting charge straight out of the $32 base, chewing through overhead supply and knocking squarely on the $38 breakout barrier. 📊 Order flow reveals relentless spot accumulation, turning prior resistance into a springboard for the next expansion leg.
💡 As long as bulls defend this consolidation pocket above the flip zone, momentum favors a decisive push past $39.50. 💬 Are you front-running this breakout candle, or waiting for the clean retest flip? 👇
⚠️ Not financial advice. Always manage your risk. 🛡️
🏷️ #SMCIB #Breakout #LongSetup #TradingSignals #Crypto
⚡ 🎯
5

·
--
$SMCIB
Here’s a decision you can use directly:
· Direction: It’s already rallied quite a bit, so chasing it now doesn’t make sense. Wait for a pullback.
· Entry: Consider entering if it stabilizes around 35.27 after a pullback.
· Stop-loss: Exit if it falls below 34.54.
· Position size: No more than 5% of your total capital.
Its underlying asset is Super Micro Computer (SMCI)—an actual U.S. stock, held in 1:1 custody and tradable 24/7. Don’t confuse short-term fluctuations in the token with the stock’s fundamentals.
(Personal analysis; not investment advice.)
#SMCIB
$SMCIB
Here’s a decision you can use directly:
· Direction: It’s already rallied quite a bit, so chasing it now doesn’t make sense. Wait for a pullback.
· Entry: Consider entering if it stabilizes around 35.27 after a pullback.
· Stop-loss: Exit if it falls below 34.54.
· Position size: No more than 5% of your total capital.
Its underlying asset is Super Micro Computer (SMCI)—an actual U.S. stock, held in 1:1 custody and tradable 24/7. Don’t confuse short-term fluctuations in the token with the stock’s fundamentals.
(Personal analysis; not investment advice.)
#SMCIB
Here’s a decision you can use directly:
· Direction: It’s already rallied quite a bit, so chasing it now doesn’t make sense. Wait for a pullback.
· Entry: Consider entering if it stabilizes around 35.27 after a pullback.
· Stop-loss: Exit if it falls below 34.54.
· Position size: No more than 5% of your total capital.
Its underlying asset is Super Micro Computer (SMCI)—an actual U.S. stock, held in 1:1 custody and tradable 24/7. Don’t confuse short-term fluctuations in the token with the stock’s fundamentals.
(Personal analysis; not investment advice.)
#SMCIB
42

⚡ $SMCIB BREAKS KEY RESISTANCE AS INSTITUTIONAL ORDER FLOW ACCELERATES! 🦈
Entry: 36.80–37.20 ⚡
Target: 38.00 / 38.80 / 39.50 🎯
Stop Loss: 36.20 ⚠️
📌 The impulsive displacement from the $32 base swept resting buy-side liquidity and flipped local market structure firmly bullish. 📊 Sustained acceptance above the 36.80–37.20 retest zone confirms high-volume absorption, positioning price to target overhead structural inefficiencies.
💡 Risk parameters remain clearly defined against the 36.20 invalidation, neutralizing exposure against sudden volatility traps. 💬 Are you treating this pullback as prime mitigation, or waiting for a deeper liquidity sweep? 👇
⚠️ Not financial advice. Always manage your risk. 🛡️
🏷️ #SMCIB #Breakout #CryptoTrading #PriceAction
🎯 🦈
⚡ $SMCIB BREAKS KEY RESISTANCE AS INSTITUTIONAL ORDER FLOW ACCELERATES! 🦈
Entry: 36.80–37.20 ⚡
Target: 38.00 / 38.80 / 39.50 🎯
Stop Loss: 36.20 ⚠️
📌 The impulsive displacement from the $32 base swept resting buy-side liquidity and flipped local market structure firmly bullish. 📊 Sustained acceptance above the 36.80–37.20 retest zone confirms high-volume absorption, positioning price to target overhead structural inefficiencies.
💡 Risk parameters remain clearly defined against the 36.20 invalidation, neutralizing exposure against sudden volatility traps. 💬 Are you treating this pullback as prime mitigation, or waiting for a deeper liquidity sweep? 👇
⚠️ Not financial advice. Always manage your risk. 🛡️
🏷️ #SMCIB #Breakout #CryptoTrading #PriceAction
🎯 🦈
Entry: 36.80–37.20 ⚡
Target: 38.00 / 38.80 / 39.50 🎯
Stop Loss: 36.20 ⚠️
📌 The impulsive displacement from the $32 base swept resting buy-side liquidity and flipped local market structure firmly bullish. 📊 Sustained acceptance above the 36.80–37.20 retest zone confirms high-volume absorption, positioning price to target overhead structural inefficiencies.
💡 Risk parameters remain clearly defined against the 36.20 invalidation, neutralizing exposure against sudden volatility traps. 💬 Are you treating this pullback as prime mitigation, or waiting for a deeper liquidity sweep? 👇
⚠️ Not financial advice. Always manage your risk. 🛡️
🏷️ #SMCIB #Breakout #CryptoTrading #PriceAction
🎯 🦈
15

·
--
⚡ $SMCIB SHATTERS RESISTANCE WITH EXPLOSIVE VELOCITY AND BULLS ARE HUNGRY FOR MORE! 💥
Entry: 36.80–37.20 ⚡
Target: 38.00 / 38.80 / 39.50 🚀
Stop Loss: 36.20 ⚠️
📌 Buyers tore clean through overhead supply from the $32 base, converting prior resistance into a firm launchpad. As long as the bid holds above the 36.00 handle, order flow favors immediate continuation toward overhead liquidity.
📊 The momentum flip is undeniable, though chasing vertical candles carries friction after such an aggressive expansion. 💡 Patience around the retest zone offers an asymmetric edge to ride the next leg. 💬 Are you bidding this shallow consolidation or waiting for a deeper sweep? 👇
⚠️ Not financial advice. Always manage your risk. 🛡️
🏷️ #SMCIB #Breakout #LongSetup #Trading
🎯 ⚡
⚡ $SMCIB SHATTERS RESISTANCE WITH EXPLOSIVE VELOCITY AND BULLS ARE HUNGRY FOR MORE! 💥
Entry: 36.80–37.20 ⚡
Target: 38.00 / 38.80 / 39.50 🚀
Stop Loss: 36.20 ⚠️
📌 Buyers tore clean through overhead supply from the $32 base, converting prior resistance into a firm launchpad. As long as the bid holds above the 36.00 handle, order flow favors immediate continuation toward overhead liquidity.
📊 The momentum flip is undeniable, though chasing vertical candles carries friction after such an aggressive expansion. 💡 Patience around the retest zone offers an asymmetric edge to ride the next leg. 💬 Are you bidding this shallow consolidation or waiting for a deeper sweep? 👇
⚠️ Not financial advice. Always manage your risk. 🛡️
🏷️ #SMCIB #Breakout #LongSetup #Trading
🎯 ⚡
Entry: 36.80–37.20 ⚡
Target: 38.00 / 38.80 / 39.50 🚀
Stop Loss: 36.20 ⚠️
📌 Buyers tore clean through overhead supply from the $32 base, converting prior resistance into a firm launchpad. As long as the bid holds above the 36.00 handle, order flow favors immediate continuation toward overhead liquidity.
📊 The momentum flip is undeniable, though chasing vertical candles carries friction after such an aggressive expansion. 💡 Patience around the retest zone offers an asymmetric edge to ride the next leg. 💬 Are you bidding this shallow consolidation or waiting for a deeper sweep? 👇
⚠️ Not financial advice. Always manage your risk. 🛡️
🏷️ #SMCIB #Breakout #LongSetup #Trading
🎯 ⚡
11

·
--
Bullish
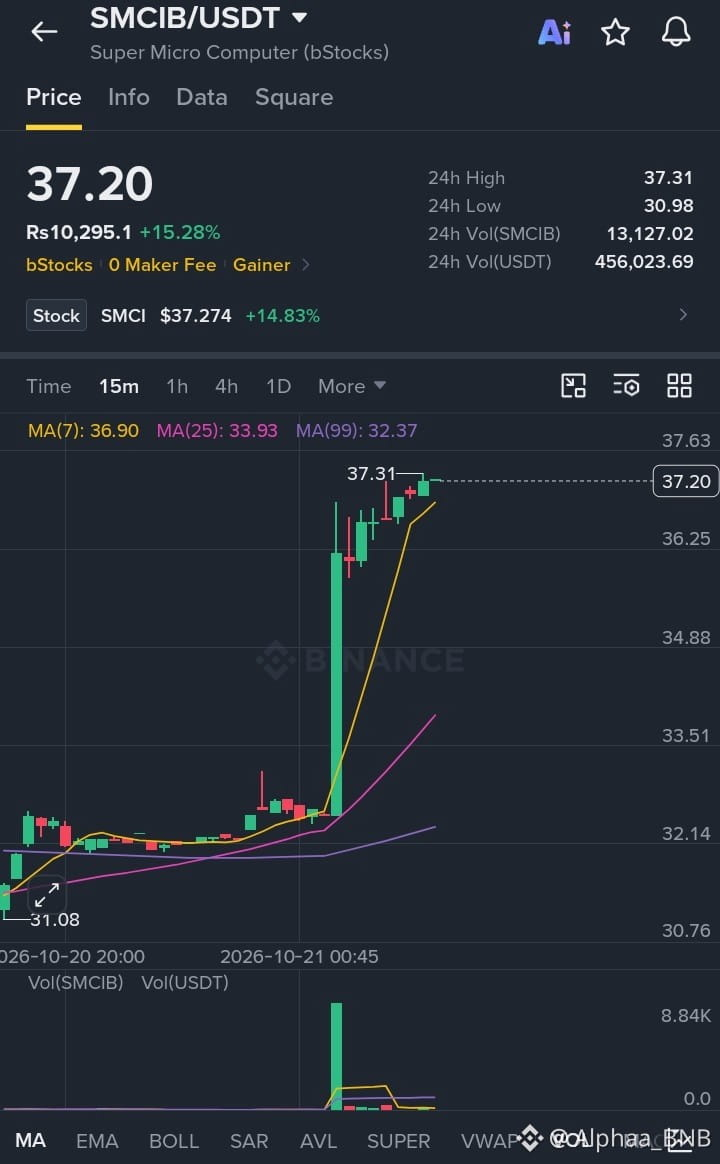
🚀 *$SMCIB / USDT*
*Super Micro Computer Explodes +15.28%! Ready For New High*
*Trade Setup: Long 🟢*
*Entry Zone:* 36.90 - 37.20
*TP1:* 37.31 (24H High)
*TP2:* 38.50
*TP3:* 40.00
*Stop Loss:* 35.80
$SMCIB is on fire on the 15m chart! Massive green candle with huge volume breakout, price trading above all MAs - MA(7): 36.90, MA(25): 33.93, MA(99): 32.37 - pure bullish momentum! 📈
Stock SMCI $37.274 +14.83% and bStocks Rs 10,295.1 +15.28% as Top Gainer! Price pumped from $31.08 bottom straight to $37.31 High - Buyers are in full control, next leg towards $40 loading!
*Trade Here On $SMCIB 👇*
#SMCIB #SMCI #SwitzerlandApprovesFirstBitcoinETF #Gainer
{spot}(SMCIBUSDT)
🚀 *$SMCIB / USDT*
*Super Micro Computer Explodes +15.28%! Ready For New High*
*Trade Setup: Long 🟢*
*Entry Zone:* 36.90 - 37.20
*TP1:* 37.31 (24H High)
*TP2:* 38.50
*TP3:* 40.00
*Stop Loss:* 35.80
$SMCIB is on fire on the 15m chart! Massive green candle with huge volume breakout, price trading above all MAs - MA(7): 36.90, MA(25): 33.93, MA(99): 32.37 - pure bullish momentum! 📈
Stock SMCI $37.274 +14.83% and bStocks Rs 10,295.1 +15.28% as Top Gainer! Price pumped from $31.08 bottom straight to $37.31 High - Buyers are in full control, next leg towards $40 loading!
*Trade Here On $SMCIB 👇*
#SMCIB #SMCI #SwitzerlandApprovesFirstBitcoinETF #Gainer
*Super Micro Computer Explodes +15.28%! Ready For New High*
*Trade Setup: Long 🟢*
*Entry Zone:* 36.90 - 37.20
*TP1:* 37.31 (24H High)
*TP2:* 38.50
*TP3:* 40.00
*Stop Loss:* 35.80
$SMCIB is on fire on the 15m chart! Massive green candle with huge volume breakout, price trading above all MAs - MA(7): 36.90, MA(25): 33.93, MA(99): 32.37 - pure bullish momentum! 📈
Stock SMCI $37.274 +14.83% and bStocks Rs 10,295.1 +15.28% as Top Gainer! Price pumped from $31.08 bottom straight to $37.31 High - Buyers are in full control, next leg towards $40 loading!
*Trade Here On $SMCIB 👇*
#SMCIB #SMCI #SwitzerlandApprovesFirstBitcoinETF #Gainer
2
49

·
--
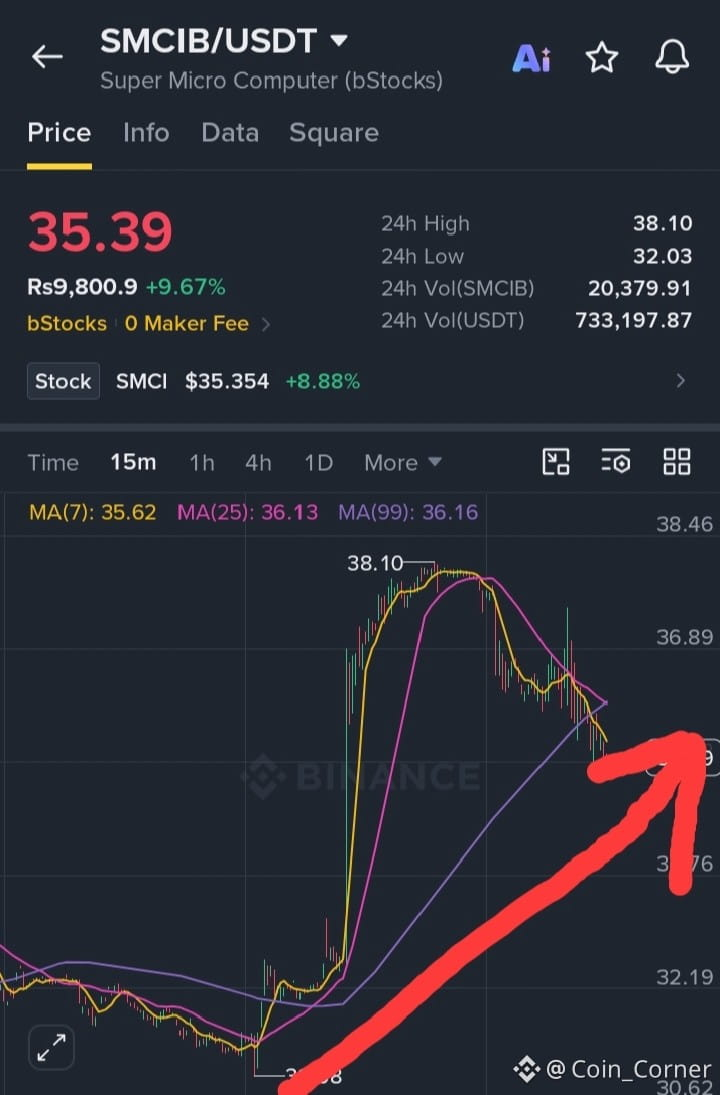
SMCIB spot market: At the 04:35 Beijing-time close on 2026-10-21, 5m +11.16%. At the 04:35:01 observation on 2026-10-21, the current price was 36.19, 24h turnover was 367.2K, price was above VWAP 34.9245, and volume was 3,758.6x. Here are the data points. Specifically, the current price, trading volume, and indicator position define the initial boundaries.
Can the pullback hold above VWAP 34.9245? After volume surged to 3,758.6x, can it stay elevated? Don’t just look at whether it moved—watch whether it holds its ground afterward.
#SMCIB #Unusual Movement Alert
SMCIB spot market: At the 04:35 Beijing-time close on 2026-10-21, 5m +11.16%. At the 04:35:01 observation on 2026-10-21, the current price was 36.19, 24h turnover was 367.2K, price was above VWAP 34.9245, and volume was 3,758.6x. Here are the data points. Specifically, the current price, trading volume, and indicator position define the initial boundaries.
Can the pullback hold above VWAP 34.9245? After volume surged to 3,758.6x, can it stay elevated? Don’t just look at whether it moved—watch whether it holds its ground afterward.
#SMCIB #Unusual Movement Alert
Can the pullback hold above VWAP 34.9245? After volume surged to 3,758.6x, can it stay elevated? Don’t just look at whether it moved—watch whether it holds its ground afterward.
#SMCIB #Unusual Movement Alert
6

·
--
🎯 Technical Trading Opportunity Analysis | $SMCIB ⚡ SMCIBUSDT
📊 Technical pattern: Bearish structural breakdown and retest of resistance zones
📈 Expected direction: Sell and correction (SHORT 🔴)
⏱️ Expected timeframe: 24–48 hours (Swing)
💵 Current price: $34.1500
🔹 Suggested entry range: $34.3207 - $33.9793
🎯 First target (TP1): $32.9547 (-3.5%)
🎯 Second target (TP2): $31.9303 (-6.5%)
🎯 Third target (TP3): $30.5642 (-10.5%)
🛑 Stop loss (SL): $35.0037 (+2.5%)
⚖️ Risk-to-reward ratio (R:R): 1 : 2.6 (Target 2) | 1 : 4.2 (Target 3)
📌 Quick project overview:
• Sector: Stocks | Rank: #1736
• MCap: $1.6M | Circ: 100.0% | Age: 72d
• ATH: $45.7100 | ATL: $29.2900
🔍 Key technical drivers:
• An extended rally is facing strong selling pressure at technical resistance levels.
• A notable slowdown in buying volume, alongside clear reversal signals in liquidity indicators.
⚠️ This analysis is for educational and informational purposes only. Always follow sound capital management practices. #DYOR
#SMCIB #BlackRockCryptoAssetsJump63
━━━━━━━━━━━━━━
📌 Follow the main account for copy trading and live analysis: @tech4c
📌 Follow main account & copy trades: @tech4c
🎯 Technical Trading Opportunity Analysis | $SMCIB ⚡ SMCIBUSDT
📊 Technical pattern: Bearish structural breakdown and retest of resistance zones
📈 Expected direction: Sell and correction (SHORT 🔴)
⏱️ Expected timeframe: 24–48 hours (Swing)
💵 Current price: $34.1500
🔹 Suggested entry range: $34.3207 - $33.9793
🎯 First target (TP1): $32.9547 (-3.5%)
🎯 Second target (TP2): $31.9303 (-6.5%)
🎯 Third target (TP3): $30.5642 (-10.5%)
🛑 Stop loss (SL): $35.0037 (+2.5%)
⚖️ Risk-to-reward ratio (R:R): 1 : 2.6 (Target 2) | 1 : 4.2 (Target 3)
📌 Quick project overview:
• Sector: Stocks | Rank: #1736
• MCap: $1.6M | Circ: 100.0% | Age: 72d
• ATH: $45.7100 | ATL: $29.2900
🔍 Key technical drivers:
• An extended rally is facing strong selling pressure at technical resistance levels.
• A notable slowdown in buying volume, alongside clear reversal signals in liquidity indicators.
⚠️ This analysis is for educational and informational purposes only. Always follow sound capital management practices. #DYOR
#SMCIB #BlackRockCryptoAssetsJump63
━━━━━━━━━━━━━━
📌 Follow the main account for copy trading and live analysis: @tech4c
📌 Follow main account & copy trades: @tech4c
📊 Technical pattern: Bearish structural breakdown and retest of resistance zones
📈 Expected direction: Sell and correction (SHORT 🔴)
⏱️ Expected timeframe: 24–48 hours (Swing)
💵 Current price: $34.1500
🔹 Suggested entry range: $34.3207 - $33.9793
🎯 First target (TP1): $32.9547 (-3.5%)
🎯 Second target (TP2): $31.9303 (-6.5%)
🎯 Third target (TP3): $30.5642 (-10.5%)
🛑 Stop loss (SL): $35.0037 (+2.5%)
⚖️ Risk-to-reward ratio (R:R): 1 : 2.6 (Target 2) | 1 : 4.2 (Target 3)
📌 Quick project overview:
• Sector: Stocks | Rank: #1736
• MCap: $1.6M | Circ: 100.0% | Age: 72d
• ATH: $45.7100 | ATL: $29.2900
🔍 Key technical drivers:
• An extended rally is facing strong selling pressure at technical resistance levels.
• A notable slowdown in buying volume, alongside clear reversal signals in liquidity indicators.
⚠️ This analysis is for educational and informational purposes only. Always follow sound capital management practices. #DYOR
#SMCIB #BlackRockCryptoAssetsJump63
━━━━━━━━━━━━━━
📌 Follow the main account for copy trading and live analysis: @tech4c
📌 Follow main account & copy trades: @tech4c
41

·
--
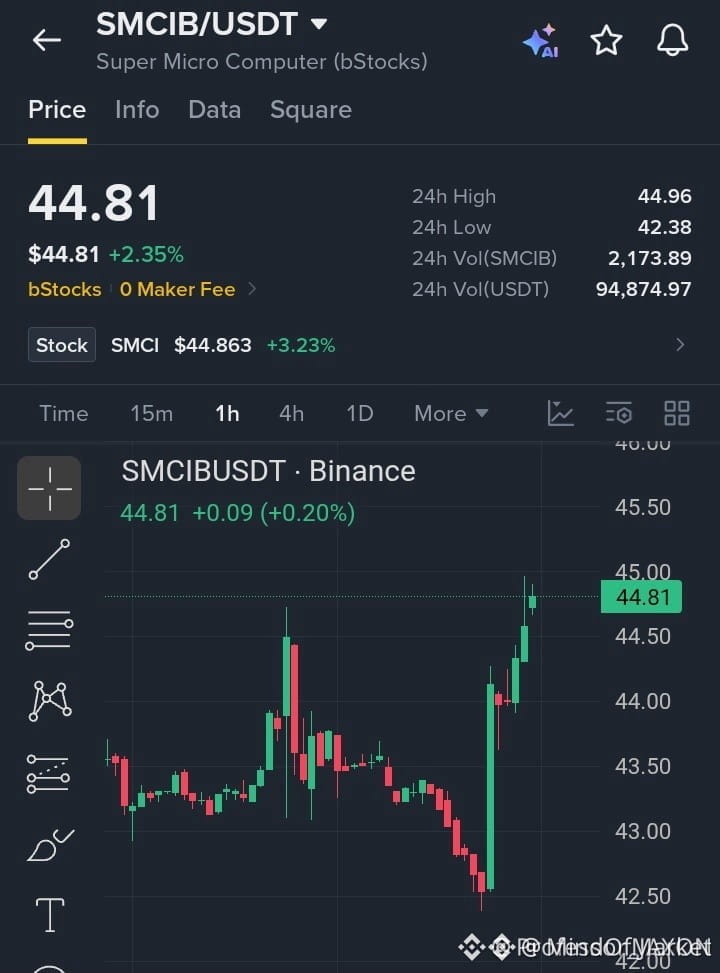
💥 $SMCIB RECLAIMS KEY STRUCTURE AT $44.50 AS BUYERS TARGET INSTITUTIONAL RESISTANCE 🚀
Entry: 44.50 - 44.85 ⚡
Target: 45.20 / 45.80 / 46.50 🚀
Stop Loss: 43.90 ⚠️
After a sharp liquidity sweep near the $42.50 demand zone, $SMCIB aggressively reclaimed the $44.50 structural pivot. 📊 Order flow has shifted back into buyer hands, converting previous resistance into a firm support block.
As long as price holds above $44.50, market structure favors a continued expansion toward upper liquidity pools at $45.80 and $46.50. 💡 Institutional participation on this retest suggests solid conviction for the next leg upward. 💬 Are you bidding this range reclaim or waiting for further confirmation? 👇
⚠️ Not financial advice. Always manage your risk. 🛡️
🏷️ #SMCIB #LongSetup #Crypto #Breakout
🎯 🦈
💥 $SMCIB RECLAIMS KEY STRUCTURE AT $44.50 AS BUYERS TARGET INSTITUTIONAL RESISTANCE 🚀
Entry: 44.50 - 44.85 ⚡
Target: 45.20 / 45.80 / 46.50 🚀
Stop Loss: 43.90 ⚠️
After a sharp liquidity sweep near the $42.50 demand zone, $SMCIB aggressively reclaimed the $44.50 structural pivot. 📊 Order flow has shifted back into buyer hands, converting previous resistance into a firm support block.
As long as price holds above $44.50, market structure favors a continued expansion toward upper liquidity pools at $45.80 and $46.50. 💡 Institutional participation on this retest suggests solid conviction for the next leg upward. 💬 Are you bidding this range reclaim or waiting for further confirmation? 👇
⚠️ Not financial advice. Always manage your risk. 🛡️
🏷️ #SMCIB #LongSetup #Crypto #Breakout
🎯 🦈
Entry: 44.50 - 44.85 ⚡
Target: 45.20 / 45.80 / 46.50 🚀
Stop Loss: 43.90 ⚠️
After a sharp liquidity sweep near the $42.50 demand zone, $SMCIB aggressively reclaimed the $44.50 structural pivot. 📊 Order flow has shifted back into buyer hands, converting previous resistance into a firm support block.
As long as price holds above $44.50, market structure favors a continued expansion toward upper liquidity pools at $45.80 and $46.50. 💡 Institutional participation on this retest suggests solid conviction for the next leg upward. 💬 Are you bidding this range reclaim or waiting for further confirmation? 👇
⚠️ Not financial advice. Always manage your risk. 🛡️
🏷️ #SMCIB #LongSetup #Crypto #Breakout
🎯 🦈
9

·
--
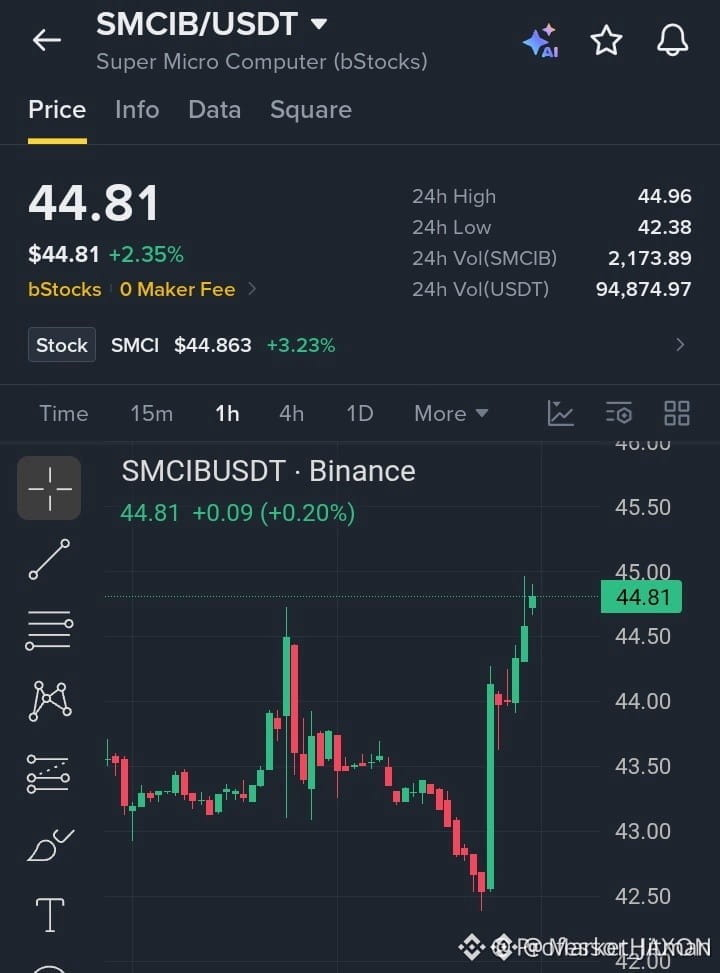
🚀 $SMCIB FLIPS $44.50 INTO SUPPORT AS BULLS CHARGE TOWARD HIGHER RESISTANCE! 💥
Entry: 44.50 - 44.85 ⚡
Target: 45.20 - 46.50 🚀
Stop Loss: 43.90 ⚠️
📌 Sellers lost control after $SMCIB carved out a clean floor at $42.50 and reclaimed the critical $44.50 level with high breakout momentum. 📊
⚡ As long as price holds above $44.50, market structure remains decisively bullish, setting up a clean continuation squeeze toward the upper overhead supply zone. 💡
💬 Are you catching this momentum move now or waiting for a retest before bidding? 👇
⚠️ Not financial advice. Always manage your risk. 🛡️
🏷️ #SMCIB #LongSetup #Breakout #Crypto
🔥 ⚡
🚀 $SMCIB FLIPS $44.50 INTO SUPPORT AS BULLS CHARGE TOWARD HIGHER RESISTANCE! 💥
Entry: 44.50 - 44.85 ⚡
Target: 45.20 - 46.50 🚀
Stop Loss: 43.90 ⚠️
📌 Sellers lost control after $SMCIB carved out a clean floor at $42.50 and reclaimed the critical $44.50 level with high breakout momentum. 📊
⚡ As long as price holds above $44.50, market structure remains decisively bullish, setting up a clean continuation squeeze toward the upper overhead supply zone. 💡
💬 Are you catching this momentum move now or waiting for a retest before bidding? 👇
⚠️ Not financial advice. Always manage your risk. 🛡️
🏷️ #SMCIB #LongSetup #Breakout #Crypto
🔥 ⚡
Entry: 44.50 - 44.85 ⚡
Target: 45.20 - 46.50 🚀
Stop Loss: 43.90 ⚠️
📌 Sellers lost control after $SMCIB carved out a clean floor at $42.50 and reclaimed the critical $44.50 level with high breakout momentum. 📊
⚡ As long as price holds above $44.50, market structure remains decisively bullish, setting up a clean continuation squeeze toward the upper overhead supply zone. 💡
💬 Are you catching this momentum move now or waiting for a retest before bidding? 👇
⚠️ Not financial advice. Always manage your risk. 🛡️
🏷️ #SMCIB #LongSetup #Breakout #Crypto
🔥 ⚡
17

·
--
Bullish
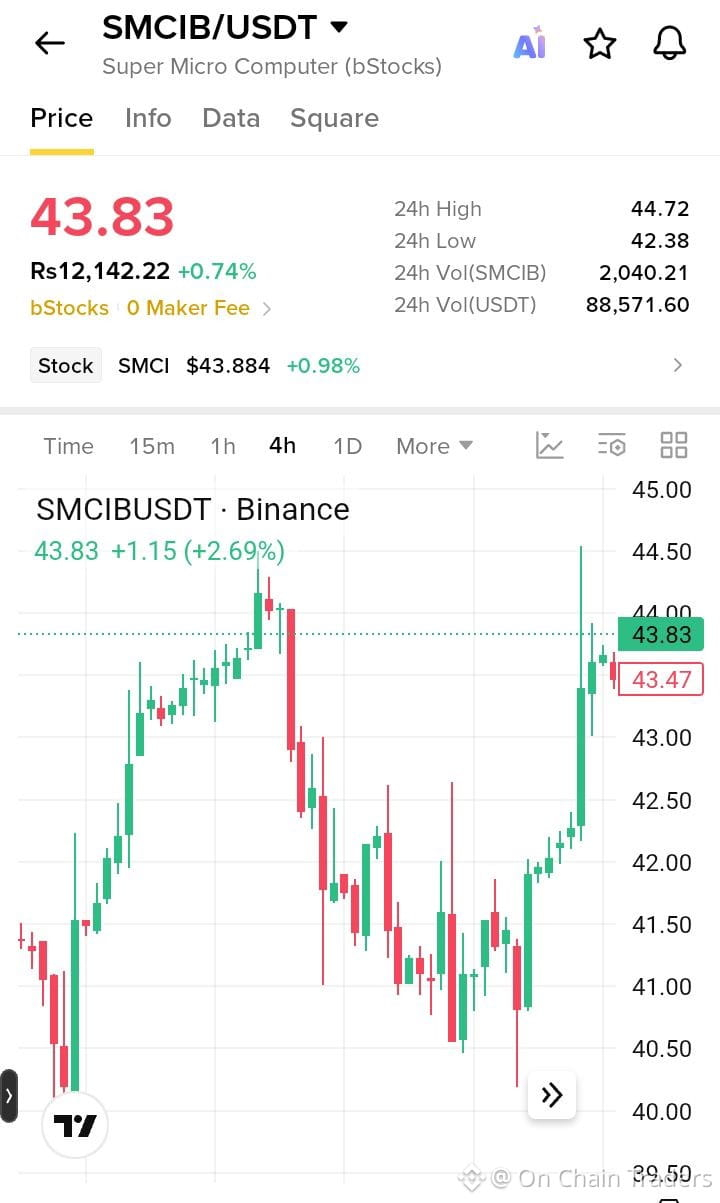
$SMCIB is holding strong near $43.83 with buyers defending the $43.50 zone. A clean break above $44.50 could push toward 🎯 $45.00 → $46.00. Below $43.00, momentum may cool. Bias: Bullish above $43.50.
Entry: $43.50–$44.00 | SL: $42.80
#SMCIB
{spot}(SMCIBUSDT)
$SMCIB is holding strong near $43.83 with buyers defending the $43.50 zone. A clean break above $44.50 could push toward 🎯 $45.00 → $46.00. Below $43.00, momentum may cool. Bias: Bullish above $43.50.
Entry: $43.50–$44.00 | SL: $42.80
#SMCIB
Entry: $43.50–$44.00 | SL: $42.80
#SMCIB
1
77
·
--
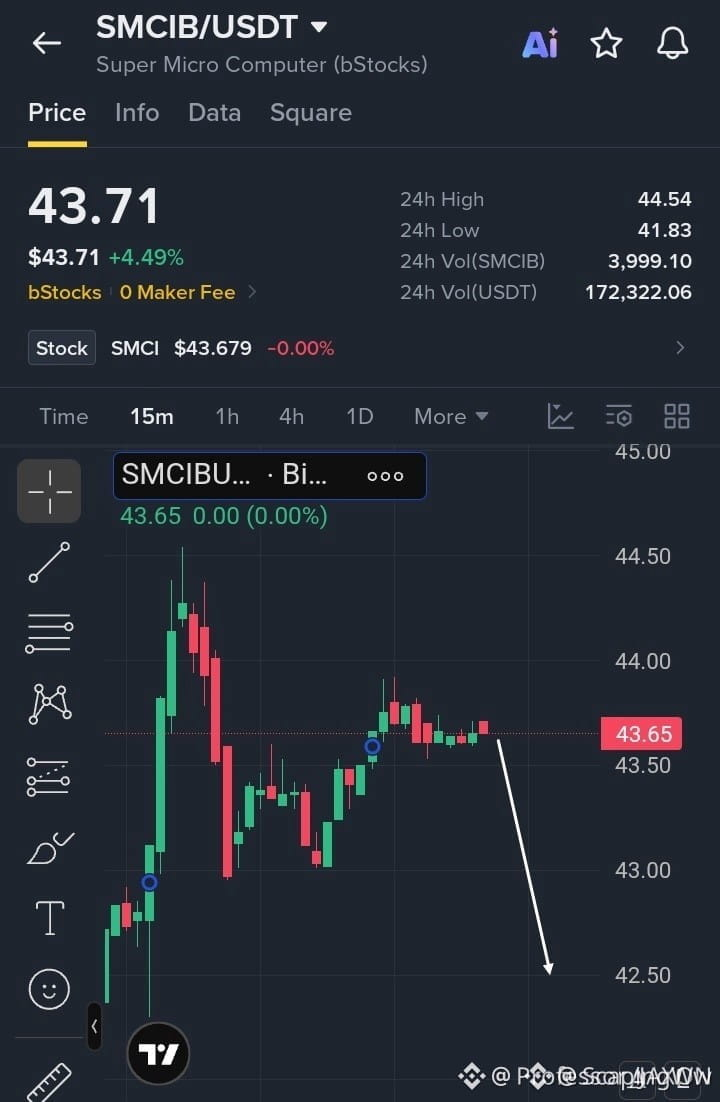
🚨 $SMCIB REJECTED AT CRITICAL RESISTANCE AS SELLER MOMENTUM ACCELERATES DOWNWARD! 📉
Entry: 43.60 - 43.75 ⚡
Target: 43.20 🎯
Stop Loss: 44.05 ⚠️
📌 The supply zone around $43.70 just slammed the door on buyers, leaving momentum visibly draining on the short-term timeframes. 📊 As order flow shifts toward aggressive market sellers, the immediate support line is hanging by a thread.
💡 A clean break beneath this consolidation shelf opens up a direct path toward lower liquidity pockets. 💬 Are you waiting for a confirmed retest or taking position on the immediate breakdown? 👇
⚠️ Not financial advice. Always manage your risk. 🛡️
🏷️ #SMCIB #ShortSetup #Crypto #Bearish
📉 🐻
🚨 $SMCIB REJECTED AT CRITICAL RESISTANCE AS SELLER MOMENTUM ACCELERATES DOWNWARD! 📉
Entry: 43.60 - 43.75 ⚡
Target: 43.20 🎯
Stop Loss: 44.05 ⚠️
📌 The supply zone around $43.70 just slammed the door on buyers, leaving momentum visibly draining on the short-term timeframes. 📊 As order flow shifts toward aggressive market sellers, the immediate support line is hanging by a thread.
💡 A clean break beneath this consolidation shelf opens up a direct path toward lower liquidity pockets. 💬 Are you waiting for a confirmed retest or taking position on the immediate breakdown? 👇
⚠️ Not financial advice. Always manage your risk. 🛡️
🏷️ #SMCIB #ShortSetup #Crypto #Bearish
📉 🐻
Entry: 43.60 - 43.75 ⚡
Target: 43.20 🎯
Stop Loss: 44.05 ⚠️
📌 The supply zone around $43.70 just slammed the door on buyers, leaving momentum visibly draining on the short-term timeframes. 📊 As order flow shifts toward aggressive market sellers, the immediate support line is hanging by a thread.
💡 A clean break beneath this consolidation shelf opens up a direct path toward lower liquidity pockets. 💬 Are you waiting for a confirmed retest or taking position on the immediate breakdown? 👇
⚠️ Not financial advice. Always manage your risk. 🛡️
🏷️ #SMCIB #ShortSetup #Crypto #Bearish
📉 🐻
13

·
--
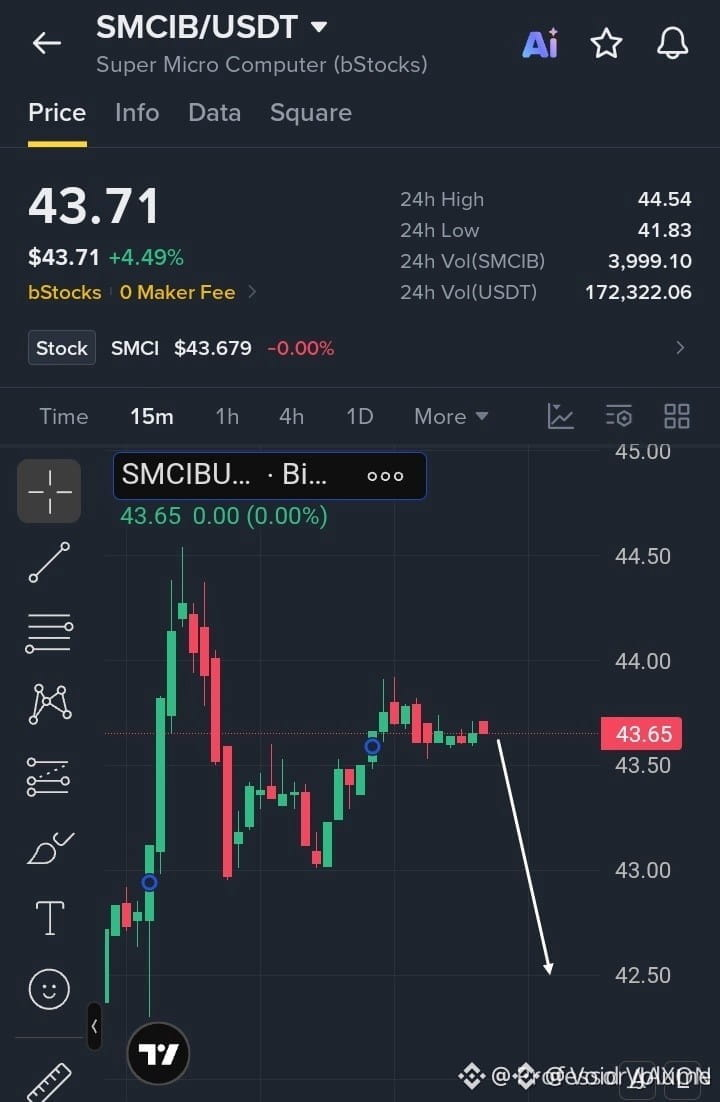
🚨 $SMCIB FAILS AT KEY SUPPLY ZONE WITH BEARISH ORDER FLOW BUILDING! 🔻
Entry: 43.60 - 43.75 🔴
Target: 42.50 🎯
Stop Loss: 44.05 ⚠️
$SMCIB printed a sharp structural rejection right at the 43.70 overhead supply level, indicating aggressive sell-side defense by institutional players. Momentum is fading rapidly across lower timeframes, signaling that buyer absorption capacity has exhausted near resistance. 📉
A clean break of the immediate local support structure opens an inefficiency fill straight down toward lower liquidity pools. 🔍 Smart money positioning favors downside continuation, targeting sell-side resting orders down to 42.50. 💬 Are you catching this structural distribution or waiting for a deeper sweep? 👇
⚠️ Not financial advice. Always manage your risk. 🛡️
🏷️ #SMCIB #ShortSetup #MarketStructure #Bearish #Trading
🔻 📉
🚨 $SMCIB FAILS AT KEY SUPPLY ZONE WITH BEARISH ORDER FLOW BUILDING! 🔻
Entry: 43.60 - 43.75 🔴
Target: 42.50 🎯
Stop Loss: 44.05 ⚠️
$SMCIB printed a sharp structural rejection right at the 43.70 overhead supply level, indicating aggressive sell-side defense by institutional players. Momentum is fading rapidly across lower timeframes, signaling that buyer absorption capacity has exhausted near resistance. 📉
A clean break of the immediate local support structure opens an inefficiency fill straight down toward lower liquidity pools. 🔍 Smart money positioning favors downside continuation, targeting sell-side resting orders down to 42.50. 💬 Are you catching this structural distribution or waiting for a deeper sweep? 👇
⚠️ Not financial advice. Always manage your risk. 🛡️
🏷️ #SMCIB #ShortSetup #MarketStructure #Bearish #Trading
🔻 📉
Entry: 43.60 - 43.75 🔴
Target: 42.50 🎯
Stop Loss: 44.05 ⚠️
$SMCIB printed a sharp structural rejection right at the 43.70 overhead supply level, indicating aggressive sell-side defense by institutional players. Momentum is fading rapidly across lower timeframes, signaling that buyer absorption capacity has exhausted near resistance. 📉
A clean break of the immediate local support structure opens an inefficiency fill straight down toward lower liquidity pools. 🔍 Smart money positioning favors downside continuation, targeting sell-side resting orders down to 42.50. 💬 Are you catching this structural distribution or waiting for a deeper sweep? 👇
⚠️ Not financial advice. Always manage your risk. 🛡️
🏷️ #SMCIB #ShortSetup #MarketStructure #Bearish #Trading
🔻 📉
12

·
--
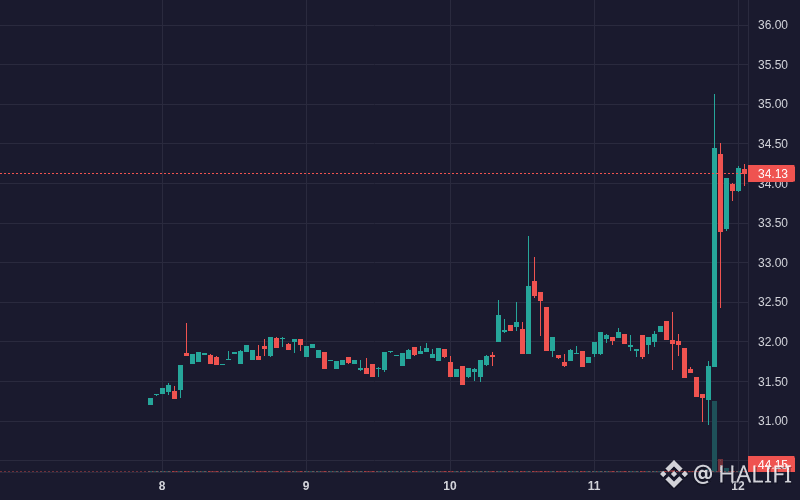
$SMCIB SMCIB is showing bullish movement: 6.68% (Crypto).
Volume: 1.83M | Last: $34.18
Key signals: strong momentum, high volatility.
Bias Daily: BULLISH 🟢 | Weekly: BULLISH 🟢
SMCIB surged over 9% in 24 hours, driven by exceptional earnings guidance and massive volume spikes.
**Strong Earnings Guidance (High)**: Super Micro Computer projected Q1 revenue of $14.5B–$15.5B and fiscal 2027 sales of $65B–$72B, beating expectations and validating AI infrastructure demand.
- **Surging Trading Volume (High)**: Trading volume spiked dramatically to over 2.8M USDT within a single hour, driving a sharp upward price movement to $34.46.
- **Large Capital Inflows (Medium)**: Sustained positive capital inflows accompanied the price rally, with significant large-tier inflow ratios reaching up to 83%, indicating strong institutional or whale participation.
#SMCIB #VIXFallsToJanuaryLow #Ripple #XRP #Crypto
$SMCIB SMCIB is showing bullish movement: 6.68% (Crypto).
Volume: 1.83M | Last: $34.18
Key signals: strong momentum, high volatility.
Bias Daily: BULLISH 🟢 | Weekly: BULLISH 🟢
SMCIB surged over 9% in 24 hours, driven by exceptional earnings guidance and massive volume spikes.
**Strong Earnings Guidance (High)**: Super Micro Computer projected Q1 revenue of $14.5B–$15.5B and fiscal 2027 sales of $65B–$72B, beating expectations and validating AI infrastructure demand.
- **Surging Trading Volume (High)**: Trading volume spiked dramatically to over 2.8M USDT within a single hour, driving a sharp upward price movement to $34.46.
- **Large Capital Inflows (Medium)**: Sustained positive capital inflows accompanied the price rally, with significant large-tier inflow ratios reaching up to 83%, indicating strong institutional or whale participation.
#SMCIB #VIXFallsToJanuaryLow #Ripple #XRP #Crypto
Volume: 1.83M | Last: $34.18
Key signals: strong momentum, high volatility.
Bias Daily: BULLISH 🟢 | Weekly: BULLISH 🟢
SMCIB surged over 9% in 24 hours, driven by exceptional earnings guidance and massive volume spikes.
**Strong Earnings Guidance (High)**: Super Micro Computer projected Q1 revenue of $14.5B–$15.5B and fiscal 2027 sales of $65B–$72B, beating expectations and validating AI infrastructure demand.
- **Surging Trading Volume (High)**: Trading volume spiked dramatically to over 2.8M USDT within a single hour, driving a sharp upward price movement to $34.46.
- **Large Capital Inflows (Medium)**: Sustained positive capital inflows accompanied the price rally, with significant large-tier inflow ratios reaching up to 83%, indicating strong institutional or whale participation.
#SMCIB #VIXFallsToJanuaryLow #Ripple #XRP #Crypto
18
Log in to explore more content
Join global crypto users on Binance Square
⚡️ Get latest and useful information about crypto.
💬 Trusted by the world’s largest crypto exchange.
👍 Discover real insights from verified creators.
Email / Phone number
Trending Topics
1
#USMidterms-WhatAreMarketsExpecting?
42,640 views
475 Discussing
2
#USOctoberNFP-AreRateCutsStillPossible
220,540 views
1,748 Discussing
3
#AMDBeatsExpectations-AINarrativeContinues
6,910 views
178 Discussing
4
#BinanceIncidentReport
197,374 views
1,195 Discussing
5
#AnthropicIPOPricedDownasInvestorsEye$1.5T
7,595 views
87 Discussing
6
#BinanceReopensWithdrawalsForMoreAssets
322,507 views
2,255 Discussing
7
#HongKongToLicenseVirtualAssetCustodyAndAdvisory
1,282 views
42 Discussing
8
#BinanceHourlyDepositsExceedWithdrawals
138,959 views
1,122 Discussing
9
#SouthKoreaRulingPartyLeaderSeeksCryptoTaxDelay
1,434 views
45 Discussing
10
#MorganStanleyAmongFirstBanksToUseDTCCTokenization
1,461 views
54 Discussing