
#axti
axti
73,076 views
984 Discussing
Hot
Latest


·
--
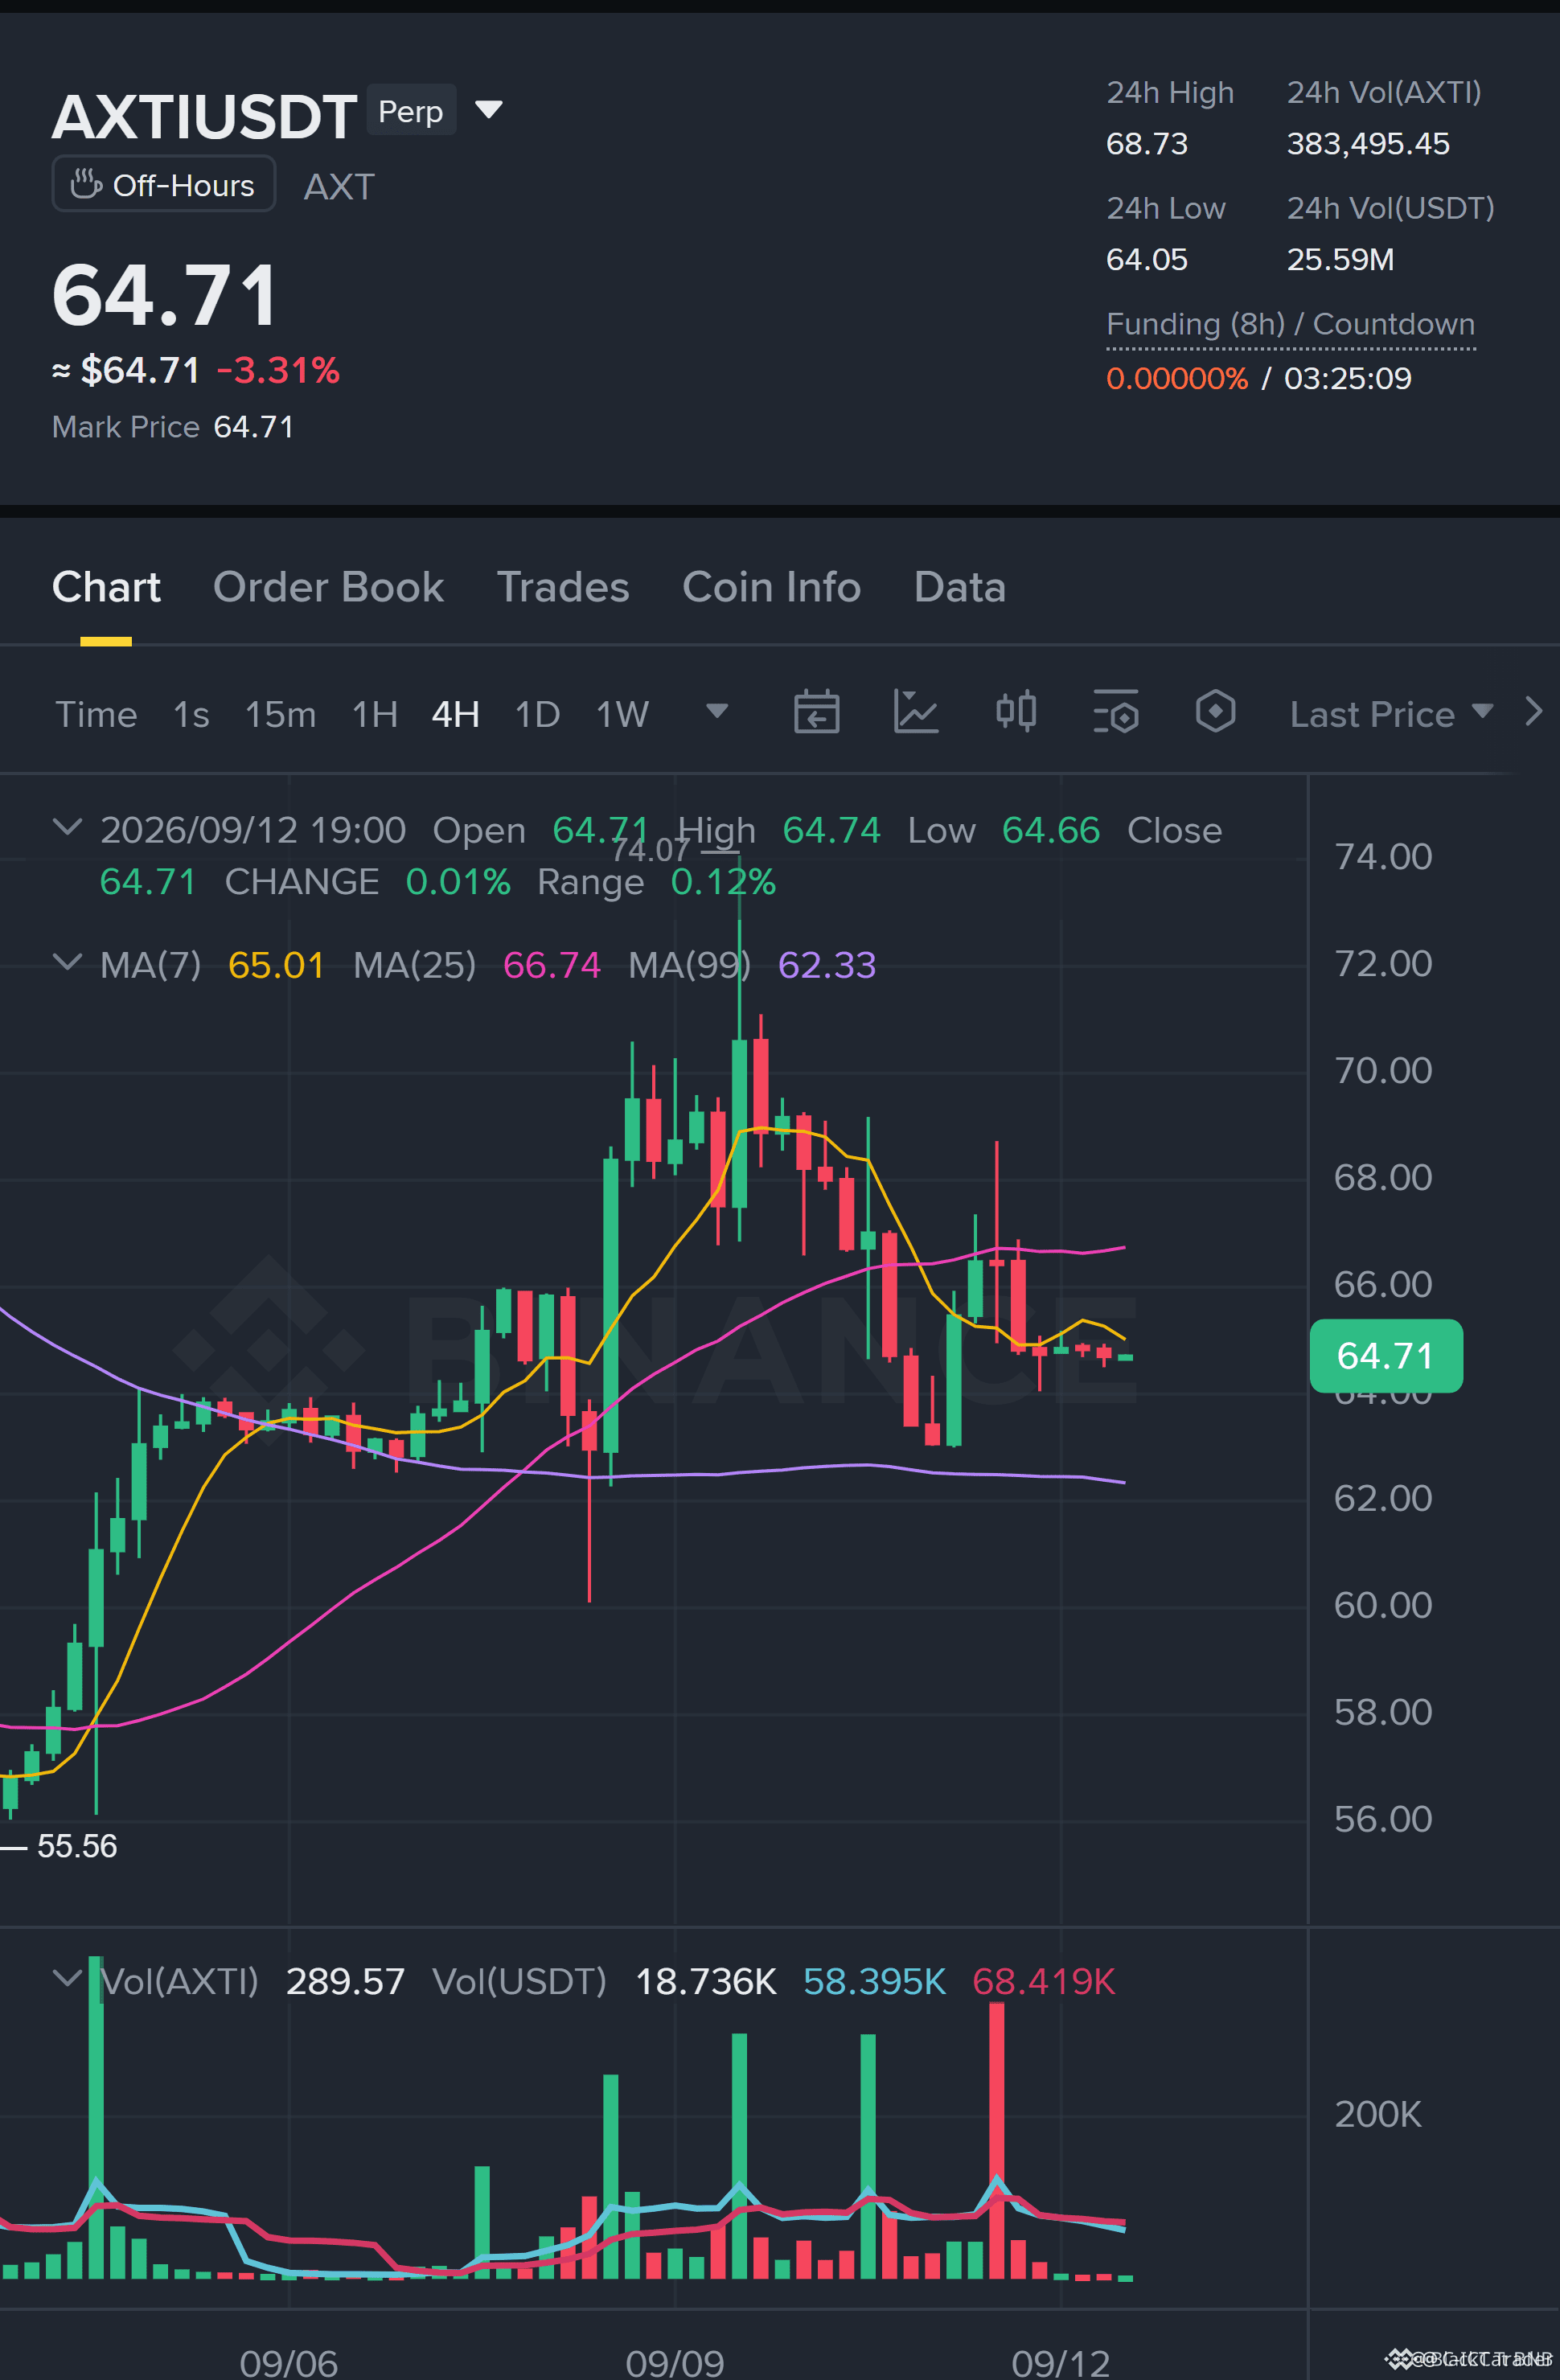
🔴 $AXTI TESTING HEAVY SUPPLY ZONE AS BEARS PREPARE FOR CONTINUATION RETEST 📉
Entry: 64.87 - 64.97 ⚡
Target: 64.05 / 63.00 / 62.57 🎯
Stop Loss: 65.61 ⚠️
📌 $AXTI is printing a clean lower-high structure on the 1H timeframe, pulling back directly into a critical premium supply zone. 🔍 While market structure leans heavily bearish toward lower liquidity pools, intraday order flow on lower timeframes has not fully confirmed institutional distribution just yet.
📊 Maintaining strict execution discipline is key here, as the setup remains on watchlist status until lower-timeframe confirmation aligns with our risk parameters. 💬 Are you keeping this short setup on your watchlist for a structural breakdown trigger, or expecting a complete reclamation of supply? 👇
⚠️ Not financial advice. Always manage your risk. 🛡️
🏷️ #AXTI #ShortSetup #MarketStructure #TechnicalAnalysis #Crypto
🎯 🐻
🔴 $AXTI TESTING HEAVY SUPPLY ZONE AS BEARS PREPARE FOR CONTINUATION RETEST 📉
Entry: 64.87 - 64.97 ⚡
Target: 64.05 / 63.00 / 62.57 🎯
Stop Loss: 65.61 ⚠️
📌 $AXTI is printing a clean lower-high structure on the 1H timeframe, pulling back directly into a critical premium supply zone. 🔍 While market structure leans heavily bearish toward lower liquidity pools, intraday order flow on lower timeframes has not fully confirmed institutional distribution just yet.
📊 Maintaining strict execution discipline is key here, as the setup remains on watchlist status until lower-timeframe confirmation aligns with our risk parameters. 💬 Are you keeping this short setup on your watchlist for a structural breakdown trigger, or expecting a complete reclamation of supply? 👇
⚠️ Not financial advice. Always manage your risk. 🛡️
🏷️ #AXTI #ShortSetup #MarketStructure #TechnicalAnalysis #Crypto
🎯 🐻
Entry: 64.87 - 64.97 ⚡
Target: 64.05 / 63.00 / 62.57 🎯
Stop Loss: 65.61 ⚠️
📌 $AXTI is printing a clean lower-high structure on the 1H timeframe, pulling back directly into a critical premium supply zone. 🔍 While market structure leans heavily bearish toward lower liquidity pools, intraday order flow on lower timeframes has not fully confirmed institutional distribution just yet.
📊 Maintaining strict execution discipline is key here, as the setup remains on watchlist status until lower-timeframe confirmation aligns with our risk parameters. 💬 Are you keeping this short setup on your watchlist for a structural breakdown trigger, or expecting a complete reclamation of supply? 👇
⚠️ Not financial advice. Always manage your risk. 🛡️
🏷️ #AXTI #ShortSetup #MarketStructure #TechnicalAnalysis #Crypto
🎯 🐻
33

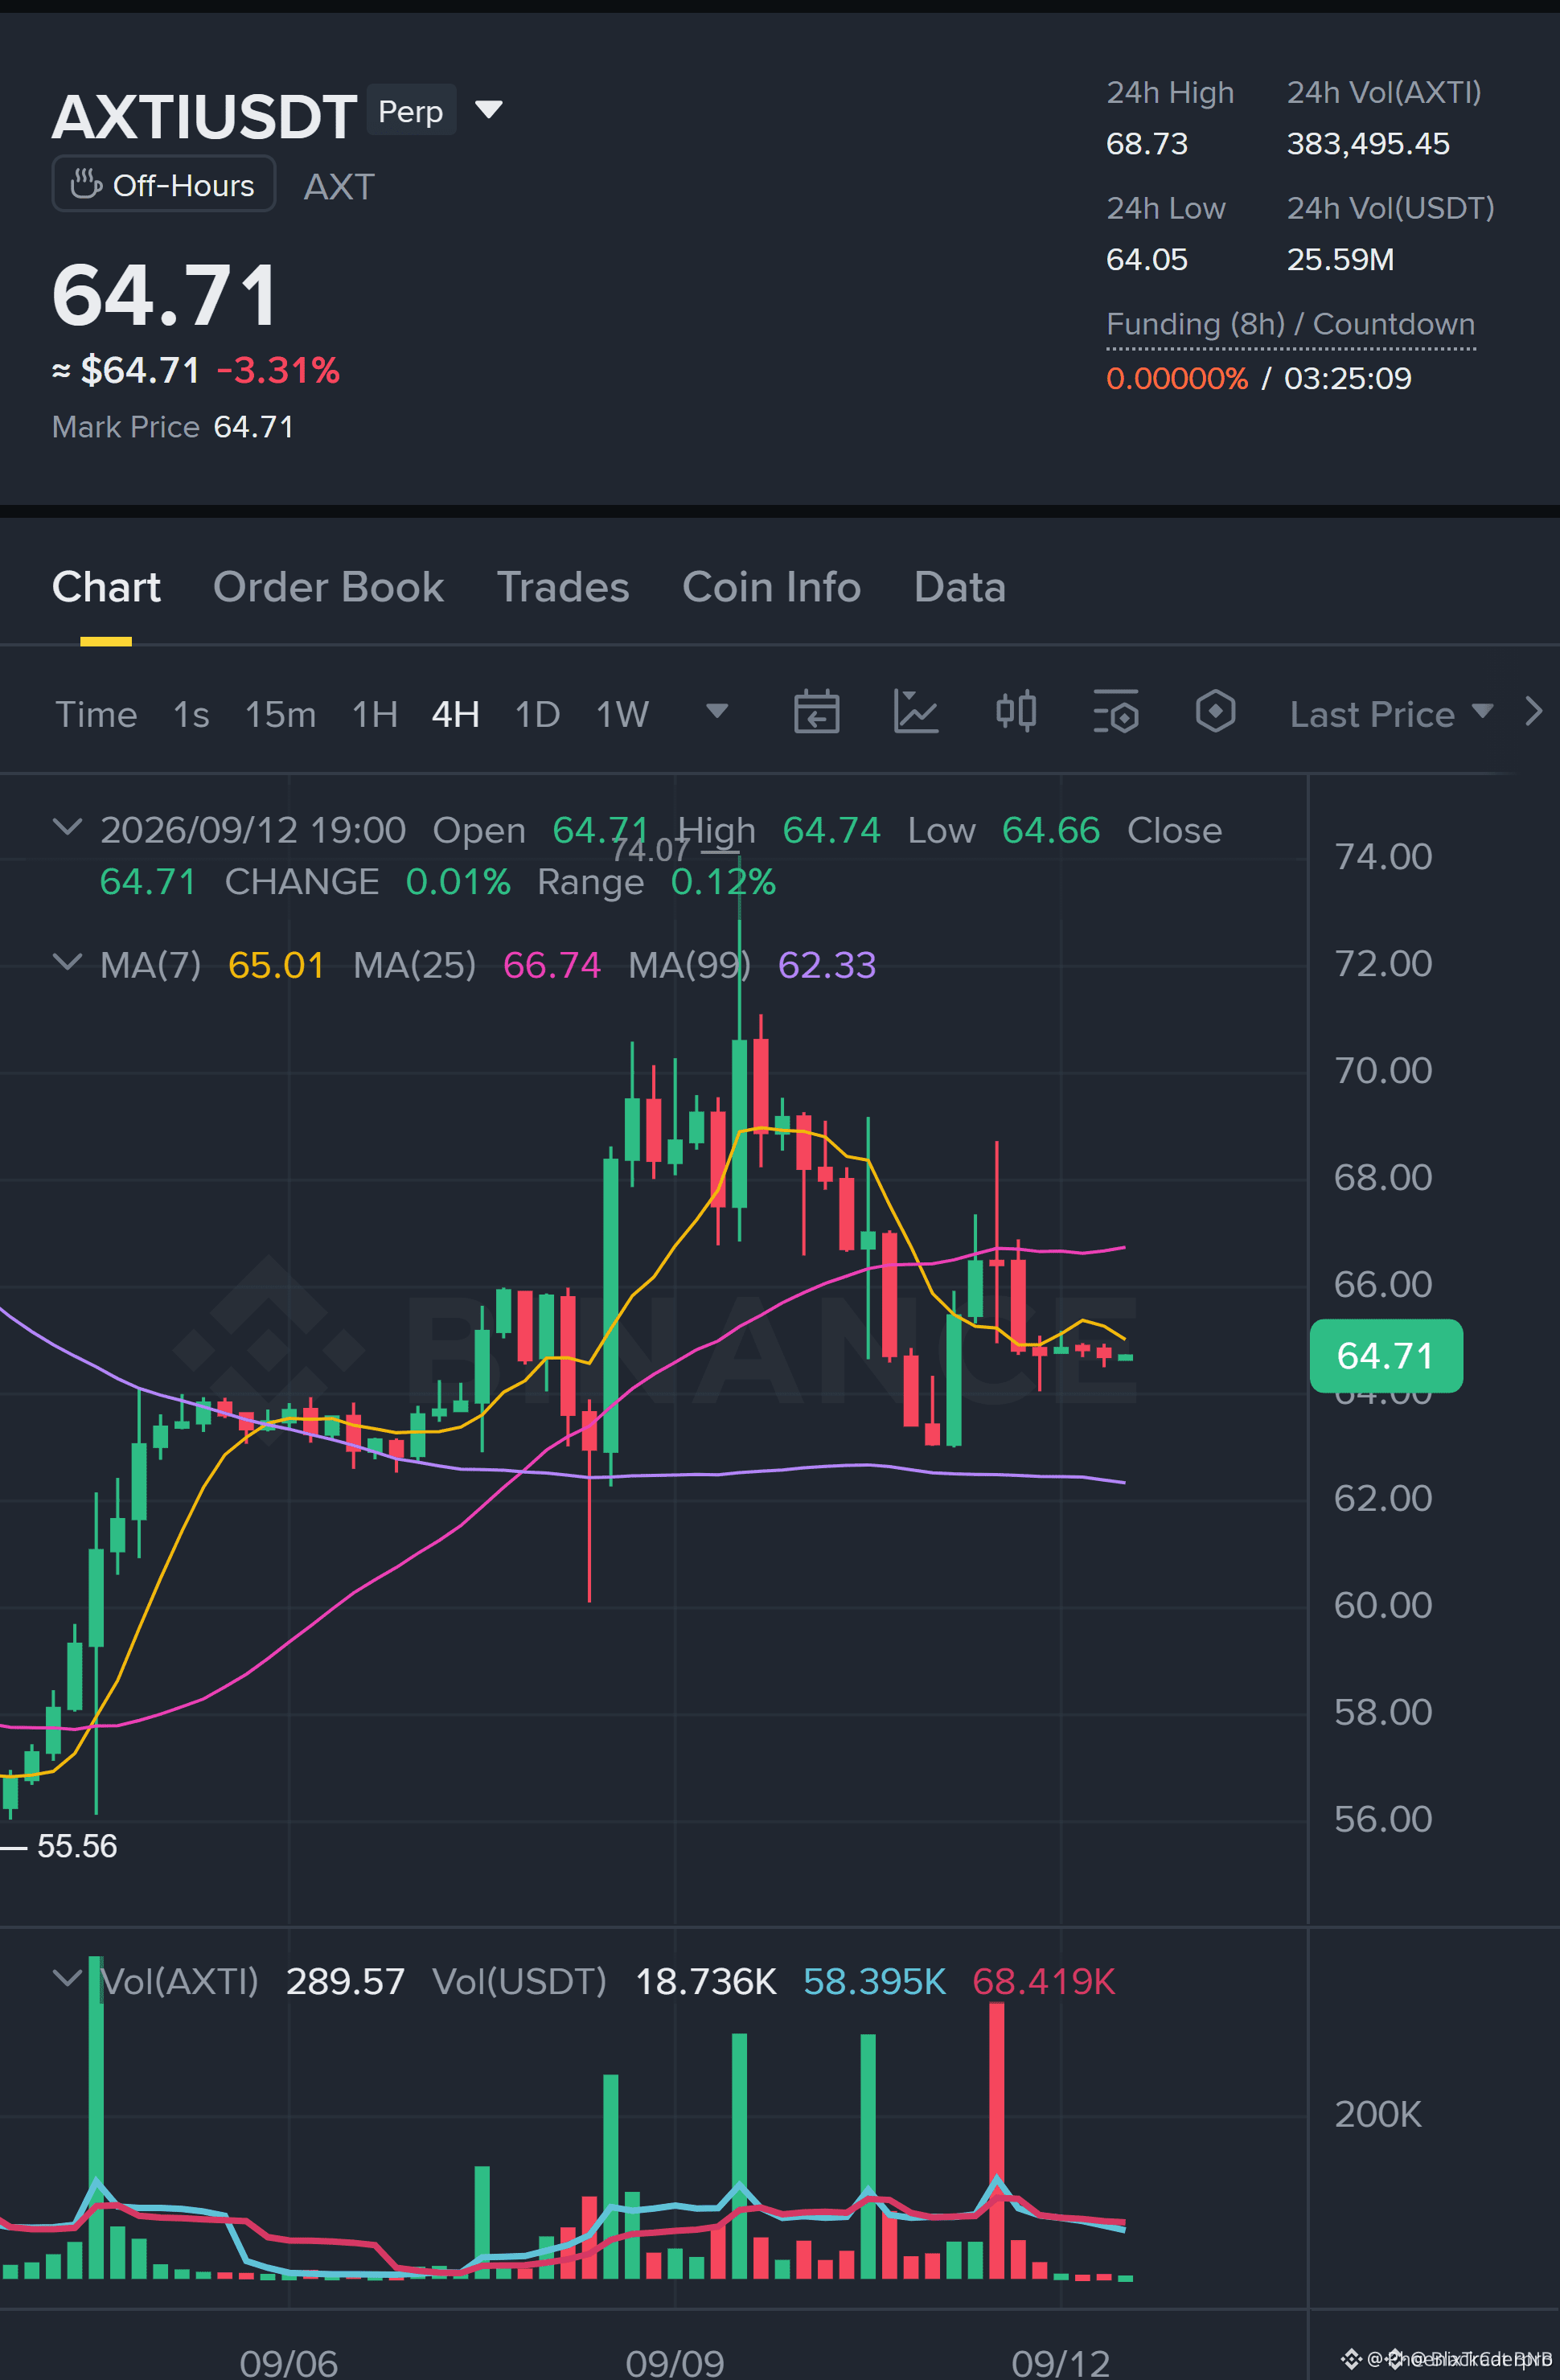
🔴 $AXTI PREPARING A SHORT CONTINUATION DROP AS BUYERS FALTER ON THE 1H RETRACEMENT! 📉
Entry: 64.87 - 64.97 ⚡
Target: 62.57 🎯
Stop Loss: 65.61 ⚠️
The 1H timeframe on $AXTI is carving out a subtle retracement back into supply, setting the stage for a short continuation move. 📊 However, sharp order flow execution requires discipline — lower timeframe confirmation on the 15M chart remains incomplete, keeping this setup locked strictly on the watchlist. 🔍
Smart money waits for sellers to confirm structural failure around the entry zone before laying down risk. ⚡ Premature entries chop account balance, but once the trigger confirms, momentum opens clean downside pathways toward 62.57. 💭 Are you waiting for confirmation to print, or jumping the gun early? 👇
⚠️ Not financial advice. Always manage your risk. 🛡️
🏷️ #AXTI #ShortSetup #Crypto #Trading #Bearish
🐻 📉
🔴 $AXTI PREPARING A SHORT CONTINUATION DROP AS BUYERS FALTER ON THE 1H RETRACEMENT! 📉
Entry: 64.87 - 64.97 ⚡
Target: 62.57 🎯
Stop Loss: 65.61 ⚠️
The 1H timeframe on $AXTI is carving out a subtle retracement back into supply, setting the stage for a short continuation move. 📊 However, sharp order flow execution requires discipline — lower timeframe confirmation on the 15M chart remains incomplete, keeping this setup locked strictly on the watchlist. 🔍
Smart money waits for sellers to confirm structural failure around the entry zone before laying down risk. ⚡ Premature entries chop account balance, but once the trigger confirms, momentum opens clean downside pathways toward 62.57. 💭 Are you waiting for confirmation to print, or jumping the gun early? 👇
⚠️ Not financial advice. Always manage your risk. 🛡️
🏷️ #AXTI #ShortSetup #Crypto #Trading #Bearish
🐻 📉
Entry: 64.87 - 64.97 ⚡
Target: 62.57 🎯
Stop Loss: 65.61 ⚠️
The 1H timeframe on $AXTI is carving out a subtle retracement back into supply, setting the stage for a short continuation move. 📊 However, sharp order flow execution requires discipline — lower timeframe confirmation on the 15M chart remains incomplete, keeping this setup locked strictly on the watchlist. 🔍
Smart money waits for sellers to confirm structural failure around the entry zone before laying down risk. ⚡ Premature entries chop account balance, but once the trigger confirms, momentum opens clean downside pathways toward 62.57. 💭 Are you waiting for confirmation to print, or jumping the gun early? 👇
⚠️ Not financial advice. Always manage your risk. 🛡️
🏷️ #AXTI #ShortSetup #Crypto #Trading #Bearish
🐻 📉
24

·
--
$AXTI price fell 7.335% in a single day, while the funding rate is still positive at 0.0003. The longs are paying the shorts, yet the price is still dropping—classic case of longs getting trapped, adding to positions, and stubbornly holding on.
Now the open interest is 115,000; at this level, the long liquidation lines are packed tightly together. The funding rate is still draining their blood. Once the next support fails, a chain liquidation will directly punch through the order book.
I won’t chase longs on this one. I’ll wait for a pullback and test the short. Direction: short. Leverage: 5x. Stop loss: exit if it reclaims 59.5. Take profit: first look at 53. Position size: 5% of total capital to test the waters.
Trading tag: #TradFi #链上美股 #AXTI
Where do you think this call is most likely to be wrong?
$AXTI price fell 7.335% in a single day, while the funding rate is still positive at 0.0003. The longs are paying the shorts, yet the price is still dropping—classic case of longs getting trapped, adding to positions, and stubbornly holding on.
Now the open interest is 115,000; at this level, the long liquidation lines are packed tightly together. The funding rate is still draining their blood. Once the next support fails, a chain liquidation will directly punch through the order book.
I won’t chase longs on this one. I’ll wait for a pullback and test the short. Direction: short. Leverage: 5x. Stop loss: exit if it reclaims 59.5. Take profit: first look at 53. Position size: 5% of total capital to test the waters.
Trading tag: #TradFi #链上美股 #AXTI
Where do you think this call is most likely to be wrong?
Now the open interest is 115,000; at this level, the long liquidation lines are packed tightly together. The funding rate is still draining their blood. Once the next support fails, a chain liquidation will directly punch through the order book.
I won’t chase longs on this one. I’ll wait for a pullback and test the short. Direction: short. Leverage: 5x. Stop loss: exit if it reclaims 59.5. Take profit: first look at 53. Position size: 5% of total capital to test the waters.
Trading tag: #TradFi #链上美股 #AXTI
Where do you think this call is most likely to be wrong?
30
·
--
AXTI drops 7.34% within 24 hours, but the funding rate is still positive at 0.0003. In this structure, longs keep adding while prices are falling and holding a positive funding rate—typical trapped longs stubbornly propping themselves up; liquidation pressure is building. The Trump tariff narrative weighs on export-oriented chip stocks, and AXTI—being a materials-side play—gets hit first.
Direction: Short. Multiplier: 5x. Stop loss: 59.5. Take profit: 52.0. Position size: 5%. Until the funding rate turns negative, this short setup logic remains unchanged.
Trading tag: #TradFi #链上美股 #AXTI
Where do you think this assessment is most likely to be wrong?
AXTI drops 7.34% within 24 hours, but the funding rate is still positive at 0.0003. In this structure, longs keep adding while prices are falling and holding a positive funding rate—typical trapped longs stubbornly propping themselves up; liquidation pressure is building. The Trump tariff narrative weighs on export-oriented chip stocks, and AXTI—being a materials-side play—gets hit first.
Direction: Short. Multiplier: 5x. Stop loss: 59.5. Take profit: 52.0. Position size: 5%. Until the funding rate turns negative, this short setup logic remains unchanged.
Trading tag: #TradFi #链上美股 #AXTI
Where do you think this assessment is most likely to be wrong?
Direction: Short. Multiplier: 5x. Stop loss: 59.5. Take profit: 52.0. Position size: 5%. Until the funding rate turns negative, this short setup logic remains unchanged.
Trading tag: #TradFi #链上美股 #AXTI
Where do you think this assessment is most likely to be wrong?
17

·
--
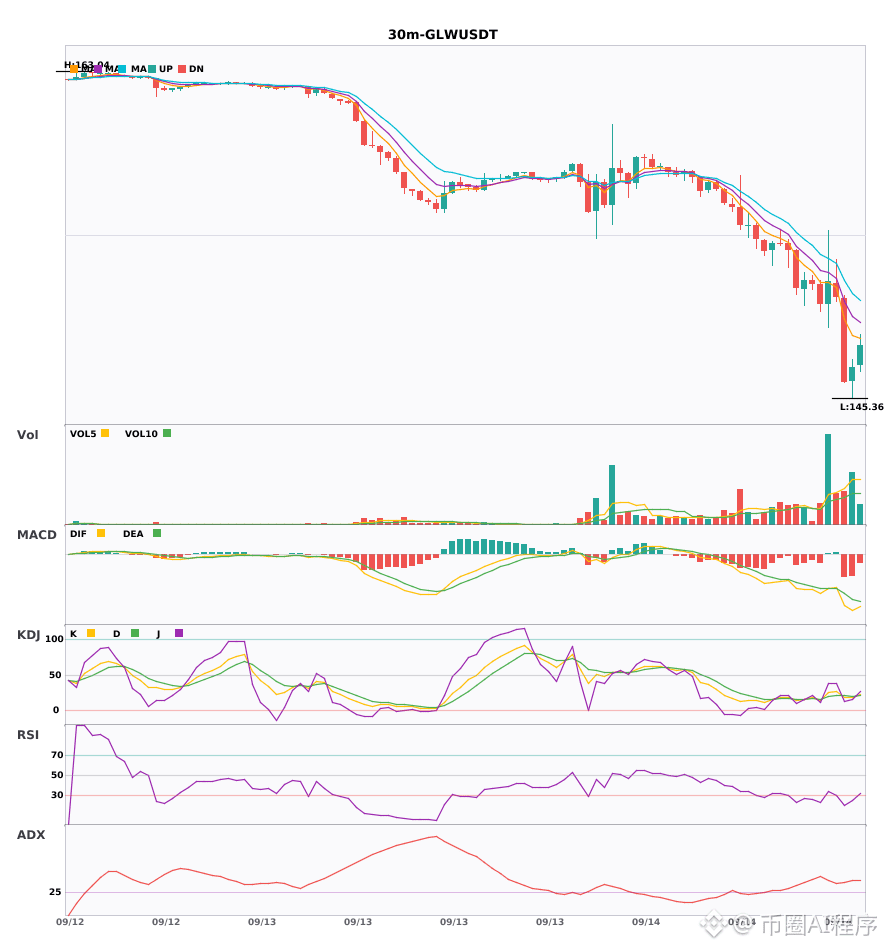
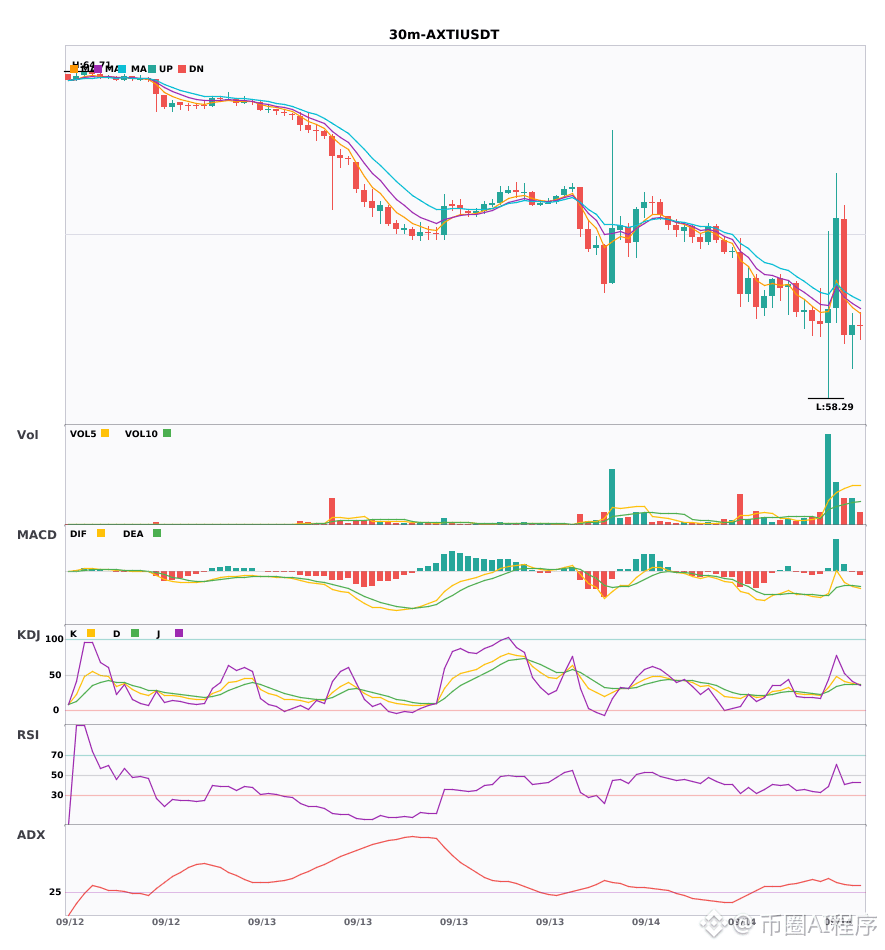
Multi-period resonance: $GLW / $AXTI / $MRVL 30 minutes weakens, 4-hour downtrend confirmation 🔥
════════════════════
🟢 $GLW 30 minutes Bearish signal
⚠️ Technical analysis: Multi-period resonance! 4-hour bearish confirmation + 30-minute entry signal. MACD dead cross below zero with green histogram expanding; moving averages aligned bearish and pointing downward; KDJ dead cross suggests bearish in the near term.
════════════════════
🟢 $AXTI 30 minutes Bearish signal
⚠️ Technical analysis: 4-hour bearish resonance confirmed | 30-minute entry. MACD DIF breaks below the zero axis, trend turns bearish. EMA5 crosses below EMA8, short-term turns bearish. KDJ is weak and bearish dominates (K is 41.5, D is 36.2). Volume expands (2.3x)
════════════════════
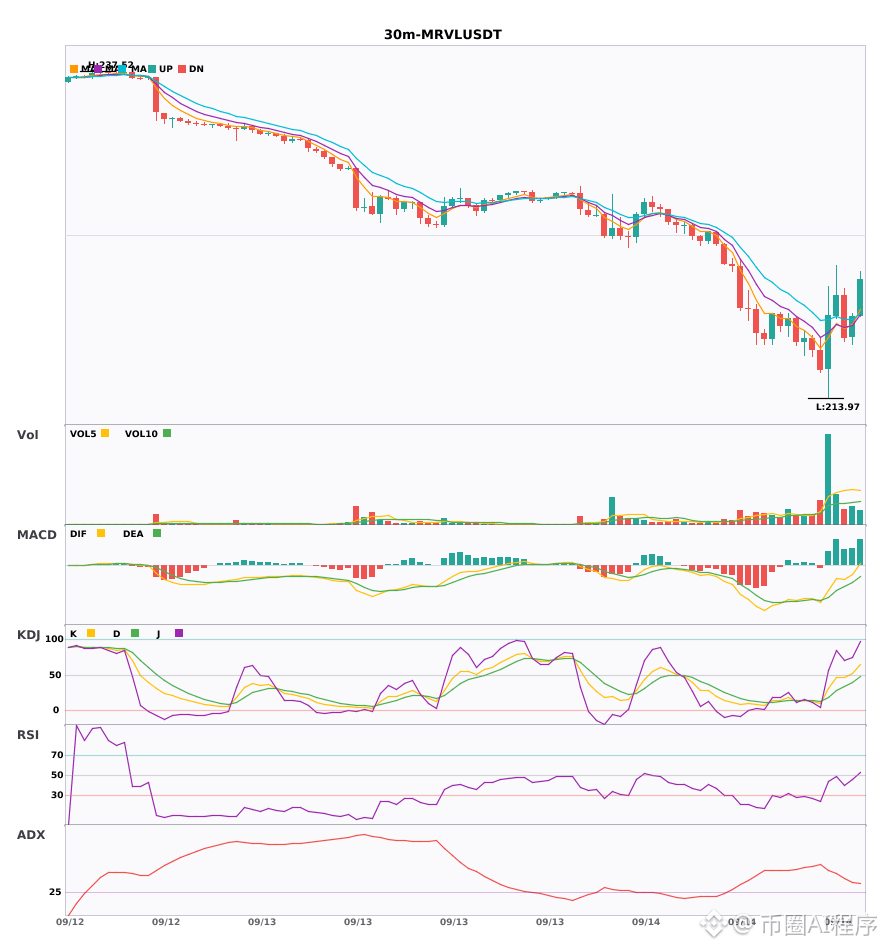
🟢 $MRVL 30 minutes Bearish signal
⚠️ Technical analysis: Multi-period resonance indicates bearish! 4-hour bearish trend confirmed. On the 30-minute chart, EMA5 crosses below EMA8, turning short-term bearish. KDJ shows weak bearish dominance; volume is 1.4x, normal.
════════════════════
🔔 Watch for first-hand market movement alerts 🔔
#多周期共振 #GLW #AXTI #MRVL
📌 When trading, pay attention to whether the candlestick pattern matches
Multi-period resonance: $GLW / $AXTI / $MRVL 30 minutes weakens, 4-hour downtrend confirmation 🔥
════════════════════
🟢 $GLW 30 minutes Bearish signal
⚠️ Technical analysis: Multi-period resonance! 4-hour bearish confirmation + 30-minute entry signal. MACD dead cross below zero with green histogram expanding; moving averages aligned bearish and pointing downward; KDJ dead cross suggests bearish in the near term.
════════════════════
🟢 $AXTI 30 minutes Bearish signal
⚠️ Technical analysis: 4-hour bearish resonance confirmed | 30-minute entry. MACD DIF breaks below the zero axis, trend turns bearish. EMA5 crosses below EMA8, short-term turns bearish. KDJ is weak and bearish dominates (K is 41.5, D is 36.2). Volume expands (2.3x)
════════════════════
🟢 $MRVL 30 minutes Bearish signal
⚠️ Technical analysis: Multi-period resonance indicates bearish! 4-hour bearish trend confirmed. On the 30-minute chart, EMA5 crosses below EMA8, turning short-term bearish. KDJ shows weak bearish dominance; volume is 1.4x, normal.
════════════════════
🔔 Watch for first-hand market movement alerts 🔔
#多周期共振 #GLW #AXTI #MRVL
📌 When trading, pay attention to whether the candlestick pattern matches
════════════════════
🟢 $GLW 30 minutes Bearish signal
⚠️ Technical analysis: Multi-period resonance! 4-hour bearish confirmation + 30-minute entry signal. MACD dead cross below zero with green histogram expanding; moving averages aligned bearish and pointing downward; KDJ dead cross suggests bearish in the near term.
════════════════════
🟢 $AXTI 30 minutes Bearish signal
⚠️ Technical analysis: 4-hour bearish resonance confirmed | 30-minute entry. MACD DIF breaks below the zero axis, trend turns bearish. EMA5 crosses below EMA8, short-term turns bearish. KDJ is weak and bearish dominates (K is 41.5, D is 36.2). Volume expands (2.3x)
════════════════════
🟢 $MRVL 30 minutes Bearish signal
⚠️ Technical analysis: Multi-period resonance indicates bearish! 4-hour bearish trend confirmed. On the 30-minute chart, EMA5 crosses below EMA8, turning short-term bearish. KDJ shows weak bearish dominance; volume is 1.4x, normal.
════════════════════
🔔 Watch for first-hand market movement alerts 🔔
#多周期共振 #GLW #AXTI #MRVL
📌 When trading, pay attention to whether the candlestick pattern matches
141
·
--
$AXTI 24 hours saw a drop of 3.445%, with the quote at 61.66. This kind of move isn’t considered that fierce when placed in on-chain U.S. stock futures contracts, but when you factor in the perspective of trading Trump, the flavor changes.
The funding rate is 0. This means neither side—bulls or bears—paid the other; the position cost is temporarily balanced. Prices are falling, but the funding rate isn’t negative. That suggests the shorts haven’t formed an absolute, overwhelming advantage, nor have we seen the typical situation of “shorts being crowded” where funding is paid to longs. This is a signal of relative stalemate. Open interest is still 114354.99, which isn’t low—so the market hasn’t fully given up.
Every policy statement Trump makes has a direct impact on assets like AXTI, which are tied to traditional finance. If he brings up tariffs again or gets tough on China, risk-off sentiment will rise; the first thing cut will be these high-beta on-chain stock contracts. With the price drifting lower, it may already be pricing in some risks that haven’t been clearly stated yet. A zero funding rate is an observation window: if the price keeps sliding and the funding rate turns negative, that means the shorts are gaining strength and downside momentum will intensify. If the funding rate suddenly turns positive and the price rebounds, it could mean the policy tone has eased and the shorts are covering.
The strongest contrary evidence would be if Trump suddenly speaks in favor of a specific policy that benefits traditional finance or tech stocks. That could instantly flip sentiment and squeeze the shorts. But based on the current data, there’s no sign of that.
For someone like me trading contracts, my action is straightforward. Direction: short. Leverage: 3x. Stop-loss: if the price rebounds and holds above 63.5 (about a recent minor high), I’ll close the position and admit the judgment is wrong. Take-profit: first look around 59.8, where the next psychological level sits. Position size: enter with a 10% allocation as a trial.
My view is based on two facts: the coexistence of price decline and a zero funding rate. If the next period brings two scenarios, this strategy fails: first, AXTI rallies on heavy volume for two consecutive days by more than 5%, and the funding rate turns positive; second, Trump issues explicit policy remarks that benefit this sector. If either happens, I’ll撤.
For an aggressive approach, short at the current price and tighten the stop-loss slightly. For a conservative approach, wait for the price to rebound into the 62–62.5 range, and only short if the funding rate hasn’t changed. For a risk-avoidance approach, this area is neither up nor down, and the funding rate has no direction—so don’t touch it at all and wait for it to show a clear trend.
The market may be overestimating short-term policy noise and underestimating the fragility of this kind of stalemated positioning.
Trading tag: #TradFi #链上美股 #AXTI
Where do you think this set of judgments is most likely to be wrong?
$AXTI 24 hours saw a drop of 3.445%, with the quote at 61.66. This kind of move isn’t considered that fierce when placed in on-chain U.S. stock futures contracts, but when you factor in the perspective of trading Trump, the flavor changes.
The funding rate is 0. This means neither side—bulls or bears—paid the other; the position cost is temporarily balanced. Prices are falling, but the funding rate isn’t negative. That suggests the shorts haven’t formed an absolute, overwhelming advantage, nor have we seen the typical situation of “shorts being crowded” where funding is paid to longs. This is a signal of relative stalemate. Open interest is still 114354.99, which isn’t low—so the market hasn’t fully given up.
Every policy statement Trump makes has a direct impact on assets like AXTI, which are tied to traditional finance. If he brings up tariffs again or gets tough on China, risk-off sentiment will rise; the first thing cut will be these high-beta on-chain stock contracts. With the price drifting lower, it may already be pricing in some risks that haven’t been clearly stated yet. A zero funding rate is an observation window: if the price keeps sliding and the funding rate turns negative, that means the shorts are gaining strength and downside momentum will intensify. If the funding rate suddenly turns positive and the price rebounds, it could mean the policy tone has eased and the shorts are covering.
The strongest contrary evidence would be if Trump suddenly speaks in favor of a specific policy that benefits traditional finance or tech stocks. That could instantly flip sentiment and squeeze the shorts. But based on the current data, there’s no sign of that.
For someone like me trading contracts, my action is straightforward. Direction: short. Leverage: 3x. Stop-loss: if the price rebounds and holds above 63.5 (about a recent minor high), I’ll close the position and admit the judgment is wrong. Take-profit: first look around 59.8, where the next psychological level sits. Position size: enter with a 10% allocation as a trial.
My view is based on two facts: the coexistence of price decline and a zero funding rate. If the next period brings two scenarios, this strategy fails: first, AXTI rallies on heavy volume for two consecutive days by more than 5%, and the funding rate turns positive; second, Trump issues explicit policy remarks that benefit this sector. If either happens, I’ll撤.
For an aggressive approach, short at the current price and tighten the stop-loss slightly. For a conservative approach, wait for the price to rebound into the 62–62.5 range, and only short if the funding rate hasn’t changed. For a risk-avoidance approach, this area is neither up nor down, and the funding rate has no direction—so don’t touch it at all and wait for it to show a clear trend.
The market may be overestimating short-term policy noise and underestimating the fragility of this kind of stalemated positioning.
Trading tag: #TradFi #链上美股 #AXTI
Where do you think this set of judgments is most likely to be wrong?
The funding rate is 0. This means neither side—bulls or bears—paid the other; the position cost is temporarily balanced. Prices are falling, but the funding rate isn’t negative. That suggests the shorts haven’t formed an absolute, overwhelming advantage, nor have we seen the typical situation of “shorts being crowded” where funding is paid to longs. This is a signal of relative stalemate. Open interest is still 114354.99, which isn’t low—so the market hasn’t fully given up.
Every policy statement Trump makes has a direct impact on assets like AXTI, which are tied to traditional finance. If he brings up tariffs again or gets tough on China, risk-off sentiment will rise; the first thing cut will be these high-beta on-chain stock contracts. With the price drifting lower, it may already be pricing in some risks that haven’t been clearly stated yet. A zero funding rate is an observation window: if the price keeps sliding and the funding rate turns negative, that means the shorts are gaining strength and downside momentum will intensify. If the funding rate suddenly turns positive and the price rebounds, it could mean the policy tone has eased and the shorts are covering.
The strongest contrary evidence would be if Trump suddenly speaks in favor of a specific policy that benefits traditional finance or tech stocks. That could instantly flip sentiment and squeeze the shorts. But based on the current data, there’s no sign of that.
For someone like me trading contracts, my action is straightforward. Direction: short. Leverage: 3x. Stop-loss: if the price rebounds and holds above 63.5 (about a recent minor high), I’ll close the position and admit the judgment is wrong. Take-profit: first look around 59.8, where the next psychological level sits. Position size: enter with a 10% allocation as a trial.
My view is based on two facts: the coexistence of price decline and a zero funding rate. If the next period brings two scenarios, this strategy fails: first, AXTI rallies on heavy volume for two consecutive days by more than 5%, and the funding rate turns positive; second, Trump issues explicit policy remarks that benefit this sector. If either happens, I’ll撤.
For an aggressive approach, short at the current price and tighten the stop-loss slightly. For a conservative approach, wait for the price to rebound into the 62–62.5 range, and only short if the funding rate hasn’t changed. For a risk-avoidance approach, this area is neither up nor down, and the funding rate has no direction—so don’t touch it at all and wait for it to show a clear trend.
The market may be overestimating short-term policy noise and underestimating the fragility of this kind of stalemated positioning.
Trading tag: #TradFi #链上美股 #AXTI
Where do you think this set of judgments is most likely to be wrong?
78

$AXTI SHORT
1. Sellers maintain initiative near current levels, exerting noticeable pressure on prices.
2. The local movement structure retains bearish potential as long as the asset trades below the specified defense level.
3. The market is setting up conditions for a downward scenario and a step-by-step approach to the target zones.
🔹Entry zone: 62.94
💰Target 1: 62.40127229 (+0.86%)
💰Target 2: 61.80254457 (+1.81%)
💰Target 3: 60.904453 (+3.23%)
❌Stop-loss: 63.89809157 (-1.52%)
⚠️ This is not financial advice. Trade at your own risk. DYOR.
#AXTI #TechnicalAnalysis #cryptocurrency 📈
$AXTI
$AXTI SHORT
1. Sellers maintain initiative near current levels, exerting noticeable pressure on prices.
2. The local movement structure retains bearish potential as long as the asset trades below the specified defense level.
3. The market is setting up conditions for a downward scenario and a step-by-step approach to the target zones.
🔹Entry zone: 62.94
💰Target 1: 62.40127229 (+0.86%)
💰Target 2: 61.80254457 (+1.81%)
💰Target 3: 60.904453 (+3.23%)
❌Stop-loss: 63.89809157 (-1.52%)
⚠️ This is not financial advice. Trade at your own risk. DYOR.
#AXTI #TechnicalAnalysis #cryptocurrency 📈
$AXTI
1. Sellers maintain initiative near current levels, exerting noticeable pressure on prices.
2. The local movement structure retains bearish potential as long as the asset trades below the specified defense level.
3. The market is setting up conditions for a downward scenario and a step-by-step approach to the target zones.
🔹Entry zone: 62.94
💰Target 1: 62.40127229 (+0.86%)
💰Target 2: 61.80254457 (+1.81%)
💰Target 3: 60.904453 (+3.23%)
❌Stop-loss: 63.89809157 (-1.52%)
⚠️ This is not financial advice. Trade at your own risk. DYOR.
#AXTI #TechnicalAnalysis #cryptocurrency 📈
$AXTI
21
·
--
$AXTI fell 61.66, down 3.445% in the past 24 hours. Trading volume is $9.62 million, and open interest is 114,355 contracts. The price is soft, but the funding rate stays at zero—both sides pay nothing. This looks like quiet before the storm.
The Trump trade right now is focused on policy uncertainty. The moment he calls for higher tariffs or goes after the Fed, TradFi perp-style on-chain U.S. stock contracts will shiver first. $AXTI is an equity-type token, so it directly eats this narrative. The price is down 3.445%, funding is zero, which means shorts haven’t gotten squeezed and longs aren’t stubbornly absorbing the funding. The drop is real selling pressure, not a sentiment crash. This is the opposite of last week’s short squeezes in some coins—here there’s no short crowding, so once it falls, there’s less resistance.
The strongest contrary signal: if Trump suddenly signals support for tech or tax cuts, risk appetite could snap back instantly, and $AXTI might rip up a bullish candle to recapture the drop. But current data doesn’t show that expectation—both price and volume are weak. The second-order effect: if it breaks below the psychological level of 60, long liquidation/stop-loss selling could cascade, since open interest is still above 110,000 contracts. Covering and closing pressure may accelerate the downside. Right now, cost is being carried by longs. They’ll either add more or cut losses; liquidity will flow toward the short side.
My take: I would short. Reason: Trump headlines risk hasn’t been priced in, while $AXTI is already structurally showing weakness. Specific parameters: direction short, 5x leverage, stop-loss at 63.00, take-profit at 58.00, position size 20%. Invalidation condition: if price reclaims 65 and funding turns positive, that means longs are pushing back—I’ll close to admit I’m wrong.
Aggressive traders can short now and hold through small bounces; conservative traders should wait for a confirmed break below 60 before adding; those who want to avoid risk can just watch and not touch this political noise.
The market thinks Trump’s mouthpiece talk has limited impact—I disagree. Because liquidity in on-chain U.S. stock perps is shallow, headlines can punch through key levels quickly. This drop in $AXTI might just be the beginning.
Trading tag: #TradFi #链上美股 #AXTI
Where do you think this setup is most likely to be wrong?
$AXTI fell 61.66, down 3.445% in the past 24 hours. Trading volume is $9.62 million, and open interest is 114,355 contracts. The price is soft, but the funding rate stays at zero—both sides pay nothing. This looks like quiet before the storm.
The Trump trade right now is focused on policy uncertainty. The moment he calls for higher tariffs or goes after the Fed, TradFi perp-style on-chain U.S. stock contracts will shiver first. $AXTI is an equity-type token, so it directly eats this narrative. The price is down 3.445%, funding is zero, which means shorts haven’t gotten squeezed and longs aren’t stubbornly absorbing the funding. The drop is real selling pressure, not a sentiment crash. This is the opposite of last week’s short squeezes in some coins—here there’s no short crowding, so once it falls, there’s less resistance.
The strongest contrary signal: if Trump suddenly signals support for tech or tax cuts, risk appetite could snap back instantly, and $AXTI might rip up a bullish candle to recapture the drop. But current data doesn’t show that expectation—both price and volume are weak. The second-order effect: if it breaks below the psychological level of 60, long liquidation/stop-loss selling could cascade, since open interest is still above 110,000 contracts. Covering and closing pressure may accelerate the downside. Right now, cost is being carried by longs. They’ll either add more or cut losses; liquidity will flow toward the short side.
My take: I would short. Reason: Trump headlines risk hasn’t been priced in, while $AXTI is already structurally showing weakness. Specific parameters: direction short, 5x leverage, stop-loss at 63.00, take-profit at 58.00, position size 20%. Invalidation condition: if price reclaims 65 and funding turns positive, that means longs are pushing back—I’ll close to admit I’m wrong.
Aggressive traders can short now and hold through small bounces; conservative traders should wait for a confirmed break below 60 before adding; those who want to avoid risk can just watch and not touch this political noise.
The market thinks Trump’s mouthpiece talk has limited impact—I disagree. Because liquidity in on-chain U.S. stock perps is shallow, headlines can punch through key levels quickly. This drop in $AXTI might just be the beginning.
Trading tag: #TradFi #链上美股 #AXTI
Where do you think this setup is most likely to be wrong?
The Trump trade right now is focused on policy uncertainty. The moment he calls for higher tariffs or goes after the Fed, TradFi perp-style on-chain U.S. stock contracts will shiver first. $AXTI is an equity-type token, so it directly eats this narrative. The price is down 3.445%, funding is zero, which means shorts haven’t gotten squeezed and longs aren’t stubbornly absorbing the funding. The drop is real selling pressure, not a sentiment crash. This is the opposite of last week’s short squeezes in some coins—here there’s no short crowding, so once it falls, there’s less resistance.
The strongest contrary signal: if Trump suddenly signals support for tech or tax cuts, risk appetite could snap back instantly, and $AXTI might rip up a bullish candle to recapture the drop. But current data doesn’t show that expectation—both price and volume are weak. The second-order effect: if it breaks below the psychological level of 60, long liquidation/stop-loss selling could cascade, since open interest is still above 110,000 contracts. Covering and closing pressure may accelerate the downside. Right now, cost is being carried by longs. They’ll either add more or cut losses; liquidity will flow toward the short side.
My take: I would short. Reason: Trump headlines risk hasn’t been priced in, while $AXTI is already structurally showing weakness. Specific parameters: direction short, 5x leverage, stop-loss at 63.00, take-profit at 58.00, position size 20%. Invalidation condition: if price reclaims 65 and funding turns positive, that means longs are pushing back—I’ll close to admit I’m wrong.
Aggressive traders can short now and hold through small bounces; conservative traders should wait for a confirmed break below 60 before adding; those who want to avoid risk can just watch and not touch this political noise.
The market thinks Trump’s mouthpiece talk has limited impact—I disagree. Because liquidity in on-chain U.S. stock perps is shallow, headlines can punch through key levels quickly. This drop in $AXTI might just be the beginning.
Trading tag: #TradFi #链上美股 #AXTI
Where do you think this setup is most likely to be wrong?
47

·
--
Old dog swept $AXTI and in 24 hours it dropped 4.05%, current price is 62.02. This drawdown isn’t small, but the funding rate is negative at -0.00003520, which means the shorts are paying the longs right now. Price falling together with a negative funding rate is a typical signal that the shorts are bearing the position.
When shorts are crowded, it’s easy for them to get squeezed. As the price drops, the shorts think they’re winning and keep adding, but the continued negative funding rate increases their cost basis. Once the buy side gets even slightly stronger, it’s easy to trigger shorts’ concentrated position closures, and the price can bounce back quickly.
I judge that the shorts here are more uncomfortable than the longs.
Trading tag: #BinanceFutures #TradFi #USDⓈM #AXTI #AXTIUSDT $AXTI
Old dog swept $AXTI and in 24 hours it dropped 4.05%, current price is 62.02. This drawdown isn’t small, but the funding rate is negative at -0.00003520, which means the shorts are paying the longs right now. Price falling together with a negative funding rate is a typical signal that the shorts are bearing the position.
When shorts are crowded, it’s easy for them to get squeezed. As the price drops, the shorts think they’re winning and keep adding, but the continued negative funding rate increases their cost basis. Once the buy side gets even slightly stronger, it’s easy to trigger shorts’ concentrated position closures, and the price can bounce back quickly.
I judge that the shorts here are more uncomfortable than the longs.
Trading tag: #BinanceFutures #TradFi #USDⓈM #AXTI #AXTIUSDT $AXTI
When shorts are crowded, it’s easy for them to get squeezed. As the price drops, the shorts think they’re winning and keep adding, but the continued negative funding rate increases their cost basis. Once the buy side gets even slightly stronger, it’s easy to trigger shorts’ concentrated position closures, and the price can bounce back quickly.
I judge that the shorts here are more uncomfortable than the longs.
Trading tag: #BinanceFutures #TradFi #USDⓈM #AXTI #AXTIUSDT $AXTI
99

·
--
In the past 24 hours, $AXTI fell 2.812%. Current price: 62.9. Funding rate: -0.00029104. Political and military events are roiling the market—capital is pulling out of risk assets, and this coin is getting hit right along with it.
The shorts are a bit crowded right now. Price is down, funding rate is negative—this suggests shorts are paying longs to hold the position, and the bearish consensus is too concentrated. Open interest is 121,700 contracts (not low), and shorts are piling in here betting on continued downside. The moment something stirs on the political front, risk-off sentiment rises, and $AXTI—an on-chain “US stock” contract—gets cut first.
The strongest counter-evidence is that the geopolitical conflict suddenly eases. If big-country relations improve and risk appetite returns, shorts could get squeezed upward in the opposite direction. Right now, the negative funding rate means shorts are paying the cost every day. If the price doesn’t keep falling and instead stabilizes or rises, they’ll have to swallow the loss and close—pushing the bounce.
Second-order impact: with shorts shouldering a negative funding rate, the longer it lasts, the higher their cost. If the price chops around near 62.9 without breaking down, shorts may run out of patience, and a wave of closes could cause a rapid upward move. Longs are currently “lying back and collecting”—but don’t get greedy; political events can flip the narrative at any moment.
Invalidation conditions: if $AXTI’s price holds above 63, or if the funding rate turns positive, the logic behind the current short-crowding squeeze breaks. All the numbers come from the pick field—no key figures were fabricated.
Three action scenarios: (1) Aggressive: go long with a light position now, set a stop-loss at 62.5, and try to catch a rebound from a short squeeze. (2) Conservative: wait until the funding rate turns positive before following, and confirm that sentiment has shifted. (3) Avoidant: don’t let FOMO get you—before the political event has a clear outcome, volatility may be too high and you can get hit from both sides.
Everyone is trying to dodge risk assets. I personally think at this level $AXTI has too many shorts crowded in, and the probability of a rebound is higher than the probability of continued decline.
Trading tag: #TradFi #链上美股 #AXTI
Where do you think this whole analysis is most likely to be wrong?
In the past 24 hours, $AXTI fell 2.812%. Current price: 62.9. Funding rate: -0.00029104. Political and military events are roiling the market—capital is pulling out of risk assets, and this coin is getting hit right along with it.
The shorts are a bit crowded right now. Price is down, funding rate is negative—this suggests shorts are paying longs to hold the position, and the bearish consensus is too concentrated. Open interest is 121,700 contracts (not low), and shorts are piling in here betting on continued downside. The moment something stirs on the political front, risk-off sentiment rises, and $AXTI —an on-chain “US stock” contract—gets cut first.
The strongest counter-evidence is that the geopolitical conflict suddenly eases. If big-country relations improve and risk appetite returns, shorts could get squeezed upward in the opposite direction. Right now, the negative funding rate means shorts are paying the cost every day. If the price doesn’t keep falling and instead stabilizes or rises, they’ll have to swallow the loss and close—pushing the bounce.
Second-order impact: with shorts shouldering a negative funding rate, the longer it lasts, the higher their cost. If the price chops around near 62.9 without breaking down, shorts may run out of patience, and a wave of closes could cause a rapid upward move. Longs are currently “lying back and collecting”—but don’t get greedy; political events can flip the narrative at any moment.
Invalidation conditions: if $AXTI ’s price holds above 63, or if the funding rate turns positive, the logic behind the current short-crowding squeeze breaks. All the numbers come from the pick field—no key figures were fabricated.
Three action scenarios: (1) Aggressive: go long with a light position now, set a stop-loss at 62.5, and try to catch a rebound from a short squeeze. (2) Conservative: wait until the funding rate turns positive before following, and confirm that sentiment has shifted. (3) Avoidant: don’t let FOMO get you—before the political event has a clear outcome, volatility may be too high and you can get hit from both sides.
Everyone is trying to dodge risk assets. I personally think at this level $AXTI has too many shorts crowded in, and the probability of a rebound is higher than the probability of continued decline.
Trading tag: #TradFi #链上美股 #AXTI
Where do you think this whole analysis is most likely to be wrong?
The shorts are a bit crowded right now. Price is down, funding rate is negative—this suggests shorts are paying longs to hold the position, and the bearish consensus is too concentrated. Open interest is 121,700 contracts (not low), and shorts are piling in here betting on continued downside. The moment something stirs on the political front, risk-off sentiment rises, and $AXTI —an on-chain “US stock” contract—gets cut first.
The strongest counter-evidence is that the geopolitical conflict suddenly eases. If big-country relations improve and risk appetite returns, shorts could get squeezed upward in the opposite direction. Right now, the negative funding rate means shorts are paying the cost every day. If the price doesn’t keep falling and instead stabilizes or rises, they’ll have to swallow the loss and close—pushing the bounce.
Second-order impact: with shorts shouldering a negative funding rate, the longer it lasts, the higher their cost. If the price chops around near 62.9 without breaking down, shorts may run out of patience, and a wave of closes could cause a rapid upward move. Longs are currently “lying back and collecting”—but don’t get greedy; political events can flip the narrative at any moment.
Invalidation conditions: if $AXTI ’s price holds above 63, or if the funding rate turns positive, the logic behind the current short-crowding squeeze breaks. All the numbers come from the pick field—no key figures were fabricated.
Three action scenarios: (1) Aggressive: go long with a light position now, set a stop-loss at 62.5, and try to catch a rebound from a short squeeze. (2) Conservative: wait until the funding rate turns positive before following, and confirm that sentiment has shifted. (3) Avoidant: don’t let FOMO get you—before the political event has a clear outcome, volatility may be too high and you can get hit from both sides.
Everyone is trying to dodge risk assets. I personally think at this level $AXTI has too many shorts crowded in, and the probability of a rebound is higher than the probability of continued decline.
Trading tag: #TradFi #链上美股 #AXTI
Where do you think this whole analysis is most likely to be wrong?
153
·
--
$AXTI is currently 62.9, down 2.812% over the past 24 hours. The funding rate is -0.00029104. The price is drifting lower, but the funding rate is negative. This combination is kind of interesting.
What’s going on? If the price is falling, it means sell pressure is pushing it down. But a negative funding rate means shorts are paying longs. Think about it: one side is suppressing the price, while at the same time they’re still paying interest. This isn’t a normal technical pullback. There’s some hard “short vs. short” pressure here—and they already have to pay to maintain their positions. I interpret this as a crowded bearish consensus. Now that the funding rate has reached -0.00029, every day shorts keep their positions open adds one more unit of cost. They’re using real money to bet that $AXTI will keep falling.
What’s the strongest counterargument? If there really is a major geopolitical event that hits the whole market and panic spreads, then a liquidity-not-top-tier asset like $AXTI could drop even harder. In that case, these shorts wouldn’t be “crowded” anymore—they’d be early. Their bet would pay off.
But the second-order effect is even more important. Shorts are paying, and time is on the longs’ side. Unless the price immediately dumps hard and blows up the longs, shorts’ position cost will increase day by day. In this kind of structure, once any positive catalyst appears or panic eases, the buying pressure from shorts closing is likely to push the price up quickly. They’ll be forced to stop out and limit losses on the short positions they’ve accumulated.
When does this thesis fail? If $AXTI’s price directly pulls back up with volume and holds above 62.9, that would indicate fresh capital is coming in to take the other side, and the pressure from the short squeeze begins to show—I’d then say my near-term crowded-bearish view is invalid. The current price is my observation level.
So in terms of action, I choose to wait. This isn’t the time to chase a short—the shorts are too crowded and are vulnerable to being squeezed. But it’s also not time to blindly go long, because the trend is still downward. I’ll watch how price behaves around 62.9. If it stabilizes below that level without breaking down further, I’ll consider using a small position to try a long trade to capture a short rebound, with the stop-loss placed below the previous low. If it breaks down directly and the funding rate turns positive, that means longs have effectively surrendered—I won’t touch it.
Everyone is watching for negative news from geopolitics. But for $AXTI’s order book, I actually think the geopolitical risk under a negative funding rate could be potential “ammo” for the longs. Can the shorts afford to wait? They’re paying for the privilege.
Trading tag: #TradFi #链上美股 #AXTI
Where do you think this setup is most likely to be wrong?
$AXTI is currently 62.9, down 2.812% over the past 24 hours. The funding rate is -0.00029104. The price is drifting lower, but the funding rate is negative. This combination is kind of interesting.
What’s going on? If the price is falling, it means sell pressure is pushing it down. But a negative funding rate means shorts are paying longs. Think about it: one side is suppressing the price, while at the same time they’re still paying interest. This isn’t a normal technical pullback. There’s some hard “short vs. short” pressure here—and they already have to pay to maintain their positions. I interpret this as a crowded bearish consensus. Now that the funding rate has reached -0.00029, every day shorts keep their positions open adds one more unit of cost. They’re using real money to bet that $AXTI will keep falling.
What’s the strongest counterargument? If there really is a major geopolitical event that hits the whole market and panic spreads, then a liquidity-not-top-tier asset like $AXTI could drop even harder. In that case, these shorts wouldn’t be “crowded” anymore—they’d be early. Their bet would pay off.
But the second-order effect is even more important. Shorts are paying, and time is on the longs’ side. Unless the price immediately dumps hard and blows up the longs, shorts’ position cost will increase day by day. In this kind of structure, once any positive catalyst appears or panic eases, the buying pressure from shorts closing is likely to push the price up quickly. They’ll be forced to stop out and limit losses on the short positions they’ve accumulated.
When does this thesis fail? If $AXTI ’s price directly pulls back up with volume and holds above 62.9, that would indicate fresh capital is coming in to take the other side, and the pressure from the short squeeze begins to show—I’d then say my near-term crowded-bearish view is invalid. The current price is my observation level.
So in terms of action, I choose to wait. This isn’t the time to chase a short—the shorts are too crowded and are vulnerable to being squeezed. But it’s also not time to blindly go long, because the trend is still downward. I’ll watch how price behaves around 62.9. If it stabilizes below that level without breaking down further, I’ll consider using a small position to try a long trade to capture a short rebound, with the stop-loss placed below the previous low. If it breaks down directly and the funding rate turns positive, that means longs have effectively surrendered—I won’t touch it.
Everyone is watching for negative news from geopolitics. But for $AXTI ’s order book, I actually think the geopolitical risk under a negative funding rate could be potential “ammo” for the longs. Can the shorts afford to wait? They’re paying for the privilege.
Trading tag: #TradFi #链上美股 #AXTI
Where do you think this setup is most likely to be wrong?
What’s going on? If the price is falling, it means sell pressure is pushing it down. But a negative funding rate means shorts are paying longs. Think about it: one side is suppressing the price, while at the same time they’re still paying interest. This isn’t a normal technical pullback. There’s some hard “short vs. short” pressure here—and they already have to pay to maintain their positions. I interpret this as a crowded bearish consensus. Now that the funding rate has reached -0.00029, every day shorts keep their positions open adds one more unit of cost. They’re using real money to bet that $AXTI will keep falling.
What’s the strongest counterargument? If there really is a major geopolitical event that hits the whole market and panic spreads, then a liquidity-not-top-tier asset like $AXTI could drop even harder. In that case, these shorts wouldn’t be “crowded” anymore—they’d be early. Their bet would pay off.
But the second-order effect is even more important. Shorts are paying, and time is on the longs’ side. Unless the price immediately dumps hard and blows up the longs, shorts’ position cost will increase day by day. In this kind of structure, once any positive catalyst appears or panic eases, the buying pressure from shorts closing is likely to push the price up quickly. They’ll be forced to stop out and limit losses on the short positions they’ve accumulated.
When does this thesis fail? If $AXTI ’s price directly pulls back up with volume and holds above 62.9, that would indicate fresh capital is coming in to take the other side, and the pressure from the short squeeze begins to show—I’d then say my near-term crowded-bearish view is invalid. The current price is my observation level.
So in terms of action, I choose to wait. This isn’t the time to chase a short—the shorts are too crowded and are vulnerable to being squeezed. But it’s also not time to blindly go long, because the trend is still downward. I’ll watch how price behaves around 62.9. If it stabilizes below that level without breaking down further, I’ll consider using a small position to try a long trade to capture a short rebound, with the stop-loss placed below the previous low. If it breaks down directly and the funding rate turns positive, that means longs have effectively surrendered—I won’t touch it.
Everyone is watching for negative news from geopolitics. But for $AXTI ’s order book, I actually think the geopolitical risk under a negative funding rate could be potential “ammo” for the longs. Can the shorts afford to wait? They’re paying for the privilege.
Trading tag: #TradFi #链上美股 #AXTI
Where do you think this setup is most likely to be wrong?
41
·
--
$AXTI In the past 24 hours, it fell 1.982%. The price is down to 64.29. The funding rate is stuck at zero and hasn’t moved. Open interest is 121,000 contracts. Trading volume is under $1.9 million, and the order book is as thin as a waterhole in the desert.
Old dog took a look: this selloff didn’t bring negative funding rates, meaning the shorts didn’t gain a clear advantage, but the longs also had no incentive to add positions. A zero funding rate means neither side is willing to pay the other—everything is frozen. OI of 121,000 contracts isn’t very high, suggesting weak positioning appetite. When price drops, it can easily trigger a chain of stop-losses, but there are currently no signs of panic selling. Single-signal read: price is falling along with zero funding— the market is waiting for a catalyst.
The strongest counter-evidence is that volume has shrunk badly. In conditions of insufficient liquidity, even small orders can push the price down. On the second-order effects: if it breaks below the 64 integer level, longs may be forced to stop out. Meanwhile, if shorts rebound up to above 65, they may cover. Liquidity could then concentrate toward the futures contracts.
My view is not to touch this level—wait until the funding rate turns negative or open interest rises meaningfully before considering. If the price holds above 65 and the funding rate turns positive, I’ll try a small long position. If it breaks below 63.5, I’ll leave and watch from the sidelines. Invalidation conditions: funding rate abnormality breaks above 0.01% or volume expands to over $3 million—then the current “stuck” assessment should be re-evaluated.
Trading tag: #BinanceFutures #TradFi #USDⓈM #AXTI #AXTIUSDT $AXTI
$AXTI In the past 24 hours, it fell 1.982%. The price is down to 64.29. The funding rate is stuck at zero and hasn’t moved. Open interest is 121,000 contracts. Trading volume is under $1.9 million, and the order book is as thin as a waterhole in the desert.
Old dog took a look: this selloff didn’t bring negative funding rates, meaning the shorts didn’t gain a clear advantage, but the longs also had no incentive to add positions. A zero funding rate means neither side is willing to pay the other—everything is frozen. OI of 121,000 contracts isn’t very high, suggesting weak positioning appetite. When price drops, it can easily trigger a chain of stop-losses, but there are currently no signs of panic selling. Single-signal read: price is falling along with zero funding— the market is waiting for a catalyst.
The strongest counter-evidence is that volume has shrunk badly. In conditions of insufficient liquidity, even small orders can push the price down. On the second-order effects: if it breaks below the 64 integer level, longs may be forced to stop out. Meanwhile, if shorts rebound up to above 65, they may cover. Liquidity could then concentrate toward the futures contracts.
My view is not to touch this level—wait until the funding rate turns negative or open interest rises meaningfully before considering. If the price holds above 65 and the funding rate turns positive, I’ll try a small long position. If it breaks below 63.5, I’ll leave and watch from the sidelines. Invalidation conditions: funding rate abnormality breaks above 0.01% or volume expands to over $3 million—then the current “stuck” assessment should be re-evaluated.
Trading tag: #BinanceFutures #TradFi #USDⓈM #AXTI #AXTIUSDT $AXTI
Old dog took a look: this selloff didn’t bring negative funding rates, meaning the shorts didn’t gain a clear advantage, but the longs also had no incentive to add positions. A zero funding rate means neither side is willing to pay the other—everything is frozen. OI of 121,000 contracts isn’t very high, suggesting weak positioning appetite. When price drops, it can easily trigger a chain of stop-losses, but there are currently no signs of panic selling. Single-signal read: price is falling along with zero funding— the market is waiting for a catalyst.
The strongest counter-evidence is that volume has shrunk badly. In conditions of insufficient liquidity, even small orders can push the price down. On the second-order effects: if it breaks below the 64 integer level, longs may be forced to stop out. Meanwhile, if shorts rebound up to above 65, they may cover. Liquidity could then concentrate toward the futures contracts.
My view is not to touch this level—wait until the funding rate turns negative or open interest rises meaningfully before considering. If the price holds above 65 and the funding rate turns positive, I’ll try a small long position. If it breaks below 63.5, I’ll leave and watch from the sidelines. Invalidation conditions: funding rate abnormality breaks above 0.01% or volume expands to over $3 million—then the current “stuck” assessment should be re-evaluated.
Trading tag: #BinanceFutures #TradFi #USDⓈM #AXTI #AXTIUSDT $AXTI
121

·
--
Disciplined execution requires clear levels before taking action—our tactical short parameters for $AXTI are now locked in.
⚡ $AXTI — SHORT SETUP
📍 Entry: 65.96 – 66.36
🎯 TP1: 65.17
🎯 TP2: 64.65
🎯 TP3: 63.86
🛑 Stop Loss: 66.75
Trade here 👇
📌 Trade management rules: see pinned post.
How are you positioning on $AXTI today? Drop your bias below and follow for daily trade frameworks!
#WriteToEarn #AXTI #CryptoTrading #BinanceSquare #Crypto
Disciplined execution requires clear levels before taking action—our tactical short parameters for $AXTI are now locked in.
⚡ $AXTI — SHORT SETUP
📍 Entry: 65.96 – 66.36
🎯 TP1: 65.17
🎯 TP2: 64.65
🎯 TP3: 63.86
🛑 Stop Loss: 66.75
Trade here 👇
📌 Trade management rules: see pinned post.
How are you positioning on $AXTI today? Drop your bias below and follow for daily trade frameworks!
#WriteToEarn #AXTI #CryptoTrading #BinanceSquare #Crypto
⚡ $AXTI — SHORT SETUP
📍 Entry: 65.96 – 66.36
🎯 TP1: 65.17
🎯 TP2: 64.65
🎯 TP3: 63.86
🛑 Stop Loss: 66.75
Trade here 👇
📌 Trade management rules: see pinned post.
How are you positioning on $AXTI today? Drop your bias below and follow for daily trade frameworks!
#WriteToEarn #AXTI #CryptoTrading #BinanceSquare #Crypto
33

·
--
$AXTI 24 hours fell 3.65%, current price 64.65. At the same time, the funding rate stayed at 0. Prices are moving downward, but long/short payments are balanced, with no extreme funding rates appearing.
This combination suggests that the decline is mainly driven by spot sell pressure, while participants in the derivatives market have not been aggressively hedging or chasing shorts. A funding rate returning to zero usually indicates the market has entered a waiting/observation phase, pending new directional signals. Currently, this is based on a single signal; it lacks cross-validation from changes in trading volume or open interest.
If spot sell pressure continues and the funding rate still cannot turn negative, this kind of slow bleed with no counterparty may persist.
Trading tag: #TradFi #链上美股 #AXTI
Where do you think this assessment is most likely to be wrong?
$AXTI 24 hours fell 3.65%, current price 64.65. At the same time, the funding rate stayed at 0. Prices are moving downward, but long/short payments are balanced, with no extreme funding rates appearing.
This combination suggests that the decline is mainly driven by spot sell pressure, while participants in the derivatives market have not been aggressively hedging or chasing shorts. A funding rate returning to zero usually indicates the market has entered a waiting/observation phase, pending new directional signals. Currently, this is based on a single signal; it lacks cross-validation from changes in trading volume or open interest.
If spot sell pressure continues and the funding rate still cannot turn negative, this kind of slow bleed with no counterparty may persist.
Trading tag: #TradFi #链上美股 #AXTI
Where do you think this assessment is most likely to be wrong?
This combination suggests that the decline is mainly driven by spot sell pressure, while participants in the derivatives market have not been aggressively hedging or chasing shorts. A funding rate returning to zero usually indicates the market has entered a waiting/observation phase, pending new directional signals. Currently, this is based on a single signal; it lacks cross-validation from changes in trading volume or open interest.
If spot sell pressure continues and the funding rate still cannot turn negative, this kind of slow bleed with no counterparty may persist.
Trading tag: #TradFi #链上美股 #AXTI
Where do you think this assessment is most likely to be wrong?
41
·
--
$AXTI 24 hours dropped 3.65%, to 64.65. The funding rate is 0, with an open position size of 121136.76.
Although the price fell, the open position size did not drop sharply in tandem—this combination is relatively rare. Typically, a sudden plunge is accompanied by liquidations due to leverage clearance. But since the positions haven’t moved, it suggests either that selling pressure in the spot market is driving the decline, or that the longs are hard-holding but haven’t yet reached the liquidation threshold. With the funding rate at zero, the market hasn’t shown extreme one-sided sentiment from either side for the moment.
Based on a single signal—there’s no macro news or sector-linked data.
Trading tag: #TradFi #链上美股 #AXTI
Where do you think this set of judgments is most likely to be wrong?
$AXTI 24 hours dropped 3.65%, to 64.65. The funding rate is 0, with an open position size of 121136.76.
Although the price fell, the open position size did not drop sharply in tandem—this combination is relatively rare. Typically, a sudden plunge is accompanied by liquidations due to leverage clearance. But since the positions haven’t moved, it suggests either that selling pressure in the spot market is driving the decline, or that the longs are hard-holding but haven’t yet reached the liquidation threshold. With the funding rate at zero, the market hasn’t shown extreme one-sided sentiment from either side for the moment.
Based on a single signal—there’s no macro news or sector-linked data.
Trading tag: #TradFi #链上美股 #AXTI
Where do you think this set of judgments is most likely to be wrong?
Although the price fell, the open position size did not drop sharply in tandem—this combination is relatively rare. Typically, a sudden plunge is accompanied by liquidations due to leverage clearance. But since the positions haven’t moved, it suggests either that selling pressure in the spot market is driving the decline, or that the longs are hard-holding but haven’t yet reached the liquidation threshold. With the funding rate at zero, the market hasn’t shown extreme one-sided sentiment from either side for the moment.
Based on a single signal—there’s no macro news or sector-linked data.
Trading tag: #TradFi #链上美股 #AXTI
Where do you think this set of judgments is most likely to be wrong?
58
·
--
2 currency pairs 30 minutes + 4 hours confluence indicates bearishness, the downtrend is fully confirmed 🔥
════════════════════
🟢 $AXTI 30 minutes Bearish signal
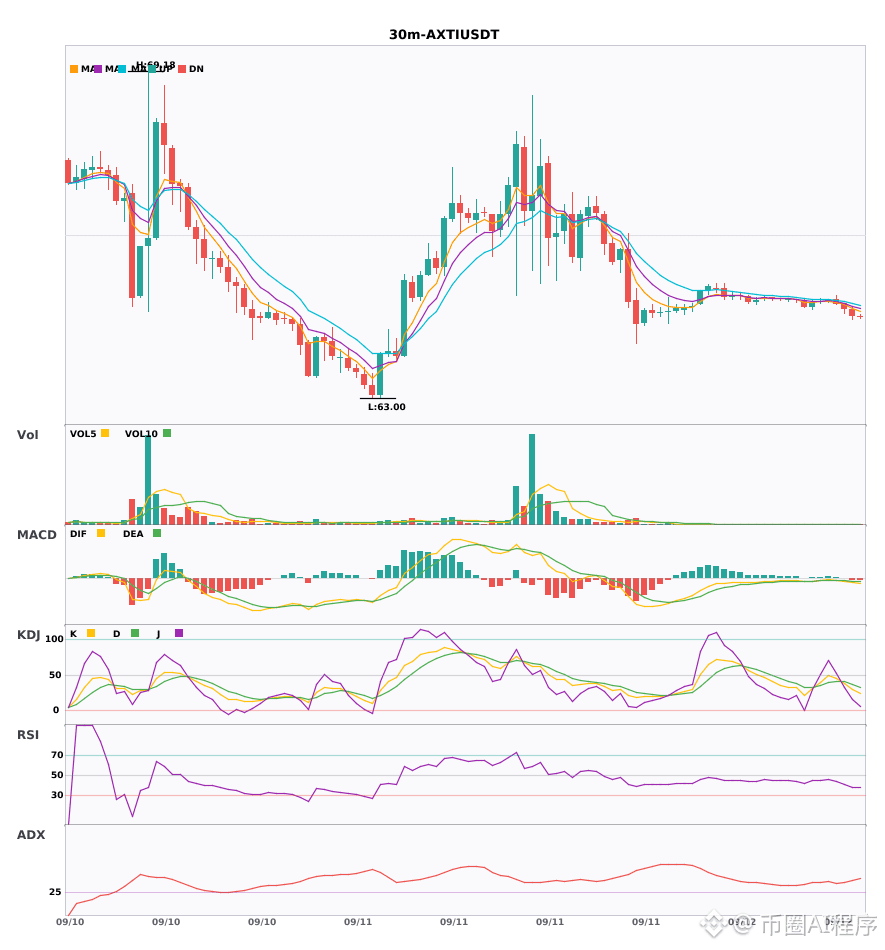
⚠️ Technicals: 4-hour bearish confluence confirmed | Enter at 30 minutes: MACD forms a dead cross below zero, bearish momentum accelerates | EMA5 < EMA8 < EMA13 (bearish alignment) | KDJ dead cross; near-term bearish (K=37.9, D=40.3) | Volume surge (3.2x)
════════════════════
🟢 $FF 30 minutes Bearish signal
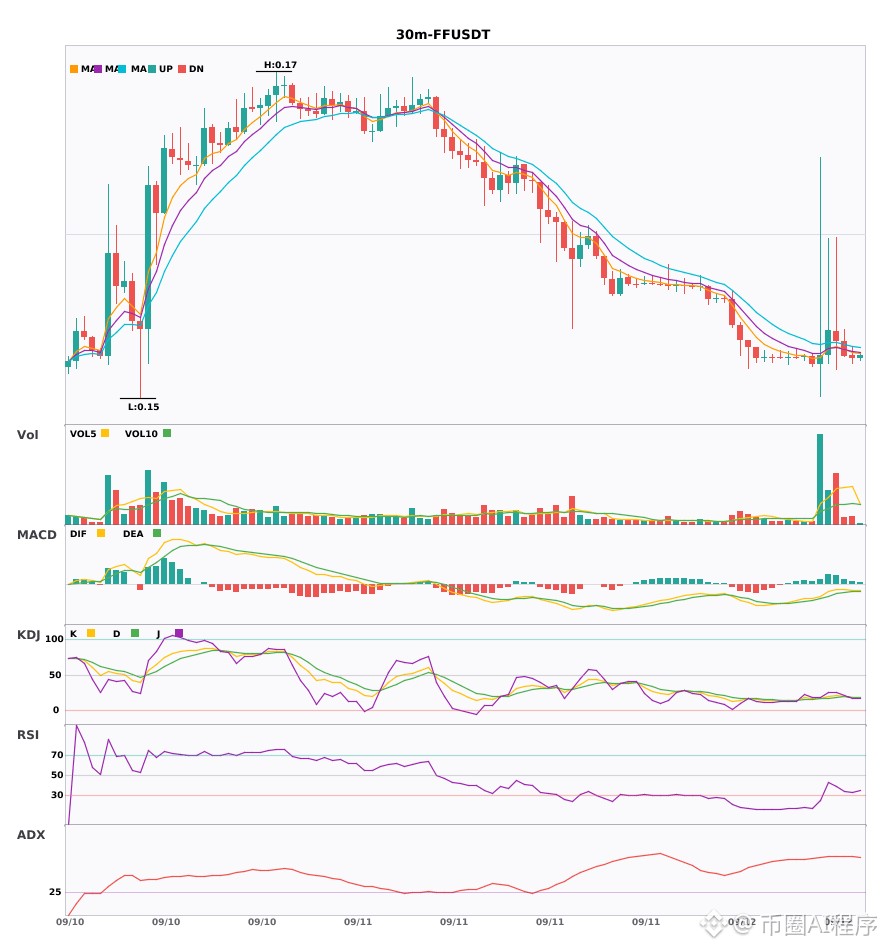
⚠️ Technicals: Multi-timeframe confluence signals bearishness! 4-hour bearish trend confirmed; on the 30-minute chart EMA5 crosses below EMA8 to turn bearish; KDJ has entered the oversold zone—watch for a rebound; volume surge 2.5x
════════════════════
🔔 Watch for first-hand market moves 🔔
#多周期共振 #AXTI #FF
📌 When trading, pay attention to whether the candlestick patterns match
2 currency pairs 30 minutes + 4 hours confluence indicates bearishness, the downtrend is fully confirmed 🔥
════════════════════
🟢 $AXTI 30 minutes Bearish signal
⚠️ Technicals: 4-hour bearish confluence confirmed | Enter at 30 minutes: MACD forms a dead cross below zero, bearish momentum accelerates | EMA5 < EMA8 < EMA13 (bearish alignment) | KDJ dead cross; near-term bearish (K=37.9, D=40.3) | Volume surge (3.2x)
════════════════════
🟢 $FF 30 minutes Bearish signal
⚠️ Technicals: Multi-timeframe confluence signals bearishness! 4-hour bearish trend confirmed; on the 30-minute chart EMA5 crosses below EMA8 to turn bearish; KDJ has entered the oversold zone—watch for a rebound; volume surge 2.5x
════════════════════
🔔 Watch for first-hand market moves 🔔
#多周期共振 #AXTI #FF
📌 When trading, pay attention to whether the candlestick patterns match
════════════════════
🟢 $AXTI 30 minutes Bearish signal
⚠️ Technicals: 4-hour bearish confluence confirmed | Enter at 30 minutes: MACD forms a dead cross below zero, bearish momentum accelerates | EMA5 < EMA8 < EMA13 (bearish alignment) | KDJ dead cross; near-term bearish (K=37.9, D=40.3) | Volume surge (3.2x)
════════════════════
🟢 $FF 30 minutes Bearish signal
⚠️ Technicals: Multi-timeframe confluence signals bearishness! 4-hour bearish trend confirmed; on the 30-minute chart EMA5 crosses below EMA8 to turn bearish; KDJ has entered the oversold zone—watch for a rebound; volume surge 2.5x
════════════════════
🔔 Watch for first-hand market moves 🔔
#多周期共振 #AXTI #FF
📌 When trading, pay attention to whether the candlestick patterns match
17

·
--
Beware! $WDC, $AXTI 30-minute-level, both have issued bearish warnings 🔥
════════════════════
🟢 $WDC 30-minute Bearish Signal
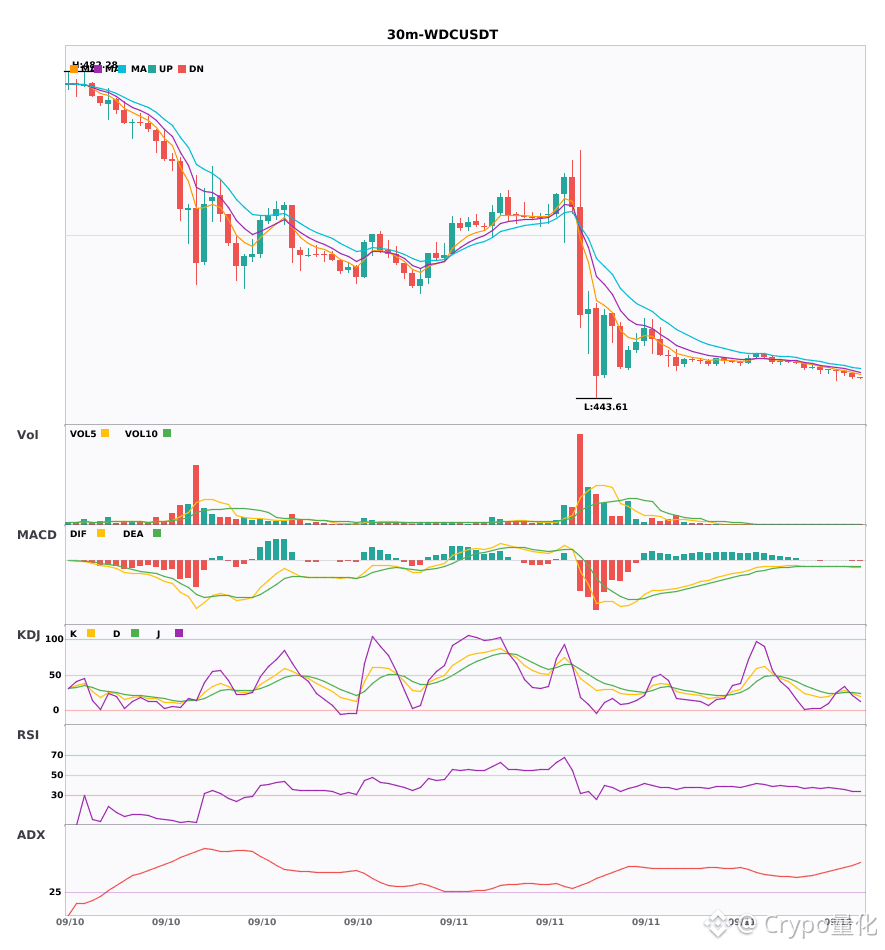
⚠️ Technicals: The trend is strong, but be careful of pullbacks. MACD forms a dead cross below zero, with the green histogram expanding; moving averages are arranged bearishly and pointing downward. KDJ is weak, with bearish dominance; volume surges by 2.6x
📢 Market update: Binance will support the cash dividend distribution for Western Digital (WDC) and NVIDIA (NVDA) through bStocks.
════════════════════
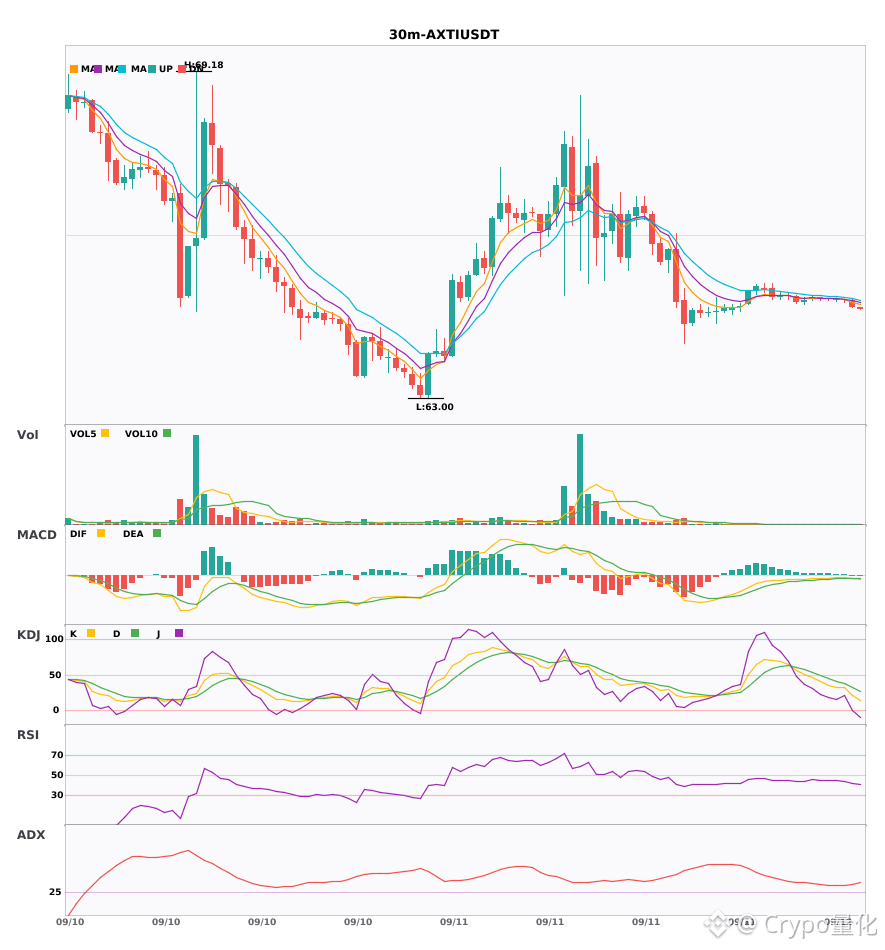
🟢 $AXTI 30-minute Bearish Signal
⚠️ Technicals: ADX(32) clearly indicates a trending market | MACD dead cross below zero; bearish momentum accelerates | EMA5 < EMA8 < EMA13 with a bearish alignment | KDJ weakly moves with bearish dominance (K is 21.6, D is 32.5) | Volume increases (2.3x)
════════════════════
🔔 Watch for first-hand alerts on price action anomalies 🔔
#技术分析 #WDC #AXTI
📌 When trading, pay attention to whether the candlestick pattern matches
Beware! $WDC , $AXTI 30-minute-level, both have issued bearish warnings 🔥
════════════════════
🟢 $WDC 30-minute Bearish Signal
⚠️ Technicals: The trend is strong, but be careful of pullbacks. MACD forms a dead cross below zero, with the green histogram expanding; moving averages are arranged bearishly and pointing downward. KDJ is weak, with bearish dominance; volume surges by 2.6x
📢 Market update: Binance will support the cash dividend distribution for Western Digital (WDC) and NVIDIA (NVDA) through bStocks.
════════════════════
🟢 $AXTI 30-minute Bearish Signal
⚠️ Technicals: ADX(32) clearly indicates a trending market | MACD dead cross below zero; bearish momentum accelerates | EMA5 < EMA8 < EMA13 with a bearish alignment | KDJ weakly moves with bearish dominance (K is 21.6, D is 32.5) | Volume increases (2.3x)
════════════════════
🔔 Watch for first-hand alerts on price action anomalies 🔔
#技术分析 #WDC #AXTI
📌 When trading, pay attention to whether the candlestick pattern matches
════════════════════
🟢 $WDC 30-minute Bearish Signal
⚠️ Technicals: The trend is strong, but be careful of pullbacks. MACD forms a dead cross below zero, with the green histogram expanding; moving averages are arranged bearishly and pointing downward. KDJ is weak, with bearish dominance; volume surges by 2.6x
📢 Market update: Binance will support the cash dividend distribution for Western Digital (WDC) and NVIDIA (NVDA) through bStocks.
════════════════════
🟢 $AXTI 30-minute Bearish Signal
⚠️ Technicals: ADX(32) clearly indicates a trending market | MACD dead cross below zero; bearish momentum accelerates | EMA5 < EMA8 < EMA13 with a bearish alignment | KDJ weakly moves with bearish dominance (K is 21.6, D is 32.5) | Volume increases (2.3x)
════════════════════
🔔 Watch for first-hand alerts on price action anomalies 🔔
#技术分析 #WDC #AXTI
📌 When trading, pay attention to whether the candlestick pattern matches
103

·
--
$AXTI #AXTI #Contract Trading
Short Alert | AXTI Key Zone Approaching
Large-Order Liquidation Zone 63.3052
1.7% from the current price
Upper Zone 65.4948
Lower Zone 63.3052
Current Price 64.8200
Trigger Level 63.3052
Invalidation Level 65.7979
Observation Level 63.3052 / 62.3032
Funding Rate +0.0000% (long/short balanced)
Market Clues: Below—50x long trigger zone / 1.7% from current price / 15m volume momentum 2.5x / RSI15=33.3
Near the large-order liquidation zone. You may wait for confirmation at the trigger level before shorting; the invalidation level is the stop-loss level.
$AXTI #AXTI #Contract Trading
Short Alert | AXTI Key Zone Approaching
Large-Order Liquidation Zone 63.3052
1.7% from the current price
Upper Zone 65.4948
Lower Zone 63.3052
Current Price 64.8200
Trigger Level 63.3052
Invalidation Level 65.7979
Observation Level 63.3052 / 62.3032
Funding Rate +0.0000% (long/short balanced)
Market Clues: Below—50x long trigger zone / 1.7% from current price / 15m volume momentum 2.5x / RSI15=33.3
Near the large-order liquidation zone. You may wait for confirmation at the trigger level before shorting; the invalidation level is the stop-loss level.
Short Alert | AXTI Key Zone Approaching
Large-Order Liquidation Zone 63.3052
1.7% from the current price
Upper Zone 65.4948
Lower Zone 63.3052
Current Price 64.8200
Trigger Level 63.3052
Invalidation Level 65.7979
Observation Level 63.3052 / 62.3032
Funding Rate +0.0000% (long/short balanced)
Market Clues: Below—50x long trigger zone / 1.7% from current price / 15m volume momentum 2.5x / RSI15=33.3
Near the large-order liquidation zone. You may wait for confirmation at the trigger level before shorting; the invalidation level is the stop-loss level.
3
·
--
$AXTI bought 65.6, down 3.54% over the past 24 hours; the funding rate is 0. The price is falling, but neither side is paying funding fees.
This suggests the longs are withdrawing—not getting squeezed out by the shorts. The downtrend hasn’t been accompanied by shorts stacking up, so the near-term selling pressure may not have fully been released yet. Next, if it breaks below around 64, there could be a stop-loss cascade.
From the contract structure, this kind of low-volatility, no-funding-fee grind is the most punishing. If there’s fundamental support here, maybe it won’t drop much—but I trade contracts, and if the structure is bad, then it’s bad. Entering long right now is like grabbing a falling knife.
I choose to short. I’ll place a sell limit order at the current price of 66.8, with 5x leverage. Stop-loss at 68.2, take-profit at 64.1, position size 20%.
If the price rebounds and trades above 67, then this thesis is invalid—I will close the position to admit the mistake.
Trading tag: #TradFi #链上美股 #AXTI
Where do you think this setup is most likely to be wrong?
$AXTI bought 65.6, down 3.54% over the past 24 hours; the funding rate is 0. The price is falling, but neither side is paying funding fees.
This suggests the longs are withdrawing—not getting squeezed out by the shorts. The downtrend hasn’t been accompanied by shorts stacking up, so the near-term selling pressure may not have fully been released yet. Next, if it breaks below around 64, there could be a stop-loss cascade.
From the contract structure, this kind of low-volatility, no-funding-fee grind is the most punishing. If there’s fundamental support here, maybe it won’t drop much—but I trade contracts, and if the structure is bad, then it’s bad. Entering long right now is like grabbing a falling knife.
I choose to short. I’ll place a sell limit order at the current price of 66.8, with 5x leverage. Stop-loss at 68.2, take-profit at 64.1, position size 20%.
If the price rebounds and trades above 67, then this thesis is invalid—I will close the position to admit the mistake.
Trading tag: #TradFi #链上美股 #AXTI
Where do you think this setup is most likely to be wrong?
This suggests the longs are withdrawing—not getting squeezed out by the shorts. The downtrend hasn’t been accompanied by shorts stacking up, so the near-term selling pressure may not have fully been released yet. Next, if it breaks below around 64, there could be a stop-loss cascade.
From the contract structure, this kind of low-volatility, no-funding-fee grind is the most punishing. If there’s fundamental support here, maybe it won’t drop much—but I trade contracts, and if the structure is bad, then it’s bad. Entering long right now is like grabbing a falling knife.
I choose to short. I’ll place a sell limit order at the current price of 66.8, with 5x leverage. Stop-loss at 68.2, take-profit at 64.1, position size 20%.
If the price rebounds and trades above 67, then this thesis is invalid—I will close the position to admit the mistake.
Trading tag: #TradFi #链上美股 #AXTI
Where do you think this setup is most likely to be wrong?
12
Log in to explore more content
Join global crypto users on Binance Square
⚡️ Get latest and useful information about crypto.
💬 Trusted by the world’s largest crypto exchange.
👍 Discover real insights from verified creators.
Email / Phone number
Trending Topics
1
#FedRateWatch
270,114 views
1,701 Discussing
2
#BitcoinSlidesTo$76000
3,819 views
58 Discussing
3
#BitcoinReboundsTo$79K
50,203 views
361 Discussing
4
#StrategyMarketCapPassesFord
10,005 views
327 Discussing
5
#ClarityActOddsHalveOnPolymarket
7,256 views
261 Discussing
6
#US30YTreasuryYieldTops5.40%
10,082 views
216 Discussing
7
#BessentEndorsesFinalClarityActDraft
27,979 views
525 Discussing
8
#ZamaOpens16ConfidentialMorphoVaults
10,392 views
253 Discussing
9
#USDCOnChainVolumeTops$100Trillion
1,546 views
37 Discussing
10
#BitcoinSpotETFsNetInflow$160M
2,427 views
92 Discussing