
#criptovisao
criptovisao
14,237 views
481 Discussing
Hot
Latest

·
--
🌙 Daily recap — CryptoVision
IN JUST A FEW LINES
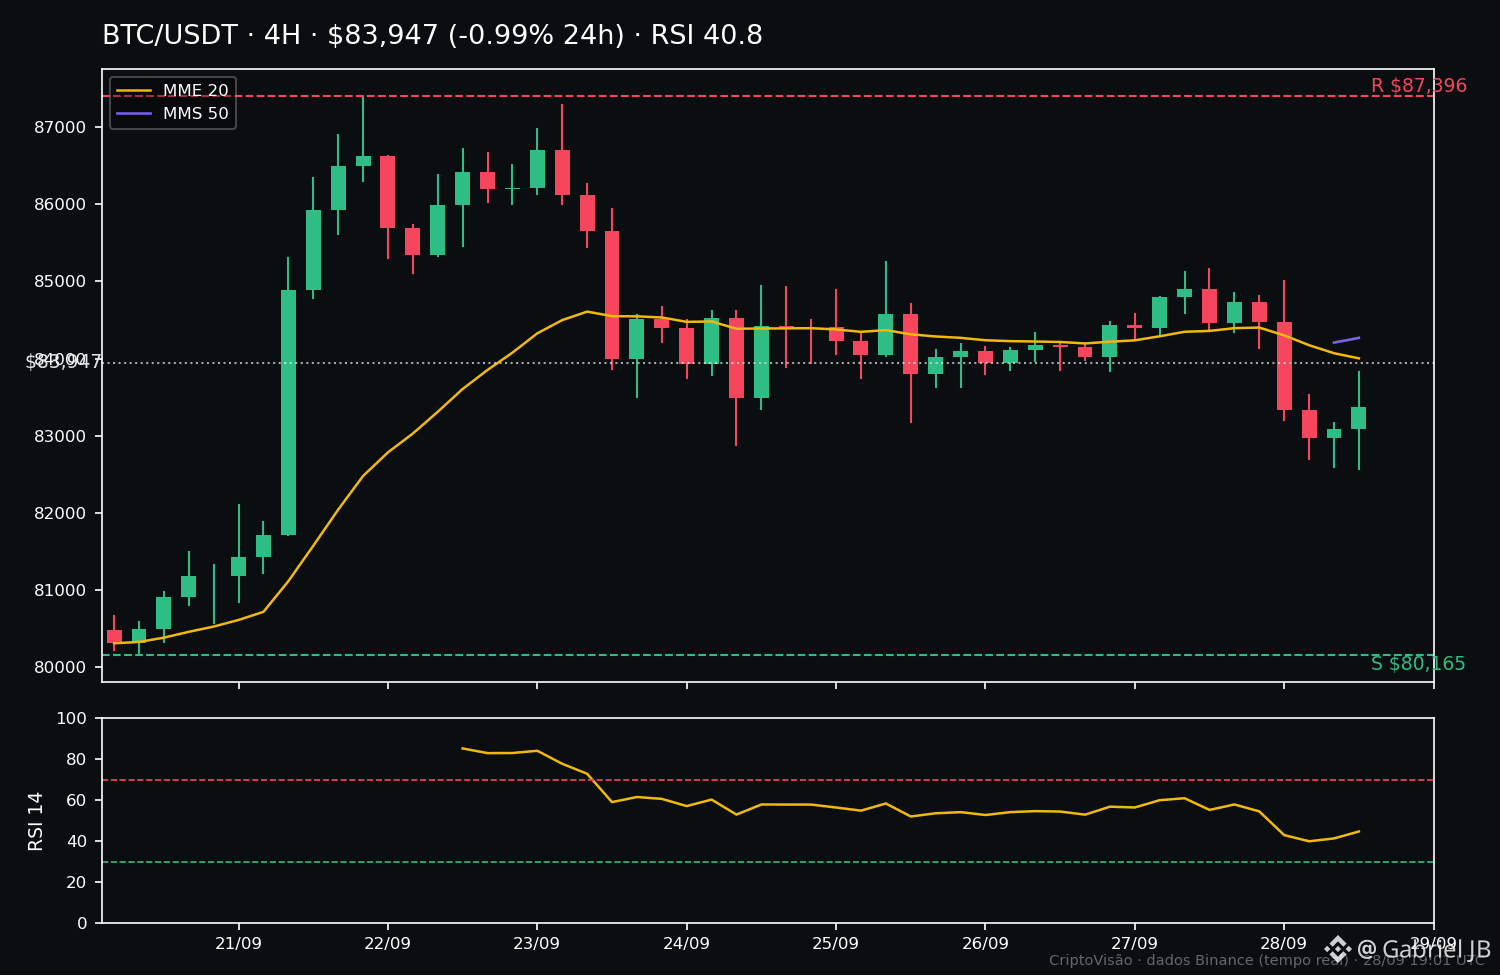
$BTC closed the day at $84.045 (-0.9% in 24h): held the $82.5k support, but still stays below the 4H moving averages (MME-20 $84.093, MMS-50 $84.268), RSI 40.8 — indecision until the end.
$ETH was the strongest of the day: $2.700 (+0.1% today, +3.9% on the week), already above both 4H averages, RSI 45.8.
$SOL pulled back to $120 (-2.7% today) but still keeps +9.4% on the week; the $117–118 zone held.
WHAT WAS CONFIRMED
— BTC: the $82.563 support held; the bearish continuation scenario from 17:30 didn’t materialize.
— ETH followed the 5pm scenario A: held $2.635, reclaimed the averages, and is on track to test $2.804.
— SOL: the $117–118 zone held, and the educational stop at $116 was never touched.
WHAT WAS NOT CONFIRMED
— BTC didn’t close above $84.2k: the recovery is incomplete and the short-term weakness wasn’t invalidated.
— SOL still hasn’t given the rejection confirmation with a strong 4H close above the zone.
LEVELS FOR TOMORROW
— BTC: closing above $84.2–84.3k invalidates the weakness; if $82.5k is lost, the next target is $80.1k.
— ETH: closing above $2.807 opens the week’s highs; if $2.635 is lost, the scenario is invalidated (next support $2.567).
— SOL: as long as it holds $117.4, the pullback remains valid; losing $116 changes the picture.
⚠️ Markets move from night to day. None of this is financial advice — and remember: if you have no position, there’s no loss.
#CriptoVisao #Bitcoin
🌙 Daily recap — CryptoVision
IN JUST A FEW LINES
$BTC closed the day at $84.045 (-0.9% in 24h): held the $82.5k support, but still stays below the 4H moving averages (MME-20 $84.093, MMS-50 $84.268), RSI 40.8 — indecision until the end.
$ETH was the strongest of the day: $2.700 (+0.1% today, +3.9% on the week), already above both 4H averages, RSI 45.8.
$SOL pulled back to $120 (-2.7% today) but still keeps +9.4% on the week; the $117–118 zone held.
WHAT WAS CONFIRMED
— BTC: the $82.563 support held; the bearish continuation scenario from 17:30 didn’t materialize.
— ETH followed the 5pm scenario A: held $2.635, reclaimed the averages, and is on track to test $2.804.
— SOL: the $117–118 zone held, and the educational stop at $116 was never touched.
WHAT WAS NOT CONFIRMED
— BTC didn’t close above $84.2k: the recovery is incomplete and the short-term weakness wasn’t invalidated.
— SOL still hasn’t given the rejection confirmation with a strong 4H close above the zone.
LEVELS FOR TOMORROW
— BTC: closing above $84.2–84.3k invalidates the weakness; if $82.5k is lost, the next target is $80.1k.
— ETH: closing above $2.807 opens the week’s highs; if $2.635 is lost, the scenario is invalidated (next support $2.567).
— SOL: as long as it holds $117.4, the pullback remains valid; losing $116 changes the picture.
⚠️ Markets move from night to day. None of this is financial advice — and remember: if you have no position, there’s no loss.
#CriptoVisao #Bitcoin
IN JUST A FEW LINES
$BTC closed the day at $84.045 (-0.9% in 24h): held the $82.5k support, but still stays below the 4H moving averages (MME-20 $84.093, MMS-50 $84.268), RSI 40.8 — indecision until the end.
$ETH was the strongest of the day: $2.700 (+0.1% today, +3.9% on the week), already above both 4H averages, RSI 45.8.
$SOL pulled back to $120 (-2.7% today) but still keeps +9.4% on the week; the $117–118 zone held.
WHAT WAS CONFIRMED
— BTC: the $82.563 support held; the bearish continuation scenario from 17:30 didn’t materialize.
— ETH followed the 5pm scenario A: held $2.635, reclaimed the averages, and is on track to test $2.804.
— SOL: the $117–118 zone held, and the educational stop at $116 was never touched.
WHAT WAS NOT CONFIRMED
— BTC didn’t close above $84.2k: the recovery is incomplete and the short-term weakness wasn’t invalidated.
— SOL still hasn’t given the rejection confirmation with a strong 4H close above the zone.
LEVELS FOR TOMORROW
— BTC: closing above $84.2–84.3k invalidates the weakness; if $82.5k is lost, the next target is $80.1k.
— ETH: closing above $2.807 opens the week’s highs; if $2.635 is lost, the scenario is invalidated (next support $2.567).
— SOL: as long as it holds $117.4, the pullback remains valid; losing $116 changes the picture.
⚠️ Markets move from night to day. None of this is financial advice — and remember: if you have no position, there’s no loss.
#CriptoVisao #Bitcoin
106
·
--
📊 MORNING OVERVIEW — CryptoVision
SITUATION
The market opens the month in balance mode: the three majors are green over 24h, but the strength indicators are all in the neutral zone and the 4H trends are unclear. This is a day for compression, not for chasing.
LEVELS (4H, real-time data)
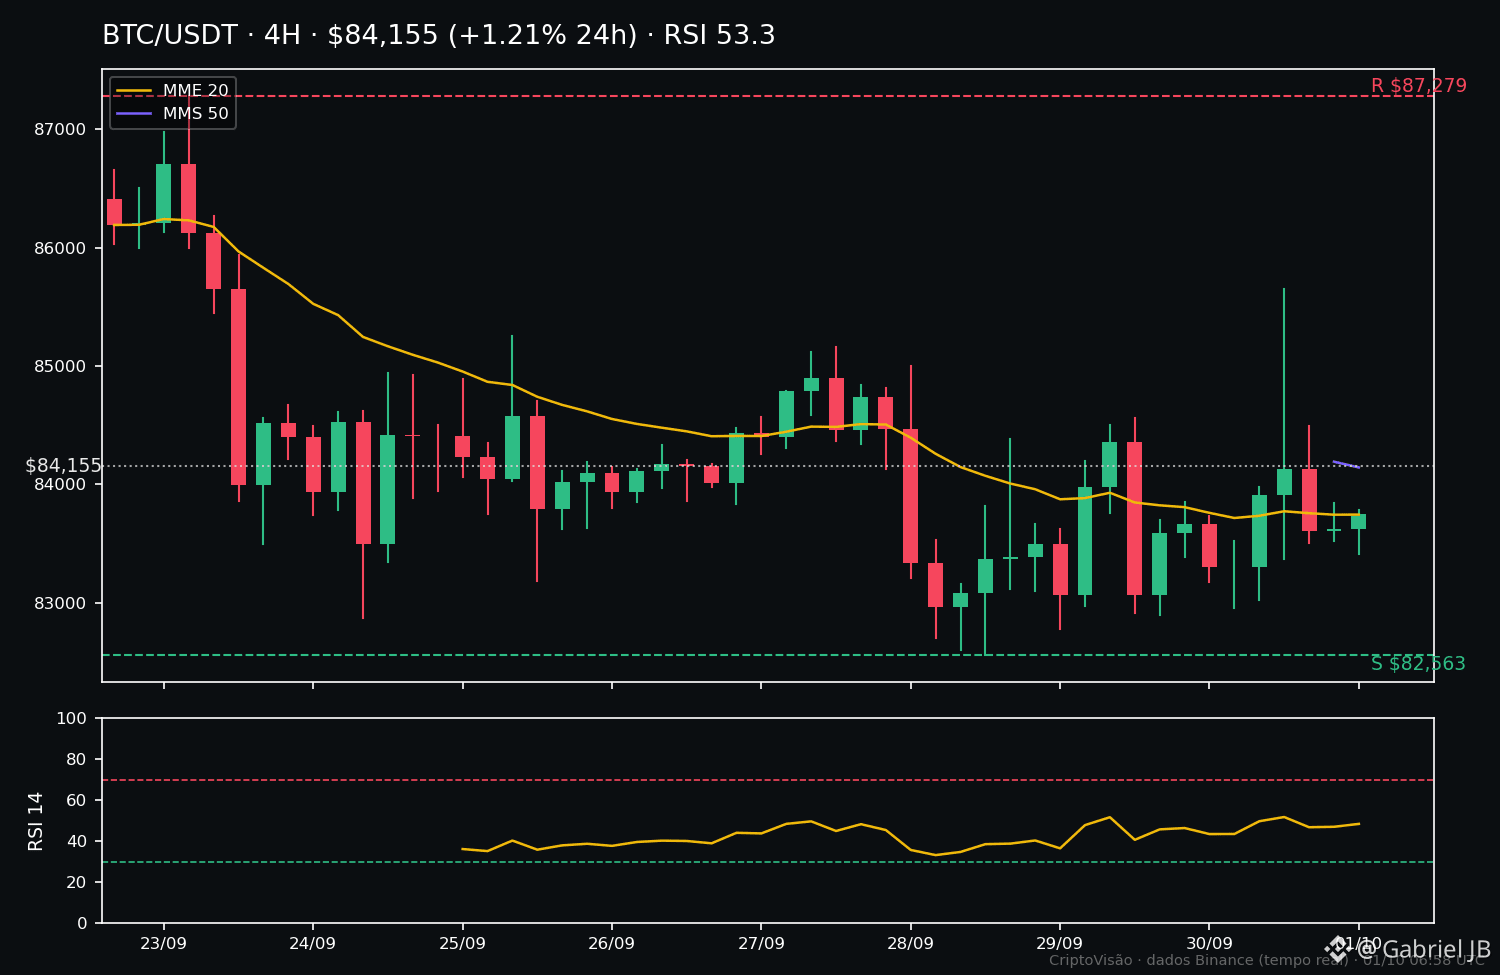
• $BTC — $84.155 (+1,21% 24h), RSI 53.3. Squeezed between the 20 ($83.574) and 50 ($84.144) period moving averages: support $82.563, resistance $87.279.
• $ETH — $2.716 (+1,95% 24h), RSI 54. Above both averages; upper end of the weekly range ($2.600–$2.789): support $2.600, resistance $2.789.
• $SOL — $119.31 (+0,84% 24h), RSI 51.4. Mid of the weekly range: support $112.52, resistance $124.95.
SCENARIO A (slight buyer bias)
As long as $BTC holds $83.500, the market keeps this week’s recovery structure — $ETH leads the relative move and tries to test the $2.789 top.
SCENARIO B (neutral/weak)
If $BTC loses $83.500 with the averages crossing down, the path opens up to $82.500 and the alts follow with the correction.
WHAT WOULD CONFIRM
A 4H close of $BTC above $84.500 confirms Scenario A; a loss of $83.000 confirms B. Until then, the market is deciding — patience pays more than haste.
RISK
A tight range + low morning volatility often misleads: false breakouts in both directions are common before real volume arrives. Anyone entering in the middle of the range pays the premium.
CONCLUSION
Neutral bias with a slight buying tilt, conditioned on the levels: $BTC is the day’s barometer. Hold $83.500 → probability favors continuation; lose it → it turns defensive. No strong directional conviction until the 4H trend is defined.
#CriptoVisao #Bitcoin
📊 MORNING OVERVIEW — CryptoVision
SITUATION
The market opens the month in balance mode: the three majors are green over 24h, but the strength indicators are all in the neutral zone and the 4H trends are unclear. This is a day for compression, not for chasing.
LEVELS (4H, real-time data)
• $BTC — $84.155 (+1,21% 24h), RSI 53.3. Squeezed between the 20 ($83.574) and 50 ($84.144) period moving averages: support $82.563, resistance $87.279.
• $ETH — $2.716 (+1,95% 24h), RSI 54. Above both averages; upper end of the weekly range ($2.600–$2.789): support $2.600, resistance $2.789.
• $SOL — $119.31 (+0,84% 24h), RSI 51.4. Mid of the weekly range: support $112.52, resistance $124.95.
SCENARIO A (slight buyer bias)
As long as $BTC holds $83.500, the market keeps this week’s recovery structure — $ETH leads the relative move and tries to test the $2.789 top.
SCENARIO B (neutral/weak)
If $BTC loses $83.500 with the averages crossing down, the path opens up to $82.500 and the alts follow with the correction.
WHAT WOULD CONFIRM
A 4H close of $BTC above $84.500 confirms Scenario A; a loss of $83.000 confirms B. Until then, the market is deciding — patience pays more than haste.
RISK
A tight range + low morning volatility often misleads: false breakouts in both directions are common before real volume arrives. Anyone entering in the middle of the range pays the premium.
CONCLUSION
Neutral bias with a slight buying tilt, conditioned on the levels: $BTC is the day’s barometer. Hold $83.500 → probability favors continuation; lose it → it turns defensive. No strong directional conviction until the 4H trend is defined.
#CriptoVisao #Bitcoin
SITUATION
The market opens the month in balance mode: the three majors are green over 24h, but the strength indicators are all in the neutral zone and the 4H trends are unclear. This is a day for compression, not for chasing.
LEVELS (4H, real-time data)
• $BTC — $84.155 (+1,21% 24h), RSI 53.3. Squeezed between the 20 ($83.574) and 50 ($84.144) period moving averages: support $82.563, resistance $87.279.
• $ETH — $2.716 (+1,95% 24h), RSI 54. Above both averages; upper end of the weekly range ($2.600–$2.789): support $2.600, resistance $2.789.
• $SOL — $119.31 (+0,84% 24h), RSI 51.4. Mid of the weekly range: support $112.52, resistance $124.95.
SCENARIO A (slight buyer bias)
As long as $BTC holds $83.500, the market keeps this week’s recovery structure — $ETH leads the relative move and tries to test the $2.789 top.
SCENARIO B (neutral/weak)
If $BTC loses $83.500 with the averages crossing down, the path opens up to $82.500 and the alts follow with the correction.
WHAT WOULD CONFIRM
A 4H close of $BTC above $84.500 confirms Scenario A; a loss of $83.000 confirms B. Until then, the market is deciding — patience pays more than haste.
RISK
A tight range + low morning volatility often misleads: false breakouts in both directions are common before real volume arrives. Anyone entering in the middle of the range pays the premium.
CONCLUSION
Neutral bias with a slight buying tilt, conditioned on the levels: $BTC is the day’s barometer. Hold $83.500 → probability favors continuation; lose it → it turns defensive. No strong directional conviction until the 4H trend is defined.
#CriptoVisao #Bitcoin
163
·
--
🌙 DAILY SUMMARY — CryptoVision
THE DAY IN A FEW LINES
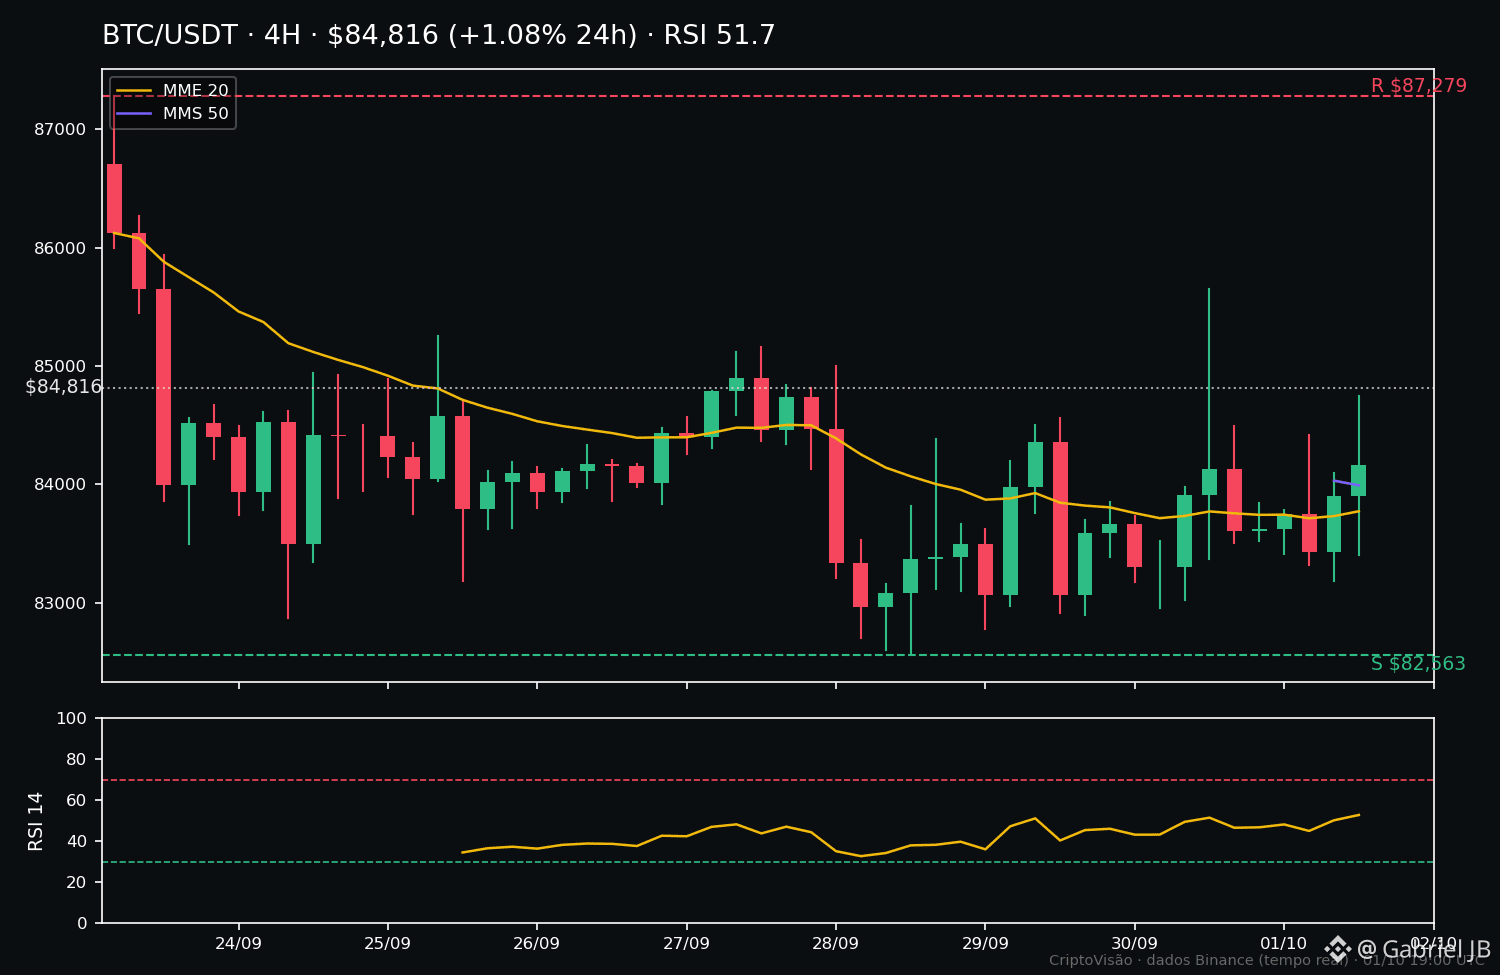
A compression day, as the morning forecast suggested. $BTC closed at $84.802 (+1.01% 24h; -2.28% 7d), RSI 51.7, between the 24h high and low ($83.186–$85.274), above both moving averages (MME-20: $83.611; MMS-50: $83.993). $ETH closed at $2.700 (+0.77% 24h; -2.20% 7d), RSI 44.4, stuck to the averages — sideways, with no direction. $SOL was the weakest: $118.38 (-0.29% 24h), RSI 40.3, already below both moving averages ($118.59/$118.90).
WHAT WAS CONFIRMED:
— Morning Scenario A: $BTC held $83.500 all day (24h low: $83.186) and closed above $84.500. The week’s recovery structure remains intact.
— $ETH did not break any extreme: it closed the day trapped between the averages, exactly the “noise, not trend” from 12:30.
— At 20:00 we said the $BTC was technically stronger than the $ETH — relative leadership held up until the close.
WHAT WAS NOT CONFIRMED:
— The buying impulse didn’t go beyond $ETH: the morning expected a test at $2.789 — the day’s high ended up at $2.722.
— $SOL never reacted to the 4h averages; it finished the day below them, with the lowest RSI among the three majors.
FOR TOMORROW (conditional)
— $BTC: if it closes 4h above $85.274 (24h high), the path opens to $87.279 (7d high). If it loses $83.993 (MMS-50), the target shifts to $83.186 and then $82.563.
— $ETH: while it stays between $2.668 and $2.722, it’s range-bound. Only a clean close outside this range sets direction — either toward $2.789 or $2.600.
— $SOL: below the averages is defensive. It needs to recover $118.90 to get back in the game; below $112.52 it spoils for good.
⚠️ Markets change overnight — these levels are for observing, not chasing. If you have no position, there’s no loss.
#CriptoVisao #Bitcoin
🌙 DAILY SUMMARY — CryptoVision
THE DAY IN A FEW LINES
A compression day, as the morning forecast suggested. $BTC closed at $84.802 (+1.01% 24h; -2.28% 7d), RSI 51.7, between the 24h high and low ($83.186–$85.274), above both moving averages (MME-20: $83.611; MMS-50: $83.993). $ETH closed at $2.700 (+0.77% 24h; -2.20% 7d), RSI 44.4, stuck to the averages — sideways, with no direction. $SOL was the weakest: $118.38 (-0.29% 24h), RSI 40.3, already below both moving averages ($118.59/$118.90).
WHAT WAS CONFIRMED:
— Morning Scenario A: $BTC held $83.500 all day (24h low: $83.186) and closed above $84.500. The week’s recovery structure remains intact.
— $ETH did not break any extreme: it closed the day trapped between the averages, exactly the “noise, not trend” from 12:30.
— At 20:00 we said the $BTC was technically stronger than the $ETH — relative leadership held up until the close.
WHAT WAS NOT CONFIRMED:
— The buying impulse didn’t go beyond $ETH : the morning expected a test at $2.789 — the day’s high ended up at $2.722.
— $SOL never reacted to the 4h averages; it finished the day below them, with the lowest RSI among the three majors.
FOR TOMORROW (conditional)
— $BTC : if it closes 4h above $85.274 (24h high), the path opens to $87.279 (7d high). If it loses $83.993 (MMS-50), the target shifts to $83.186 and then $82.563.
— $ETH : while it stays between $2.668 and $2.722, it’s range-bound. Only a clean close outside this range sets direction — either toward $2.789 or $2.600.
— $SOL : below the averages is defensive. It needs to recover $118.90 to get back in the game; below $112.52 it spoils for good.
⚠️ Markets change overnight — these levels are for observing, not chasing. If you have no position, there’s no loss.
#CriptoVisao #Bitcoin
THE DAY IN A FEW LINES
A compression day, as the morning forecast suggested. $BTC closed at $84.802 (+1.01% 24h; -2.28% 7d), RSI 51.7, between the 24h high and low ($83.186–$85.274), above both moving averages (MME-20: $83.611; MMS-50: $83.993). $ETH closed at $2.700 (+0.77% 24h; -2.20% 7d), RSI 44.4, stuck to the averages — sideways, with no direction. $SOL was the weakest: $118.38 (-0.29% 24h), RSI 40.3, already below both moving averages ($118.59/$118.90).
WHAT WAS CONFIRMED:
— Morning Scenario A: $BTC held $83.500 all day (24h low: $83.186) and closed above $84.500. The week’s recovery structure remains intact.
— $ETH did not break any extreme: it closed the day trapped between the averages, exactly the “noise, not trend” from 12:30.
— At 20:00 we said the $BTC was technically stronger than the $ETH — relative leadership held up until the close.
WHAT WAS NOT CONFIRMED:
— The buying impulse didn’t go beyond $ETH : the morning expected a test at $2.789 — the day’s high ended up at $2.722.
— $SOL never reacted to the 4h averages; it finished the day below them, with the lowest RSI among the three majors.
FOR TOMORROW (conditional)
— $BTC : if it closes 4h above $85.274 (24h high), the path opens to $87.279 (7d high). If it loses $83.993 (MMS-50), the target shifts to $83.186 and then $82.563.
— $ETH : while it stays between $2.668 and $2.722, it’s range-bound. Only a clean close outside this range sets direction — either toward $2.789 or $2.600.
— $SOL : below the averages is defensive. It needs to recover $118.90 to get back in the game; below $112.52 it spoils for good.
⚠️ Markets change overnight — these levels are for observing, not chasing. If you have no position, there’s no loss.
#CriptoVisao #Bitcoin
84
·
--
BTC vs ETH: Which is holding up better in the downturn? 📊
Both are down today, but not by the same amount. Fresh figures (12/11, ~8 p.m. CAT):
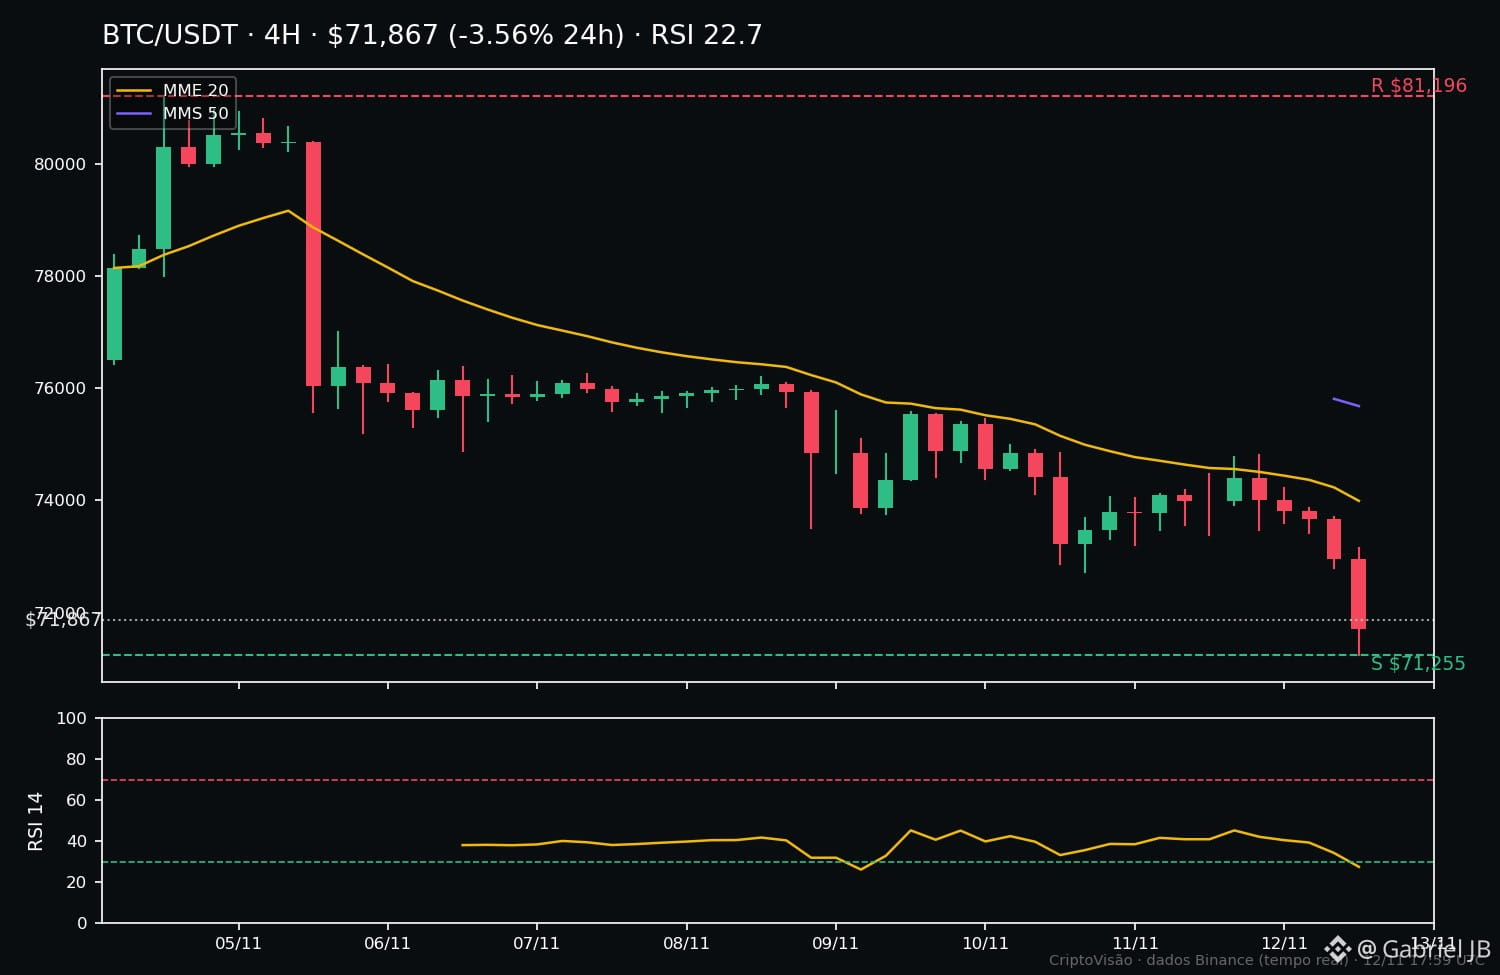
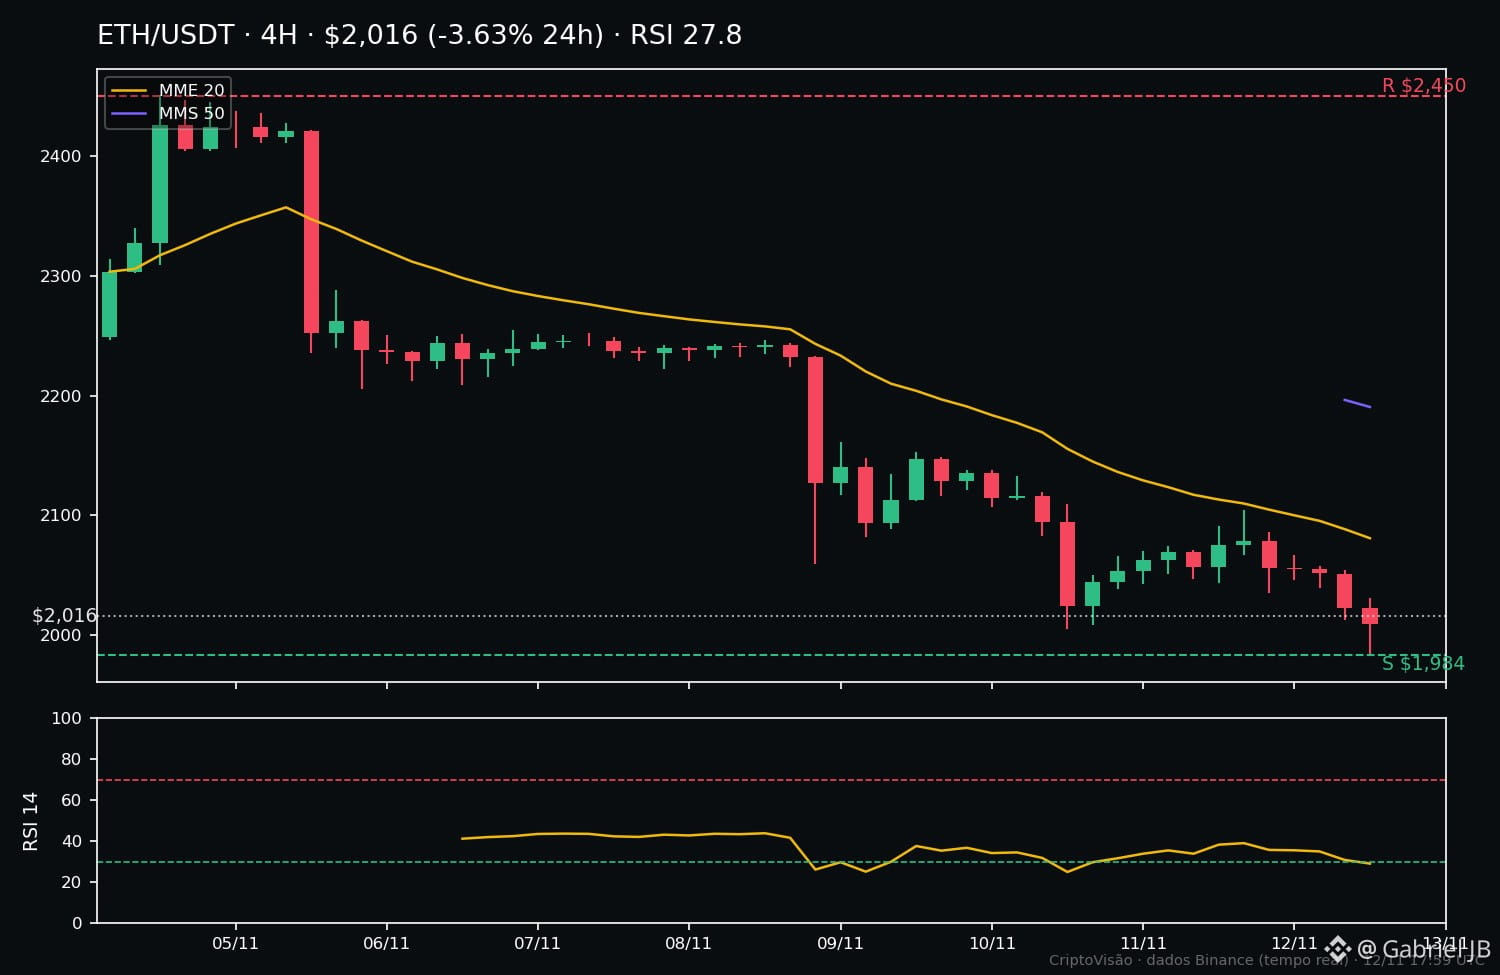
$BTC — US$ 71.887 | 24h: -3,56% | 7 days: -8,23% | RSI-14: 22,7 (oversold) | below the SMA-20 (US$ 74.043) and the SMA-50 (US$ 75.681) | 7-day support: US$ 71.255
$ETH — US$ 2.016 | 24h: -3,62% | 7 days: -12,78% | RSI-14: 27,8 (oversold) | below the SMA-20 (US$ 2.076) and the SMA-50 (US$ 2.191) | 7-day support: US$ 1.984
Which is stronger? $BTC — and the difference is in the weekly performance: ETH is down 12,78% over 7 days versus 8,23% for BTC, and is 8% below its 50-period average, compared with 5% for BTC. Over the past 24 hours, it was almost a tie (-3,56% vs -3,62%).
What does this suggest? In a falling market, capital tends to take shelter in the larger asset: BTC is losing less, which points to defensive rotation—not ETH leadership. Both are oversold and below their averages, meaning weakness across the board, with BTC simply proving more resilient.
Caution: one day does not make a trend. Relative strength can change quickly, and being oversold is not a buy signal—it’s just a gauge of selling pressure.
In your view, will ETH regain its momentum, or will BTC continue to dominate? 👇
#Bitcoin #Ethereum #CriptoVisao
BTC vs ETH: Which is holding up better in the downturn? 📊
Both are down today, but not by the same amount. Fresh figures (12/11, ~8 p.m. CAT):
$BTC — US$ 71.887 | 24h: -3,56% | 7 days: -8,23% | RSI-14: 22,7 (oversold) | below the SMA-20 (US$ 74.043) and the SMA-50 (US$ 75.681) | 7-day support: US$ 71.255
$ETH — US$ 2.016 | 24h: -3,62% | 7 days: -12,78% | RSI-14: 27,8 (oversold) | below the SMA-20 (US$ 2.076) and the SMA-50 (US$ 2.191) | 7-day support: US$ 1.984
Which is stronger? $BTC — and the difference is in the weekly performance: ETH is down 12,78% over 7 days versus 8,23% for BTC, and is 8% below its 50-period average, compared with 5% for BTC. Over the past 24 hours, it was almost a tie (-3,56% vs -3,62%).
What does this suggest? In a falling market, capital tends to take shelter in the larger asset: BTC is losing less, which points to defensive rotation—not ETH leadership. Both are oversold and below their averages, meaning weakness across the board, with BTC simply proving more resilient.
Caution: one day does not make a trend. Relative strength can change quickly, and being oversold is not a buy signal—it’s just a gauge of selling pressure.
In your view, will ETH regain its momentum, or will BTC continue to dominate? 👇
#Bitcoin #Ethereum #CriptoVisao
Both are down today, but not by the same amount. Fresh figures (12/11, ~8 p.m. CAT):
$BTC — US$ 71.887 | 24h: -3,56% | 7 days: -8,23% | RSI-14: 22,7 (oversold) | below the SMA-20 (US$ 74.043) and the SMA-50 (US$ 75.681) | 7-day support: US$ 71.255
$ETH — US$ 2.016 | 24h: -3,62% | 7 days: -12,78% | RSI-14: 27,8 (oversold) | below the SMA-20 (US$ 2.076) and the SMA-50 (US$ 2.191) | 7-day support: US$ 1.984
Which is stronger? $BTC — and the difference is in the weekly performance: ETH is down 12,78% over 7 days versus 8,23% for BTC, and is 8% below its 50-period average, compared with 5% for BTC. Over the past 24 hours, it was almost a tie (-3,56% vs -3,62%).
What does this suggest? In a falling market, capital tends to take shelter in the larger asset: BTC is losing less, which points to defensive rotation—not ETH leadership. Both are oversold and below their averages, meaning weakness across the board, with BTC simply proving more resilient.
Caution: one day does not make a trend. Relative strength can change quickly, and being oversold is not a buy signal—it’s just a gauge of selling pressure.
In your view, will ETH regain its momentum, or will BTC continue to dominate? 👇
#Bitcoin #Ethereum #CriptoVisao
20
·
--
SOL tests 7-day low: will support at $81.34 hold? 📉
SITUATION
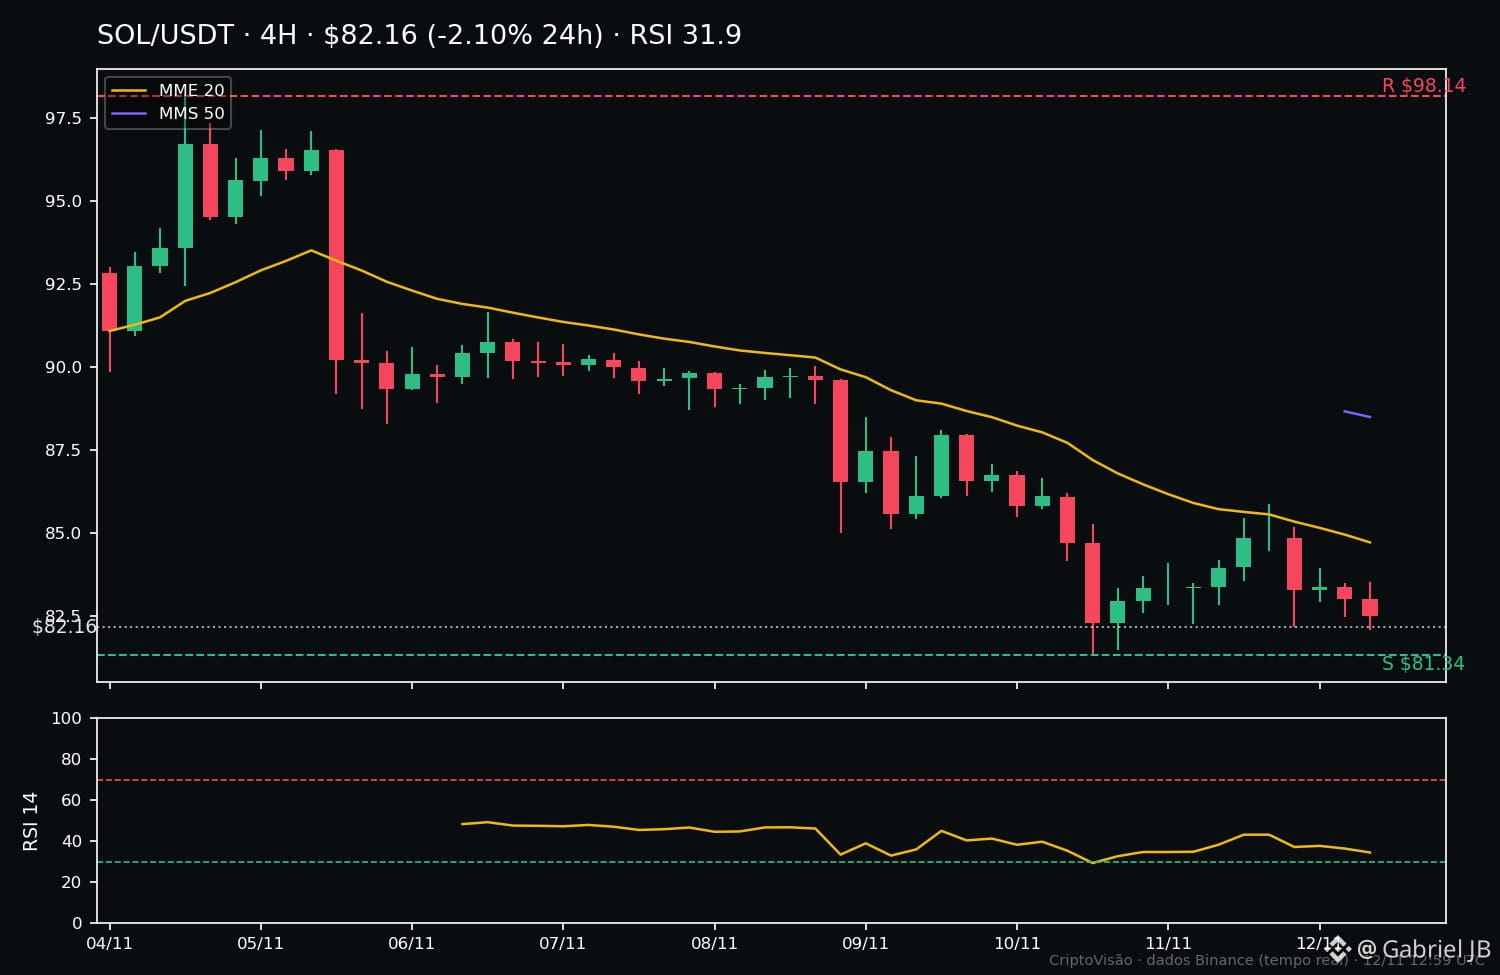
Solana ($SOL) is trading at $82.19, down 2.1% in 24 hours and 9.4% in 7 days. The price is hovering near the week's low ($81.34), and the RSI-14 is at 31.9, close to oversold territory. 24-hour volume is $138.9 million—the highest among the three altcoins analyzed today (SOL, DOGE, and XRP). On the 4-hour chart, the price remains below the 20-period ($84.53) and 50-period ($88.49) moving averages: the short-term trend remains bearish.
LEVELS
• Support: $81.34 (7-day low)
• Resistance: $85.85 (24-hour high) and $88.49 (50-period moving average)
• Major resistance: $98.14 (7-day high)
SCENARIO A — Support holds
If the price defends $81.34 and the RSI starts to rise from oversold territory, the first recovery target is around $85.85. Above that, $88.49.
SCENARIO B — Support breaks
If the price closes below $81.34 on high volume, the decline could accelerate—and the next support has no recent reference point from the past 7 days, meaning the price has no nearby safety net.
WHAT WOULD CONFIRM IT
A 4-hour close above $85.85 would confirm buying strength; a break below $81.34 with a close underneath would confirm the downtrend's continuation. Until then, this is just a test of support—not a decision.
RISK
Altcoins are more volatile and have wider spreads than BTC: a stop that's too tight can get swept up by market noise. Traders need to size their positions to account for the size of the move—and never trade with money they can't afford to lose. Avoid excessive leverage.
CONCLUSION
SOL is at the week's most interesting point: testing support with the RSI nearly oversold. Holding or breaking through will determine the next move—and the answer comes from the price, not anyone's opinion. Would you trade a support test like this, or would you rather wait for confirmation?
#Solana #CriptoVisao #AnaliseTecnica
SOL tests 7-day low: will support at $81.34 hold? 📉
SITUATION
Solana ($SOL ) is trading at $82.19, down 2.1% in 24 hours and 9.4% in 7 days. The price is hovering near the week's low ($81.34), and the RSI-14 is at 31.9, close to oversold territory. 24-hour volume is $138.9 million—the highest among the three altcoins analyzed today (SOL, DOGE, and XRP). On the 4-hour chart, the price remains below the 20-period ($84.53) and 50-period ($88.49) moving averages: the short-term trend remains bearish.
LEVELS
• Support: $81.34 (7-day low)
• Resistance: $85.85 (24-hour high) and $88.49 (50-period moving average)
• Major resistance: $98.14 (7-day high)
SCENARIO A — Support holds
If the price defends $81.34 and the RSI starts to rise from oversold territory, the first recovery target is around $85.85. Above that, $88.49.
SCENARIO B — Support breaks
If the price closes below $81.34 on high volume, the decline could accelerate—and the next support has no recent reference point from the past 7 days, meaning the price has no nearby safety net.
WHAT WOULD CONFIRM IT
A 4-hour close above $85.85 would confirm buying strength; a break below $81.34 with a close underneath would confirm the downtrend's continuation. Until then, this is just a test of support—not a decision.
RISK
Altcoins are more volatile and have wider spreads than BTC: a stop that's too tight can get swept up by market noise. Traders need to size their positions to account for the size of the move—and never trade with money they can't afford to lose. Avoid excessive leverage.
CONCLUSION
SOL is at the week's most interesting point: testing support with the RSI nearly oversold. Holding or breaking through will determine the next move—and the answer comes from the price, not anyone's opinion. Would you trade a support test like this, or would you rather wait for confirmation?
#Solana #CriptoVisao #AnaliseTecnica
SITUATION
Solana ($SOL ) is trading at $82.19, down 2.1% in 24 hours and 9.4% in 7 days. The price is hovering near the week's low ($81.34), and the RSI-14 is at 31.9, close to oversold territory. 24-hour volume is $138.9 million—the highest among the three altcoins analyzed today (SOL, DOGE, and XRP). On the 4-hour chart, the price remains below the 20-period ($84.53) and 50-period ($88.49) moving averages: the short-term trend remains bearish.
LEVELS
• Support: $81.34 (7-day low)
• Resistance: $85.85 (24-hour high) and $88.49 (50-period moving average)
• Major resistance: $98.14 (7-day high)
SCENARIO A — Support holds
If the price defends $81.34 and the RSI starts to rise from oversold territory, the first recovery target is around $85.85. Above that, $88.49.
SCENARIO B — Support breaks
If the price closes below $81.34 on high volume, the decline could accelerate—and the next support has no recent reference point from the past 7 days, meaning the price has no nearby safety net.
WHAT WOULD CONFIRM IT
A 4-hour close above $85.85 would confirm buying strength; a break below $81.34 with a close underneath would confirm the downtrend's continuation. Until then, this is just a test of support—not a decision.
RISK
Altcoins are more volatile and have wider spreads than BTC: a stop that's too tight can get swept up by market noise. Traders need to size their positions to account for the size of the move—and never trade with money they can't afford to lose. Avoid excessive leverage.
CONCLUSION
SOL is at the week's most interesting point: testing support with the RSI nearly oversold. Holding or breaking through will determine the next move—and the answer comes from the price, not anyone's opinion. Would you trade a support test like this, or would you rather wait for confirmation?
#Solana #CriptoVisao #AnaliseTecnica
28
·
--
ETH leaning on support: what will decide the next move? 📉
SITUATION
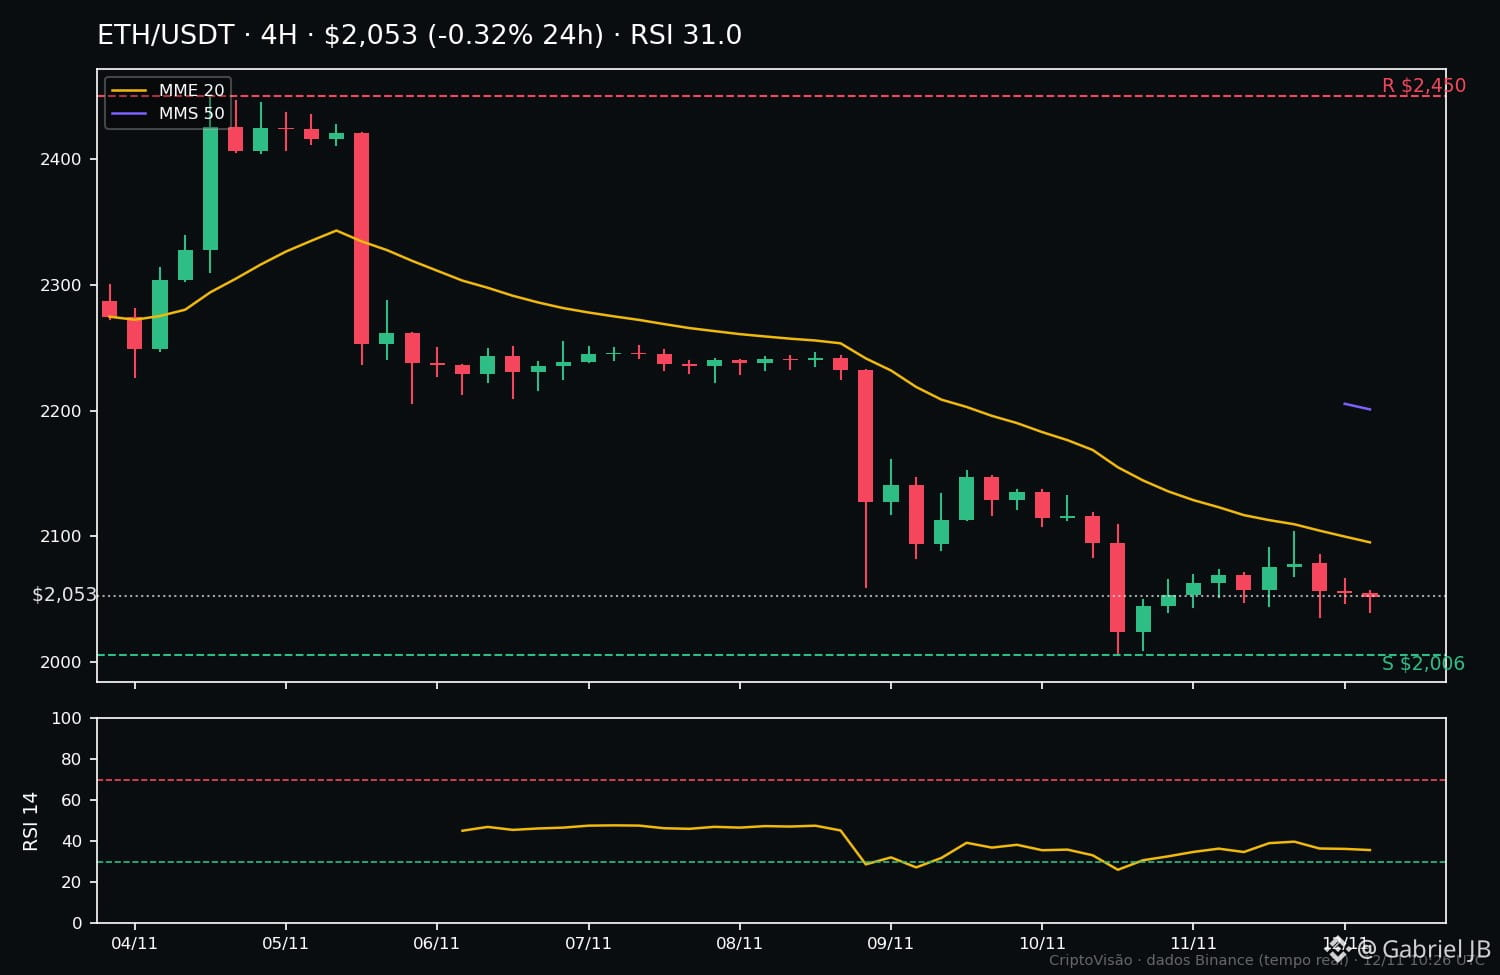
$ETH is trading at US$ 2.052, down 9.81% in 7 days — almost double the drop of $BTC over the same period (-4.90%). The price is just 2.3% above the weekly low (US$ 2.006), and the RSI-14 is at 31, near the oversold zone. Over 24h, ETH fluctuates between US$ 2.035,83 and US$ 2.103,78, in the lower part of the range. Clear relative weakness: when the market falls, ETH falls further.
LEVELS
• Support: US$ 2.006 (7-day low) and US$ 2.035,83 (24h low)
• Resistance: US$ 2.085,67 (20-period average) and US$ 2.201 (50-period average)
• Major resistance: US$ 2.450 (7-day high)
SCENARIO A — Support holds
If the price holds above US$ 2.006 with a 4h close above US$ 2.036, it opens the door to testing the 20-period average at US$ 2.086. Confirmation would come with above-average volume and the RSI moving back above 35.
SCENARIO B — Support breaks
A 4h close below US$ 2.006 invalidates the defense and leaves ETH without nearby support, with the risk of an accelerating decline. In that case, patience is better than trying to guess the bottom.
WHAT WOULD CONFIRM IT
In scenario A: a 4h close above US$ 2.086. In scenario B: a 4h close below US$ 2.006. Until then, this is a zone for observation, not decision-making.
RISK
An RSI near oversold is not a buy signal on its own — in a downtrend, the price can stay cheap for a long time. Trading against the trend without confirmation is the most common mistake at times like these.
CONCLUSION
ETH is weak and leaning on the week's support. Those watching should keep an eye on US$ 2.006; those trading should wait for confirmation. What do you think: will support hold, or will ETH seek new lows? Comment below 👇
#Ethereum #CriptoVisao #TechnicalAnalysis
ETH leaning on support: what will decide the next move? 📉
SITUATION
$ETH is trading at US$ 2.052, down 9.81% in 7 days — almost double the drop of $BTC over the same period (-4.90%). The price is just 2.3% above the weekly low (US$ 2.006), and the RSI-14 is at 31, near the oversold zone. Over 24h, ETH fluctuates between US$ 2.035,83 and US$ 2.103,78, in the lower part of the range. Clear relative weakness: when the market falls, ETH falls further.
LEVELS
• Support: US$ 2.006 (7-day low) and US$ 2.035,83 (24h low)
• Resistance: US$ 2.085,67 (20-period average) and US$ 2.201 (50-period average)
• Major resistance: US$ 2.450 (7-day high)
SCENARIO A — Support holds
If the price holds above US$ 2.006 with a 4h close above US$ 2.036, it opens the door to testing the 20-period average at US$ 2.086. Confirmation would come with above-average volume and the RSI moving back above 35.
SCENARIO B — Support breaks
A 4h close below US$ 2.006 invalidates the defense and leaves ETH without nearby support, with the risk of an accelerating decline. In that case, patience is better than trying to guess the bottom.
WHAT WOULD CONFIRM IT
In scenario A: a 4h close above US$ 2.086. In scenario B: a 4h close below US$ 2.006. Until then, this is a zone for observation, not decision-making.
RISK
An RSI near oversold is not a buy signal on its own — in a downtrend, the price can stay cheap for a long time. Trading against the trend without confirmation is the most common mistake at times like these.
CONCLUSION
ETH is weak and leaning on the week's support. Those watching should keep an eye on US$ 2.006; those trading should wait for confirmation. What do you think: will support hold, or will ETH seek new lows? Comment below 👇
#Ethereum #CriptoVisao #TechnicalAnalysis
SITUATION
$ETH is trading at US$ 2.052, down 9.81% in 7 days — almost double the drop of $BTC over the same period (-4.90%). The price is just 2.3% above the weekly low (US$ 2.006), and the RSI-14 is at 31, near the oversold zone. Over 24h, ETH fluctuates between US$ 2.035,83 and US$ 2.103,78, in the lower part of the range. Clear relative weakness: when the market falls, ETH falls further.
LEVELS
• Support: US$ 2.006 (7-day low) and US$ 2.035,83 (24h low)
• Resistance: US$ 2.085,67 (20-period average) and US$ 2.201 (50-period average)
• Major resistance: US$ 2.450 (7-day high)
SCENARIO A — Support holds
If the price holds above US$ 2.006 with a 4h close above US$ 2.036, it opens the door to testing the 20-period average at US$ 2.086. Confirmation would come with above-average volume and the RSI moving back above 35.
SCENARIO B — Support breaks
A 4h close below US$ 2.006 invalidates the defense and leaves ETH without nearby support, with the risk of an accelerating decline. In that case, patience is better than trying to guess the bottom.
WHAT WOULD CONFIRM IT
In scenario A: a 4h close above US$ 2.086. In scenario B: a 4h close below US$ 2.006. Until then, this is a zone for observation, not decision-making.
RISK
An RSI near oversold is not a buy signal on its own — in a downtrend, the price can stay cheap for a long time. Trading against the trend without confirmation is the most common mistake at times like these.
CONCLUSION
ETH is weak and leaning on the week's support. Those watching should keep an eye on US$ 2.006; those trading should wait for confirmation. What do you think: will support hold, or will ETH seek new lows? Comment below 👇
#Ethereum #CriptoVisao #TechnicalAnalysis
82
·
--
📊 Daily Summary — November 11: the market caught its breath, but the trend has not yet turned
THE DAY IN A FEW LINES
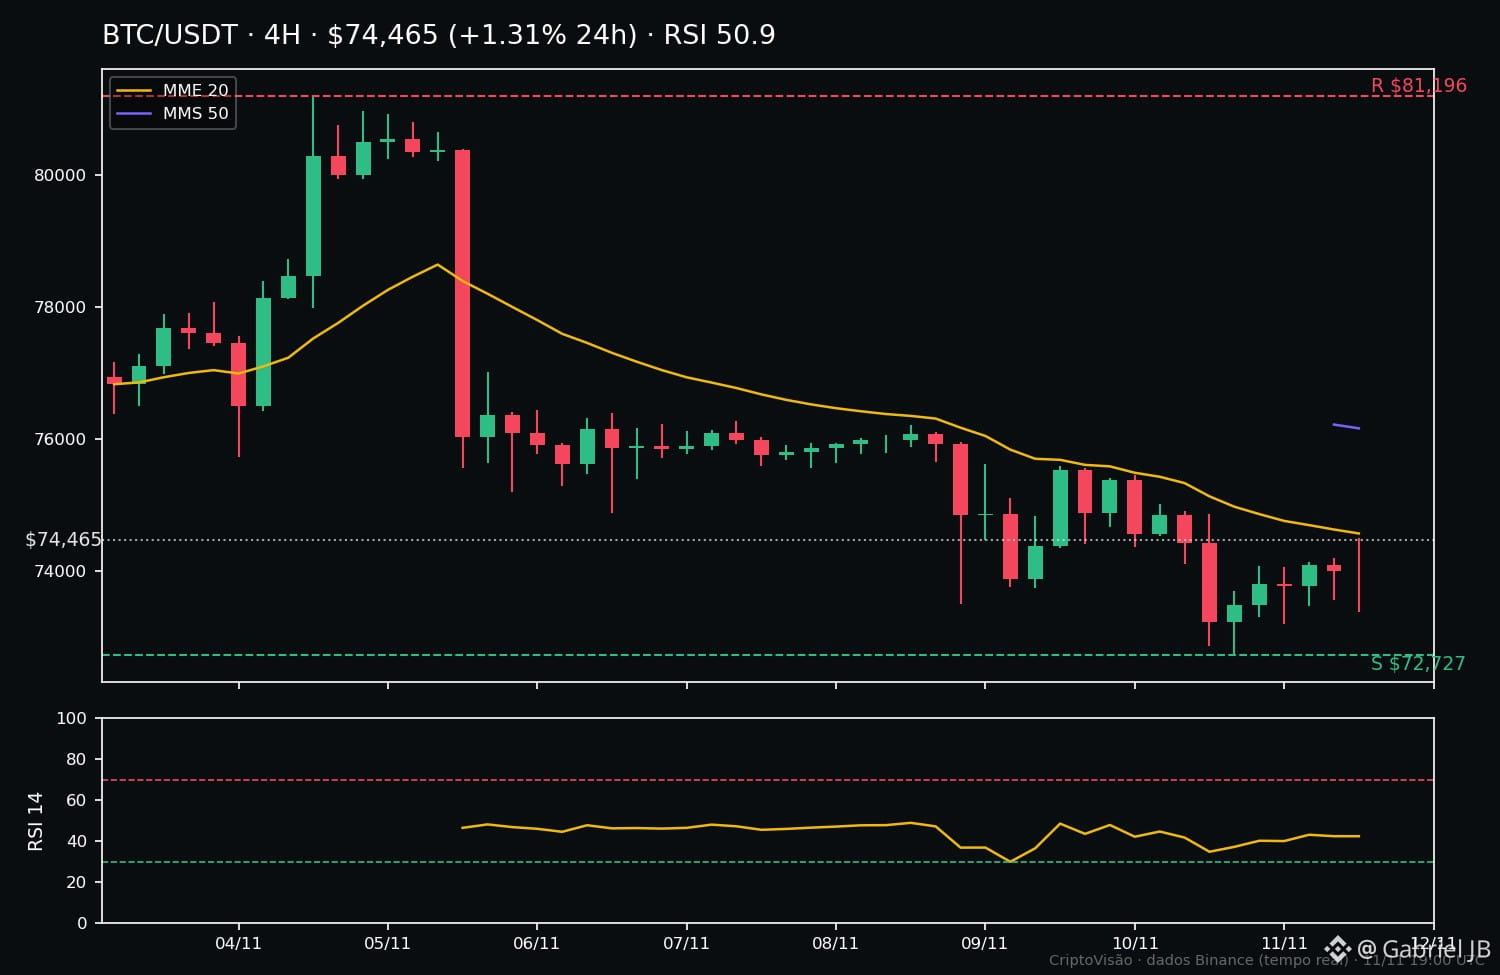
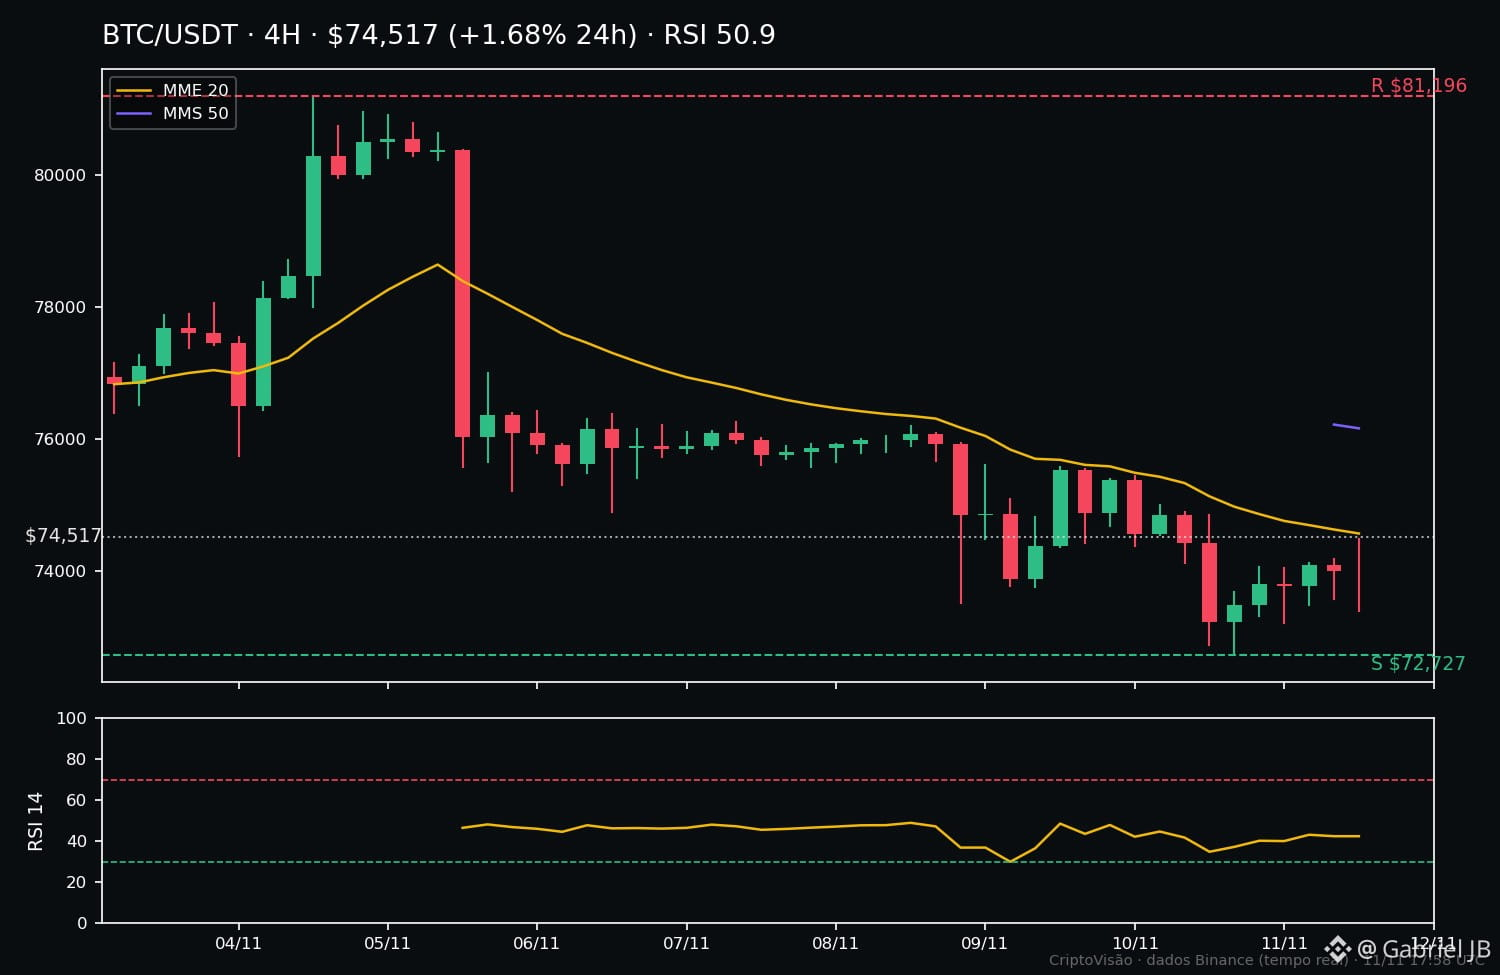
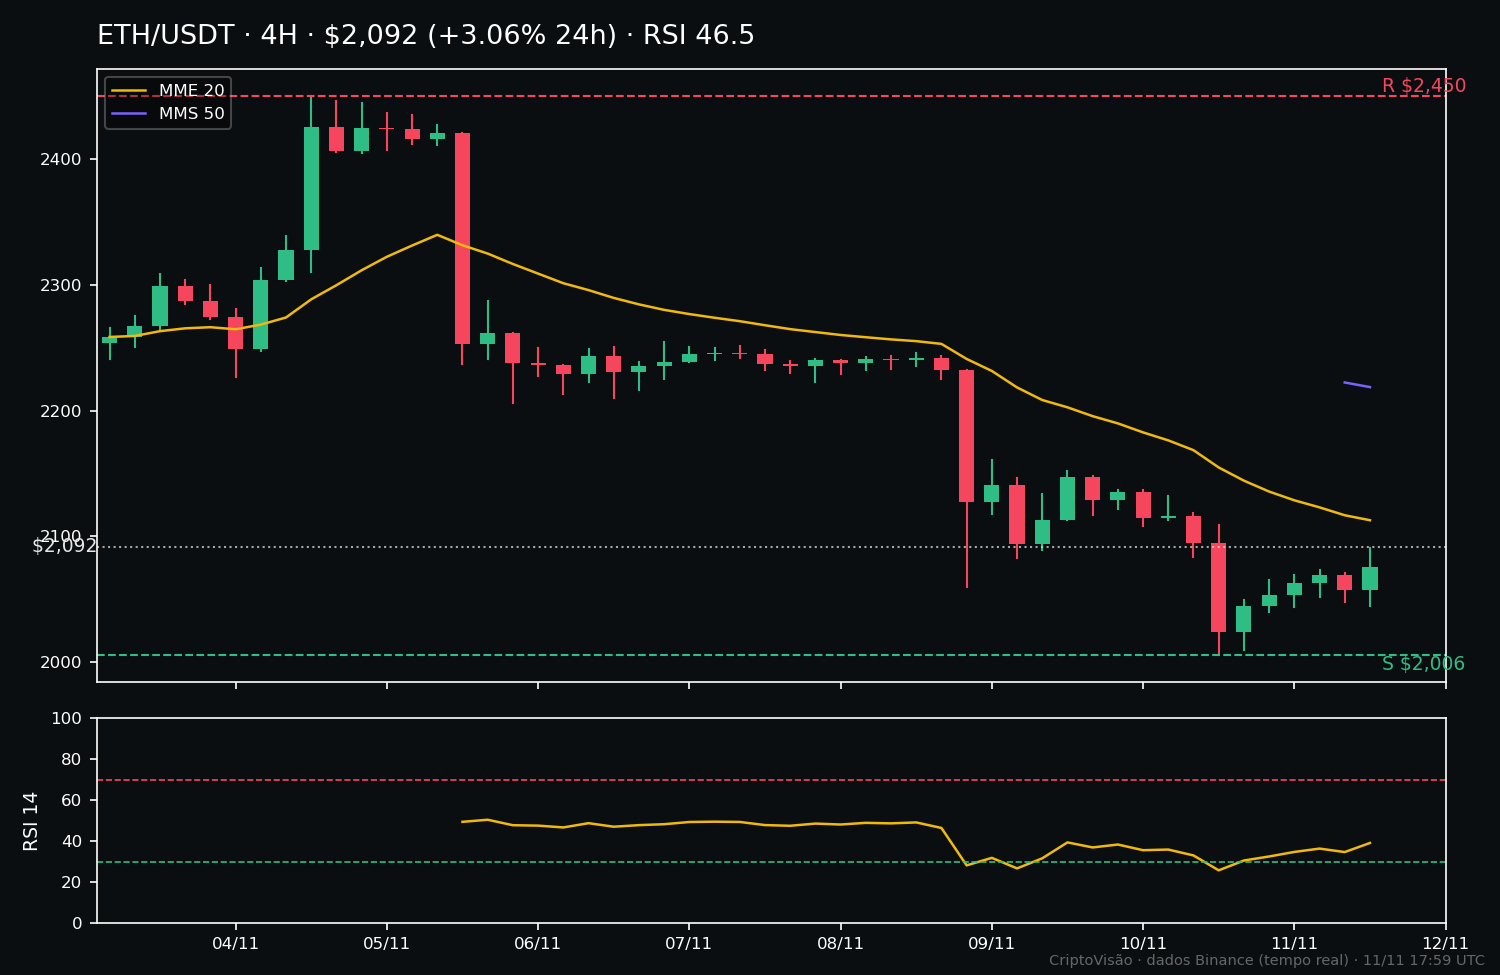
After yesterday’s breakdown, the market caught its breath today: $BTC at $74,514 (+1.43% in 24h), $ETH at $2,083 (+1.92%), and $SOL at $85.04 (+2.47%). A modest recovery — all three are still down for the week (-3.69%, -8.12%, and -7.88%) and below their 20- and 50-period averages. RSI is neutral for all three: 50.9 for $BTC, 46.5 for $ETH , and 46.9 for $SOL.
WHAT WAS CONFIRMED
- The $72,727 support held: $BTC did not make a new 7-day low and closed the day near the top of its range over the past 24 hours.
- $BTC is still stronger than $ETH for the week (-3.69% versus -8.12%).
- $SOL found support at $81.34 and recovered to $85.
WHAT WAS NOT CONFIRMED
- The recovery did not reverse the trend: none of the three regained its 20-period average.
- $ETH remains the weakest of the trio, still far from its 7-day high of $2,450.
LEVELS FOR TOMORROW
- $BTC: if it loses $72,727, the way down opens; if it holds and breaks above $74,593, it will test $76,160.
- $ETH: support at $2,006; resistance at $2,116.
- $SOL: support at $81.34; resistance at $85.83.
Markets can change overnight; no position means no losses. Risk management first.
Tomorrow: a real recovery or just a pause in the decline? Tell us in the comments.
#Bitcoin #Ethereum #CryptoVision
📊 Daily Summary — November 11: the market caught its breath, but the trend has not yet turned
THE DAY IN A FEW LINES
After yesterday’s breakdown, the market caught its breath today: $BTC at $74,514 (+1.43% in 24h), $ETH at $2,083 (+1.92%), and $SOL at $85.04 (+2.47%). A modest recovery — all three are still down for the week (-3.69%, -8.12%, and -7.88%) and below their 20- and 50-period averages. RSI is neutral for all three: 50.9 for $BTC , 46.5 for $ETH , and 46.9 for $SOL .
WHAT WAS CONFIRMED
- The $72,727 support held: $BTC did not make a new 7-day low and closed the day near the top of its range over the past 24 hours.
- $BTC is still stronger than $ETH for the week (-3.69% versus -8.12%).
- $SOL found support at $81.34 and recovered to $85.
WHAT WAS NOT CONFIRMED
- The recovery did not reverse the trend: none of the three regained its 20-period average.
- $ETH remains the weakest of the trio, still far from its 7-day high of $2,450.
LEVELS FOR TOMORROW
- $BTC : if it loses $72,727, the way down opens; if it holds and breaks above $74,593, it will test $76,160.
- $ETH : support at $2,006; resistance at $2,116.
- $SOL : support at $81.34; resistance at $85.83.
Markets can change overnight; no position means no losses. Risk management first.
Tomorrow: a real recovery or just a pause in the decline? Tell us in the comments.
#Bitcoin #Ethereum #CryptoVision
THE DAY IN A FEW LINES
After yesterday’s breakdown, the market caught its breath today: $BTC at $74,514 (+1.43% in 24h), $ETH at $2,083 (+1.92%), and $SOL at $85.04 (+2.47%). A modest recovery — all three are still down for the week (-3.69%, -8.12%, and -7.88%) and below their 20- and 50-period averages. RSI is neutral for all three: 50.9 for $BTC , 46.5 for $ETH , and 46.9 for $SOL .
WHAT WAS CONFIRMED
- The $72,727 support held: $BTC did not make a new 7-day low and closed the day near the top of its range over the past 24 hours.
- $BTC is still stronger than $ETH for the week (-3.69% versus -8.12%).
- $SOL found support at $81.34 and recovered to $85.
WHAT WAS NOT CONFIRMED
- The recovery did not reverse the trend: none of the three regained its 20-period average.
- $ETH remains the weakest of the trio, still far from its 7-day high of $2,450.
LEVELS FOR TOMORROW
- $BTC : if it loses $72,727, the way down opens; if it holds and breaks above $74,593, it will test $76,160.
- $ETH : support at $2,006; resistance at $2,116.
- $SOL : support at $81.34; resistance at $85.83.
Markets can change overnight; no position means no losses. Risk management first.
Tomorrow: a real recovery or just a pause in the decline? Tell us in the comments.
#Bitcoin #Ethereum #CryptoVision
1
51
·
--
BTC or ETH: which one is stronger today? ⚖️
The latest numbers (11/11, ~8pm CAT):
$BTC — US$ 74,532
• 24h: +1.70% | 7 days: -3.69%
• RSI-14: 50.9 (neutral)
• Price is practically at the 20-period average (4h) and 2.1% below the 50-period average
$ETH — US$ 2,092
• 24h: +3.06% | 7 days: -8.12%
• RSI-14: 46.5 (neutral)
• Price is 1.1% below the 20-period average and 5.7% below the 50-period average
Which one is stronger? $BTC. 💪
$ETH gained the day (+3.06% versus +1.70%), but $BTC is ahead for the week (-3.69% versus -8.12%), has the higher RSI, and is closer to the averages—and 8.2% from its 7-day high, compared with 14.6% for $ETH.
What does this mean? Today's rebound in $ETH is stronger, but it's happening within a weaker weekly structure. It's a short-term rotation, not confirmed leadership. $BTC continues to hold up better during the decline.
⚠️ Caution: one day doesn't change the trend. Looking at just 24 hours can be misleading—the full picture requires looking at the week, the averages, and the context.
Which of the two are you watching more closely this week? 👇
#Bitcoin #Ethereum #CriptoVisao
BTC or ETH: which one is stronger today? ⚖️
The latest numbers (11/11, ~8pm CAT):
$BTC — US$ 74,532
• 24h: +1.70% | 7 days: -3.69%
• RSI-14: 50.9 (neutral)
• Price is practically at the 20-period average (4h) and 2.1% below the 50-period average
$ETH — US$ 2,092
• 24h: +3.06% | 7 days: -8.12%
• RSI-14: 46.5 (neutral)
• Price is 1.1% below the 20-period average and 5.7% below the 50-period average
Which one is stronger? $BTC . 💪
$ETH gained the day (+3.06% versus +1.70%), but $BTC is ahead for the week (-3.69% versus -8.12%), has the higher RSI, and is closer to the averages—and 8.2% from its 7-day high, compared with 14.6% for $ETH .
What does this mean? Today's rebound in $ETH is stronger, but it's happening within a weaker weekly structure. It's a short-term rotation, not confirmed leadership. $BTC continues to hold up better during the decline.
⚠️ Caution: one day doesn't change the trend. Looking at just 24 hours can be misleading—the full picture requires looking at the week, the averages, and the context.
Which of the two are you watching more closely this week? 👇
#Bitcoin #Ethereum #CriptoVisao
The latest numbers (11/11, ~8pm CAT):
$BTC — US$ 74,532
• 24h: +1.70% | 7 days: -3.69%
• RSI-14: 50.9 (neutral)
• Price is practically at the 20-period average (4h) and 2.1% below the 50-period average
$ETH — US$ 2,092
• 24h: +3.06% | 7 days: -8.12%
• RSI-14: 46.5 (neutral)
• Price is 1.1% below the 20-period average and 5.7% below the 50-period average
Which one is stronger? $BTC . 💪
$ETH gained the day (+3.06% versus +1.70%), but $BTC is ahead for the week (-3.69% versus -8.12%), has the higher RSI, and is closer to the averages—and 8.2% from its 7-day high, compared with 14.6% for $ETH .
What does this mean? Today's rebound in $ETH is stronger, but it's happening within a weaker weekly structure. It's a short-term rotation, not confirmed leadership. $BTC continues to hold up better during the decline.
⚠️ Caution: one day doesn't change the trend. Looking at just 24 hours can be misleading—the full picture requires looking at the week, the averages, and the context.
Which of the two are you watching more closely this week? 👇
#Bitcoin #Ethereum #CriptoVisao
33
·
--
The $BTC fell 10% in 7 days — and that’s where the costliest mistake lies 📉
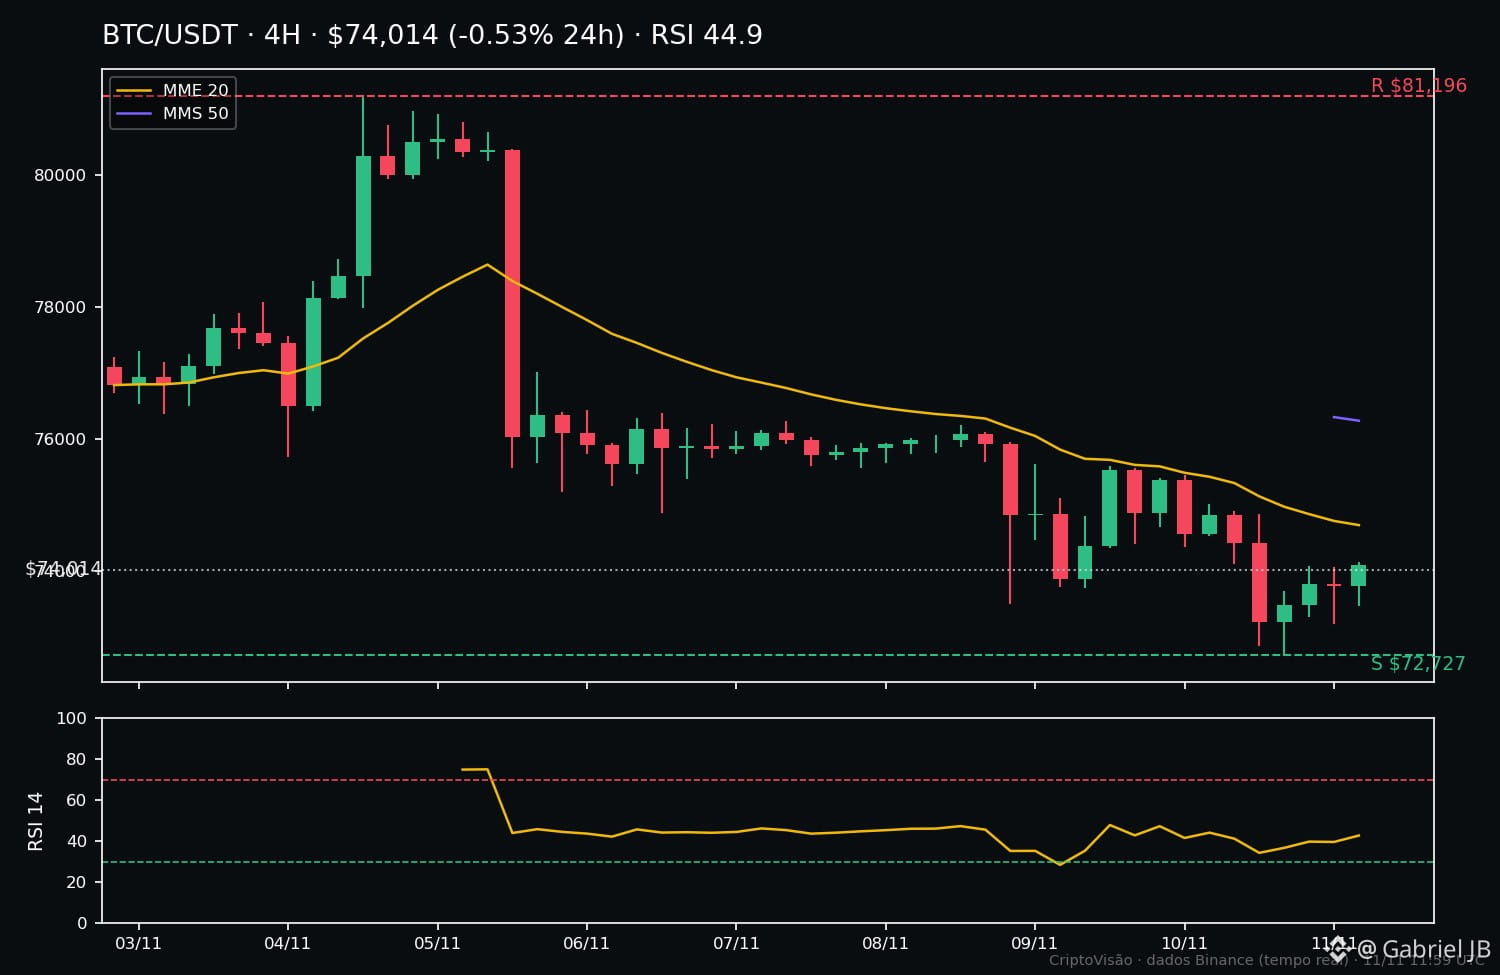
The $BTC fell from US$ 81.196 to US$ 72.727 in 7 days (-10.4%). Today it’s at US$ 74.014, still below the 20- and 50-period averages on the 4h chart (US$ 74.789 and US$ 76.276), with RSI-14 at 44.9 — neutral, with no sign of a reversal.
The mistake of the day: buying the dip just because “it’s already fallen a lot.” A falling price isn’t a cheap price. Without confirmation, every “discount” could just be the middle of the drop — and anyone who buys without a plan becomes hostage to the next candle.
The simple rule: wait for confirmation. A 4h close above the 20-period average (US$ 74.789) or a higher low shows that buyers have returned. Without that, it’s a bet, not analysis.
And if you enter: place a stop below the 7-day low (US$ 72.727). If that level is breached, the thesis is dead — exit and reassess. Anyone who doesn’t set a stop before entering ends up making decisions emotionally afterward.
Have you ever bought a dip that kept falling? Tell us in the comments 👇
$BTC
#Bitcoin #CriptoVisao #RiskManagement
The $BTC fell 10% in 7 days — and that’s where the costliest mistake lies 📉
The $BTC fell from US$ 81.196 to US$ 72.727 in 7 days (-10.4%). Today it’s at US$ 74.014, still below the 20- and 50-period averages on the 4h chart (US$ 74.789 and US$ 76.276), with RSI-14 at 44.9 — neutral, with no sign of a reversal.
The mistake of the day: buying the dip just because “it’s already fallen a lot.” A falling price isn’t a cheap price. Without confirmation, every “discount” could just be the middle of the drop — and anyone who buys without a plan becomes hostage to the next candle.
The simple rule: wait for confirmation. A 4h close above the 20-period average (US$ 74.789) or a higher low shows that buyers have returned. Without that, it’s a bet, not analysis.
And if you enter: place a stop below the 7-day low (US$ 72.727). If that level is breached, the thesis is dead — exit and reassess. Anyone who doesn’t set a stop before entering ends up making decisions emotionally afterward.
Have you ever bought a dip that kept falling? Tell us in the comments 👇
$BTC
#Bitcoin #CriptoVisao #RiskManagement
The $BTC fell from US$ 81.196 to US$ 72.727 in 7 days (-10.4%). Today it’s at US$ 74.014, still below the 20- and 50-period averages on the 4h chart (US$ 74.789 and US$ 76.276), with RSI-14 at 44.9 — neutral, with no sign of a reversal.
The mistake of the day: buying the dip just because “it’s already fallen a lot.” A falling price isn’t a cheap price. Without confirmation, every “discount” could just be the middle of the drop — and anyone who buys without a plan becomes hostage to the next candle.
The simple rule: wait for confirmation. A 4h close above the 20-period average (US$ 74.789) or a higher low shows that buyers have returned. Without that, it’s a bet, not analysis.
And if you enter: place a stop below the 7-day low (US$ 72.727). If that level is breached, the thesis is dead — exit and reassess. Anyone who doesn’t set a stop before entering ends up making decisions emotionally afterward.
Have you ever bought a dip that kept falling? Tell us in the comments 👇
$BTC
#Bitcoin #CriptoVisao #RiskManagement
47
·
--
The $BTC is testing support — and this is where you learn breakout strategy 📉
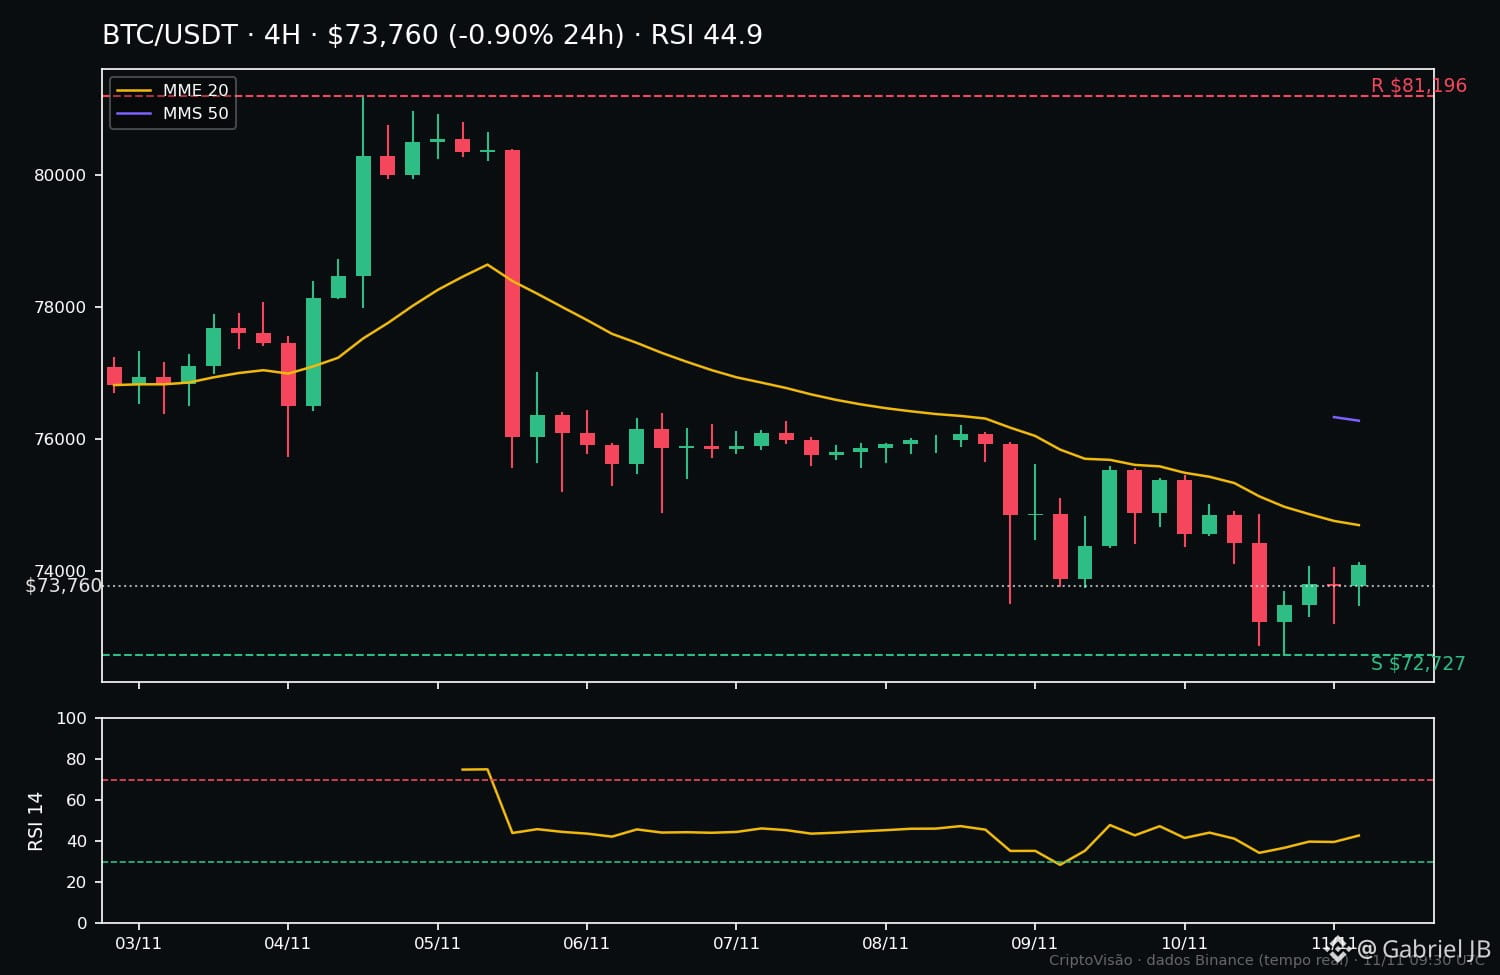
Bitcoin is trading at $73,756 (-0.98% in 24h; -3.55% in 7 days), with RSI-14 at 44.9 and below the 20-period ($74,789) and 50-period ($76,276) moving averages on the 4h chart. The level that matters now is the low of the last 7 days: $72,727.
What is a real breakout?
It’s not a wick that pierces the level and then retreats. It’s a 4h candle close below $72,727, with the price holding below it in the next candle. Only then is the breakout confirmed.
The false breakout trap:
The price breaks through, triggers orders, and returns to the range within a few hours. Anyone who enters on the wick without waiting for the close becomes fuel for the move in the opposite direction.
Where would the stop go (educational example, not a recommendation)?
In a confirmed downside breakout, a trader would place the stop above the broken level — in this case, above $72,727 — because if the price moves back above it, the breakout thesis is no longer valid. Risk is defined before entering, never after.
If support holds and the price starts rising again, there’s no entry either: it’s just a support test, not a breakout.
No confirmation, no entry. What about you: do you wait for the candle close or enter on the wick? 👇
#Bitcoin #Estrategia #CryptoVision
The $BTC is testing support — and this is where you learn breakout strategy 📉
Bitcoin is trading at $73,756 (-0.98% in 24h; -3.55% in 7 days), with RSI-14 at 44.9 and below the 20-period ($74,789) and 50-period ($76,276) moving averages on the 4h chart. The level that matters now is the low of the last 7 days: $72,727.
What is a real breakout?
It’s not a wick that pierces the level and then retreats. It’s a 4h candle close below $72,727, with the price holding below it in the next candle. Only then is the breakout confirmed.
The false breakout trap:
The price breaks through, triggers orders, and returns to the range within a few hours. Anyone who enters on the wick without waiting for the close becomes fuel for the move in the opposite direction.
Where would the stop go (educational example, not a recommendation)?
In a confirmed downside breakout, a trader would place the stop above the broken level — in this case, above $72,727 — because if the price moves back above it, the breakout thesis is no longer valid. Risk is defined before entering, never after.
If support holds and the price starts rising again, there’s no entry either: it’s just a support test, not a breakout.
No confirmation, no entry. What about you: do you wait for the candle close or enter on the wick? 👇
#Bitcoin #Estrategia #CryptoVision
Bitcoin is trading at $73,756 (-0.98% in 24h; -3.55% in 7 days), with RSI-14 at 44.9 and below the 20-period ($74,789) and 50-period ($76,276) moving averages on the 4h chart. The level that matters now is the low of the last 7 days: $72,727.
What is a real breakout?
It’s not a wick that pierces the level and then retreats. It’s a 4h candle close below $72,727, with the price holding below it in the next candle. Only then is the breakout confirmed.
The false breakout trap:
The price breaks through, triggers orders, and returns to the range within a few hours. Anyone who enters on the wick without waiting for the close becomes fuel for the move in the opposite direction.
Where would the stop go (educational example, not a recommendation)?
In a confirmed downside breakout, a trader would place the stop above the broken level — in this case, above $72,727 — because if the price moves back above it, the breakout thesis is no longer valid. Risk is defined before entering, never after.
If support holds and the price starts rising again, there’s no entry either: it’s just a support test, not a breakout.
No confirmation, no entry. What about you: do you wait for the candle close or enter on the wick? 👇
#Bitcoin #Estrategia #CryptoVision
102
·
--
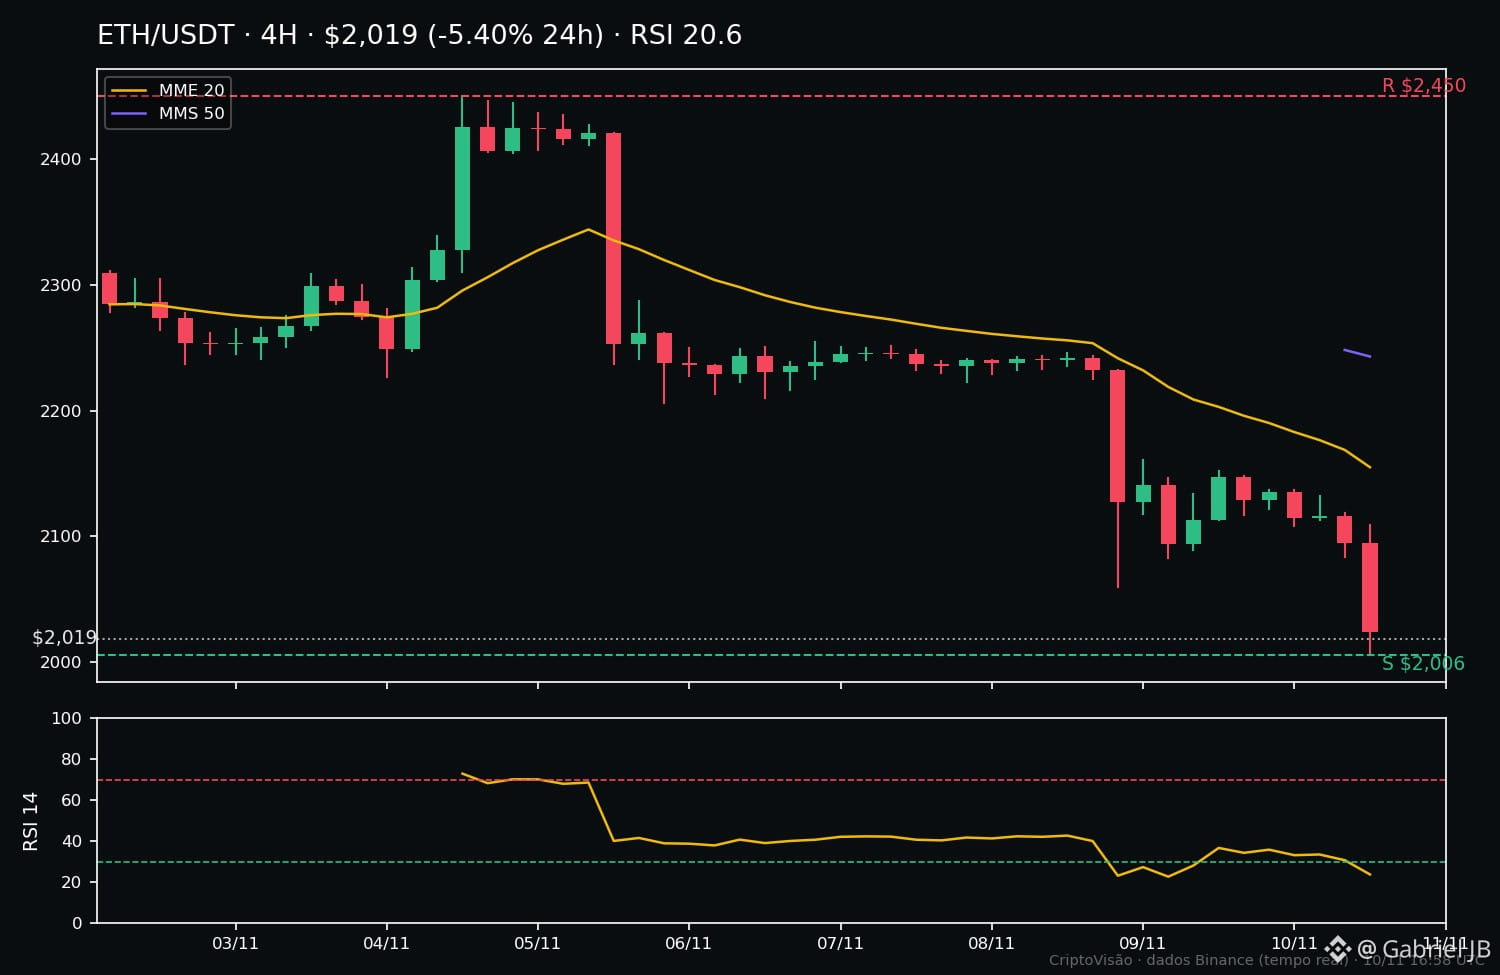
📉 The $ETH fell 5.5% today — and the patient trader still hasn’t entered
Ethereum is trading at US$ 2,015.70, down 11.4% in 7 days, with an RSI-14 of 20.6 (oversold). The price lost the US$ 2,143 zone and dropped to US$ 2,006, its 7-day low.
This is where the pullback strategy comes in: after a strong move, the patient trader waits for a retest of the broken level instead of chasing the price.
Retest zone: US$ 2,140–2,170 — the broken support becomes resistance, near the 20-period average (US$ 2,169).
Confirmation: rejection in this zone — a long upper wick and a close back below it.
Stop (educational example): above US$ 2,200. A 4-hour close above US$ 2,170 invalidates the idea.
The classic mistake: entering out of FOMO — selling at the bottom after the drop, or buying the top of the bounce without confirmation. The move has already happened; those who chase pay the price.
Patience is a position. ⏳
Do you wait for the retest or prefer to enter on the breakout?
#Ethereum #CriptoVisao #TechnicalAnalysis
📉 The $ETH fell 5.5% today — and the patient trader still hasn’t entered
Ethereum is trading at US$ 2,015.70, down 11.4% in 7 days, with an RSI-14 of 20.6 (oversold). The price lost the US$ 2,143 zone and dropped to US$ 2,006, its 7-day low.
This is where the pullback strategy comes in: after a strong move, the patient trader waits for a retest of the broken level instead of chasing the price.
Retest zone: US$ 2,140–2,170 — the broken support becomes resistance, near the 20-period average (US$ 2,169).
Confirmation: rejection in this zone — a long upper wick and a close back below it.
Stop (educational example): above US$ 2,200. A 4-hour close above US$ 2,170 invalidates the idea.
The classic mistake: entering out of FOMO — selling at the bottom after the drop, or buying the top of the bounce without confirmation. The move has already happened; those who chase pay the price.
Patience is a position. ⏳
Do you wait for the retest or prefer to enter on the breakout?
#Ethereum #CriptoVisao #TechnicalAnalysis
Ethereum is trading at US$ 2,015.70, down 11.4% in 7 days, with an RSI-14 of 20.6 (oversold). The price lost the US$ 2,143 zone and dropped to US$ 2,006, its 7-day low.
This is where the pullback strategy comes in: after a strong move, the patient trader waits for a retest of the broken level instead of chasing the price.
Retest zone: US$ 2,140–2,170 — the broken support becomes resistance, near the 20-period average (US$ 2,169).
Confirmation: rejection in this zone — a long upper wick and a close back below it.
Stop (educational example): above US$ 2,200. A 4-hour close above US$ 2,170 invalidates the idea.
The classic mistake: entering out of FOMO — selling at the bottom after the drop, or buying the top of the bounce without confirmation. The move has already happened; those who chase pay the price.
Patience is a position. ⏳
Do you wait for the retest or prefer to enter on the breakout?
#Ethereum #CriptoVisao #TechnicalAnalysis
29
·
--
The 1% rule that separates those who survive from those who go broke on $BTC 📊
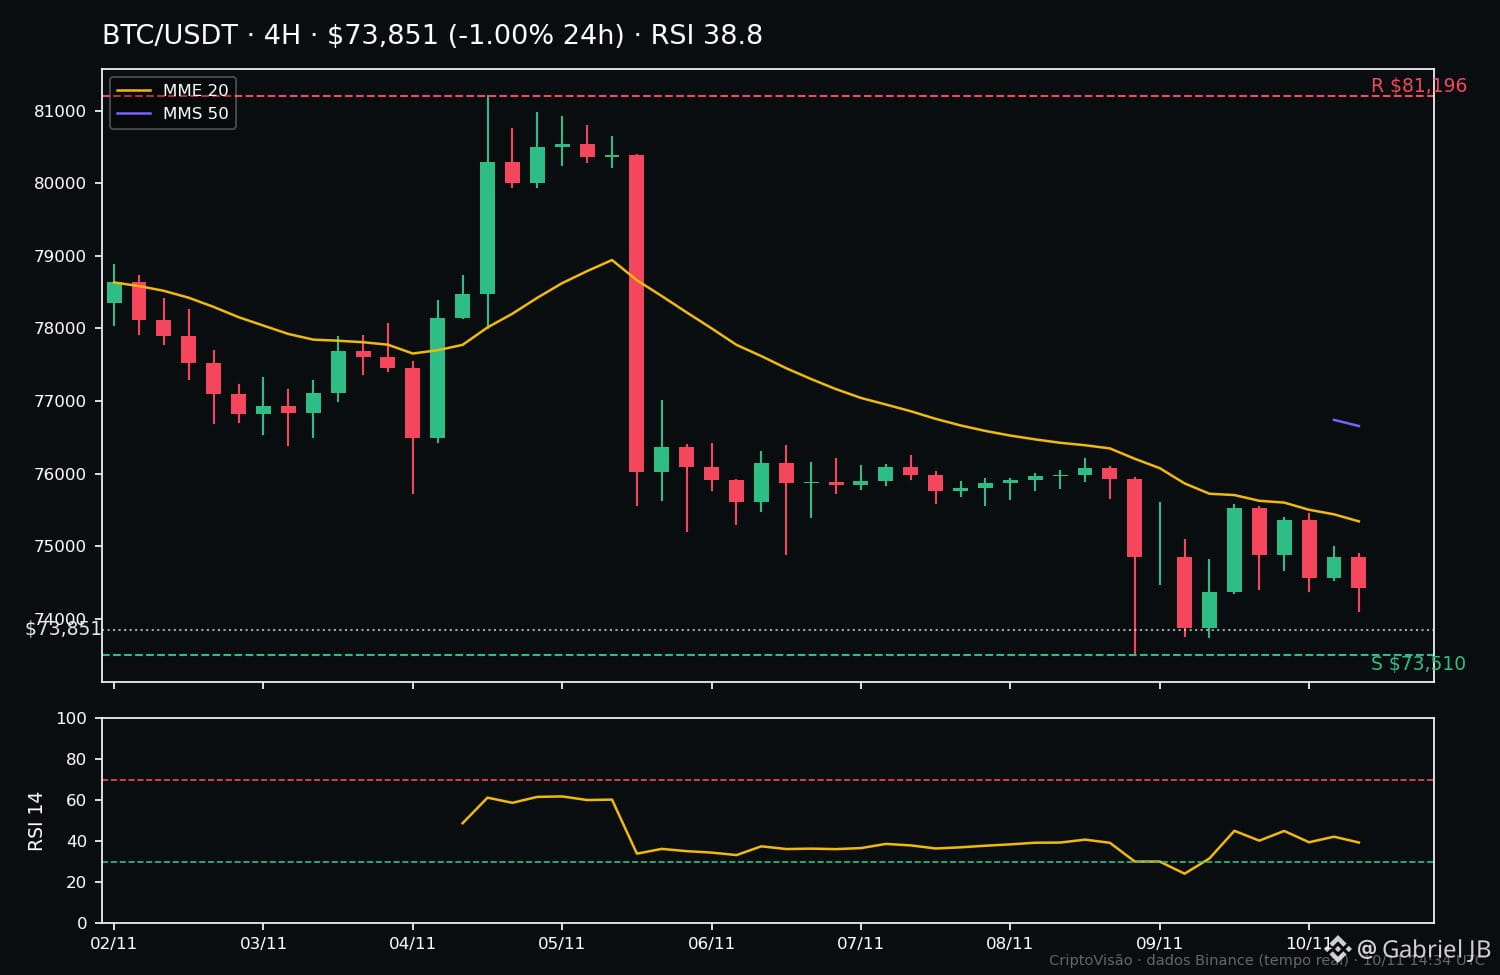
$BTC is trading at US$73,707 (-1.08% in 24h; -5.36% in 7 days), below the 20- and 50-period moving averages on the 4h chart, with the week's support at US$73,510 and resistance at US$81,196. It's the perfect scenario to practice the calculation that best protects an account — before thinking about profit.
Example account: US$1,000. The 1% rule = US$10 risk per trade. That's not the position size: it's the maximum you're willing to lose if the stop is triggered.
Step 1 — place the stop below actual support. Weekly support: US$73,510. Stop: US$72,950. It's not a round number: the chart structure dictates it. Risk per BTC: 73,707 − 72,950 = US$757.
Step 2 — the stop determines the position size. US$10 ÷ US$757 = 0.0132 BTC, about US$974. Notice: the position is large, but the risk is still only US$10.
Step 3 — the risk/reward test. First realistic target: US$75,347 (20-period moving average, 4h). Reward: 75,347 − 73,707 = US$1,640 per BTC. Risk/reward = 2.2:1 — above the 2:1 minimum. The entry passes the test. Below 2:1, the best decision is not to enter.
And why are several small stops worth more than an all-in? 10 consecutive 1% stops leave the account down 9.6% — you can recover with a 10.6% gain. A 50% loss on an all-in requires a 100% gain just to get back to zero. Preserving capital is strategy No. 1: those who survive stay in the game.
What's your risk limit per trade: 1% or 2%? Let us know in the comments. 👇
#Bitcoin #GestaoDeRisco #CryptoVision
The 1% rule that separates those who survive from those who go broke on $BTC 📊
$BTC is trading at US$73,707 (-1.08% in 24h; -5.36% in 7 days), below the 20- and 50-period moving averages on the 4h chart, with the week's support at US$73,510 and resistance at US$81,196. It's the perfect scenario to practice the calculation that best protects an account — before thinking about profit.
Example account: US$1,000. The 1% rule = US$10 risk per trade. That's not the position size: it's the maximum you're willing to lose if the stop is triggered.
Step 1 — place the stop below actual support. Weekly support: US$73,510. Stop: US$72,950. It's not a round number: the chart structure dictates it. Risk per BTC: 73,707 − 72,950 = US$757.
Step 2 — the stop determines the position size. US$10 ÷ US$757 = 0.0132 BTC, about US$974. Notice: the position is large, but the risk is still only US$10.
Step 3 — the risk/reward test. First realistic target: US$75,347 (20-period moving average, 4h). Reward: 75,347 − 73,707 = US$1,640 per BTC. Risk/reward = 2.2:1 — above the 2:1 minimum. The entry passes the test. Below 2:1, the best decision is not to enter.
And why are several small stops worth more than an all-in? 10 consecutive 1% stops leave the account down 9.6% — you can recover with a 10.6% gain. A 50% loss on an all-in requires a 100% gain just to get back to zero. Preserving capital is strategy No. 1: those who survive stay in the game.
What's your risk limit per trade: 1% or 2%? Let us know in the comments. 👇
#Bitcoin #GestaoDeRisco #CryptoVision
$BTC is trading at US$73,707 (-1.08% in 24h; -5.36% in 7 days), below the 20- and 50-period moving averages on the 4h chart, with the week's support at US$73,510 and resistance at US$81,196. It's the perfect scenario to practice the calculation that best protects an account — before thinking about profit.
Example account: US$1,000. The 1% rule = US$10 risk per trade. That's not the position size: it's the maximum you're willing to lose if the stop is triggered.
Step 1 — place the stop below actual support. Weekly support: US$73,510. Stop: US$72,950. It's not a round number: the chart structure dictates it. Risk per BTC: 73,707 − 72,950 = US$757.
Step 2 — the stop determines the position size. US$10 ÷ US$757 = 0.0132 BTC, about US$974. Notice: the position is large, but the risk is still only US$10.
Step 3 — the risk/reward test. First realistic target: US$75,347 (20-period moving average, 4h). Reward: 75,347 − 73,707 = US$1,640 per BTC. Risk/reward = 2.2:1 — above the 2:1 minimum. The entry passes the test. Below 2:1, the best decision is not to enter.
And why are several small stops worth more than an all-in? 10 consecutive 1% stops leave the account down 9.6% — you can recover with a 10.6% gain. A 50% loss on an all-in requires a 100% gain just to get back to zero. Preserving capital is strategy No. 1: those who survive stay in the game.
What's your risk limit per trade: 1% or 2%? Let us know in the comments. 👇
#Bitcoin #GestaoDeRisco #CryptoVision
4
·
--
ETH is near the weekly low — and the RSI is already signaling oversold 📉
SITUATION
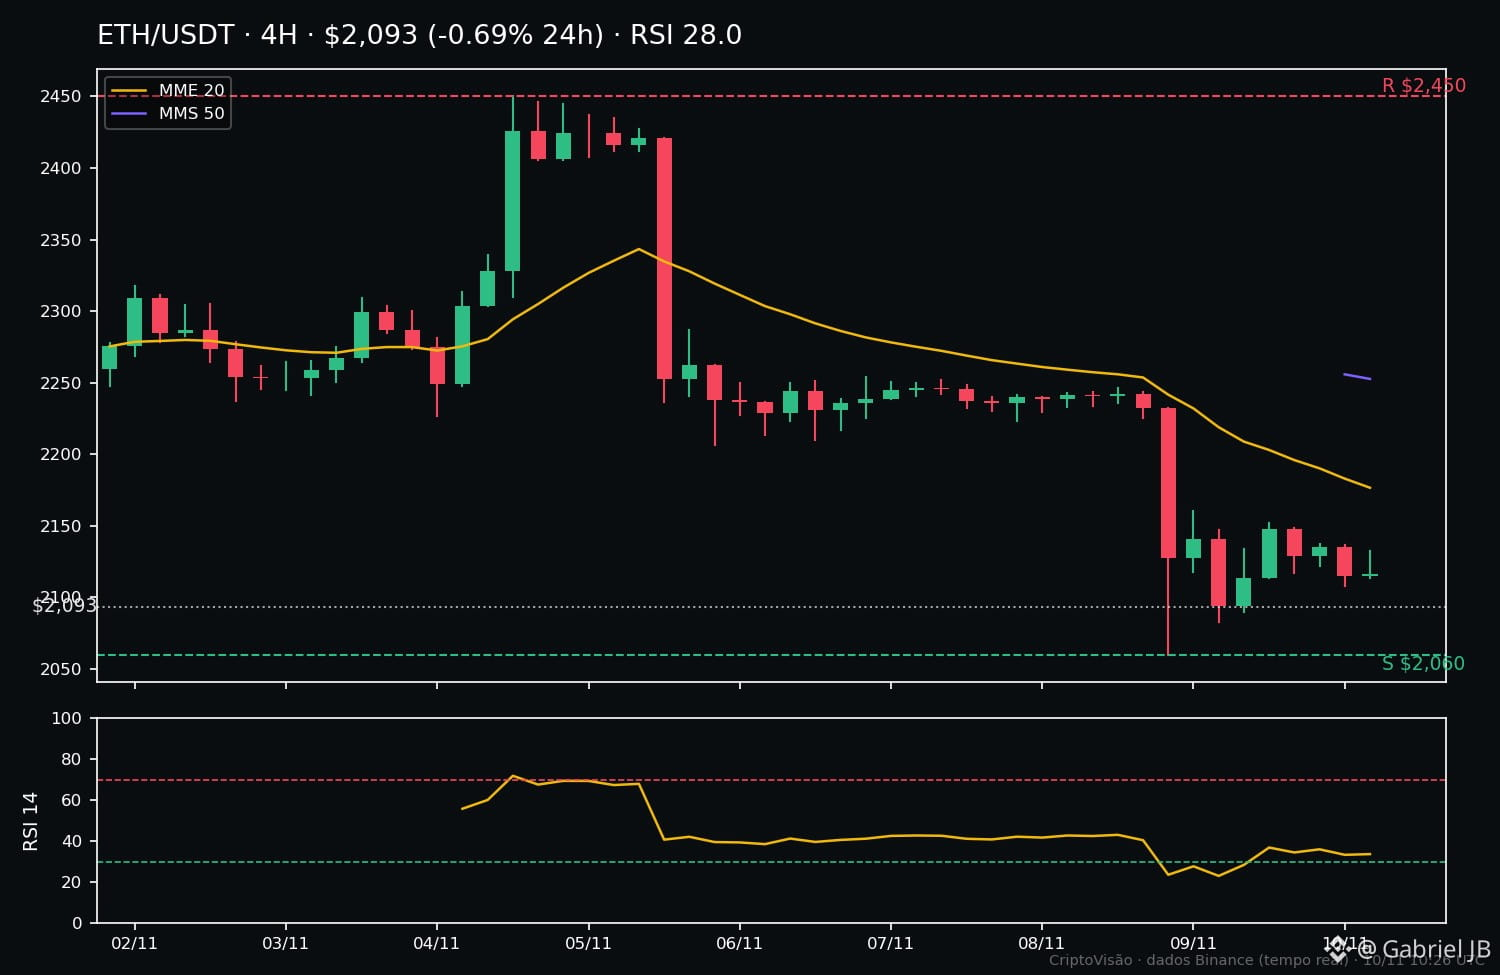
$ETH is trading at $2,092.76, down 0.57% in 24h and 7.0% for the week. The RSI-14 (4h) is at 28, in oversold territory, and the price is just 4% above the 24h low — in other words, the market is testing the weekly floor, not moving away from it.
LEVELS
• Support: $2,060 (low over the past 7 days)
• Resistance: $2,188 (20-period moving average) and $2,450 (weekly high)
• The price is below the 20- and 50-period moving averages ($2,188 / $2,253)
VS $BTC
$BTC is practically unchanged today (+0.04%, $74,307.68), with a neutral RSI of 41.9. For the week, ETH is down 7.0% versus BTC’s 4.47% decline: clear relative weakness — ETH is suffering more than the market.
SCENARIO A — Support holds
If $2,060 holds with a 4h close above it and the RSI exits oversold territory, there’s room to test $2,188.
SCENARIO B — Support breaks
A 4h close below $2,060 invalidates the weekly floor and opens the way to new lows — with no nearby support on the 7-day chart.
WHAT WOULD CONFIRM IT
Scenario A: 4h close above $2,060 + RSI above 30. Scenario B: 4h close below $2,060 with volume.
RISK
An oversold RSI is not a buy signal on its own: in a downtrend, the price can remain oversold for days. Anyone trading against the trend without confirmation risks trying to catch a falling knife.
CONCLUSION
ETH is at the week’s decision point: either $2,060 holds and the market catches its breath, or it breaks and relative weakness against BTC deepens. Until then, patience is more valuable than haste.
What do you think: will $2,060 hold or break this week? 👇
#Ethereum #CriptoVisao #TechnicalAnalysis
ETH is near the weekly low — and the RSI is already signaling oversold 📉
SITUATION
$ETH is trading at $2,092.76, down 0.57% in 24h and 7.0% for the week. The RSI-14 (4h) is at 28, in oversold territory, and the price is just 4% above the 24h low — in other words, the market is testing the weekly floor, not moving away from it.
LEVELS
• Support: $2,060 (low over the past 7 days)
• Resistance: $2,188 (20-period moving average) and $2,450 (weekly high)
• The price is below the 20- and 50-period moving averages ($2,188 / $2,253)
VS $BTC
$BTC is practically unchanged today (+0.04%, $74,307.68), with a neutral RSI of 41.9. For the week, ETH is down 7.0% versus BTC’s 4.47% decline: clear relative weakness — ETH is suffering more than the market.
SCENARIO A — Support holds
If $2,060 holds with a 4h close above it and the RSI exits oversold territory, there’s room to test $2,188.
SCENARIO B — Support breaks
A 4h close below $2,060 invalidates the weekly floor and opens the way to new lows — with no nearby support on the 7-day chart.
WHAT WOULD CONFIRM IT
Scenario A: 4h close above $2,060 + RSI above 30. Scenario B: 4h close below $2,060 with volume.
RISK
An oversold RSI is not a buy signal on its own: in a downtrend, the price can remain oversold for days. Anyone trading against the trend without confirmation risks trying to catch a falling knife.
CONCLUSION
ETH is at the week’s decision point: either $2,060 holds and the market catches its breath, or it breaks and relative weakness against BTC deepens. Until then, patience is more valuable than haste.
What do you think: will $2,060 hold or break this week? 👇
#Ethereum #CriptoVisao #TechnicalAnalysis
SITUATION
$ETH is trading at $2,092.76, down 0.57% in 24h and 7.0% for the week. The RSI-14 (4h) is at 28, in oversold territory, and the price is just 4% above the 24h low — in other words, the market is testing the weekly floor, not moving away from it.
LEVELS
• Support: $2,060 (low over the past 7 days)
• Resistance: $2,188 (20-period moving average) and $2,450 (weekly high)
• The price is below the 20- and 50-period moving averages ($2,188 / $2,253)
VS $BTC
$BTC is practically unchanged today (+0.04%, $74,307.68), with a neutral RSI of 41.9. For the week, ETH is down 7.0% versus BTC’s 4.47% decline: clear relative weakness — ETH is suffering more than the market.
SCENARIO A — Support holds
If $2,060 holds with a 4h close above it and the RSI exits oversold territory, there’s room to test $2,188.
SCENARIO B — Support breaks
A 4h close below $2,060 invalidates the weekly floor and opens the way to new lows — with no nearby support on the 7-day chart.
WHAT WOULD CONFIRM IT
Scenario A: 4h close above $2,060 + RSI above 30. Scenario B: 4h close below $2,060 with volume.
RISK
An oversold RSI is not a buy signal on its own: in a downtrend, the price can remain oversold for days. Anyone trading against the trend without confirmation risks trying to catch a falling knife.
CONCLUSION
ETH is at the week’s decision point: either $2,060 holds and the market catches its breath, or it breaks and relative weakness against BTC deepens. Until then, patience is more valuable than haste.
What do you think: will $2,060 hold or break this week? 👇
#Ethereum #CriptoVisao #TechnicalAnalysis
42
·
--
$BTC to test the week's support: will $73,510 hold or give way?
SITUATION
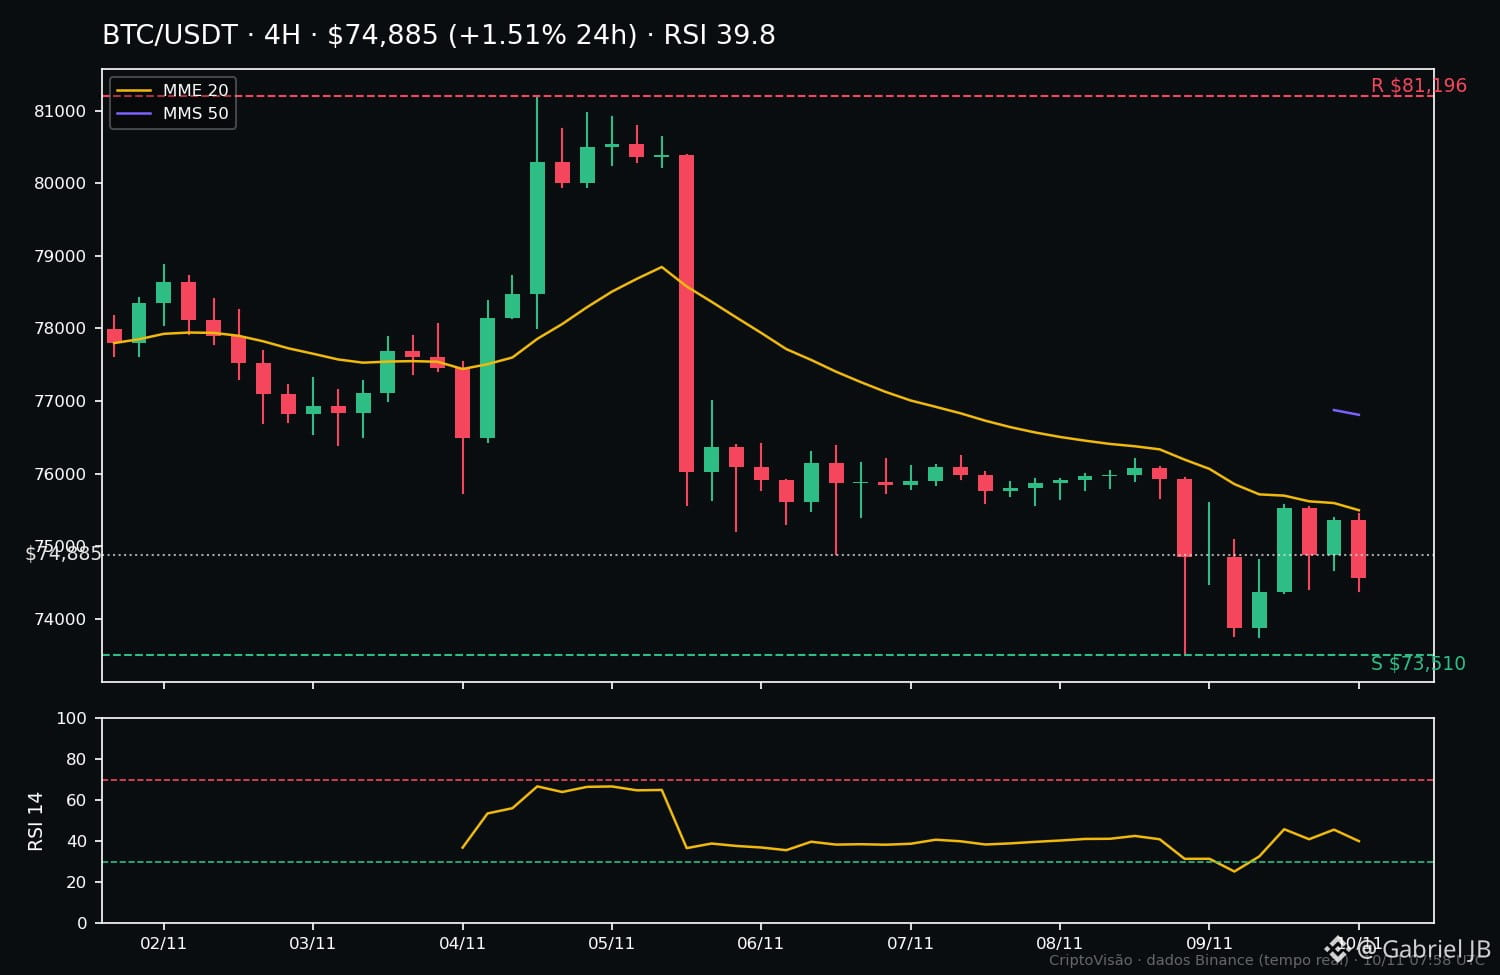
$BTC is trading at $74,900 (+1.48% over the last 24 hours), recovering from the week's low of $73,510. For the week, it is still down 4.16%. The RSI-14 is at 39.8 — neutral, but on the weak side — and the price remains below the 20- and 50-period moving averages (4h), keeping the short-term trend tilted downward.
LEVELS
Support: $73,510 (7-day low; 24-hour low at $73,750). Resistance: $75,470 (EMA-20) and $76,812 (SMA-50). Above that, $81,196 is the week's high.
SCENARIO A — support holds
A 4h candle close above $75,470, with volume, paves the way for a test of $76,800. It would be the first sign that buyers are regaining control of the short term.
SCENARIO B — support gives way
A 4h close below $73,510 invalidates the recovery and opens the door to looking for lower lows. Wicks below the level without a close don't count — only the close confirms it.
WHAT WOULD CONFIRM IT
In scenario A: a 4h close above the EMA-20 and the RSI rising above 45. In scenario B: a 4h close below $73,510.
RISK
With the price below the moving averages and the RSI near 40, selling pressure is still in control. Entering before confirmation means betting against the trend — and in this zone, a false breakout can be costly.
CONCLUSION
$BTC is at a decision point. If you're watching, wait for the close: above $75,470, the outlook improves; below $73,510, caution is warranted. What do you think — will support hold this time? 👇
#Bitcoin #CriptoVisao #TechnicalAnalysis
$BTC to test the week's support: will $73,510 hold or give way?
SITUATION
$BTC is trading at $74,900 (+1.48% over the last 24 hours), recovering from the week's low of $73,510. For the week, it is still down 4.16%. The RSI-14 is at 39.8 — neutral, but on the weak side — and the price remains below the 20- and 50-period moving averages (4h), keeping the short-term trend tilted downward.
LEVELS
Support: $73,510 (7-day low; 24-hour low at $73,750). Resistance: $75,470 (EMA-20) and $76,812 (SMA-50). Above that, $81,196 is the week's high.
SCENARIO A — support holds
A 4h candle close above $75,470, with volume, paves the way for a test of $76,800. It would be the first sign that buyers are regaining control of the short term.
SCENARIO B — support gives way
A 4h close below $73,510 invalidates the recovery and opens the door to looking for lower lows. Wicks below the level without a close don't count — only the close confirms it.
WHAT WOULD CONFIRM IT
In scenario A: a 4h close above the EMA-20 and the RSI rising above 45. In scenario B: a 4h close below $73,510.
RISK
With the price below the moving averages and the RSI near 40, selling pressure is still in control. Entering before confirmation means betting against the trend — and in this zone, a false breakout can be costly.
CONCLUSION
$BTC is at a decision point. If you're watching, wait for the close: above $75,470, the outlook improves; below $73,510, caution is warranted. What do you think — will support hold this time? 👇
#Bitcoin #CriptoVisao #TechnicalAnalysis
SITUATION
$BTC is trading at $74,900 (+1.48% over the last 24 hours), recovering from the week's low of $73,510. For the week, it is still down 4.16%. The RSI-14 is at 39.8 — neutral, but on the weak side — and the price remains below the 20- and 50-period moving averages (4h), keeping the short-term trend tilted downward.
LEVELS
Support: $73,510 (7-day low; 24-hour low at $73,750). Resistance: $75,470 (EMA-20) and $76,812 (SMA-50). Above that, $81,196 is the week's high.
SCENARIO A — support holds
A 4h candle close above $75,470, with volume, paves the way for a test of $76,800. It would be the first sign that buyers are regaining control of the short term.
SCENARIO B — support gives way
A 4h close below $73,510 invalidates the recovery and opens the door to looking for lower lows. Wicks below the level without a close don't count — only the close confirms it.
WHAT WOULD CONFIRM IT
In scenario A: a 4h close above the EMA-20 and the RSI rising above 45. In scenario B: a 4h close below $73,510.
RISK
With the price below the moving averages and the RSI near 40, selling pressure is still in control. Entering before confirmation means betting against the trend — and in this zone, a false breakout can be costly.
CONCLUSION
$BTC is at a decision point. If you're watching, wait for the close: above $75,470, the outlook improves; below $73,510, caution is warranted. What do you think — will support hold this time? 👇
#Bitcoin #CriptoVisao #TechnicalAnalysis
76
·
--
Position size determines whether you survive — not being right 📐
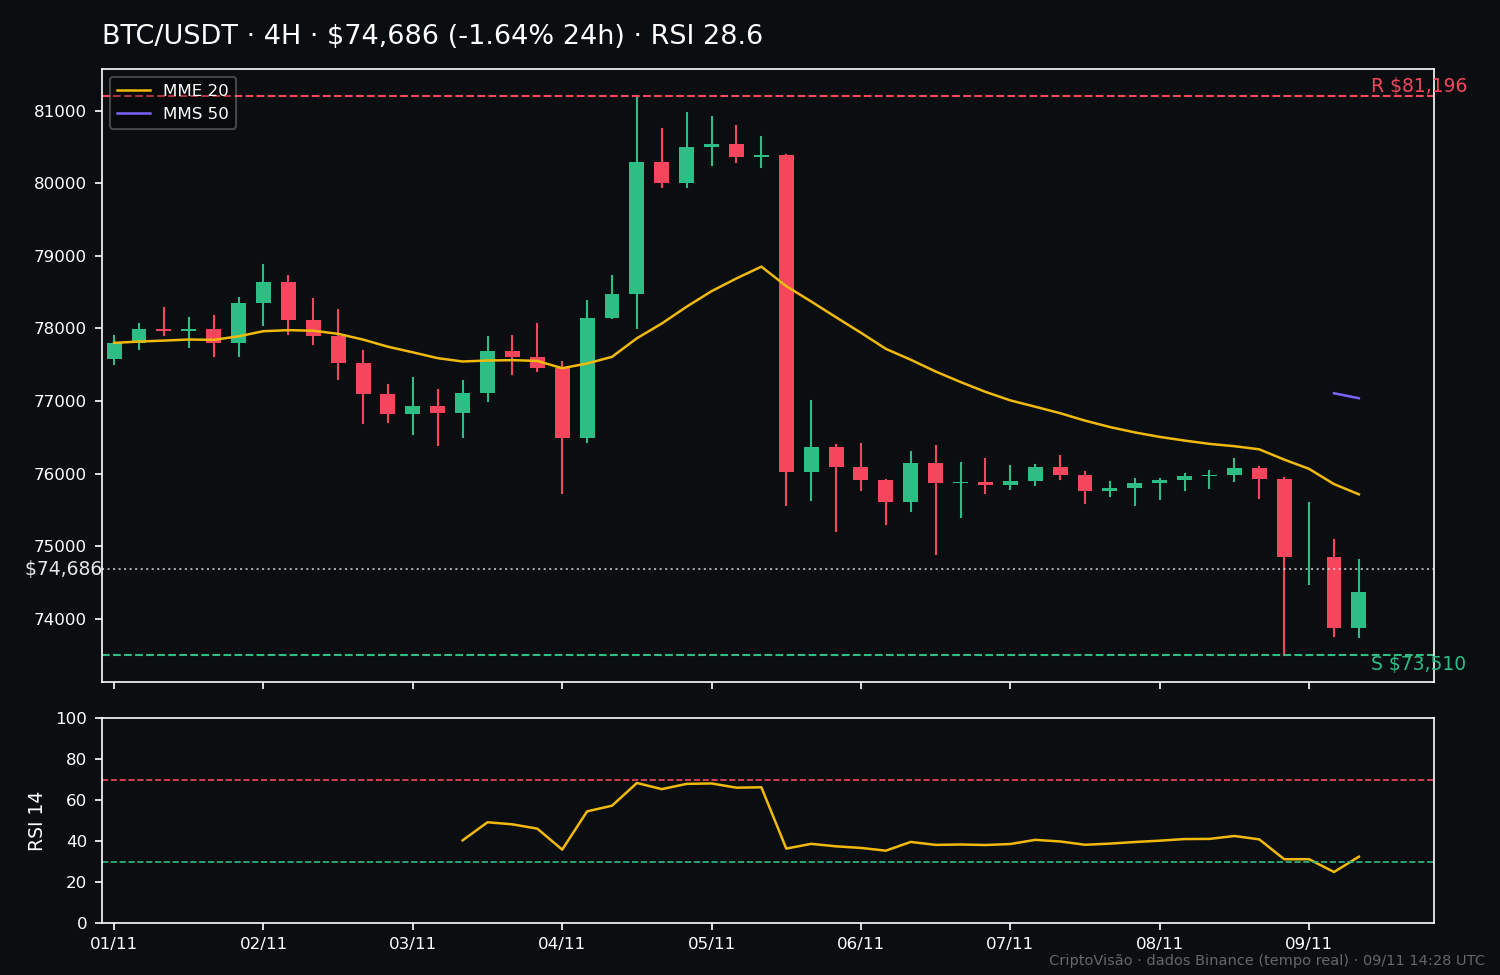
$BTC today: $74.696 (-1.6% in 24h). Weekly support: $73.510. Resistance: $81.196. RSI at 28.6, in oversold territory, and the price remains below the 20- and 50-period moving averages. Today’s calculation, step by step, using a $1,000 account as an example:
1️⃣ Define the risk: 1% of the account = $10 per trade. That’s the maximum you’re willing to lose if the stop is triggered.
2️⃣ Place the stop based on market structure: below actual support, at $73.100 — not at some arbitrary round number. Distance from entry: $74.696 − $73.100 = $1.596 per BTC.
3️⃣ The stop determines the position size: $10 ÷ $1.596 = 0,0063 BTC, about $468. It’s not the amount you “think” is right — it’s what the risk allows.
Risk/reward test: target at resistance, $81.196 − $74.696 = $6.500 in potential gains versus $1.596 in risk. A 4.1-to-1 ratio — above the minimum of 2-to-1, so the trade passes the test. Caveat: the short-term trend remains bearish, so the numbers give it the green light, but the context calls for caution.
Why does this matter? Ten 1% stop-outs cost about 9.6% of your account — you stay in the game. Ten 10% bets cost 65%. Preserving capital is strategy No. 1.
Do you already calculate your position size before entering, or do you decide by gut feeling? 👇
#Bitcoin #GestaoDeRisco #CryptoVision
Position size determines whether you survive — not being right 📐
$BTC today: $74.696 (-1.6% in 24h). Weekly support: $73.510. Resistance: $81.196. RSI at 28.6, in oversold territory, and the price remains below the 20- and 50-period moving averages. Today’s calculation, step by step, using a $1,000 account as an example:
1️⃣ Define the risk: 1% of the account = $10 per trade. That’s the maximum you’re willing to lose if the stop is triggered.
2️⃣ Place the stop based on market structure: below actual support, at $73.100 — not at some arbitrary round number. Distance from entry: $74.696 − $73.100 = $1.596 per BTC.
3️⃣ The stop determines the position size: $10 ÷ $1.596 = 0,0063 BTC, about $468. It’s not the amount you “think” is right — it’s what the risk allows.
Risk/reward test: target at resistance, $81.196 − $74.696 = $6.500 in potential gains versus $1.596 in risk. A 4.1-to-1 ratio — above the minimum of 2-to-1, so the trade passes the test. Caveat: the short-term trend remains bearish, so the numbers give it the green light, but the context calls for caution.
Why does this matter? Ten 1% stop-outs cost about 9.6% of your account — you stay in the game. Ten 10% bets cost 65%. Preserving capital is strategy No. 1.
Do you already calculate your position size before entering, or do you decide by gut feeling? 👇
#Bitcoin #GestaoDeRisco #CryptoVision
$BTC today: $74.696 (-1.6% in 24h). Weekly support: $73.510. Resistance: $81.196. RSI at 28.6, in oversold territory, and the price remains below the 20- and 50-period moving averages. Today’s calculation, step by step, using a $1,000 account as an example:
1️⃣ Define the risk: 1% of the account = $10 per trade. That’s the maximum you’re willing to lose if the stop is triggered.
2️⃣ Place the stop based on market structure: below actual support, at $73.100 — not at some arbitrary round number. Distance from entry: $74.696 − $73.100 = $1.596 per BTC.
3️⃣ The stop determines the position size: $10 ÷ $1.596 = 0,0063 BTC, about $468. It’s not the amount you “think” is right — it’s what the risk allows.
Risk/reward test: target at resistance, $81.196 − $74.696 = $6.500 in potential gains versus $1.596 in risk. A 4.1-to-1 ratio — above the minimum of 2-to-1, so the trade passes the test. Caveat: the short-term trend remains bearish, so the numbers give it the green light, but the context calls for caution.
Why does this matter? Ten 1% stop-outs cost about 9.6% of your account — you stay in the game. Ten 10% bets cost 65%. Preserving capital is strategy No. 1.
Do you already calculate your position size before entering, or do you decide by gut feeling? 👇
#Bitcoin #GestaoDeRisco #CryptoVision
8
·
--
ETH in extreme oversold territory: what the RSI at 14.7 is telling us 📉
SITUATION
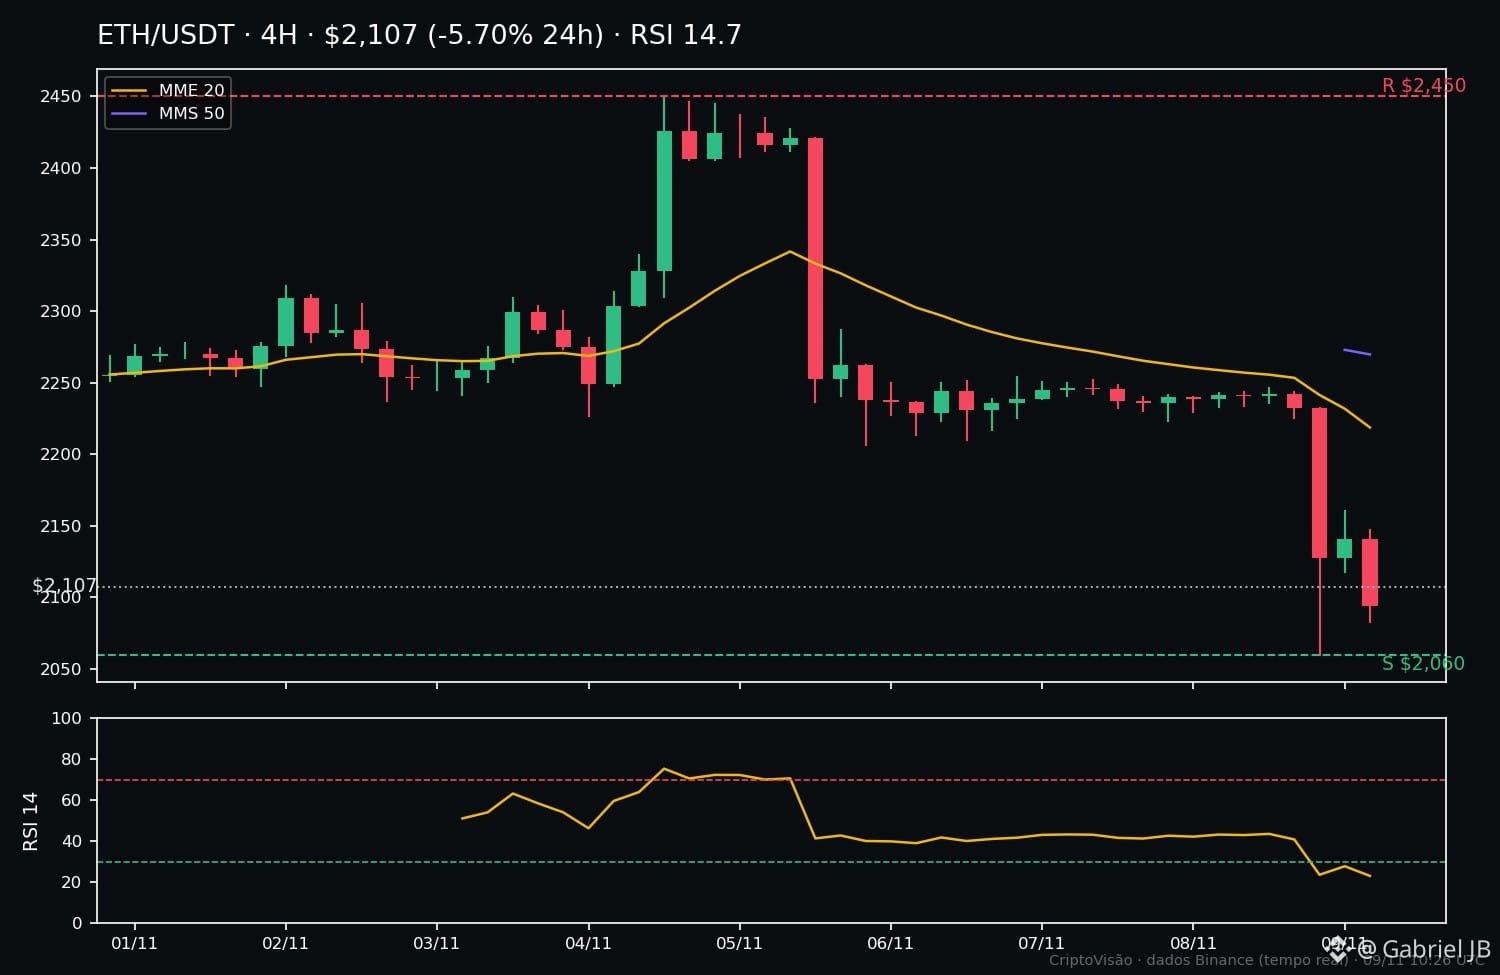
$ETH is trading at $2,107, down 5.69% in 24h and 7.17% for the week. The RSI-14 (4h) is at 14.7 — extreme oversold territory — and the price remains below the 20- and 50-period moving averages ($2,221 and $2,270). 24h volume totals $777 million.
LEVELS
• Immediate support: $2,060 (24h and weekly low)
• Next support: $2,000 (psychological)
• Resistance: $2,221 (20-period average) and $2,270 (50-period average)
• Weekly high: $2,450
$ETH vs. $BTC
$BTC is also down (-2.08% in 24h), but $ETH is falling almost 3x as much. Clear relative weakness: when the market corrects, $ETH suffers more — and when it recovers, it tends to rebound more strongly. Both are oversold ($BTC RSI at 18.3).
SCENARIO A — Relief
Holding $2,060 and closing a 4h candle above $2,221 opens the way to test $2,270. Confirmation: growing buying volume and the RSI moving out of oversold territory.
SCENARIO B — Continued decline
Losing $2,060 on a 4h close opens the way to test $2,000. Confirmation: $BTC also losing $73,510 (weekly low).
WHAT WOULD CONFIRM IT
A 4h close: above $2,221 (relief) or below $2,060 (decline). Without a close, it’s just intraday noise.
RISK
Being oversold is not a buy signal by itself: an asset can remain oversold for days. Panic-selling near support or buying just because it “fell a lot” are the two classic mistakes here. Risk management first, always.
CONCLUSION
$ETH is weak, oversold, and testing the week’s support. The level that decides everything is $2,060 — above it, relief; below it, $2,000 comes into view. Do you see $ETH holding this support, or will $BTC pull everything down? 👇
#Ethereum #CriptoVisao #TechnicalAnalysis
ETH in extreme oversold territory: what the RSI at 14.7 is telling us 📉
SITUATION
$ETH is trading at $2,107, down 5.69% in 24h and 7.17% for the week. The RSI-14 (4h) is at 14.7 — extreme oversold territory — and the price remains below the 20- and 50-period moving averages ($2,221 and $2,270). 24h volume totals $777 million.
LEVELS
• Immediate support: $2,060 (24h and weekly low)
• Next support: $2,000 (psychological)
• Resistance: $2,221 (20-period average) and $2,270 (50-period average)
• Weekly high: $2,450
$ETH vs. $BTC
$BTC is also down (-2.08% in 24h), but $ETH is falling almost 3x as much. Clear relative weakness: when the market corrects, $ETH suffers more — and when it recovers, it tends to rebound more strongly. Both are oversold ($BTC RSI at 18.3).
SCENARIO A — Relief
Holding $2,060 and closing a 4h candle above $2,221 opens the way to test $2,270. Confirmation: growing buying volume and the RSI moving out of oversold territory.
SCENARIO B — Continued decline
Losing $2,060 on a 4h close opens the way to test $2,000. Confirmation: $BTC also losing $73,510 (weekly low).
WHAT WOULD CONFIRM IT
A 4h close: above $2,221 (relief) or below $2,060 (decline). Without a close, it’s just intraday noise.
RISK
Being oversold is not a buy signal by itself: an asset can remain oversold for days. Panic-selling near support or buying just because it “fell a lot” are the two classic mistakes here. Risk management first, always.
CONCLUSION
$ETH is weak, oversold, and testing the week’s support. The level that decides everything is $2,060 — above it, relief; below it, $2,000 comes into view. Do you see $ETH holding this support, or will $BTC pull everything down? 👇
#Ethereum #CriptoVisao #TechnicalAnalysis
SITUATION
$ETH is trading at $2,107, down 5.69% in 24h and 7.17% for the week. The RSI-14 (4h) is at 14.7 — extreme oversold territory — and the price remains below the 20- and 50-period moving averages ($2,221 and $2,270). 24h volume totals $777 million.
LEVELS
• Immediate support: $2,060 (24h and weekly low)
• Next support: $2,000 (psychological)
• Resistance: $2,221 (20-period average) and $2,270 (50-period average)
• Weekly high: $2,450
$ETH vs. $BTC
$BTC is also down (-2.08% in 24h), but $ETH is falling almost 3x as much. Clear relative weakness: when the market corrects, $ETH suffers more — and when it recovers, it tends to rebound more strongly. Both are oversold ($BTC RSI at 18.3).
SCENARIO A — Relief
Holding $2,060 and closing a 4h candle above $2,221 opens the way to test $2,270. Confirmation: growing buying volume and the RSI moving out of oversold territory.
SCENARIO B — Continued decline
Losing $2,060 on a 4h close opens the way to test $2,000. Confirmation: $BTC also losing $73,510 (weekly low).
WHAT WOULD CONFIRM IT
A 4h close: above $2,221 (relief) or below $2,060 (decline). Without a close, it’s just intraday noise.
RISK
Being oversold is not a buy signal by itself: an asset can remain oversold for days. Panic-selling near support or buying just because it “fell a lot” are the two classic mistakes here. Risk management first, always.
CONCLUSION
$ETH is weak, oversold, and testing the week’s support. The level that decides everything is $2,060 — above it, relief; below it, $2,000 comes into view. Do you see $ETH holding this support, or will $BTC pull everything down? 👇
#Ethereum #CriptoVisao #TechnicalAnalysis
46
·
--
$DOGE tests $0.07: support or a door open to further downside?
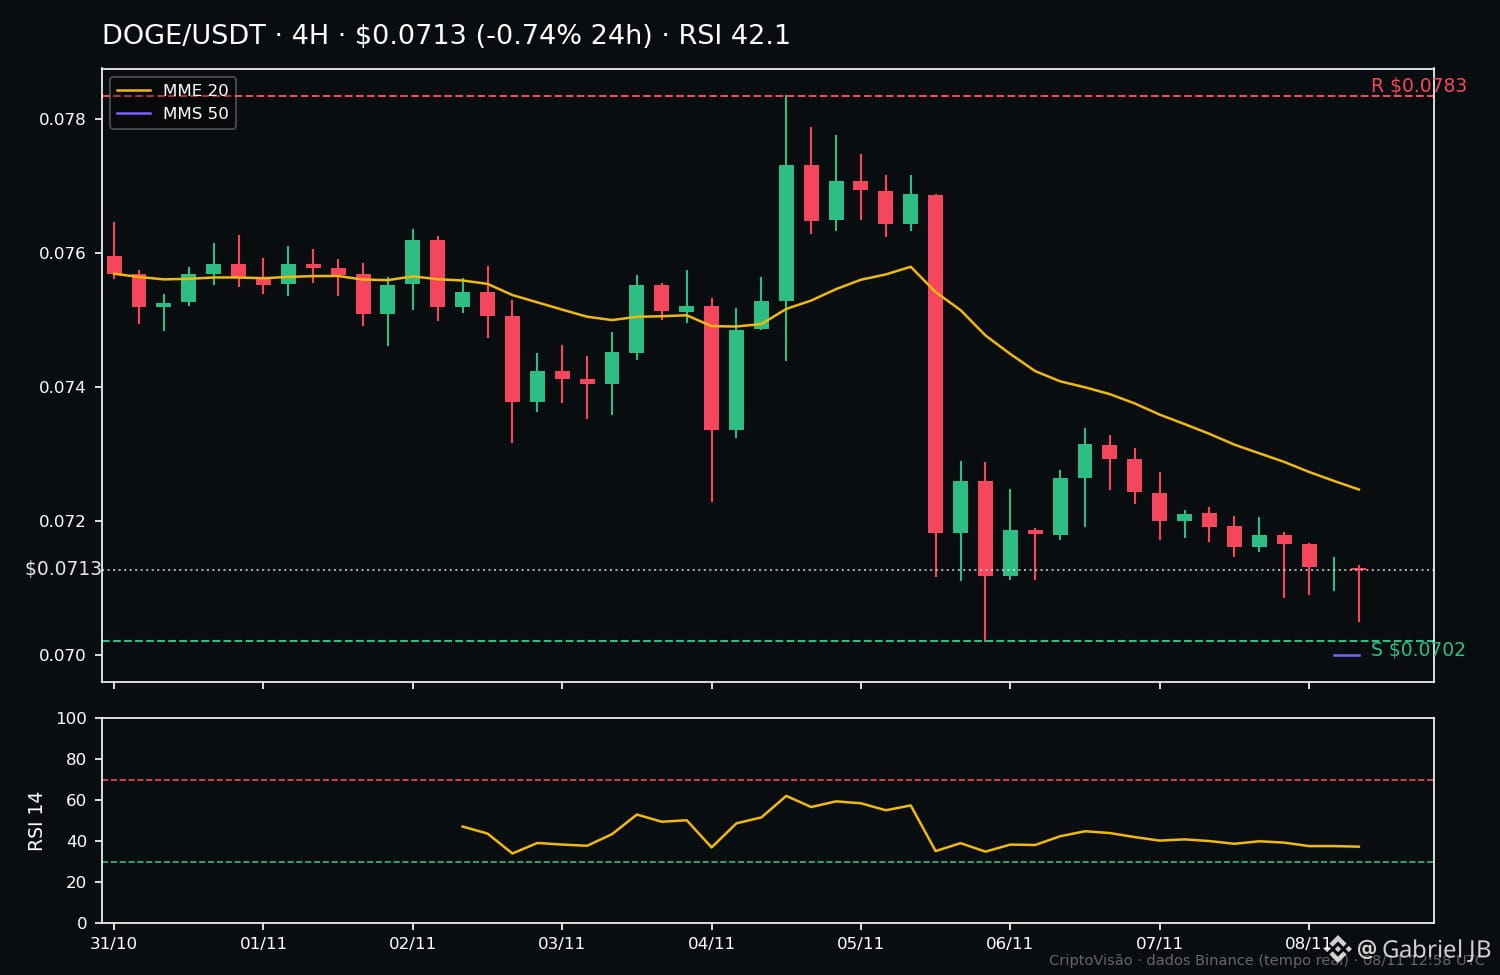
SITUATION — Dogecoin is trading at $0.07126, down 0.75% over the last 24 hours and 5.85% over the last 7 days. The price is sitting right on the 7-day low ($0.0702), with the RSI-14 at 42.1 — a neutral zone, but approaching weakness. The 20- and 50-period moving averages (4h) are both near $0.07: the price is exactly at a decision point.
LEVELS — Support: $0.0702 (7-day low), followed by the $0.068 zone. Resistance: $0.0720 (24-hour high) and $0.0783 (7-day high). 24-hour volume is about $11.8 million — lower than SOL and XRP today, so moves may be sharper.
SCENARIO A (support holds) — If $0.07 holds with a 4h close above $0.0720, the structure improves and the next level to watch is $0.0783.
SCENARIO B (support breaks) — If there is a 4h close below $0.0702, there is room for the decline to extend toward $0.068, with increased volatility.
WHAT WOULD CONFIRM IT — In scenario A, rising volume on a break above $0.0720 and the RSI climbing above 50. In scenario B, a confirmed close below $0.0702, not just a quick wick.
RISK — Altcoins are more volatile and have wider spreads than BTC: stops need to account for that, with a wider margin and a smaller position. None of this is financial advice — it’s a technical reading of a level being tested.
CONCLUSION — $DOGE is at the all-or-nothing $0.07 level: either support holds and the coin gets some breathing room, or it breaks and the correction takes another leg down. What’s your read — a hold or a break? #Dogecoin #CriptoVisao #TechnicalAnalysis
$DOGE tests $0.07: support or a door open to further downside?
SITUATION — Dogecoin is trading at $0.07126, down 0.75% over the last 24 hours and 5.85% over the last 7 days. The price is sitting right on the 7-day low ($0.0702), with the RSI-14 at 42.1 — a neutral zone, but approaching weakness. The 20- and 50-period moving averages (4h) are both near $0.07: the price is exactly at a decision point.
LEVELS — Support: $0.0702 (7-day low), followed by the $0.068 zone. Resistance: $0.0720 (24-hour high) and $0.0783 (7-day high). 24-hour volume is about $11.8 million — lower than SOL and XRP today, so moves may be sharper.
SCENARIO A (support holds) — If $0.07 holds with a 4h close above $0.0720, the structure improves and the next level to watch is $0.0783.
SCENARIO B (support breaks) — If there is a 4h close below $0.0702, there is room for the decline to extend toward $0.068, with increased volatility.
WHAT WOULD CONFIRM IT — In scenario A, rising volume on a break above $0.0720 and the RSI climbing above 50. In scenario B, a confirmed close below $0.0702, not just a quick wick.
RISK — Altcoins are more volatile and have wider spreads than BTC: stops need to account for that, with a wider margin and a smaller position. None of this is financial advice — it’s a technical reading of a level being tested.
CONCLUSION — $DOGE is at the all-or-nothing $0.07 level: either support holds and the coin gets some breathing room, or it breaks and the correction takes another leg down. What’s your read — a hold or a break? #Dogecoin #CriptoVisao #TechnicalAnalysis
SITUATION — Dogecoin is trading at $0.07126, down 0.75% over the last 24 hours and 5.85% over the last 7 days. The price is sitting right on the 7-day low ($0.0702), with the RSI-14 at 42.1 — a neutral zone, but approaching weakness. The 20- and 50-period moving averages (4h) are both near $0.07: the price is exactly at a decision point.
LEVELS — Support: $0.0702 (7-day low), followed by the $0.068 zone. Resistance: $0.0720 (24-hour high) and $0.0783 (7-day high). 24-hour volume is about $11.8 million — lower than SOL and XRP today, so moves may be sharper.
SCENARIO A (support holds) — If $0.07 holds with a 4h close above $0.0720, the structure improves and the next level to watch is $0.0783.
SCENARIO B (support breaks) — If there is a 4h close below $0.0702, there is room for the decline to extend toward $0.068, with increased volatility.
WHAT WOULD CONFIRM IT — In scenario A, rising volume on a break above $0.0720 and the RSI climbing above 50. In scenario B, a confirmed close below $0.0702, not just a quick wick.
RISK — Altcoins are more volatile and have wider spreads than BTC: stops need to account for that, with a wider margin and a smaller position. None of this is financial advice — it’s a technical reading of a level being tested.
CONCLUSION — $DOGE is at the all-or-nothing $0.07 level: either support holds and the coin gets some breathing room, or it breaks and the correction takes another leg down. What’s your read — a hold or a break? #Dogecoin #CriptoVisao #TechnicalAnalysis
24
·
--
ETH is leaning on the weekly support — and the next move depends on this test 📊
SITUATION
$ETH is trading at US$ 2.234,69, down 0,47% in 24 hours and practically flat for the week (-0,18%). The price is below the 20- and 50-period moving averages on the 4-hour chart (US$ 2.267,88 and US$ 2.278,04), and the RSI-14 is at 52,3 — neutral, with neither oversold conditions nor euphoria. In short: the market has no clear direction, compressed near support.
LEVELS
• Support: US$ 2.206,28 (weekly low) — the price is only 1,3% above it
• Immediate resistance: US$ 2.267,88 (20-period moving average)
• Weekly resistance: US$ 2.450,00 (high of the last 7 days)
$ETH vs $BTC
$BTC is also below the moving averages on the 4-hour chart, but is falling less today (-0,15% versus -0,47% for ETH). For the week, however, ETH is holding up better: -0,18% versus -1,8% for BTC. In other words: relative weakness today, relative resilience for the week. Neither has a defined trend.
SCENARIO A — Support holds
If ETH holds US$ 2.206 and closes back above US$ 2.268, the recovery scenario gains strength, with the US$ 2.450 zone as the weekly reference.
SCENARIO B — Support breaks
A 4-hour close below US$ 2.206 would invalidate the defense and open the door to new weekly lows, with no immediate technical support on the chart.
WHAT WOULD CONFIRM IT
• Scenario A: 4-hour close above US$ 2.268, with the RSI rising
• Scenario B: 4-hour close below US$ 2.206, with an increase in selling volume
RISK
Buying right at support without confirmation means betting on it holding before that happens — and if support breaks, the decline tends to accelerate. Risk management first: size your position and define your invalidation level before entering.
CONCLUSION
ETH is at a decision point, neither euphoric nor panicked. The US$ 2.206 support is the line separating consolidation from a continuation of the decline. What do you think: will support hold or break this week? 👇
#Ethereum #CriptoVisao #TechnicalAnalysis
ETH is leaning on the weekly support — and the next move depends on this test 📊
SITUATION
$ETH is trading at US$ 2.234,69, down 0,47% in 24 hours and practically flat for the week (-0,18%). The price is below the 20- and 50-period moving averages on the 4-hour chart (US$ 2.267,88 and US$ 2.278,04), and the RSI-14 is at 52,3 — neutral, with neither oversold conditions nor euphoria. In short: the market has no clear direction, compressed near support.
LEVELS
• Support: US$ 2.206,28 (weekly low) — the price is only 1,3% above it
• Immediate resistance: US$ 2.267,88 (20-period moving average)
• Weekly resistance: US$ 2.450,00 (high of the last 7 days)
$ETH vs $BTC
$BTC is also below the moving averages on the 4-hour chart, but is falling less today (-0,15% versus -0,47% for ETH). For the week, however, ETH is holding up better: -0,18% versus -1,8% for BTC. In other words: relative weakness today, relative resilience for the week. Neither has a defined trend.
SCENARIO A — Support holds
If ETH holds US$ 2.206 and closes back above US$ 2.268, the recovery scenario gains strength, with the US$ 2.450 zone as the weekly reference.
SCENARIO B — Support breaks
A 4-hour close below US$ 2.206 would invalidate the defense and open the door to new weekly lows, with no immediate technical support on the chart.
WHAT WOULD CONFIRM IT
• Scenario A: 4-hour close above US$ 2.268, with the RSI rising
• Scenario B: 4-hour close below US$ 2.206, with an increase in selling volume
RISK
Buying right at support without confirmation means betting on it holding before that happens — and if support breaks, the decline tends to accelerate. Risk management first: size your position and define your invalidation level before entering.
CONCLUSION
ETH is at a decision point, neither euphoric nor panicked. The US$ 2.206 support is the line separating consolidation from a continuation of the decline. What do you think: will support hold or break this week? 👇
#Ethereum #CriptoVisao #TechnicalAnalysis
SITUATION
$ETH is trading at US$ 2.234,69, down 0,47% in 24 hours and practically flat for the week (-0,18%). The price is below the 20- and 50-period moving averages on the 4-hour chart (US$ 2.267,88 and US$ 2.278,04), and the RSI-14 is at 52,3 — neutral, with neither oversold conditions nor euphoria. In short: the market has no clear direction, compressed near support.
LEVELS
• Support: US$ 2.206,28 (weekly low) — the price is only 1,3% above it
• Immediate resistance: US$ 2.267,88 (20-period moving average)
• Weekly resistance: US$ 2.450,00 (high of the last 7 days)
$ETH vs $BTC
$BTC is also below the moving averages on the 4-hour chart, but is falling less today (-0,15% versus -0,47% for ETH). For the week, however, ETH is holding up better: -0,18% versus -1,8% for BTC. In other words: relative weakness today, relative resilience for the week. Neither has a defined trend.
SCENARIO A — Support holds
If ETH holds US$ 2.206 and closes back above US$ 2.268, the recovery scenario gains strength, with the US$ 2.450 zone as the weekly reference.
SCENARIO B — Support breaks
A 4-hour close below US$ 2.206 would invalidate the defense and open the door to new weekly lows, with no immediate technical support on the chart.
WHAT WOULD CONFIRM IT
• Scenario A: 4-hour close above US$ 2.268, with the RSI rising
• Scenario B: 4-hour close below US$ 2.206, with an increase in selling volume
RISK
Buying right at support without confirmation means betting on it holding before that happens — and if support breaks, the decline tends to accelerate. Risk management first: size your position and define your invalidation level before entering.
CONCLUSION
ETH is at a decision point, neither euphoric nor panicked. The US$ 2.206 support is the line separating consolidation from a continuation of the decline. What do you think: will support hold or break this week? 👇
#Ethereum #CriptoVisao #TechnicalAnalysis
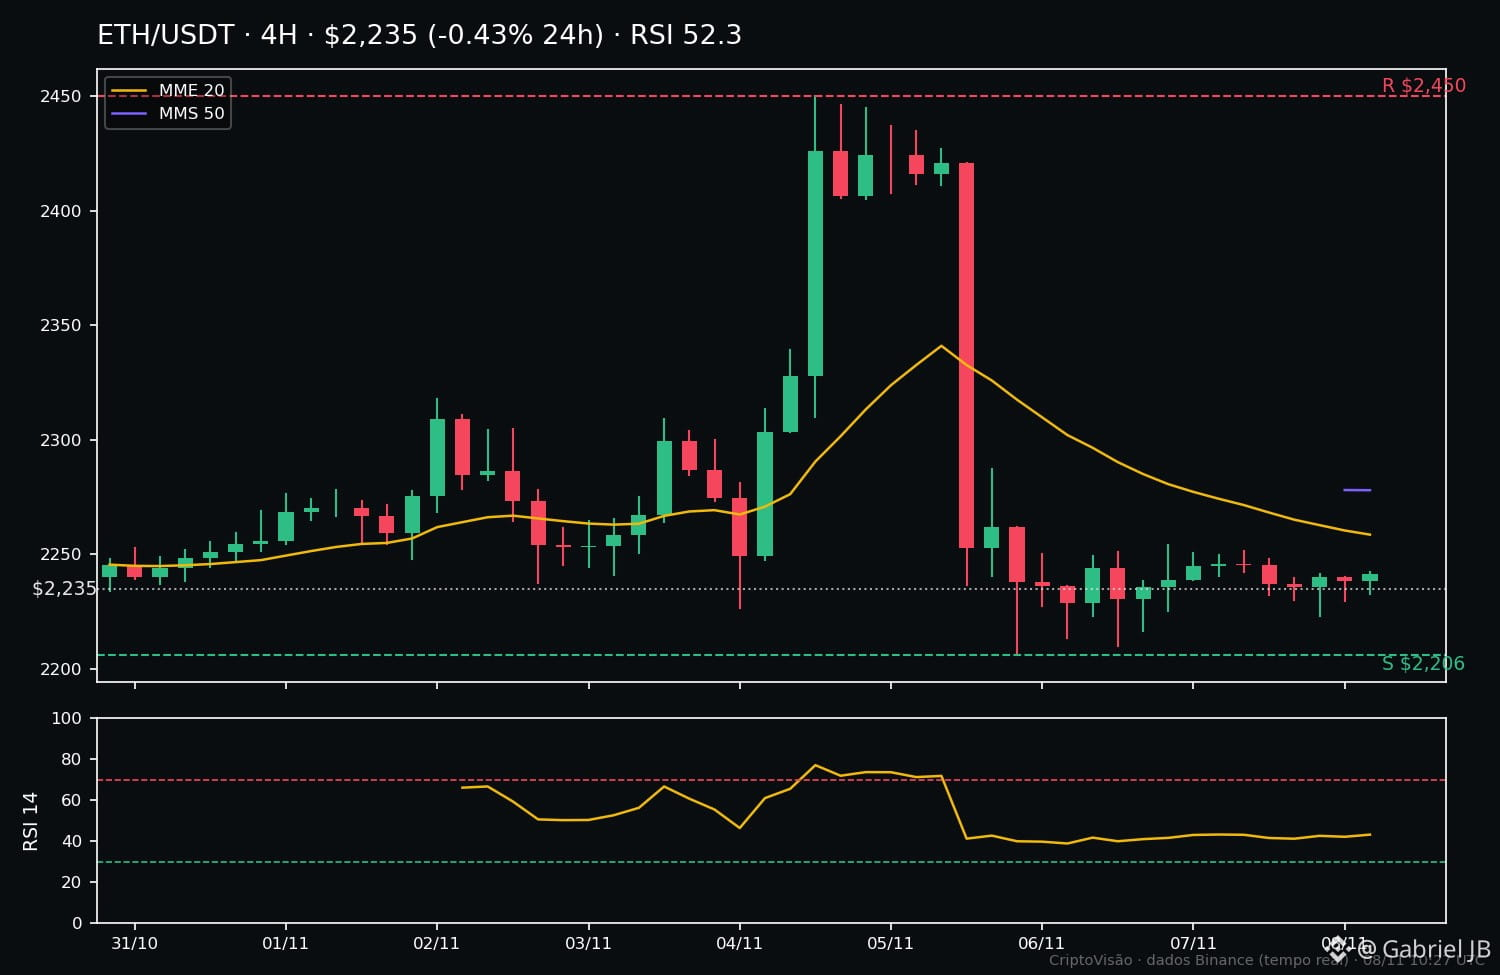
48
·
--
Bitcoin tests the week's floor: what will decide the next move 📉
SITUATION
The $BTC is trading at US$ 75.978, down 0.17% over the last 24 hours and 1.33% on the week. The price is below the 20-period (US$ 76.844) and 50-period (US$ 77.404) moving averages on the 4-hour chart, with RSI-14 at 40.5 — neutral, but leaning weak. Volume over the last 24 hours was US$ 380 million. The week saw momentum fade after reaching a high of US$ 81.196.
LEVELS
• Support: US$ 74.888 (7-day low)
• Immediate resistance: US$ 76.844 (EMA-20) and US$ 77.404 (EMA-50)
• Major resistance: US$ 81.196 (weekly high)
SCENARIO A — SUPPORT HOLDS
If the price defends US$ 74.888 and closes a 4-hour candle above US$ 76.844, the market could regain momentum and test US$ 77.404, then US$ 81.196.
SCENARIO B — SUPPORT BREAKS
If a 4-hour candle closes below US$ 74.888, the week's structure breaks down, leaving the next downside target open, with no clear nearby support.
WHAT WOULD CONFIRM IT
A 4-hour candle close, not a wick: above US$ 76.844 confirms strength; below US$ 74.888 confirms weakness. Volume accompanying the move adds weight to the signal.
RISK
Trading in the middle of the range is the biggest mistake here: without confirmation, both buying at support and selling at resistance are bets. Risk management comes first — keep positions small and define invalidation before entering.
CONCLUSION
Bitcoin is at a decision point: US$ 74.888 will determine whether the week ends in recovery or continued decline. What do you think — will support hold or break? 👇
#Bitcoin #BTC #CriptoVisao
Bitcoin tests the week's floor: what will decide the next move 📉
SITUATION
The $BTC is trading at US$ 75.978, down 0.17% over the last 24 hours and 1.33% on the week. The price is below the 20-period (US$ 76.844) and 50-period (US$ 77.404) moving averages on the 4-hour chart, with RSI-14 at 40.5 — neutral, but leaning weak. Volume over the last 24 hours was US$ 380 million. The week saw momentum fade after reaching a high of US$ 81.196.
LEVELS
• Support: US$ 74.888 (7-day low)
• Immediate resistance: US$ 76.844 (EMA-20) and US$ 77.404 (EMA-50)
• Major resistance: US$ 81.196 (weekly high)
SCENARIO A — SUPPORT HOLDS
If the price defends US$ 74.888 and closes a 4-hour candle above US$ 76.844, the market could regain momentum and test US$ 77.404, then US$ 81.196.
SCENARIO B — SUPPORT BREAKS
If a 4-hour candle closes below US$ 74.888, the week's structure breaks down, leaving the next downside target open, with no clear nearby support.
WHAT WOULD CONFIRM IT
A 4-hour candle close, not a wick: above US$ 76.844 confirms strength; below US$ 74.888 confirms weakness. Volume accompanying the move adds weight to the signal.
RISK
Trading in the middle of the range is the biggest mistake here: without confirmation, both buying at support and selling at resistance are bets. Risk management comes first — keep positions small and define invalidation before entering.
CONCLUSION
Bitcoin is at a decision point: US$ 74.888 will determine whether the week ends in recovery or continued decline. What do you think — will support hold or break? 👇
#Bitcoin #BTC #CriptoVisao
SITUATION
The $BTC is trading at US$ 75.978, down 0.17% over the last 24 hours and 1.33% on the week. The price is below the 20-period (US$ 76.844) and 50-period (US$ 77.404) moving averages on the 4-hour chart, with RSI-14 at 40.5 — neutral, but leaning weak. Volume over the last 24 hours was US$ 380 million. The week saw momentum fade after reaching a high of US$ 81.196.
LEVELS
• Support: US$ 74.888 (7-day low)
• Immediate resistance: US$ 76.844 (EMA-20) and US$ 77.404 (EMA-50)
• Major resistance: US$ 81.196 (weekly high)
SCENARIO A — SUPPORT HOLDS
If the price defends US$ 74.888 and closes a 4-hour candle above US$ 76.844, the market could regain momentum and test US$ 77.404, then US$ 81.196.
SCENARIO B — SUPPORT BREAKS
If a 4-hour candle closes below US$ 74.888, the week's structure breaks down, leaving the next downside target open, with no clear nearby support.
WHAT WOULD CONFIRM IT
A 4-hour candle close, not a wick: above US$ 76.844 confirms strength; below US$ 74.888 confirms weakness. Volume accompanying the move adds weight to the signal.
RISK
Trading in the middle of the range is the biggest mistake here: without confirmation, both buying at support and selling at resistance are bets. Risk management comes first — keep positions small and define invalidation before entering.
CONCLUSION
Bitcoin is at a decision point: US$ 74.888 will determine whether the week ends in recovery or continued decline. What do you think — will support hold or break? 👇
#Bitcoin #BTC #CriptoVisao
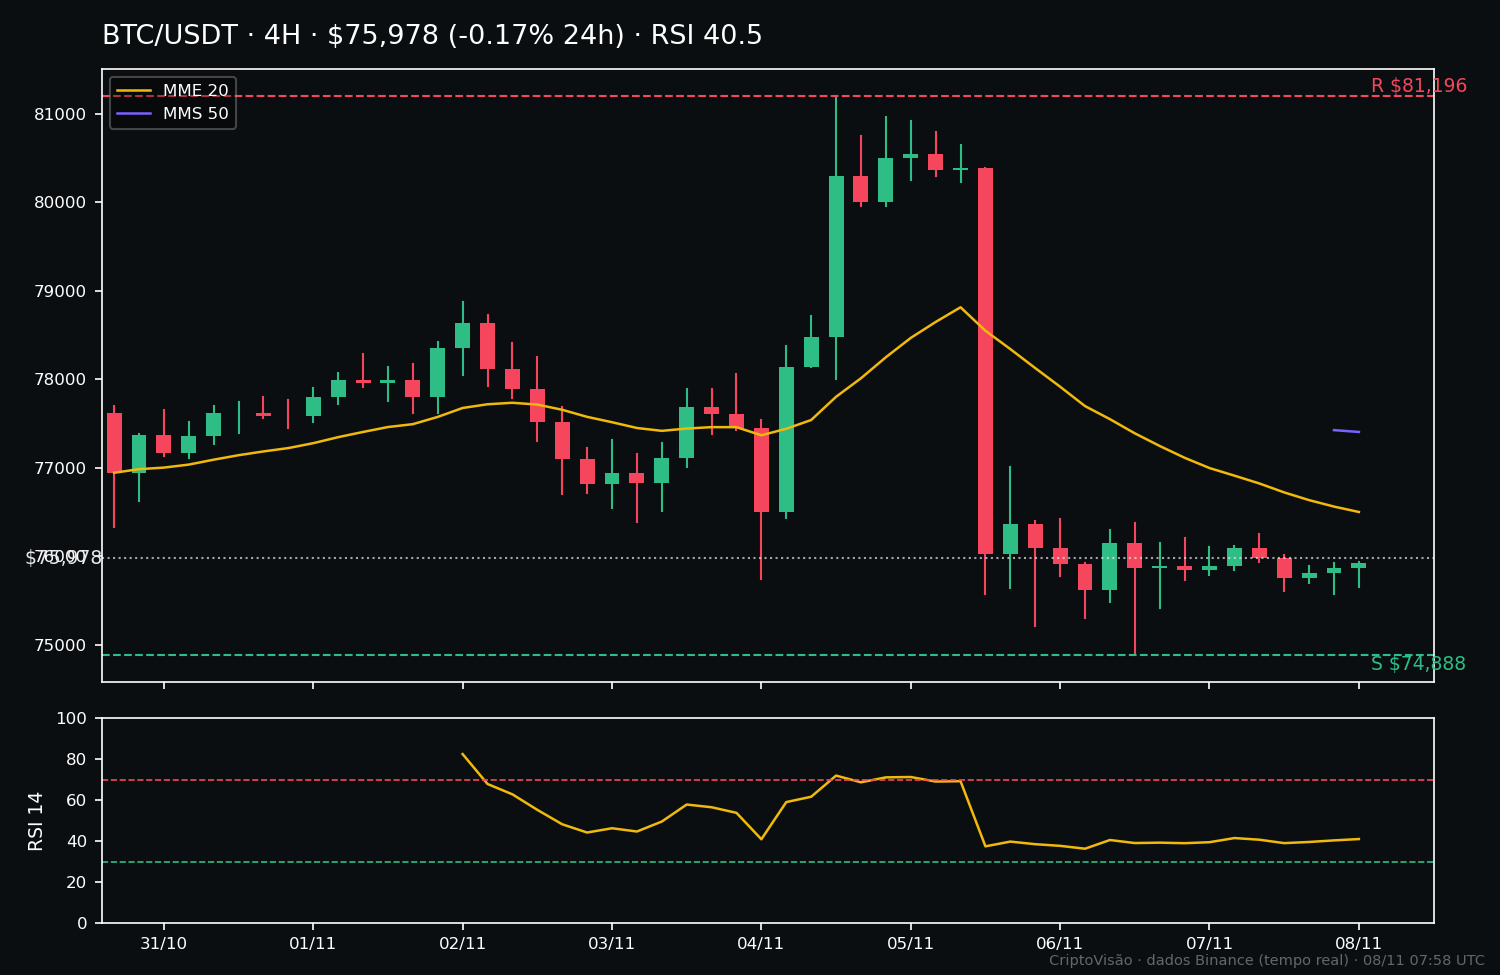
281
·
--
The day the market couldn't make up its mind — and all three RSI readings in oversold territory 📊
THE DAY IN A FEW LINES (07/11, ~21:00 CAT)
$BTC: US$ 75.803 | 24h +0,01% | 7d −3,1% | RSI-14 16,9
$ETH: US$ 2.237 | 24h +0,26% | 7d +0,01% | RSI-14 16,6
$SOL: US$ 89,81 | 24h −0,51% | 7d −8,0% | RSI-14 21,1
It was a sideways day, hugging the week's lows: $BTC spent the day between US$ 75.601 and US$ 76.250, $ETH barely moved in 7 days, and $SOL was the weakest of the three, down −8% for the week. All three ended the day in oversold territory — selling pressure exhausted in the short term, but oversold conditions alone aren't a buy signal.
WHAT WAS CONFIRMED ✅
• $BTC support at US$ 74.888 held all day — the 24h low was US$ 75.601, always above it.
• $ETH maintained its relative strength: flat over 7 days (+0,01%) while $BTC fell 3,1%.
WHAT WASN'T CONFIRMED ❌
• The morning thesis's bounce never appeared: $BTC slid from US$ 76.107 at 10:00 to US$ 75.803, and the RSI plunged from 21,3 to 16,9.
• The $ETH retest of the US$ 2.277–2.300 zone (the 19:00 strategy) hasn't happened yet — the price remains below it.
LEVELS FOR TOMORROW
$BTC: support at US$ 74.888 — if it breaks below with a 4h close, another leg down could begin; resistance at US$ 76.250, then the moving averages at US$ 77.400.
$ETH: support at US$ 2.206; resistance at US$ 2.277–2.300 — only a close above that range would change the tone.
$SOL: support at US$ 88,30; resistance at US$ 91,98 (20-period average).
Risk reminder: markets change overnight, and an oversold RSI can remain oversold for days. No position means no loss — patience is a position too.
Will we test support first tomorrow, or will we finally see a bounce? 👇
$BTC $ETH $SOL
#Bitcoin #Ethereum #CriptoVisao
The day the market couldn't make up its mind — and all three RSI readings in oversold territory 📊
THE DAY IN A FEW LINES (07/11, ~21:00 CAT)
$BTC : US$ 75.803 | 24h +0,01% | 7d −3,1% | RSI-14 16,9
$ETH : US$ 2.237 | 24h +0,26% | 7d +0,01% | RSI-14 16,6
$SOL : US$ 89,81 | 24h −0,51% | 7d −8,0% | RSI-14 21,1
It was a sideways day, hugging the week's lows: $BTC spent the day between US$ 75.601 and US$ 76.250, $ETH barely moved in 7 days, and $SOL was the weakest of the three, down −8% for the week. All three ended the day in oversold territory — selling pressure exhausted in the short term, but oversold conditions alone aren't a buy signal.
WHAT WAS CONFIRMED ✅
• $BTC support at US$ 74.888 held all day — the 24h low was US$ 75.601, always above it.
• $ETH maintained its relative strength: flat over 7 days (+0,01%) while $BTC fell 3,1%.
WHAT WASN'T CONFIRMED ❌
• The morning thesis's bounce never appeared: $BTC slid from US$ 76.107 at 10:00 to US$ 75.803, and the RSI plunged from 21,3 to 16,9.
• The $ETH retest of the US$ 2.277–2.300 zone (the 19:00 strategy) hasn't happened yet — the price remains below it.
LEVELS FOR TOMORROW
$BTC : support at US$ 74.888 — if it breaks below with a 4h close, another leg down could begin; resistance at US$ 76.250, then the moving averages at US$ 77.400.
$ETH : support at US$ 2.206; resistance at US$ 2.277–2.300 — only a close above that range would change the tone.
$SOL : support at US$ 88,30; resistance at US$ 91,98 (20-period average).
Risk reminder: markets change overnight, and an oversold RSI can remain oversold for days. No position means no loss — patience is a position too.
Will we test support first tomorrow, or will we finally see a bounce? 👇
$BTC $ETH $SOL
#Bitcoin #Ethereum #CriptoVisao
THE DAY IN A FEW LINES (07/11, ~21:00 CAT)
$BTC : US$ 75.803 | 24h +0,01% | 7d −3,1% | RSI-14 16,9
$ETH : US$ 2.237 | 24h +0,26% | 7d +0,01% | RSI-14 16,6
$SOL : US$ 89,81 | 24h −0,51% | 7d −8,0% | RSI-14 21,1
It was a sideways day, hugging the week's lows: $BTC spent the day between US$ 75.601 and US$ 76.250, $ETH barely moved in 7 days, and $SOL was the weakest of the three, down −8% for the week. All three ended the day in oversold territory — selling pressure exhausted in the short term, but oversold conditions alone aren't a buy signal.
WHAT WAS CONFIRMED ✅
• $BTC support at US$ 74.888 held all day — the 24h low was US$ 75.601, always above it.
• $ETH maintained its relative strength: flat over 7 days (+0,01%) while $BTC fell 3,1%.
WHAT WASN'T CONFIRMED ❌
• The morning thesis's bounce never appeared: $BTC slid from US$ 76.107 at 10:00 to US$ 75.803, and the RSI plunged from 21,3 to 16,9.
• The $ETH retest of the US$ 2.277–2.300 zone (the 19:00 strategy) hasn't happened yet — the price remains below it.
LEVELS FOR TOMORROW
$BTC : support at US$ 74.888 — if it breaks below with a 4h close, another leg down could begin; resistance at US$ 76.250, then the moving averages at US$ 77.400.
$ETH : support at US$ 2.206; resistance at US$ 2.277–2.300 — only a close above that range would change the tone.
$SOL : support at US$ 88,30; resistance at US$ 91,98 (20-period average).
Risk reminder: markets change overnight, and an oversold RSI can remain oversold for days. No position means no loss — patience is a position too.
Will we test support first tomorrow, or will we finally see a bounce? 👇
$BTC $ETH $SOL
#Bitcoin #Ethereum #CriptoVisao
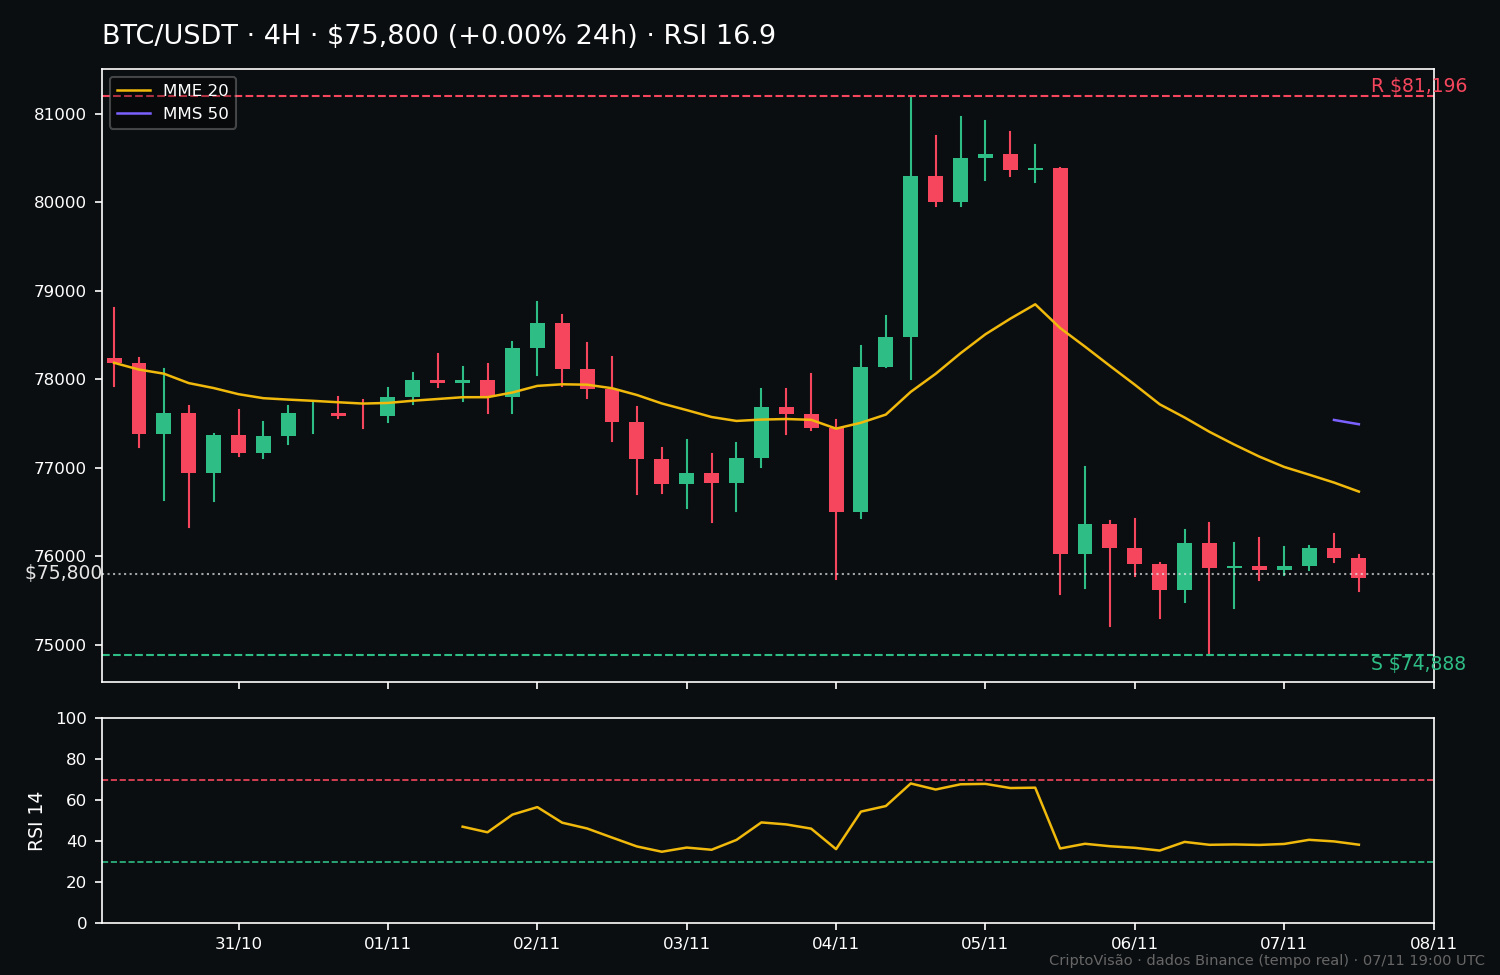
35
Log in to explore more content
Join global crypto users on Binance Square
⚡️ Get latest and useful information about crypto.
💬 Trusted by the world’s largest crypto exchange.
👍 Discover real insights from verified creators.
Email / Phone number
Trending Topics
1
#WhatWillDriveCryptoandStocks’NextRebound?
17,555 views
326 Discussing
2
#Anthropic’s6xIPODemandSignalsPotentialRecordRaise
5,529 views
141 Discussing
3
#HuangExitNvidiaStrategyInFocus
156,176 views
1,459 Discussing
4
#AnthropicRejectsIPODelayValuationinQuestion
775,297 views
5,633 Discussing
5
#HedgeFundsCMEBitcoinNetShortsFall89%
11,409 views
182 Discussing
6
#BitMineReports$6.3BNetLossForFiscal2026
22,095 views
173 Discussing
7
#TradFiForBeginners
557,333 views
3,894 Discussing
8
#SoFiExpandsSoFiUSDStablecoinToPolygon
7,433 views
114 Discussing
9
#TetherGoldXAUTCompletesKPMGAudit
10,396 views
120 Discussing
10
#ChipStocksExtendLossesAfterNvidiaCEOChange
58,347 views
556 Discussing