
Gabriel JB
548 Posts

Gabriel JB
Report
Block User
Tornando o mundo cripto simples, seguro e acessível para todos. Siga e aprenda comigo! 🚀
12 Following
50 Followers
85 Liked
Posts
All
Quotes
·
--
DAY IN REVIEW — support held, but the market didn’t turn around 📊
$BTC $ETH $SOL — Friday close, November 6 (21:00 CAT):
THE DAY IN A NUTSHELL
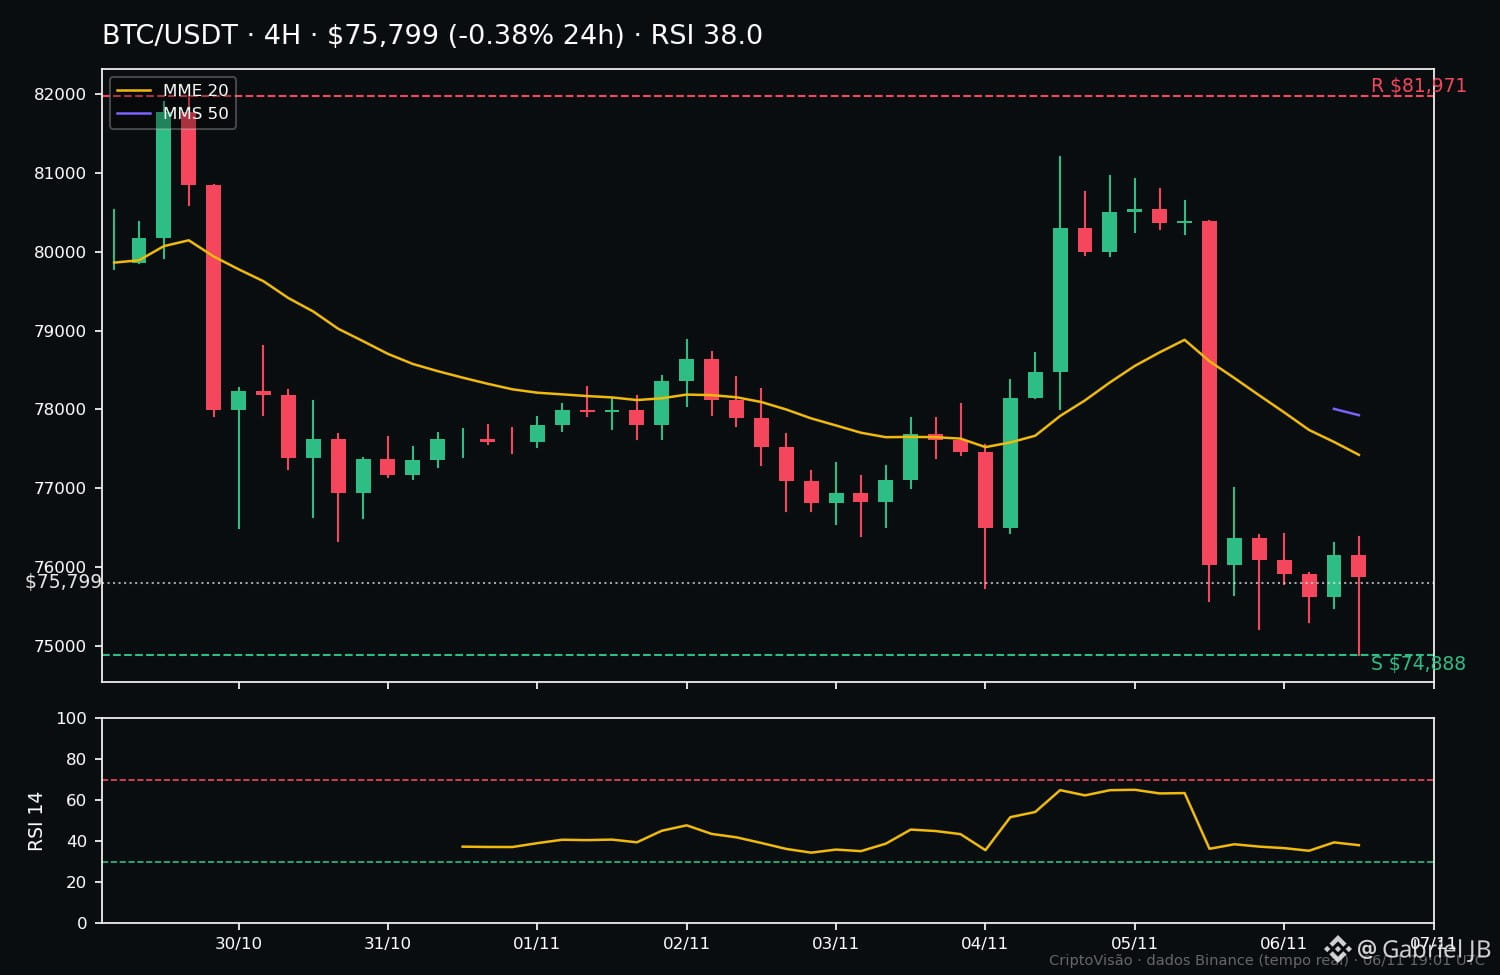
The morning was red: all three coins woke up near their weekly lows. The US jobs report surprised (165K jobs, versus ~65K expected; unemployment at 4.1%), and $BTC briefly rose above 76.100 dollars, but quickly fell back to the 75.500–75.800 zone. Close: $BTC 75.799 dollars (-0,38% in 24h; -5,0% in 7 days), $ETH 2.230,92 dollars (-0,85%; -3,45% in 7 days), $SOL 90,26 dollars (+0,84%; -9,04% in 7 days). RSI-14 was neutral for all three (38,0 / 41,2 / 43,4), and prices were below the 4h moving averages.
WHAT WAS CONFIRMED
✔️ The weekly support for $BTC (75.208 dollars) was tested and held at the close — the day’s low was 74.888, but the price climbed back above support.
✔️ The morning’s bearish bias: none of the three turned its weekly performance around; $SOL remains the weakest (-9,04% in 7 days).
✔️ $ETH was stronger than $BTC for the week (-3,45% versus -5,0%) and held the 50-period moving average — the 20:00 verdict held.
WHAT WAS NOT CONFIRMED
❌ No breakout: $SOL did not reach the 92,80–94,45 retest zone (day’s high: 91,62); $ETH did not reach 2.287–2.313; $BTC remains far from 81.971.
❌ The jobs report did not change the day’s direction — a brief reaction, with no follow-through.
LEVELS FOR TOMORROW
$BTC: if it loses 74.888, the way opens lower; if it holds 75.208 and closes above 76.560, it gains momentum toward the moving averages (77.855).
$ETH: support 2.174–2.206; resistance 2.270 and 2.311.
$SOL: support 88,30; resistance 91,62 and the 92,80–94,45 zone.
Remember: markets change overnight, and a weak close isn’t a sell order — no position, no loss. Risk management first, always.
What’s your read on the day: will support hold through the weekend, or will the pressure continue? 👇
#Bitcoin #Ethereum #CriptoVisao
DAY IN REVIEW — support held, but the market didn’t turn around 📊
$BTC $ETH $SOL — Friday close, November 6 (21:00 CAT):
THE DAY IN A NUTSHELL
The morning was red: all three coins woke up near their weekly lows. The US jobs report surprised (165K jobs, versus ~65K expected; unemployment at 4.1%), and $BTC briefly rose above 76.100 dollars, but quickly fell back to the 75.500–75.800 zone. Close: $BTC 75.799 dollars (-0,38% in 24h; -5,0% in 7 days), $ETH 2.230,92 dollars (-0,85%; -3,45% in 7 days), $SOL 90,26 dollars (+0,84%; -9,04% in 7 days). RSI-14 was neutral for all three (38,0 / 41,2 / 43,4), and prices were below the 4h moving averages.
WHAT WAS CONFIRMED
✔️ The weekly support for $BTC (75.208 dollars) was tested and held at the close — the day’s low was 74.888, but the price climbed back above support.
✔️ The morning’s bearish bias: none of the three turned its weekly performance around; $SOL remains the weakest (-9,04% in 7 days).
✔️ $ETH was stronger than $BTC for the week (-3,45% versus -5,0%) and held the 50-period moving average — the 20:00 verdict held.
WHAT WAS NOT CONFIRMED
❌ No breakout: $SOL did not reach the 92,80–94,45 retest zone (day’s high: 91,62); $ETH did not reach 2.287–2.313; $BTC remains far from 81.971.
❌ The jobs report did not change the day’s direction — a brief reaction, with no follow-through.
LEVELS FOR TOMORROW
$BTC : if it loses 74.888, the way opens lower; if it holds 75.208 and closes above 76.560, it gains momentum toward the moving averages (77.855).
$ETH : support 2.174–2.206; resistance 2.270 and 2.311.
$SOL : support 88,30; resistance 91,62 and the 92,80–94,45 zone.
Remember: markets change overnight, and a weak close isn’t a sell order — no position, no loss. Risk management first, always.
What’s your read on the day: will support hold through the weekend, or will the pressure continue? 👇
#Bitcoin #Ethereum #CriptoVisao
$BTC $ETH $SOL — Friday close, November 6 (21:00 CAT):
THE DAY IN A NUTSHELL
The morning was red: all three coins woke up near their weekly lows. The US jobs report surprised (165K jobs, versus ~65K expected; unemployment at 4.1%), and $BTC briefly rose above 76.100 dollars, but quickly fell back to the 75.500–75.800 zone. Close: $BTC 75.799 dollars (-0,38% in 24h; -5,0% in 7 days), $ETH 2.230,92 dollars (-0,85%; -3,45% in 7 days), $SOL 90,26 dollars (+0,84%; -9,04% in 7 days). RSI-14 was neutral for all three (38,0 / 41,2 / 43,4), and prices were below the 4h moving averages.
WHAT WAS CONFIRMED
✔️ The weekly support for $BTC (75.208 dollars) was tested and held at the close — the day’s low was 74.888, but the price climbed back above support.
✔️ The morning’s bearish bias: none of the three turned its weekly performance around; $SOL remains the weakest (-9,04% in 7 days).
✔️ $ETH was stronger than $BTC for the week (-3,45% versus -5,0%) and held the 50-period moving average — the 20:00 verdict held.
WHAT WAS NOT CONFIRMED
❌ No breakout: $SOL did not reach the 92,80–94,45 retest zone (day’s high: 91,62); $ETH did not reach 2.287–2.313; $BTC remains far from 81.971.
❌ The jobs report did not change the day’s direction — a brief reaction, with no follow-through.
LEVELS FOR TOMORROW
$BTC : if it loses 74.888, the way opens lower; if it holds 75.208 and closes above 76.560, it gains momentum toward the moving averages (77.855).
$ETH : support 2.174–2.206; resistance 2.270 and 2.311.
$SOL : support 88,30; resistance 91,62 and the 92,80–94,45 zone.
Remember: markets change overnight, and a weak close isn’t a sell order — no position, no loss. Risk management first, always.
What’s your read on the day: will support hold through the weekend, or will the pressure continue? 👇
#Bitcoin #Ethereum #CriptoVisao
69
·
--
⚖️ $BTC or $ETH —which one is stronger today?
The numbers side by side (fresh data, Binance):
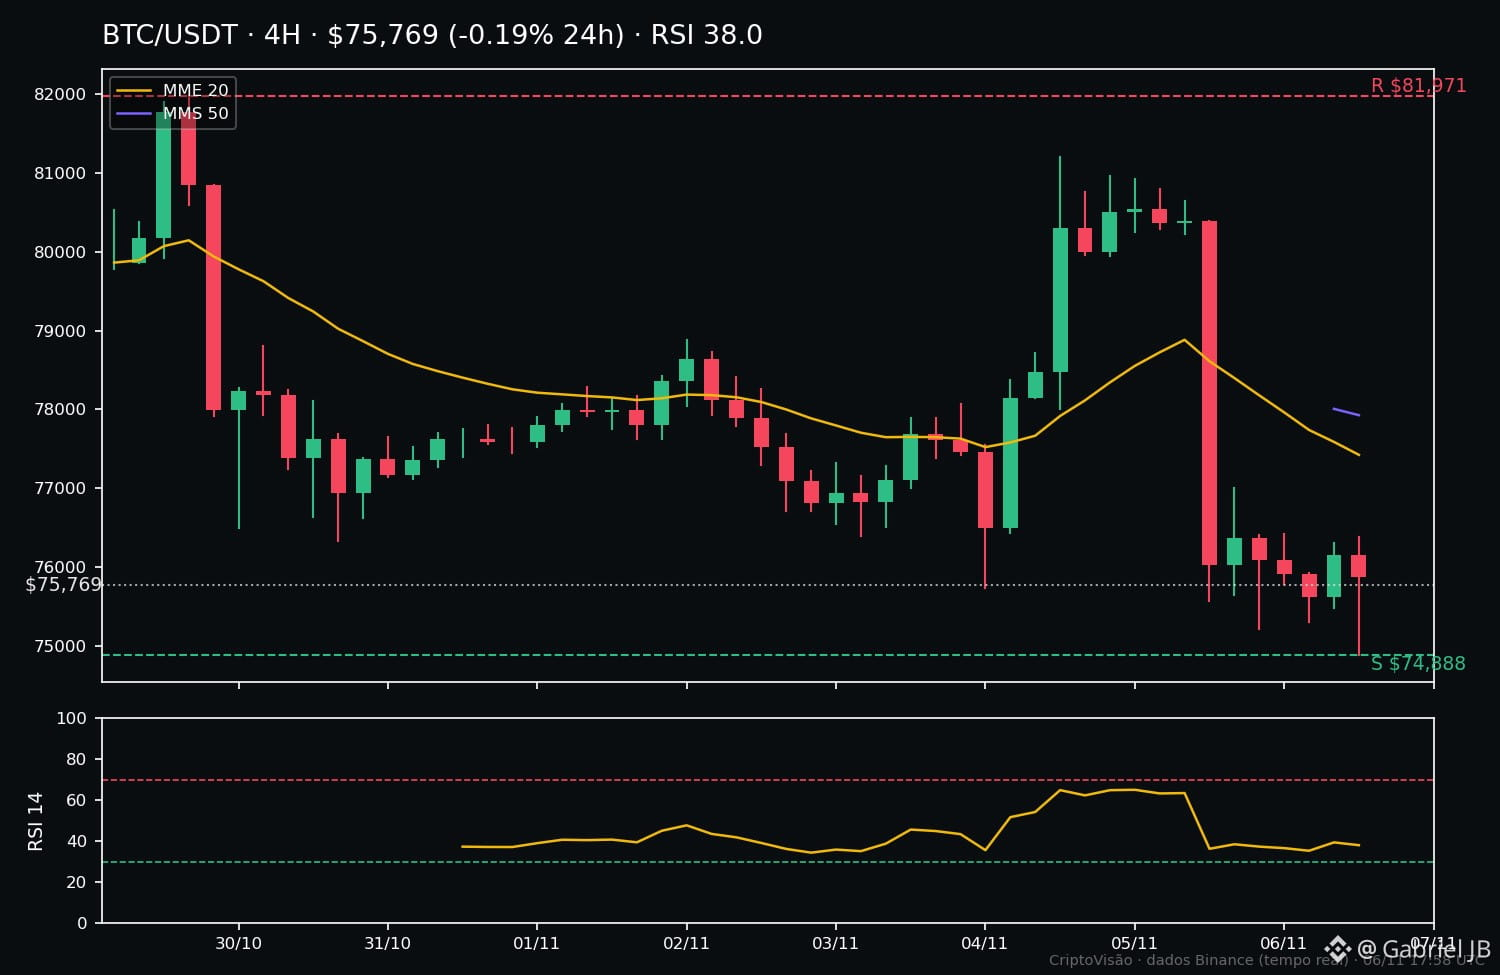
$BTC: US$ 75,779 | 24h -0.16% | 7d -5.0% | RSI 38.0 | below the SMA-20 and SMA-50
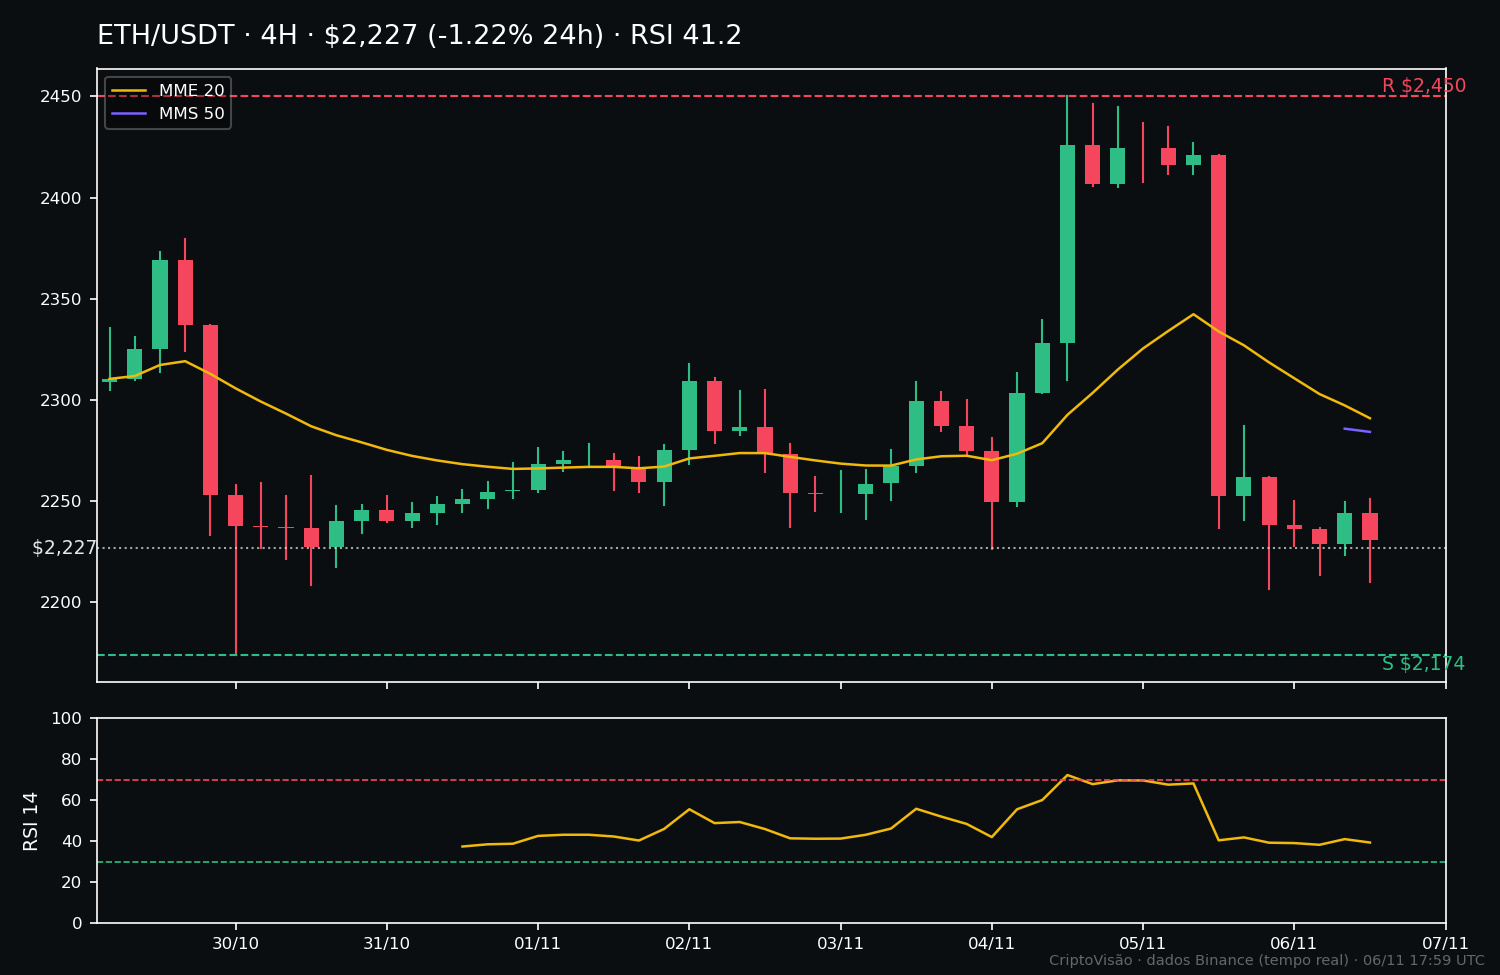
$ETH: US$ 2,226.83 | 24h -1.21% | 7d -3.45% | RSI 41.2 | below the SMA-20, above the SMA-50
Who is stronger? $ETH, by a little. It lost less over the week (-3.45% versus -5.0%), has a higher RSI, and is holding the SMA-50, while $BTC is below both averages. $BTC only won today (-0.16% versus -1.21%).
What this suggests: capital isn’t fleeing $ETH as much this week—its structure is a little firmer. But keep in mind: both remain below the SMA-20 and near their 7-day lows. A one-day comparison doesn’t define a trend—it’s an observation, not a prediction.
And you: do you think $ETH will hold the SMA-50 and turn things around, or will $BTC dominate again? 👇
#Bitcoin #Ethereum #CriptoVisao
⚖️ $BTC or $ETH —which one is stronger today?
The numbers side by side (fresh data, Binance):
$BTC : US$ 75,779 | 24h -0.16% | 7d -5.0% | RSI 38.0 | below the SMA-20 and SMA-50
$ETH : US$ 2,226.83 | 24h -1.21% | 7d -3.45% | RSI 41.2 | below the SMA-20, above the SMA-50
Who is stronger? $ETH , by a little. It lost less over the week (-3.45% versus -5.0%), has a higher RSI, and is holding the SMA-50, while $BTC is below both averages. $BTC only won today (-0.16% versus -1.21%).
What this suggests: capital isn’t fleeing $ETH as much this week—its structure is a little firmer. But keep in mind: both remain below the SMA-20 and near their 7-day lows. A one-day comparison doesn’t define a trend—it’s an observation, not a prediction.
And you: do you think $ETH will hold the SMA-50 and turn things around, or will $BTC dominate again? 👇
#Bitcoin #Ethereum #CriptoVisao
The numbers side by side (fresh data, Binance):
$BTC : US$ 75,779 | 24h -0.16% | 7d -5.0% | RSI 38.0 | below the SMA-20 and SMA-50
$ETH : US$ 2,226.83 | 24h -1.21% | 7d -3.45% | RSI 41.2 | below the SMA-20, above the SMA-50
Who is stronger? $ETH , by a little. It lost less over the week (-3.45% versus -5.0%), has a higher RSI, and is holding the SMA-50, while $BTC is below both averages. $BTC only won today (-0.16% versus -1.21%).
What this suggests: capital isn’t fleeing $ETH as much this week—its structure is a little firmer. But keep in mind: both remain below the SMA-20 and near their 7-day lows. A one-day comparison doesn’t define a trend—it’s an observation, not a prediction.
And you: do you think $ETH will hold the SMA-50 and turn things around, or will $BTC dominate again? 👇
#Bitcoin #Ethereum #CriptoVisao
15
·
--
$SOL fell 9% in a week — and the mistake is rushing to buy the recovery
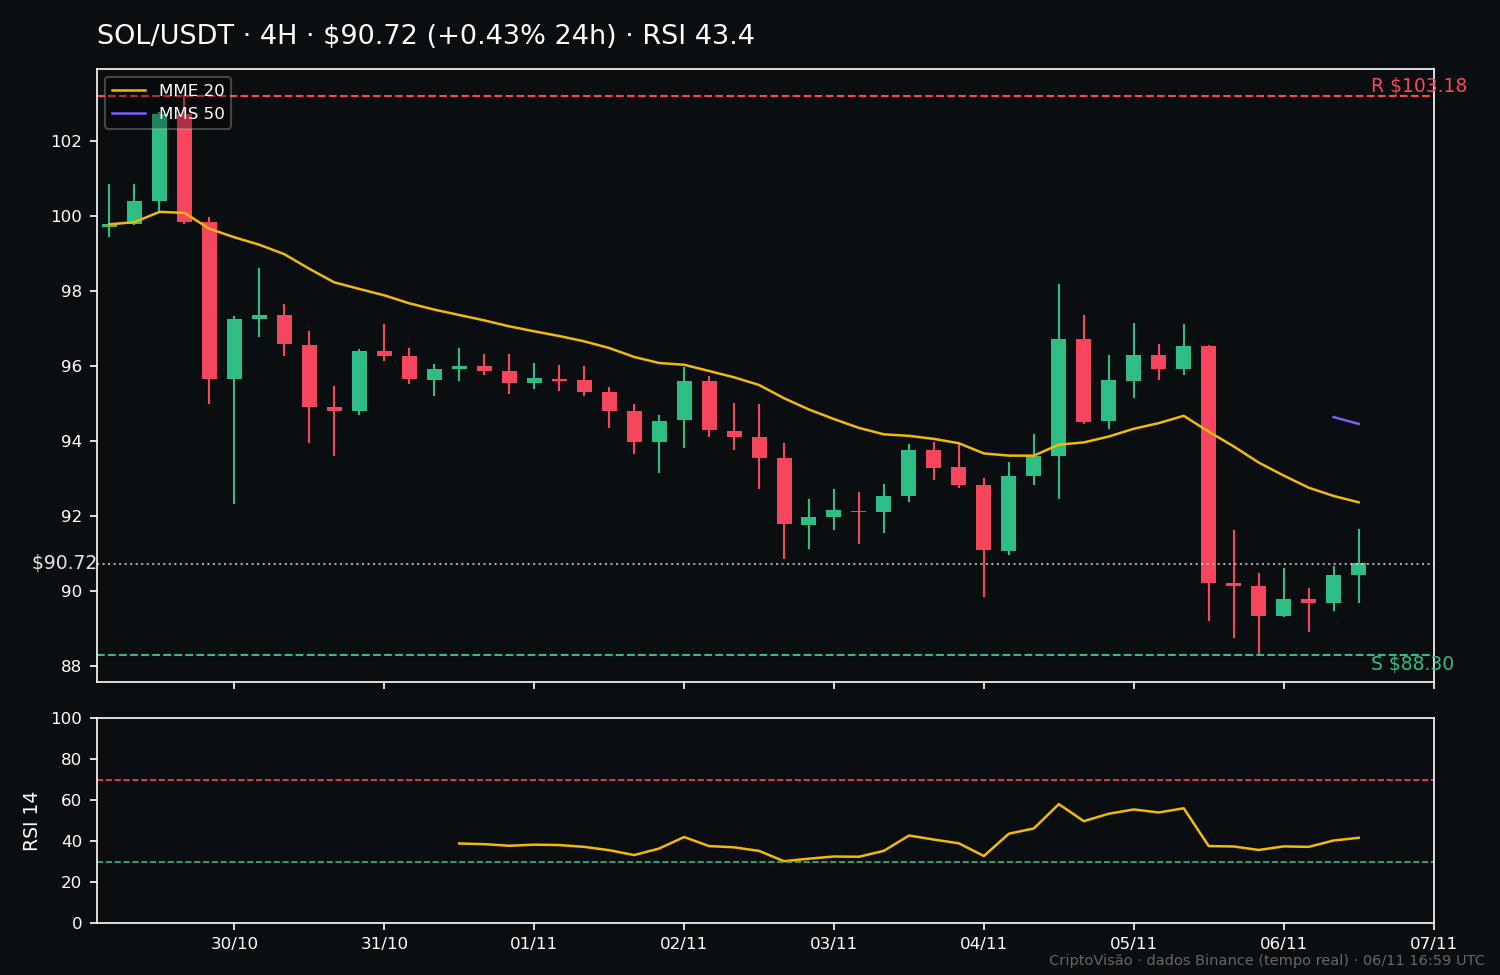
$SOL lost 9.04% in 7 days, from a high of $103.18 to a low of $88.30. Today it’s recovering to $90.74 (+0.33% in 24h, RSI 43.4). Many people see green and jump in right away, afraid of missing out. It’s a classic mistake.
The pullback strategy teaches the opposite: after a strong move, the patient trader waits for a retest of the broken level instead of chasing the price.
Where would the retest zone be? At $92.80–$94.45, where the 20- and 50-period moving averages (4h) are. It was support on the way down; now it’s resistance. If the price gets there, that’s where the next move will be decided.
What would confirm an entry? Rejection in that zone — a 4h candle with a long upper wick and a close in the direction of the trend, that is, downward. No rejection, no entry: just observation.
Where would the stop go (educational example)? Above $95.50. A 4h close above that level invalidates the outlook and suggests the recovery may have room to run.
The classic mistake is entering at the top of the move out of FOMO: buying the bounce at $90.74 without confirmation, then watching the price fall back to $88.30 — or worse. Patience is a position.
What about you: do you wait for the retest or jump in at the first sign of green? 👇
#Solana #CriptoVisao #Trading
$SOL fell 9% in a week — and the mistake is rushing to buy the recovery
$SOL lost 9.04% in 7 days, from a high of $103.18 to a low of $88.30. Today it’s recovering to $90.74 (+0.33% in 24h, RSI 43.4). Many people see green and jump in right away, afraid of missing out. It’s a classic mistake.
The pullback strategy teaches the opposite: after a strong move, the patient trader waits for a retest of the broken level instead of chasing the price.
Where would the retest zone be? At $92.80–$94.45, where the 20- and 50-period moving averages (4h) are. It was support on the way down; now it’s resistance. If the price gets there, that’s where the next move will be decided.
What would confirm an entry? Rejection in that zone — a 4h candle with a long upper wick and a close in the direction of the trend, that is, downward. No rejection, no entry: just observation.
Where would the stop go (educational example)? Above $95.50. A 4h close above that level invalidates the outlook and suggests the recovery may have room to run.
The classic mistake is entering at the top of the move out of FOMO: buying the bounce at $90.74 without confirmation, then watching the price fall back to $88.30 — or worse. Patience is a position.
What about you: do you wait for the retest or jump in at the first sign of green? 👇
#Solana #CriptoVisao #Trading
$SOL lost 9.04% in 7 days, from a high of $103.18 to a low of $88.30. Today it’s recovering to $90.74 (+0.33% in 24h, RSI 43.4). Many people see green and jump in right away, afraid of missing out. It’s a classic mistake.
The pullback strategy teaches the opposite: after a strong move, the patient trader waits for a retest of the broken level instead of chasing the price.
Where would the retest zone be? At $92.80–$94.45, where the 20- and 50-period moving averages (4h) are. It was support on the way down; now it’s resistance. If the price gets there, that’s where the next move will be decided.
What would confirm an entry? Rejection in that zone — a 4h candle with a long upper wick and a close in the direction of the trend, that is, downward. No rejection, no entry: just observation.
Where would the stop go (educational example)? Above $95.50. A 4h close above that level invalidates the outlook and suggests the recovery may have room to run.
The classic mistake is entering at the top of the move out of FOMO: buying the bounce at $90.74 without confirmation, then watching the price fall back to $88.30 — or worse. Patience is a position.
What about you: do you wait for the retest or jump in at the first sign of green? 👇
#Solana #CriptoVisao #Trading
27
·
--
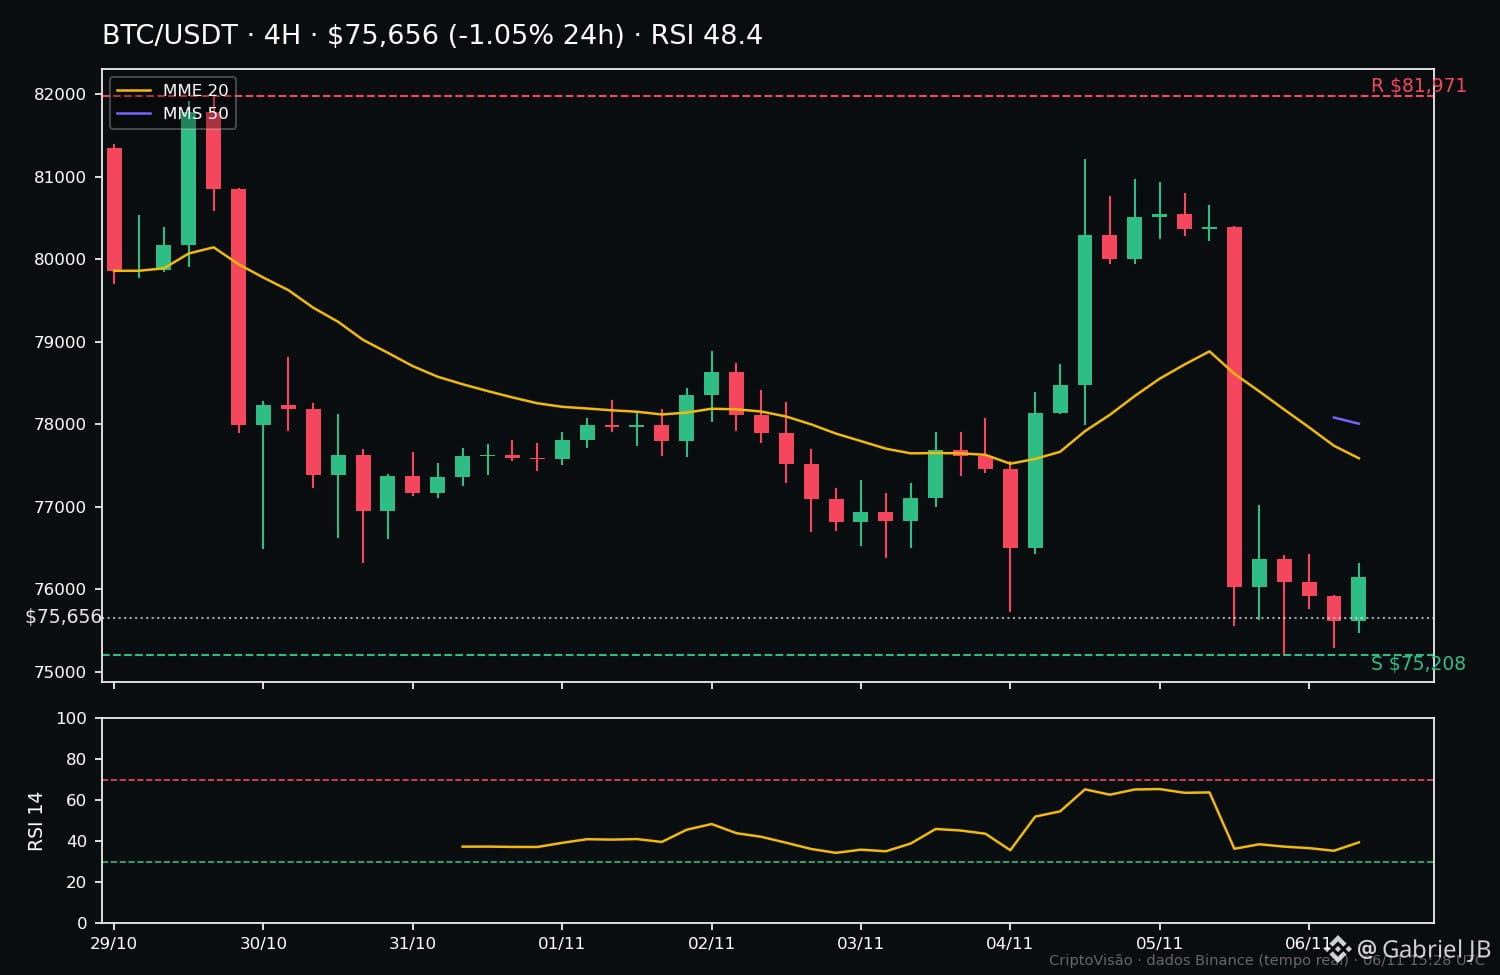
Support tested and defended — for now: $BTC remains on hold ⏳
WHAT CHANGED SINCE THIS MORNING
In the morning, $BTC was at $75,615, close to the weekly low ($75,208). In the afternoon, it is trading at $75,648 — practically unchanged. The difference is in how it got there: during the day, the price fell to $74,888, breaking through support, but then climbed back above it. The level was tested and, for now, defended.
VERDICT: ON HOLD
Neither the recovery scenario nor the support-loss scenario has been confirmed. One detail to note: the 24-hour change improved from -5.85% to -1.24%, but that is mostly due to the rolling 24-hour window — the price has barely moved since this morning. The RSI-14 rose from 42.4 to 48.4, still neutral, and the price remains below the 20- and 50-period averages ($77,903 and $78,006).
CURRENT LEVELS
• Support: $75,208 (weekly low)
• Resistance: $78,000–$78,006 (moving average zone)
• Resistance: $81,971 (weekly high)
UPDATED SCENARIOS
Scenario A — recovery: a 4-hour candle close above $78,000 would confirm buying strength and open the way to $81,971.
Scenario B — support breaks: a 4-hour candle close below $75,208 would invalidate the recovery and open the door to new lows. The wick down to $74,888 shows that sellers have already tested the level — a second test with a close below it would be a warning sign.
WHAT TO WATCH UNTIL THE DAILY CLOSE
4-hour candle closes relative to $75,208, whether the price retests the weekly low, and volume, currently at $1.91 billion over 24 hours.
RISK
This remains a decision zone, not a place for certainty. Volatility could push the price either way before a direction is established — entering without confirmation is like trying to catch a falling knife.
Do you think support will hold until tomorrow, or will a second test break it? 👇
$BTC #Bitcoin #CriptoVisao
Support tested and defended — for now: $BTC remains on hold ⏳
WHAT CHANGED SINCE THIS MORNING
In the morning, $BTC was at $75,615, close to the weekly low ($75,208). In the afternoon, it is trading at $75,648 — practically unchanged. The difference is in how it got there: during the day, the price fell to $74,888, breaking through support, but then climbed back above it. The level was tested and, for now, defended.
VERDICT: ON HOLD
Neither the recovery scenario nor the support-loss scenario has been confirmed. One detail to note: the 24-hour change improved from -5.85% to -1.24%, but that is mostly due to the rolling 24-hour window — the price has barely moved since this morning. The RSI-14 rose from 42.4 to 48.4, still neutral, and the price remains below the 20- and 50-period averages ($77,903 and $78,006).
CURRENT LEVELS
• Support: $75,208 (weekly low)
• Resistance: $78,000–$78,006 (moving average zone)
• Resistance: $81,971 (weekly high)
UPDATED SCENARIOS
Scenario A — recovery: a 4-hour candle close above $78,000 would confirm buying strength and open the way to $81,971.
Scenario B — support breaks: a 4-hour candle close below $75,208 would invalidate the recovery and open the door to new lows. The wick down to $74,888 shows that sellers have already tested the level — a second test with a close below it would be a warning sign.
WHAT TO WATCH UNTIL THE DAILY CLOSE
4-hour candle closes relative to $75,208, whether the price retests the weekly low, and volume, currently at $1.91 billion over 24 hours.
RISK
This remains a decision zone, not a place for certainty. Volatility could push the price either way before a direction is established — entering without confirmation is like trying to catch a falling knife.
Do you think support will hold until tomorrow, or will a second test break it? 👇
$BTC #Bitcoin #CriptoVisao
WHAT CHANGED SINCE THIS MORNING
In the morning, $BTC was at $75,615, close to the weekly low ($75,208). In the afternoon, it is trading at $75,648 — practically unchanged. The difference is in how it got there: during the day, the price fell to $74,888, breaking through support, but then climbed back above it. The level was tested and, for now, defended.
VERDICT: ON HOLD
Neither the recovery scenario nor the support-loss scenario has been confirmed. One detail to note: the 24-hour change improved from -5.85% to -1.24%, but that is mostly due to the rolling 24-hour window — the price has barely moved since this morning. The RSI-14 rose from 42.4 to 48.4, still neutral, and the price remains below the 20- and 50-period averages ($77,903 and $78,006).
CURRENT LEVELS
• Support: $75,208 (weekly low)
• Resistance: $78,000–$78,006 (moving average zone)
• Resistance: $81,971 (weekly high)
UPDATED SCENARIOS
Scenario A — recovery: a 4-hour candle close above $78,000 would confirm buying strength and open the way to $81,971.
Scenario B — support breaks: a 4-hour candle close below $75,208 would invalidate the recovery and open the door to new lows. The wick down to $74,888 shows that sellers have already tested the level — a second test with a close below it would be a warning sign.
WHAT TO WATCH UNTIL THE DAILY CLOSE
4-hour candle closes relative to $75,208, whether the price retests the weekly low, and volume, currently at $1.91 billion over 24 hours.
RISK
This remains a decision zone, not a place for certainty. Volatility could push the price either way before a direction is established — entering without confirmation is like trying to catch a falling knife.
Do you think support will hold until tomorrow, or will a second test break it? 👇
$BTC #Bitcoin #CriptoVisao
18
·
--
The stop isn’t placed at a round number — it’s placed below support 🛡️
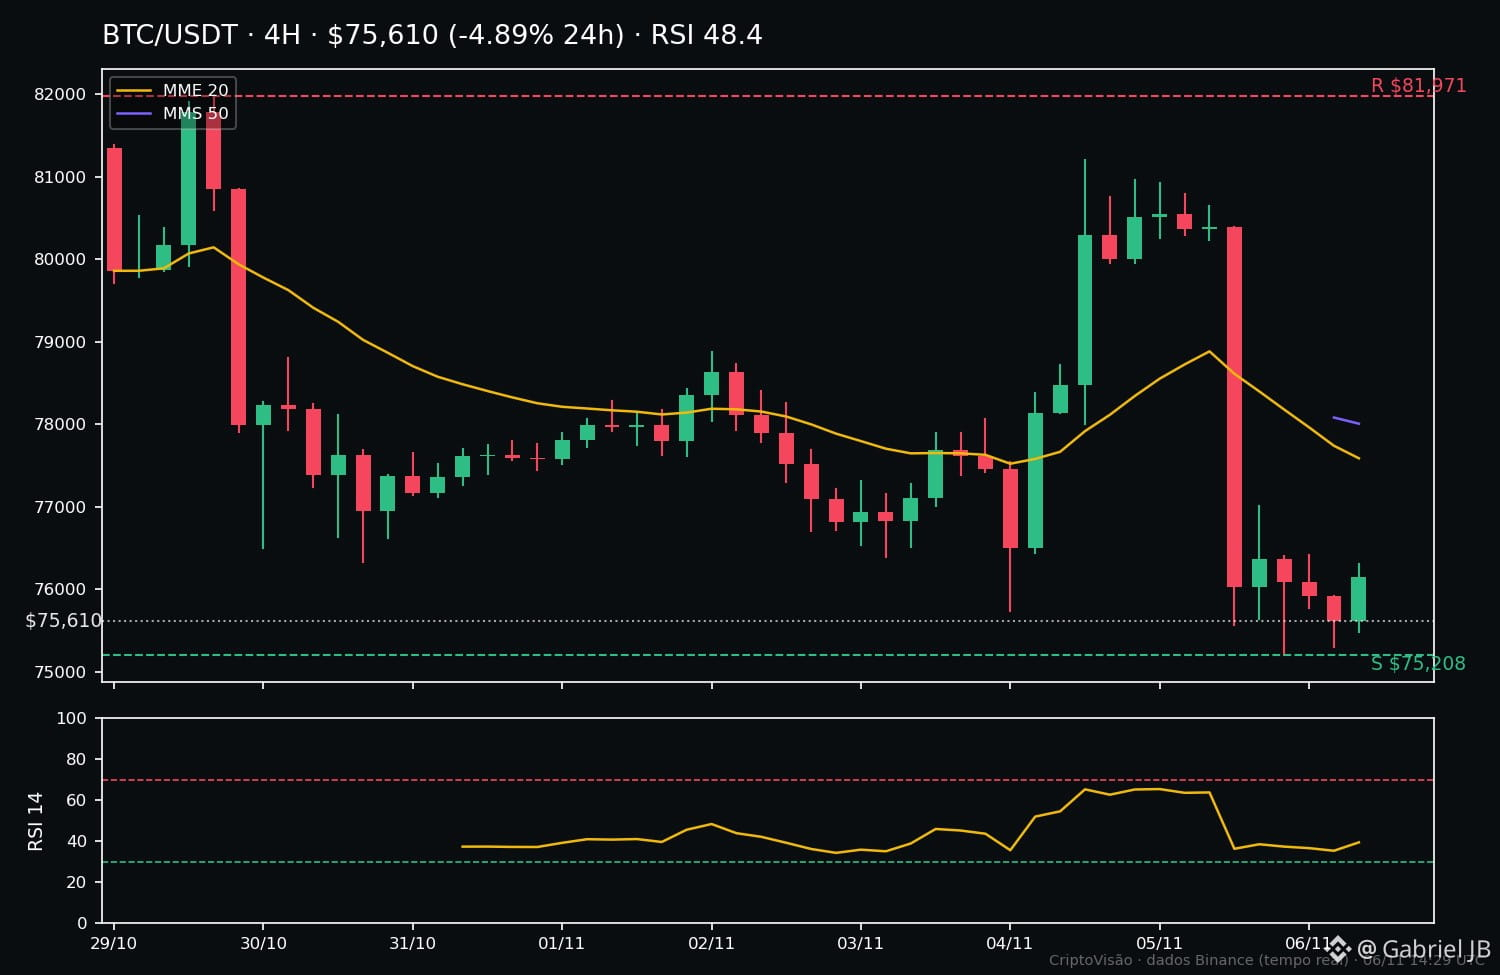
$BTC is trading at $75.641 today (-4,81% in 24h), right at the week’s support ($75.208) and below the 4h moving averages. Weekly resistance: $81.971. RSI 48,4 — neutral.
The calculation, step by step, for a $1.000 account:
1. The 1% rule: the maximum risk per trade is $10. Never more than that.
2. Stop based on structure: below actual support — $74.800, not the round number $75.000. Risk per BTC: $75.641 − $74.800 = $841.
3. The stop determines position size: $10 ÷ $841 = 0,0119 BTC (about $900). Stop first, position second — never the other way around.
4. Risk/reward test: target at resistance, $81.971 − $75.641 = $6.330 per BTC. 6.330 ÷ 841 ≈ 7,5:1 — comfortably above the 1:2 minimum.
But be careful: a high R:R isn’t a green light. The price is below the moving averages and the short-term trend is downward — the test says “worth a look,” not “get in now.”
And remember: 10 stops at 1% cost about 10% of your account. One bad all-in trade could cost you everything. Preserving capital is strategy #1.
What’s your risk limit per trade — 1% or 2%?
#Bitcoin #GestaoDeRisco #CriptoVisao
The stop isn’t placed at a round number — it’s placed below support 🛡️
$BTC is trading at $75.641 today (-4,81% in 24h), right at the week’s support ($75.208) and below the 4h moving averages. Weekly resistance: $81.971. RSI 48,4 — neutral.
The calculation, step by step, for a $1.000 account:
1. The 1% rule: the maximum risk per trade is $10. Never more than that.
2. Stop based on structure: below actual support — $74.800, not the round number $75.000. Risk per BTC: $75.641 − $74.800 = $841.
3. The stop determines position size: $10 ÷ $841 = 0,0119 BTC (about $900). Stop first, position second — never the other way around.
4. Risk/reward test: target at resistance, $81.971 − $75.641 = $6.330 per BTC. 6.330 ÷ 841 ≈ 7,5:1 — comfortably above the 1:2 minimum.
But be careful: a high R:R isn’t a green light. The price is below the moving averages and the short-term trend is downward — the test says “worth a look,” not “get in now.”
And remember: 10 stops at 1% cost about 10% of your account. One bad all-in trade could cost you everything. Preserving capital is strategy #1.
What’s your risk limit per trade — 1% or 2%?
#Bitcoin #GestaoDeRisco #CriptoVisao
$BTC is trading at $75.641 today (-4,81% in 24h), right at the week’s support ($75.208) and below the 4h moving averages. Weekly resistance: $81.971. RSI 48,4 — neutral.
The calculation, step by step, for a $1.000 account:
1. The 1% rule: the maximum risk per trade is $10. Never more than that.
2. Stop based on structure: below actual support — $74.800, not the round number $75.000. Risk per BTC: $75.641 − $74.800 = $841.
3. The stop determines position size: $10 ÷ $841 = 0,0119 BTC (about $900). Stop first, position second — never the other way around.
4. Risk/reward test: target at resistance, $81.971 − $75.641 = $6.330 per BTC. 6.330 ÷ 841 ≈ 7,5:1 — comfortably above the 1:2 minimum.
But be careful: a high R:R isn’t a green light. The price is below the moving averages and the short-term trend is downward — the test says “worth a look,” not “get in now.”
And remember: 10 stops at 1% cost about 10% of your account. One bad all-in trade could cost you everything. Preserving capital is strategy #1.
What’s your risk limit per trade — 1% or 2%?
#Bitcoin #GestaoDeRisco #CriptoVisao
9
·
--
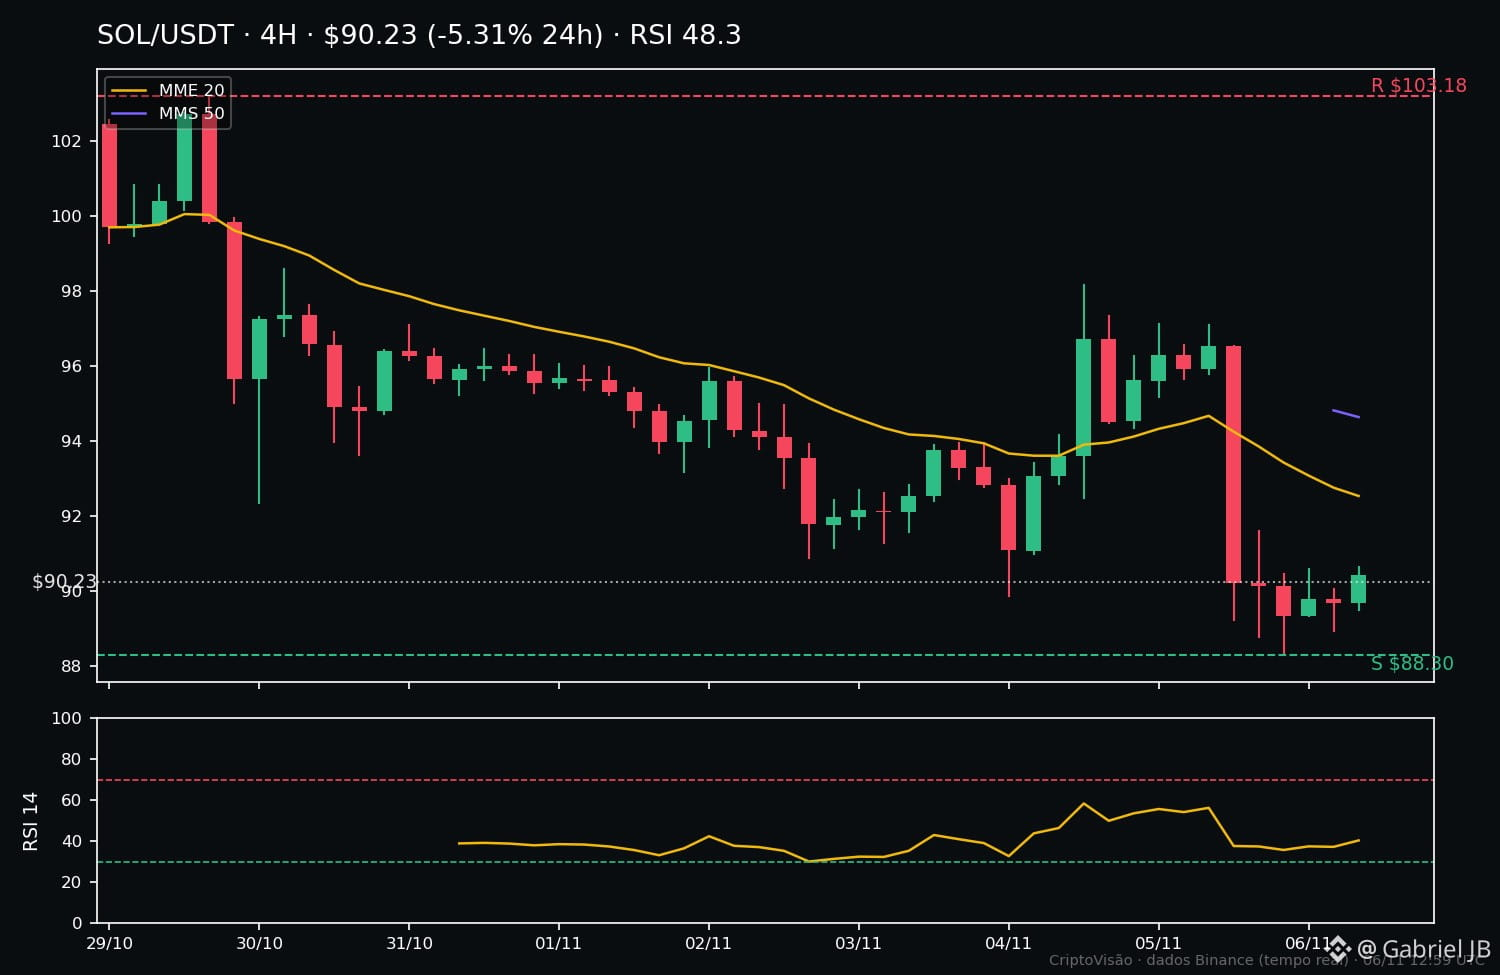
SOL tests the week's low: will $88 support hold or give way?
SITUATION
Solana is down 5.3% in the last 24 hours and 9.3% for the week, trading at $90.22 — right near its 7-day low. 24-hour volume is $247M, the highest of the three altcoins analyzed today. The RSI-14 is at 48.3, neutral: neither oversold nor euphoric — the market hasn't decided yet.
LEVELS
• Support: $88.30 (7-day low)
• Immediate resistance: $92.87 (MA20, 4h)
• Resistance: $94.63 (MA50, 4h) and $103.18 (7-day high)
SCENARIO A — Bounce at support
If $88.30 holds, with a 4h close above it and volume rising, the first target is the MA20 at $92.87.
SCENARIO B — Support breaks
A 4h close below $88.30 opens the door to another leg down — with no nearby support on the 7-day chart.
WHAT WOULD CONFIRM IT
In scenario A, a 4h close above $92.87. In scenario B, a 4h close below $88.30. Until then, it's just a test — not confirmation.
RISK
Altcoins are more volatile and have wider spreads than BTC — your stop needs to account for that. A 5% move in a day is normal here: size your position accordingly and never trade with leverage without a plan.
CONCLUSION
SOL is at the week's decision point. The $88.30 support is the line between a technical recovery and another leg down. Do you think support will hold — or does the market still have more to correct? 💬
$SOL #Solana #CriptoVisao
SOL tests the week's low: will $88 support hold or give way?
SITUATION
Solana is down 5.3% in the last 24 hours and 9.3% for the week, trading at $90.22 — right near its 7-day low. 24-hour volume is $247M, the highest of the three altcoins analyzed today. The RSI-14 is at 48.3, neutral: neither oversold nor euphoric — the market hasn't decided yet.
LEVELS
• Support: $88.30 (7-day low)
• Immediate resistance: $92.87 (MA20, 4h)
• Resistance: $94.63 (MA50, 4h) and $103.18 (7-day high)
SCENARIO A — Bounce at support
If $88.30 holds, with a 4h close above it and volume rising, the first target is the MA20 at $92.87.
SCENARIO B — Support breaks
A 4h close below $88.30 opens the door to another leg down — with no nearby support on the 7-day chart.
WHAT WOULD CONFIRM IT
In scenario A, a 4h close above $92.87. In scenario B, a 4h close below $88.30. Until then, it's just a test — not confirmation.
RISK
Altcoins are more volatile and have wider spreads than BTC — your stop needs to account for that. A 5% move in a day is normal here: size your position accordingly and never trade with leverage without a plan.
CONCLUSION
SOL is at the week's decision point. The $88.30 support is the line between a technical recovery and another leg down. Do you think support will hold — or does the market still have more to correct? 💬
$SOL #Solana #CriptoVisao
SITUATION
Solana is down 5.3% in the last 24 hours and 9.3% for the week, trading at $90.22 — right near its 7-day low. 24-hour volume is $247M, the highest of the three altcoins analyzed today. The RSI-14 is at 48.3, neutral: neither oversold nor euphoric — the market hasn't decided yet.
LEVELS
• Support: $88.30 (7-day low)
• Immediate resistance: $92.87 (MA20, 4h)
• Resistance: $94.63 (MA50, 4h) and $103.18 (7-day high)
SCENARIO A — Bounce at support
If $88.30 holds, with a 4h close above it and volume rising, the first target is the MA20 at $92.87.
SCENARIO B — Support breaks
A 4h close below $88.30 opens the door to another leg down — with no nearby support on the 7-day chart.
WHAT WOULD CONFIRM IT
In scenario A, a 4h close above $92.87. In scenario B, a 4h close below $88.30. Until then, it's just a test — not confirmation.
RISK
Altcoins are more volatile and have wider spreads than BTC — your stop needs to account for that. A 5% move in a day is normal here: size your position accordingly and never trade with leverage without a plan.
CONCLUSION
SOL is at the week's decision point. The $88.30 support is the line between a technical recovery and another leg down. Do you think support will hold — or does the market still have more to correct? 💬
$SOL #Solana #CriptoVisao
11
·
--
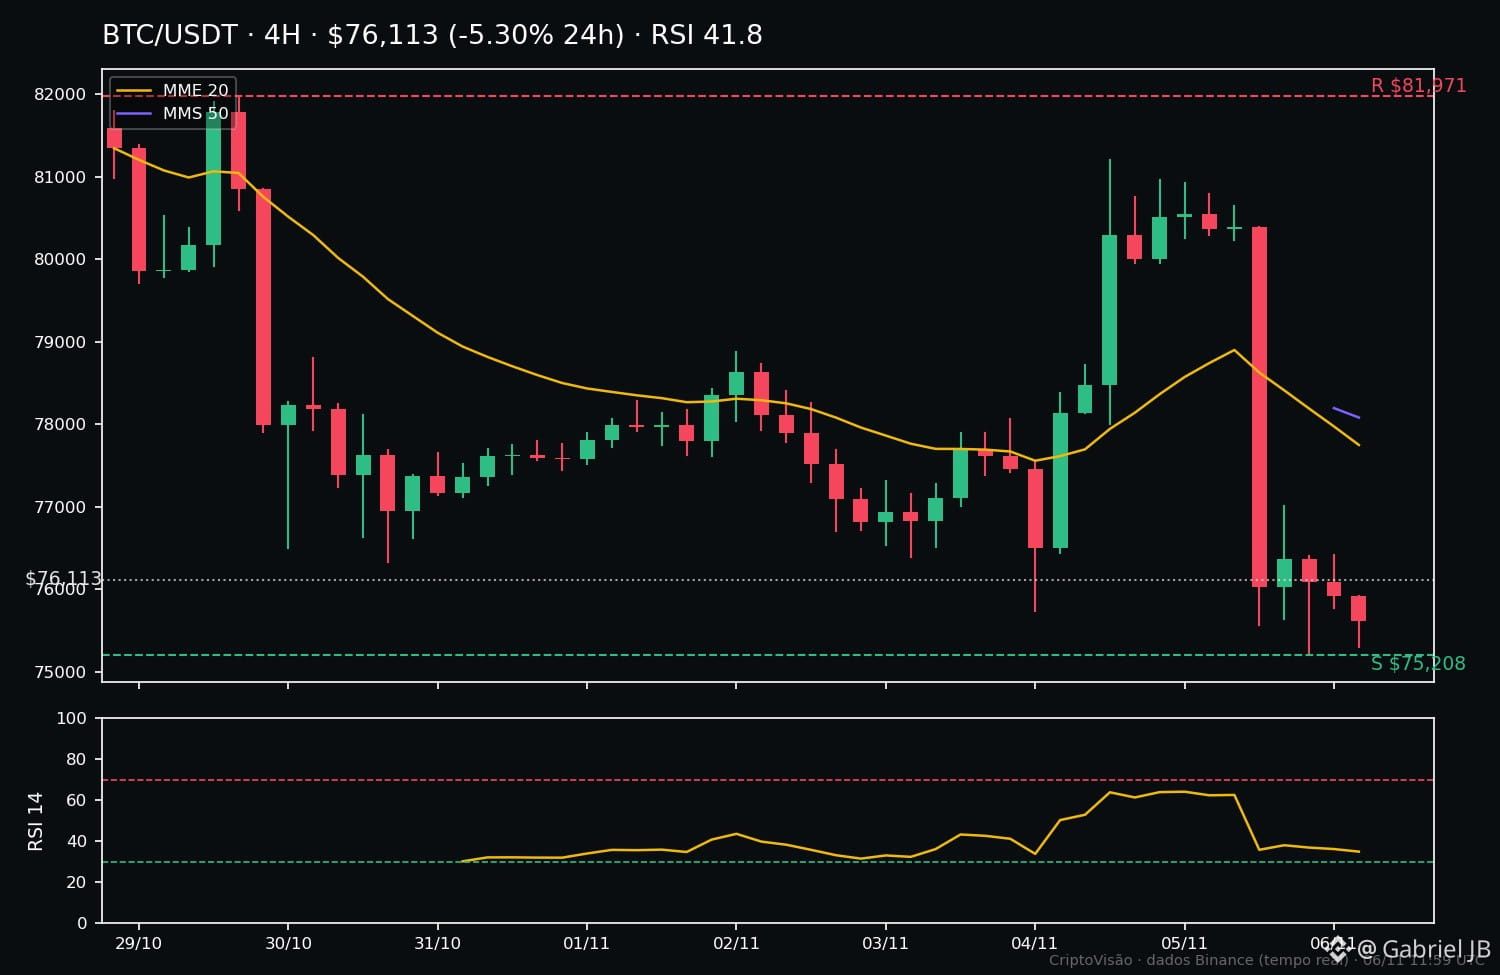
The 5% drop in $BTC and the mistake that drains wallets: catching a falling knife
$BTC fell 5.3% in the last 24 hours and is now at $76,113, close to its 7-day low ($75,208). And this is exactly where many traders make the mistake of the day: buying the dip without confirmation, trying to catch the bottom.
It seems logical: “It’s already fallen so much, it can only go up.” But the data says otherwise. The price is below the 20- and 50-period moving averages ($77,942 and $78,080), and the RSI-14 is at 41.8 — neutral, far from oversold. In other words, the short-term trend is still downward, and there’s still room to fall.
Anyone buying here without a plan is catching a falling knife: if the $75,208 support fails, losses can mount quickly, with no time to react. The mistake isn’t buying cheap; it’s buying without confirmation and without a stop.
The simple rule: wait for a 4-hour candle to close above the moving averages, or for a confirmed higher low. If you enter, do so in small increments, with a stop below $75,208 and a maximum risk of 1% of your account per trade.
Today’s drop is a lesson, not an invitation. Have you ever given in to the temptation to buy the dip without confirmation? Share what you learned in the comments. 👇
$BTC
#Bitcoin #Trading #CriptoVisao
The 5% drop in $BTC and the mistake that drains wallets: catching a falling knife
$BTC fell 5.3% in the last 24 hours and is now at $76,113, close to its 7-day low ($75,208). And this is exactly where many traders make the mistake of the day: buying the dip without confirmation, trying to catch the bottom.
It seems logical: “It’s already fallen so much, it can only go up.” But the data says otherwise. The price is below the 20- and 50-period moving averages ($77,942 and $78,080), and the RSI-14 is at 41.8 — neutral, far from oversold. In other words, the short-term trend is still downward, and there’s still room to fall.
Anyone buying here without a plan is catching a falling knife: if the $75,208 support fails, losses can mount quickly, with no time to react. The mistake isn’t buying cheap; it’s buying without confirmation and without a stop.
The simple rule: wait for a 4-hour candle to close above the moving averages, or for a confirmed higher low. If you enter, do so in small increments, with a stop below $75,208 and a maximum risk of 1% of your account per trade.
Today’s drop is a lesson, not an invitation. Have you ever given in to the temptation to buy the dip without confirmation? Share what you learned in the comments. 👇
$BTC
#Bitcoin #Trading #CriptoVisao
$BTC fell 5.3% in the last 24 hours and is now at $76,113, close to its 7-day low ($75,208). And this is exactly where many traders make the mistake of the day: buying the dip without confirmation, trying to catch the bottom.
It seems logical: “It’s already fallen so much, it can only go up.” But the data says otherwise. The price is below the 20- and 50-period moving averages ($77,942 and $78,080), and the RSI-14 is at 41.8 — neutral, far from oversold. In other words, the short-term trend is still downward, and there’s still room to fall.
Anyone buying here without a plan is catching a falling knife: if the $75,208 support fails, losses can mount quickly, with no time to react. The mistake isn’t buying cheap; it’s buying without confirmation and without a stop.
The simple rule: wait for a 4-hour candle to close above the moving averages, or for a confirmed higher low. If you enter, do so in small increments, with a stop below $75,208 and a maximum risk of 1% of your account per trade.
Today’s drop is a lesson, not an invitation. Have you ever given in to the temptation to buy the dip without confirmation? Share what you learned in the comments. 👇
$BTC
#Bitcoin #Trading #CriptoVisao
47
·
--
ETH tests the weekly low — what will decide the next move? 📉
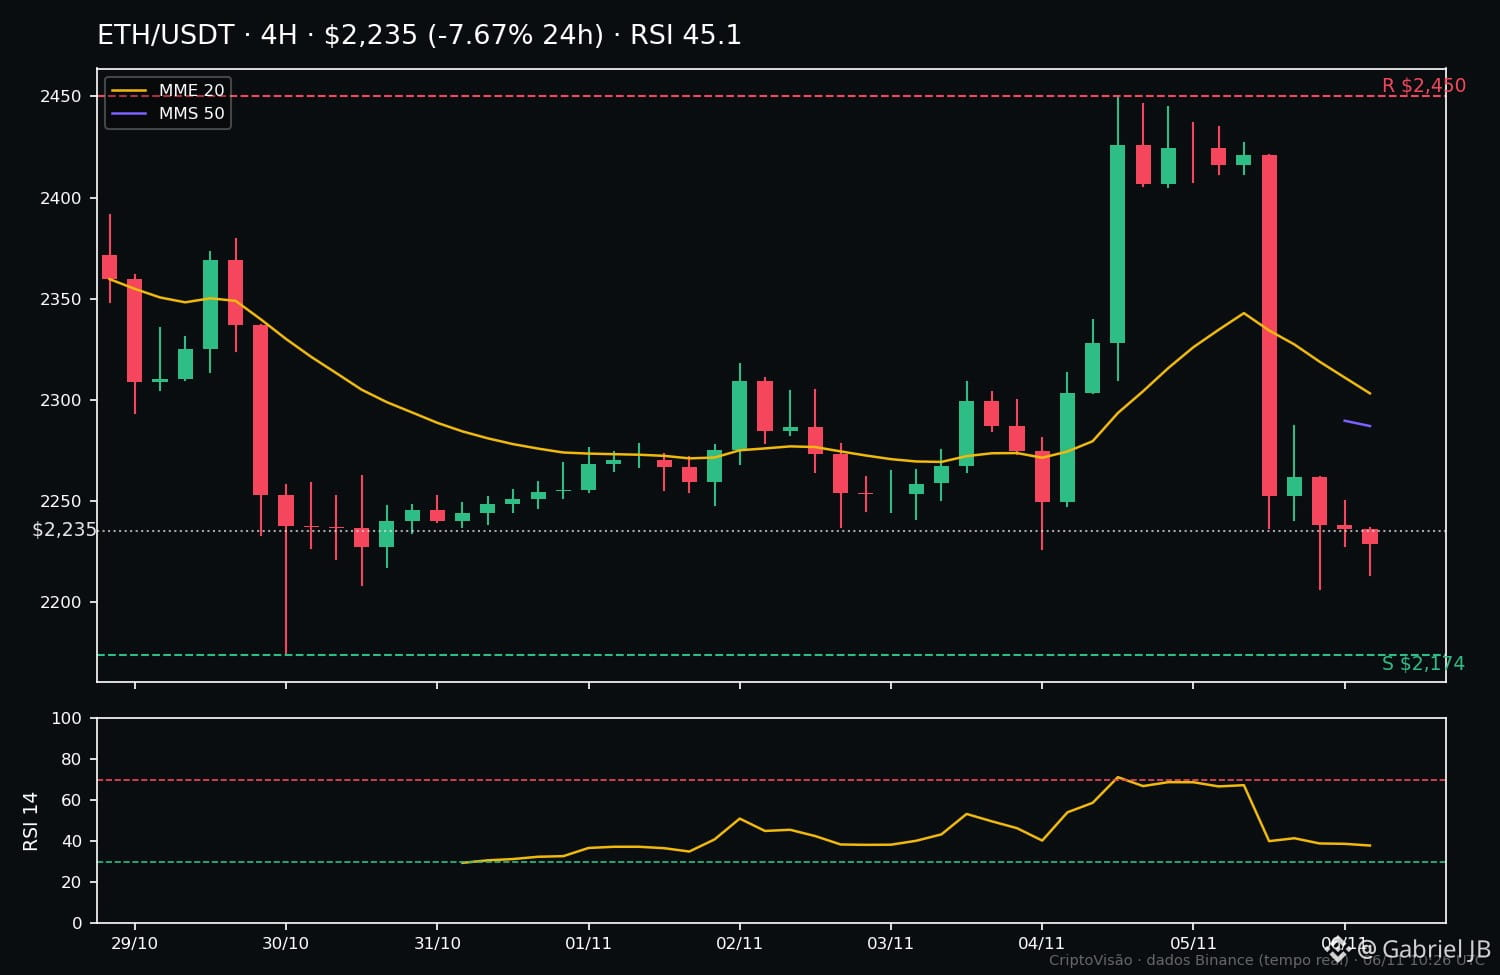
The $ETH fell to $2,235, down 7.67% over the last 24 hours — a steeper drop than $BTC today (down 5.50%, to $76,084). For the week, however, ETH is less negative (down 5.54% versus BTC’s 7.04%): today’s weakness, not the whole week’s.
SITUATION
The price is below the 4-hour moving averages (EMA-20 at $2,313 and SMA-50 at $2,287), and the RSI-14 is at 45.1 — neutral, not oversold. ETH is trading at 13% of its 24-hour range ($2,206–$2,424), meaning it is near the day’s low.
LEVELS
Support: $2,206 (24-hour low) and $2,174 (7-day low).
Resistance: $2,287–$2,313 (moving averages) and $2,450 (7-day high).
SCENARIO A — recovery: holding $2,174 and closing 4-hour candles above $2,313, with rising volume, opens the way to test $2,450.
SCENARIO B — continued decline: a 4-hour close below $2,174 confirms weakness and exposes lower levels.
WHAT WOULD CONFIRM IT
To the upside: a close above the EMA-20 and RSI rising above 50. To the downside: losing $2,174 on volume.
RISK
$BTC is also below the moving averages — this is a market-wide decline, not just an ETH decline. High volatility near support calls for patience: rushing in after the price, or using leverage, is the classic mistake in these zones.
CONCLUSION
ETH is at a decision point: either support at $2,174 holds and the price reclaims the moving averages, or losing that level confirms further weakness. Until then, this is a zone for observation, not certainty.
What do you think — will support at $2,174 hold, or will ETH test lower levels? 👇
#Ethereum #CriptoVisao #TechnicalAnalysis
ETH tests the weekly low — what will decide the next move? 📉
The $ETH fell to $2,235, down 7.67% over the last 24 hours — a steeper drop than $BTC today (down 5.50%, to $76,084). For the week, however, ETH is less negative (down 5.54% versus BTC’s 7.04%): today’s weakness, not the whole week’s.
SITUATION
The price is below the 4-hour moving averages (EMA-20 at $2,313 and SMA-50 at $2,287), and the RSI-14 is at 45.1 — neutral, not oversold. ETH is trading at 13% of its 24-hour range ($2,206–$2,424), meaning it is near the day’s low.
LEVELS
Support: $2,206 (24-hour low) and $2,174 (7-day low).
Resistance: $2,287–$2,313 (moving averages) and $2,450 (7-day high).
SCENARIO A — recovery: holding $2,174 and closing 4-hour candles above $2,313, with rising volume, opens the way to test $2,450.
SCENARIO B — continued decline: a 4-hour close below $2,174 confirms weakness and exposes lower levels.
WHAT WOULD CONFIRM IT
To the upside: a close above the EMA-20 and RSI rising above 50. To the downside: losing $2,174 on volume.
RISK
$BTC is also below the moving averages — this is a market-wide decline, not just an ETH decline. High volatility near support calls for patience: rushing in after the price, or using leverage, is the classic mistake in these zones.
CONCLUSION
ETH is at a decision point: either support at $2,174 holds and the price reclaims the moving averages, or losing that level confirms further weakness. Until then, this is a zone for observation, not certainty.
What do you think — will support at $2,174 hold, or will ETH test lower levels? 👇
#Ethereum #CriptoVisao #TechnicalAnalysis
The $ETH fell to $2,235, down 7.67% over the last 24 hours — a steeper drop than $BTC today (down 5.50%, to $76,084). For the week, however, ETH is less negative (down 5.54% versus BTC’s 7.04%): today’s weakness, not the whole week’s.
SITUATION
The price is below the 4-hour moving averages (EMA-20 at $2,313 and SMA-50 at $2,287), and the RSI-14 is at 45.1 — neutral, not oversold. ETH is trading at 13% of its 24-hour range ($2,206–$2,424), meaning it is near the day’s low.
LEVELS
Support: $2,206 (24-hour low) and $2,174 (7-day low).
Resistance: $2,287–$2,313 (moving averages) and $2,450 (7-day high).
SCENARIO A — recovery: holding $2,174 and closing 4-hour candles above $2,313, with rising volume, opens the way to test $2,450.
SCENARIO B — continued decline: a 4-hour close below $2,174 confirms weakness and exposes lower levels.
WHAT WOULD CONFIRM IT
To the upside: a close above the EMA-20 and RSI rising above 50. To the downside: losing $2,174 on volume.
RISK
$BTC is also below the moving averages — this is a market-wide decline, not just an ETH decline. High volatility near support calls for patience: rushing in after the price, or using leverage, is the classic mistake in these zones.
CONCLUSION
ETH is at a decision point: either support at $2,174 holds and the price reclaims the moving averages, or losing that level confirms further weakness. Until then, this is a zone for observation, not certainty.
What do you think — will support at $2,174 hold, or will ETH test lower levels? 👇
#Ethereum #CriptoVisao #TechnicalAnalysis
45
·
--
SOL testing support at $88: real breakout or trap?
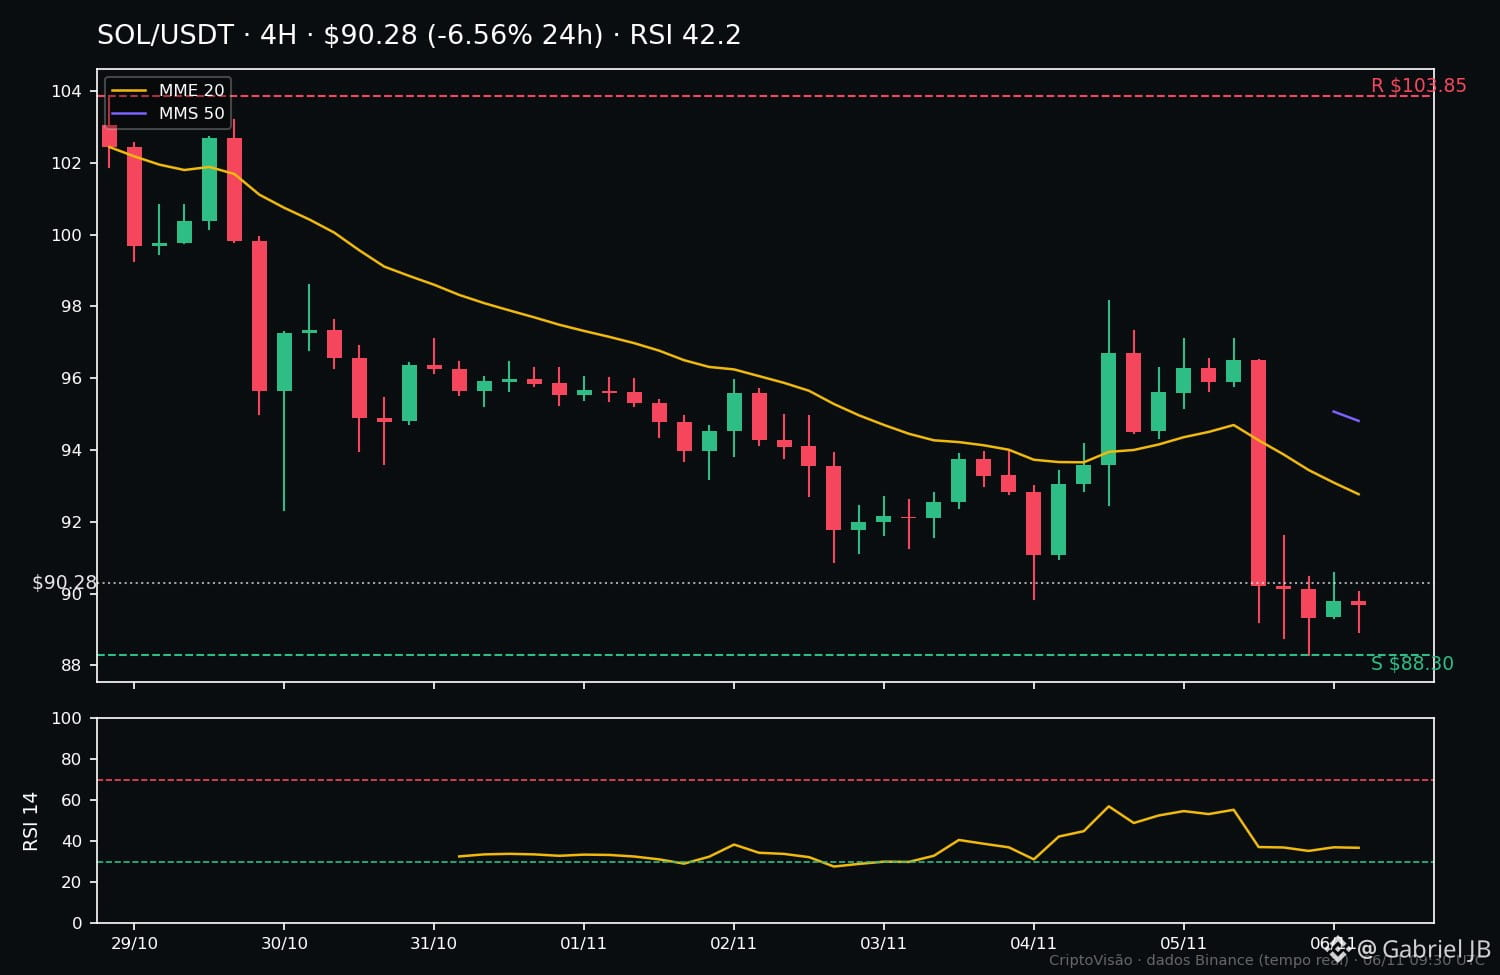
A $SOL is at $90.25 (-6.6% in 24h; -12.5% in 7 days), about 2% above the 7-day low: $88.30. RSI-14 at 42.2, neutral, and price remains below the 4h moving averages. 7-day resistance: $103.85.
This is where the breakout strategy plays out. A breakout is only confirmed with the CLOSE of a 4h candle below support — a wick that touches $88 and bounces back up is not confirmation, it is just a test.
The classic trap: price closes below support, many start selling... and on the next candle price moves back up. False breakout. Anyone who entered without waiting for the close gets stuck on the wrong side.
Educational risk management example: anyone trading the break would place the stop above the lost support, in the $88-$90 zone, to exit if the breakout turns out to be false. No confirmation, no entry.
Do you think $88.30 will hold, or will $SOL test lower levels? 👇
#Solana #CriptoVisao
SOL testing support at $88: real breakout or trap?
A $SOL is at $90.25 (-6.6% in 24h; -12.5% in 7 days), about 2% above the 7-day low: $88.30. RSI-14 at 42.2, neutral, and price remains below the 4h moving averages. 7-day resistance: $103.85.
This is where the breakout strategy plays out. A breakout is only confirmed with the CLOSE of a 4h candle below support — a wick that touches $88 and bounces back up is not confirmation, it is just a test.
The classic trap: price closes below support, many start selling... and on the next candle price moves back up. False breakout. Anyone who entered without waiting for the close gets stuck on the wrong side.
Educational risk management example: anyone trading the break would place the stop above the lost support, in the $88-$90 zone, to exit if the breakout turns out to be false. No confirmation, no entry.
Do you think $88.30 will hold, or will $SOL test lower levels? 👇
#Solana #CriptoVisao
A $SOL is at $90.25 (-6.6% in 24h; -12.5% in 7 days), about 2% above the 7-day low: $88.30. RSI-14 at 42.2, neutral, and price remains below the 4h moving averages. 7-day resistance: $103.85.
This is where the breakout strategy plays out. A breakout is only confirmed with the CLOSE of a 4h candle below support — a wick that touches $88 and bounces back up is not confirmation, it is just a test.
The classic trap: price closes below support, many start selling... and on the next candle price moves back up. False breakout. Anyone who entered without waiting for the close gets stuck on the wrong side.
Educational risk management example: anyone trading the break would place the stop above the lost support, in the $88-$90 zone, to exit if the breakout turns out to be false. No confirmation, no entry.
Do you think $88.30 will hold, or will $SOL test lower levels? 👇
#Solana #CriptoVisao
89
·
--
Bitcoin tests the weekly support: $75,200 will decide the next move 📉
SITUATION
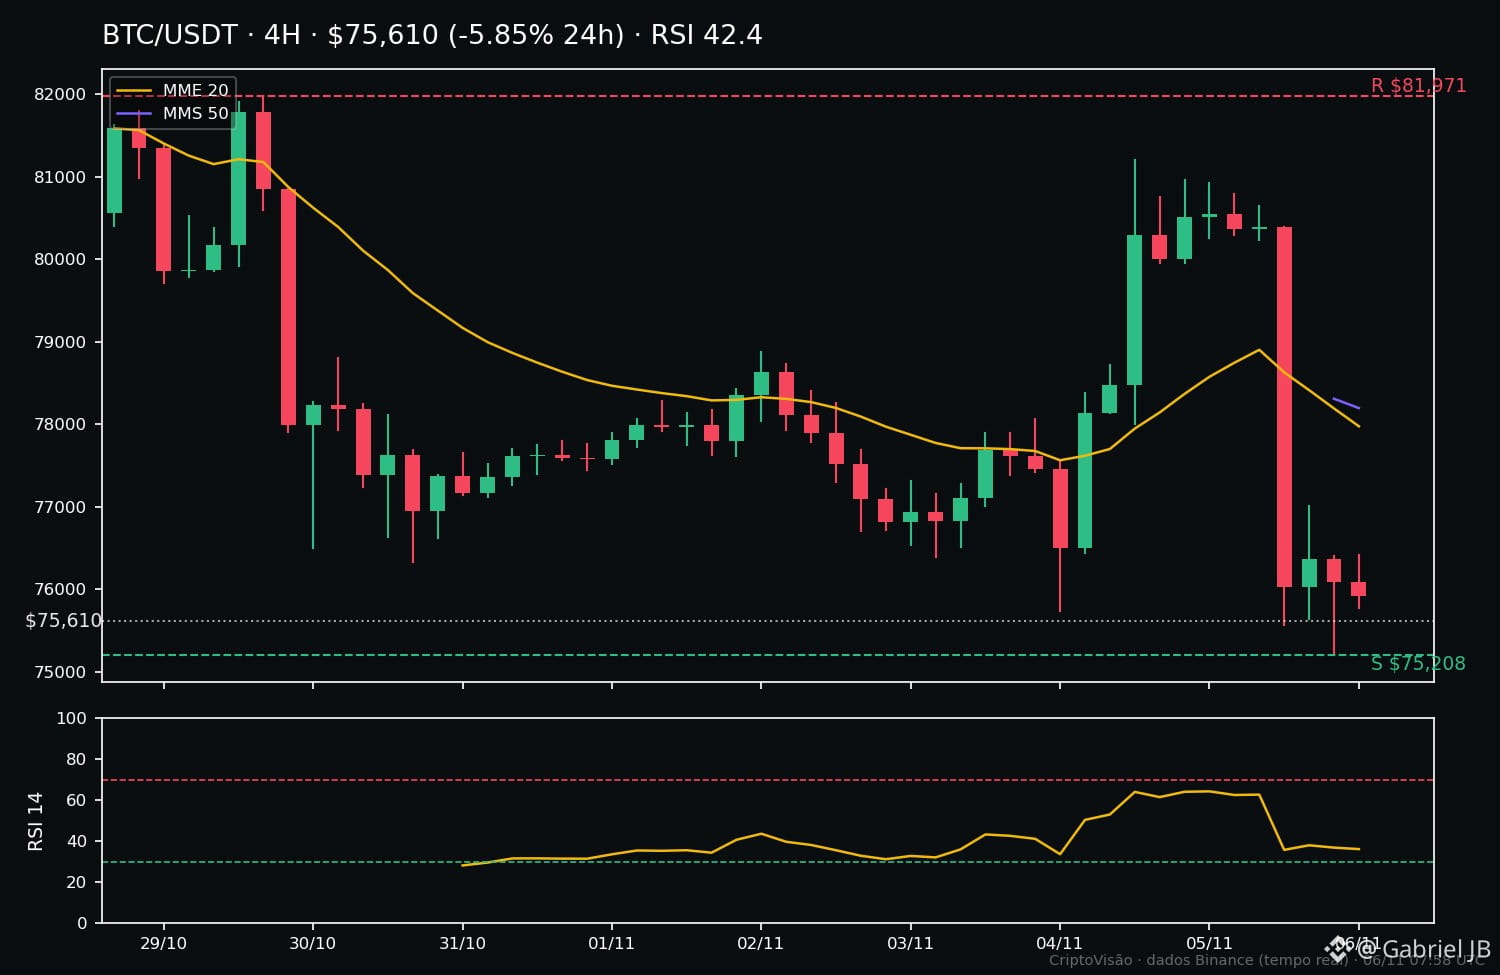
$BTC fell 5.85% in the last 24 hours and is now trading at $75,615, right around the weekly low ($75,208). Over 7 days, the cumulative decline is 6.95%. The price is below the 20- and 50-period moving averages on the 4-hour chart ($78,002 and $78,195) — a weakening short-term trend — and the RSI-14 is at 42.4, neutral, with no oversold signal.
LEVELS
• Support: $75,208 (weekly and 24-hour low)
• Resistance: $78,000–$78,200 (moving average zone)
• Resistance: $81,971 (weekly high)
SCENARIO A — support holds
If the price defends $75,208 with a 4-hour candle close above that level and recovers $78,000, there’s room for a rebound toward $81,971.
SCENARIO B — support breaks
If a 4-hour candle closes below $75,208, the recovery scenario is invalidated, leaving room for the price to test levels below the weekly low.
WHAT WOULD CONFIRM IT
A 4-hour candle close — not a wick — above $78,000 would confirm buying strength; a close below $75,208 would confirm the loss of support.
RISK
The price is right at the weekly low, with $2.08 billion in volume over the last 24 hours. Entering here without confirmation is like trying to catch a falling knife: volatility could push the price either way before a direction is established.
CONCLUSION
This is a decision zone, not a certainty. The level to watch is clear: $75,208. Those following $BTC: do you think support will hold, or will we see new lows this week? 👇
$BTC #Bitcoin #CriptoVisao
Bitcoin tests the weekly support: $75,200 will decide the next move 📉
SITUATION
$BTC fell 5.85% in the last 24 hours and is now trading at $75,615, right around the weekly low ($75,208). Over 7 days, the cumulative decline is 6.95%. The price is below the 20- and 50-period moving averages on the 4-hour chart ($78,002 and $78,195) — a weakening short-term trend — and the RSI-14 is at 42.4, neutral, with no oversold signal.
LEVELS
• Support: $75,208 (weekly and 24-hour low)
• Resistance: $78,000–$78,200 (moving average zone)
• Resistance: $81,971 (weekly high)
SCENARIO A — support holds
If the price defends $75,208 with a 4-hour candle close above that level and recovers $78,000, there’s room for a rebound toward $81,971.
SCENARIO B — support breaks
If a 4-hour candle closes below $75,208, the recovery scenario is invalidated, leaving room for the price to test levels below the weekly low.
WHAT WOULD CONFIRM IT
A 4-hour candle close — not a wick — above $78,000 would confirm buying strength; a close below $75,208 would confirm the loss of support.
RISK
The price is right at the weekly low, with $2.08 billion in volume over the last 24 hours. Entering here without confirmation is like trying to catch a falling knife: volatility could push the price either way before a direction is established.
CONCLUSION
This is a decision zone, not a certainty. The level to watch is clear: $75,208. Those following $BTC : do you think support will hold, or will we see new lows this week? 👇
$BTC #Bitcoin #CriptoVisao
SITUATION
$BTC fell 5.85% in the last 24 hours and is now trading at $75,615, right around the weekly low ($75,208). Over 7 days, the cumulative decline is 6.95%. The price is below the 20- and 50-period moving averages on the 4-hour chart ($78,002 and $78,195) — a weakening short-term trend — and the RSI-14 is at 42.4, neutral, with no oversold signal.
LEVELS
• Support: $75,208 (weekly and 24-hour low)
• Resistance: $78,000–$78,200 (moving average zone)
• Resistance: $81,971 (weekly high)
SCENARIO A — support holds
If the price defends $75,208 with a 4-hour candle close above that level and recovers $78,000, there’s room for a rebound toward $81,971.
SCENARIO B — support breaks
If a 4-hour candle closes below $75,208, the recovery scenario is invalidated, leaving room for the price to test levels below the weekly low.
WHAT WOULD CONFIRM IT
A 4-hour candle close — not a wick — above $78,000 would confirm buying strength; a close below $75,208 would confirm the loss of support.
RISK
The price is right at the weekly low, with $2.08 billion in volume over the last 24 hours. Entering here without confirmation is like trying to catch a falling knife: volatility could push the price either way before a direction is established.
CONCLUSION
This is a decision zone, not a certainty. The level to watch is clear: $75,208. Those following $BTC : do you think support will hold, or will we see new lows this week? 👇
$BTC #Bitcoin #CriptoVisao
101
·
--
Red morning: the three majors test weekly lows 📉
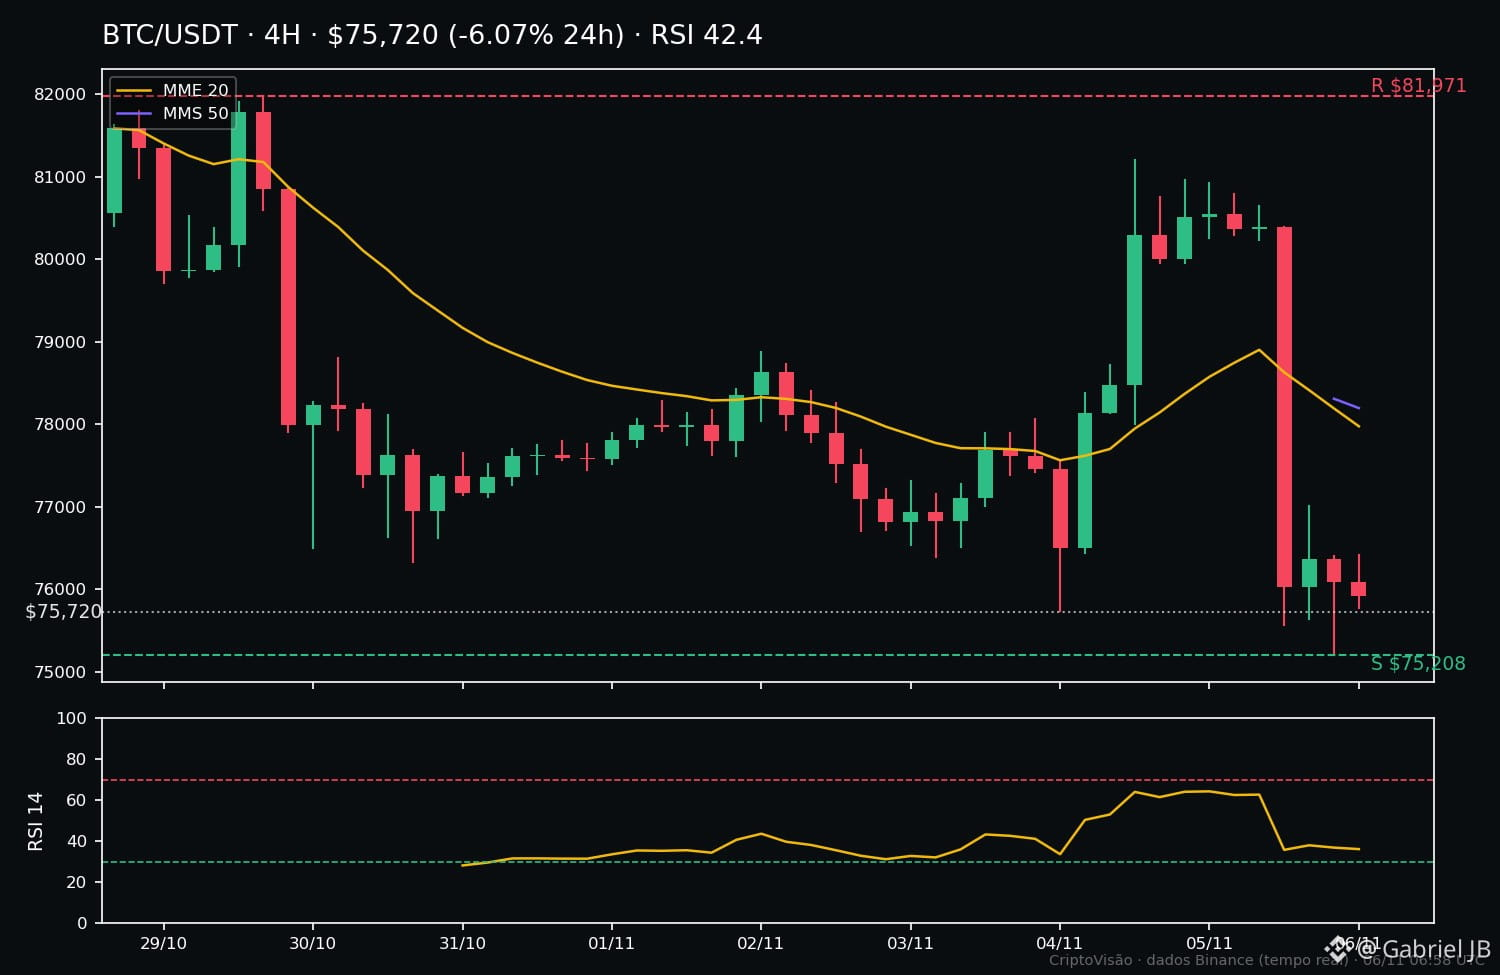
The market opened lower. $BTC lost 6.1% in 24h and is trading at 75,720 USD, right near its 7-day low (75,208 USD). $ETH fell 8.2% to 2,230 USD and $SOL dropped 6.7% to 89.71 USD — SOL is now down 12.9% for the week.
SITUATION
All three coins are below their 4h moving averages and the RSI-14 is neutral (BTC 42.4; ETH 44.6; SOL 41.4): there is selling pressure, but no exhaustion signal yet to foreshadow a recovery. The U.S. jobs report comes out today at 3:30 p.m. — it’s the macro data that could move the market for the rest of the day.
LEVELS
$BTC: support 75,208 USD (weekly low) | resistance 78,000 USD (moving averages) and 81,971 USD
$ETH: support 2,174 USD | resistance 2,314 USD and 2,450 USD
$SOL: support 88.30 USD | resistance 93.07 USD and 103.85 USD
SCENARIO A — Recovery
If BTC holds 75,208 USD and closes 4h candles above 78,000 USD, that opens the way to test 81,971 USD. ETH would follow above 2,314 USD.
SCENARIO B — Further declines
A 4h close below 75,208 USD for BTC opens the way to new weekly lows — and drags ETH below 2,174 USD and SOL below 88.30 USD.
WHAT WOULD CONFIRM IT
A 4h close above the moving averages (BTC 78,000 USD) with rising volume, or a confirmed break below support on volume. Until then, this is an uncertain zone, not one for confident calls.
RISK
Buying just because “it’s already fallen a lot” is the classic mistake: the RSI is not yet oversold and there’s no reversal signal. Volatility tends to rise on macro data days — size your position for the worst-case scenario, not the best.
CONCLUSION
Today’s bias: bearish in the short term, but conditional — as long as BTC holds 75,208 USD, the drop is a correction within the range; if it loses that level, the picture changes. Do you think support will hold until the jobs report? 👇
#Bitcoin #Ethereum #CryptoVision
Red morning: the three majors test weekly lows 📉
The market opened lower. $BTC lost 6.1% in 24h and is trading at 75,720 USD, right near its 7-day low (75,208 USD). $ETH fell 8.2% to 2,230 USD and $SOL dropped 6.7% to 89.71 USD — SOL is now down 12.9% for the week.
SITUATION
All three coins are below their 4h moving averages and the RSI-14 is neutral (BTC 42.4; ETH 44.6; SOL 41.4): there is selling pressure, but no exhaustion signal yet to foreshadow a recovery. The U.S. jobs report comes out today at 3:30 p.m. — it’s the macro data that could move the market for the rest of the day.
LEVELS
$BTC : support 75,208 USD (weekly low) | resistance 78,000 USD (moving averages) and 81,971 USD
$ETH : support 2,174 USD | resistance 2,314 USD and 2,450 USD
$SOL : support 88.30 USD | resistance 93.07 USD and 103.85 USD
SCENARIO A — Recovery
If BTC holds 75,208 USD and closes 4h candles above 78,000 USD, that opens the way to test 81,971 USD. ETH would follow above 2,314 USD.
SCENARIO B — Further declines
A 4h close below 75,208 USD for BTC opens the way to new weekly lows — and drags ETH below 2,174 USD and SOL below 88.30 USD.
WHAT WOULD CONFIRM IT
A 4h close above the moving averages (BTC 78,000 USD) with rising volume, or a confirmed break below support on volume. Until then, this is an uncertain zone, not one for confident calls.
RISK
Buying just because “it’s already fallen a lot” is the classic mistake: the RSI is not yet oversold and there’s no reversal signal. Volatility tends to rise on macro data days — size your position for the worst-case scenario, not the best.
CONCLUSION
Today’s bias: bearish in the short term, but conditional — as long as BTC holds 75,208 USD, the drop is a correction within the range; if it loses that level, the picture changes. Do you think support will hold until the jobs report? 👇
#Bitcoin #Ethereum #CryptoVision
The market opened lower. $BTC lost 6.1% in 24h and is trading at 75,720 USD, right near its 7-day low (75,208 USD). $ETH fell 8.2% to 2,230 USD and $SOL dropped 6.7% to 89.71 USD — SOL is now down 12.9% for the week.
SITUATION
All three coins are below their 4h moving averages and the RSI-14 is neutral (BTC 42.4; ETH 44.6; SOL 41.4): there is selling pressure, but no exhaustion signal yet to foreshadow a recovery. The U.S. jobs report comes out today at 3:30 p.m. — it’s the macro data that could move the market for the rest of the day.
LEVELS
$BTC : support 75,208 USD (weekly low) | resistance 78,000 USD (moving averages) and 81,971 USD
$ETH : support 2,174 USD | resistance 2,314 USD and 2,450 USD
$SOL : support 88.30 USD | resistance 93.07 USD and 103.85 USD
SCENARIO A — Recovery
If BTC holds 75,208 USD and closes 4h candles above 78,000 USD, that opens the way to test 81,971 USD. ETH would follow above 2,314 USD.
SCENARIO B — Further declines
A 4h close below 75,208 USD for BTC opens the way to new weekly lows — and drags ETH below 2,174 USD and SOL below 88.30 USD.
WHAT WOULD CONFIRM IT
A 4h close above the moving averages (BTC 78,000 USD) with rising volume, or a confirmed break below support on volume. Until then, this is an uncertain zone, not one for confident calls.
RISK
Buying just because “it’s already fallen a lot” is the classic mistake: the RSI is not yet oversold and there’s no reversal signal. Volatility tends to rise on macro data days — size your position for the worst-case scenario, not the best.
CONCLUSION
Today’s bias: bearish in the short term, but conditional — as long as BTC holds 75,208 USD, the drop is a correction within the range; if it loses that level, the picture changes. Do you think support will hold until the jobs report? 👇
#Bitcoin #Ethereum #CryptoVision
87
·
--
📊 DAILY SUMMARY — The morning promised a rise. The market delivered a correction
THE DAY IN A FEW LINES
In the morning, everything was rising: $BTC at $80,611 (+3.32% in 24h), $ETH at 2,429 (+5.75%) and $SOL at 96.19 (+3.38%). By the close of the day, the picture had turned: $BTC at $76,090 (−5.3% in 24h), $ETH at 2,251.86 (−7.08%) and $SOL at 89.53 (−6.05%). $SOL is the weakest of the week: −11.83% in 7 days. Fresh data from today, 05/11, via Binance.
WHAT WAS CONFIRMED
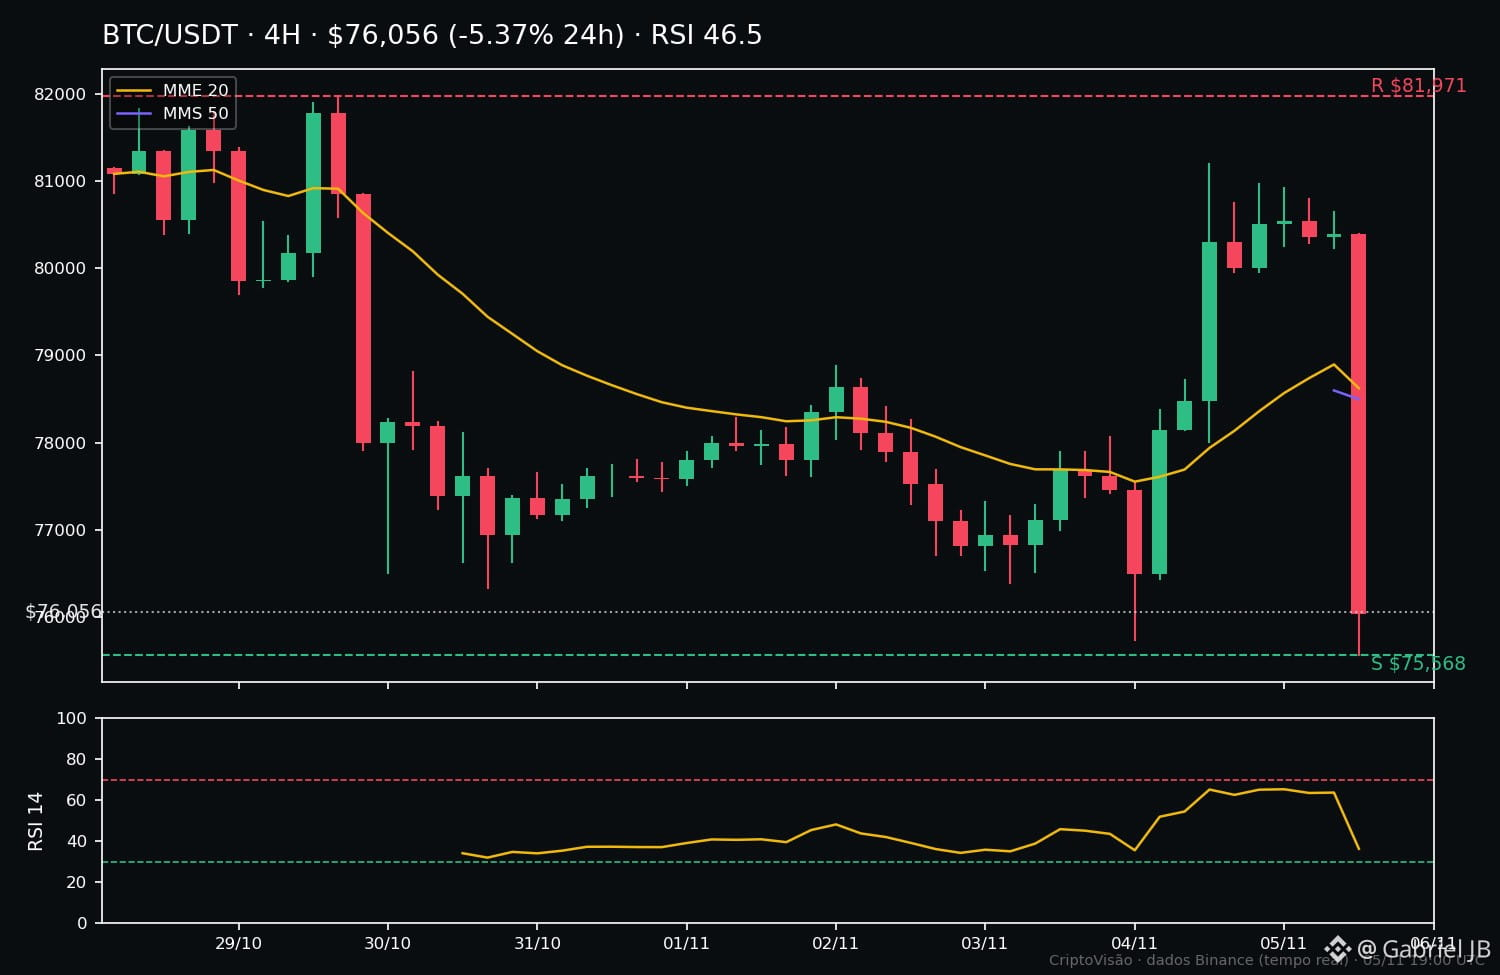
The morning’s scenario B: with the RSI overbought (73.9 on $BTC and 77.3 on $ETH), rejection at resistance sent the price back to the moving averages—and beyond. $BTC lost $78,002 and reached the $75,736 target, with the day’s low at $75,568. The RSI cooled to 46.5: neutral, with no excess in either direction.
WHAT WAS NOT CONFIRMED
The continuation: $BTC never closed above $81,971, and $ETH was rejected near 2,450—the 11:30 breakout was not confirmed. Anyone who bought near resistance without a confirming close paid the highest price of the day.
LEVELS FOR TOMORROW
$BTC — support: 75,568 (today’s low); resistance: 78,200–78,500 (former support, now resistance). If 75,568 gives way, there is room for new weekly lows; if it holds and the price recovers 78,500, a recovery is back on the table.
$ETH — support: 2,174.08 (7-day low); resistance: 2,450. Below 2,174, weakness deepens.
$SOL — support: 89.22; resistance: 93.58 (20-period average). It is the weakest coin of the week—deserving extra attention.
RISK: markets can change overnight; no position means no loss. Patience is a position.
And you: do you see a recovery tomorrow or a continued decline? 👇
#Bitcoin #Ethereum #CriptoVisao
📊 DAILY SUMMARY — The morning promised a rise. The market delivered a correction
THE DAY IN A FEW LINES
In the morning, everything was rising: $BTC at $80,611 (+3.32% in 24h), $ETH at 2,429 (+5.75%) and $SOL at 96.19 (+3.38%). By the close of the day, the picture had turned: $BTC at $76,090 (−5.3% in 24h), $ETH at 2,251.86 (−7.08%) and $SOL at 89.53 (−6.05%). $SOL is the weakest of the week: −11.83% in 7 days. Fresh data from today, 05/11, via Binance.
WHAT WAS CONFIRMED
The morning’s scenario B: with the RSI overbought (73.9 on $BTC and 77.3 on $ETH ), rejection at resistance sent the price back to the moving averages—and beyond. $BTC lost $78,002 and reached the $75,736 target, with the day’s low at $75,568. The RSI cooled to 46.5: neutral, with no excess in either direction.
WHAT WAS NOT CONFIRMED
The continuation: $BTC never closed above $81,971, and $ETH was rejected near 2,450—the 11:30 breakout was not confirmed. Anyone who bought near resistance without a confirming close paid the highest price of the day.
LEVELS FOR TOMORROW
$BTC — support: 75,568 (today’s low); resistance: 78,200–78,500 (former support, now resistance). If 75,568 gives way, there is room for new weekly lows; if it holds and the price recovers 78,500, a recovery is back on the table.
$ETH — support: 2,174.08 (7-day low); resistance: 2,450. Below 2,174, weakness deepens.
$SOL — support: 89.22; resistance: 93.58 (20-period average). It is the weakest coin of the week—deserving extra attention.
RISK: markets can change overnight; no position means no loss. Patience is a position.
And you: do you see a recovery tomorrow or a continued decline? 👇
#Bitcoin #Ethereum #CriptoVisao
THE DAY IN A FEW LINES
In the morning, everything was rising: $BTC at $80,611 (+3.32% in 24h), $ETH at 2,429 (+5.75%) and $SOL at 96.19 (+3.38%). By the close of the day, the picture had turned: $BTC at $76,090 (−5.3% in 24h), $ETH at 2,251.86 (−7.08%) and $SOL at 89.53 (−6.05%). $SOL is the weakest of the week: −11.83% in 7 days. Fresh data from today, 05/11, via Binance.
WHAT WAS CONFIRMED
The morning’s scenario B: with the RSI overbought (73.9 on $BTC and 77.3 on $ETH ), rejection at resistance sent the price back to the moving averages—and beyond. $BTC lost $78,002 and reached the $75,736 target, with the day’s low at $75,568. The RSI cooled to 46.5: neutral, with no excess in either direction.
WHAT WAS NOT CONFIRMED
The continuation: $BTC never closed above $81,971, and $ETH was rejected near 2,450—the 11:30 breakout was not confirmed. Anyone who bought near resistance without a confirming close paid the highest price of the day.
LEVELS FOR TOMORROW
$BTC — support: 75,568 (today’s low); resistance: 78,200–78,500 (former support, now resistance). If 75,568 gives way, there is room for new weekly lows; if it holds and the price recovers 78,500, a recovery is back on the table.
$ETH — support: 2,174.08 (7-day low); resistance: 2,450. Below 2,174, weakness deepens.
$SOL — support: 89.22; resistance: 93.58 (20-period average). It is the weakest coin of the week—deserving extra attention.
RISK: markets can change overnight; no position means no loss. Patience is a position.
And you: do you see a recovery tomorrow or a continued decline? 👇
#Bitcoin #Ethereum #CriptoVisao
77
·
--
⚖️ Red day: who held up better, $BTC or $ETH?
Today (05/11, ~20:00 CAT) the two largest fell sharply — but not by the same amount. The numbers side by side:
$BTC — $75,871.57
• 24h: −5.66% | 7d: −6.23%
• RSI-14: 46.5 (neutral)
• Below the EMA-20 ($78,209) and the SMA-50 ($78,497)
• Near the 7-day low ($75,568)
$ETH — $2,252.87
• 24h: −7.08% | 7d: −4.60%
• RSI-14: 49.4 (neutral)
• Between the moving averages: below the EMA-20 ($2,318), above the SMA-50 ($2,296)
• ~28% above the 7-day low ($2,174)
Who's stronger? $ETH, by a little.
On the day, $BTC fell less. But over the week, $ETH lost less (−4.60% versus −6.23%), has the higher RSI, and is holding above the 50-period average, further from the week's low. $BTC is practically at its 7-day low and below both moving averages.
What does this suggest? Over the weekly window, capital held up a little better in $ETH — relative rotation in favor of $ETH, not outright leadership. Neither is strong: both fell today and are near their lows.
Risk of reading too much into it: a one-day comparison is not a trend. What would confirm $ETH's relative strength: holding above $2,296 (SMA-50) and $2,174. What would invalidate it: losing the 7-day low. For $BTC, recovering $78,209 would reverse the picture.
This is not a forecast or advice — it's a snapshot of today. Tomorrow the numbers may tell a different story.
And you, do you think $ETH will continue to lead this week, or will $BTC take back the lead? 👇
#Bitcoin #Ethereum #CriptoVisao
⚖️ Red day: who held up better, $BTC or $ETH ?
Today (05/11, ~20:00 CAT) the two largest fell sharply — but not by the same amount. The numbers side by side:
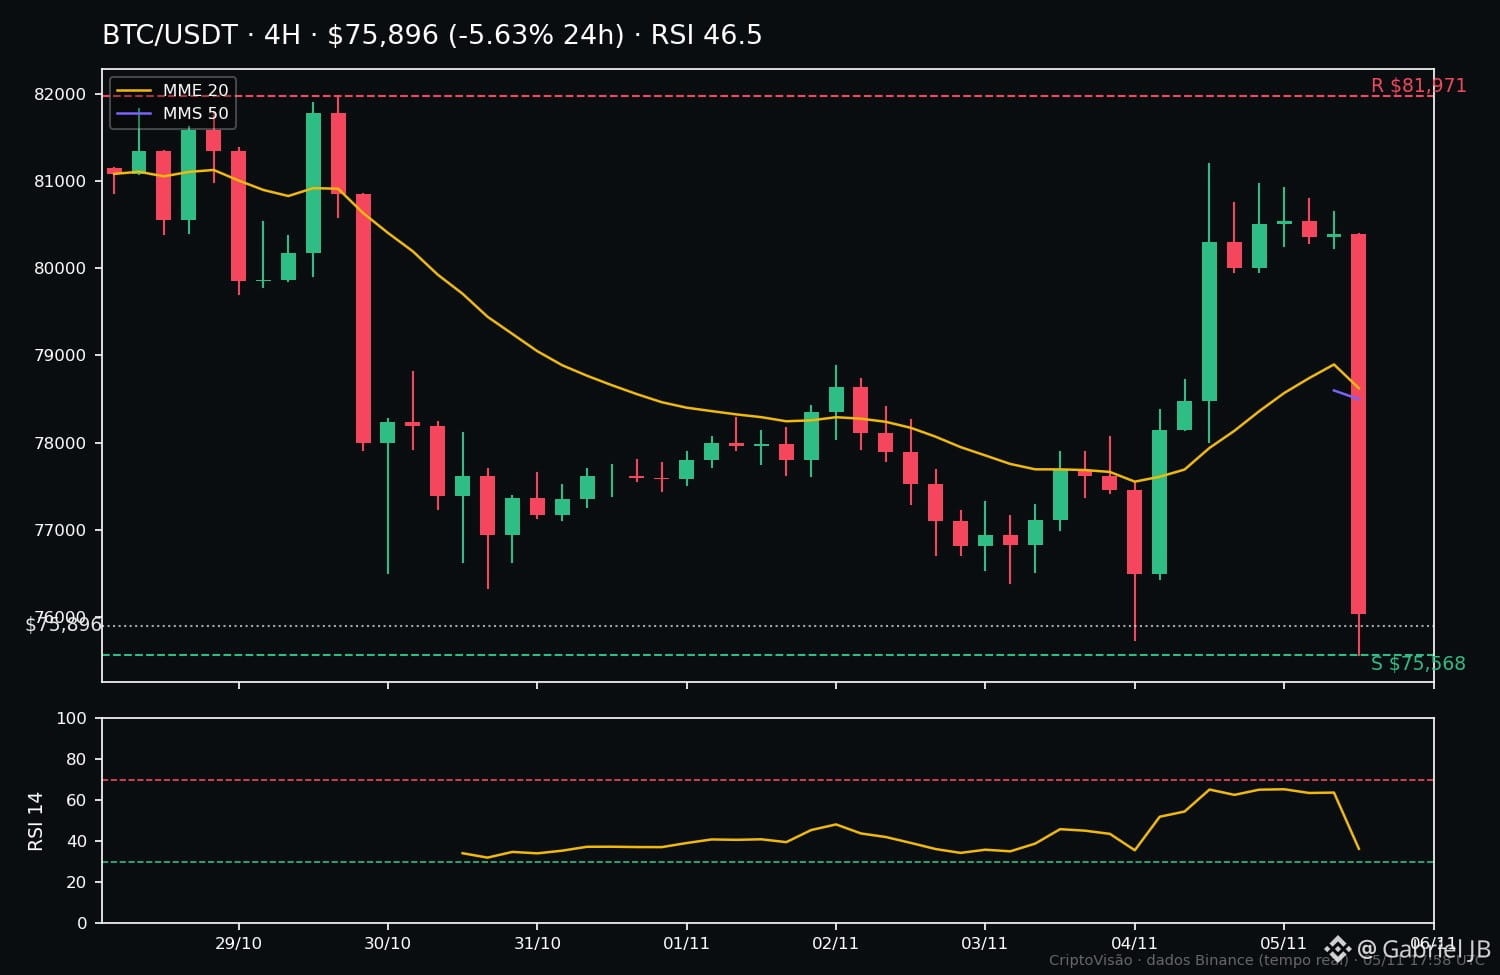
$BTC — $75,871.57
• 24h: −5.66% | 7d: −6.23%
• RSI-14: 46.5 (neutral)
• Below the EMA-20 ($78,209) and the SMA-50 ($78,497)
• Near the 7-day low ($75,568)
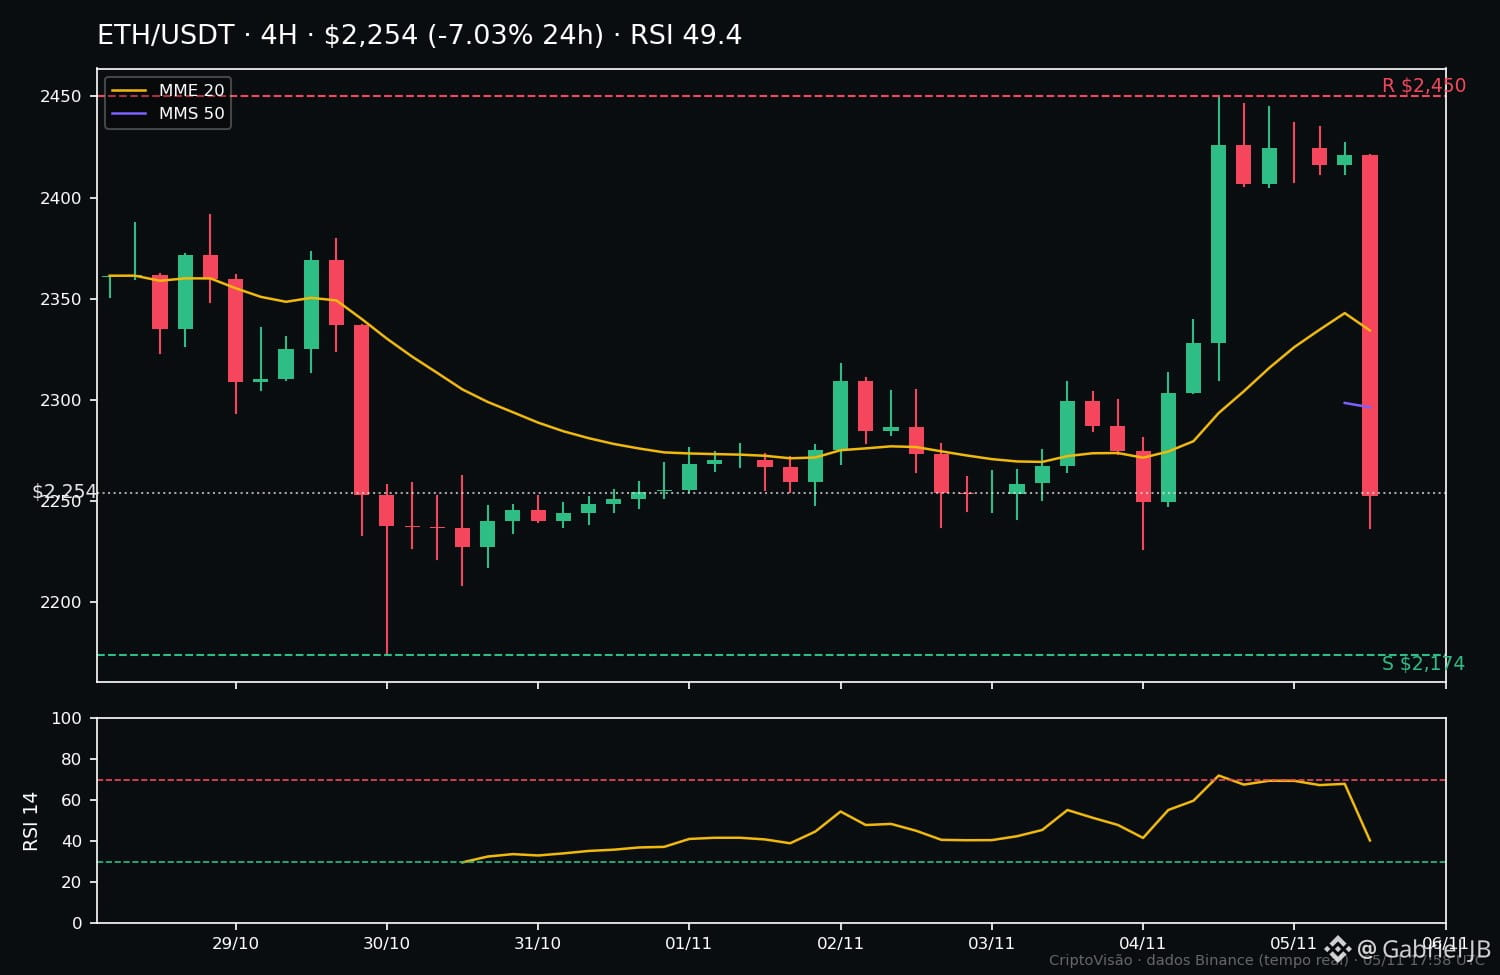
$ETH — $2,252.87
• 24h: −7.08% | 7d: −4.60%
• RSI-14: 49.4 (neutral)
• Between the moving averages: below the EMA-20 ($2,318), above the SMA-50 ($2,296)
• ~28% above the 7-day low ($2,174)
Who's stronger? $ETH , by a little.
On the day, $BTC fell less. But over the week, $ETH lost less (−4.60% versus −6.23%), has the higher RSI, and is holding above the 50-period average, further from the week's low. $BTC is practically at its 7-day low and below both moving averages.
What does this suggest? Over the weekly window, capital held up a little better in $ETH — relative rotation in favor of $ETH , not outright leadership. Neither is strong: both fell today and are near their lows.
Risk of reading too much into it: a one-day comparison is not a trend. What would confirm $ETH 's relative strength: holding above $2,296 (SMA-50) and $2,174. What would invalidate it: losing the 7-day low. For $BTC , recovering $78,209 would reverse the picture.
This is not a forecast or advice — it's a snapshot of today. Tomorrow the numbers may tell a different story.
And you, do you think $ETH will continue to lead this week, or will $BTC take back the lead? 👇
#Bitcoin #Ethereum #CriptoVisao
Today (05/11, ~20:00 CAT) the two largest fell sharply — but not by the same amount. The numbers side by side:
$BTC — $75,871.57
• 24h: −5.66% | 7d: −6.23%
• RSI-14: 46.5 (neutral)
• Below the EMA-20 ($78,209) and the SMA-50 ($78,497)
• Near the 7-day low ($75,568)
$ETH — $2,252.87
• 24h: −7.08% | 7d: −4.60%
• RSI-14: 49.4 (neutral)
• Between the moving averages: below the EMA-20 ($2,318), above the SMA-50 ($2,296)
• ~28% above the 7-day low ($2,174)
Who's stronger? $ETH , by a little.
On the day, $BTC fell less. But over the week, $ETH lost less (−4.60% versus −6.23%), has the higher RSI, and is holding above the 50-period average, further from the week's low. $BTC is practically at its 7-day low and below both moving averages.
What does this suggest? Over the weekly window, capital held up a little better in $ETH — relative rotation in favor of $ETH , not outright leadership. Neither is strong: both fell today and are near their lows.
Risk of reading too much into it: a one-day comparison is not a trend. What would confirm $ETH 's relative strength: holding above $2,296 (SMA-50) and $2,174. What would invalidate it: losing the 7-day low. For $BTC , recovering $78,209 would reverse the picture.
This is not a forecast or advice — it's a snapshot of today. Tomorrow the numbers may tell a different story.
And you, do you think $ETH will continue to lead this week, or will $BTC take back the lead? 👇
#Bitcoin #Ethereum #CriptoVisao
45
·
--
The $BTC fell 5% today — and that’s where the patient trader wins the trade
Bitcoin at US$ 76,443 at 18:59 (CAT): -5.03% in 24h and -6.23% in 7 days. It fell from US$ 81,971 to a low of US$ 75,568. RSI-14 is at 46.5, neutral — no extreme in either direction.
After a sharp move like this, the classic mistake is to chase the price: sell at the low out of fear or buy the “bottom” out of FOMO. The patient trader waits for the pullback: a retest of the broken level.
Today’s retest zone: US$ 78,200–78,500, the former support (20-period moving average on the 4h chart) that has now turned into resistance.
What would confirm an entry: rejection in this zone — a long wick and a close back below it. No confirmation, no trade.
Stop (educational example): above US$ 78,500. If the price closes above this zone, the idea loses strength and is invalidated.
The market always gives a second chance to those who wait. Patience is a position. What about you: have you ever missed a trade by jumping in impulsively, without waiting for the retest? 👇
#Bitcoin #Trading #CriptoVisao
The $BTC fell 5% today — and that’s where the patient trader wins the trade
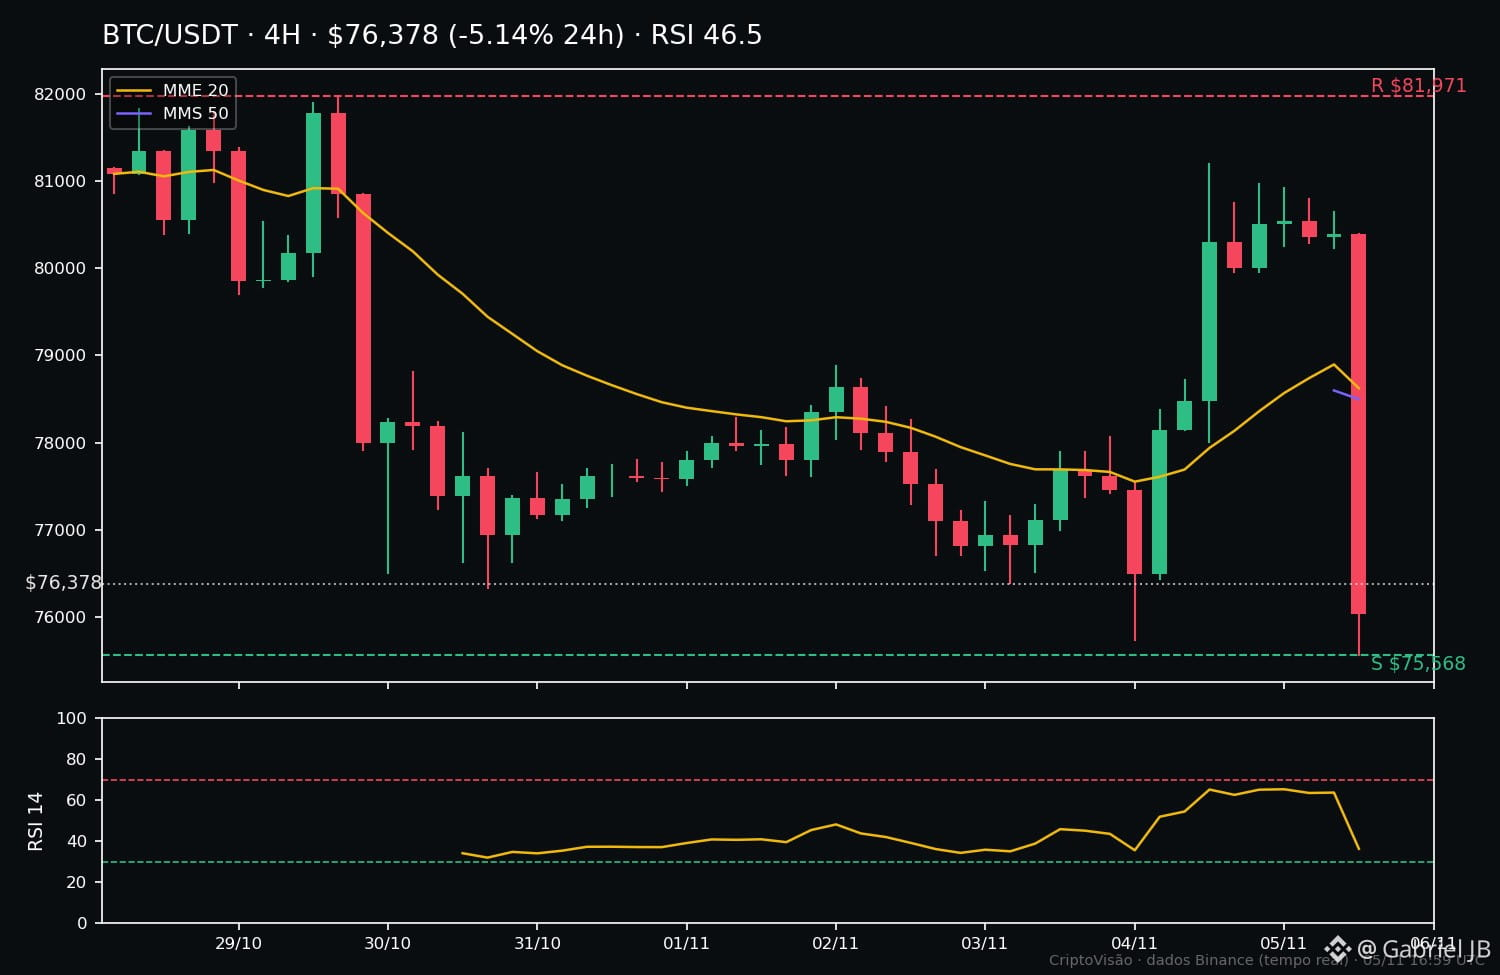
Bitcoin at US$ 76,443 at 18:59 (CAT): -5.03% in 24h and -6.23% in 7 days. It fell from US$ 81,971 to a low of US$ 75,568. RSI-14 is at 46.5, neutral — no extreme in either direction.
After a sharp move like this, the classic mistake is to chase the price: sell at the low out of fear or buy the “bottom” out of FOMO. The patient trader waits for the pullback: a retest of the broken level.
Today’s retest zone: US$ 78,200–78,500, the former support (20-period moving average on the 4h chart) that has now turned into resistance.
What would confirm an entry: rejection in this zone — a long wick and a close back below it. No confirmation, no trade.
Stop (educational example): above US$ 78,500. If the price closes above this zone, the idea loses strength and is invalidated.
The market always gives a second chance to those who wait. Patience is a position. What about you: have you ever missed a trade by jumping in impulsively, without waiting for the retest? 👇
#Bitcoin #Trading #CriptoVisao
Bitcoin at US$ 76,443 at 18:59 (CAT): -5.03% in 24h and -6.23% in 7 days. It fell from US$ 81,971 to a low of US$ 75,568. RSI-14 is at 46.5, neutral — no extreme in either direction.
After a sharp move like this, the classic mistake is to chase the price: sell at the low out of fear or buy the “bottom” out of FOMO. The patient trader waits for the pullback: a retest of the broken level.
Today’s retest zone: US$ 78,200–78,500, the former support (20-period moving average on the 4h chart) that has now turned into resistance.
What would confirm an entry: rejection in this zone — a long wick and a close back below it. No confirmation, no trade.
Stop (educational example): above US$ 78,500. If the price closes above this zone, the idea loses strength and is invalidated.
The market always gives a second chance to those who wait. Patience is a position. What about you: have you ever missed a trade by jumping in impulsively, without waiting for the retest? 👇
#Bitcoin #Trading #CriptoVisao
17
·
--
⚠️ $BTC plunged toward support — and the day’s thesis is hanging by a thread
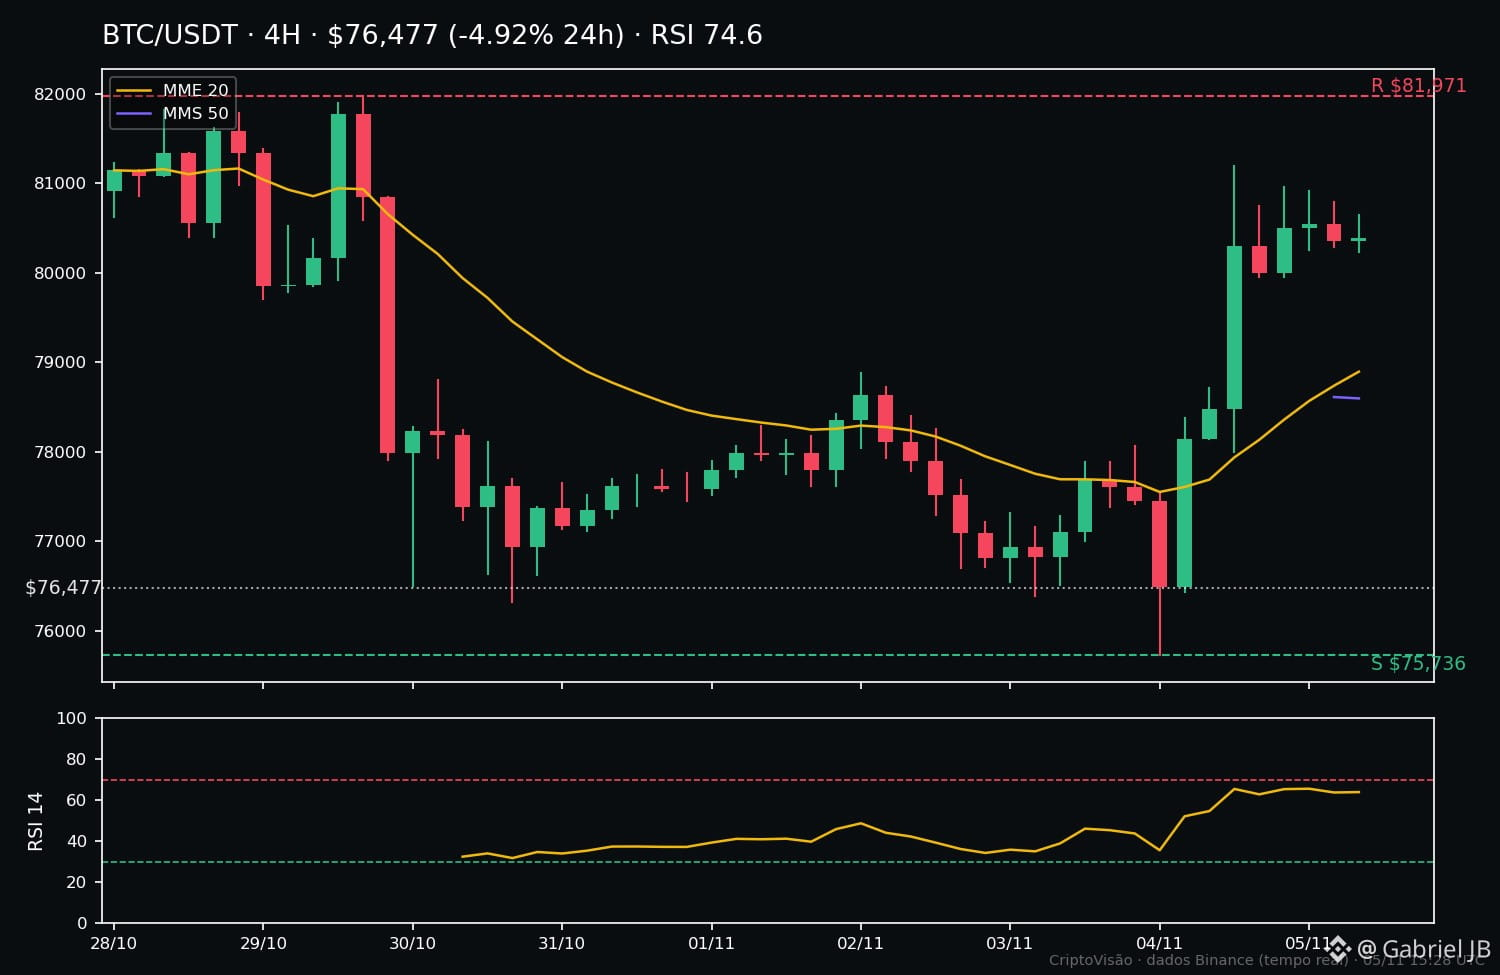
At 4:30 p.m., $BTC was at $79,466. An hour later, it’s at $76,545: down 4.82% in 24 hours, with nearly $2,900 lost in about 60 minutes. The price is now hugging the day’s low ($76,171) and is less than $1,000 from the support level of the past 7 days, at $75,736.
What changed since this morning:
The day’s thesis was consolidation between $75,736 and $81,971, with the RSI at 74.6. The top of the range ($81,971) was never even tested — the price turned downward and is now testing the floor. The RSI is still at 74.6, but be careful: it’s calculated using 4-hour closing prices and hasn’t yet reflected this drop. Don’t read that number as strength — it’s lagging.
Levels now:
• Support: $75,736 (7-day low) — the level that decides everything by tomorrow
• Resistance: $81,971, with the 4-hour moving averages coming first: $78,314 (SMA-20) and $78,598 (SMA-50) — the price is below both
• 24-hour volume: $1.58 billion
Verdict: ON HOLD — on the verge of invalidation.
As long as $75,736 holds, the consolidation thesis remains alive, even if wounded. If support breaks before the close, the thesis is invalidated and the outlook shifts to continued downside — with no new support in the data from the past 7 days.
What to watch before the close:
1️⃣ Does $75,736 hold or break? This is tonight’s test.
2️⃣ A recovery above $78,314 would put the price back above the moving averages and ease the immediate pressure.
3️⃣ Volume: a drop on rising volume is more significant than a weak drop.
⚠️ Risk: trading near pressured support is like trying to catch a falling knife. Waiting for confirmation — whether support holds or breaks — takes patience, but avoids the day’s worst mistake: buying the dip too soon.
Do you think $75,736 will hold until tomorrow, or will $BTC test lower levels? 👇
#Bitcoin #CryptoVision
⚠️ $BTC plunged toward support — and the day’s thesis is hanging by a thread
At 4:30 p.m., $BTC was at $79,466. An hour later, it’s at $76,545: down 4.82% in 24 hours, with nearly $2,900 lost in about 60 minutes. The price is now hugging the day’s low ($76,171) and is less than $1,000 from the support level of the past 7 days, at $75,736.
What changed since this morning:
The day’s thesis was consolidation between $75,736 and $81,971, with the RSI at 74.6. The top of the range ($81,971) was never even tested — the price turned downward and is now testing the floor. The RSI is still at 74.6, but be careful: it’s calculated using 4-hour closing prices and hasn’t yet reflected this drop. Don’t read that number as strength — it’s lagging.
Levels now:
• Support: $75,736 (7-day low) — the level that decides everything by tomorrow
• Resistance: $81,971, with the 4-hour moving averages coming first: $78,314 (SMA-20) and $78,598 (SMA-50) — the price is below both
• 24-hour volume: $1.58 billion
Verdict: ON HOLD — on the verge of invalidation.
As long as $75,736 holds, the consolidation thesis remains alive, even if wounded. If support breaks before the close, the thesis is invalidated and the outlook shifts to continued downside — with no new support in the data from the past 7 days.
What to watch before the close:
1️⃣ Does $75,736 hold or break? This is tonight’s test.
2️⃣ A recovery above $78,314 would put the price back above the moving averages and ease the immediate pressure.
3️⃣ Volume: a drop on rising volume is more significant than a weak drop.
⚠️ Risk: trading near pressured support is like trying to catch a falling knife. Waiting for confirmation — whether support holds or breaks — takes patience, but avoids the day’s worst mistake: buying the dip too soon.
Do you think $75,736 will hold until tomorrow, or will $BTC test lower levels? 👇
#Bitcoin #CryptoVision
At 4:30 p.m., $BTC was at $79,466. An hour later, it’s at $76,545: down 4.82% in 24 hours, with nearly $2,900 lost in about 60 minutes. The price is now hugging the day’s low ($76,171) and is less than $1,000 from the support level of the past 7 days, at $75,736.
What changed since this morning:
The day’s thesis was consolidation between $75,736 and $81,971, with the RSI at 74.6. The top of the range ($81,971) was never even tested — the price turned downward and is now testing the floor. The RSI is still at 74.6, but be careful: it’s calculated using 4-hour closing prices and hasn’t yet reflected this drop. Don’t read that number as strength — it’s lagging.
Levels now:
• Support: $75,736 (7-day low) — the level that decides everything by tomorrow
• Resistance: $81,971, with the 4-hour moving averages coming first: $78,314 (SMA-20) and $78,598 (SMA-50) — the price is below both
• 24-hour volume: $1.58 billion
Verdict: ON HOLD — on the verge of invalidation.
As long as $75,736 holds, the consolidation thesis remains alive, even if wounded. If support breaks before the close, the thesis is invalidated and the outlook shifts to continued downside — with no new support in the data from the past 7 days.
What to watch before the close:
1️⃣ Does $75,736 hold or break? This is tonight’s test.
2️⃣ A recovery above $78,314 would put the price back above the moving averages and ease the immediate pressure.
3️⃣ Volume: a drop on rising volume is more significant than a weak drop.
⚠️ Risk: trading near pressured support is like trying to catch a falling knife. Waiting for confirmation — whether support holds or breaks — takes patience, but avoids the day’s worst mistake: buying the dip too soon.
Do you think $75,736 will hold until tomorrow, or will $BTC test lower levels? 👇
#Bitcoin #CryptoVision
45
·
--
🛡️ The math that keeps you in the game (even when you make mistakes)
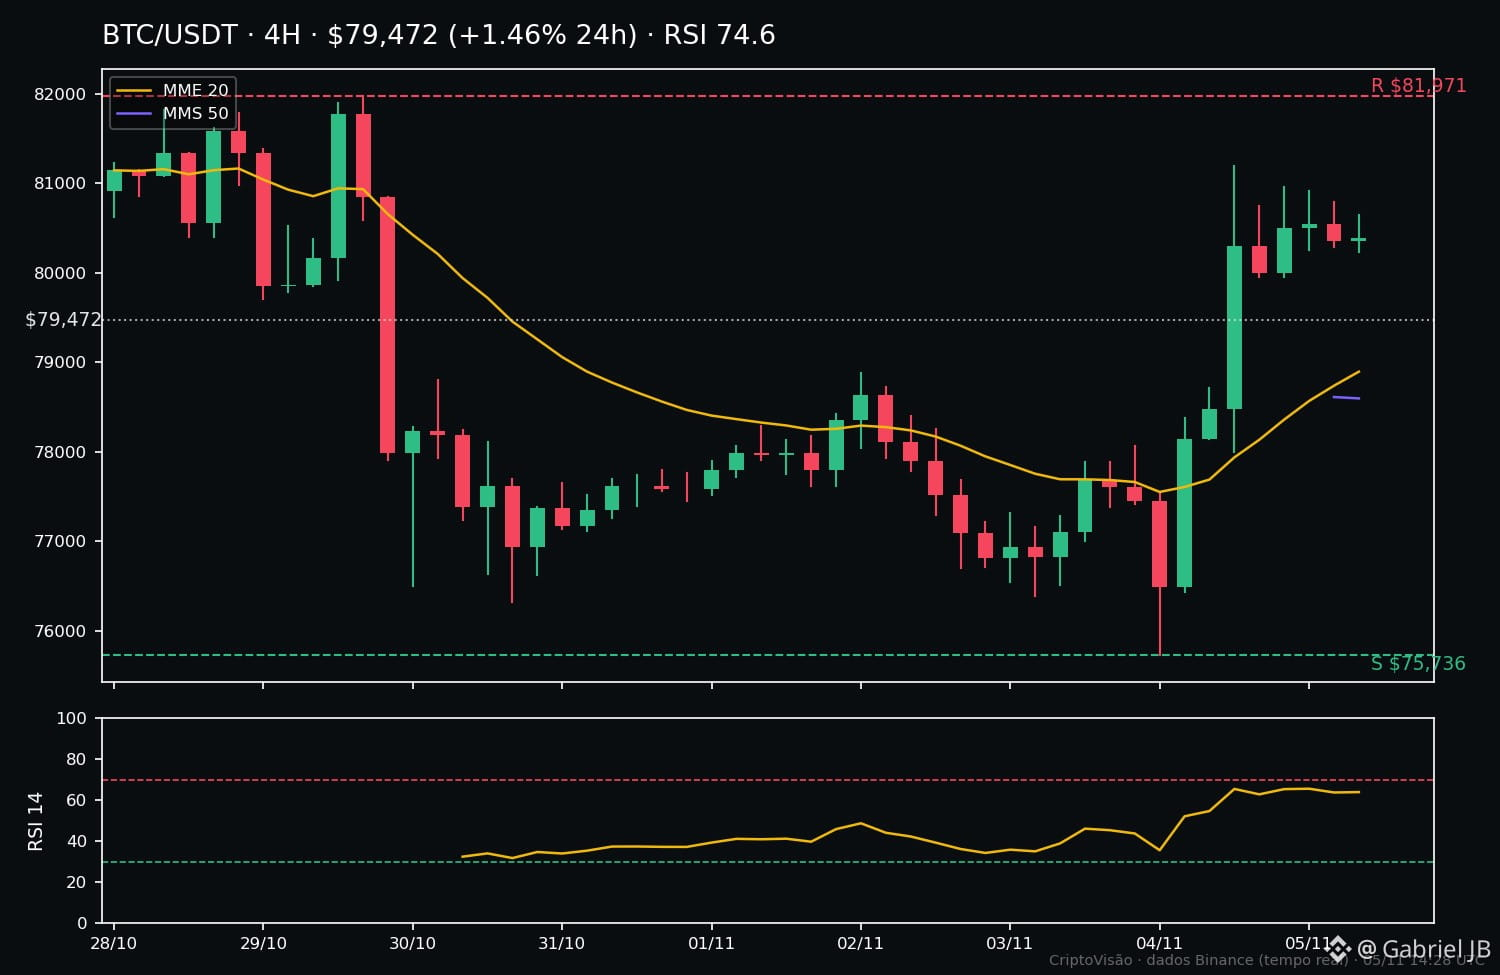
$BTC is at $79.466 today (+1.4% in 24h), between last week's support at $75.736 and resistance at $81.971. RSI at 74.6 — overbought territory. And this is where risk management decides everything.
Let's do the math together, step by step:
1️⃣ Define the risk: $2,000 account, 1% risk per trade = $20. Never more than that per trade.
2️⃣ Set the stop based on structure: below real support, at $75.150 — not just some round number.
3️⃣ Position size comes from the stop: risk per $BTC = $79.466 − $75.150 = $4.316. Position = $20 ÷ $4.316 = 0.0046 BTC (≈ $368). The stop determines the size — never a hunch.
4️⃣ Test the risk/reward: up to resistance, the potential gain is $81.971 − $79.466 = $2.505. R:R = 0.58:1. Below the minimum of 1.5:1 — this entry, at this price, FAILS. Waiting is also a decision.
And watch out for correlation: $BTC, $ETH and $SOL almost always move together. Three 1% positions in correlated coins aren't three 1% risks — they're ~3% in a single bet.
With 1% per trade, 10 consecutive stops cost ~10% of your account, and you stay in the game. Going all-in ends with the first mistake. Preserving capital is strategy No. 1 — the market will be here tomorrow.
What's your risk rule per trade: 1% or 2%? 👇
#Bitcoin #GestaoDeRisco #CryptoVision
🛡️ The math that keeps you in the game (even when you make mistakes)
$BTC is at $79.466 today (+1.4% in 24h), between last week's support at $75.736 and resistance at $81.971. RSI at 74.6 — overbought territory. And this is where risk management decides everything.
Let's do the math together, step by step:
1️⃣ Define the risk: $2,000 account, 1% risk per trade = $20. Never more than that per trade.
2️⃣ Set the stop based on structure: below real support, at $75.150 — not just some round number.
3️⃣ Position size comes from the stop: risk per $BTC = $79.466 − $75.150 = $4.316. Position = $20 ÷ $4.316 = 0.0046 BTC (≈ $368). The stop determines the size — never a hunch.
4️⃣ Test the risk/reward: up to resistance, the potential gain is $81.971 − $79.466 = $2.505. R:R = 0.58:1. Below the minimum of 1.5:1 — this entry, at this price, FAILS. Waiting is also a decision.
And watch out for correlation: $BTC , $ETH and $SOL almost always move together. Three 1% positions in correlated coins aren't three 1% risks — they're ~3% in a single bet.
With 1% per trade, 10 consecutive stops cost ~10% of your account, and you stay in the game. Going all-in ends with the first mistake. Preserving capital is strategy No. 1 — the market will be here tomorrow.
What's your risk rule per trade: 1% or 2%? 👇
#Bitcoin #GestaoDeRisco #CryptoVision
$BTC is at $79.466 today (+1.4% in 24h), between last week's support at $75.736 and resistance at $81.971. RSI at 74.6 — overbought territory. And this is where risk management decides everything.
Let's do the math together, step by step:
1️⃣ Define the risk: $2,000 account, 1% risk per trade = $20. Never more than that per trade.
2️⃣ Set the stop based on structure: below real support, at $75.150 — not just some round number.
3️⃣ Position size comes from the stop: risk per $BTC = $79.466 − $75.150 = $4.316. Position = $20 ÷ $4.316 = 0.0046 BTC (≈ $368). The stop determines the size — never a hunch.
4️⃣ Test the risk/reward: up to resistance, the potential gain is $81.971 − $79.466 = $2.505. R:R = 0.58:1. Below the minimum of 1.5:1 — this entry, at this price, FAILS. Waiting is also a decision.
And watch out for correlation: $BTC , $ETH and $SOL almost always move together. Three 1% positions in correlated coins aren't three 1% risks — they're ~3% in a single bet.
With 1% per trade, 10 consecutive stops cost ~10% of your account, and you stay in the game. Going all-in ends with the first mistake. Preserving capital is strategy No. 1 — the market will be here tomorrow.
What's your risk rule per trade: 1% or 2%? 👇
#Bitcoin #GestaoDeRisco #CryptoVision
28
·
--
XRP at resistance’s doorstep: the $1.34 test will decide what comes next 📊
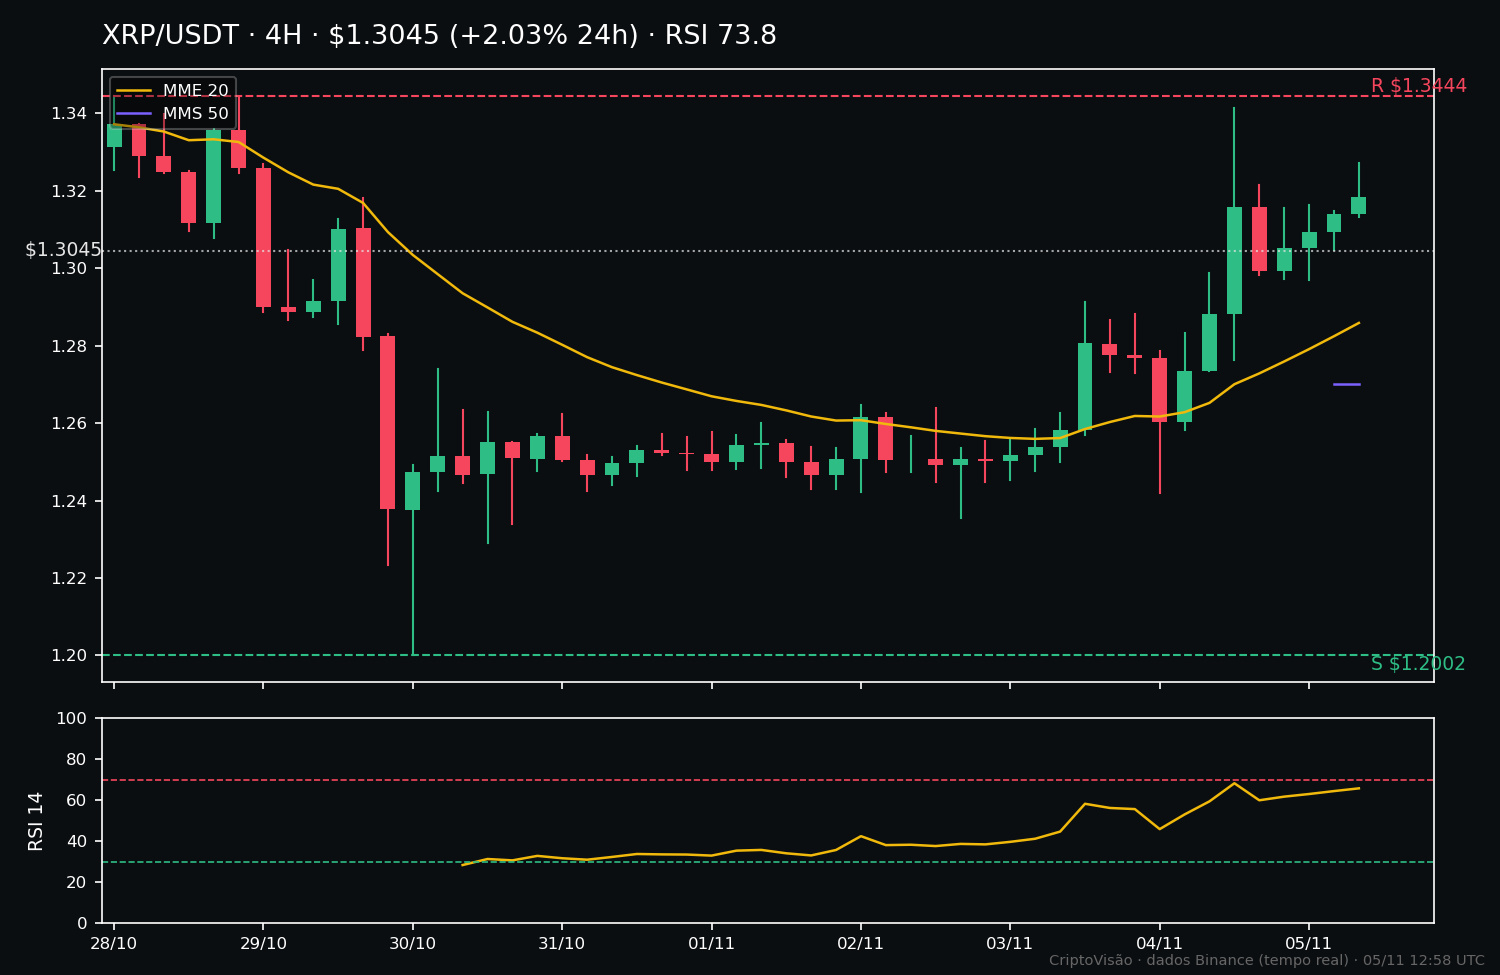
SITUATION — $XRP is trading at $1.30, up 2.1% in the last 24 hours, but still 1.4% below its price 7 days ago. It is above the 20- and 50-period averages (4h), with the RSI-14 at 73.8 — overbought territory. The short-term move is positive, but the price is approaching the test already “stretched.”
LEVELS — Resistance: $1.34 (the 7-day high; it has already touched $1.34 today). Support: $1.28 (20-period average) and $1.20 (the 7-day low).
SCENARIO A — A 4h close above $1.34 with volume opens the way to test the $1.40–$1.45 zone.
SCENARIO B — Rejection at $1.34: a natural pullback to $1.28 and, if that level breaks, to $1.20.
WHAT WOULD CONFIRM IT — In scenario A, a 4h candle close above $1.34 with above-average volume. In scenario B, a rejection candle (long upper wick) at $1.34.
RISK — An overbought RSI is not, by itself, a sell signal, but it’s a warning: buying right at resistance means paying the highest price of the week. And remember: altcoins are more volatile and have wider spreads than BTC — your stop needs room to breathe, or noise may sweep it away.
CONCLUSION — $XRP is at a decision point, not an automatic entry. Waiting for the 4h close is cheaper than guessing.
What do you think: will $XRP break through $1.34 this week, or get rejected again? 👇
#XRP #CriptoVisao #TechnicalAnalysis
XRP at resistance’s doorstep: the $1.34 test will decide what comes next 📊
SITUATION — $XRP is trading at $1.30, up 2.1% in the last 24 hours, but still 1.4% below its price 7 days ago. It is above the 20- and 50-period averages (4h), with the RSI-14 at 73.8 — overbought territory. The short-term move is positive, but the price is approaching the test already “stretched.”
LEVELS — Resistance: $1.34 (the 7-day high; it has already touched $1.34 today). Support: $1.28 (20-period average) and $1.20 (the 7-day low).
SCENARIO A — A 4h close above $1.34 with volume opens the way to test the $1.40–$1.45 zone.
SCENARIO B — Rejection at $1.34: a natural pullback to $1.28 and, if that level breaks, to $1.20.
WHAT WOULD CONFIRM IT — In scenario A, a 4h candle close above $1.34 with above-average volume. In scenario B, a rejection candle (long upper wick) at $1.34.
RISK — An overbought RSI is not, by itself, a sell signal, but it’s a warning: buying right at resistance means paying the highest price of the week. And remember: altcoins are more volatile and have wider spreads than BTC — your stop needs room to breathe, or noise may sweep it away.
CONCLUSION — $XRP is at a decision point, not an automatic entry. Waiting for the 4h close is cheaper than guessing.
What do you think: will $XRP break through $1.34 this week, or get rejected again? 👇
#XRP #CriptoVisao #TechnicalAnalysis
SITUATION — $XRP is trading at $1.30, up 2.1% in the last 24 hours, but still 1.4% below its price 7 days ago. It is above the 20- and 50-period averages (4h), with the RSI-14 at 73.8 — overbought territory. The short-term move is positive, but the price is approaching the test already “stretched.”
LEVELS — Resistance: $1.34 (the 7-day high; it has already touched $1.34 today). Support: $1.28 (20-period average) and $1.20 (the 7-day low).
SCENARIO A — A 4h close above $1.34 with volume opens the way to test the $1.40–$1.45 zone.
SCENARIO B — Rejection at $1.34: a natural pullback to $1.28 and, if that level breaks, to $1.20.
WHAT WOULD CONFIRM IT — In scenario A, a 4h candle close above $1.34 with above-average volume. In scenario B, a rejection candle (long upper wick) at $1.34.
RISK — An overbought RSI is not, by itself, a sell signal, but it’s a warning: buying right at resistance means paying the highest price of the week. And remember: altcoins are more volatile and have wider spreads than BTC — your stop needs room to breathe, or noise may sweep it away.
CONCLUSION — $XRP is at a decision point, not an automatic entry. Waiting for the 4h close is cheaper than guessing.
What do you think: will $XRP break through $1.34 this week, or get rejected again? 👇
#XRP #CriptoVisao #TechnicalAnalysis
15
·
--
⚠️ Today’s $BTC mistake: buying the breakout before it happens
$BTC is at 80.375,90 USD (+2,42% in 24h) and pushing toward resistance at 81.971 USD, the high for the last 7 days. The RSI-14 is at 74,9 — overbought territory. The temptation is to get in now, “before it takes off.”
The mistake: confusing a wick with a close. A move above 81.971 USD during a 4h candle isn’t a breakout — it’s just a wick. Without a 4h close above that level, there’s no confirmation at all. Anyone who buys the wick pays the top price and ends up holding through the correction down to support at 75.736 USD.
The simple rule: wait for a 4h close above 81.971 USD. No close, no entry. And set your stop before entering — never after the position is already in the red.
Risk management first: no trade is worth all your capital.
Have you ever bought a “breakout” that turned out to be just a wick? Tell us in the comments 👇
$BTC
#Bitcoin #Trading #CriptoVisao
⚠️ Today’s $BTC mistake: buying the breakout before it happens
$BTC is at 80.375,90 USD (+2,42% in 24h) and pushing toward resistance at 81.971 USD, the high for the last 7 days. The RSI-14 is at 74,9 — overbought territory. The temptation is to get in now, “before it takes off.”
The mistake: confusing a wick with a close. A move above 81.971 USD during a 4h candle isn’t a breakout — it’s just a wick. Without a 4h close above that level, there’s no confirmation at all. Anyone who buys the wick pays the top price and ends up holding through the correction down to support at 75.736 USD.
The simple rule: wait for a 4h close above 81.971 USD. No close, no entry. And set your stop before entering — never after the position is already in the red.
Risk management first: no trade is worth all your capital.
Have you ever bought a “breakout” that turned out to be just a wick? Tell us in the comments 👇
$BTC
#Bitcoin #Trading #CriptoVisao
$BTC is at 80.375,90 USD (+2,42% in 24h) and pushing toward resistance at 81.971 USD, the high for the last 7 days. The RSI-14 is at 74,9 — overbought territory. The temptation is to get in now, “before it takes off.”
The mistake: confusing a wick with a close. A move above 81.971 USD during a 4h candle isn’t a breakout — it’s just a wick. Without a 4h close above that level, there’s no confirmation at all. Anyone who buys the wick pays the top price and ends up holding through the correction down to support at 75.736 USD.
The simple rule: wait for a 4h close above 81.971 USD. No close, no entry. And set your stop before entering — never after the position is already in the red.
Risk management first: no trade is worth all your capital.
Have you ever bought a “breakout” that turned out to be just a wick? Tell us in the comments 👇
$BTC
#Bitcoin #Trading #CriptoVisao
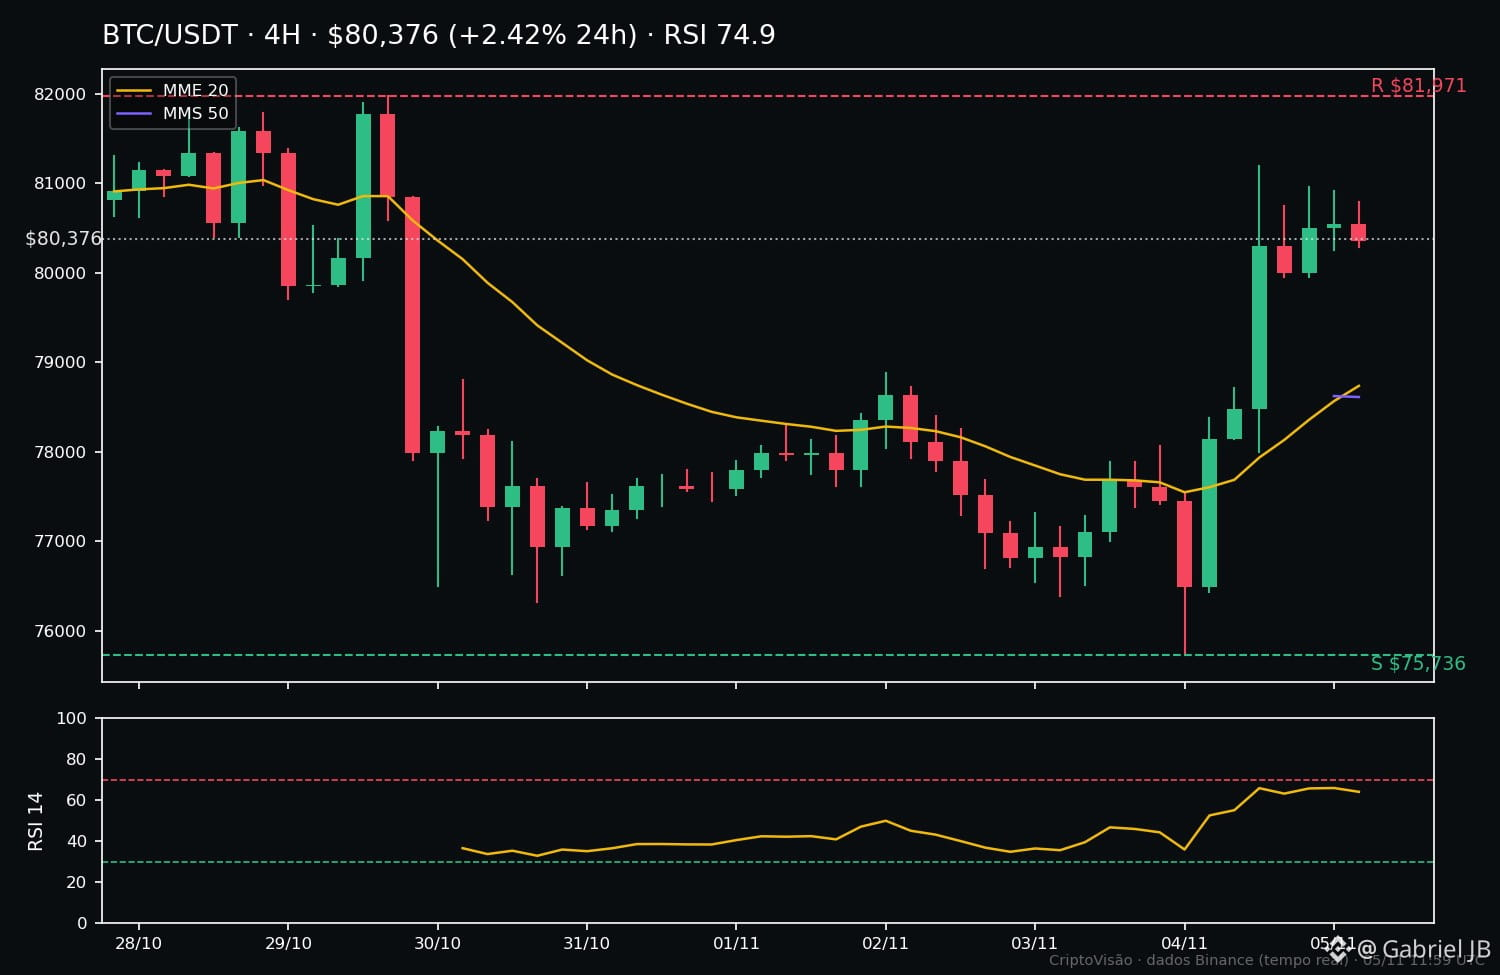
31
·
--
📊 $ETH gains ground on $BTC —but the RSI is already warning: overbought
SITUATION: $ETH is at $2,420, up 3.8% in 24 hours and 2.8% in 7 days, above the 20- and 50-period averages (4h). $BTC rose less: up 2.4% in 24 hours and down 0.7% in 7 days. ETH is showing real relative strength—but the RSI-14 is at 75.5, in overbought territory, and the price is approaching the 7-day high.
LEVELS
Resistance: $2,450 (7-day high)
Support: $2,310 (24-hour low, near the SMA-20)
Major support: $2,174 (7-day low)
SCENARIO A — Continuation: a 4-hour close above $2,450, accompanied by volume, opens the door to testing new weekly highs.
SCENARIO B — Rejection: loss of momentum near $2,450 and a correction to $2,310; losing this support invalidates the short-term momentum.
WHAT WOULD CONFIRM IT: in scenario A, a 4-hour close above $2,450; in scenario B, a rejection candle at the high or a close below $2,310.
RISK: RSI is overbought for both coins ($BTC is also at 74.9). Vertical rallies without a pause often correct—chasing the price here is the most common mistake. Risk management first: size your position and set a stop before entering.
CONCLUSION: the short-term trend favors ETH, with real relative strength against $BTC —but the ideal entry has already passed; the market is now calling for confirmation, not haste.
Do you think $ETH will close the week above $2,450? 👇
#Ethereum #CryptoVision
📊 $ETH gains ground on $BTC —but the RSI is already warning: overbought
SITUATION: $ETH is at $2,420, up 3.8% in 24 hours and 2.8% in 7 days, above the 20- and 50-period averages (4h). $BTC rose less: up 2.4% in 24 hours and down 0.7% in 7 days. ETH is showing real relative strength—but the RSI-14 is at 75.5, in overbought territory, and the price is approaching the 7-day high.
LEVELS
Resistance: $2,450 (7-day high)
Support: $2,310 (24-hour low, near the SMA-20)
Major support: $2,174 (7-day low)
SCENARIO A — Continuation: a 4-hour close above $2,450, accompanied by volume, opens the door to testing new weekly highs.
SCENARIO B — Rejection: loss of momentum near $2,450 and a correction to $2,310; losing this support invalidates the short-term momentum.
WHAT WOULD CONFIRM IT: in scenario A, a 4-hour close above $2,450; in scenario B, a rejection candle at the high or a close below $2,310.
RISK: RSI is overbought for both coins ($BTC is also at 74.9). Vertical rallies without a pause often correct—chasing the price here is the most common mistake. Risk management first: size your position and set a stop before entering.
CONCLUSION: the short-term trend favors ETH, with real relative strength against $BTC —but the ideal entry has already passed; the market is now calling for confirmation, not haste.
Do you think $ETH will close the week above $2,450? 👇
#Ethereum #CryptoVision
SITUATION: $ETH is at $2,420, up 3.8% in 24 hours and 2.8% in 7 days, above the 20- and 50-period averages (4h). $BTC rose less: up 2.4% in 24 hours and down 0.7% in 7 days. ETH is showing real relative strength—but the RSI-14 is at 75.5, in overbought territory, and the price is approaching the 7-day high.
LEVELS
Resistance: $2,450 (7-day high)
Support: $2,310 (24-hour low, near the SMA-20)
Major support: $2,174 (7-day low)
SCENARIO A — Continuation: a 4-hour close above $2,450, accompanied by volume, opens the door to testing new weekly highs.
SCENARIO B — Rejection: loss of momentum near $2,450 and a correction to $2,310; losing this support invalidates the short-term momentum.
WHAT WOULD CONFIRM IT: in scenario A, a 4-hour close above $2,450; in scenario B, a rejection candle at the high or a close below $2,310.
RISK: RSI is overbought for both coins ($BTC is also at 74.9). Vertical rallies without a pause often correct—chasing the price here is the most common mistake. Risk management first: size your position and set a stop before entering.
CONCLUSION: the short-term trend favors ETH, with real relative strength against $BTC —but the ideal entry has already passed; the market is now calling for confirmation, not haste.
Do you think $ETH will close the week above $2,450? 👇
#Ethereum #CryptoVision
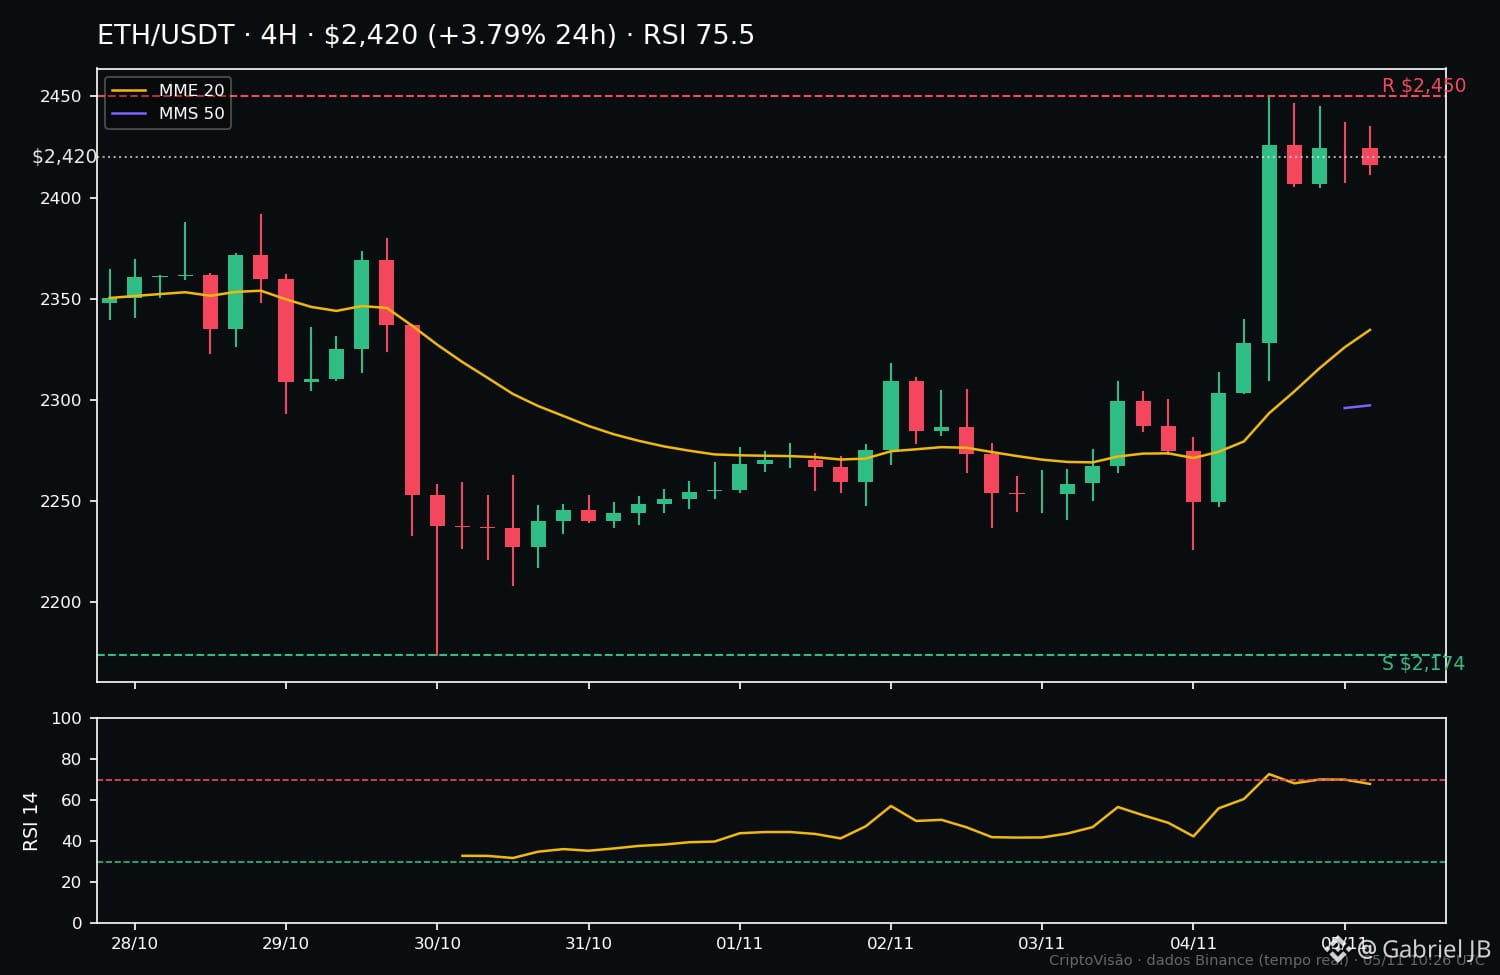
157
·
--
$ETH has already broken through one level—and now it’s testing the next ⚠️
Yesterday, $ETH was eyeing resistance at USD 2,391.55. Today it’s trading at USD 2,412.77 (+4.16% in 24h)—above that level—and testing the next resistance: USD 2,450, the 7-day high. Today’s data, November 5, via Binance.
But there’s a warning on the chart: the RSI-14 is at 75.5, in overbought territory. A breakout in overbought territory calls for double confirmation.
The breakout strategy rule remains unchanged: only a 4h candle close above USD 2,450 counts. A wick that touches the level and closes below it is the classic false-breakout trap—anyone who enters at the peak gets stuck when the price falls back into the range.
If the close confirms above USD 2,450, the continuation scenario gains strength; if it gets rejected, the invalidation is clear and the range remains in control. In an educational example, a trader would place the stop below the broken level—and never risk more on a single trade than they’re willing to lose. The 7-day support is at USD 2,174.08.
No confirmation, no entry. What about you—do you enter at the candle close or wait for a retest?
#Ethereum #CryptoVision
$ETH has already broken through one level—and now it’s testing the next ⚠️
Yesterday, $ETH was eyeing resistance at USD 2,391.55. Today it’s trading at USD 2,412.77 (+4.16% in 24h)—above that level—and testing the next resistance: USD 2,450, the 7-day high. Today’s data, November 5, via Binance.
But there’s a warning on the chart: the RSI-14 is at 75.5, in overbought territory. A breakout in overbought territory calls for double confirmation.
The breakout strategy rule remains unchanged: only a 4h candle close above USD 2,450 counts. A wick that touches the level and closes below it is the classic false-breakout trap—anyone who enters at the peak gets stuck when the price falls back into the range.
If the close confirms above USD 2,450, the continuation scenario gains strength; if it gets rejected, the invalidation is clear and the range remains in control. In an educational example, a trader would place the stop below the broken level—and never risk more on a single trade than they’re willing to lose. The 7-day support is at USD 2,174.08.
No confirmation, no entry. What about you—do you enter at the candle close or wait for a retest?
#Ethereum #CryptoVision
Yesterday, $ETH was eyeing resistance at USD 2,391.55. Today it’s trading at USD 2,412.77 (+4.16% in 24h)—above that level—and testing the next resistance: USD 2,450, the 7-day high. Today’s data, November 5, via Binance.
But there’s a warning on the chart: the RSI-14 is at 75.5, in overbought territory. A breakout in overbought territory calls for double confirmation.
The breakout strategy rule remains unchanged: only a 4h candle close above USD 2,450 counts. A wick that touches the level and closes below it is the classic false-breakout trap—anyone who enters at the peak gets stuck when the price falls back into the range.
If the close confirms above USD 2,450, the continuation scenario gains strength; if it gets rejected, the invalidation is clear and the range remains in control. In an educational example, a trader would place the stop below the broken level—and never risk more on a single trade than they’re willing to lose. The 7-day support is at USD 2,174.08.
No confirmation, no entry. What about you—do you enter at the candle close or wait for a retest?
#Ethereum #CryptoVision
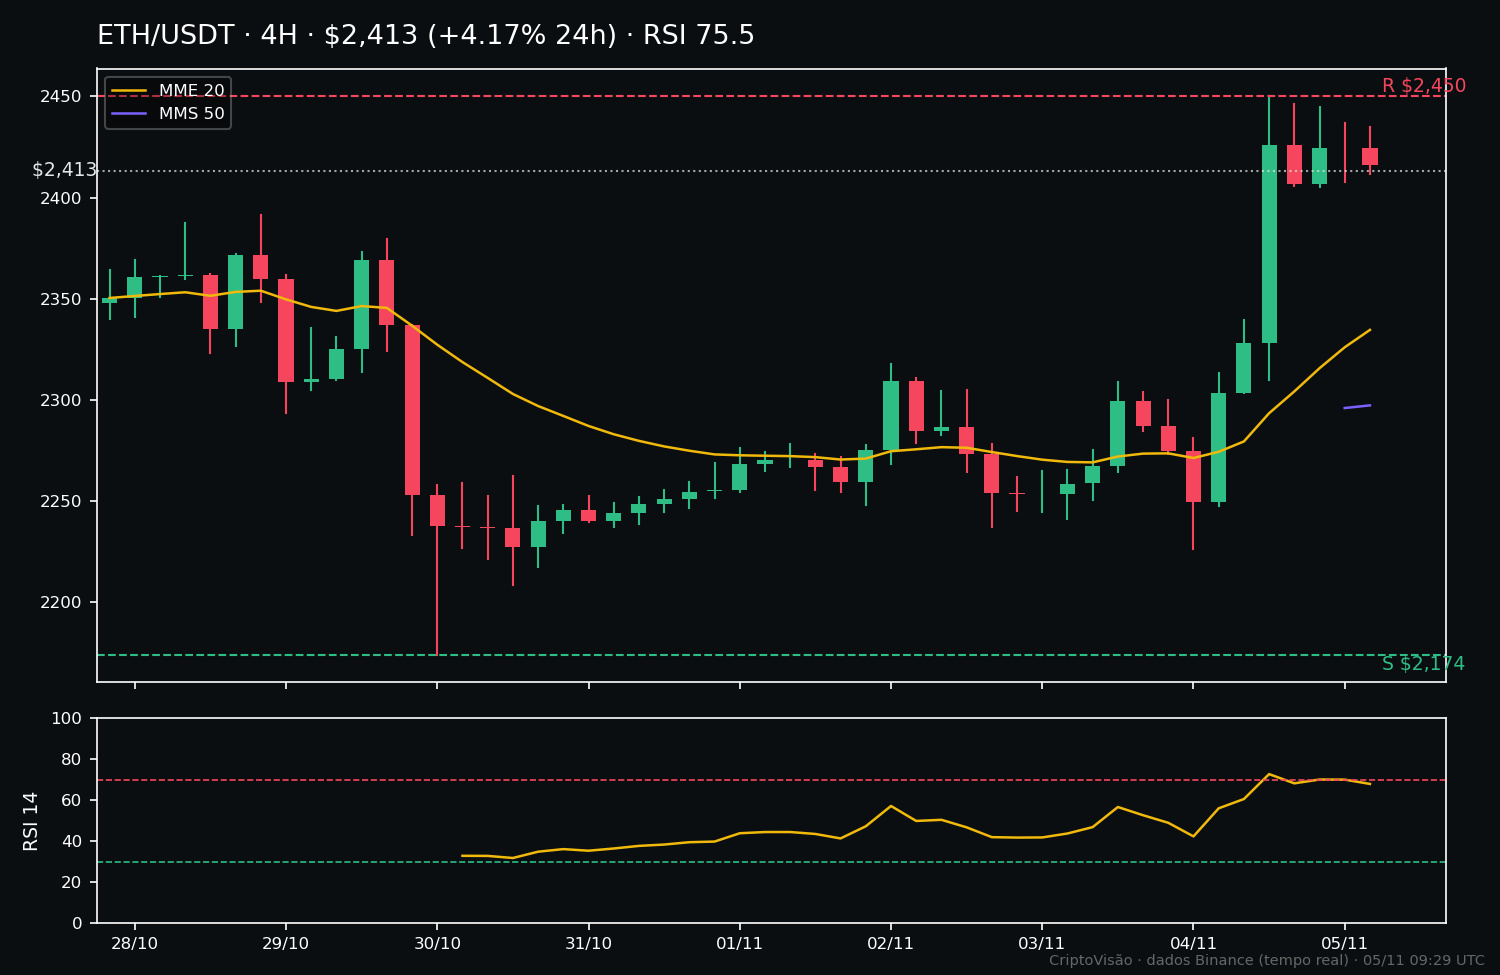
45
Log in to explore more content
Join global crypto users on Binance Square
⚡️ Get latest and useful information about crypto.
💬 Trusted by the world’s largest crypto exchange.
👍 Discover real insights from verified creators.
Email / Phone number
Trending Topics
BitcoinRebounds$75KAsChipsLead
9,992 views
142 Discussing
Market Watch | Bitcoin Rebounds to $75,600 After Dip Below $75,000 as Chip Stocks Lead Rally on Jobs Beat
Binance News
·17 Likes
·5.1k views
JobsReportRaisesHikeOdds
127,123 views
1,109 Discussing
US Data Center Rules May Constrain AI Expansion
18,771 views
109 Discussing