ETH is leaning on the weekly support — and the next move depends on this test 📊
SITUATION
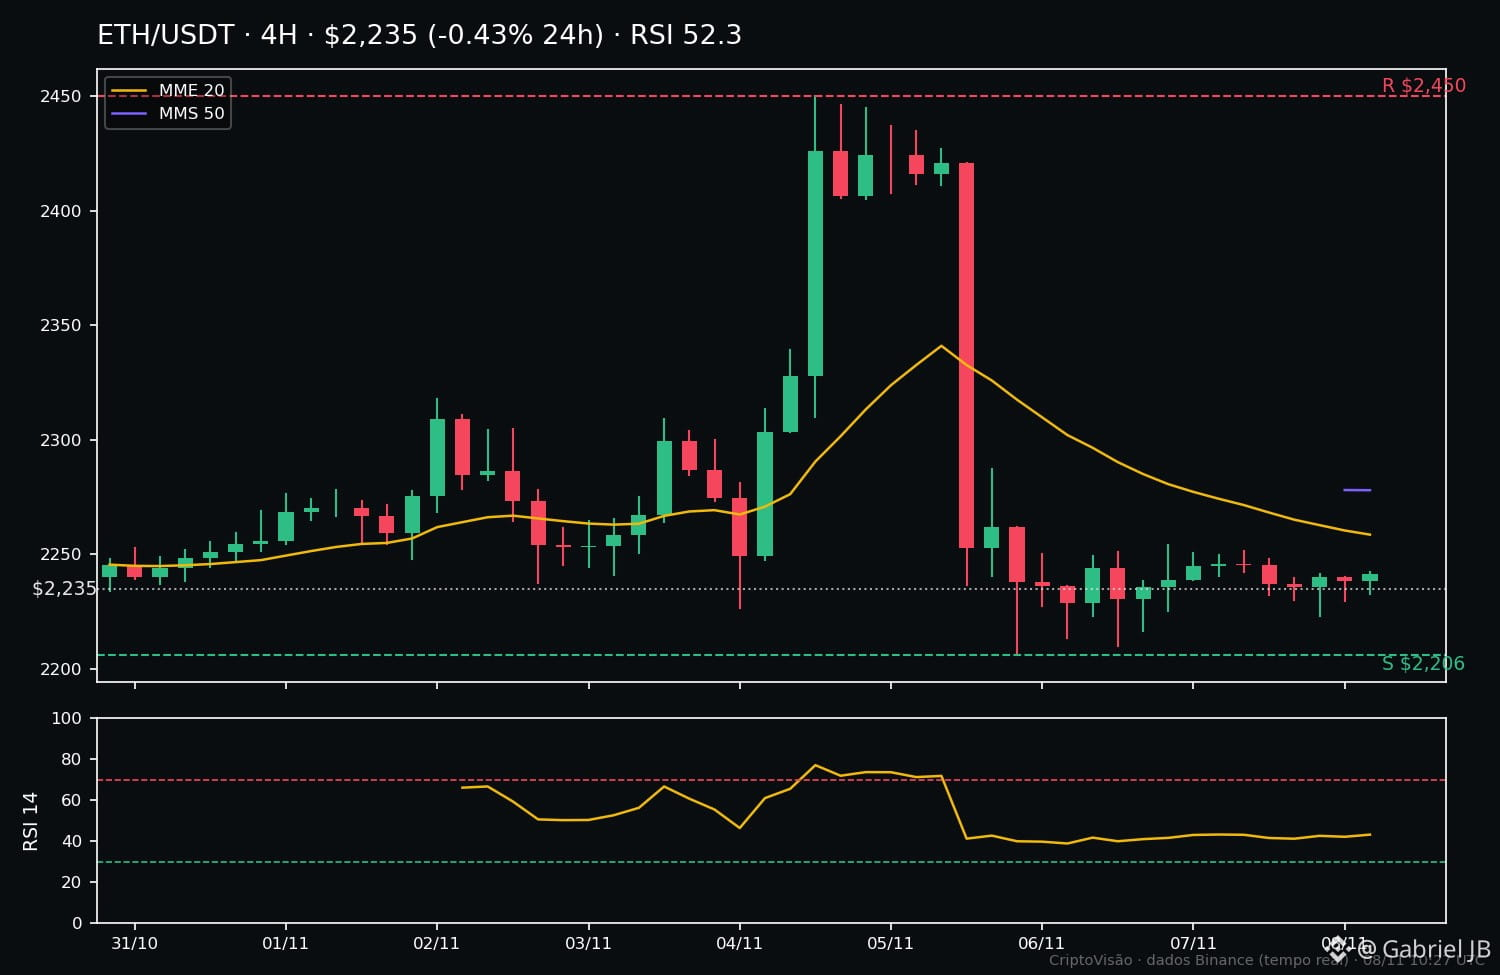
$ETH is trading at US$ 2.234,69, down 0,47% in 24 hours and practically flat for the week (-0,18%). The price is below the 20- and 50-period moving averages on the 4-hour chart (US$ 2.267,88 and US$ 2.278,04), and the RSI-14 is at 52,3 — neutral, with neither oversold conditions nor euphoria. In short: the market has no clear direction, compressed near support.
LEVELS
• Support: US$ 2.206,28 (weekly low) — the price is only 1,3% above it
• Immediate resistance: US$ 2.267,88 (20-period moving average)
• Weekly resistance: US$ 2.450,00 (high of the last 7 days)
$ETH vs $BTC
$BTC is also below the moving averages on the 4-hour chart, but is falling less today (-0,15% versus -0,47% for ETH). For the week, however, ETH is holding up better: -0,18% versus -1,8% for BTC. In other words: relative weakness today, relative resilience for the week. Neither has a defined trend.
SCENARIO A — Support holds
If ETH holds US$ 2.206 and closes back above US$ 2.268, the recovery scenario gains strength, with the US$ 2.450 zone as the weekly reference.
SCENARIO B — Support breaks
A 4-hour close below US$ 2.206 would invalidate the defense and open the door to new weekly lows, with no immediate technical support on the chart.
WHAT WOULD CONFIRM IT
• Scenario A: 4-hour close above US$ 2.268, with the RSI rising
• Scenario B: 4-hour close below US$ 2.206, with an increase in selling volume
RISK
Buying right at support without confirmation means betting on it holding before that happens — and if support breaks, the decline tends to accelerate. Risk management first: size your position and define your invalidation level before entering.
CONCLUSION
ETH is at a decision point, neither euphoric nor panicked. The US$ 2.206 support is the line separating consolidation from a continuation of the decline. What do you think: will support hold or break this week? 👇
#Ethereum #CriptoVisao #TechnicalAnalysis
SITUATION
$ETH is trading at US$ 2.234,69, down 0,47% in 24 hours and practically flat for the week (-0,18%). The price is below the 20- and 50-period moving averages on the 4-hour chart (US$ 2.267,88 and US$ 2.278,04), and the RSI-14 is at 52,3 — neutral, with neither oversold conditions nor euphoria. In short: the market has no clear direction, compressed near support.
LEVELS
• Support: US$ 2.206,28 (weekly low) — the price is only 1,3% above it
• Immediate resistance: US$ 2.267,88 (20-period moving average)
• Weekly resistance: US$ 2.450,00 (high of the last 7 days)
$ETH vs $BTC
$BTC is also below the moving averages on the 4-hour chart, but is falling less today (-0,15% versus -0,47% for ETH). For the week, however, ETH is holding up better: -0,18% versus -1,8% for BTC. In other words: relative weakness today, relative resilience for the week. Neither has a defined trend.
SCENARIO A — Support holds
If ETH holds US$ 2.206 and closes back above US$ 2.268, the recovery scenario gains strength, with the US$ 2.450 zone as the weekly reference.
SCENARIO B — Support breaks
A 4-hour close below US$ 2.206 would invalidate the defense and open the door to new weekly lows, with no immediate technical support on the chart.
WHAT WOULD CONFIRM IT
• Scenario A: 4-hour close above US$ 2.268, with the RSI rising
• Scenario B: 4-hour close below US$ 2.206, with an increase in selling volume
RISK
Buying right at support without confirmation means betting on it holding before that happens — and if support breaks, the decline tends to accelerate. Risk management first: size your position and define your invalidation level before entering.
CONCLUSION
ETH is at a decision point, neither euphoric nor panicked. The US$ 2.206 support is the line separating consolidation from a continuation of the decline. What do you think: will support hold or break this week? 👇
#Ethereum #CriptoVisao #TechnicalAnalysis