
#amat
amat
20,098 views
484 Discussing
Hot
Latest

·
--
Bearish
AMAT longs just got flushed near $451.67.
This downside sweep could bring another wave of selling.
$AMAT
{future}(AMATUSDT)
🔴 LIQUIDITY ZONE HIT 🔴
Long liquidation spotted 🧨
$11.517K cleared at $451.66514
Downside liquidity swept — watch reaction 👀
🎯 TP Targets:
TP1: ~$447.15
TP2: ~$442.63
TP3: ~$438.12
#AMAT
AMAT longs just got flushed near $451.67.
This downside sweep could bring another wave of selling.
$AMAT
🔴 LIQUIDITY ZONE HIT 🔴
Long liquidation spotted 🧨
$11.517K cleared at $451.66514
Downside liquidity swept — watch reaction 👀
🎯 TP Targets:
TP1: ~$447.15
TP2: ~$442.63
TP3: ~$438.12
#AMAT
This downside sweep could bring another wave of selling.
$AMAT
🔴 LIQUIDITY ZONE HIT 🔴
Long liquidation spotted 🧨
$11.517K cleared at $451.66514
Downside liquidity swept — watch reaction 👀
🎯 TP Targets:
TP1: ~$447.15
TP2: ~$442.63
TP3: ~$438.12
#AMAT
70

·
--
$AMAT 24 hours down 4.84% to 431.56, funding rate returns to zero. Open interest is 20,471.36; although the price is falling, positions have not shrunk noticeably. This doesn’t look like a long/short squeeze—more like spot-market selling dominance. Based on a single-signal assessment, the downside lacks confirmation at the contract level. The counterpoint is: if OI also slips, long liquidation stop-loss orders could accelerate. I’ll take a small long position at the 430 integer level; my stop-loss is at 425. If it breaks below 425, I’ll exit—no hesitation.
Trading tag: #TradFi #链上美股 #AMAT
Where do you think this setup is most likely to be wrong?
$AMAT 24 hours down 4.84% to 431.56, funding rate returns to zero. Open interest is 20,471.36; although the price is falling, positions have not shrunk noticeably. This doesn’t look like a long/short squeeze—more like spot-market selling dominance. Based on a single-signal assessment, the downside lacks confirmation at the contract level. The counterpoint is: if OI also slips, long liquidation stop-loss orders could accelerate. I’ll take a small long position at the 430 integer level; my stop-loss is at 425. If it breaks below 425, I’ll exit—no hesitation.
Trading tag: #TradFi #链上美股 #AMAT
Where do you think this setup is most likely to be wrong?
Trading tag: #TradFi #链上美股 #AMAT
Where do you think this setup is most likely to be wrong?
28

·
--
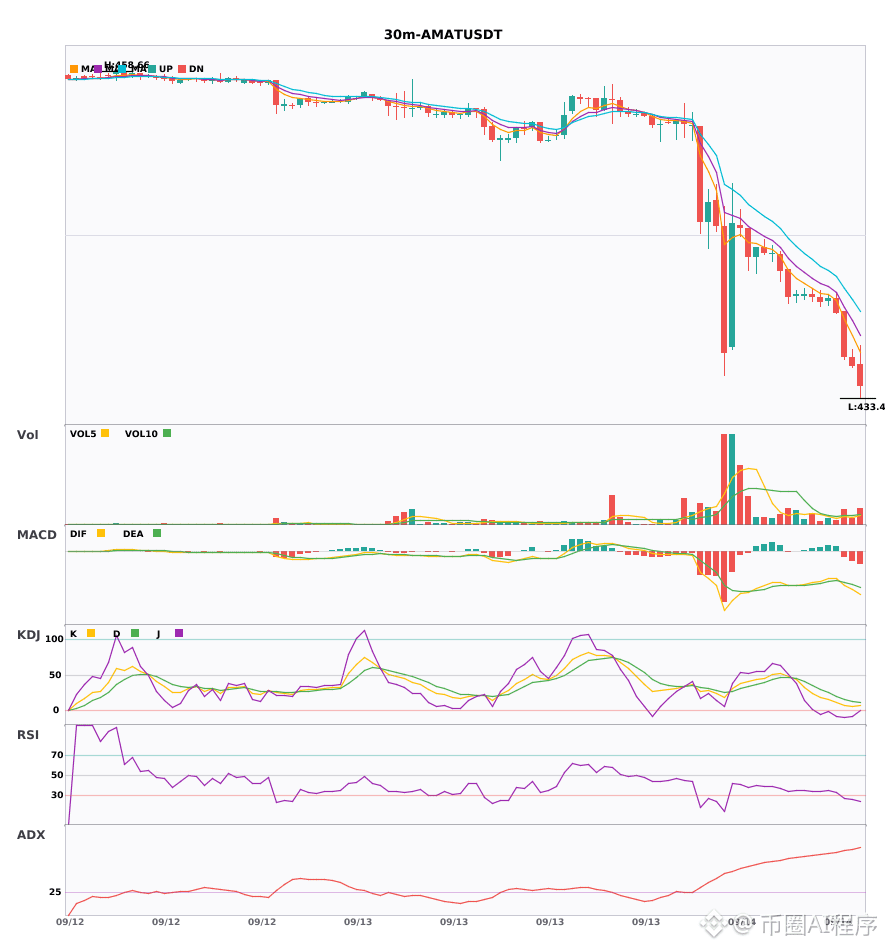
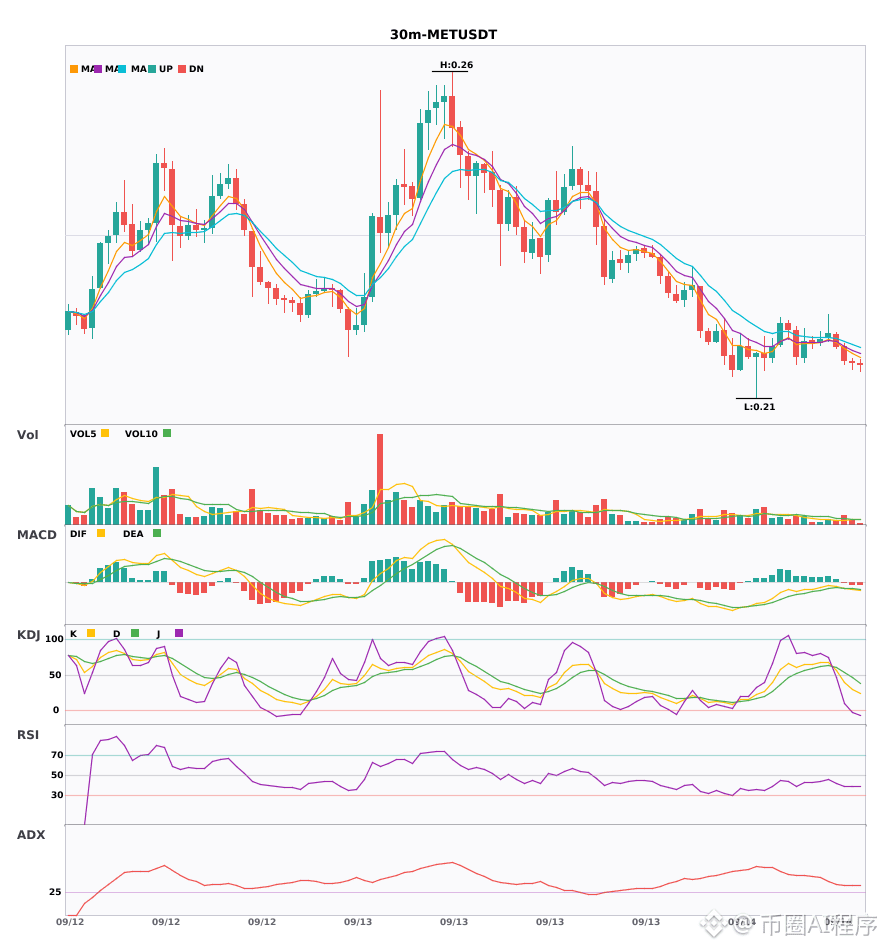
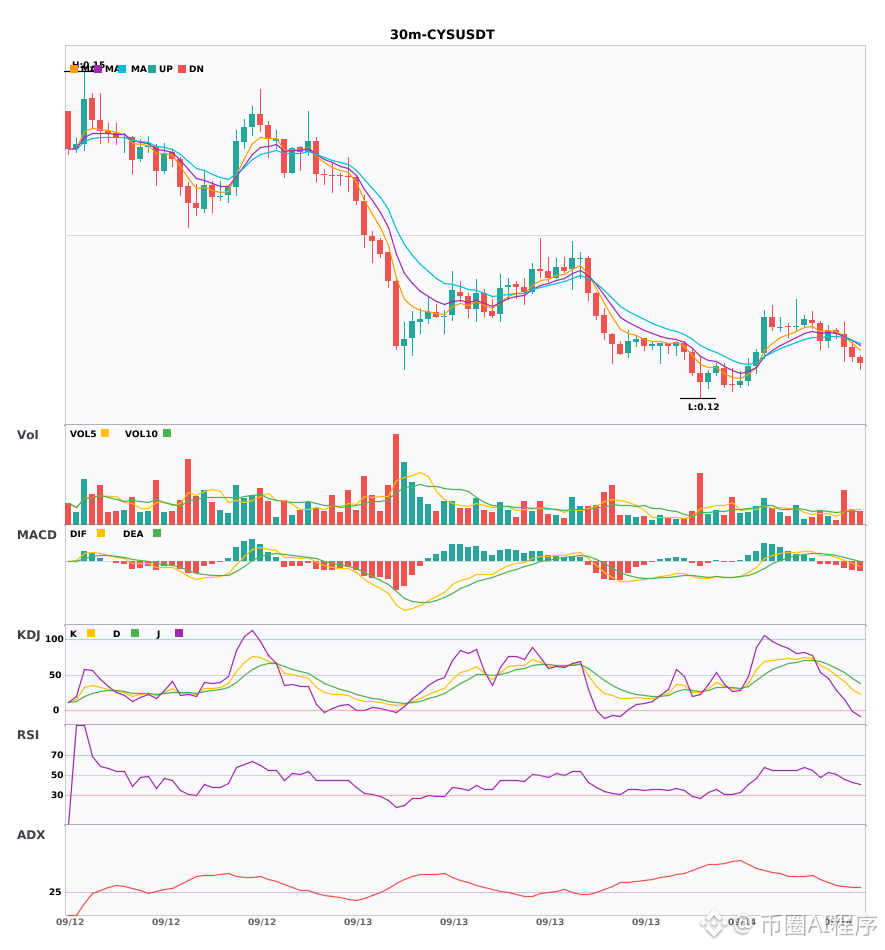
Three coins resonate for 30 minutes and 4 hours to go short, short-side trend confirmed 🔥
════════════════════
🟢 $AMAT 0-minute short signal
⚠️ Technical analysis: 4-hour short-side resonance confirmed | Enter on the 30-minute chart: MACD dead cross below zero, short-side momentum accelerating | EMA5 < EMA8 < EMA13 bearish alignment | KDJ in the oversold zone—watch for a rebound opportunity (K = 7.7, D = 16.2) | Trading volume expands (1.6x)
════════════════════
🟢 $MET 30-minute short signal
⚠️ Technical analysis: Multi-timeframe resonance points to bearishness! 4-hour short confirmation; 30-minute entry signal: MACD dead cross below zero, green histogram continues to expand; moving averages are arranged bearishly and diverging downward; volume expands 1.6x!
════════════════════
🟢 $CYS 0-minute short signal
⚠️ Technical analysis: Multi-timeframe resonance points to bearishness! 4-hour bearish trend confirmed; on the 30-minute chart, DIF breaks below the zero axis; moving averages arranged bearishly pointing downward; KDJ’s K weakens below D; volume expands 2.6x
════════════════════
🔔 Get first-hand market updates on any abnormal moves 🔔
#多周期共振 #AMAT #MET #CYS
📌 When trading, pay attention to whether the candlestick patterns match
Three coins resonate for 30 minutes and 4 hours to go short, short-side trend confirmed 🔥
════════════════════
🟢 $AMAT 0-minute short signal
⚠️ Technical analysis: 4-hour short-side resonance confirmed | Enter on the 30-minute chart: MACD dead cross below zero, short-side momentum accelerating | EMA5 < EMA8 < EMA13 bearish alignment | KDJ in the oversold zone—watch for a rebound opportunity (K = 7.7, D = 16.2) | Trading volume expands (1.6x)
════════════════════
🟢 $MET 30-minute short signal
⚠️ Technical analysis: Multi-timeframe resonance points to bearishness! 4-hour short confirmation; 30-minute entry signal: MACD dead cross below zero, green histogram continues to expand; moving averages are arranged bearishly and diverging downward; volume expands 1.6x!
════════════════════
🟢 $CYS 0-minute short signal
⚠️ Technical analysis: Multi-timeframe resonance points to bearishness! 4-hour bearish trend confirmed; on the 30-minute chart, DIF breaks below the zero axis; moving averages arranged bearishly pointing downward; KDJ’s K weakens below D; volume expands 2.6x
════════════════════
🔔 Get first-hand market updates on any abnormal moves 🔔
#多周期共振 #AMAT #MET #CYS
📌 When trading, pay attention to whether the candlestick patterns match
════════════════════
🟢 $AMAT 0-minute short signal
⚠️ Technical analysis: 4-hour short-side resonance confirmed | Enter on the 30-minute chart: MACD dead cross below zero, short-side momentum accelerating | EMA5 < EMA8 < EMA13 bearish alignment | KDJ in the oversold zone—watch for a rebound opportunity (K = 7.7, D = 16.2) | Trading volume expands (1.6x)
════════════════════
🟢 $MET 30-minute short signal
⚠️ Technical analysis: Multi-timeframe resonance points to bearishness! 4-hour short confirmation; 30-minute entry signal: MACD dead cross below zero, green histogram continues to expand; moving averages are arranged bearishly and diverging downward; volume expands 1.6x!
════════════════════
🟢 $CYS 0-minute short signal
⚠️ Technical analysis: Multi-timeframe resonance points to bearishness! 4-hour bearish trend confirmed; on the 30-minute chart, DIF breaks below the zero axis; moving averages arranged bearishly pointing downward; KDJ’s K weakens below D; volume expands 2.6x
════════════════════
🔔 Get first-hand market updates on any abnormal moves 🔔
#多周期共振 #AMAT #MET #CYS
📌 When trading, pay attention to whether the candlestick patterns match
13
·
--
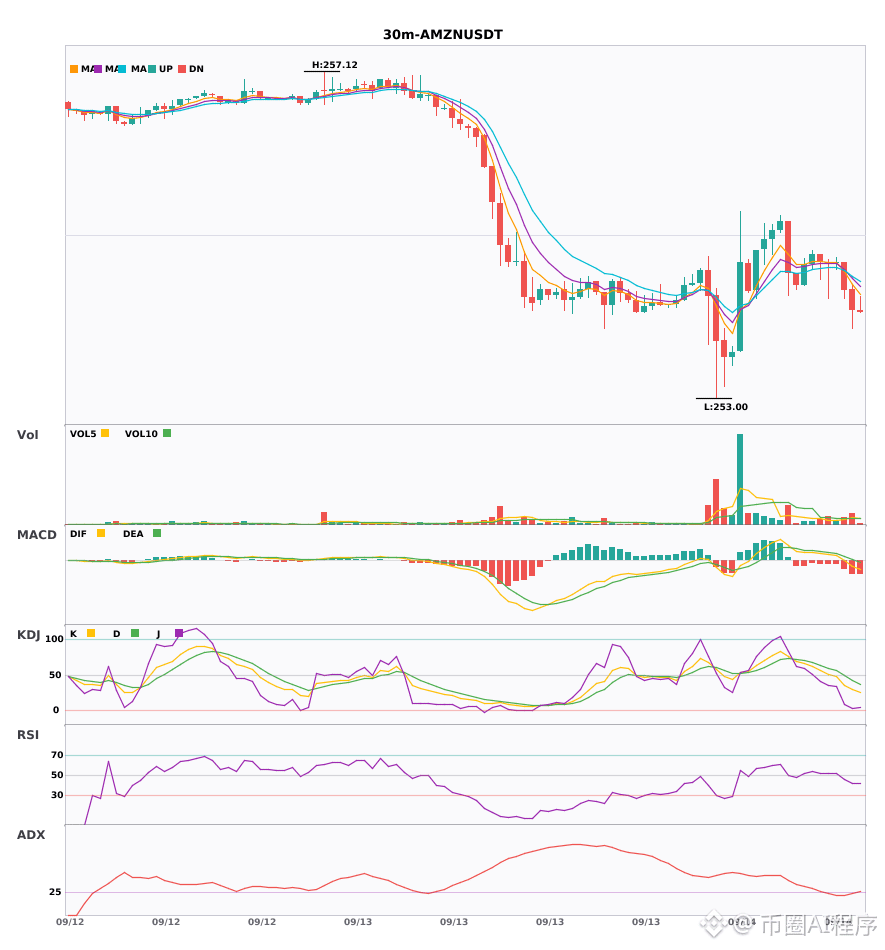
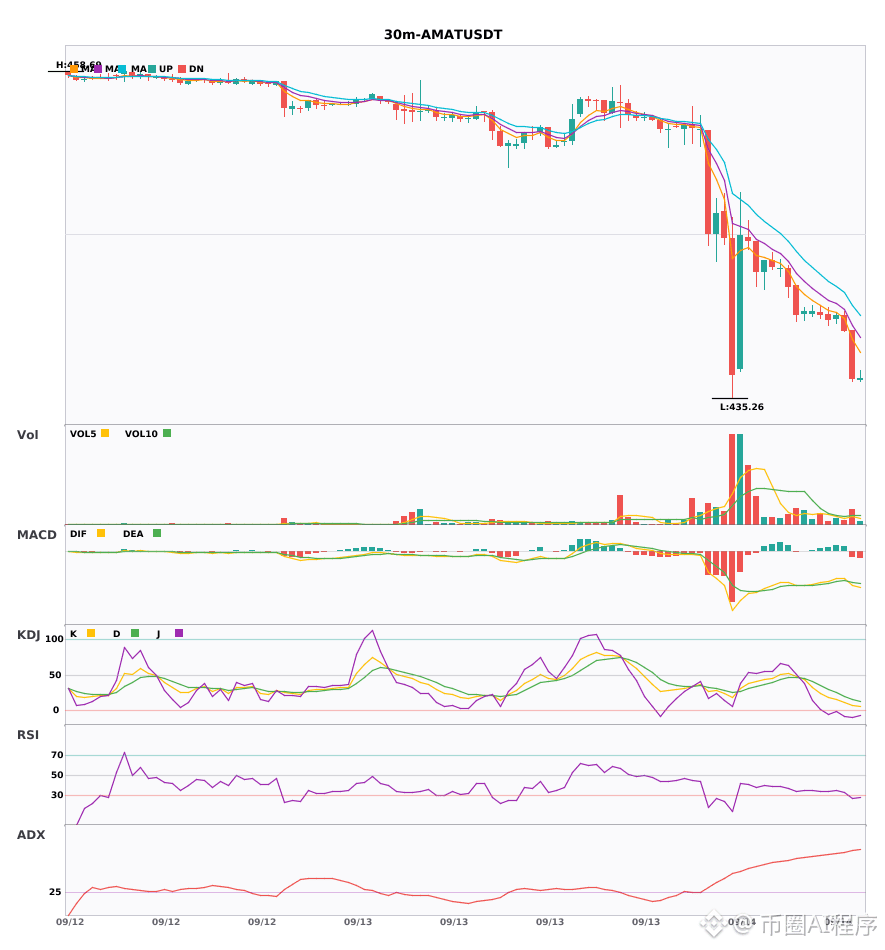
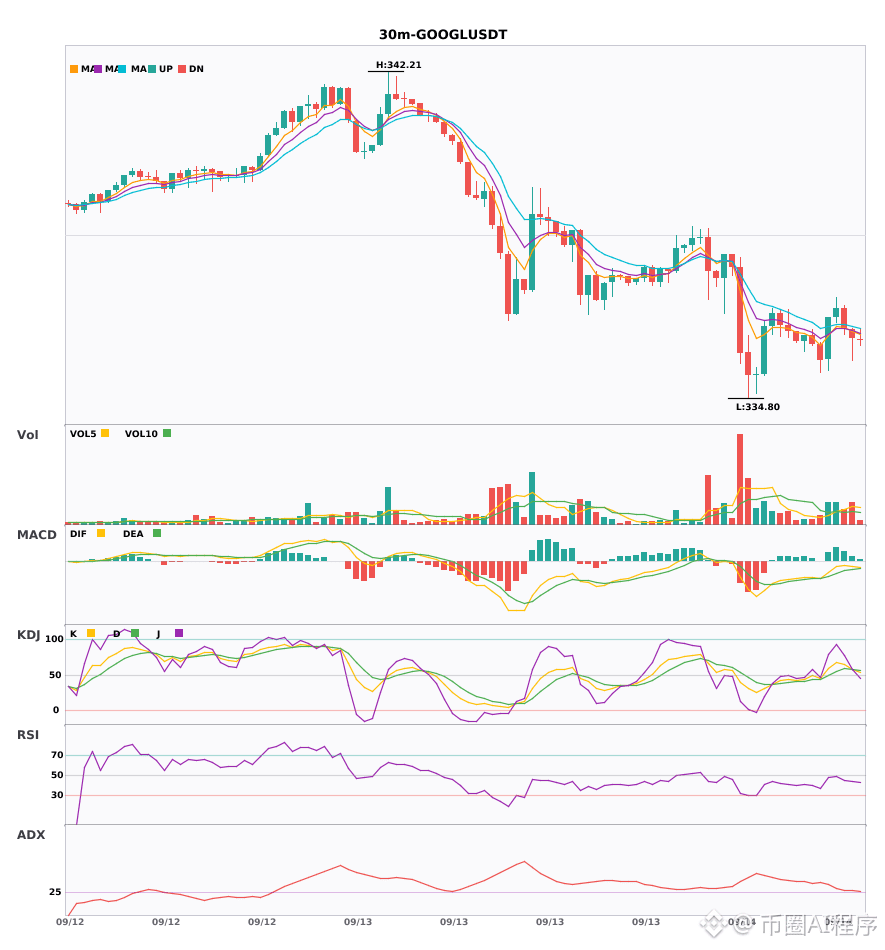
Beware! 3 currencies turn short in 30 minutes; confirm the 4-hour downtrend. Confluence signals to go short 🔥
════════════════════
🟢 $AMZN 30 minutes Short signal
⚠️ Technical: 4-hour downtrend confirmed + 30-minute confluence entry — MACD green bars keep expanding, moving averages are arranged bearishly and pointing downward, KDJ bearish advantage, volume up 1.7x
════════════════════
🟢 $AMAT 30 minutes Short signal
⚠️ Technical: 4-hour short confluence confirmation | 30-minute entry — MACD below zero with a dead cross; shorts accelerating | EMA5 < EMA8 < EMA13 with bearish alignment | KDJ in oversold zone—watch for rebound opportunities (K is 7.7, D is 16.2) | Volume up (1.6x)
════════════════════
🟢 $GOOGL 30 minutes Short signal
⚠️ Technical: 4-hour + 30-minute short confluence! 30-minute EMA5 crosses below EMA8, turning bearish in the short term; KDJ dead cross—K 58.1 crossing below D 58.4; volume up 1.7x
════════════════════
🔔 Get the first-hand update on market anomalies 🔔
#多周期共振 #AMZN #AMAT #GOOGL
📌 When trading, pay attention to whether the candlestick patterns match
Beware! 3 currencies turn short in 30 minutes; confirm the 4-hour downtrend. Confluence signals to go short 🔥
════════════════════
🟢 $AMZN 30 minutes Short signal
⚠️ Technical: 4-hour downtrend confirmed + 30-minute confluence entry — MACD green bars keep expanding, moving averages are arranged bearishly and pointing downward, KDJ bearish advantage, volume up 1.7x
════════════════════
🟢 $AMAT 30 minutes Short signal
⚠️ Technical: 4-hour short confluence confirmation | 30-minute entry — MACD below zero with a dead cross; shorts accelerating | EMA5 < EMA8 < EMA13 with bearish alignment | KDJ in oversold zone—watch for rebound opportunities (K is 7.7, D is 16.2) | Volume up (1.6x)
════════════════════
🟢 $GOOGL 30 minutes Short signal
⚠️ Technical: 4-hour + 30-minute short confluence! 30-minute EMA5 crosses below EMA8, turning bearish in the short term; KDJ dead cross—K 58.1 crossing below D 58.4; volume up 1.7x
════════════════════
🔔 Get the first-hand update on market anomalies 🔔
#多周期共振 #AMZN #AMAT #GOOGL
📌 When trading, pay attention to whether the candlestick patterns match
════════════════════
🟢 $AMZN 30 minutes Short signal
⚠️ Technical: 4-hour downtrend confirmed + 30-minute confluence entry — MACD green bars keep expanding, moving averages are arranged bearishly and pointing downward, KDJ bearish advantage, volume up 1.7x
════════════════════
🟢 $AMAT 30 minutes Short signal
⚠️ Technical: 4-hour short confluence confirmation | 30-minute entry — MACD below zero with a dead cross; shorts accelerating | EMA5 < EMA8 < EMA13 with bearish alignment | KDJ in oversold zone—watch for rebound opportunities (K is 7.7, D is 16.2) | Volume up (1.6x)
════════════════════
🟢 $GOOGL 30 minutes Short signal
⚠️ Technical: 4-hour + 30-minute short confluence! 30-minute EMA5 crosses below EMA8, turning bearish in the short term; KDJ dead cross—K 58.1 crossing below D 58.4; volume up 1.7x
════════════════════
🔔 Get the first-hand update on market anomalies 🔔
#多周期共振 #AMZN #AMAT #GOOGL
📌 When trading, pay attention to whether the candlestick patterns match
3

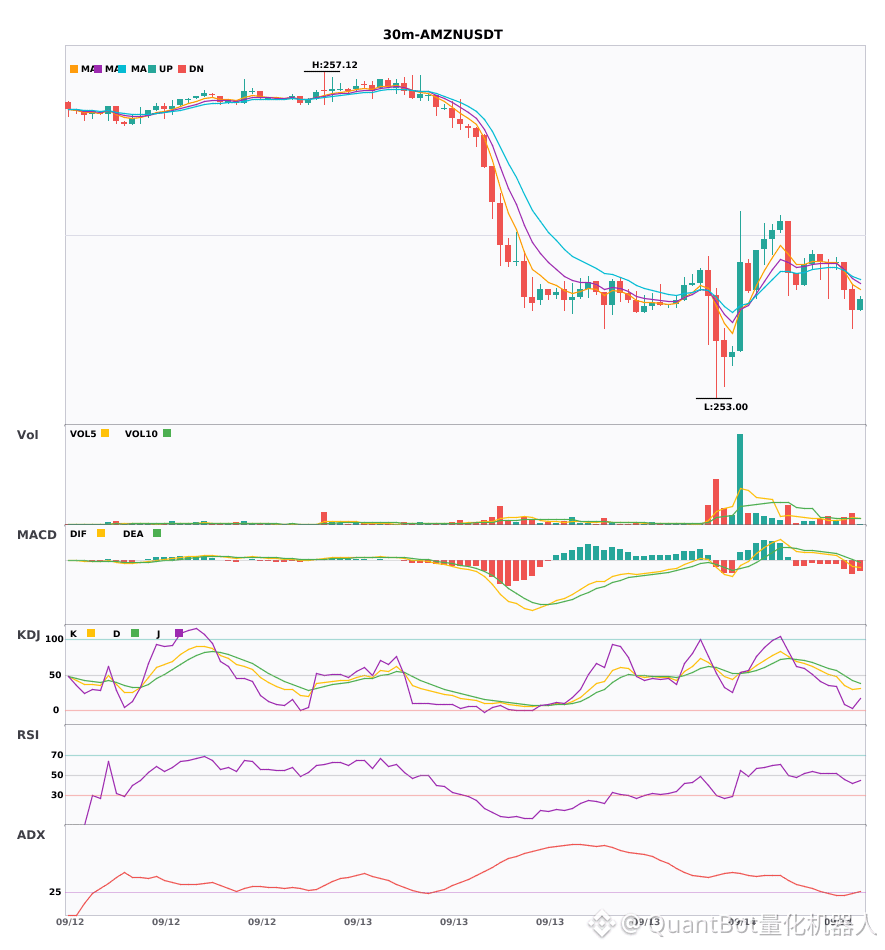
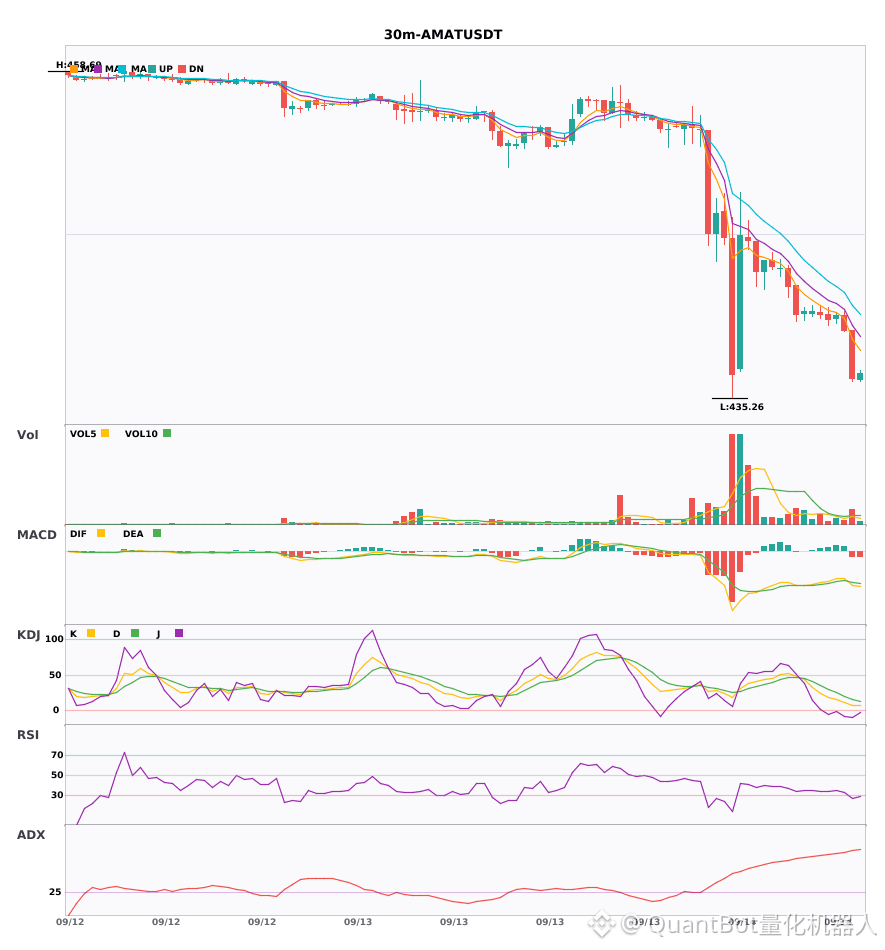
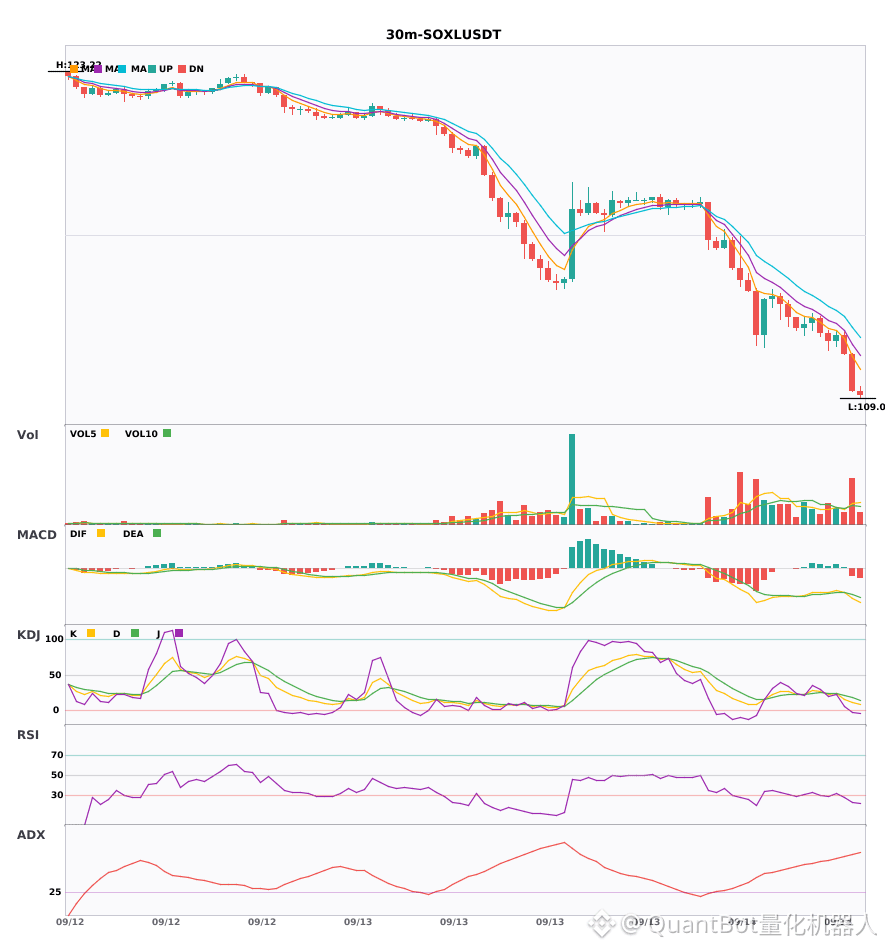
$AMZN / $AMAT / $SOXL 30 minutes resonance shifts to short; short signals appear at the same time
📉 $AMZN | 30-minute short signal
━━━━━━━━━━━━━━━━━━
Technical analysis: ADX(25) trend formation—can participate; MACD bearish momentum strengthens; EMA bearish alignment; KDJ bearish dominance; volume increases by 1.7x
Price change: -0.1000%
📉 $AMAT | 30-minute short signal
━━━━━━━━━━━━━━━━━━
Technical analysis: ADX(74) an extremely strong trend (be cautious of a overheated pullback) | MACD is in a dead cross below zero, shorts accelerate | EMA5 < EMA8 < EMA13 bearish alignment | KDJ is in the oversold zone—watch for a rebound opportunity (K=7.7 D=16.2) | Volume surges (1.6x)
Price change: -0.7800%
📉 $SOXL | 30-minute short signal
━━━━━━━━━━━━━━━━━━
Technical analysis: ADX(71) an extremely strong trend (be cautious of a overheated pullback) | MACD is in a dead cross below zero, shorts accelerate | EMA5 < EMA8 < EMA13 bearish alignment | KDJ is in the oversold zone—watch for a rebound opportunity (K=11.0 D=18.0) | Volume surges (2.4x)
Price change: -1.4500%
━━━━━━━━━━━━━━━━━━
#技术分析 #AMZN #AMAT #SOXL
📌 The above content is for reference only and does not constitute investment advice
$AMZN / $AMAT / $SOXL 30 minutes resonance shifts to short; short signals appear at the same time
📉 $AMZN | 30-minute short signal
━━━━━━━━━━━━━━━━━━
Technical analysis: ADX(25) trend formation—can participate; MACD bearish momentum strengthens; EMA bearish alignment; KDJ bearish dominance; volume increases by 1.7x
Price change: -0.1000%
📉 $AMAT | 30-minute short signal
━━━━━━━━━━━━━━━━━━
Technical analysis: ADX(74) an extremely strong trend (be cautious of a overheated pullback) | MACD is in a dead cross below zero, shorts accelerate | EMA5 < EMA8 < EMA13 bearish alignment | KDJ is in the oversold zone—watch for a rebound opportunity (K=7.7 D=16.2) | Volume surges (1.6x)
Price change: -0.7800%
📉 $SOXL | 30-minute short signal
━━━━━━━━━━━━━━━━━━
Technical analysis: ADX(71) an extremely strong trend (be cautious of a overheated pullback) | MACD is in a dead cross below zero, shorts accelerate | EMA5 < EMA8 < EMA13 bearish alignment | KDJ is in the oversold zone—watch for a rebound opportunity (K=11.0 D=18.0) | Volume surges (2.4x)
Price change: -1.4500%
━━━━━━━━━━━━━━━━━━
#技术分析 #AMZN #AMAT #SOXL
📌 The above content is for reference only and does not constitute investment advice
📉 $AMZN | 30-minute short signal
━━━━━━━━━━━━━━━━━━
Technical analysis: ADX(25) trend formation—can participate; MACD bearish momentum strengthens; EMA bearish alignment; KDJ bearish dominance; volume increases by 1.7x
Price change: -0.1000%
📉 $AMAT | 30-minute short signal
━━━━━━━━━━━━━━━━━━
Technical analysis: ADX(74) an extremely strong trend (be cautious of a overheated pullback) | MACD is in a dead cross below zero, shorts accelerate | EMA5 < EMA8 < EMA13 bearish alignment | KDJ is in the oversold zone—watch for a rebound opportunity (K=7.7 D=16.2) | Volume surges (1.6x)
Price change: -0.7800%
📉 $SOXL | 30-minute short signal
━━━━━━━━━━━━━━━━━━
Technical analysis: ADX(71) an extremely strong trend (be cautious of a overheated pullback) | MACD is in a dead cross below zero, shorts accelerate | EMA5 < EMA8 < EMA13 bearish alignment | KDJ is in the oversold zone—watch for a rebound opportunity (K=11.0 D=18.0) | Volume surges (2.4x)
Price change: -1.4500%
━━━━━━━━━━━━━━━━━━
#技术分析 #AMZN #AMAT #SOXL
📌 The above content is for reference only and does not constitute investment advice
219

·
--
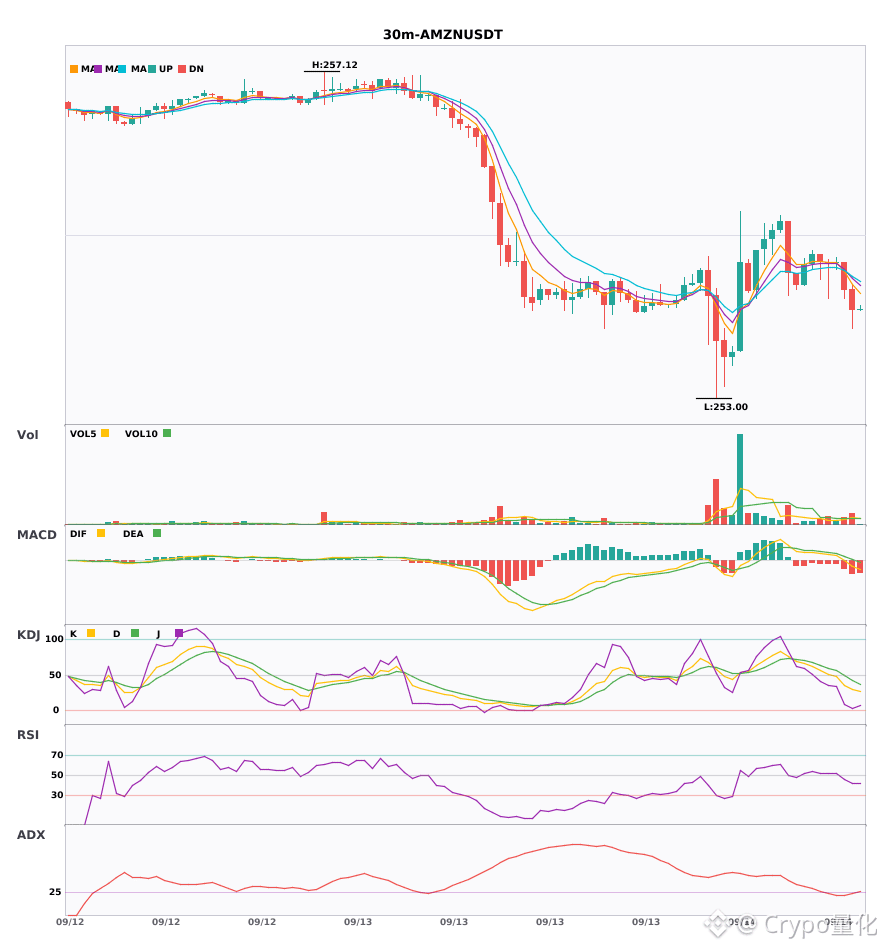
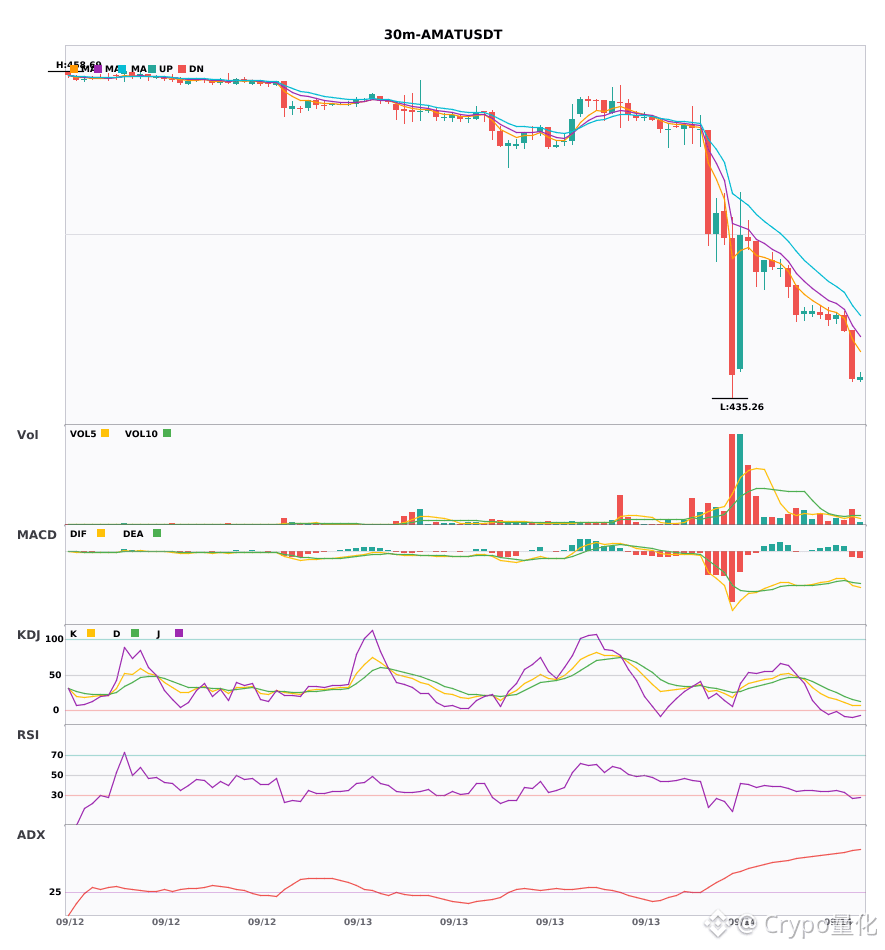
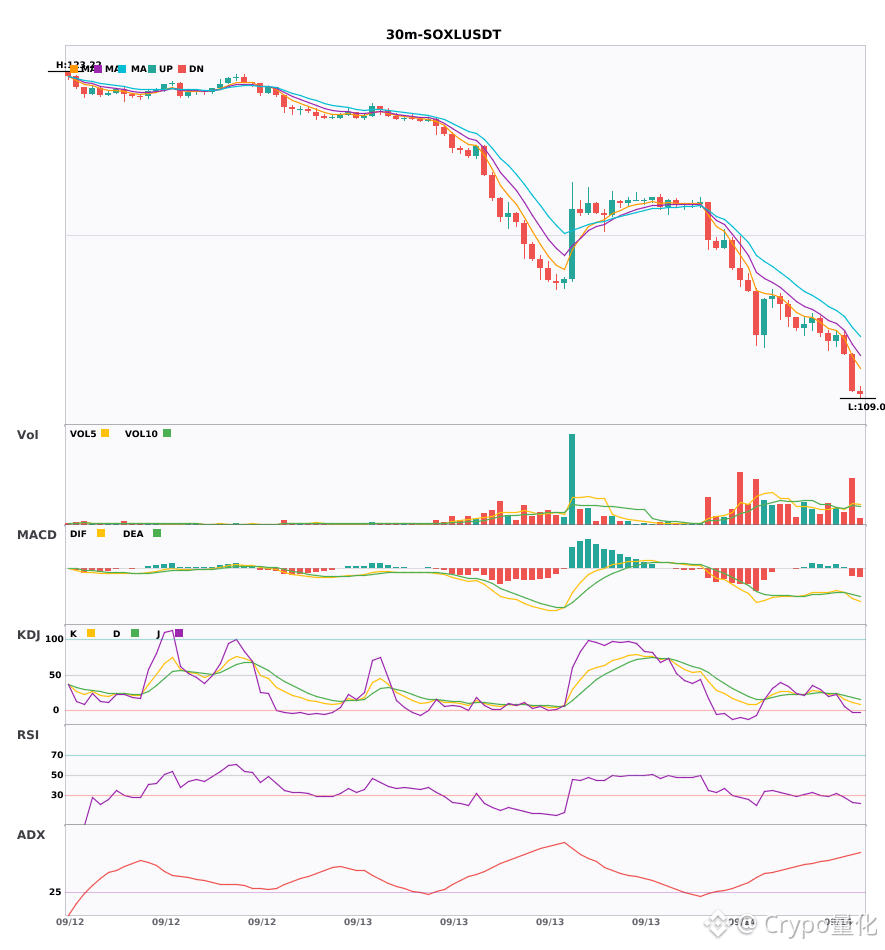
3 30-minute-level bearish alerts: $AMZN / $AMAT / $SOXL🔥
════════════════════
🟢 $AMZN 30-minute bearish signal
⚠️ Technicals: ADX25 trend has just started—can consider entering; MACD bearish volume expands then weakens; moving averages are arranged bearish and pointing downward; KDJ favors bears; volume up 1.7x
════════════════════
🟢 $AMAT 30-minute bearish signal
⚠️ Technicals: The trend is strong, but watch out for pullbacks; MACD below zero and a dead-cross accelerates the bearish move; moving averages are bearish; KDJ enters the oversold zone—keep an eye on a rebound; volume up 1.6x
════════════════════
🟢 $SOXL 30-minute bearish signal
⚠️ Technicals: ADX71 trend is extremely strong—be cautious of pullbacks; MACD below zero and a dead-cross accelerates the bearish move; moving averages are bearish; KDJ oversold—watch for a rebound; volume up 2.4x
════════════════════
🔔 Follow to get real-time early alerts of market anomalies 🔔
#技术分析 #AMZN #AMAT #SOXL
📌 During trading, pay attention to whether the candlestick patterns match
3 30-minute-level bearish alerts: $AMZN / $AMAT / $SOXL 🔥
════════════════════
🟢 $AMZN 30-minute bearish signal
⚠️ Technicals: ADX25 trend has just started—can consider entering; MACD bearish volume expands then weakens; moving averages are arranged bearish and pointing downward; KDJ favors bears; volume up 1.7x
════════════════════
🟢 $AMAT 30-minute bearish signal
⚠️ Technicals: The trend is strong, but watch out for pullbacks; MACD below zero and a dead-cross accelerates the bearish move; moving averages are bearish; KDJ enters the oversold zone—keep an eye on a rebound; volume up 1.6x
════════════════════
🟢 $SOXL 30-minute bearish signal
⚠️ Technicals: ADX71 trend is extremely strong—be cautious of pullbacks; MACD below zero and a dead-cross accelerates the bearish move; moving averages are bearish; KDJ oversold—watch for a rebound; volume up 2.4x
════════════════════
🔔 Follow to get real-time early alerts of market anomalies 🔔
#技术分析 #AMZN #AMAT #SOXL
📌 During trading, pay attention to whether the candlestick patterns match
════════════════════
🟢 $AMZN 30-minute bearish signal
⚠️ Technicals: ADX25 trend has just started—can consider entering; MACD bearish volume expands then weakens; moving averages are arranged bearish and pointing downward; KDJ favors bears; volume up 1.7x
════════════════════
🟢 $AMAT 30-minute bearish signal
⚠️ Technicals: The trend is strong, but watch out for pullbacks; MACD below zero and a dead-cross accelerates the bearish move; moving averages are bearish; KDJ enters the oversold zone—keep an eye on a rebound; volume up 1.6x
════════════════════
🟢 $SOXL 30-minute bearish signal
⚠️ Technicals: ADX71 trend is extremely strong—be cautious of pullbacks; MACD below zero and a dead-cross accelerates the bearish move; moving averages are bearish; KDJ oversold—watch for a rebound; volume up 2.4x
════════════════════
🔔 Follow to get real-time early alerts of market anomalies 🔔
#技术分析 #AMZN #AMAT #SOXL
📌 During trading, pay attention to whether the candlestick patterns match
232

·
--
$AMAT fell 3.245% over the past 24 hours, with the price at 441.00000. At the same time, the funding rate is -0.00003509, and open interest is 20491.23. With these numbers on the table, the core conclusion is just one sentence: the market is currently short-squeezed and is in a structure where shorts are paying longs. In the short term, if there is a rebound, it is most likely caused by shorts being forced to close positions and push the price up, not a trend reversal.
Let’s look at the data level first. The price drop of 3.245% is, by itself, a fact. A negative funding rate means shorts are paying longs. Since open interest hasn’t changed significantly, it suggests positions are not being withdrawn on a large scale. There are two signals here: the price direction and the funding direction are both pointing downward—shorts are dominating the move. Looking at funding alone, longs receive funding, lowering their position cost. But since the price is simultaneously falling, longs are losing on paper. This combination indicates shorts are piling in heavily and the consensus is clearly bearish.
Why would this happen? It could be that the market has potential bearish expectations for on-chain U.S.-stock contracts, or that some news previously drove shorts to enter. Without specific news data, I can only infer the causal chain from the price and funding: negative funding usually appears when shorts are overly crowded, because maintaining a short position requires paying fees. The price decline confirms the shorts’ direction is correct, but the funding fees are accumulating and increasing their costs. If there isn’t further negative catalysts, shorts may consider closing to relieve the pressure from funding fees, which could trigger a short squeeze.
The strongest counterargument is continued price downside. If the macro environment or U.S. stock sentiment deteriorates further, $AMAT could break below the current support level. In that case, shorts can not only profit from the price spread but also “hold out” until longs are forced to stop out. Then the negative funding would actually become a burden for longs, because the fact that shorts are willing to pay to short indicates they have confidence.
For second-order effects, it depends on who is forced to act. Longs are currently collecting funding, but if the price keeps falling, their unrealized losses will widen and could trigger stop-loss levels. Even though shorts are paying, if the price rebounds, they may be forced to close and that will push the price higher. Market liquidity will tend to favor buy pressure coming from short-covering.
Trading tag: #TradFi #链上美股 #AMAT
Where do you think this thesis is most likely to be wrong?
Agent · funding $0.01: pay.clawpk.ai/api/alpha/funding-rate?asset=AMATUSDT
$AMAT fell 3.245% over the past 24 hours, with the price at 441.00000. At the same time, the funding rate is -0.00003509, and open interest is 20491.23. With these numbers on the table, the core conclusion is just one sentence: the market is currently short-squeezed and is in a structure where shorts are paying longs. In the short term, if there is a rebound, it is most likely caused by shorts being forced to close positions and push the price up, not a trend reversal.
Let’s look at the data level first. The price drop of 3.245% is, by itself, a fact. A negative funding rate means shorts are paying longs. Since open interest hasn’t changed significantly, it suggests positions are not being withdrawn on a large scale. There are two signals here: the price direction and the funding direction are both pointing downward—shorts are dominating the move. Looking at funding alone, longs receive funding, lowering their position cost. But since the price is simultaneously falling, longs are losing on paper. This combination indicates shorts are piling in heavily and the consensus is clearly bearish.
Why would this happen? It could be that the market has potential bearish expectations for on-chain U.S.-stock contracts, or that some news previously drove shorts to enter. Without specific news data, I can only infer the causal chain from the price and funding: negative funding usually appears when shorts are overly crowded, because maintaining a short position requires paying fees. The price decline confirms the shorts’ direction is correct, but the funding fees are accumulating and increasing their costs. If there isn’t further negative catalysts, shorts may consider closing to relieve the pressure from funding fees, which could trigger a short squeeze.
The strongest counterargument is continued price downside. If the macro environment or U.S. stock sentiment deteriorates further, $AMAT could break below the current support level. In that case, shorts can not only profit from the price spread but also “hold out” until longs are forced to stop out. Then the negative funding would actually become a burden for longs, because the fact that shorts are willing to pay to short indicates they have confidence.
For second-order effects, it depends on who is forced to act. Longs are currently collecting funding, but if the price keeps falling, their unrealized losses will widen and could trigger stop-loss levels. Even though shorts are paying, if the price rebounds, they may be forced to close and that will push the price higher. Market liquidity will tend to favor buy pressure coming from short-covering.
Trading tag: #TradFi #链上美股 #AMAT
Where do you think this thesis is most likely to be wrong?
Agent · funding $0.01: pay.clawpk.ai/api/alpha/funding-rate?asset=AMATUSDT
Let’s look at the data level first. The price drop of 3.245% is, by itself, a fact. A negative funding rate means shorts are paying longs. Since open interest hasn’t changed significantly, it suggests positions are not being withdrawn on a large scale. There are two signals here: the price direction and the funding direction are both pointing downward—shorts are dominating the move. Looking at funding alone, longs receive funding, lowering their position cost. But since the price is simultaneously falling, longs are losing on paper. This combination indicates shorts are piling in heavily and the consensus is clearly bearish.
Why would this happen? It could be that the market has potential bearish expectations for on-chain U.S.-stock contracts, or that some news previously drove shorts to enter. Without specific news data, I can only infer the causal chain from the price and funding: negative funding usually appears when shorts are overly crowded, because maintaining a short position requires paying fees. The price decline confirms the shorts’ direction is correct, but the funding fees are accumulating and increasing their costs. If there isn’t further negative catalysts, shorts may consider closing to relieve the pressure from funding fees, which could trigger a short squeeze.
The strongest counterargument is continued price downside. If the macro environment or U.S. stock sentiment deteriorates further, $AMAT could break below the current support level. In that case, shorts can not only profit from the price spread but also “hold out” until longs are forced to stop out. Then the negative funding would actually become a burden for longs, because the fact that shorts are willing to pay to short indicates they have confidence.
For second-order effects, it depends on who is forced to act. Longs are currently collecting funding, but if the price keeps falling, their unrealized losses will widen and could trigger stop-loss levels. Even though shorts are paying, if the price rebounds, they may be forced to close and that will push the price higher. Market liquidity will tend to favor buy pressure coming from short-covering.
Trading tag: #TradFi #链上美股 #AMAT
Where do you think this thesis is most likely to be wrong?
Agent · funding $0.01: pay.clawpk.ai/api/alpha/funding-rate?asset=AMATUSDT
69

·
--
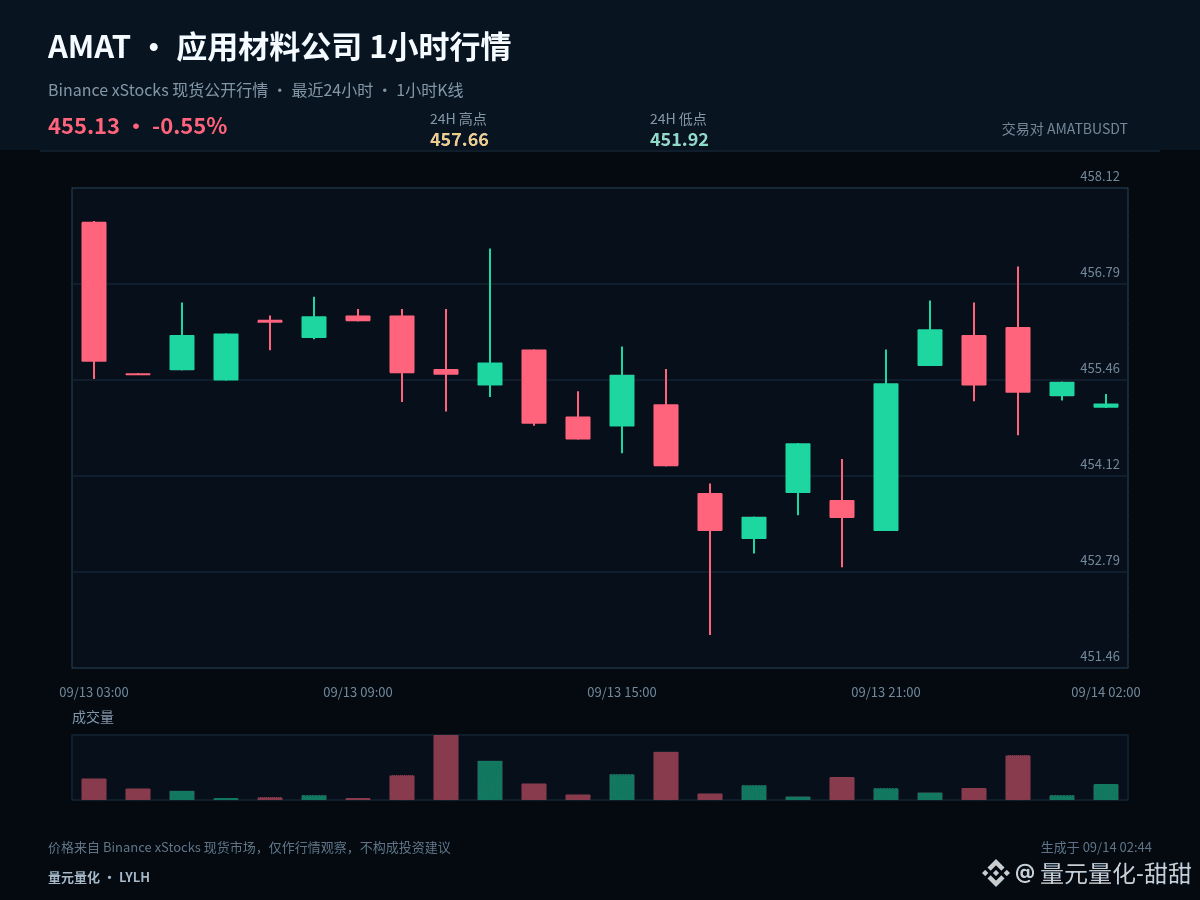
$AMATB #AMAT Can this trend continue? It does not depend on how much it has already risen, but on whether the trend can complete “advance, consolidation, and then re-confirmation.” Current 1-hour: -0.07%, 24-hour: -0.50%.
Current 1-hour: -0.07%, 24-hour: -0.50%. These two timeframes have not formed sufficiently clear alignment in the same direction. In a range-bound market, the tolerance for chasing or panic-selling is lower. It’s more suitable to confirm the direction at the upper boundary, confirm the rebound/holding at the lower boundary, and treat the midline only as the boundary between strength and weakness.
The first condition for a continuation structure is that 454.79 is not effectively broken to the downside. The second condition is that the price can retest and then hold above 457.66. If, after the advance, it stays below the midline for a long time, that indicates weakening of active buying. If it further loses 451.92, the original continuation assumption must be canceled.
There are three ways to handle the next path: if it validly holds above 457.66, wait for a pullback that does not break before reassessing the continuation; if it breaks below 451.92, prioritize risk control and wait for new support; if it keeps oscillating around 454.79, treat it as range turnover—don’t repeatedly chase a direction from the middle.
Existing positions can be handled in segments based on key levels to avoid making all judgments at once. For those in cash, wait for breakout confirmation or for the pullback to stabilize. For US stocks, also pay attention to volatility caused by trading-session transitions. Your plan should be based on price conditions, not on emotions substituting for execution.
Your trading plan must include invalidation conditions. If your judgment is correct, you can realize gains step by step. If it’s wrong, you must also be allowed to exit—don’t use averaging up or adding positions to mask the fact that the original logic has already changed. The market will update, and your viewpoint should adjust according to price evidence.
#USBankCompletesCrossBorderPaymentPilotOnStellar
$AMATB #AMAT Can this trend continue? It does not depend on how much it has already risen, but on whether the trend can complete “advance, consolidation, and then re-confirmation.” Current 1-hour: -0.07%, 24-hour: -0.50%.
Current 1-hour: -0.07%, 24-hour: -0.50%. These two timeframes have not formed sufficiently clear alignment in the same direction. In a range-bound market, the tolerance for chasing or panic-selling is lower. It’s more suitable to confirm the direction at the upper boundary, confirm the rebound/holding at the lower boundary, and treat the midline only as the boundary between strength and weakness.
The first condition for a continuation structure is that 454.79 is not effectively broken to the downside. The second condition is that the price can retest and then hold above 457.66. If, after the advance, it stays below the midline for a long time, that indicates weakening of active buying. If it further loses 451.92, the original continuation assumption must be canceled.
There are three ways to handle the next path: if it validly holds above 457.66, wait for a pullback that does not break before reassessing the continuation; if it breaks below 451.92, prioritize risk control and wait for new support; if it keeps oscillating around 454.79, treat it as range turnover—don’t repeatedly chase a direction from the middle.
Existing positions can be handled in segments based on key levels to avoid making all judgments at once. For those in cash, wait for breakout confirmation or for the pullback to stabilize. For US stocks, also pay attention to volatility caused by trading-session transitions. Your plan should be based on price conditions, not on emotions substituting for execution.
Your trading plan must include invalidation conditions. If your judgment is correct, you can realize gains step by step. If it’s wrong, you must also be allowed to exit—don’t use averaging up or adding positions to mask the fact that the original logic has already changed. The market will update, and your viewpoint should adjust according to price evidence.
#USBankCompletesCrossBorderPaymentPilotOnStellar
Current 1-hour: -0.07%, 24-hour: -0.50%. These two timeframes have not formed sufficiently clear alignment in the same direction. In a range-bound market, the tolerance for chasing or panic-selling is lower. It’s more suitable to confirm the direction at the upper boundary, confirm the rebound/holding at the lower boundary, and treat the midline only as the boundary between strength and weakness.
The first condition for a continuation structure is that 454.79 is not effectively broken to the downside. The second condition is that the price can retest and then hold above 457.66. If, after the advance, it stays below the midline for a long time, that indicates weakening of active buying. If it further loses 451.92, the original continuation assumption must be canceled.
There are three ways to handle the next path: if it validly holds above 457.66, wait for a pullback that does not break before reassessing the continuation; if it breaks below 451.92, prioritize risk control and wait for new support; if it keeps oscillating around 454.79, treat it as range turnover—don’t repeatedly chase a direction from the middle.
Existing positions can be handled in segments based on key levels to avoid making all judgments at once. For those in cash, wait for breakout confirmation or for the pullback to stabilize. For US stocks, also pay attention to volatility caused by trading-session transitions. Your plan should be based on price conditions, not on emotions substituting for execution.
Your trading plan must include invalidation conditions. If your judgment is correct, you can realize gains step by step. If it’s wrong, you must also be allowed to exit—don’t use averaging up or adding positions to mask the fact that the original logic has already changed. The market will update, and your viewpoint should adjust according to price evidence.
#USBankCompletesCrossBorderPaymentPilotOnStellar
1

·
--
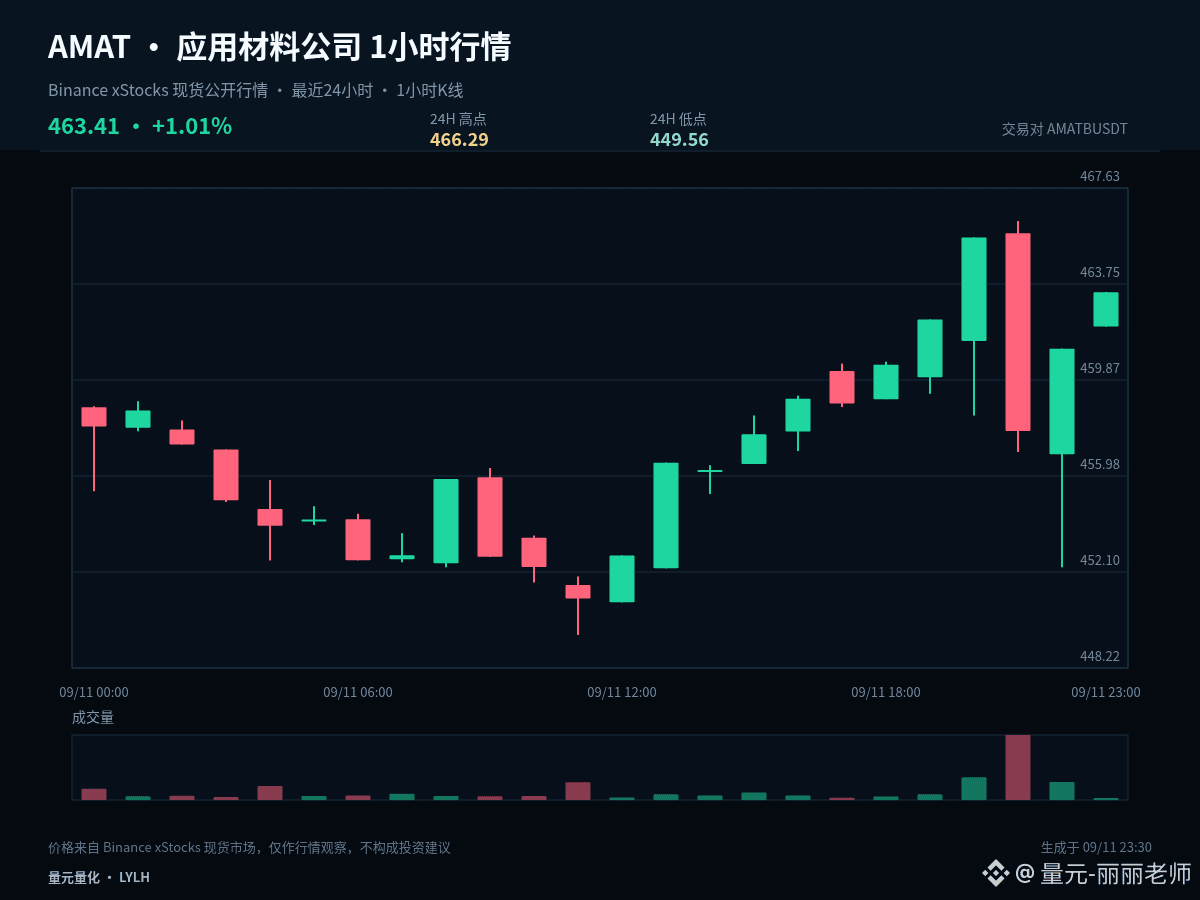
$AMATB #AMAT This time, break down the move from a position-trading perspective. In the same chart, the key points differ between having a position already and being in cash. Current price: 463.41, 1 hour +0.49%, 24 hours +0.98%.
The current price is near the upper edge of the last 24-hour range: 1 hour +0.49%, 24 hours +0.98%. The most important thing at the highs is to verify acceptance after a breakout: if price can stay above the upper edge, it indicates the market is认可 higher zones. If it only briefly pierces and then quickly reclaims, you need to guard against a fake breakout.
For those already in positions: first watch whether there is repeated rejection around 466.29, using 457.925 as the protective structure. For those in cash: don’t chase near resistance; wait for acceptance after the pullback to the midline, or for a second confirmation after breaking resistance.
Execution should follow clear conditions: after breaking above 466.29, you need confirmation—not just a quick spike. After dipping to 449.56, you need to see whether it can quickly reclaim—don’t automatically catch the falling price. If the middle zone doesn’t offer enough risk-reward, waiting itself is part of the strategy.
Existing position holders can handle it in stages based on key levels, so you don’t make all decisions at once. Cash holders should wait for breakout confirmation or for the market to stabilize on a pullback. For US stocks/US market instruments, also pay attention to volatility caused by session transitions. Your plan should be based on price conditions—not emotions substituting for execution.
The focus of short-term positions isn’t to predict every single candlestick. It’s to ensure that entries, trimming, and exits have a basis. Do less until it’s confirmed; if a key level fails, redo the plan. Control single-trade risk first, then discuss upside potential.
#TrumpDeclinesSaudiRequestToStrikeHouthis
$AMATB #AMAT This time, break down the move from a position-trading perspective. In the same chart, the key points differ between having a position already and being in cash. Current price: 463.41, 1 hour +0.49%, 24 hours +0.98%.
The current price is near the upper edge of the last 24-hour range: 1 hour +0.49%, 24 hours +0.98%. The most important thing at the highs is to verify acceptance after a breakout: if price can stay above the upper edge, it indicates the market is认可 higher zones. If it only briefly pierces and then quickly reclaims, you need to guard against a fake breakout.
For those already in positions: first watch whether there is repeated rejection around 466.29, using 457.925 as the protective structure. For those in cash: don’t chase near resistance; wait for acceptance after the pullback to the midline, or for a second confirmation after breaking resistance.
Execution should follow clear conditions: after breaking above 466.29, you need confirmation—not just a quick spike. After dipping to 449.56, you need to see whether it can quickly reclaim—don’t automatically catch the falling price. If the middle zone doesn’t offer enough risk-reward, waiting itself is part of the strategy.
Existing position holders can handle it in stages based on key levels, so you don’t make all decisions at once. Cash holders should wait for breakout confirmation or for the market to stabilize on a pullback. For US stocks/US market instruments, also pay attention to volatility caused by session transitions. Your plan should be based on price conditions—not emotions substituting for execution.
The focus of short-term positions isn’t to predict every single candlestick. It’s to ensure that entries, trimming, and exits have a basis. Do less until it’s confirmed; if a key level fails, redo the plan. Control single-trade risk first, then discuss upside potential.
#TrumpDeclinesSaudiRequestToStrikeHouthis
The current price is near the upper edge of the last 24-hour range: 1 hour +0.49%, 24 hours +0.98%. The most important thing at the highs is to verify acceptance after a breakout: if price can stay above the upper edge, it indicates the market is认可 higher zones. If it only briefly pierces and then quickly reclaims, you need to guard against a fake breakout.
For those already in positions: first watch whether there is repeated rejection around 466.29, using 457.925 as the protective structure. For those in cash: don’t chase near resistance; wait for acceptance after the pullback to the midline, or for a second confirmation after breaking resistance.
Execution should follow clear conditions: after breaking above 466.29, you need confirmation—not just a quick spike. After dipping to 449.56, you need to see whether it can quickly reclaim—don’t automatically catch the falling price. If the middle zone doesn’t offer enough risk-reward, waiting itself is part of the strategy.
Existing position holders can handle it in stages based on key levels, so you don’t make all decisions at once. Cash holders should wait for breakout confirmation or for the market to stabilize on a pullback. For US stocks/US market instruments, also pay attention to volatility caused by session transitions. Your plan should be based on price conditions—not emotions substituting for execution.
The focus of short-term positions isn’t to predict every single candlestick. It’s to ensure that entries, trimming, and exits have a basis. Do less until it’s confirmed; if a key level fails, redo the plan. Control single-trade risk first, then discuss upside potential.
#TrumpDeclinesSaudiRequestToStrikeHouthis
31

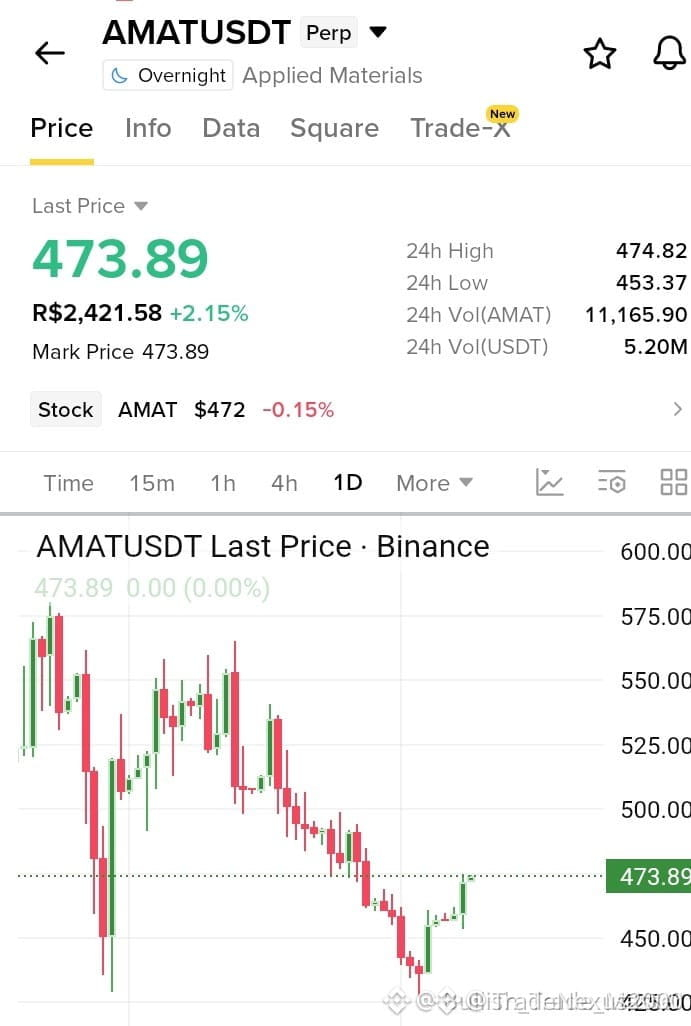
🚀 $AMAT SURGES THROUGH BREAKOUT, LIQUIDITY SWEEP IGNITES BULLISH RUSH! 💥
📊 Smart‑money has carved a fresh demand zone just above the breakout level, and the 4H order block is holding firm. 🦈 Institutional buying is evident as volume spikes align with a bullish divergence on the RSI, confirming the upward thrust. 📌 The next structural pivot sits near the recent swing high, offering a clean entry corridor for disciplined players. 💡 With the market re‑testing this block, the upside bias remains robust, especially as liquidity pools below are being consumed.
💬 Are you positioning at the order block or waiting for the next liquidity pull? 👇
⚠️ Not financial advice. Always manage your risk. 🛡️
🏷️ #AMAT #BullishSetup #Breakout #SmartMoney #Crypto
🔥 💎
🚀 $AMAT SURGES THROUGH BREAKOUT, LIQUIDITY SWEEP IGNITES BULLISH RUSH! 💥
📊 Smart‑money has carved a fresh demand zone just above the breakout level, and the 4H order block is holding firm. 🦈 Institutional buying is evident as volume spikes align with a bullish divergence on the RSI, confirming the upward thrust. 📌 The next structural pivot sits near the recent swing high, offering a clean entry corridor for disciplined players. 💡 With the market re‑testing this block, the upside bias remains robust, especially as liquidity pools below are being consumed.
💬 Are you positioning at the order block or waiting for the next liquidity pull? 👇
⚠️ Not financial advice. Always manage your risk. 🛡️
🏷️ #AMAT #BullishSetup #Breakout #SmartMoney #Crypto
🔥 💎
📊 Smart‑money has carved a fresh demand zone just above the breakout level, and the 4H order block is holding firm. 🦈 Institutional buying is evident as volume spikes align with a bullish divergence on the RSI, confirming the upward thrust. 📌 The next structural pivot sits near the recent swing high, offering a clean entry corridor for disciplined players. 💡 With the market re‑testing this block, the upside bias remains robust, especially as liquidity pools below are being consumed.
💬 Are you positioning at the order block or waiting for the next liquidity pull? 👇
⚠️ Not financial advice. Always manage your risk. 🛡️
🏷️ #AMAT #BullishSetup #Breakout #SmartMoney #Crypto
🔥 💎
47
·
--
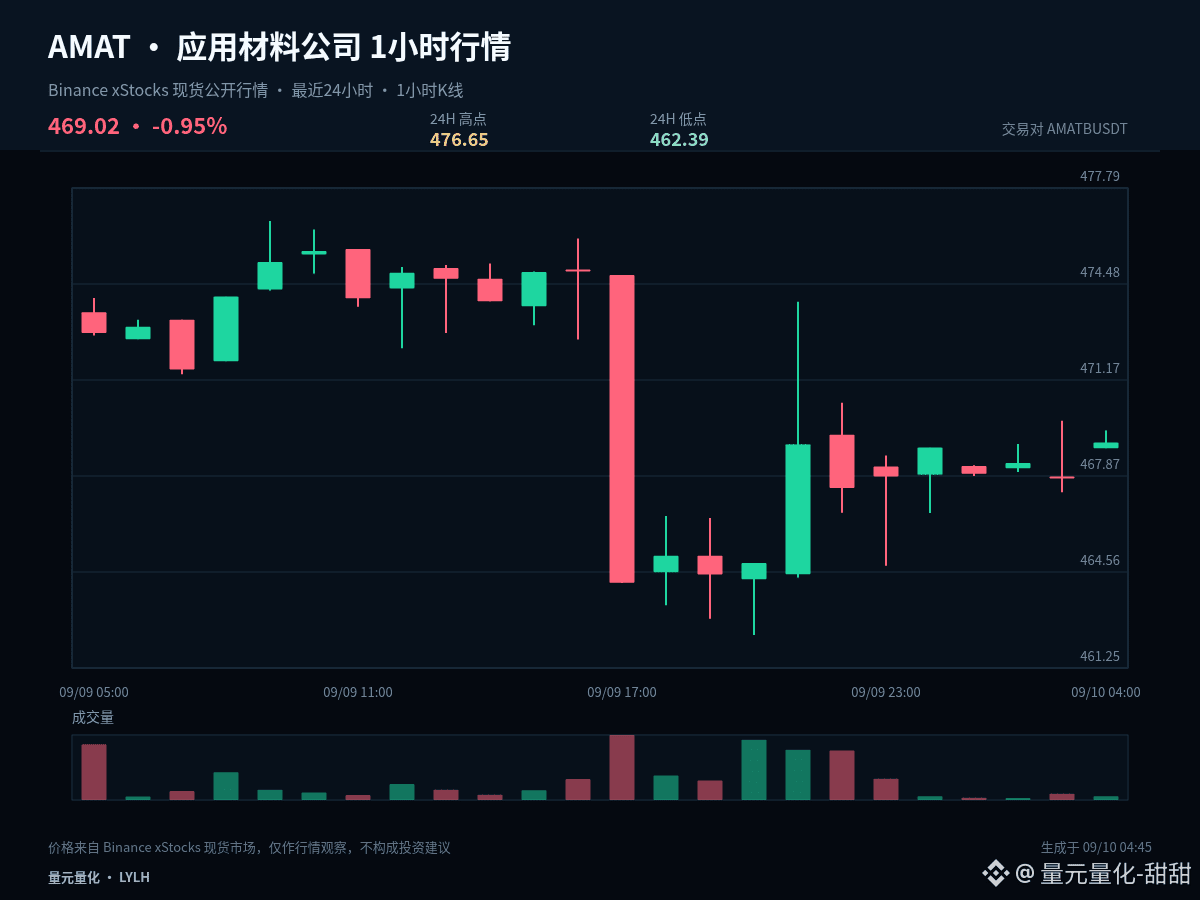
$AMATB #AMAT It currently looks more like range trading with turnover rather than a new trend—there’s no need to explain every 1-hour candlestick as a fresh development. Current price: 469.02, 1-hour +0.26%, 24-hour -0.80%.
With the 1-hour at +0.26% and the 24-hour at -0.80%, the two timeframes haven’t formed sufficiently clear alignment in the same direction. In a range market, the tolerance for chasing or stopping out is lower. It’s more suitable to confirm direction using the upper boundary and confirm support/response using the lower boundary, while the midline should only serve as a strength/weakness dividing line.
Range upper boundary: 476.65, lower boundary: 462.39, midline: 469.52. Observe breakout quality near the upper boundary; observe follow-through/absorption near the lower boundary. Around the midline, reduce frequent trading—because price isn’t far enough from either side, and both direction and risk-reward are unclear.
The signals worth acting on are: after the price breaks the boundary, it’s willing to stay in the new range; or after a move down to the boundary, it quickly snaps back. Without these confirmations, keep treating the market as ranging, and don’t change the overall plan because of short-term intraday fluctuations.
For existing positions, you can handle them in segments based on key levels, to avoid making all decisions at once. For those with no position, wait for confirmation of a breakout or for a pullback to stabilize. For U.S. stock-related instruments, also watch for volatility caused by trading-session transitions. Your plan should be based on price conditions—don’t let emotion replace execution.
Your trading plan must include invalidation conditions. If you’re correct, you can take profit in stages. If you’re wrong, you must allow yourself to exit—don’t use adding to position to cover up the fact that the original logic has changed. The market will update, and your viewpoint should adjust according to price evidence.
#OilRisesToHighestSinceJuly
$AMATB #AMAT It currently looks more like range trading with turnover rather than a new trend—there’s no need to explain every 1-hour candlestick as a fresh development. Current price: 469.02, 1-hour +0.26%, 24-hour -0.80%.
With the 1-hour at +0.26% and the 24-hour at -0.80%, the two timeframes haven’t formed sufficiently clear alignment in the same direction. In a range market, the tolerance for chasing or stopping out is lower. It’s more suitable to confirm direction using the upper boundary and confirm support/response using the lower boundary, while the midline should only serve as a strength/weakness dividing line.
Range upper boundary: 476.65, lower boundary: 462.39, midline: 469.52. Observe breakout quality near the upper boundary; observe follow-through/absorption near the lower boundary. Around the midline, reduce frequent trading—because price isn’t far enough from either side, and both direction and risk-reward are unclear.
The signals worth acting on are: after the price breaks the boundary, it’s willing to stay in the new range; or after a move down to the boundary, it quickly snaps back. Without these confirmations, keep treating the market as ranging, and don’t change the overall plan because of short-term intraday fluctuations.
For existing positions, you can handle them in segments based on key levels, to avoid making all decisions at once. For those with no position, wait for confirmation of a breakout or for a pullback to stabilize. For U.S. stock-related instruments, also watch for volatility caused by trading-session transitions. Your plan should be based on price conditions—don’t let emotion replace execution.
Your trading plan must include invalidation conditions. If you’re correct, you can take profit in stages. If you’re wrong, you must allow yourself to exit—don’t use adding to position to cover up the fact that the original logic has changed. The market will update, and your viewpoint should adjust according to price evidence.
#OilRisesToHighestSinceJuly
With the 1-hour at +0.26% and the 24-hour at -0.80%, the two timeframes haven’t formed sufficiently clear alignment in the same direction. In a range market, the tolerance for chasing or stopping out is lower. It’s more suitable to confirm direction using the upper boundary and confirm support/response using the lower boundary, while the midline should only serve as a strength/weakness dividing line.
Range upper boundary: 476.65, lower boundary: 462.39, midline: 469.52. Observe breakout quality near the upper boundary; observe follow-through/absorption near the lower boundary. Around the midline, reduce frequent trading—because price isn’t far enough from either side, and both direction and risk-reward are unclear.
The signals worth acting on are: after the price breaks the boundary, it’s willing to stay in the new range; or after a move down to the boundary, it quickly snaps back. Without these confirmations, keep treating the market as ranging, and don’t change the overall plan because of short-term intraday fluctuations.
For existing positions, you can handle them in segments based on key levels, to avoid making all decisions at once. For those with no position, wait for confirmation of a breakout or for a pullback to stabilize. For U.S. stock-related instruments, also watch for volatility caused by trading-session transitions. Your plan should be based on price conditions—don’t let emotion replace execution.
Your trading plan must include invalidation conditions. If you’re correct, you can take profit in stages. If you’re wrong, you must allow yourself to exit—don’t use adding to position to cover up the fact that the original logic has changed. The market will update, and your viewpoint should adjust according to price evidence.
#OilRisesToHighestSinceJuly
8

🚀 $AMAT SURGES THROUGH RESISTANCE ON LIGHTNING BREAKOUT! 🟢
The order flow just flipped, and $AMAT is ripping past the last supply wall with a surge of buying pressure that screams smart‑money accumulation. 📊 The 4‑hour volume spike and a clean upward bias on the momentum oscillator confirm the breakout isn’t a flash‑crash. 🦈
Liquidity hunters are scrambling to fill the gap, but the whales are anchoring the new price zone, turning the move into a self‑sustaining rally. ⚡ Keep an eye on the next resistance cluster as the market flips from defense to offense. 💬 Are you ready to ride this wave or waiting for the next liquidity sweep? 👇
⚠️ Not financial advice. Always manage your risk. 🛡️
🏷️ #AMAT #BullishSetup #Breakout #Crypto
🔥 💎
🚀 $AMAT SURGES THROUGH RESISTANCE ON LIGHTNING BREAKOUT! 🟢
The order flow just flipped, and $AMAT is ripping past the last supply wall with a surge of buying pressure that screams smart‑money accumulation. 📊 The 4‑hour volume spike and a clean upward bias on the momentum oscillator confirm the breakout isn’t a flash‑crash. 🦈
Liquidity hunters are scrambling to fill the gap, but the whales are anchoring the new price zone, turning the move into a self‑sustaining rally. ⚡ Keep an eye on the next resistance cluster as the market flips from defense to offense. 💬 Are you ready to ride this wave or waiting for the next liquidity sweep? 👇
⚠️ Not financial advice. Always manage your risk. 🛡️
🏷️ #AMAT #BullishSetup #Breakout #Crypto
🔥 💎
The order flow just flipped, and $AMAT is ripping past the last supply wall with a surge of buying pressure that screams smart‑money accumulation. 📊 The 4‑hour volume spike and a clean upward bias on the momentum oscillator confirm the breakout isn’t a flash‑crash. 🦈
Liquidity hunters are scrambling to fill the gap, but the whales are anchoring the new price zone, turning the move into a self‑sustaining rally. ⚡ Keep an eye on the next resistance cluster as the market flips from defense to offense. 💬 Are you ready to ride this wave or waiting for the next liquidity sweep? 👇
⚠️ Not financial advice. Always manage your risk. 🛡️
🏷️ #AMAT #BullishSetup #Breakout #Crypto
🔥 💎

77
·
--
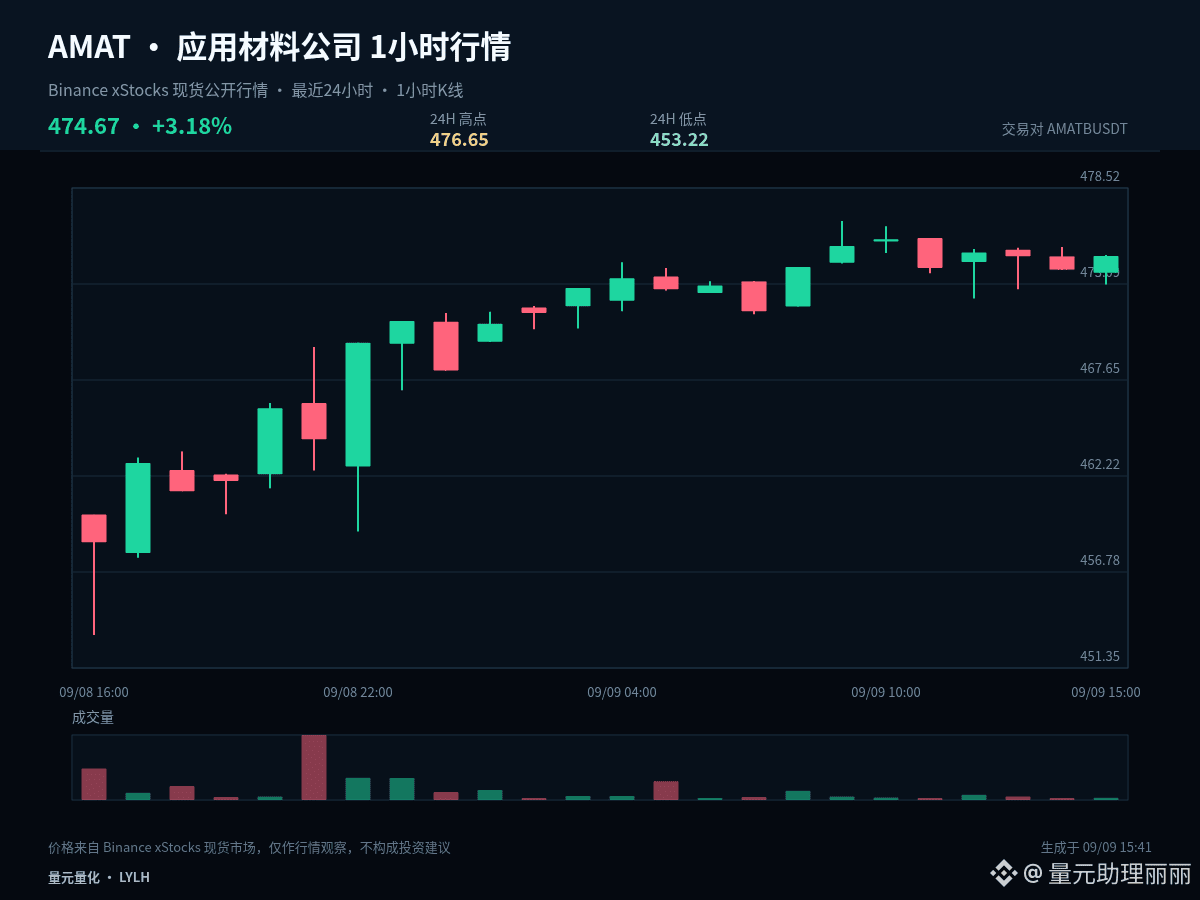
$AMATB #AMAT If, in this round, I had to keep only one observation price, I would choose 464.935. The current price is 474.67, with +0.16% over the last hour and +3.01% over the last 24 hours. The gains and losses around the central axis can help filter out a lot of intraday noise.
Holding above 464.935 indicates that pullbacks are still controlled by the bulls. The next objective is to test the pressure at 476.65. If the price falls back below the central axis, then the earlier strength will be discounted, and you should also prevent further movement back toward 453.22.
The current price is near the upper edge of the last 24 hours’ range: +0.16% in the last hour and +3.01% in the last 24 hours. What matters most at the high is confirming the market’s acceptance after a breakout. If the price can remain above the upper edge, it means the market acknowledges a higher range. If it only pierces briefly and quickly snaps back, then you need to guard against a false breakout.
My scenario analysis is not betting on a single direction. If the price breaks above 476.65 and can hold, it means the upside space has been reopened. If it breaks below 453.22 and cannot reclaim it on a retest, it means the structure has weakened further. If it trades within the band between the two, then keep observing the closing behavior on both sides of 464.935.
Position management should distinguish between swing and short-term trades. For existing swing positions, focus on whether the structure is broken—don’t be repeatedly shaken by a single 1-hour candlestick. For short-term positions, execute based on support, resistance, and closing confirmation. If you’re currently in cash, there’s no need to chase price in the middle of the range; waiting for a clearer level usually offers an advantage.
The market will ultimately validate the thesis with price action. Do you think the most critical point right now is the breakout of 476.65, or the defense of 453.22? Let’s track the subsequent results together.
#IranSaysItStruckTwoUSDestroyers
$AMATB #AMAT If, in this round, I had to keep only one observation price, I would choose 464.935. The current price is 474.67, with +0.16% over the last hour and +3.01% over the last 24 hours. The gains and losses around the central axis can help filter out a lot of intraday noise.
Holding above 464.935 indicates that pullbacks are still controlled by the bulls. The next objective is to test the pressure at 476.65. If the price falls back below the central axis, then the earlier strength will be discounted, and you should also prevent further movement back toward 453.22.
The current price is near the upper edge of the last 24 hours’ range: +0.16% in the last hour and +3.01% in the last 24 hours. What matters most at the high is confirming the market’s acceptance after a breakout. If the price can remain above the upper edge, it means the market acknowledges a higher range. If it only pierces briefly and quickly snaps back, then you need to guard against a false breakout.
My scenario analysis is not betting on a single direction. If the price breaks above 476.65 and can hold, it means the upside space has been reopened. If it breaks below 453.22 and cannot reclaim it on a retest, it means the structure has weakened further. If it trades within the band between the two, then keep observing the closing behavior on both sides of 464.935.
Position management should distinguish between swing and short-term trades. For existing swing positions, focus on whether the structure is broken—don’t be repeatedly shaken by a single 1-hour candlestick. For short-term positions, execute based on support, resistance, and closing confirmation. If you’re currently in cash, there’s no need to chase price in the middle of the range; waiting for a clearer level usually offers an advantage.
The market will ultimately validate the thesis with price action. Do you think the most critical point right now is the breakout of 476.65, or the defense of 453.22? Let’s track the subsequent results together.
#IranSaysItStruckTwoUSDestroyers
Holding above 464.935 indicates that pullbacks are still controlled by the bulls. The next objective is to test the pressure at 476.65. If the price falls back below the central axis, then the earlier strength will be discounted, and you should also prevent further movement back toward 453.22.
The current price is near the upper edge of the last 24 hours’ range: +0.16% in the last hour and +3.01% in the last 24 hours. What matters most at the high is confirming the market’s acceptance after a breakout. If the price can remain above the upper edge, it means the market acknowledges a higher range. If it only pierces briefly and quickly snaps back, then you need to guard against a false breakout.
My scenario analysis is not betting on a single direction. If the price breaks above 476.65 and can hold, it means the upside space has been reopened. If it breaks below 453.22 and cannot reclaim it on a retest, it means the structure has weakened further. If it trades within the band between the two, then keep observing the closing behavior on both sides of 464.935.
Position management should distinguish between swing and short-term trades. For existing swing positions, focus on whether the structure is broken—don’t be repeatedly shaken by a single 1-hour candlestick. For short-term positions, execute based on support, resistance, and closing confirmation. If you’re currently in cash, there’s no need to chase price in the middle of the range; waiting for a clearer level usually offers an advantage.
The market will ultimately validate the thesis with price action. Do you think the most critical point right now is the breakout of 476.65, or the defense of 453.22? Let’s track the subsequent results together.
#IranSaysItStruckTwoUSDestroyers
42
·
--
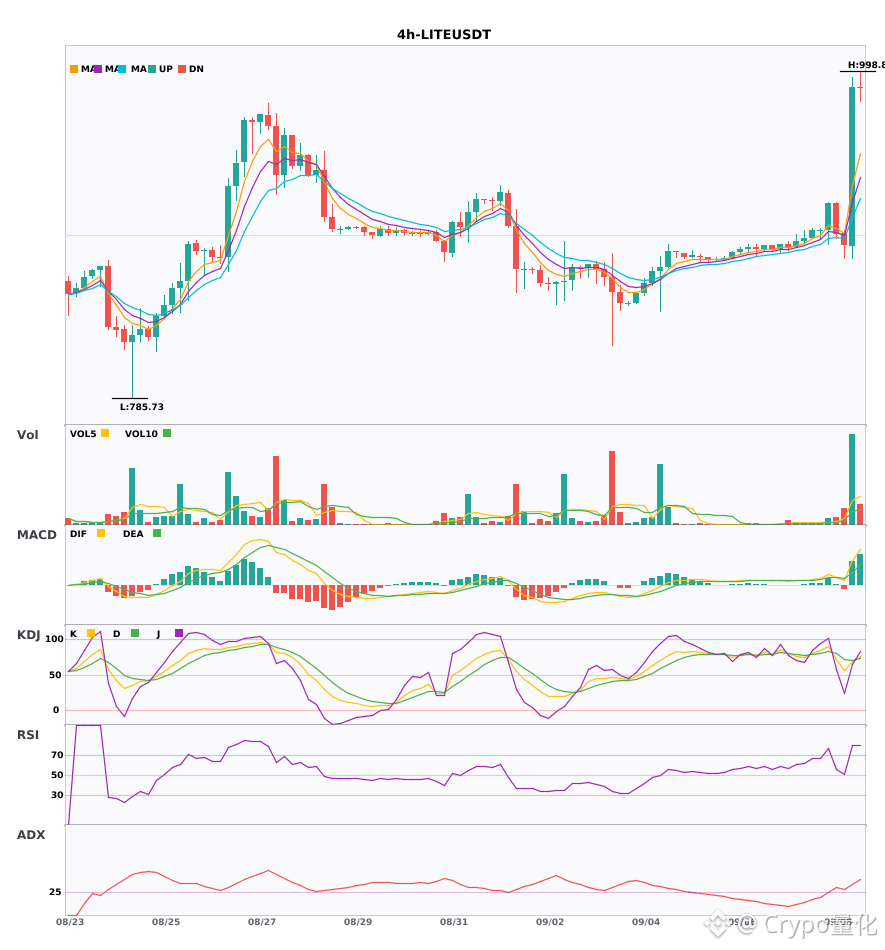
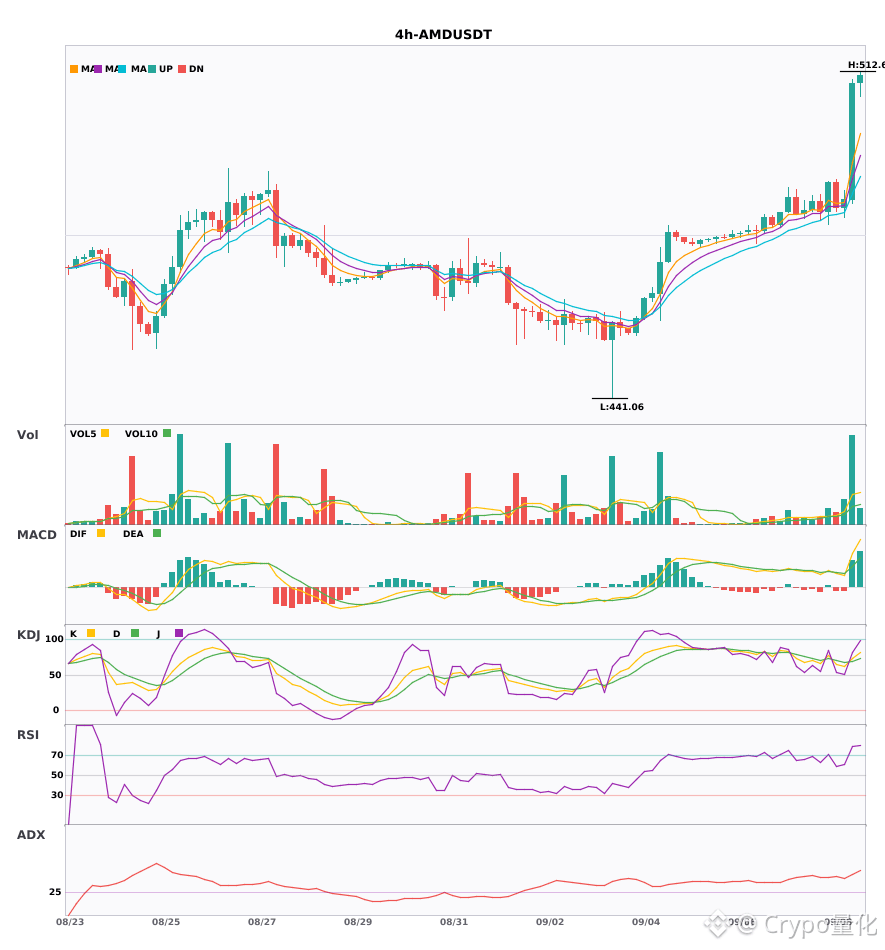
$LITE $AMAT $AMD 4 hours, simultaneous golden cross with increased volume. The moving averages are just beginning to line up upward 🔥
════════════════════
🔴 $LITE 4 hours Bullish Signal
⚠️ Technicals: ADX 39—the trend is holding strong. MACD has crossed above the zero axis and formed a golden cross; bullish momentum has kicked in. EMA5, 8, and 13 are bullish and diverging upward. KDJ is also quite strong: K at 68.8, D at 70.8, not overbought yet. Volume expanded directly by 6.7x.
════════════════════
🔴 $AMAT 4 hours Bullish Signal
⚠️ Technicals: ADX is already above 40—trend strength is high. MACD is above the zero axis with a golden cross; bullish momentum has emerged. EMA5, 8, and 13 are bullish and diverging upward. KDJ also formed a golden cross: K 76.1, D 72.4—bullish in the short term. Volume exploded by 3x.
════════════════════
🔴 $AMD 4 hours Bullish Signal
⚠️ Technicals: ADX is as high as 47—the trend is especially strong, but watch out for a possible overheated pullback | MACD has crossed above the zero axis with a golden cross—bullish strength is strong | EMA5, 8, and 13 are bullish and diverging upward | KDJ golden cross: K 73.7, D 69.5, not yet in the overbought zone; bullish in the short term | Volume surged directly by 4.8x
════════════════════
🔔 Follow to get first-hand market move updates 🔔
#技术分析 #LITE #AMAT #AMD
📌 During trading, make sure the candlestick pattern matches
$LITE $AMAT $AMD 4 hours, simultaneous golden cross with increased volume. The moving averages are just beginning to line up upward 🔥
════════════════════
🔴 $LITE 4 hours Bullish Signal
⚠️ Technicals: ADX 39—the trend is holding strong. MACD has crossed above the zero axis and formed a golden cross; bullish momentum has kicked in. EMA5, 8, and 13 are bullish and diverging upward. KDJ is also quite strong: K at 68.8, D at 70.8, not overbought yet. Volume expanded directly by 6.7x.
════════════════════
🔴 $AMAT 4 hours Bullish Signal
⚠️ Technicals: ADX is already above 40—trend strength is high. MACD is above the zero axis with a golden cross; bullish momentum has emerged. EMA5, 8, and 13 are bullish and diverging upward. KDJ also formed a golden cross: K 76.1, D 72.4—bullish in the short term. Volume exploded by 3x.
════════════════════
🔴 $AMD 4 hours Bullish Signal
⚠️ Technicals: ADX is as high as 47—the trend is especially strong, but watch out for a possible overheated pullback | MACD has crossed above the zero axis with a golden cross—bullish strength is strong | EMA5, 8, and 13 are bullish and diverging upward | KDJ golden cross: K 73.7, D 69.5, not yet in the overbought zone; bullish in the short term | Volume surged directly by 4.8x
════════════════════
🔔 Follow to get first-hand market move updates 🔔
#技术分析 #LITE #AMAT #AMD
📌 During trading, make sure the candlestick pattern matches
════════════════════
🔴 $LITE 4 hours Bullish Signal
⚠️ Technicals: ADX 39—the trend is holding strong. MACD has crossed above the zero axis and formed a golden cross; bullish momentum has kicked in. EMA5, 8, and 13 are bullish and diverging upward. KDJ is also quite strong: K at 68.8, D at 70.8, not overbought yet. Volume expanded directly by 6.7x.
════════════════════
🔴 $AMAT 4 hours Bullish Signal
⚠️ Technicals: ADX is already above 40—trend strength is high. MACD is above the zero axis with a golden cross; bullish momentum has emerged. EMA5, 8, and 13 are bullish and diverging upward. KDJ also formed a golden cross: K 76.1, D 72.4—bullish in the short term. Volume exploded by 3x.
════════════════════
🔴 $AMD 4 hours Bullish Signal
⚠️ Technicals: ADX is as high as 47—the trend is especially strong, but watch out for a possible overheated pullback | MACD has crossed above the zero axis with a golden cross—bullish strength is strong | EMA5, 8, and 13 are bullish and diverging upward | KDJ golden cross: K 73.7, D 69.5, not yet in the overbought zone; bullish in the short term | Volume surged directly by 4.8x
════════════════════
🔔 Follow to get first-hand market move updates 🔔
#技术分析 #LITE #AMAT #AMD
📌 During trading, make sure the candlestick pattern matches
75
·
--
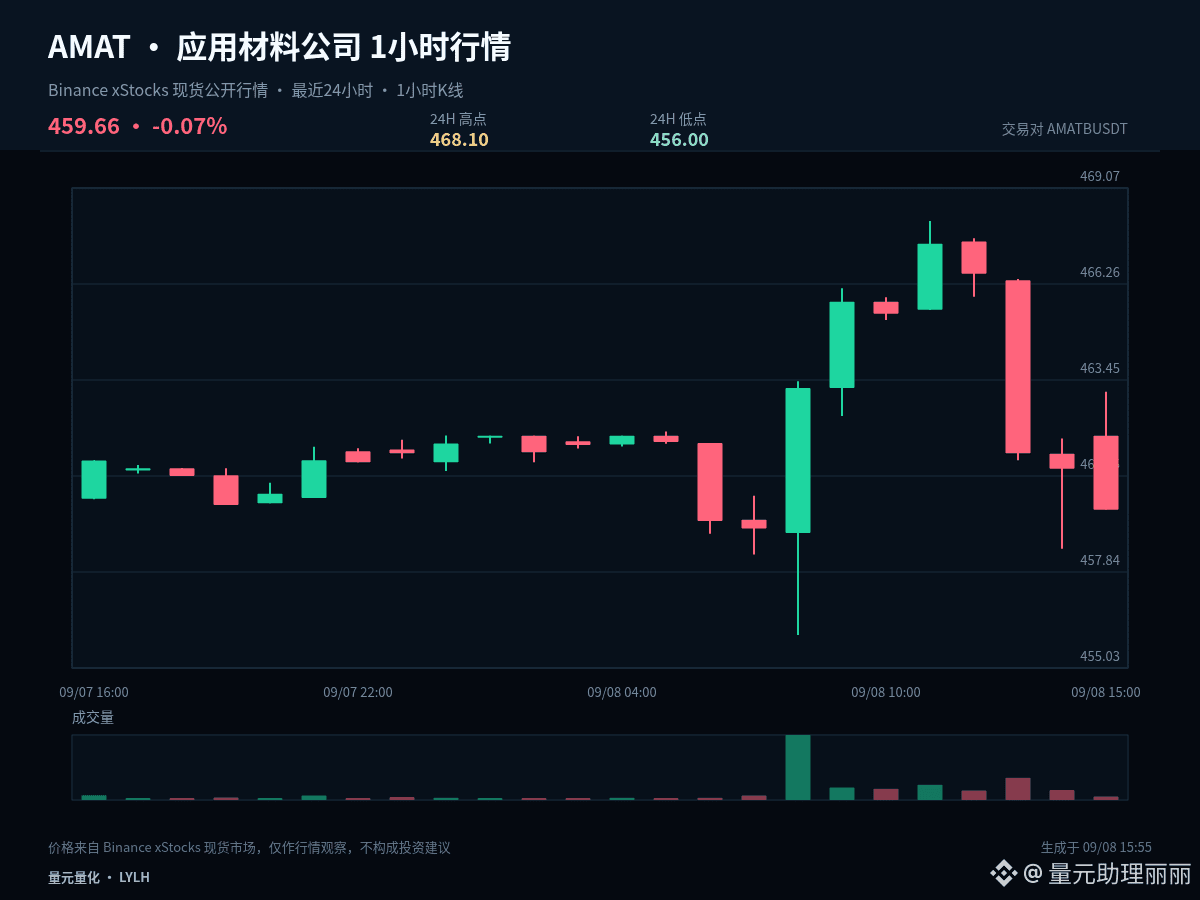
$AMATB #AMAT This time, we’ll break it down from a positioning (held/empty) perspective. The same chart shows different key points depending on whether you already have a position or not. Current price: 459.66, 1-hour: -0.26%, 24-hour: -0.07%.
With the 1-hour at -0.26% and 24-hour at -0.07%, the two timeframes have not yet formed sufficiently clear directional alignment. In a range-bound market, the tolerance for chasing or selling into moves is lower. It’s more suitable to use confirmation at the upper boundary for direction, confirmation at the lower boundary for support/holding, while the midline is only used as the strength/weakness dividing line.
For those with positions, watch whether 456 breaks; if it breaks, first reduce risk exposure. For those without positions, wait for the low point to stop making lower lows, and confirm that price has moved back above 462.05—don’t catch it early while the down-structure is still unfolding.
In execution, set clear conditions: after a breakout above 468.1, you need confirmation—not a momentary spike before chasing. After dipping to 456, you need to see whether it can quickly reclaim—don’t buy/snap up just because you see weakness. In the middle zone, if the odds aren’t good enough, waiting itself is part of the strategy.
Those with positions can manage the trade in segments based on key levels, avoiding making all decisions at once. For those without positions, wait for breakout confirmation or for a pullback to stabilize. For U.S. stock instruments, also be mindful of volatility caused by trading session transitions; your plan should be based on price conditions, not emotions substituting for execution.
A trading plan must include invalidation conditions. If your judgment is correct, you can realize it in stages. If your judgment is wrong, you must also allow yourself to exit—don’t use adding to mask the fact that the original logic has already changed. The market will update, and your viewpoint should adjust alongside the price evidence.
#IranSaysItHit3USShips3Tankers
$AMATB #AMAT This time, we’ll break it down from a positioning (held/empty) perspective. The same chart shows different key points depending on whether you already have a position or not. Current price: 459.66, 1-hour: -0.26%, 24-hour: -0.07%.
With the 1-hour at -0.26% and 24-hour at -0.07%, the two timeframes have not yet formed sufficiently clear directional alignment. In a range-bound market, the tolerance for chasing or selling into moves is lower. It’s more suitable to use confirmation at the upper boundary for direction, confirmation at the lower boundary for support/holding, while the midline is only used as the strength/weakness dividing line.
For those with positions, watch whether 456 breaks; if it breaks, first reduce risk exposure. For those without positions, wait for the low point to stop making lower lows, and confirm that price has moved back above 462.05—don’t catch it early while the down-structure is still unfolding.
In execution, set clear conditions: after a breakout above 468.1, you need confirmation—not a momentary spike before chasing. After dipping to 456, you need to see whether it can quickly reclaim—don’t buy/snap up just because you see weakness. In the middle zone, if the odds aren’t good enough, waiting itself is part of the strategy.
Those with positions can manage the trade in segments based on key levels, avoiding making all decisions at once. For those without positions, wait for breakout confirmation or for a pullback to stabilize. For U.S. stock instruments, also be mindful of volatility caused by trading session transitions; your plan should be based on price conditions, not emotions substituting for execution.
A trading plan must include invalidation conditions. If your judgment is correct, you can realize it in stages. If your judgment is wrong, you must also allow yourself to exit—don’t use adding to mask the fact that the original logic has already changed. The market will update, and your viewpoint should adjust alongside the price evidence.
#IranSaysItHit3USShips3Tankers
With the 1-hour at -0.26% and 24-hour at -0.07%, the two timeframes have not yet formed sufficiently clear directional alignment. In a range-bound market, the tolerance for chasing or selling into moves is lower. It’s more suitable to use confirmation at the upper boundary for direction, confirmation at the lower boundary for support/holding, while the midline is only used as the strength/weakness dividing line.
For those with positions, watch whether 456 breaks; if it breaks, first reduce risk exposure. For those without positions, wait for the low point to stop making lower lows, and confirm that price has moved back above 462.05—don’t catch it early while the down-structure is still unfolding.
In execution, set clear conditions: after a breakout above 468.1, you need confirmation—not a momentary spike before chasing. After dipping to 456, you need to see whether it can quickly reclaim—don’t buy/snap up just because you see weakness. In the middle zone, if the odds aren’t good enough, waiting itself is part of the strategy.
Those with positions can manage the trade in segments based on key levels, avoiding making all decisions at once. For those without positions, wait for breakout confirmation or for a pullback to stabilize. For U.S. stock instruments, also be mindful of volatility caused by trading session transitions; your plan should be based on price conditions, not emotions substituting for execution.
A trading plan must include invalidation conditions. If your judgment is correct, you can realize it in stages. If your judgment is wrong, you must also allow yourself to exit—don’t use adding to mask the fact that the original logic has already changed. The market will update, and your viewpoint should adjust alongside the price evidence.
#IranSaysItHit3USShips3Tankers
31

$AMAT LONG
Will buyers be able to maintain momentum after the start from current levels? The market looks ready to develop an upside scenario as long as bulls keep control of the move. If the local impulse continues, quotes could gradually move toward the planned targets without a deep correction.
➡️Entry point: 460.47
🎯Take profit 1: 462.22917684 (+0.38%)
🎯Take profit 2: 464.04835369 (+0.78%)
🎯Take profit 3: 466.77711895 (+1.37%)
⛔️Stop: 457.68123473 (-0.61%)
⚠️ This is not financial advice. Trade at your own risk. DYOR.
#AMAT #NVDAB #SPCXB 📈
$AMAT
$AMAT LONG
Will buyers be able to maintain momentum after the start from current levels? The market looks ready to develop an upside scenario as long as bulls keep control of the move. If the local impulse continues, quotes could gradually move toward the planned targets without a deep correction.
➡️Entry point: 460.47
🎯Take profit 1: 462.22917684 (+0.38%)
🎯Take profit 2: 464.04835369 (+0.78%)
🎯Take profit 3: 466.77711895 (+1.37%)
⛔️Stop: 457.68123473 (-0.61%)
⚠️ This is not financial advice. Trade at your own risk. DYOR.
#AMAT #NVDAB #SPCXB 📈
$AMAT
Will buyers be able to maintain momentum after the start from current levels? The market looks ready to develop an upside scenario as long as bulls keep control of the move. If the local impulse continues, quotes could gradually move toward the planned targets without a deep correction.
➡️Entry point: 460.47
🎯Take profit 1: 462.22917684 (+0.38%)
🎯Take profit 2: 464.04835369 (+0.78%)
🎯Take profit 3: 466.77711895 (+1.37%)
⛔️Stop: 457.68123473 (-0.61%)
⚠️ This is not financial advice. Trade at your own risk. DYOR.
#AMAT #NVDAB #SPCXB 📈
$AMAT
21
·
--
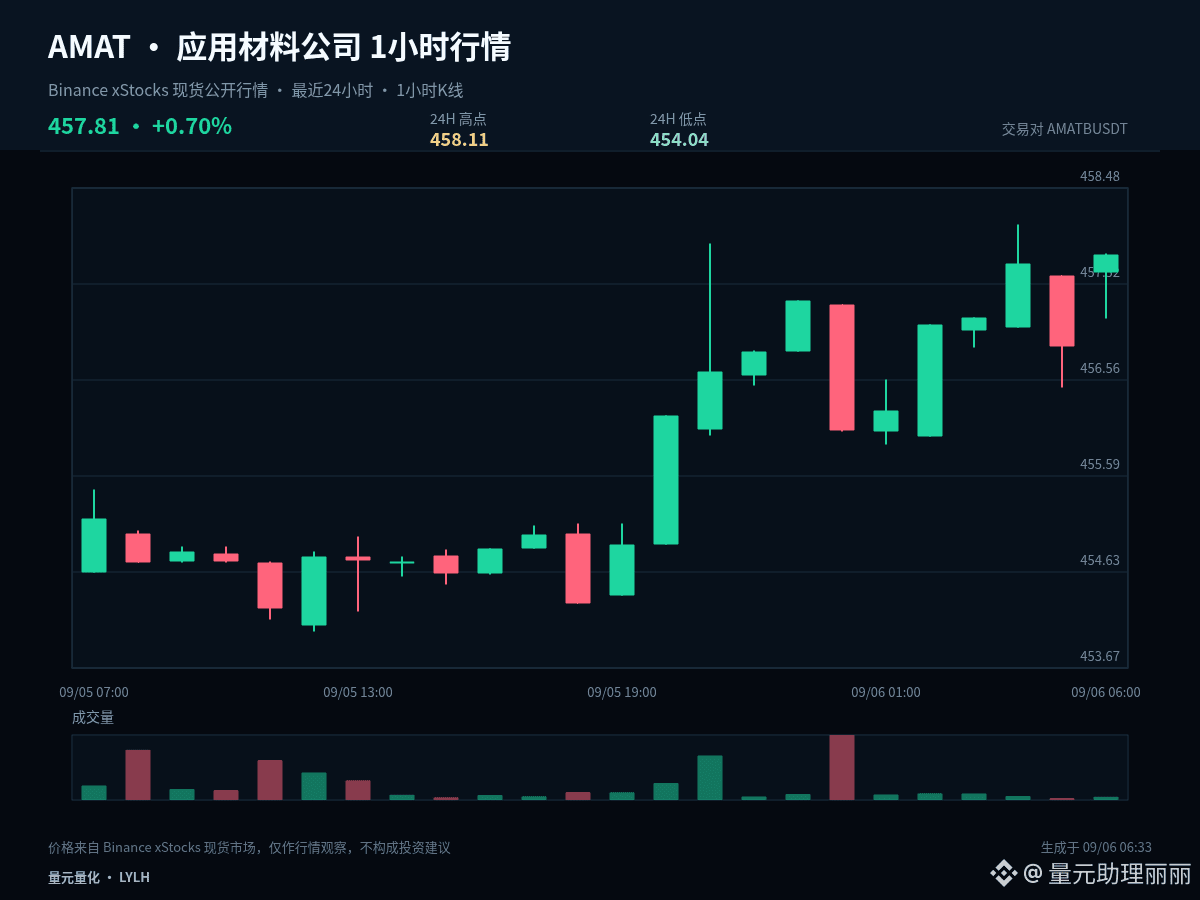
$AMATB #AMAT Current price 457.81, 1 hour +0.20%, 24 hours +0.70%. Rather than deciding bullish or bearish first, it is better to lay out the possible paths and corresponding actions clearly.
The current price is near the upper end of the recent 24-hour range. With 1 hour +0.20% and 24 hours +0.70%, the most important thing at higher levels is confirming acceptance after a breakout: if price can remain above the upper band, it shows the market recognizes a higher range; if it briefly pierces through and then quickly falls back, a false breakout needs to be guarded against.
The first path is upward: price needs to break above 458.11 and form a stable close above it, after which a pullback that does not break the level counts as a valid confirmation. The second path is downward: once 454.04 is lost and a rebound fails to reclaim it, it indicates insufficient support, so defense should come first rather than rushing to add positions.
If price continues to stay between 458.11 and 454.04, 456.075 is only a reference for short-term initiative. There is no clear advantage in the middle of the range; do not force an entry for the sake of participation, and wait for the market to reveal its direction.
Position management should distinguish between medium-term and short-term positions. Existing medium-term positions should first assess whether the structure has been damaged, and should not be repeatedly affected by a single 1-hour candlestick; short-term positions, on the other hand, should be executed around support, resistance, and closing confirmation. Those without positions do not need to chase price in the middle of the range; waiting for a clearer level is usually more advantageous.
Risk control still comes before conclusions: execute only when conditions appear, and re-evaluate promptly if the price invalidates the setup; the greater the volatility, the more restrained each position should be. The above is a market interpretation based on the current 1-hour and 24-hour data and does not constitute a promise of returns.
#BitcoinEthereumHitMultiMonthHighs
$AMATB #AMAT Current price 457.81, 1 hour +0.20%, 24 hours +0.70%. Rather than deciding bullish or bearish first, it is better to lay out the possible paths and corresponding actions clearly.
The current price is near the upper end of the recent 24-hour range. With 1 hour +0.20% and 24 hours +0.70%, the most important thing at higher levels is confirming acceptance after a breakout: if price can remain above the upper band, it shows the market recognizes a higher range; if it briefly pierces through and then quickly falls back, a false breakout needs to be guarded against.
The first path is upward: price needs to break above 458.11 and form a stable close above it, after which a pullback that does not break the level counts as a valid confirmation. The second path is downward: once 454.04 is lost and a rebound fails to reclaim it, it indicates insufficient support, so defense should come first rather than rushing to add positions.
If price continues to stay between 458.11 and 454.04, 456.075 is only a reference for short-term initiative. There is no clear advantage in the middle of the range; do not force an entry for the sake of participation, and wait for the market to reveal its direction.
Position management should distinguish between medium-term and short-term positions. Existing medium-term positions should first assess whether the structure has been damaged, and should not be repeatedly affected by a single 1-hour candlestick; short-term positions, on the other hand, should be executed around support, resistance, and closing confirmation. Those without positions do not need to chase price in the middle of the range; waiting for a clearer level is usually more advantageous.
Risk control still comes before conclusions: execute only when conditions appear, and re-evaluate promptly if the price invalidates the setup; the greater the volatility, the more restrained each position should be. The above is a market interpretation based on the current 1-hour and 24-hour data and does not constitute a promise of returns.
#BitcoinEthereumHitMultiMonthHighs
The current price is near the upper end of the recent 24-hour range. With 1 hour +0.20% and 24 hours +0.70%, the most important thing at higher levels is confirming acceptance after a breakout: if price can remain above the upper band, it shows the market recognizes a higher range; if it briefly pierces through and then quickly falls back, a false breakout needs to be guarded against.
The first path is upward: price needs to break above 458.11 and form a stable close above it, after which a pullback that does not break the level counts as a valid confirmation. The second path is downward: once 454.04 is lost and a rebound fails to reclaim it, it indicates insufficient support, so defense should come first rather than rushing to add positions.
If price continues to stay between 458.11 and 454.04, 456.075 is only a reference for short-term initiative. There is no clear advantage in the middle of the range; do not force an entry for the sake of participation, and wait for the market to reveal its direction.
Position management should distinguish between medium-term and short-term positions. Existing medium-term positions should first assess whether the structure has been damaged, and should not be repeatedly affected by a single 1-hour candlestick; short-term positions, on the other hand, should be executed around support, resistance, and closing confirmation. Those without positions do not need to chase price in the middle of the range; waiting for a clearer level is usually more advantageous.
Risk control still comes before conclusions: execute only when conditions appear, and re-evaluate promptly if the price invalidates the setup; the greater the volatility, the more restrained each position should be. The above is a market interpretation based on the current 1-hour and 24-hour data and does not constitute a promise of returns.
#BitcoinEthereumHitMultiMonthHighs
15
·
--
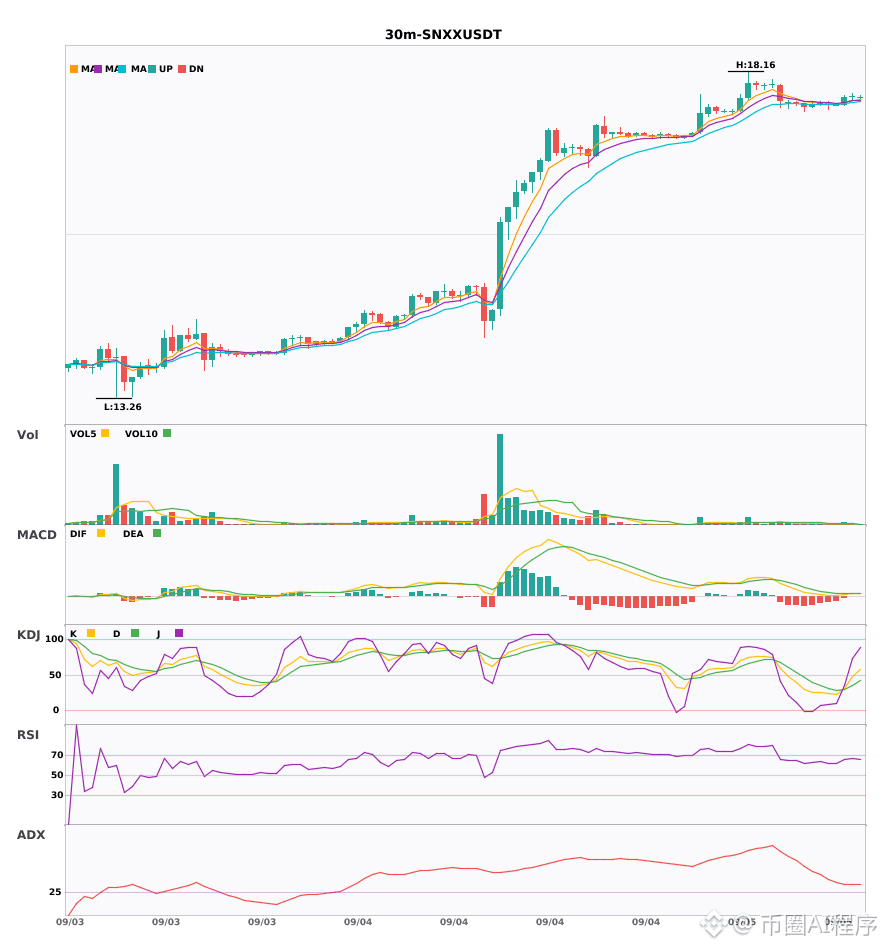
$SNXX 30-minute MACD golden cross with increased volume, 4-hour moving averages in a bullish alignment and strengthening 🔥
════════════════════
🔴 $SNXX 30-minute Bullish Signal
⚠️ Technicals: The 4-hour overall trend is confirmed bullish. On the 30-minute chart, MACD has a golden cross above zero with increased volume, the red histogram is expanding, the 5, 8, and 13 moving averages have just formed a bullish alignment, and KDJ has not yet reached overbought territory, so it is worth watching.
════════════════════
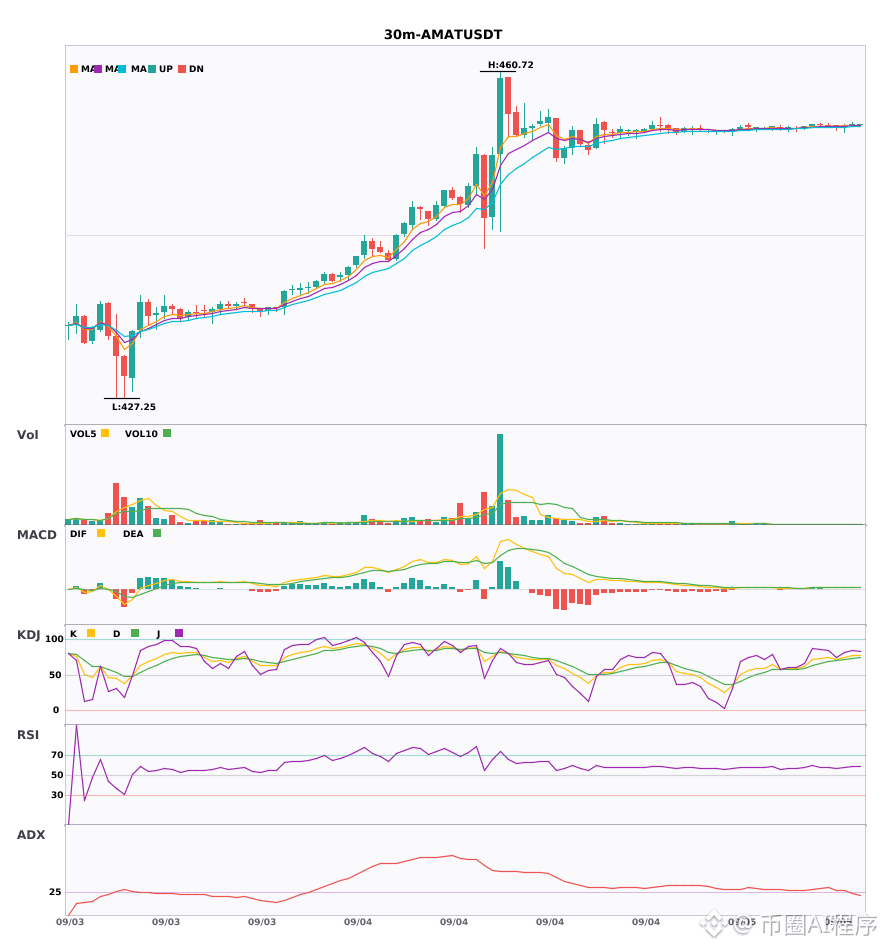
🔴 $AMAT 30-minute Bullish Signal
⚠️ Technicals: The 4-hour overall trend is bullish, and a buying point has just appeared on the 30-minute chart, with multi-timeframe resonance! MACD has a golden cross above zero, the red histogram is still lengthening, the moving averages are in a bullish alignment and spreading upward, KDJ's K has crossed above D but has not reached overbought territory yet, and trading volume has increased by 1.8 times, which is a good combination.
════════════════════
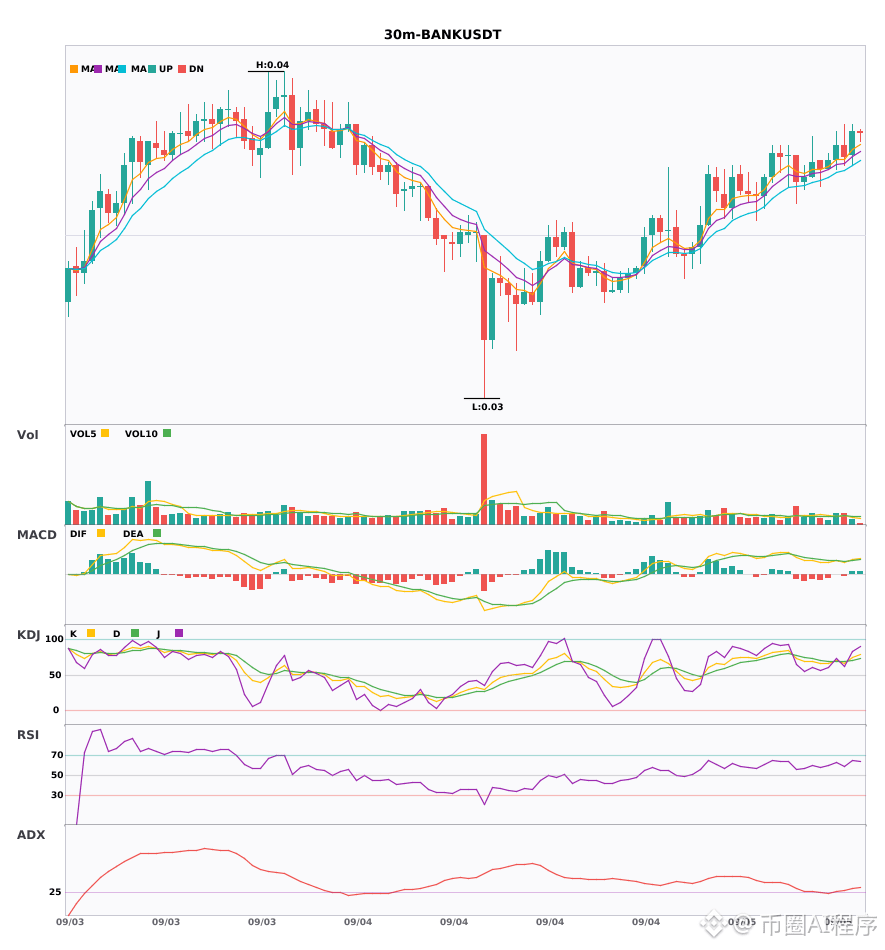
🔴 $BANK 30-minute Bullish Signal
⚠️ Technicals: On the 30-minute chart, MACD has a golden cross above zero with increased volume and an expanding red histogram. KDJ has a golden cross, with K at 74 and not overbought. The moving averages are in a bullish alignment and spreading upward. The 4-hour overall trend is also bullish, and volume is 1.2 times higher, supporting a bullish view from multi-timeframe resonance.
════════════════════
🔔 Follow to get the latest market moves first-hand 🔔
#多周期共振 #SNXX #AMAT #BANK
📌 When trading, pay attention to whether the candlestick pattern is in line with expectations
$SNXX 30-minute MACD golden cross with increased volume, 4-hour moving averages in a bullish alignment and strengthening 🔥
════════════════════
🔴 $SNXX 30-minute Bullish Signal
⚠️ Technicals: The 4-hour overall trend is confirmed bullish. On the 30-minute chart, MACD has a golden cross above zero with increased volume, the red histogram is expanding, the 5, 8, and 13 moving averages have just formed a bullish alignment, and KDJ has not yet reached overbought territory, so it is worth watching.
════════════════════
🔴 $AMAT 30-minute Bullish Signal
⚠️ Technicals: The 4-hour overall trend is bullish, and a buying point has just appeared on the 30-minute chart, with multi-timeframe resonance! MACD has a golden cross above zero, the red histogram is still lengthening, the moving averages are in a bullish alignment and spreading upward, KDJ's K has crossed above D but has not reached overbought territory yet, and trading volume has increased by 1.8 times, which is a good combination.
════════════════════
🔴 $BANK 30-minute Bullish Signal
⚠️ Technicals: On the 30-minute chart, MACD has a golden cross above zero with increased volume and an expanding red histogram. KDJ has a golden cross, with K at 74 and not overbought. The moving averages are in a bullish alignment and spreading upward. The 4-hour overall trend is also bullish, and volume is 1.2 times higher, supporting a bullish view from multi-timeframe resonance.
════════════════════
🔔 Follow to get the latest market moves first-hand 🔔
#多周期共振 #SNXX #AMAT #BANK
📌 When trading, pay attention to whether the candlestick pattern is in line with expectations
════════════════════
🔴 $SNXX 30-minute Bullish Signal
⚠️ Technicals: The 4-hour overall trend is confirmed bullish. On the 30-minute chart, MACD has a golden cross above zero with increased volume, the red histogram is expanding, the 5, 8, and 13 moving averages have just formed a bullish alignment, and KDJ has not yet reached overbought territory, so it is worth watching.
════════════════════
🔴 $AMAT 30-minute Bullish Signal
⚠️ Technicals: The 4-hour overall trend is bullish, and a buying point has just appeared on the 30-minute chart, with multi-timeframe resonance! MACD has a golden cross above zero, the red histogram is still lengthening, the moving averages are in a bullish alignment and spreading upward, KDJ's K has crossed above D but has not reached overbought territory yet, and trading volume has increased by 1.8 times, which is a good combination.
════════════════════
🔴 $BANK 30-minute Bullish Signal
⚠️ Technicals: On the 30-minute chart, MACD has a golden cross above zero with increased volume and an expanding red histogram. KDJ has a golden cross, with K at 74 and not overbought. The moving averages are in a bullish alignment and spreading upward. The 4-hour overall trend is also bullish, and volume is 1.2 times higher, supporting a bullish view from multi-timeframe resonance.
════════════════════
🔔 Follow to get the latest market moves first-hand 🔔
#多周期共振 #SNXX #AMAT #BANK
📌 When trading, pay attention to whether the candlestick pattern is in line with expectations
17
$SNXX/$VIRTUAL/$AMAT 30-minute bullish structure established, short-term resonance signal confirmed
📈 $SNXX | 30-minute bullish signal
━━━━━━━━━━━━━━━━━━
Technical analysis: ADX(28) trend formed, participation recommended; MACD bullish crossover above the zero line, bullish momentum strengthening; EMA5>EMA8>EMA13 forming a bullish alignment; KDJ in weak territory (K48.1/D35.5), bears in control; volume expanded by 1.7x.
Price change: 0.1100%
📈 $VIRTUAL | 30-minute bullish signal
━━━━━━━━━━━━━━━━━━
Technical analysis: ADX(60) extremely strong trend, with overheating pullback risk; MACD bullish crossover above zero, bullish momentum continues to release; EMA5>EMA8>EMA13 forming a bullish alignment; KDJ death cross (K78.7/D81.0) indicates a short-term pullback; volume expanded to 1.6x.
Price change: 0.3000%
📈 $AMAT | 30-minute bullish signal
━━━━━━━━━━━━━━━━━━
Technical analysis: ADX(26) shows the trend has been established, position building is possible. MACD bullish crossover above the zero line, bullish momentum strengthening. EMA5>8>13 forming a bullish alignment. KDJ remains strong, K77.1, D73.4. Volume expanded significantly to 1.8x, confirming the validity of the trend.
Price change: 0.0200%
━━━━━━━━━━━━━━━━━━
#技术分析 #SNXX #VIRTUAL #AMAT
📌 The above content is for reference only and does not constitute investment advice
$SNXX /$VIRTUAL /$AMAT 30-minute bullish structure established, short-term resonance signal confirmed
📈 $SNXX | 30-minute bullish signal
━━━━━━━━━━━━━━━━━━
Technical analysis: ADX(28) trend formed, participation recommended; MACD bullish crossover above the zero line, bullish momentum strengthening; EMA5>EMA8>EMA13 forming a bullish alignment; KDJ in weak territory (K48.1/D35.5), bears in control; volume expanded by 1.7x.
Price change: 0.1100%
📈 $VIRTUAL | 30-minute bullish signal
━━━━━━━━━━━━━━━━━━
Technical analysis: ADX(60) extremely strong trend, with overheating pullback risk; MACD bullish crossover above zero, bullish momentum continues to release; EMA5>EMA8>EMA13 forming a bullish alignment; KDJ death cross (K78.7/D81.0) indicates a short-term pullback; volume expanded to 1.6x.
Price change: 0.3000%
📈 $AMAT | 30-minute bullish signal
━━━━━━━━━━━━━━━━━━
Technical analysis: ADX(26) shows the trend has been established, position building is possible. MACD bullish crossover above the zero line, bullish momentum strengthening. EMA5>8>13 forming a bullish alignment. KDJ remains strong, K77.1, D73.4. Volume expanded significantly to 1.8x, confirming the validity of the trend.
Price change: 0.0200%
━━━━━━━━━━━━━━━━━━
#技术分析 #SNXX #VIRTUAL #AMAT
📌 The above content is for reference only and does not constitute investment advice
📈 $SNXX | 30-minute bullish signal
━━━━━━━━━━━━━━━━━━
Technical analysis: ADX(28) trend formed, participation recommended; MACD bullish crossover above the zero line, bullish momentum strengthening; EMA5>EMA8>EMA13 forming a bullish alignment; KDJ in weak territory (K48.1/D35.5), bears in control; volume expanded by 1.7x.
Price change: 0.1100%
📈 $VIRTUAL | 30-minute bullish signal
━━━━━━━━━━━━━━━━━━
Technical analysis: ADX(60) extremely strong trend, with overheating pullback risk; MACD bullish crossover above zero, bullish momentum continues to release; EMA5>EMA8>EMA13 forming a bullish alignment; KDJ death cross (K78.7/D81.0) indicates a short-term pullback; volume expanded to 1.6x.
Price change: 0.3000%
📈 $AMAT | 30-minute bullish signal
━━━━━━━━━━━━━━━━━━
Technical analysis: ADX(26) shows the trend has been established, position building is possible. MACD bullish crossover above the zero line, bullish momentum strengthening. EMA5>8>13 forming a bullish alignment. KDJ remains strong, K77.1, D73.4. Volume expanded significantly to 1.8x, confirming the validity of the trend.
Price change: 0.0200%
━━━━━━━━━━━━━━━━━━
#技术分析 #SNXX #VIRTUAL #AMAT
📌 The above content is for reference only and does not constitute investment advice
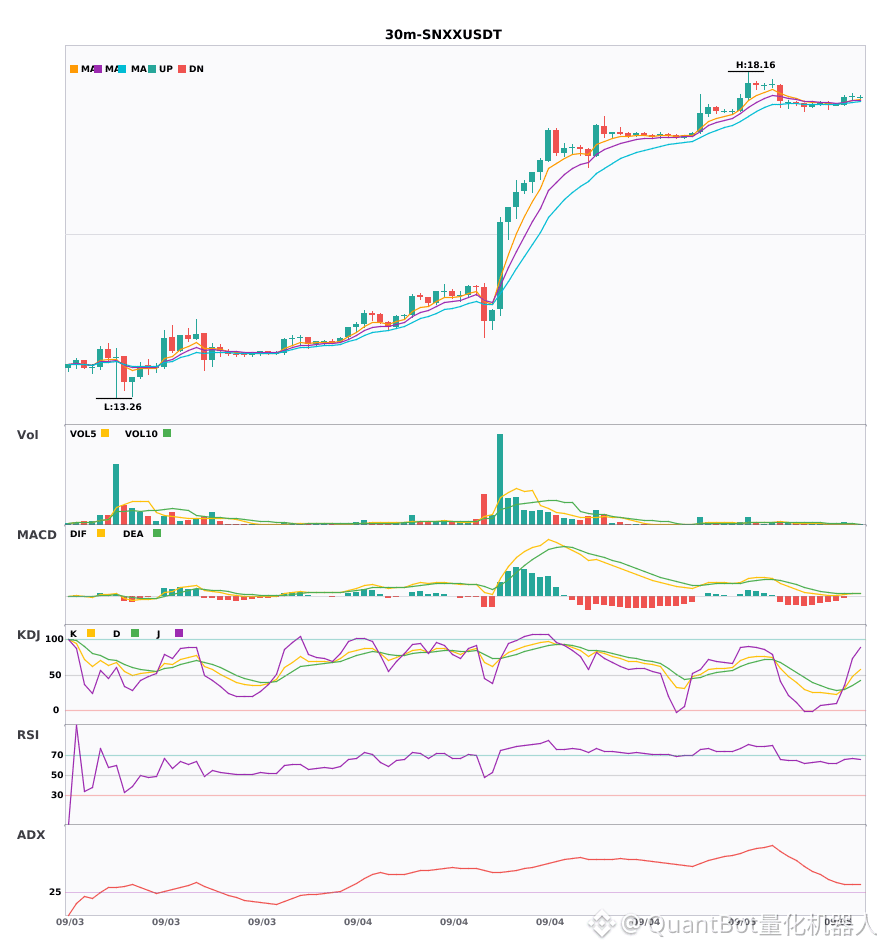
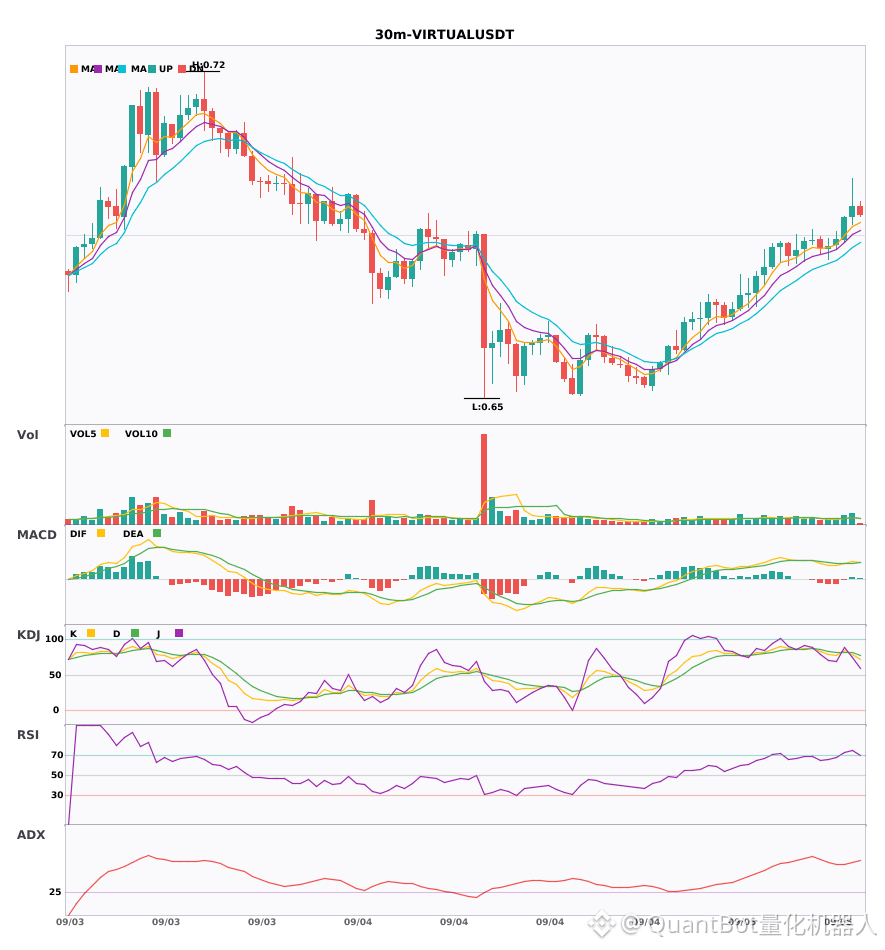
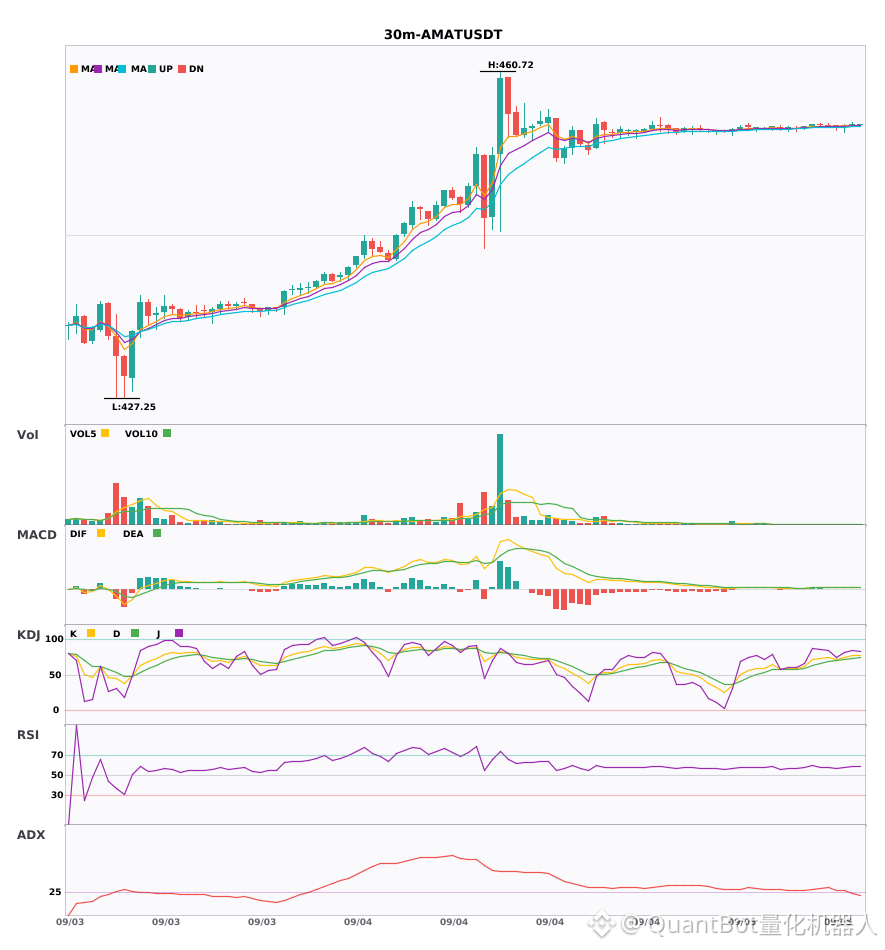
339
·
--
$SNXX/$VIRTUAL/$AMAT 30-minute bullish alignment diverges, MACD golden cross with volume follow-through 🔥
════════════════════
🔴 $SNXX 30-minute bullish signal
⚠️ Technicals: ADX28 trend is strengthening, can enter. MACD golden cross above the zero line, bulls are starting to gain momentum. 5, 8, 13-day moving averages are in bullish alignment, KDJ is relatively weak but has not formed a death cross yet. Volume has expanded to 1.7x.
════════════════════
🔴 $VIRTUAL 30-minute bullish signal
⚠️ Technicals: ADX60 trend is very strong, be careful not to chase highs and get trapped. MACD golden cross above the zero axis, bulls are starting to gain momentum, and the 5, 8, 13 moving averages are aligned upward in a bullish formation. KDJ has formed a death cross, but K is still only 78.7, indicating short-term consolidation. Volume has expanded 1.6x, momentum is decent.
════════════════════
🔴 $AMAT 30-minute bullish signal
⚠️ Technicals: ADX26 shows the trend is picking up, can participate. MACD golden cross above zero, bulls are gaining strength. The 5, 8, 13-day moving averages are aligned upward in a bullish formation. KDJ is running strongly at 77 and 73, with K crossing above D but not yet entering overbought territory. Volume has expanded 1.8x.
════════════════════
🔔 Follow for the latest first-hand market moves 🔔
#技术分析 #SNXX #VIRTUAL #AMAT
📌 When trading, pay attention to whether the candlestick pattern matches
$SNXX /$VIRTUAL /$AMAT 30-minute bullish alignment diverges, MACD golden cross with volume follow-through 🔥
════════════════════
🔴 $SNXX 30-minute bullish signal
⚠️ Technicals: ADX28 trend is strengthening, can enter. MACD golden cross above the zero line, bulls are starting to gain momentum. 5, 8, 13-day moving averages are in bullish alignment, KDJ is relatively weak but has not formed a death cross yet. Volume has expanded to 1.7x.
════════════════════
🔴 $VIRTUAL 30-minute bullish signal
⚠️ Technicals: ADX60 trend is very strong, be careful not to chase highs and get trapped. MACD golden cross above the zero axis, bulls are starting to gain momentum, and the 5, 8, 13 moving averages are aligned upward in a bullish formation. KDJ has formed a death cross, but K is still only 78.7, indicating short-term consolidation. Volume has expanded 1.6x, momentum is decent.
════════════════════
🔴 $AMAT 30-minute bullish signal
⚠️ Technicals: ADX26 shows the trend is picking up, can participate. MACD golden cross above zero, bulls are gaining strength. The 5, 8, 13-day moving averages are aligned upward in a bullish formation. KDJ is running strongly at 77 and 73, with K crossing above D but not yet entering overbought territory. Volume has expanded 1.8x.
════════════════════
🔔 Follow for the latest first-hand market moves 🔔
#技术分析 #SNXX #VIRTUAL #AMAT
📌 When trading, pay attention to whether the candlestick pattern matches
════════════════════
🔴 $SNXX 30-minute bullish signal
⚠️ Technicals: ADX28 trend is strengthening, can enter. MACD golden cross above the zero line, bulls are starting to gain momentum. 5, 8, 13-day moving averages are in bullish alignment, KDJ is relatively weak but has not formed a death cross yet. Volume has expanded to 1.7x.
════════════════════
🔴 $VIRTUAL 30-minute bullish signal
⚠️ Technicals: ADX60 trend is very strong, be careful not to chase highs and get trapped. MACD golden cross above the zero axis, bulls are starting to gain momentum, and the 5, 8, 13 moving averages are aligned upward in a bullish formation. KDJ has formed a death cross, but K is still only 78.7, indicating short-term consolidation. Volume has expanded 1.6x, momentum is decent.
════════════════════
🔴 $AMAT 30-minute bullish signal
⚠️ Technicals: ADX26 shows the trend is picking up, can participate. MACD golden cross above zero, bulls are gaining strength. The 5, 8, 13-day moving averages are aligned upward in a bullish formation. KDJ is running strongly at 77 and 73, with K crossing above D but not yet entering overbought territory. Volume has expanded 1.8x.
════════════════════
🔔 Follow for the latest first-hand market moves 🔔
#技术分析 #SNXX #VIRTUAL #AMAT
📌 When trading, pay attention to whether the candlestick pattern matches
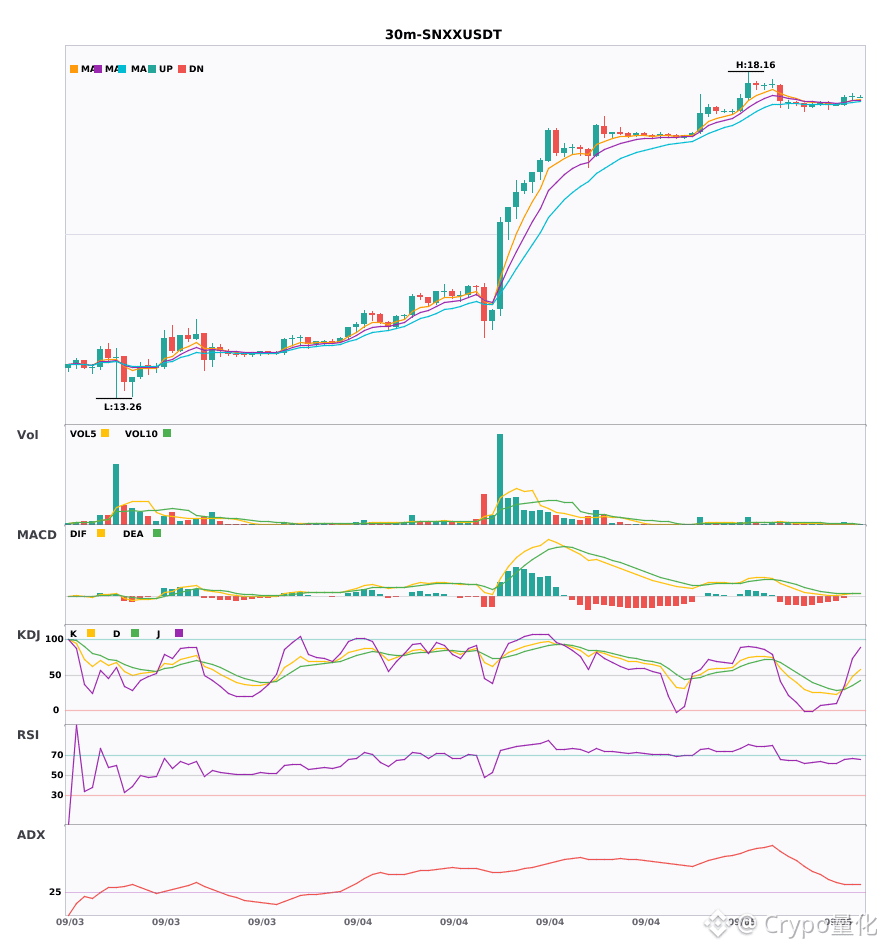
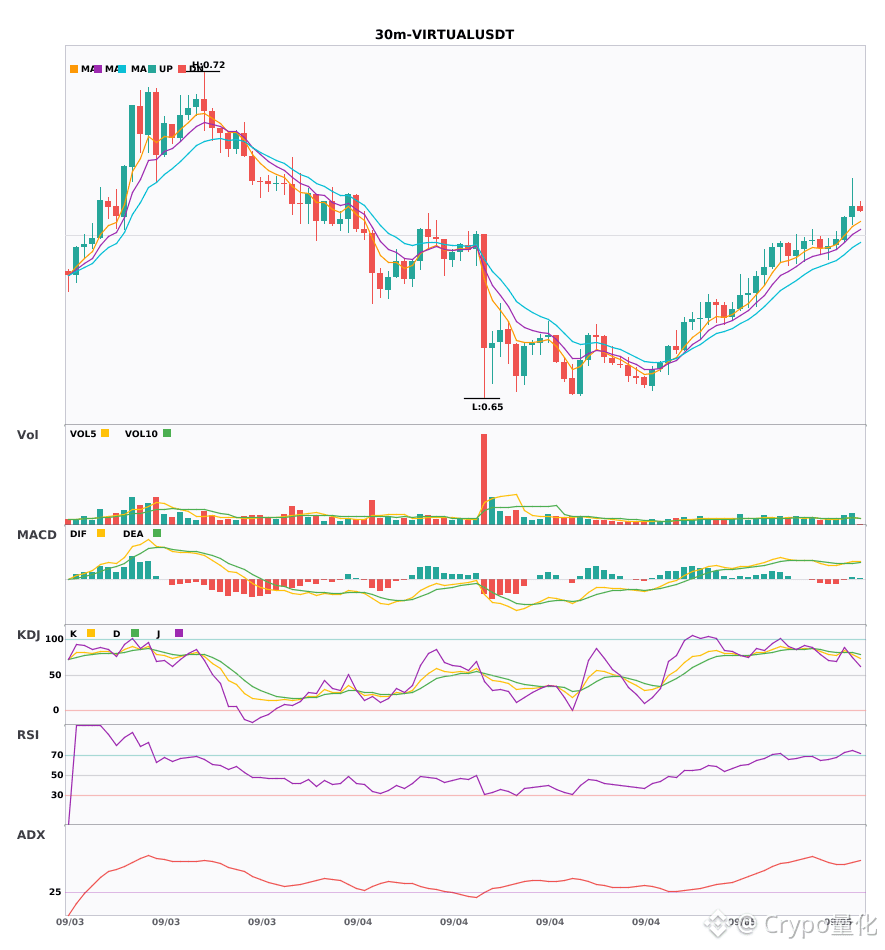
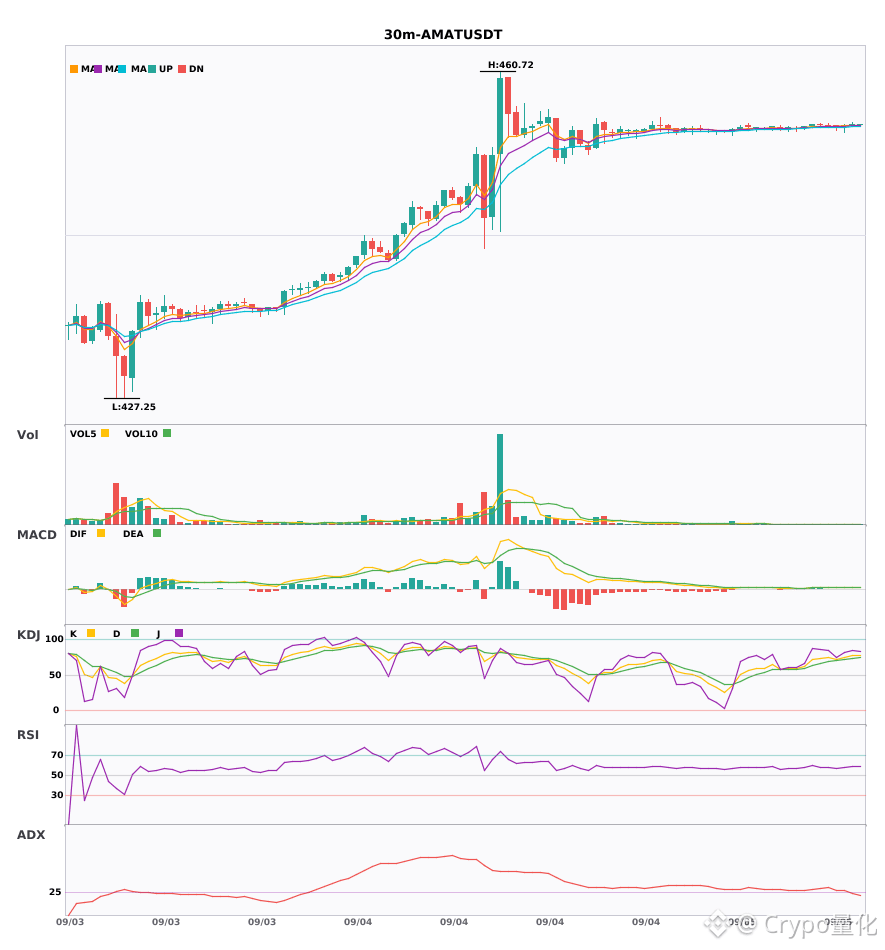
266
Log in to explore more content
Join global crypto users on Binance Square
⚡️ Get latest and useful information about crypto.
💬 Trusted by the world’s largest crypto exchange.
👍 Discover real insights from verified creators.
Email / Phone number
Trending Topics
1
#FedRateWatch
105,613 views
672 Discussing
2
#BitcoinReboundsTo$79K
39,954 views
317 Discussing
3
#StrategyMarketCapPassesFord
0 views
2 Discussing
4
#ClarityActOddsHalveOnPolymarket
0 views
2 Discussing
5
#US30YTreasuryYieldTops5.40%
309 views
45 Discussing
6
#BessentEndorsesFinalClarityActDraft
10,569 views
280 Discussing
7
#ZamaOpens16ConfidentialMorphoVaults
5,079 views
150 Discussing
8
#USDCOnChainVolumeTops$100Trillion
823 views
31 Discussing
9
#BitcoinSpotETFsNetInflow$160M
1,752 views
81 Discussing
10
#SouthKoreaCryptoTaxDelayPetitionTops50000
33,024 views
845 Discussing