
#nvdab
nvdab
56,474 views
1,495 Discussing
Hot
Latest

·
--
Silicon Slide: NVIDIA bStock Treads Water on Binance Spot 📉
NVIDIA Corp’s tokenized share $NVDAB (NVDAB/USDT) is trading at $172.27 on Binance Spot, down 2.36 % over the past 24 hours. The candle closed near its low, signalling waning buying pressure after a recent rally.
Why it matters: Nvidia remains a bellwether for AI‑driven chip demand, yet muted earnings guidance has cooled enthusiasm across the sector.
Key levels – Support sits around $165.00, a solid psychological floor backed by recent buying clusters. Resistance hovers near $180.00, where sellers previously stepped in. Mid‑range equilibrium is roughly $172.50, acting as a pivot for short‑term bias.
Outlook (cautious): The recent decline looks stretched; a pullback toward the $165 support zone is likely if momentum stalls. Watch volume and any fresh AI‑sector data for confirmation before any upside re‑entry.
#NVDAB #Stocks #BinanceSquare
Silicon Slide: NVIDIA bStock Treads Water on Binance Spot 📉
NVIDIA Corp’s tokenized share $NVDAB (NVDAB/USDT) is trading at $172.27 on Binance Spot, down 2.36 % over the past 24 hours. The candle closed near its low, signalling waning buying pressure after a recent rally.
Why it matters: Nvidia remains a bellwether for AI‑driven chip demand, yet muted earnings guidance has cooled enthusiasm across the sector.
Key levels – Support sits around $165.00, a solid psychological floor backed by recent buying clusters. Resistance hovers near $180.00, where sellers previously stepped in. Mid‑range equilibrium is roughly $172.50, acting as a pivot for short‑term bias.
Outlook (cautious): The recent decline looks stretched; a pullback toward the $165 support zone is likely if momentum stalls. Watch volume and any fresh AI‑sector data for confirmation before any upside re‑entry.
#NVDAB #Stocks #BinanceSquare
NVIDIA Corp’s tokenized share $NVDAB (NVDAB/USDT) is trading at $172.27 on Binance Spot, down 2.36 % over the past 24 hours. The candle closed near its low, signalling waning buying pressure after a recent rally.
Why it matters: Nvidia remains a bellwether for AI‑driven chip demand, yet muted earnings guidance has cooled enthusiasm across the sector.
Key levels – Support sits around $165.00, a solid psychological floor backed by recent buying clusters. Resistance hovers near $180.00, where sellers previously stepped in. Mid‑range equilibrium is roughly $172.50, acting as a pivot for short‑term bias.
Outlook (cautious): The recent decline looks stretched; a pullback toward the $165 support zone is likely if momentum stalls. Watch volume and any fresh AI‑sector data for confirmation before any upside re‑entry.
#NVDAB #Stocks #BinanceSquare

🚨 NVIDIA ($NVDAB) Market Watch: Is This a Buying Opportunity or a Warning Sign?The NVIDIA market is entering a critical phase as investors closely monitor recent developments surrounding CEO Jensen Huang.
Following reports of a foreign intelligence-related investigation and the board's independent review, NVIDIA shares experienced a decline of approximately 4% in one trading session.
Now, all eyes are on three important upcoming dates:
📅 November 12: Live market preview with Burak Finance on Binance Square.
📊 November 17: NVIDIA's Q3 earnings announcement after the US market close.
🏛️ November 18: Expected congressional briefing request involving CEO Jensen Huang.
What Should Investors Watch?
The biggest question is whether the recent price decline represents a temporary market correction or the beginning of deeper uncertainty.
Here are three key factors to monitor:
Market Sentiment: How are investors reacting to the latest developments?
Earnings Performance: Can NVIDIA deliver strong revenue and earnings growth?
Future Outlook: Will management guidance restore investor confidence?
💡 My Market Perspective:
The upcoming earnings report could become an important turning point for NVIDIA. Strong financial results and positive guidance may help improve sentiment, while continued uncertainty could increase volatility.
For now, patience and confirmation are more important than emotional trading.
🔥 What's your view? Is $NVDAB preparing for a recovery, or should investors remain cautious?
Share your thoughts in the comments!
NVIDIA #NVDAB #Crypto #BinanceSquare #MarketAnalysis #EarningsPreview #Tradin
🚨 NVIDIA ($NVDAB) Market Watch: Is This a Buying Opportunity or a Warning Sign?
The NVIDIA market is entering a critical phase as investors closely monitor recent developments surrounding CEO Jensen Huang.
Following reports of a foreign intelligence-related investigation and the board's independent review, NVIDIA shares experienced a decline of approximately 4% in one trading session.
Now, all eyes are on three important upcoming dates:
📅 November 12: Live market preview with Burak Finance on Binance Square.
📊 November 17: NVIDIA's Q3 earnings announcement after the US market close.
🏛️ November 18: Expected congressional briefing request involving CEO Jensen Huang.
What Should Investors Watch?
The biggest question is whether the recent price decline represents a temporary market correction or the beginning of deeper uncertainty.
Here are three key factors to monitor:
Market Sentiment: How are investors reacting to the latest developments?
Earnings Performance: Can NVIDIA deliver strong revenue and earnings growth?
Future Outlook: Will management guidance restore investor confidence?
💡 My Market Perspective:
The upcoming earnings report could become an important turning point for NVIDIA. Strong financial results and positive guidance may help improve sentiment, while continued uncertainty could increase volatility.
For now, patience and confirmation are more important than emotional trading.
🔥 What's your view? Is $NVDAB preparing for a recovery, or should investors remain cautious?
Share your thoughts in the comments!
NVIDIA #NVDAB #Crypto #BinanceSquare #MarketAnalysis #EarningsPreview #Tradin
Following reports of a foreign intelligence-related investigation and the board's independent review, NVIDIA shares experienced a decline of approximately 4% in one trading session.
Now, all eyes are on three important upcoming dates:
📅 November 12: Live market preview with Burak Finance on Binance Square.
📊 November 17: NVIDIA's Q3 earnings announcement after the US market close.
🏛️ November 18: Expected congressional briefing request involving CEO Jensen Huang.
What Should Investors Watch?
The biggest question is whether the recent price decline represents a temporary market correction or the beginning of deeper uncertainty.
Here are three key factors to monitor:
Market Sentiment: How are investors reacting to the latest developments?
Earnings Performance: Can NVIDIA deliver strong revenue and earnings growth?
Future Outlook: Will management guidance restore investor confidence?
💡 My Market Perspective:
The upcoming earnings report could become an important turning point for NVIDIA. Strong financial results and positive guidance may help improve sentiment, while continued uncertainty could increase volatility.
For now, patience and confirmation are more important than emotional trading.
🔥 What's your view? Is $NVDAB preparing for a recovery, or should investors remain cautious?
Share your thoughts in the comments!
NVIDIA #NVDAB #Crypto #BinanceSquare #MarketAnalysis #EarningsPreview #Tradin
96

·
--
Can $NVDAB hold its recent range after a soft daily dip?
Trading at $179.62 down 0.86% on $56.03M volume, price action shows mild cooling rather than panic.
Hourly momentum slowed as the latest close dipped to $178.86 with below-average volume activity.
A sustained move back above the $183.64 high could invite bullish continuation attempts. Conversely, losing the $170.82 low boundary invalidates the stabilization thesis.
Will buyers reclaim the upper resistance zone first, or will a breakdown test lower structural limits?
Tap $NVDAB for the live chart. #NVDAB #BinanceSquare
Can $NVDAB hold its recent range after a soft daily dip?
Trading at $179.62 down 0.86% on $56.03M volume, price action shows mild cooling rather than panic.
Hourly momentum slowed as the latest close dipped to $178.86 with below-average volume activity.
A sustained move back above the $183.64 high could invite bullish continuation attempts. Conversely, losing the $170.82 low boundary invalidates the stabilization thesis.
Will buyers reclaim the upper resistance zone first, or will a breakdown test lower structural limits?
Tap $NVDAB for the live chart. #NVDAB #BinanceSquare
Trading at $179.62 down 0.86% on $56.03M volume, price action shows mild cooling rather than panic.
Hourly momentum slowed as the latest close dipped to $178.86 with below-average volume activity.
A sustained move back above the $183.64 high could invite bullish continuation attempts. Conversely, losing the $170.82 low boundary invalidates the stabilization thesis.
Will buyers reclaim the upper resistance zone first, or will a breakdown test lower structural limits?
Tap $NVDAB for the live chart. #NVDAB #BinanceSquare
11

·
--
$NVDAB -4.59% | $SPCXB +4.49% | $UNI -0.46%
#NVDAB slipped to $178.28, down 4.59% on $45.1 M of volume, indicating sellers are stepping in despite the still‑healthy turnover.
#SPCXB rose to $141.16, up 4.49% with $44.0 M traded, showing a modest but clear buying interest that outpaces its peers.
#UNI hovered at $6.94, barely down 0.46% while $39.6 M changed hands, a sign the token’s core activity remains steady even as price nudges lower. 📊
The divergence between NVDAB’s drop and SPCXB’s rise may hint at sector rotation within this slice of the market.
#Write2Earn #Binance
$NVDAB -4.59% | $SPCXB +4.49% | $UNI -0.46%
#NVDAB slipped to $178.28, down 4.59% on $45.1 M of volume, indicating sellers are stepping in despite the still‑healthy turnover.
#SPCXB rose to $141.16, up 4.49% with $44.0 M traded, showing a modest but clear buying interest that outpaces its peers.
#UNI hovered at $6.94, barely down 0.46% while $39.6 M changed hands, a sign the token’s core activity remains steady even as price nudges lower. 📊
The divergence between NVDAB’s drop and SPCXB’s rise may hint at sector rotation within this slice of the market.
#Write2Earn #Binance
#NVDAB slipped to $178.28, down 4.59% on $45.1 M of volume, indicating sellers are stepping in despite the still‑healthy turnover.
#SPCXB rose to $141.16, up 4.49% with $44.0 M traded, showing a modest but clear buying interest that outpaces its peers.
#UNI hovered at $6.94, barely down 0.46% while $39.6 M changed hands, a sign the token’s core activity remains steady even as price nudges lower. 📊
The divergence between NVDAB’s drop and SPCXB’s rise may hint at sector rotation within this slice of the market.
#Write2Earn #Binance
3

·
--
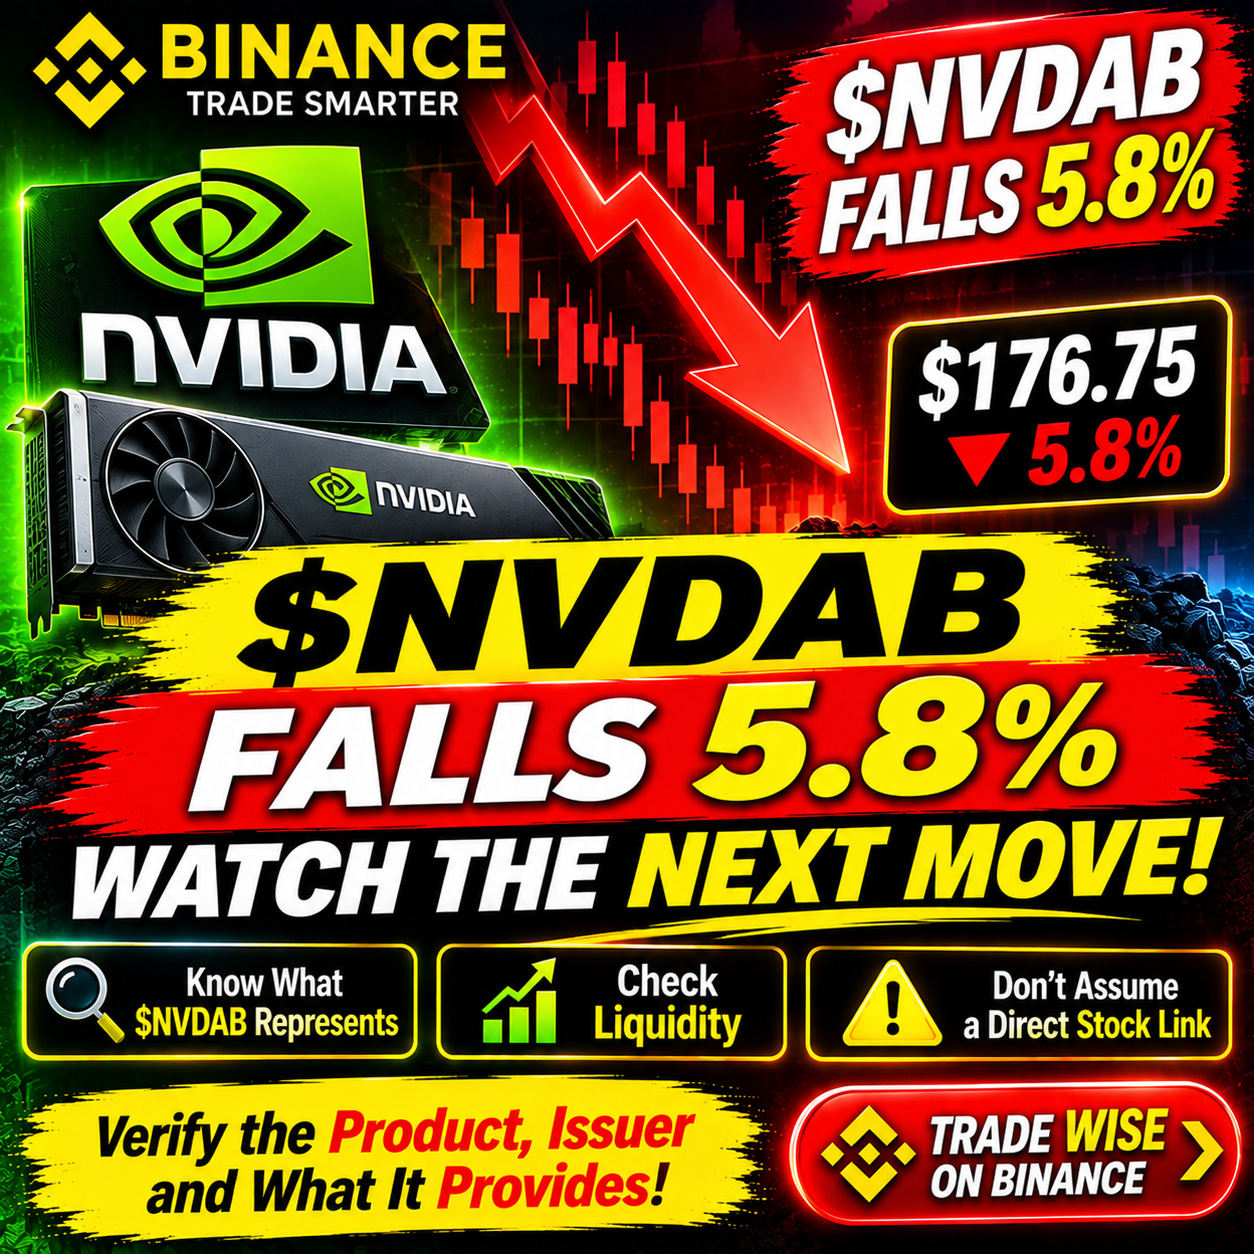
📉 $NVDAB FALLS 5.8% — WATCH THE NEXT MOVE!
The $NVDAB asset in your list is trading near $176.75, down 5.8%. Before drawing conclusions, verify the exact product, its issuer, and what rights or exposure the token provides. If it tracks a traditional asset, both the underlying market and token-specific liquidity can matter. Don't confuse a ticker with direct stock ownership.
#NVDAB
#TokenizedAssets #MarketWatch #TradingNews #BinanceSquare
{spot}(NVDABUSDT)
📉 $NVDAB FALLS 5.8% — WATCH THE NEXT MOVE!
The $NVDAB asset in your list is trading near $176.75, down 5.8%. Before drawing conclusions, verify the exact product, its issuer, and what rights or exposure the token provides. If it tracks a traditional asset, both the underlying market and token-specific liquidity can matter. Don't confuse a ticker with direct stock ownership.
#NVDAB
#TokenizedAssets #MarketWatch #TradingNews #BinanceSquare
The $NVDAB asset in your list is trading near $176.75, down 5.8%. Before drawing conclusions, verify the exact product, its issuer, and what rights or exposure the token provides. If it tracks a traditional asset, both the underlying market and token-specific liquidity can matter. Don't confuse a ticker with direct stock ownership.
#NVDAB
#TokenizedAssets #MarketWatch #TradingNews #BinanceSquare
1
1

·
--
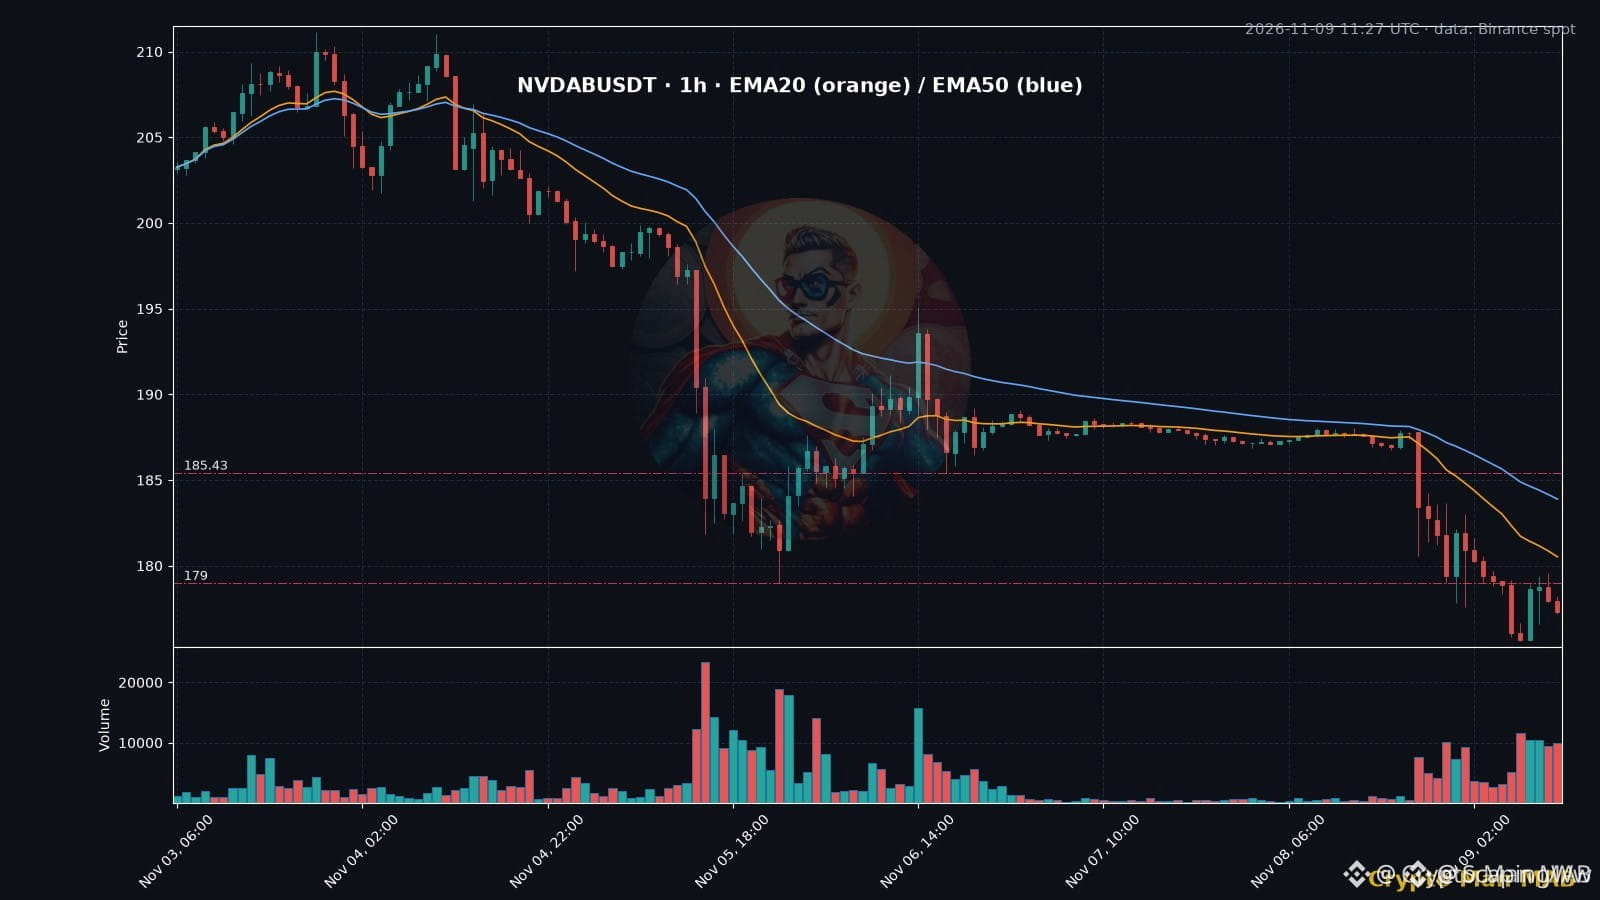
🚨 $NVDAB CRACKING BELOW KEY SUPPORT AS SELLERS LEAN HARD INTO EVERY BOUNCE 📉
Entry: 179 ⚡
Target: 185 🚀
Stop Loss: 175.6 ⚠️
Weekend headline shocks cracked the order books, dragging price straight past the November crash wicks into a fragile local low at 175.6. 📊 Volume remains lethargic on recovery attempts, signaling that sellers are actively squatting on every minor relief rally.
To claw back market control, bulls need an aggressive reclaim of 179 followed by a solid defense of the 185 shelf. ⚡ As the main US session opens up, expect high-frequency volatility to test whether this structural floor holds or gives way to deeper downside. 💬 Are you waiting for a confirmed reclaim above 179 or shorting the weak bounces right here? 👇
⚠️ Not financial advice. Always manage your risk. 🛡️
🏷️ #NVDAB #BearTrap #MarketStructure #Trading
🔥 💎
🚨 $NVDAB CRACKING BELOW KEY SUPPORT AS SELLERS LEAN HARD INTO EVERY BOUNCE 📉
Entry: 179 ⚡
Target: 185 🚀
Stop Loss: 175.6 ⚠️
Weekend headline shocks cracked the order books, dragging price straight past the November crash wicks into a fragile local low at 175.6. 📊 Volume remains lethargic on recovery attempts, signaling that sellers are actively squatting on every minor relief rally.
To claw back market control, bulls need an aggressive reclaim of 179 followed by a solid defense of the 185 shelf. ⚡ As the main US session opens up, expect high-frequency volatility to test whether this structural floor holds or gives way to deeper downside. 💬 Are you waiting for a confirmed reclaim above 179 or shorting the weak bounces right here? 👇
⚠️ Not financial advice. Always manage your risk. 🛡️
🏷️ #NVDAB #BearTrap #MarketStructure #Trading
🔥 💎
Entry: 179 ⚡
Target: 185 🚀
Stop Loss: 175.6 ⚠️
Weekend headline shocks cracked the order books, dragging price straight past the November crash wicks into a fragile local low at 175.6. 📊 Volume remains lethargic on recovery attempts, signaling that sellers are actively squatting on every minor relief rally.
To claw back market control, bulls need an aggressive reclaim of 179 followed by a solid defense of the 185 shelf. ⚡ As the main US session opens up, expect high-frequency volatility to test whether this structural floor holds or gives way to deeper downside. 💬 Are you waiting for a confirmed reclaim above 179 or shorting the weak bounces right here? 👇
⚠️ Not financial advice. Always manage your risk. 🛡️
🏷️ #NVDAB #BearTrap #MarketStructure #Trading
🔥 💎
3

·
--
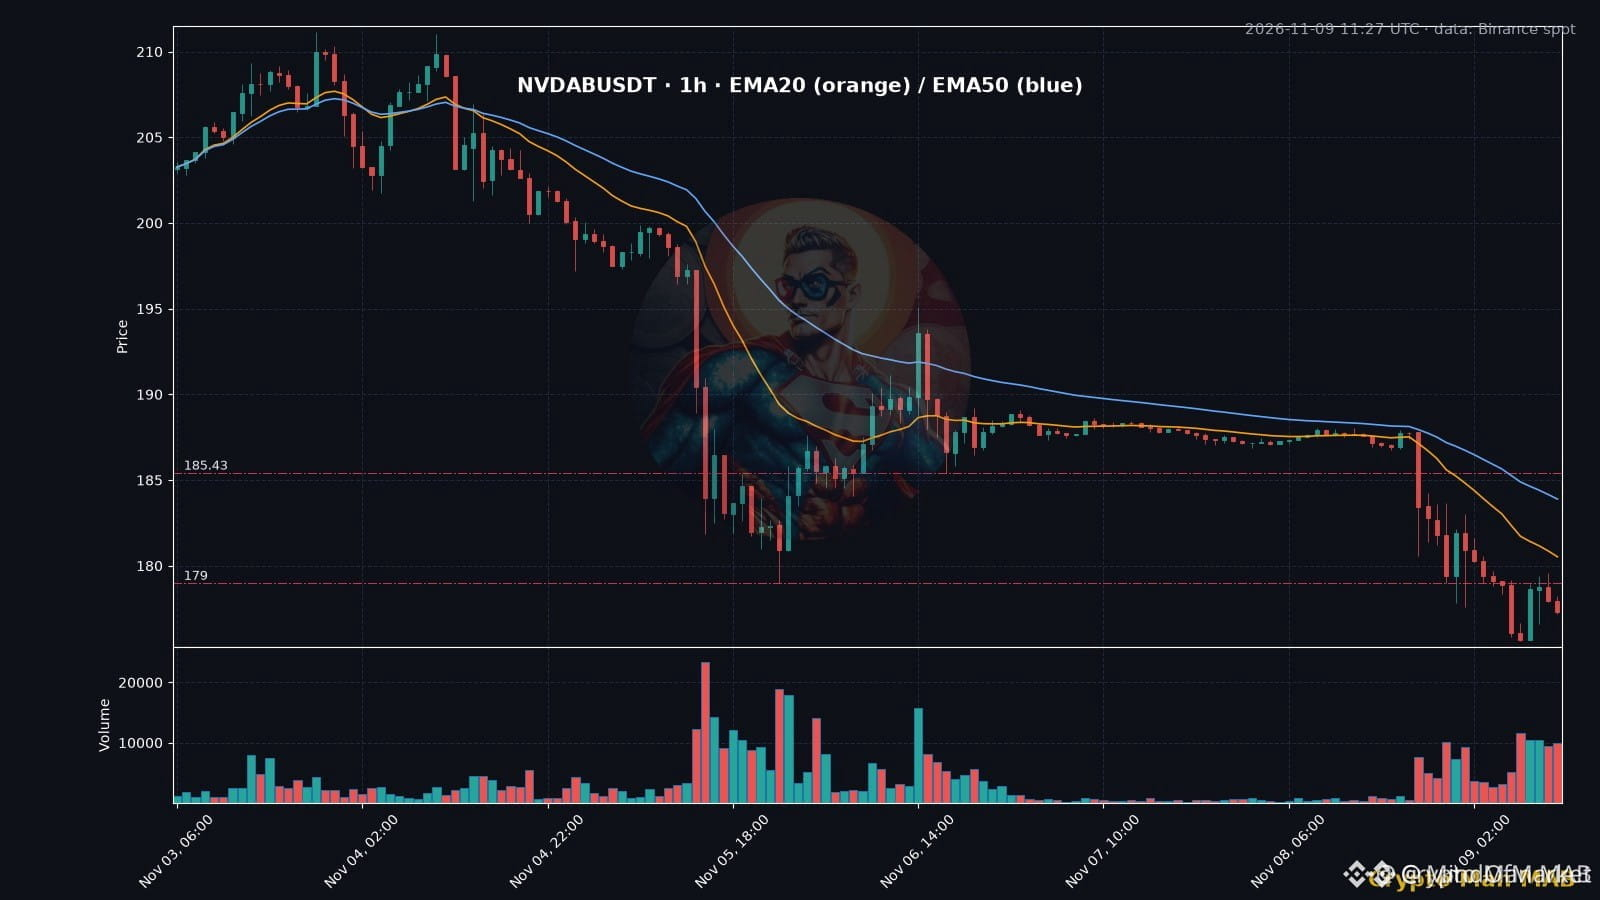
🚨 $NVDAB TESTING CRITICAL SUPPORT AS INSTITUTIONAL SELLERS LEAN ON EVERY BOUNCE 📉
Entry: 177 ⚡
Stop Loss: 179 ⚠️
Weekend consolidation around 187 evaporated instantly when headline flow triggered an aggressive 4H liquidity sweep down to 179 and subsequently 175.6. Price action is currently flagging a tired bounce toward 177, where institutional supply continues to absorb incoming bids without hesitation. 📊
The 175.6 print breached the November 5 sweep low, leaving an unprotected vacuum down into the lower 170 range if buyers fail to defend this immediate shelf. To neutralize this bearish market structure, price must reclaim 179 before attempting a recovery toward the 185 liquidity cluster. ⚡
Are you fading these weak intraday relief bounces or waiting for a confirmed structural reclaim? 💬
⚠️ Not financial advice. Always manage your risk. 🛡️
🏷️ #NVDAB #ShortSetup #OrderFlow #Liquidity
🔥 💎
🚨 $NVDAB TESTING CRITICAL SUPPORT AS INSTITUTIONAL SELLERS LEAN ON EVERY BOUNCE 📉
Entry: 177 ⚡
Stop Loss: 179 ⚠️
Weekend consolidation around 187 evaporated instantly when headline flow triggered an aggressive 4H liquidity sweep down to 179 and subsequently 175.6. Price action is currently flagging a tired bounce toward 177, where institutional supply continues to absorb incoming bids without hesitation. 📊
The 175.6 print breached the November 5 sweep low, leaving an unprotected vacuum down into the lower 170 range if buyers fail to defend this immediate shelf. To neutralize this bearish market structure, price must reclaim 179 before attempting a recovery toward the 185 liquidity cluster. ⚡
Are you fading these weak intraday relief bounces or waiting for a confirmed structural reclaim? 💬
⚠️ Not financial advice. Always manage your risk. 🛡️
🏷️ #NVDAB #ShortSetup #OrderFlow #Liquidity
🔥 💎
Entry: 177 ⚡
Stop Loss: 179 ⚠️
Weekend consolidation around 187 evaporated instantly when headline flow triggered an aggressive 4H liquidity sweep down to 179 and subsequently 175.6. Price action is currently flagging a tired bounce toward 177, where institutional supply continues to absorb incoming bids without hesitation. 📊
The 175.6 print breached the November 5 sweep low, leaving an unprotected vacuum down into the lower 170 range if buyers fail to defend this immediate shelf. To neutralize this bearish market structure, price must reclaim 179 before attempting a recovery toward the 185 liquidity cluster. ⚡
Are you fading these weak intraday relief bounces or waiting for a confirmed structural reclaim? 💬
⚠️ Not financial advice. Always manage your risk. 🛡️
🏷️ #NVDAB #ShortSetup #OrderFlow #Liquidity
🔥 💎
5

·
--
Can a 2.93x volume spike stabilize $NVDAB near $177.83?
Volume surged as hourly closes ticked up 1.69% to 178.62, easing a 5.18% daily decline on $17.01M in total volume.
A bullish continuation scenario requires reclaiming the 188.06 range high.
Conversely, dropping below the 175.59 range low invalidates this immediate stabilization thesis.
Will buyers defend the recent hourly momentum, or does a break of 175.59 signal deeper risk?
Tap $NVDAB for the live chart. #NVDAB #BinanceSquare
Can a 2.93x volume spike stabilize $NVDAB near $177.83?
Volume surged as hourly closes ticked up 1.69% to 178.62, easing a 5.18% daily decline on $17.01M in total volume.
A bullish continuation scenario requires reclaiming the 188.06 range high.
Conversely, dropping below the 175.59 range low invalidates this immediate stabilization thesis.
Will buyers defend the recent hourly momentum, or does a break of 175.59 signal deeper risk?
Tap $NVDAB for the live chart. #NVDAB #BinanceSquare
Volume surged as hourly closes ticked up 1.69% to 178.62, easing a 5.18% daily decline on $17.01M in total volume.
A bullish continuation scenario requires reclaiming the 188.06 range high.
Conversely, dropping below the 175.59 range low invalidates this immediate stabilization thesis.
Will buyers defend the recent hourly momentum, or does a break of 175.59 signal deeper risk?
Tap $NVDAB for the live chart. #NVDAB #BinanceSquare
1
·
--
$NVDAB trades at $178.80 on $11.30M volume after a 4.42% daily drop.
Hourly volume sits at 1.36x the recent average while price tests the lower boundary of its 24-hour range near 177.61.
A bullish scenario requires holding above 177.61 and reclaiming the 188.06 upper range boundary to resume upward momentum. Conversely, dropping below 177.61 invalidates this setup and exposes deeper downside risk.
Will you wait for a confirmed reclaim of 188.06, or does a break below 177.61 signal the start of a broader correction?
Tap $NVDAB for the live chart. #NVDAB #BinanceSquare
$NVDAB trades at $178.80 on $11.30M volume after a 4.42% daily drop.
Hourly volume sits at 1.36x the recent average while price tests the lower boundary of its 24-hour range near 177.61.
A bullish scenario requires holding above 177.61 and reclaiming the 188.06 upper range boundary to resume upward momentum. Conversely, dropping below 177.61 invalidates this setup and exposes deeper downside risk.
Will you wait for a confirmed reclaim of 188.06, or does a break below 177.61 signal the start of a broader correction?
Tap $NVDAB for the live chart. #NVDAB #BinanceSquare
Hourly volume sits at 1.36x the recent average while price tests the lower boundary of its 24-hour range near 177.61.
A bullish scenario requires holding above 177.61 and reclaiming the 188.06 upper range boundary to resume upward momentum. Conversely, dropping below 177.61 invalidates this setup and exposes deeper downside risk.
Will you wait for a confirmed reclaim of 188.06, or does a break below 177.61 signal the start of a broader correction?
Tap $NVDAB for the live chart. #NVDAB #BinanceSquare
·
--
Volume spiked 4.68x on the latest hourly close near $180.9.
$NVDAB trades at $180.55 after a 3.45% daily dip, holding inside a 24-hour range between 177.82 and 188.06.
A bullish scenario requires holding above the 177.82 low to test higher boundaries. The invalidation risk remains a drop below that range low on sustained volume.
Will buyers defend the 177.82 low, or does breaking beneath it signal deeper downside?
Tap $NVDAB for the live chart. #NVDAB #BinanceSquare
Volume spiked 4.68x on the latest hourly close near $180.9.
$NVDAB trades at $180.55 after a 3.45% daily dip, holding inside a 24-hour range between 177.82 and 188.06.
A bullish scenario requires holding above the 177.82 low to test higher boundaries. The invalidation risk remains a drop below that range low on sustained volume.
Will buyers defend the 177.82 low, or does breaking beneath it signal deeper downside?
Tap $NVDAB for the live chart. #NVDAB #BinanceSquare
$NVDAB trades at $180.55 after a 3.45% daily dip, holding inside a 24-hour range between 177.82 and 188.06.
A bullish scenario requires holding above the 177.82 low to test higher boundaries. The invalidation risk remains a drop below that range low on sustained volume.
Will buyers defend the 177.82 low, or does breaking beneath it signal deeper downside?
Tap $NVDAB for the live chart. #NVDAB #BinanceSquare
28

·
--
$NVDAB Why should I believe Trump's endorsement means I should blindly go long on NVDAB?
It’s up single digits ahead of earnings, and this week’s hearing could hammer it down.
RSI is over 70—are you chasing an overbought stock?
Institutions unloaded just over 600,000 shares, and retail investors are left holding the bag and selling at a loss, huh?#NVDAB
{future}(NVDABUSDT)
$NVDAB Why should I believe Trump's endorsement means I should blindly go long on NVDAB?
It’s up single digits ahead of earnings, and this week’s hearing could hammer it down.
RSI is over 70—are you chasing an overbought stock?
Institutions unloaded just over 600,000 shares, and retail investors are left holding the bag and selling at a loss, huh?#NVDAB
It’s up single digits ahead of earnings, and this week’s hearing could hammer it down.
RSI is over 70—are you chasing an overbought stock?
Institutions unloaded just over 600,000 shares, and retail investors are left holding the bag and selling at a loss, huh?#NVDAB
136

Folks, things are picking up: the $NVDAB 5-minute volume ratio is 8.0, and trading is flowing like a floodgate just opened.
Price -1.09%, current price 172.12.
Volume has surged, and excitement is heating up.
The sharper the drop, the more likely emotions are to run high.
#NVDAB
Folks, things are picking up: the $NVDAB 5-minute volume ratio is 8.0, and trading is flowing like a floodgate just opened.
Price -1.09%, current price 172.12.
Volume has surged, and excitement is heating up.
The sharper the drop, the more likely emotions are to run high.
#NVDAB
Price -1.09%, current price 172.12.
Volume has surged, and excitement is heating up.
The sharper the drop, the more likely emotions are to run high.
#NVDAB
2

·
--
$NVDAB 5-minute volume surge anomaly: trading volume is 23.6 times the average ($1.89 million), while the price is down 1.39% over the same period.
Rising volume and falling prices indicate concentrated selling, so exercise caution in the short term. If volume later contracts and the price stabilizes, that would suggest panic selling has been cleared.
#NVDAB
$NVDAB 5-minute volume surge anomaly: trading volume is 23.6 times the average ($1.89 million), while the price is down 1.39% over the same period.
Rising volume and falling prices indicate concentrated selling, so exercise caution in the short term. If volume later contracts and the price stabilizes, that would suggest panic selling has been cleared.
#NVDAB
Rising volume and falling prices indicate concentrated selling, so exercise caution in the short term. If volume later contracts and the price stabilizes, that would suggest panic selling has been cleared.
#NVDAB

🔍 Today, I noticed NVDAB moving forward with renewed hope, as if carrying a tiny grain of joy in a volatile market. But don’t forget, the horizon is still unclear, and opportunities come with unrecorded risks. 🌱💬
Sometimes fluctuations wake us up and ask: “Should I keep going or turn back?” I always choose to observe, take notes, and stay flexible.
This is not investment advice.
#CryptoCommunity #CryptoLife #StayCurious #NVDAB #Write2Earn
🔍 Today, I noticed NVDAB moving forward with renewed hope, as if carrying a tiny grain of joy in a volatile market. But don’t forget, the horizon is still unclear, and opportunities come with unrecorded risks. 🌱💬
Sometimes fluctuations wake us up and ask: “Should I keep going or turn back?” I always choose to observe, take notes, and stay flexible.
This is not investment advice.
#CryptoCommunity #CryptoLife #StayCurious #NVDAB #Write2Earn
Sometimes fluctuations wake us up and ask: “Should I keep going or turn back?” I always choose to observe, take notes, and stay flexible.
This is not investment advice.
#CryptoCommunity #CryptoLife #StayCurious #NVDAB #Write2Earn

54

·
--
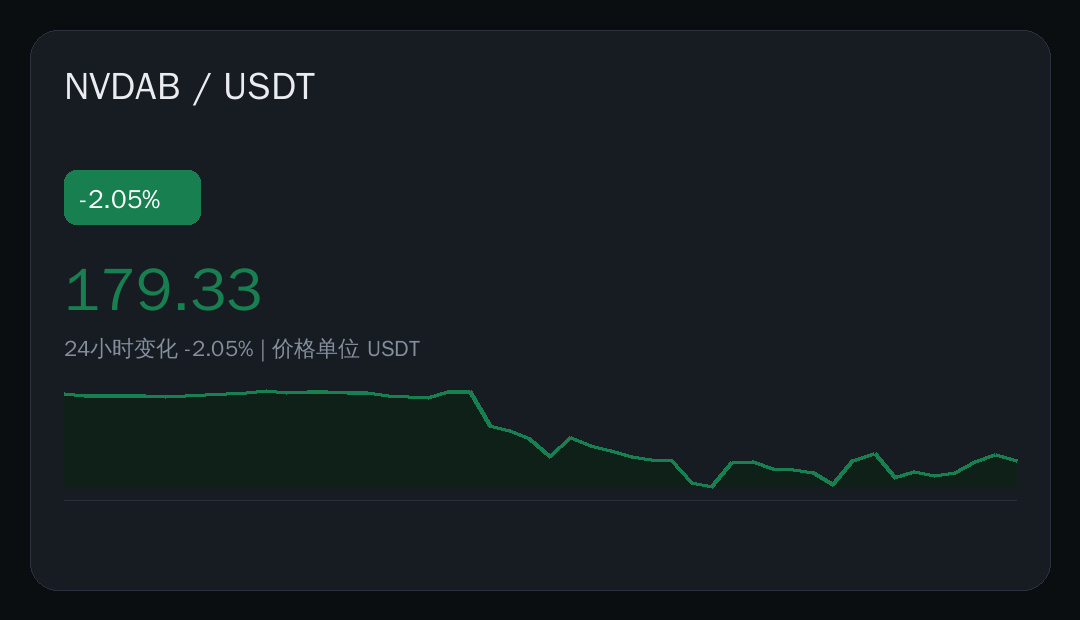
🩸 Under pressure: $NVDAB 24 hours -2.05%, current price 179.33 USDT.
📊 Data snapshot
· Current price: 179.33 USDT
· 24h: -2.05%
· Range: 170.82 — 183.11
· Trading volume: 56141783.50 USDT
This move has been pretty grueling. It swept up and down, then drifted back near where it started. The volume says more than the price does—buyers and sellers are clearly still wrestling at this level. Don’t get trigger-happy every time there’s a swing. There’s no shame in watching more and trading less until the market makes itself clear.
Volatility doesn’t equal opportunity
Share your thoughts in the comments 👇
#市场观察 #NVDAB #Binance
🩸 Under pressure: $NVDAB 24 hours -2.05%, current price 179.33 USDT.
📊 Data snapshot
· Current price: 179.33 USDT
· 24h: -2.05%
· Range: 170.82 — 183.11
· Trading volume: 56141783.50 USDT
This move has been pretty grueling. It swept up and down, then drifted back near where it started. The volume says more than the price does—buyers and sellers are clearly still wrestling at this level. Don’t get trigger-happy every time there’s a swing. There’s no shame in watching more and trading less until the market makes itself clear.
Volatility doesn’t equal opportunity
Share your thoughts in the comments 👇
#市场观察 #NVDAB #Binance
📊 Data snapshot
· Current price: 179.33 USDT
· 24h: -2.05%
· Range: 170.82 — 183.11
· Trading volume: 56141783.50 USDT
This move has been pretty grueling. It swept up and down, then drifted back near where it started. The volume says more than the price does—buyers and sellers are clearly still wrestling at this level. Don’t get trigger-happy every time there’s a swing. There’s no shame in watching more and trading less until the market makes itself clear.
Volatility doesn’t equal opportunity
Share your thoughts in the comments 👇
#市场观察 #NVDAB #Binance
61

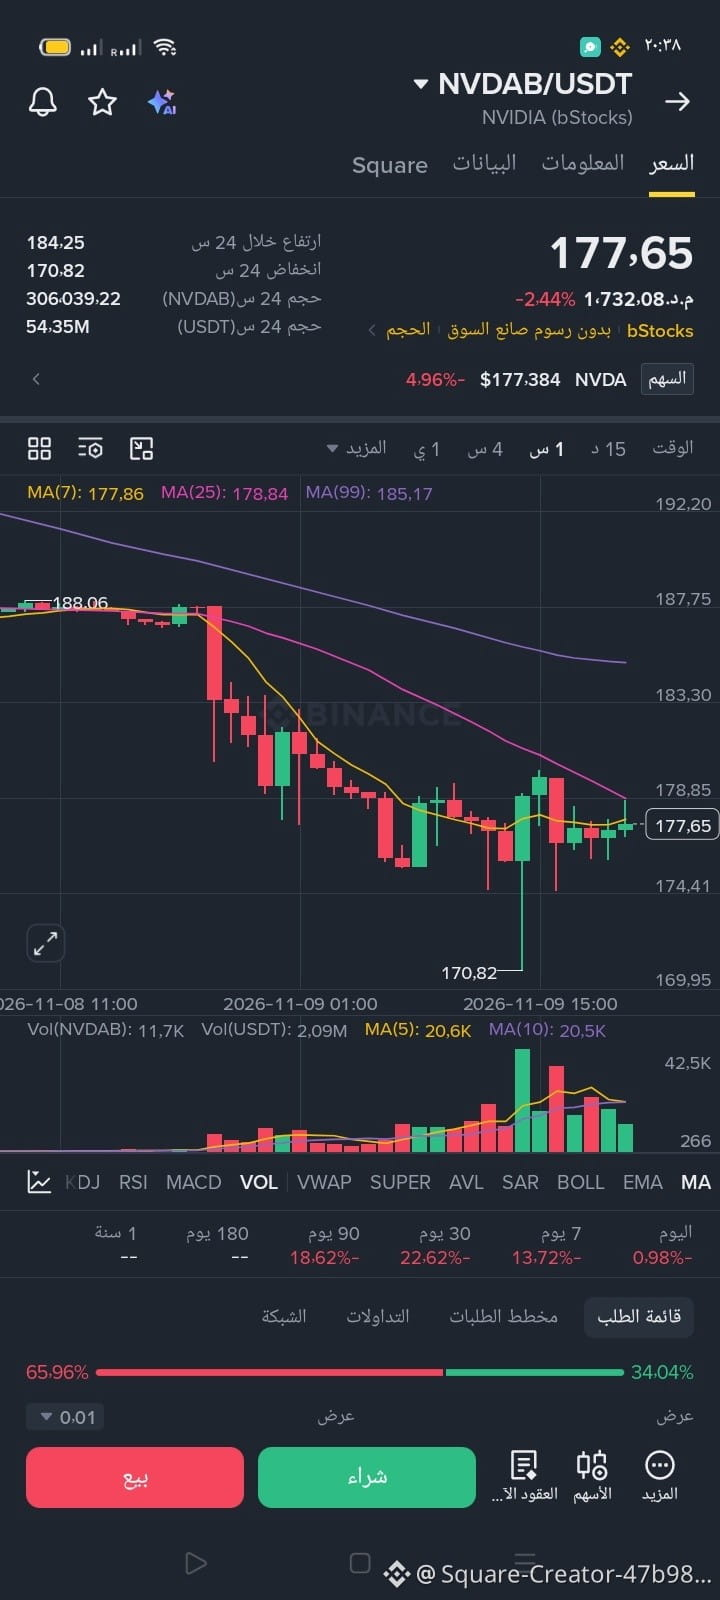
$NVDAB 💰 Current price: $177.65 (-4.96%).
🔴 Overall trend: Strongly bearish in the short term, with temporary sideways fluctuation between $174.40 and $178.85 and no confirmation of a bullish reversal.
$NVDAB 🟢 Support levels:
$174.40
$170.82 (major support).
🔴 Resistance levels:
$178.85
$183.30 (strong resistance).
📈 Bullish scenario: A breakout above $178.85 with a clear close and increased trading volume could push the price toward $183.30.
📉 Bearish scenario: A break below $174.40 could lead to a test of $170.82; breaking below it would increase selling pressure.
🎯 Trading strategy: It is preferable to wait for a breakout above $178.85 followed by a successful retest, or for a clear bullish rebound from the $170.82 support area.
⚠️ Summary: The trend remains negative, and the current rebound is not enough to confirm a trend reversal. It is best to wait for a clear signal before entering and to set a stop-loss.$NVDAB
#NVDAB #Binance
{spot}(NVDABUSDT)
$NVDAB 💰 Current price: $177.65 (-4.96%).
🔴 Overall trend: Strongly bearish in the short term, with temporary sideways fluctuation between $174.40 and $178.85 and no confirmation of a bullish reversal.
$NVDAB 🟢 Support levels:
$174.40
$170.82 (major support).
🔴 Resistance levels:
$178.85
$183.30 (strong resistance).
📈 Bullish scenario: A breakout above $178.85 with a clear close and increased trading volume could push the price toward $183.30.
📉 Bearish scenario: A break below $174.40 could lead to a test of $170.82; breaking below it would increase selling pressure.
🎯 Trading strategy: It is preferable to wait for a breakout above $178.85 followed by a successful retest, or for a clear bullish rebound from the $170.82 support area.
⚠️ Summary: The trend remains negative, and the current rebound is not enough to confirm a trend reversal. It is best to wait for a clear signal before entering and to set a stop-loss.$NVDAB
#NVDAB #Binance
🔴 Overall trend: Strongly bearish in the short term, with temporary sideways fluctuation between $174.40 and $178.85 and no confirmation of a bullish reversal.
$NVDAB 🟢 Support levels:
$174.40
$170.82 (major support).
🔴 Resistance levels:
$178.85
$183.30 (strong resistance).
📈 Bullish scenario: A breakout above $178.85 with a clear close and increased trading volume could push the price toward $183.30.
📉 Bearish scenario: A break below $174.40 could lead to a test of $170.82; breaking below it would increase selling pressure.
🎯 Trading strategy: It is preferable to wait for a breakout above $178.85 followed by a successful retest, or for a clear bullish rebound from the $170.82 support area.
⚠️ Summary: The trend remains negative, and the current rebound is not enough to confirm a trend reversal. It is best to wait for a clear signal before entering and to set a stop-loss.$NVDAB
#NVDAB #Binance
75

·
--
$NVDAB Current price: $179.13, down 2.0% over 24 hours, with $57M in trading volume and a 3.5% range—volatility is low, but the direction is weak 📉
RSI(14) is only 48, hovering just below neutral. Neither bulls nor bears have much strength. The trend is clearly bearish, and volume is still shrinking. That suggests selling pressure isn’t too fierce, but buyers are even more hesitant—a classic “no one’s stepping in” situation 👀
In a slow decline on shrinking volume like this, the biggest risk is chasing shorts—you could easily enter right before a rebound. But don’t rush to buy the dip either: shrinking volume doesn’t mean the price has bottomed; it just means fewer people are trading. My approach: wait for a volume signal—either a high-volume break below the previous low to confirm weakness, or a high-volume move back above the moving average before considering a rebound 💡
For short-term traders, watch more and trade less while waiting for the setup to become clearer. If you’re holding a position, manage your risk and don’t stubbornly hold on ⚠️
What do you think? Let’s discuss in the comments.
$NVDAB #NVDAB #MarketAnalysis
$NVDAB Current price: $179.13, down 2.0% over 24 hours, with $57M in trading volume and a 3.5% range—volatility is low, but the direction is weak 📉
RSI(14) is only 48, hovering just below neutral. Neither bulls nor bears have much strength. The trend is clearly bearish, and volume is still shrinking. That suggests selling pressure isn’t too fierce, but buyers are even more hesitant—a classic “no one’s stepping in” situation 👀
In a slow decline on shrinking volume like this, the biggest risk is chasing shorts—you could easily enter right before a rebound. But don’t rush to buy the dip either: shrinking volume doesn’t mean the price has bottomed; it just means fewer people are trading. My approach: wait for a volume signal—either a high-volume break below the previous low to confirm weakness, or a high-volume move back above the moving average before considering a rebound 💡
For short-term traders, watch more and trade less while waiting for the setup to become clearer. If you’re holding a position, manage your risk and don’t stubbornly hold on ⚠️
What do you think? Let’s discuss in the comments.
$NVDAB #NVDAB #MarketAnalysis
RSI(14) is only 48, hovering just below neutral. Neither bulls nor bears have much strength. The trend is clearly bearish, and volume is still shrinking. That suggests selling pressure isn’t too fierce, but buyers are even more hesitant—a classic “no one’s stepping in” situation 👀
In a slow decline on shrinking volume like this, the biggest risk is chasing shorts—you could easily enter right before a rebound. But don’t rush to buy the dip either: shrinking volume doesn’t mean the price has bottomed; it just means fewer people are trading. My approach: wait for a volume signal—either a high-volume break below the previous low to confirm weakness, or a high-volume move back above the moving average before considering a rebound 💡
For short-term traders, watch more and trade less while waiting for the setup to become clearer. If you’re holding a position, manage your risk and don’t stubbornly hold on ⚠️
What do you think? Let’s discuss in the comments.
$NVDAB #NVDAB #MarketAnalysis
3
·
--
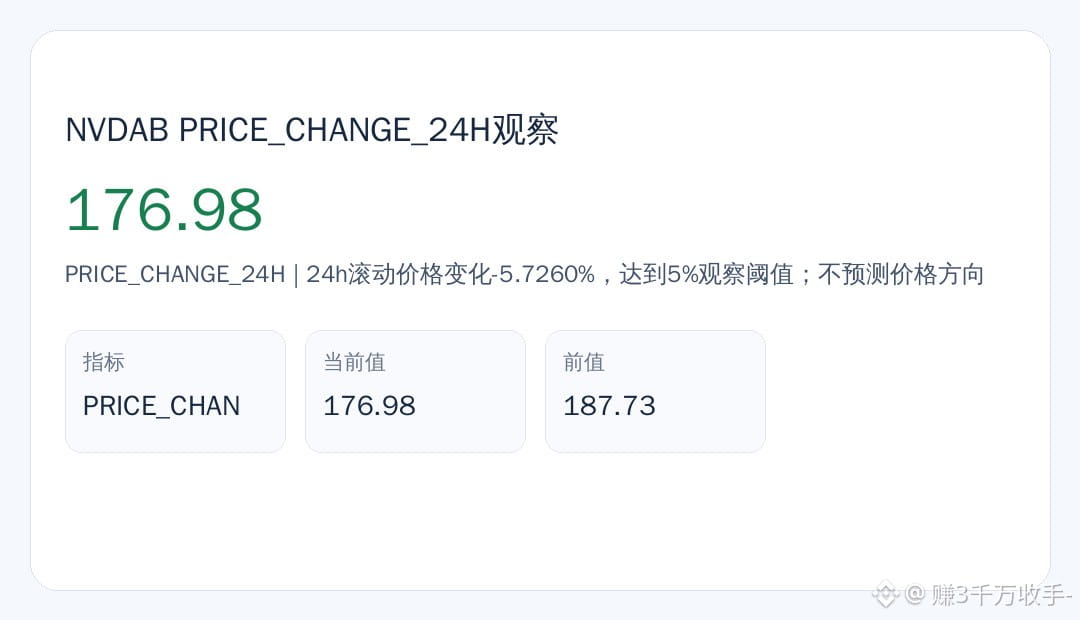
👀 Anyone watching? PRICE_CHANGE_24H for $NVDAB came in at 176.98. The 24h rolling price change is -5.7260%, reaching the 5% watch threshold; this does not predict price direction.
📊 Data snapshot
· Metric: PRICE_CHANGE_24H
· Reading: 176.98
· Method: Calculated from historical prices of closed candlesticks
Don't rush to conclusions—at this point, volume is more worth watching than price.
What do you make of this move? 👇
#市场观察 #NVDAB #Binance
👀 Anyone watching? PRICE_CHANGE_24H for $NVDAB came in at 176.98. The 24h rolling price change is -5.7260%, reaching the 5% watch threshold; this does not predict price direction.
📊 Data snapshot
· Metric: PRICE_CHANGE_24H
· Reading: 176.98
· Method: Calculated from historical prices of closed candlesticks
Don't rush to conclusions—at this point, volume is more worth watching than price.
What do you make of this move? 👇
#市场观察 #NVDAB #Binance
📊 Data snapshot
· Metric: PRICE_CHANGE_24H
· Reading: 176.98
· Method: Calculated from historical prices of closed candlesticks
Don't rush to conclusions—at this point, volume is more worth watching than price.
What do you make of this move? 👇
#市场观察 #NVDAB #Binance

·
--
I woke up in the middle of the night to check and my heart sank. $NVDAB is at 175.00, down 6.49% for the day. It’s dropped another 2.62% in just the past hour, and it’s only a step away from the 24-hour low of 170.82.
In plain English: this kind of drop is the most nerve-racking—after falling all day, it’s still probing lower in the middle of the night. Anyone holding it probably isn’t sleeping well, while those on the sidelines are debating whether to dip in. If it can’t hold 170.82, the next stop is a new low, with little support in between.
I’m inclined to wait and see for now, because a 2.62% drop in an hour suggests the selling pressure hasn’t run its course. Rushing in now would just be guessing where the bottom is. But if it stabilizes around 170.82 and stops falling, I’ll change my mind immediately.
If it can’t hold 170.82, how much further do you think it could fall?
$NVDAB
#NVDAB #MarketAnalysis
I woke up in the middle of the night to check and my heart sank. $NVDAB is at 175.00, down 6.49% for the day. It’s dropped another 2.62% in just the past hour, and it’s only a step away from the 24-hour low of 170.82.
In plain English: this kind of drop is the most nerve-racking—after falling all day, it’s still probing lower in the middle of the night. Anyone holding it probably isn’t sleeping well, while those on the sidelines are debating whether to dip in. If it can’t hold 170.82, the next stop is a new low, with little support in between.
I’m inclined to wait and see for now, because a 2.62% drop in an hour suggests the selling pressure hasn’t run its course. Rushing in now would just be guessing where the bottom is. But if it stabilizes around 170.82 and stops falling, I’ll change my mind immediately.
If it can’t hold 170.82, how much further do you think it could fall?
$NVDAB
#NVDAB #MarketAnalysis
In plain English: this kind of drop is the most nerve-racking—after falling all day, it’s still probing lower in the middle of the night. Anyone holding it probably isn’t sleeping well, while those on the sidelines are debating whether to dip in. If it can’t hold 170.82, the next stop is a new low, with little support in between.
I’m inclined to wait and see for now, because a 2.62% drop in an hour suggests the selling pressure hasn’t run its course. Rushing in now would just be guessing where the bottom is. But if it stabilizes around 170.82 and stops falling, I’ll change my mind immediately.
If it can’t hold 170.82, how much further do you think it could fall?
$NVDAB
#NVDAB #MarketAnalysis
5

·
--
🔥 $NVDAB Market Update: Critical Decision Zone Ahead! 🚀 / 📉
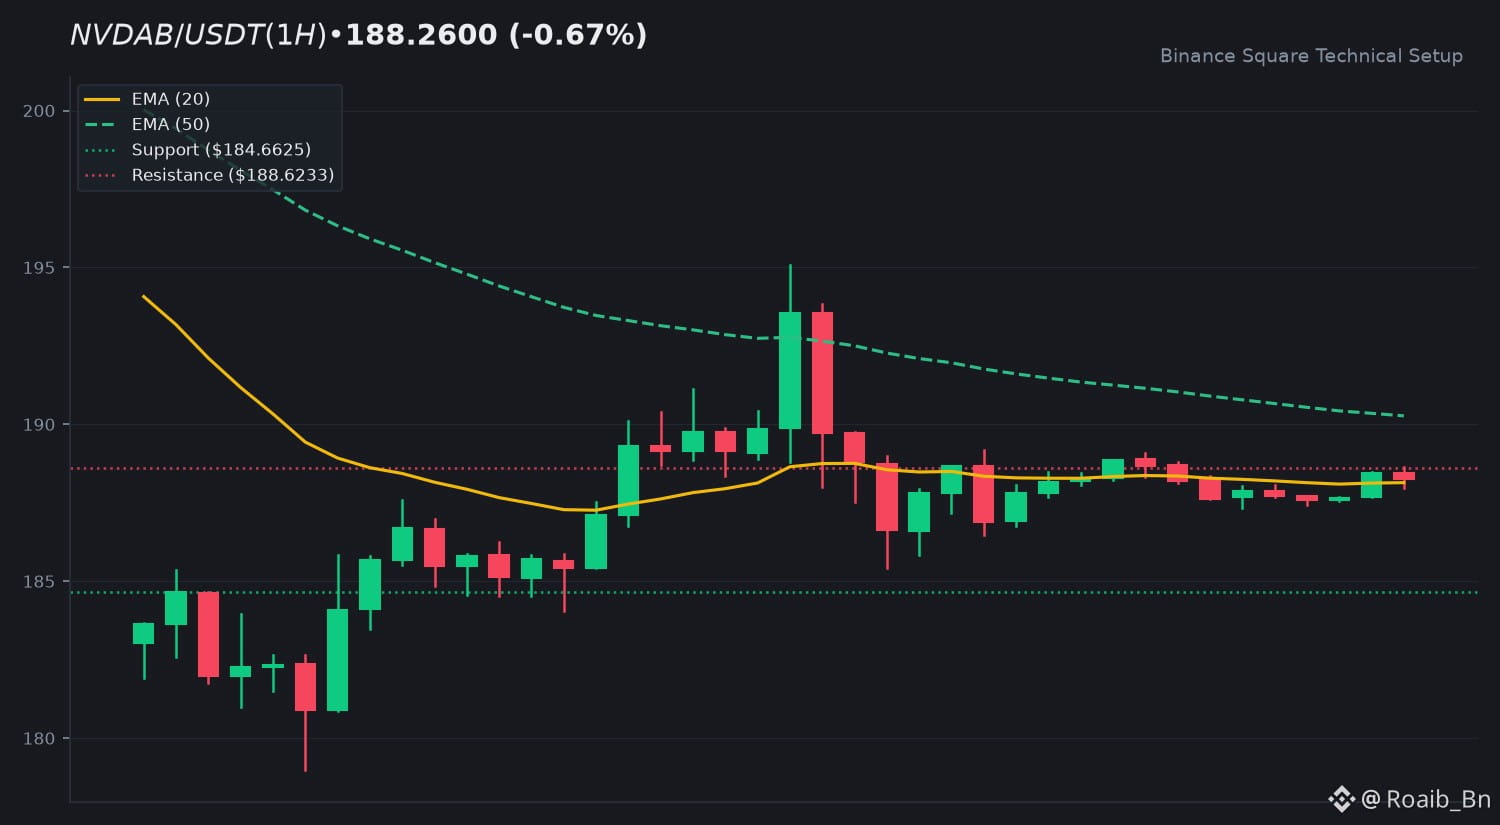
📊 1. Market Snapshot:
$NVDAB is currently trading at $188.26, registering a minor 24h change of -0.67%. Market activity shows a 24h high of $195.09, a low of $185.43, and a 24h quote volume of $15,202,149 USDT.
🔮 2. Directional Prediction: UP 🟢
Technicals favor a bullish recovery and trend reversal attempt. The EMA 20 sits at $188.14 (just below the current price), while the EMA 50 is at $190.26. RSI (14) stands at a neutral 49.54. Meanwhile, the MACD histogram prints a positive +0.0935 (MACD: -0.2488, Signal: -0.3422), signaling early bullish momentum. However, low volume (0.2x of 20-SMA) calls for caution against fakeouts.
🎯 3. Critical Price Targets:
- 🟢 Upside Bull Target: $195.0900 (24h high resistance breakout).
- 🔴 Downside Bear Risk: $184.6625 followed by deeper risk at $179.0000.
- 🛡️ Key Levels: Resistance at $188.6233 and $195.0900; Support at $184.6625 and $179.0000.
💡 4. Trader's Key Takeaway:
Watch the $188.6233 resistance pivot. A high-volume breakout confirms upside continuation, while rejection risks revisiting sub-$185 supports.
💬 5. What is your target for $NVDAB this week? Are you BUYING or SELLING? Drop your thoughts below! 👇
⚠️ Disclaimer: This content is for educational purposes only and does not constitute financial advice. Crypto markets carry high risk. Always DYOR.
$NVDAB #NVDAB #CryptoPrediction #BinanceSquare #Trading
🔥 $NVDAB Market Update: Critical Decision Zone Ahead! 🚀 / 📉
📊 1. Market Snapshot:
$NVDAB is currently trading at $188.26, registering a minor 24h change of -0.67%. Market activity shows a 24h high of $195.09, a low of $185.43, and a 24h quote volume of $15,202,149 USDT.
🔮 2. Directional Prediction: UP 🟢
Technicals favor a bullish recovery and trend reversal attempt. The EMA 20 sits at $188.14 (just below the current price), while the EMA 50 is at $190.26. RSI (14) stands at a neutral 49.54. Meanwhile, the MACD histogram prints a positive +0.0935 (MACD: -0.2488, Signal: -0.3422), signaling early bullish momentum. However, low volume (0.2x of 20-SMA) calls for caution against fakeouts.
🎯 3. Critical Price Targets:
- 🟢 Upside Bull Target: $195.0900 (24h high resistance breakout).
- 🔴 Downside Bear Risk: $184.6625 followed by deeper risk at $179.0000.
- 🛡️ Key Levels: Resistance at $188.6233 and $195.0900; Support at $184.6625 and $179.0000.
💡 4. Trader's Key Takeaway:
Watch the $188.6233 resistance pivot. A high-volume breakout confirms upside continuation, while rejection risks revisiting sub-$185 supports.
💬 5. What is your target for $NVDAB this week? Are you BUYING or SELLING? Drop your thoughts below! 👇
⚠️ Disclaimer: This content is for educational purposes only and does not constitute financial advice. Crypto markets carry high risk. Always DYOR.
$NVDAB #NVDAB #CryptoPrediction #BinanceSquare #Trading
📊 1. Market Snapshot:
$NVDAB is currently trading at $188.26, registering a minor 24h change of -0.67%. Market activity shows a 24h high of $195.09, a low of $185.43, and a 24h quote volume of $15,202,149 USDT.
🔮 2. Directional Prediction: UP 🟢
Technicals favor a bullish recovery and trend reversal attempt. The EMA 20 sits at $188.14 (just below the current price), while the EMA 50 is at $190.26. RSI (14) stands at a neutral 49.54. Meanwhile, the MACD histogram prints a positive +0.0935 (MACD: -0.2488, Signal: -0.3422), signaling early bullish momentum. However, low volume (0.2x of 20-SMA) calls for caution against fakeouts.
🎯 3. Critical Price Targets:
- 🟢 Upside Bull Target: $195.0900 (24h high resistance breakout).
- 🔴 Downside Bear Risk: $184.6625 followed by deeper risk at $179.0000.
- 🛡️ Key Levels: Resistance at $188.6233 and $195.0900; Support at $184.6625 and $179.0000.
💡 4. Trader's Key Takeaway:
Watch the $188.6233 resistance pivot. A high-volume breakout confirms upside continuation, while rejection risks revisiting sub-$185 supports.
💬 5. What is your target for $NVDAB this week? Are you BUYING or SELLING? Drop your thoughts below! 👇
⚠️ Disclaimer: This content is for educational purposes only and does not constitute financial advice. Crypto markets carry high risk. Always DYOR.
$NVDAB #NVDAB #CryptoPrediction #BinanceSquare #Trading
83
Log in to explore more content
Join global crypto users on Binance Square
⚡️ Get latest and useful information about crypto.
💬 Trusted by the world’s largest crypto exchange.
👍 Discover real insights from verified creators.
Email / Phone number
Trending Topics
1
#HotCPIDecemberHikePriced
17,220 views
549 Discussing
2
#AnthropicRejectsIPODelayValuationinQuestion
151,397 views
1,455 Discussing
3
#NvidiaInvestigatesAfterHuang’sAffairApology
406,588 views
2,922 Discussing
4
#CanNvidiaEarningsEaseMarketConcerns?
15,803 views
357 Discussing
5
#ADPWeeklyEstimateShowsUSPrivatePayrollsUp19750
4,660 views
158 Discussing
6
#US-IranTalksFuelStrongStockMarketRebound
67,874 views
527 Discussing
7
#BitcoinFiveWeeklyLosses
425,516 views
3,070 Discussing
8
#AIChipSlumpNasdaq
236,201 views
1,748 Discussing
9
#BitcoinSpotETFsPost$201MNetOutflowForThirdStraightDay
1,286 views
24 Discussing
10
#CryptoLiquidationsReach$1.16BIn24Hours
56,334 views
82 Discussing