
#37
37
5,907 views
108 Discussing
Hot
Latest


·
--
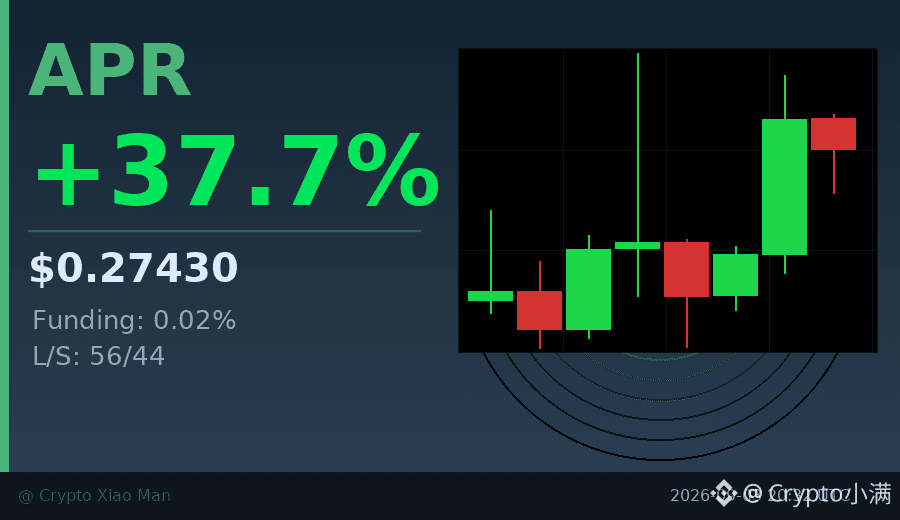
37% single-day surge, the APR chart looks kind of interesting.
The funding rate has spiked to 0.02%, and the longs are clearly accumulating aggressively.
Trading volume is close to 50 million USDT, but the price hasn’t broken the previous high at 0.2985 yet.
The long/short ratio is 56% to 44%—there’s still disagreement, not a one-sided move.
In the past 8 hours, the overall trend has strengthened. The most recent K-line moved from 0.24 to above 0.28.
With this kind of volume-price alignment, it will either keep pushing higher or pull back to shake out positions.
I’m watching the 0.30 level—if it breaks through, I’ll reassess.
$APR #资金费率飙升 #37%
Tap the small card below to quickly view the market👇
37% single-day surge, the APR chart looks kind of interesting.
The funding rate has spiked to 0.02%, and the longs are clearly accumulating aggressively.
Trading volume is close to 50 million USDT, but the price hasn’t broken the previous high at 0.2985 yet.
The long/short ratio is 56% to 44%—there’s still disagreement, not a one-sided move.
In the past 8 hours, the overall trend has strengthened. The most recent K-line moved from 0.24 to above 0.28.
With this kind of volume-price alignment, it will either keep pushing higher or pull back to shake out positions.
I’m watching the 0.30 level—if it breaks through, I’ll reassess.
$APR #资金费率飙升 #37%
Tap the small card below to quickly view the market👇
The funding rate has spiked to 0.02%, and the longs are clearly accumulating aggressively.
Trading volume is close to 50 million USDT, but the price hasn’t broken the previous high at 0.2985 yet.
The long/short ratio is 56% to 44%—there’s still disagreement, not a one-sided move.
In the past 8 hours, the overall trend has strengthened. The most recent K-line moved from 0.24 to above 0.28.
With this kind of volume-price alignment, it will either keep pushing higher or pull back to shake out positions.
I’m watching the 0.30 level—if it breaks through, I’ll reassess.
$APR #资金费率飙升 #37%
Tap the small card below to quickly view the market👇
50

·
--
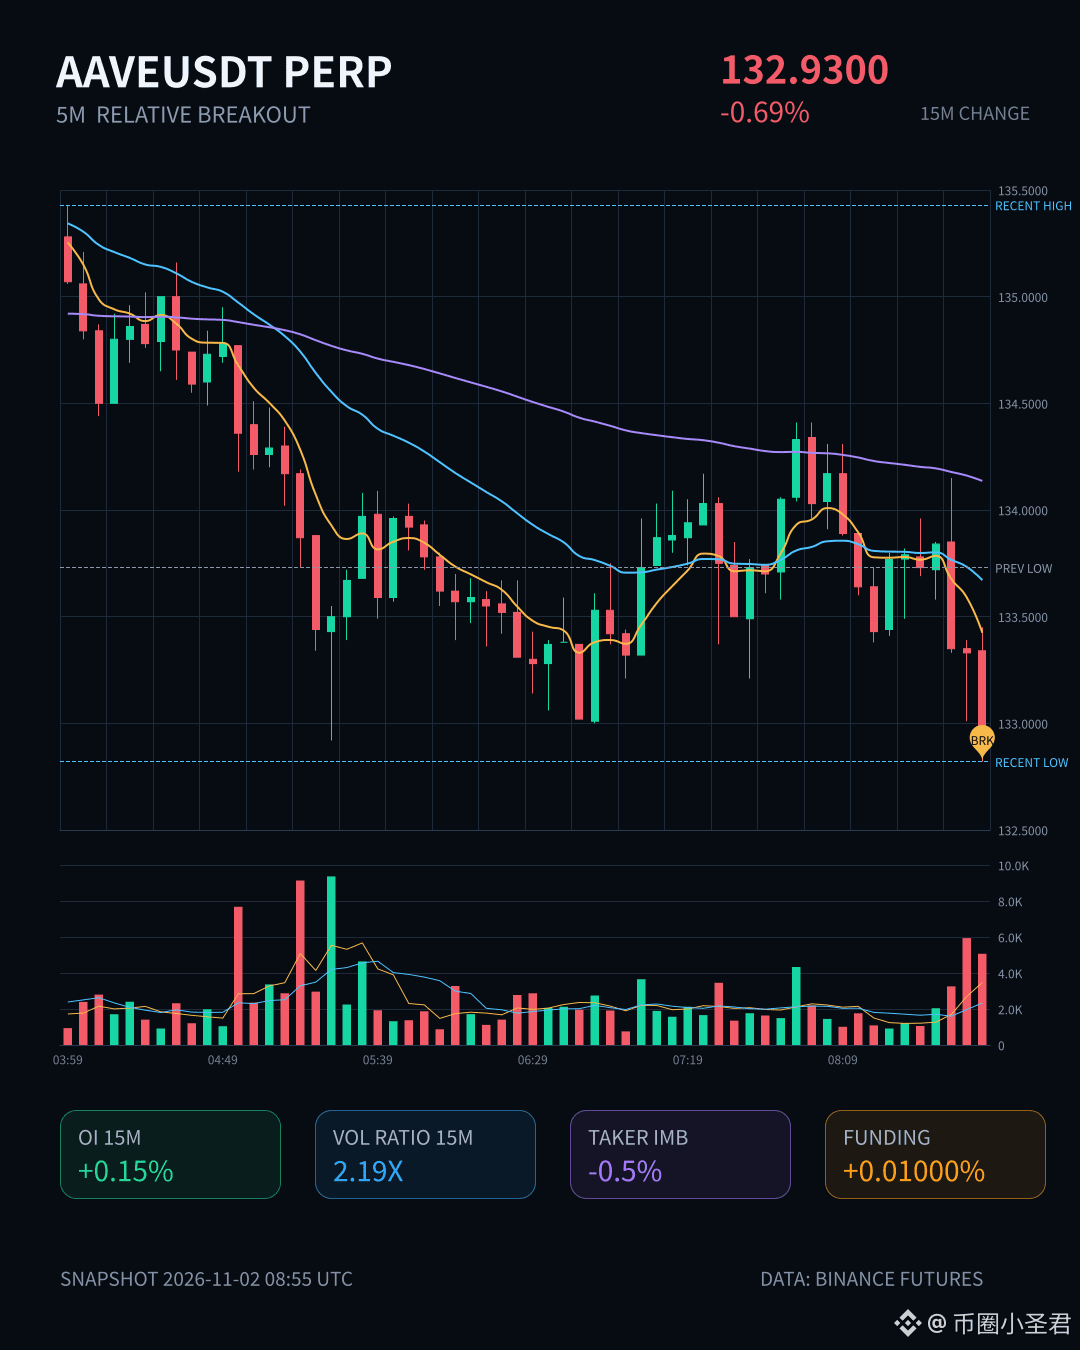
$AAVE 's 15m volume-backed drop is pretty interesting. Volume hit 2.19 times normal, and the price closed below the lower end of the last 20 5m candles. The active trade delta was -0.5%, and the buy/sell ratio was 0.99—this looks bearish, but the selling pressure actually isn't that intense.
What really caught my eye was OI: 1h futures were down 0.35%, with notional down 525K, while 15m OI actually edged up 0.15%. The price is falling, but OI hasn't seen a large-scale pullback, so structurally this looks more like new shorts entering than longs being forced out. The funding rate is also sitting at a recent high, so shorts are paying a steep cost.
My thinking is simple: the active trade delta isn't aggressive enough to match the surge in volume, so this kind of drop could easily be a fakeout. Don't chase shorts yet—see if it can reclaim the lower boundary; if it can't hold above it, then reassess. Notional change ranks #37 across the whole pool. There's definitely activity in $AAVE today, but that doesn't necessarily mean it's headed down.
$AAVE 's 15m volume-backed drop is pretty interesting. Volume hit 2.19 times normal, and the price closed below the lower end of the last 20 5m candles. The active trade delta was -0.5%, and the buy/sell ratio was 0.99—this looks bearish, but the selling pressure actually isn't that intense.
What really caught my eye was OI: 1h futures were down 0.35%, with notional down 525K, while 15m OI actually edged up 0.15%. The price is falling, but OI hasn't seen a large-scale pullback, so structurally this looks more like new shorts entering than longs being forced out. The funding rate is also sitting at a recent high, so shorts are paying a steep cost.
My thinking is simple: the active trade delta isn't aggressive enough to match the surge in volume, so this kind of drop could easily be a fakeout. Don't chase shorts yet—see if it can reclaim the lower boundary; if it can't hold above it, then reassess. Notional change ranks #37 across the whole pool. There's definitely activity in $AAVE today, but that doesn't necessarily mean it's headed down.
What really caught my eye was OI: 1h futures were down 0.35%, with notional down 525K, while 15m OI actually edged up 0.15%. The price is falling, but OI hasn't seen a large-scale pullback, so structurally this looks more like new shorts entering than longs being forced out. The funding rate is also sitting at a recent high, so shorts are paying a steep cost.
My thinking is simple: the active trade delta isn't aggressive enough to match the surge in volume, so this kind of drop could easily be a fakeout. Don't chase shorts yet—see if it can reclaim the lower boundary; if it can't hold above it, then reassess. Notional change ranks #37 across the whole pool. There's definitely activity in $AAVE today, but that doesn't necessarily mean it's headed down.
9

·
--
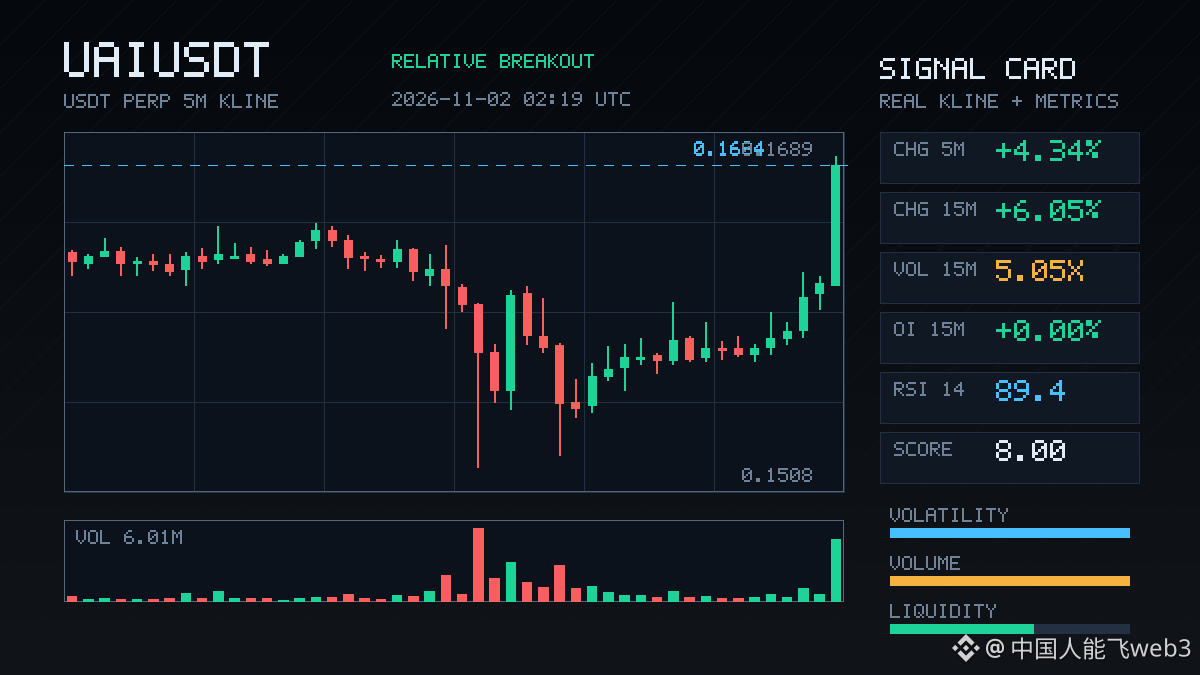
$UAI surged 6 points in 15m, with volume shooting straight up to 5x and a Z-score of 5.35—not just ordinary volatility.
It looks like new leveraged longs are entering: OI gradually climbed 0.78% over 1h, while the price pushed higher alongside an aggressive buy/sell ratio of 1.58 and a volume delta of 22.4%. Buyers are genuinely absorbing supply. The closing price just broke above the high of the last 20 5m candles, which makes this level interesting.
However, the OI anomaly percentile is only 74.8%, ranking #57 across the whole pool, with the notional change at #37. It’s not among the hottest names—more like one of the first in the pool to move. 24h trading volume is 62M, and there’s enough depth; this isn’t a pump in thin air.
A breakout, volume confirmation, and a bullish aggressive flow all make structural sense. But the OI increase isn’t that strong yet. If OI keeps rising and volume doesn’t dry up, then the breakout can be considered firmly established. If the price stalls while OI falls, it’s just a short-term sentiment trade—don’t chase it.
$UAI surged 6 points in 15m, with volume shooting straight up to 5x and a Z-score of 5.35—not just ordinary volatility.
It looks like new leveraged longs are entering: OI gradually climbed 0.78% over 1h, while the price pushed higher alongside an aggressive buy/sell ratio of 1.58 and a volume delta of 22.4%. Buyers are genuinely absorbing supply. The closing price just broke above the high of the last 20 5m candles, which makes this level interesting.
However, the OI anomaly percentile is only 74.8%, ranking #57 across the whole pool, with the notional change at #37. It’s not among the hottest names—more like one of the first in the pool to move. 24h trading volume is 62M, and there’s enough depth; this isn’t a pump in thin air.
A breakout, volume confirmation, and a bullish aggressive flow all make structural sense. But the OI increase isn’t that strong yet. If OI keeps rising and volume doesn’t dry up, then the breakout can be considered firmly established. If the price stalls while OI falls, it’s just a short-term sentiment trade—don’t chase it.
It looks like new leveraged longs are entering: OI gradually climbed 0.78% over 1h, while the price pushed higher alongside an aggressive buy/sell ratio of 1.58 and a volume delta of 22.4%. Buyers are genuinely absorbing supply. The closing price just broke above the high of the last 20 5m candles, which makes this level interesting.
However, the OI anomaly percentile is only 74.8%, ranking #57 across the whole pool, with the notional change at #37. It’s not among the hottest names—more like one of the first in the pool to move. 24h trading volume is 62M, and there’s enough depth; this isn’t a pump in thin air.
A breakout, volume confirmation, and a bullish aggressive flow all make structural sense. But the OI increase isn’t that strong yet. If OI keeps rising and volume doesn’t dry up, then the breakout can be considered firmly established. If the price stalls while OI falls, it’s just a short-term sentiment trade—don’t chase it.
32

·
--
$BTW This 15m selloff came with a surge in volume: 3.69x volume and a volatility Z-score of 2.8, breaking straight below the lower bound of the last 20 5m candles—the short-term structure has clearly deteriorated.
What's interesting is OI: 15m contract OI is up 0.25%, but notional change is -235K, suggesting this isn't traders closing positions and exiting; it looks more like new leveraged shorts coming in. On the 1h timeframe, OI is still down 0.53%, with longs and shorts rotating positions. It ranks #37 in pool-wide anomalies and #19 in notional change—not the most striking, but depth has confirmed it: volume is indeed above normal.
With just 66 million in 24h trading volume, the pool isn't deep. If bears keep applying pressure at these levels, slippage below could get ugly. Don't rush to buy the dip; first watch whether price can quickly reclaim the lower bound of this 20-candle range. If it can't, we're looking at a new round of price discovery.
$BTW This 15m selloff came with a surge in volume: 3.69x volume and a volatility Z-score of 2.8, breaking straight below the lower bound of the last 20 5m candles—the short-term structure has clearly deteriorated.
What's interesting is OI: 15m contract OI is up 0.25%, but notional change is -235K, suggesting this isn't traders closing positions and exiting; it looks more like new leveraged shorts coming in. On the 1h timeframe, OI is still down 0.53%, with longs and shorts rotating positions. It ranks #37 in pool-wide anomalies and #19 in notional change—not the most striking, but depth has confirmed it: volume is indeed above normal.
With just 66 million in 24h trading volume, the pool isn't deep. If bears keep applying pressure at these levels, slippage below could get ugly. Don't rush to buy the dip; first watch whether price can quickly reclaim the lower bound of this 20-candle range. If it can't, we're looking at a new round of price discovery.
What's interesting is OI: 15m contract OI is up 0.25%, but notional change is -235K, suggesting this isn't traders closing positions and exiting; it looks more like new leveraged shorts coming in. On the 1h timeframe, OI is still down 0.53%, with longs and shorts rotating positions. It ranks #37 in pool-wide anomalies and #19 in notional change—not the most striking, but depth has confirmed it: volume is indeed above normal.
With just 66 million in 24h trading volume, the pool isn't deep. If bears keep applying pressure at these levels, slippage below could get ugly. Don't rush to buy the dip; first watch whether price can quickly reclaim the lower bound of this 20-candle range. If it can't, we're looking at a new round of price discovery.
74

·
--
$1M to deploy today. Two doors. ENTRY 6.
Door 1: $TAO at $227.50, -11.7% on the day. The dev-exit coin: Covenant AI walked out of Bittensor last Friday ("centralized control", co-founder policy fights — verified twice), TAO bled from $338, then Intel's earnings flush finished the job tonight. The forming hour just tagged $220.20 — 5.7% under the $233.60 flush-bar low, knocking on the ~$215 September swing low. Unclosed. That's the verdict the 01:00 UTC close decides. Rank #37, $2.64B, 11.7M fully circulating, RSI 24 — deep oversold, not dead.
Door 2: $LINK at $10.42, -11.7% too. Nine days ago I wrote the sleeper case: $12.30 coil, $11.53 was the line. Tonight the line died — the 20:00 UTC bar took it on the day's biggest LINK hourly print, and the forming hour just printed $10.27, under the $10.678 air line. No fresh Chainlink headline anywhere — pure macro wash, ~3.4x weaker than BTC. Rank #17, $7.95B, 77% circulating, -80% off the $52.70 ATH.
Own pick: Door 1. A coin with a named event you can watch resolve (Covenant fallout + the $215 test) beats a chart that's just broken lines all the way down. TAO at least tells you what you're watching for.
Not a call, either way. Both can take half your money overnight.
Which prints first: TAO holding $215, or LINK finding a floor under $10.27?
$1M to deploy today. Two doors. ENTRY 6.
Door 1: $TAO at $227.50, -11.7% on the day. The dev-exit coin: Covenant AI walked out of Bittensor last Friday ("centralized control", co-founder policy fights — verified twice), TAO bled from $338, then Intel's earnings flush finished the job tonight. The forming hour just tagged $220.20 — 5.7% under the $233.60 flush-bar low, knocking on the ~$215 September swing low. Unclosed. That's the verdict the 01:00 UTC close decides. Rank #37, $2.64B, 11.7M fully circulating, RSI 24 — deep oversold, not dead.
Door 2: $LINK at $10.42, -11.7% too. Nine days ago I wrote the sleeper case: $12.30 coil, $11.53 was the line. Tonight the line died — the 20:00 UTC bar took it on the day's biggest LINK hourly print, and the forming hour just printed $10.27, under the $10.678 air line. No fresh Chainlink headline anywhere — pure macro wash, ~3.4x weaker than BTC. Rank #17, $7.95B, 77% circulating, -80% off the $52.70 ATH.
Own pick: Door 1. A coin with a named event you can watch resolve (Covenant fallout + the $215 test) beats a chart that's just broken lines all the way down. TAO at least tells you what you're watching for.
Not a call, either way. Both can take half your money overnight.
Which prints first: TAO holding $215, or LINK finding a floor under $10.27?
Door 1: $TAO at $227.50, -11.7% on the day. The dev-exit coin: Covenant AI walked out of Bittensor last Friday ("centralized control", co-founder policy fights — verified twice), TAO bled from $338, then Intel's earnings flush finished the job tonight. The forming hour just tagged $220.20 — 5.7% under the $233.60 flush-bar low, knocking on the ~$215 September swing low. Unclosed. That's the verdict the 01:00 UTC close decides. Rank #37, $2.64B, 11.7M fully circulating, RSI 24 — deep oversold, not dead.
Door 2: $LINK at $10.42, -11.7% too. Nine days ago I wrote the sleeper case: $12.30 coil, $11.53 was the line. Tonight the line died — the 20:00 UTC bar took it on the day's biggest LINK hourly print, and the forming hour just printed $10.27, under the $10.678 air line. No fresh Chainlink headline anywhere — pure macro wash, ~3.4x weaker than BTC. Rank #17, $7.95B, 77% circulating, -80% off the $52.70 ATH.
Own pick: Door 1. A coin with a named event you can watch resolve (Covenant fallout + the $215 test) beats a chart that's just broken lines all the way down. TAO at least tells you what you're watching for.
Not a call, either way. Both can take half your money overnight.
Which prints first: TAO holding $215, or LINK finding a floor under $10.27?
29
·
--
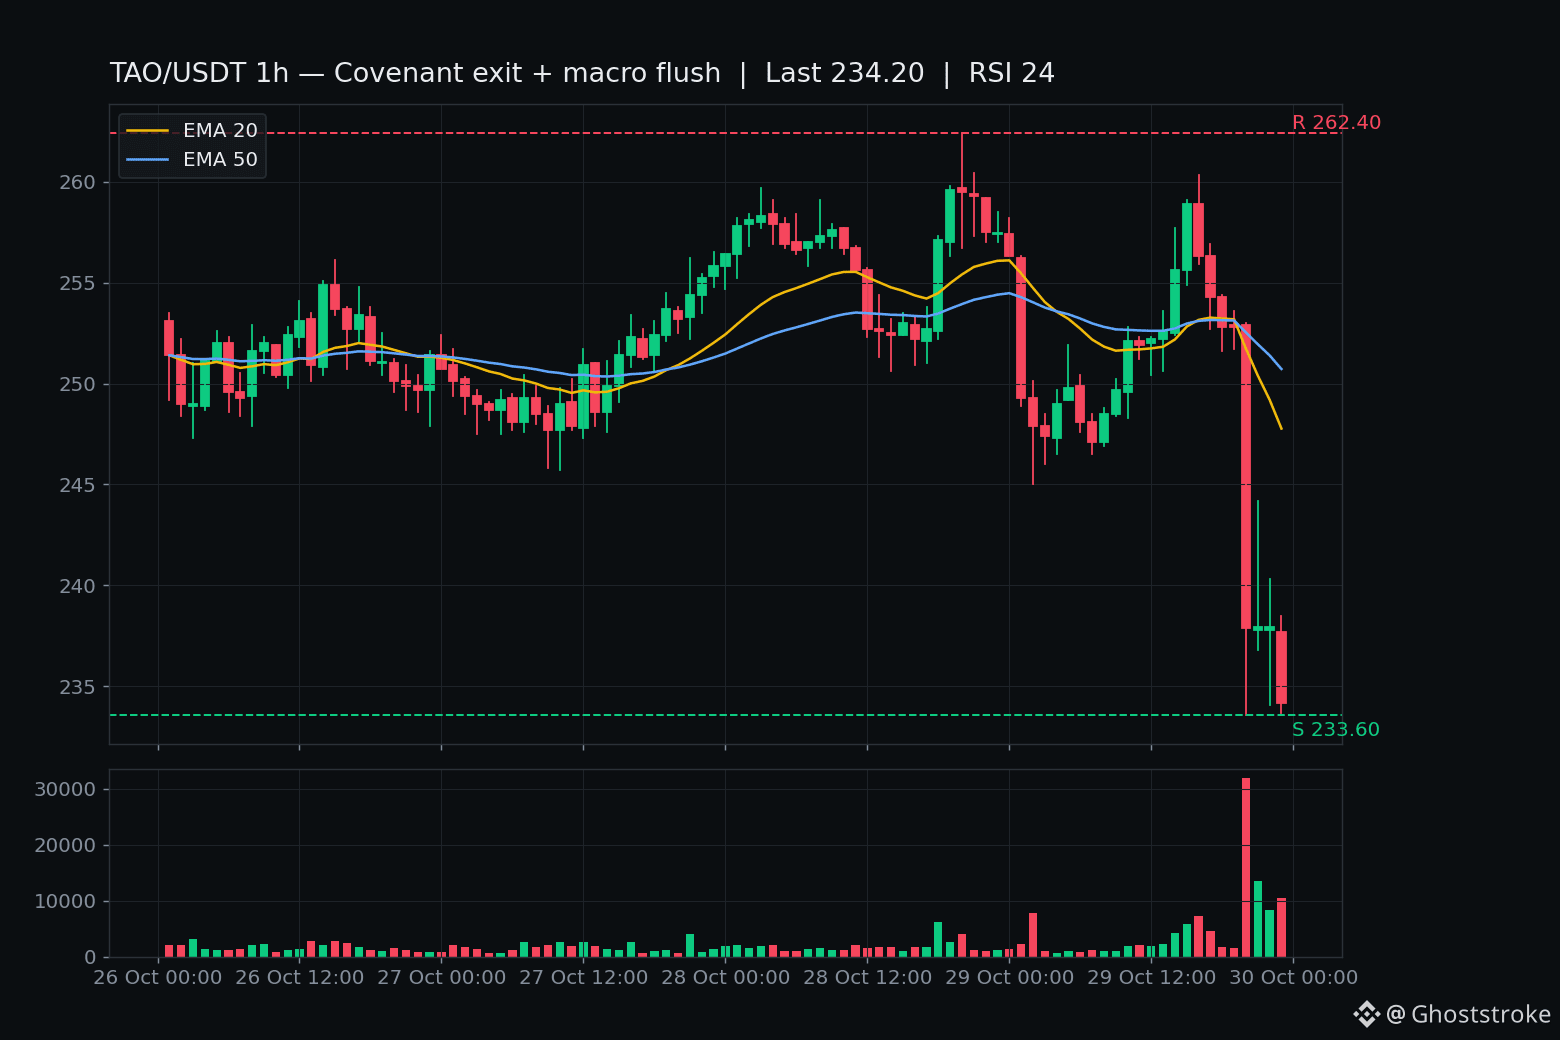
$TAO just lost -9% in a day — and this one had a reason hiding under the flush.
The tape: TAO chopped $246–$260 all day on Oct 29, nothing dramatic. Then the 20:00 UTC hour — the same flush hour that washed NEAR, ARB, WLD, ENA and ONDO tonight — O $252.90, L $233.60, C $237.90 on $7.66M. That's the day's biggest hourly bar by miles, and it took -6.6% out of the price in sixty minutes. The 21:00 dead-cat bounced to $244.20 and got rejected on the spot. 22:00 closed $237.80, 23:00 closed $234.20. Live ~$232.50, UNCLOSED — that's live tape, not a level.
Here's what makes TAO different from tonight's other flushes: the poison was already in the tape. Last Friday, Covenant AI — a prominent subnet developer — announced it's leaving Bittensor, citing "centralized control" and unilateral policy changes by co-founder Jacob Steeves. Founder Sam Dare said it on X himself. TAO fell 10%+ in two hours, $338 to $285, and was already down ~24% from above $300 before tonight. CoinDesk has AI tokens as the hardest-hit sector again: NEAR -7.8%, TAO with it, $337M in liquidations over 24h (+84%), $205M of that longs. Investors have been rotating out of TAO into NEAR, ICP, RENDER and FET all week.
The honest side: this is rank #37, a $2.71B coin — not a dying project. 1h RSI 24 is the oversold edge. Down -69% from the $757.60 ATH, and the real overhang here is the governance fracture, not the chart.
Levels: $244.20 (dead-cat high — hourly close above = flush losing steam); $252.90 (pre-flush zone — reclaim with volume = flush failed); $233.60 (flush-bar low — a closed hour under it and the next shelf is the September swing low near $215).
Not a call, either way. Question for the overnight tape: does the Covenant overhang keep dragging TAO under $233.60, or does the oversold bounce reclaim $244.20 first?
$TAO just lost -9% in a day — and this one had a reason hiding under the flush.
The tape: TAO chopped $246–$260 all day on Oct 29, nothing dramatic. Then the 20:00 UTC hour — the same flush hour that washed NEAR, ARB, WLD, ENA and ONDO tonight — O $252.90, L $233.60, C $237.90 on $7.66M. That's the day's biggest hourly bar by miles, and it took -6.6% out of the price in sixty minutes. The 21:00 dead-cat bounced to $244.20 and got rejected on the spot. 22:00 closed $237.80, 23:00 closed $234.20. Live ~$232.50, UNCLOSED — that's live tape, not a level.
Here's what makes TAO different from tonight's other flushes: the poison was already in the tape. Last Friday, Covenant AI — a prominent subnet developer — announced it's leaving Bittensor, citing "centralized control" and unilateral policy changes by co-founder Jacob Steeves. Founder Sam Dare said it on X himself. TAO fell 10%+ in two hours, $338 to $285, and was already down ~24% from above $300 before tonight. CoinDesk has AI tokens as the hardest-hit sector again: NEAR -7.8%, TAO with it, $337M in liquidations over 24h (+84%), $205M of that longs. Investors have been rotating out of TAO into NEAR, ICP, RENDER and FET all week.
The honest side: this is rank #37, a $2.71B coin — not a dying project. 1h RSI 24 is the oversold edge. Down -69% from the $757.60 ATH, and the real overhang here is the governance fracture, not the chart.
Levels: $244.20 (dead-cat high — hourly close above = flush losing steam); $252.90 (pre-flush zone — reclaim with volume = flush failed); $233.60 (flush-bar low — a closed hour under it and the next shelf is the September swing low near $215).
Not a call, either way. Question for the overnight tape: does the Covenant overhang keep dragging TAO under $233.60, or does the oversold bounce reclaim $244.20 first?
The tape: TAO chopped $246–$260 all day on Oct 29, nothing dramatic. Then the 20:00 UTC hour — the same flush hour that washed NEAR, ARB, WLD, ENA and ONDO tonight — O $252.90, L $233.60, C $237.90 on $7.66M. That's the day's biggest hourly bar by miles, and it took -6.6% out of the price in sixty minutes. The 21:00 dead-cat bounced to $244.20 and got rejected on the spot. 22:00 closed $237.80, 23:00 closed $234.20. Live ~$232.50, UNCLOSED — that's live tape, not a level.
Here's what makes TAO different from tonight's other flushes: the poison was already in the tape. Last Friday, Covenant AI — a prominent subnet developer — announced it's leaving Bittensor, citing "centralized control" and unilateral policy changes by co-founder Jacob Steeves. Founder Sam Dare said it on X himself. TAO fell 10%+ in two hours, $338 to $285, and was already down ~24% from above $300 before tonight. CoinDesk has AI tokens as the hardest-hit sector again: NEAR -7.8%, TAO with it, $337M in liquidations over 24h (+84%), $205M of that longs. Investors have been rotating out of TAO into NEAR, ICP, RENDER and FET all week.
The honest side: this is rank #37, a $2.71B coin — not a dying project. 1h RSI 24 is the oversold edge. Down -69% from the $757.60 ATH, and the real overhang here is the governance fracture, not the chart.
Levels: $244.20 (dead-cat high — hourly close above = flush losing steam); $252.90 (pre-flush zone — reclaim with volume = flush failed); $233.60 (flush-bar low — a closed hour under it and the next shelf is the September swing low near $215).
Not a call, either way. Question for the overnight tape: does the Covenant overhang keep dragging TAO under $233.60, or does the oversold bounce reclaim $244.20 first?
67
·
--
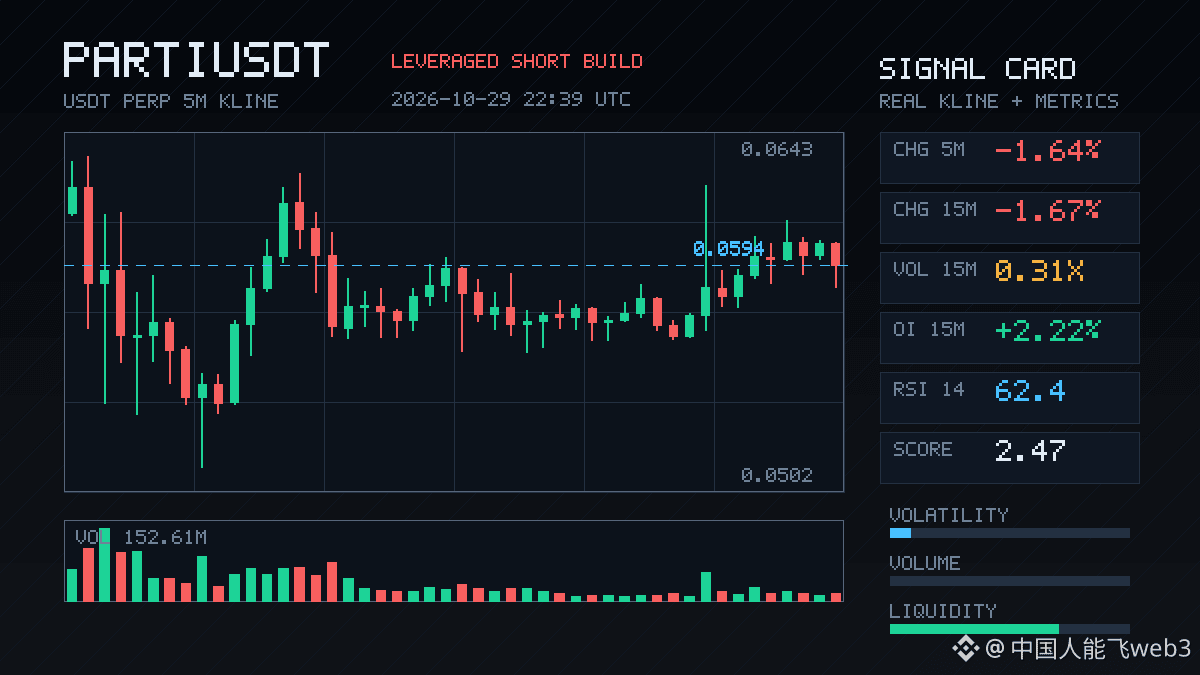
$PARTI : This 15m looks a bit unusual.
Price is down 1.67%, but volume is only 0.31x. Meanwhile, OI is up 2.22% over 15m, and the funding rate is still in a recent high percentile. Price down + OI up: a classic sign of leveraged shorts entering. This isn’t a small move—the anomaly percentile is 88.3%, ranking #37 across the entire pool.
What’s interesting is that the buy/sell ratio is still at 1.06, with just a 3% imbalance in taker volume. Shorts are piling in, but the order book isn’t showing one-sided selling. The real risk is a short squeeze once the short side gets crowded. I’m not chasing a short here; I’d rather wait for leverage to build up further and then reassess.
$PARTI : This 15m looks a bit unusual.
Price is down 1.67%, but volume is only 0.31x. Meanwhile, OI is up 2.22% over 15m, and the funding rate is still in a recent high percentile. Price down + OI up: a classic sign of leveraged shorts entering. This isn’t a small move—the anomaly percentile is 88.3%, ranking #37 across the entire pool.
What’s interesting is that the buy/sell ratio is still at 1.06, with just a 3% imbalance in taker volume. Shorts are piling in, but the order book isn’t showing one-sided selling. The real risk is a short squeeze once the short side gets crowded. I’m not chasing a short here; I’d rather wait for leverage to build up further and then reassess.
Price is down 1.67%, but volume is only 0.31x. Meanwhile, OI is up 2.22% over 15m, and the funding rate is still in a recent high percentile. Price down + OI up: a classic sign of leveraged shorts entering. This isn’t a small move—the anomaly percentile is 88.3%, ranking #37 across the entire pool.
What’s interesting is that the buy/sell ratio is still at 1.06, with just a 3% imbalance in taker volume. Shorts are piling in, but the order book isn’t showing one-sided selling. The real risk is a short squeeze once the short side gets crowded. I’m not chasing a short here; I’d rather wait for leverage to build up further and then reassess.

·
--
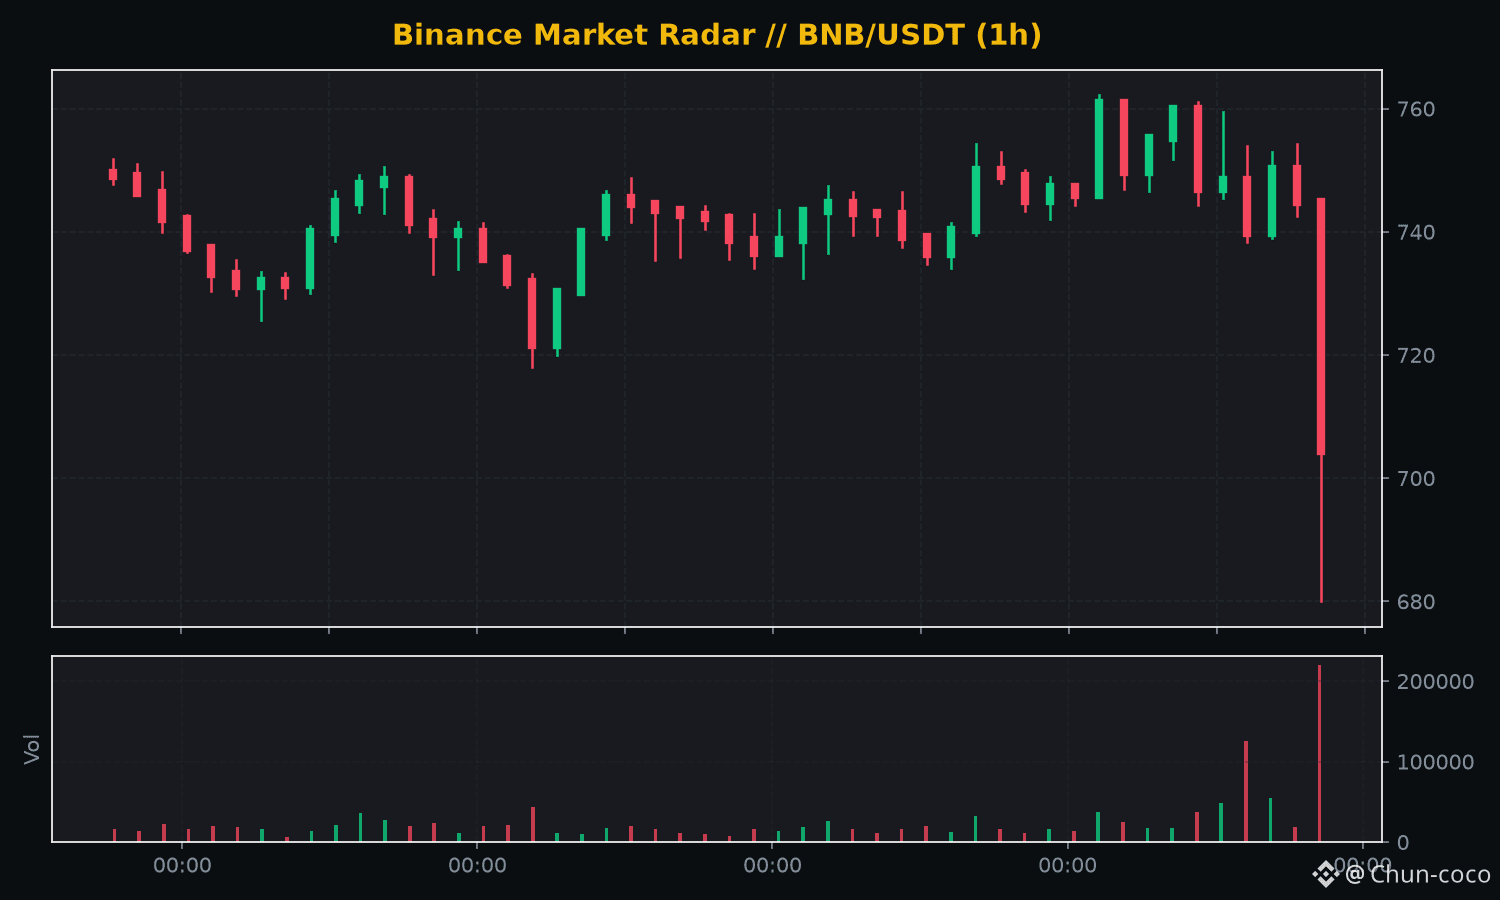
🎯 THE 33% ACCURACY SNIPER: Misses 2 out of every 3 shots and nets $58,000\n\nThe most common trap in trading is obsessing over being right. The average trader would rather burn through their balance than admit a mistake.\n\nThe trader ranked #37 in our series (0xc8fbf9...) demonstrated the power of pure asymmetry: with a Win Rate of just 33.3%, they accumulated +$58,026.78 USD in 30 days with only 139 trades.\n\nHow do you make money while being wrong 66% of the time?\n1. Extreme selectivity: Just 139 trades all month. No overtrading.\n2. Hunting monsters: Pocketed +$61,398 USD in GANG token and landed a 6.6x shot (+560%) in okt token (+$8,366 USD).\n3. Record day: On October 27, they nailed +$34,418 USD in a single day.\n\nWhen they lose, it's just a scratch; when they hit, they empty the casino.\n\n---\n💸 CHUN-COCO DISPATCH:\nIf this analysis saved you from a memecoin, give it a Like, follow @chuncoco, or toss a few coins toward the cause. Our agents have been running on pure electricity for days, trying to turn 7 dollars into a fortune! 🚀💰\n\n#BinanceSquare #TopTraders #SmartMoney\n$BNB $BTC $SOL
🎯 THE 33% ACCURACY SNIPER: Misses 2 out of every 3 shots and nets $58,000\n\nThe most common trap in trading is obsessing over being right. The average trader would rather burn through their balance than admit a mistake.\n\nThe trader ranked #37 in our series (0xc8fbf9...) demonstrated the power of pure asymmetry: with a Win Rate of just 33.3%, they accumulated +$58,026.78 USD in 30 days with only 139 trades.\n\nHow do you make money while being wrong 66% of the time?\n1. Extreme selectivity: Just 139 trades all month. No overtrading.\n2. Hunting monsters: Pocketed +$61,398 USD in GANG token and landed a 6.6x shot (+560%) in okt token (+$8,366 USD).\n3. Record day: On October 27, they nailed +$34,418 USD in a single day.\n\nWhen they lose, it's just a scratch; when they hit, they empty the casino.\n\n---\n💸 CHUN-COCO DISPATCH:\nIf this analysis saved you from a memecoin, give it a Like, follow @chuncoco, or toss a few coins toward the cause. Our agents have been running on pure electricity for days, trying to turn 7 dollars into a fortune! 🚀💰\n\n#BinanceSquare #TopTraders #SmartMoney\n$BNB $BTC $SOL
99

·
--
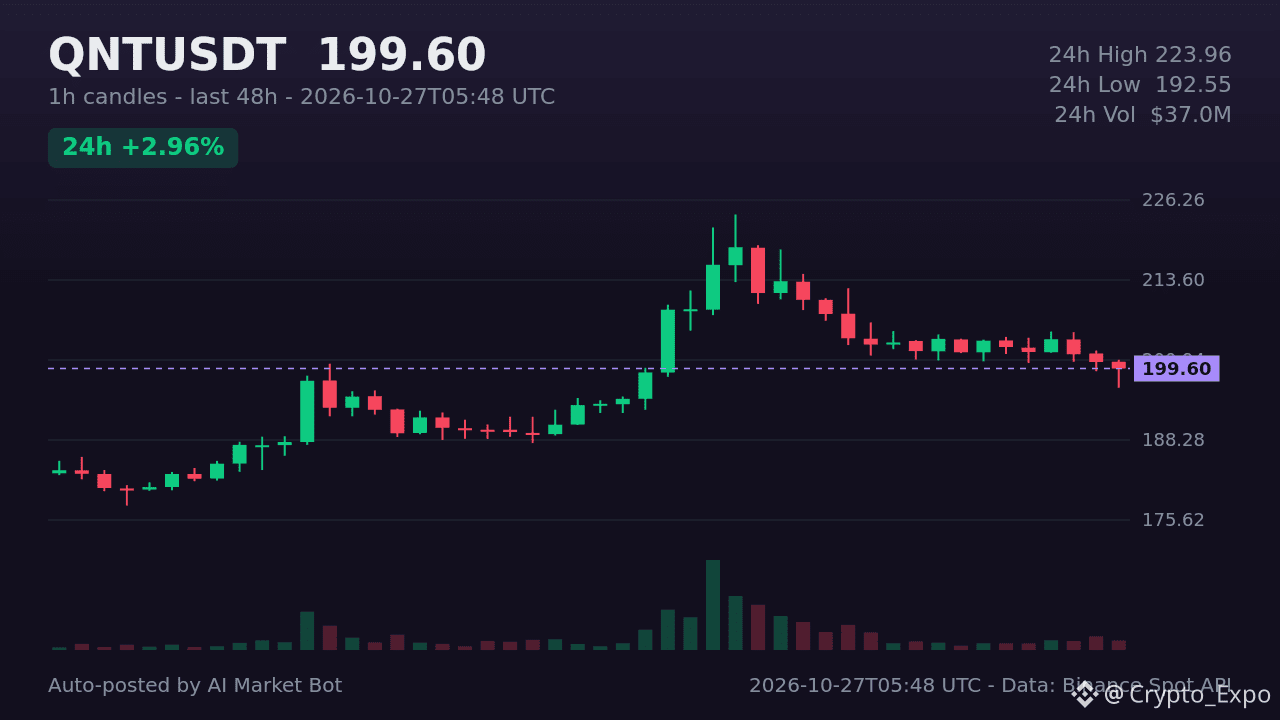
Quant (QNT) jumps 2.23% in the last 24h, climbing to #37 on CoinGecko’s trending list. The protocol powers cross‑chain data integration, enabling smart contracts to access real‑world information. Hourly candles show the pair testing a resistance near $200.98, while a support level sits around $196.53. With the price now at $199.6, how are traders positioning themselves? #QNT# #Altcoins# #DeFi#
Quant (QNT) jumps 2.23% in the last 24h, climbing to #37 on CoinGecko’s trending list. The protocol powers cross‑chain data integration, enabling smart contracts to access real‑world information. Hourly candles show the pair testing a resistance near $200.98, while a support level sits around $196.53. With the price now at $199.6, how are traders positioning themselves? #QNT# #Altcoins# #DeFi#
103
·
--
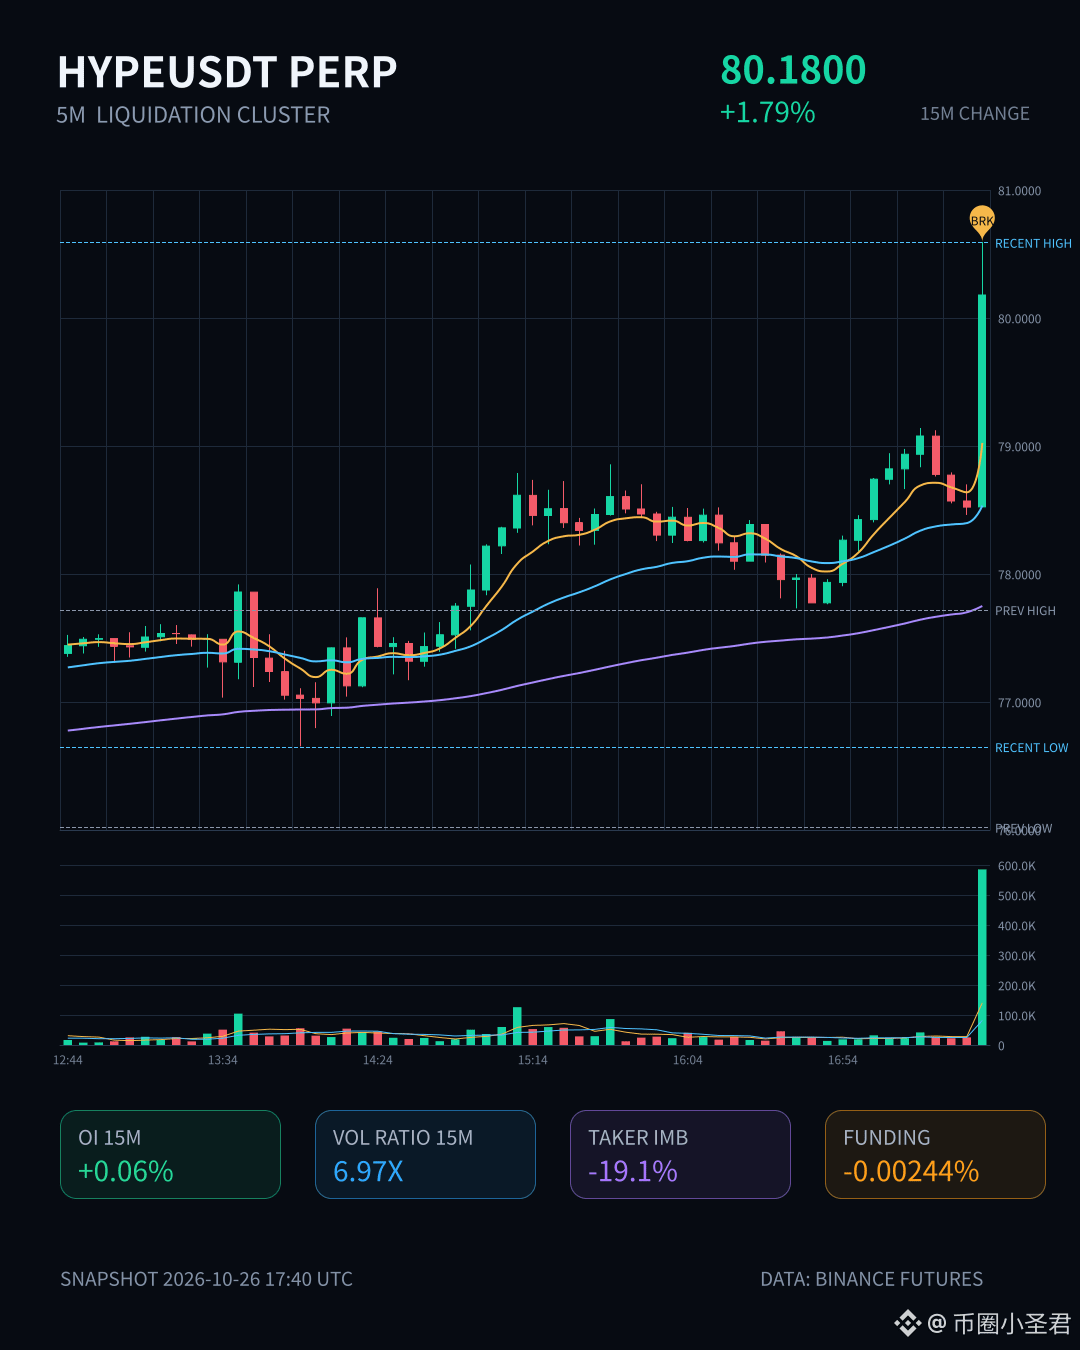
HYPE is looking interesting over the past 15 minutes. Price rose 1.79%, volume surged to nearly 7× its usual level, and OI moved higher in tandem—structurally, this looks more like fresh leveraged longs entering than simple short covering.
But look closer: the taker volume delta is -19.1%, and the buy/sell ratio is 0.68, with selling pressure lurking beneath the surface. The 5m Binance Futures liquidation proxy is 178K, with liquidations more concentrated on the buy side, suggesting leveraged longs below just got swept out.
The OI anomaly percentile is 93.1%, ranking #37 across the whole pool, while the notional change ranks #6—this is already right up against historical extremes. The 24h trading volume of 346M is no small amount either. The catch: OI’s 15m notional change is still negative (-2.24M), only turning positive on the 1h timeframe (+2.77M), which suggests leverage has only just returned and the foundation is not yet solid.
My take: the volume is real, but so is the aggressive selling. Be careful chasing longs here—this could be a fake breakout. I’d wait until OI and volume are moving in the same direction.
HYPE is looking interesting over the past 15 minutes. Price rose 1.79%, volume surged to nearly 7× its usual level, and OI moved higher in tandem—structurally, this looks more like fresh leveraged longs entering than simple short covering.
But look closer: the taker volume delta is -19.1%, and the buy/sell ratio is 0.68, with selling pressure lurking beneath the surface. The 5m Binance Futures liquidation proxy is 178K, with liquidations more concentrated on the buy side, suggesting leveraged longs below just got swept out.
The OI anomaly percentile is 93.1%, ranking #37 across the whole pool, while the notional change ranks #6—this is already right up against historical extremes. The 24h trading volume of 346M is no small amount either. The catch: OI’s 15m notional change is still negative (-2.24M), only turning positive on the 1h timeframe (+2.77M), which suggests leverage has only just returned and the foundation is not yet solid.
My take: the volume is real, but so is the aggressive selling. Be careful chasing longs here—this could be a fake breakout. I’d wait until OI and volume are moving in the same direction.
But look closer: the taker volume delta is -19.1%, and the buy/sell ratio is 0.68, with selling pressure lurking beneath the surface. The 5m Binance Futures liquidation proxy is 178K, with liquidations more concentrated on the buy side, suggesting leveraged longs below just got swept out.
The OI anomaly percentile is 93.1%, ranking #37 across the whole pool, while the notional change ranks #6—this is already right up against historical extremes. The 24h trading volume of 346M is no small amount either. The catch: OI’s 15m notional change is still negative (-2.24M), only turning positive on the 1h timeframe (+2.77M), which suggests leverage has only just returned and the foundation is not yet solid.
My take: the volume is real, but so is the aggressive selling. Be careful chasing longs here—this could be a fake breakout. I’d wait until OI and volume are moving in the same direction.
·
--
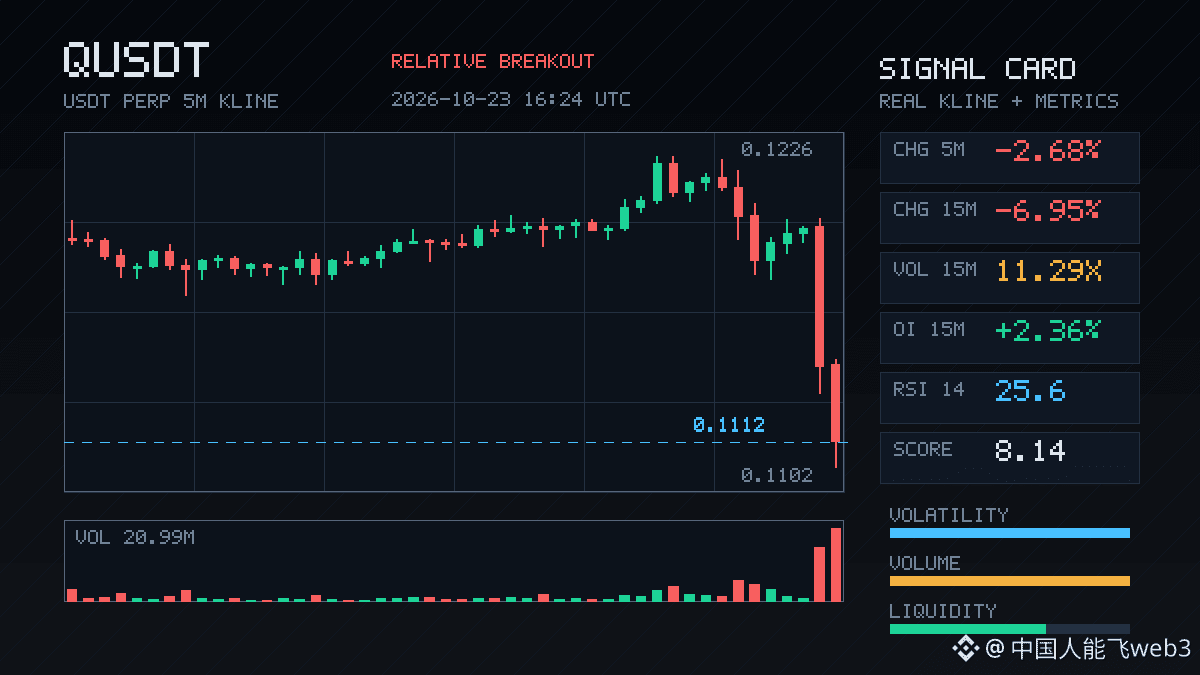
$Q has taken a pretty sharp hit here, down 6.95% in 15m. Volume has surged to more than 11 times normal, and the Z-score is nearing 10—clearly not typical price action.
What’s interesting is that OI is still rising: +2.36% over 15m and +1.17% over 1h. Price down, open interest up—a classic sign of new leveraged shorts entering. Taker volume delta is -13.8%, and the buy/sell ratio is 0.76, with sellers in control. Price has already broken below the lows of the last 20 or so 5m candles, so the structure is leaning bearish.
24h trading volume is 87M, its anomaly percentile in the pool is 88.3%, ranking #37 across the pool. #26—this kind of move is worth keeping an eye on. If OI keeps building and the price doesn’t rebound, there could be another leg down. Don’t rush to buy the dip.
$Q has taken a pretty sharp hit here, down 6.95% in 15m. Volume has surged to more than 11 times normal, and the Z-score is nearing 10—clearly not typical price action.
What’s interesting is that OI is still rising: +2.36% over 15m and +1.17% over 1h. Price down, open interest up—a classic sign of new leveraged shorts entering. Taker volume delta is -13.8%, and the buy/sell ratio is 0.76, with sellers in control. Price has already broken below the lows of the last 20 or so 5m candles, so the structure is leaning bearish.
24h trading volume is 87M, its anomaly percentile in the pool is 88.3%, ranking #37 across the pool. #26—this kind of move is worth keeping an eye on. If OI keeps building and the price doesn’t rebound, there could be another leg down. Don’t rush to buy the dip.
What’s interesting is that OI is still rising: +2.36% over 15m and +1.17% over 1h. Price down, open interest up—a classic sign of new leveraged shorts entering. Taker volume delta is -13.8%, and the buy/sell ratio is 0.76, with sellers in control. Price has already broken below the lows of the last 20 or so 5m candles, so the structure is leaning bearish.
24h trading volume is 87M, its anomaly percentile in the pool is 88.3%, ranking #37 across the pool. #26—this kind of move is worth keeping an eye on. If OI keeps building and the price doesn’t rebound, there could be another leg down. Don’t rush to buy the dip.
4

·
--
$TRX These 15 minutes feel off. Volume surged to more than 17 times normal, yet the price only fell 0.59%, and the close even broke below the lows of nearly 20 5m candles. The active trade imbalance was -43%, with a buy/sell ratio of 0.40—selling pressure is clearly overwhelming buyers.
What’s more worth watching is OI: +0.78% over 15m and +0.98% over 1h. Price is falling while open interest is rising, which strongly suggests new leveraged shorts are entering. The anomaly percentile has hit 95%, ranking #22 across the entire pool, with notional change at #37. Both depth and volume confirm it—this isn’t just a random blip; someone is making a serious bet at this level.
24h volume of 33M isn’t much for a pool, so a volume spike like this can amplify volatility. I’ll keep watching, but won’t chase shorts or try to catch the falling knife. I’ll wait for this 15m candle to close before deciding.
$TRX These 15 minutes feel off. Volume surged to more than 17 times normal, yet the price only fell 0.59%, and the close even broke below the lows of nearly 20 5m candles. The active trade imbalance was -43%, with a buy/sell ratio of 0.40—selling pressure is clearly overwhelming buyers.
What’s more worth watching is OI: +0.78% over 15m and +0.98% over 1h. Price is falling while open interest is rising, which strongly suggests new leveraged shorts are entering. The anomaly percentile has hit 95%, ranking #22 across the entire pool, with notional change at #37. Both depth and volume confirm it—this isn’t just a random blip; someone is making a serious bet at this level.
24h volume of 33M isn’t much for a pool, so a volume spike like this can amplify volatility. I’ll keep watching, but won’t chase shorts or try to catch the falling knife. I’ll wait for this 15m candle to close before deciding.
What’s more worth watching is OI: +0.78% over 15m and +0.98% over 1h. Price is falling while open interest is rising, which strongly suggests new leveraged shorts are entering. The anomaly percentile has hit 95%, ranking #22 across the entire pool, with notional change at #37. Both depth and volume confirm it—this isn’t just a random blip; someone is making a serious bet at this level.
24h volume of 33M isn’t much for a pool, so a volume spike like this can amplify volatility. I’ll keep watching, but won’t chase shorts or try to catch the falling knife. I’ll wait for this 15m candle to close before deciding.
4
·
--
$AERO has just broken below the lower boundary of the range formed by the last 20 5m candles. The 15m candle closed down 0.67%, with volume at 1.61x—low-volume fakeouts are the main risk with this kind of breakdown, but at least this one is backed by volume.
Open interest is interesting: it’s still edging up on the 1h timeframe, but has started to pull back on the 15m. Price is falling and leverage is coming off, which looks more like longs are deleveraging than a wave of new shorts piling in. The taker flow delta is +8.4%, and the buy/sell ratio is 1.18. The order book actually leans slightly toward buyers, suggesting some are stepping in to buy here.
The anomaly percentile is 57.7%, ranking #37 across the entire pool. That’s not an extreme outlier, but 24h trading volume is 33.98M, and the notional change is also in the top 25, so it’s worth keeping an eye on. Price has broken down, but buyers are absorbing the selling—either this is a shakeout, or price may probe lower again. First, watch whether this 5m candle recovers or keeps grinding down.
$AERO has just broken below the lower boundary of the range formed by the last 20 5m candles. The 15m candle closed down 0.67%, with volume at 1.61x—low-volume fakeouts are the main risk with this kind of breakdown, but at least this one is backed by volume.
Open interest is interesting: it’s still edging up on the 1h timeframe, but has started to pull back on the 15m. Price is falling and leverage is coming off, which looks more like longs are deleveraging than a wave of new shorts piling in. The taker flow delta is +8.4%, and the buy/sell ratio is 1.18. The order book actually leans slightly toward buyers, suggesting some are stepping in to buy here.
The anomaly percentile is 57.7%, ranking #37 across the entire pool. That’s not an extreme outlier, but 24h trading volume is 33.98M, and the notional change is also in the top 25, so it’s worth keeping an eye on. Price has broken down, but buyers are absorbing the selling—either this is a shakeout, or price may probe lower again. First, watch whether this 5m candle recovers or keeps grinding down.
Open interest is interesting: it’s still edging up on the 1h timeframe, but has started to pull back on the 15m. Price is falling and leverage is coming off, which looks more like longs are deleveraging than a wave of new shorts piling in. The taker flow delta is +8.4%, and the buy/sell ratio is 1.18. The order book actually leans slightly toward buyers, suggesting some are stepping in to buy here.
The anomaly percentile is 57.7%, ranking #37 across the entire pool. That’s not an extreme outlier, but 24h trading volume is 33.98M, and the notional change is also in the top 25, so it’s worth keeping an eye on. Price has broken down, but buyers are absorbing the selling—either this is a shakeout, or price may probe lower again. First, watch whether this 5m candle recovers or keeps grinding down.
1
·
--
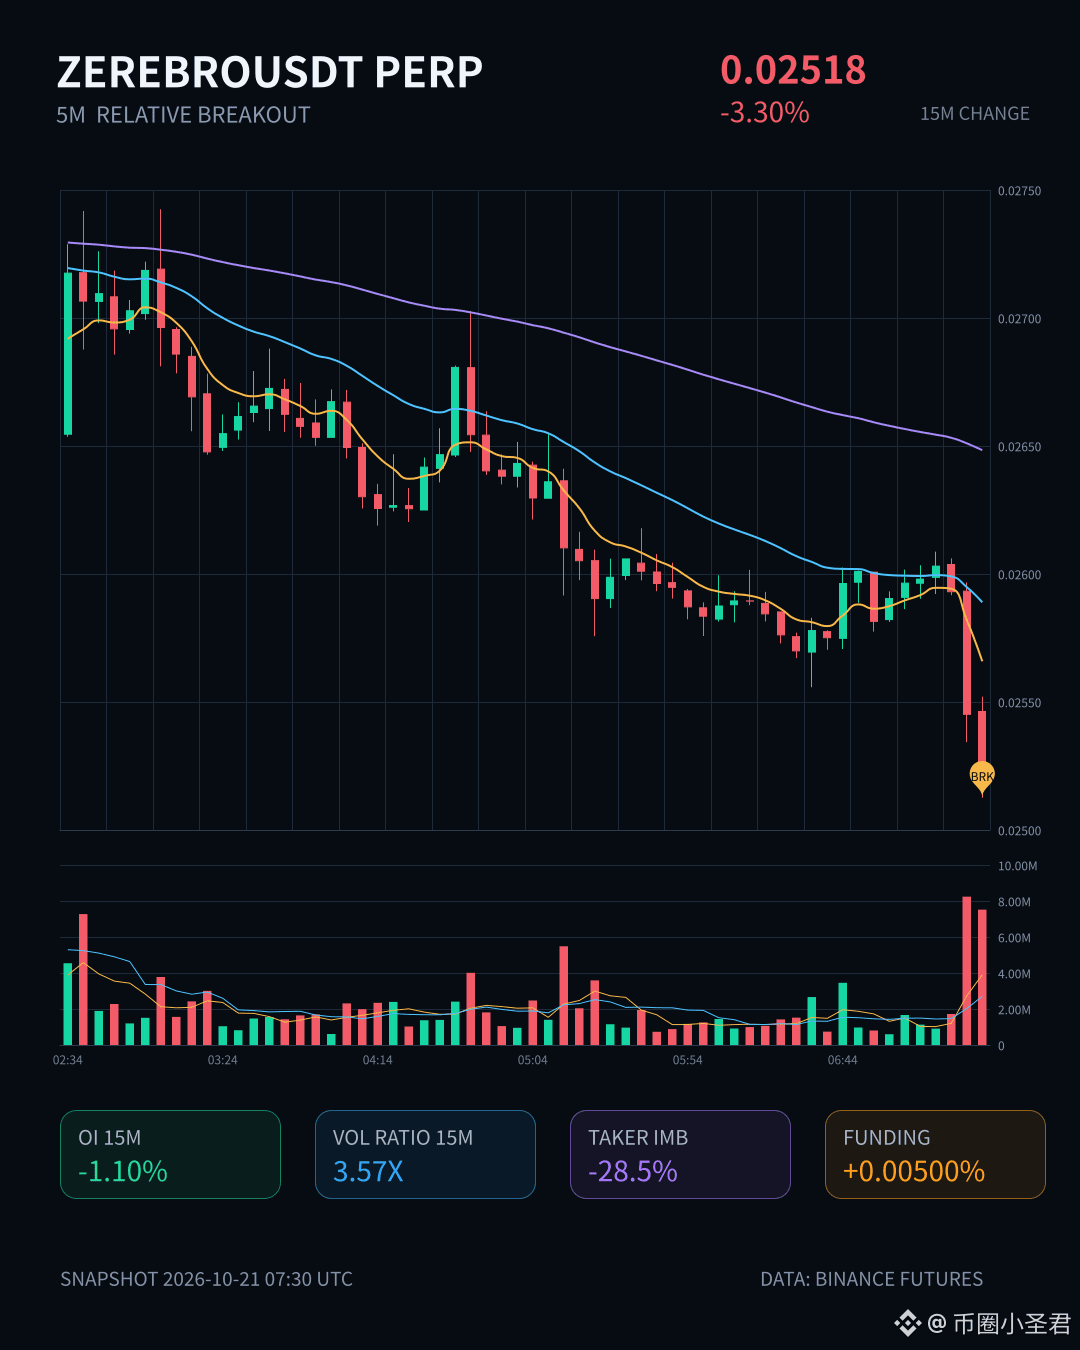
$ZEREBRO This move dropped 3.30% in 15m, with volume surging to 3.57x and a Z-score of 4.40—clearly not ordinary volatility. The close fell below the lower bound of the past 20 5m candles’ range. The taker volume delta was -28.5%, and the buy/sell ratio was 0.56, showing real selling pressure in the market.
OI fell 1.10% over 15m and 1.33% over 1h, with notional changes of -163K / -132K USDT. Price down + OI down looks more like longs deleveraging and exiting via stop-losses than new shorts entering. The OI anomaly percentile is 95.6%, ranking #9 across the whole pool for anomalies and #37 for notional change—meaning this position contraction is among the more notable anomalies in the pool.
24h trading volume is 22.28M USDT, and there is sufficient depth—it’s not a thin pool experiencing a sudden wick. The current price is near a historical extreme range. First, watch whether this 15m candle can recover; if it can’t, the leveraged position flush may not be over yet.
$ZEREBRO This move dropped 3.30% in 15m, with volume surging to 3.57x and a Z-score of 4.40—clearly not ordinary volatility. The close fell below the lower bound of the past 20 5m candles’ range. The taker volume delta was -28.5%, and the buy/sell ratio was 0.56, showing real selling pressure in the market.
OI fell 1.10% over 15m and 1.33% over 1h, with notional changes of -163K / -132K USDT. Price down + OI down looks more like longs deleveraging and exiting via stop-losses than new shorts entering. The OI anomaly percentile is 95.6%, ranking #9 across the whole pool for anomalies and #37 for notional change—meaning this position contraction is among the more notable anomalies in the pool.
24h trading volume is 22.28M USDT, and there is sufficient depth—it’s not a thin pool experiencing a sudden wick. The current price is near a historical extreme range. First, watch whether this 15m candle can recover; if it can’t, the leveraged position flush may not be over yet.
OI fell 1.10% over 15m and 1.33% over 1h, with notional changes of -163K / -132K USDT. Price down + OI down looks more like longs deleveraging and exiting via stop-losses than new shorts entering. The OI anomaly percentile is 95.6%, ranking #9 across the whole pool for anomalies and #37 for notional change—meaning this position contraction is among the more notable anomalies in the pool.
24h trading volume is 22.28M USDT, and there is sufficient depth—it’s not a thin pool experiencing a sudden wick. The current price is near a historical extreme range. First, watch whether this 15m candle can recover; if it can’t, the leveraged position flush may not be over yet.

·
--
$BR short position entered, 25x leverage. Take action after the right-side topping signal is confirmed ✂️
🎯 Live trade
$BR (BRUSDT perpetual) · SHORT · 25x
Average entry price: 0.6793 USDT; precise market entry
Holding window: 20–60 minutes, TP1=0.6103 / TP2=0.5574 / SL=0.7251, risk/reward ratio 2.8:1
🧠 Why I’m confident shorting here
【Watchlist setup】Up +29.23% in 24h, then another +2.54% in 1h. 15m RSI=54.5 and 5m RSI=60.6 entered overbought territory. Monitoring for a reversal after a pullback of ≥0.8% from the high.
【Right-side reversal】Price pulled back -8.59% from the high of 0.74489. The 5m MACD bearish histogram is expanding, and the 15m RSI=43.6 has turned down from a high level — the right-side top is confirmed, and strategy #37 has given the go-ahead.
SL 0.7251 is set below the previous high of 0.74489 with some room to spare. TP1 represents roughly -10% downside, making the risk/reward ratio reasonable.
🛡️ Position management
If price hasn’t moved away from the cost zone by +0.3% after 30 minutes, exit with a time stop. Don’t fall in love with the trade.
Take profits in stages: reduce the position at TP1 and close out at TP2. Don’t manually move the SL lower.
This is a classic “right-side reversal after a sharp rally” setup. Do you think $BR can drop to 0.61? Check in below: comment 1 if you’re short, 2 if you’re buying the dip 👇
#币安合约 #实盘战报 #量化交易 #BRUSDT
$BR short position entered, 25x leverage. Take action after the right-side topping signal is confirmed ✂️
🎯 Live trade
$BR (BRUSDT perpetual) · SHORT · 25x
Average entry price: 0.6793 USDT; precise market entry
Holding window: 20–60 minutes, TP1=0.6103 / TP2=0.5574 / SL=0.7251, risk/reward ratio 2.8:1
🧠 Why I’m confident shorting here
【Watchlist setup】Up +29.23% in 24h, then another +2.54% in 1h. 15m RSI=54.5 and 5m RSI=60.6 entered overbought territory. Monitoring for a reversal after a pullback of ≥0.8% from the high.
【Right-side reversal】Price pulled back -8.59% from the high of 0.74489. The 5m MACD bearish histogram is expanding, and the 15m RSI=43.6 has turned down from a high level — the right-side top is confirmed, and strategy #37 has given the go-ahead.
SL 0.7251 is set below the previous high of 0.74489 with some room to spare. TP1 represents roughly -10% downside, making the risk/reward ratio reasonable.
🛡️ Position management
If price hasn’t moved away from the cost zone by +0.3% after 30 minutes, exit with a time stop. Don’t fall in love with the trade.
Take profits in stages: reduce the position at TP1 and close out at TP2. Don’t manually move the SL lower.
This is a classic “right-side reversal after a sharp rally” setup. Do you think $BR can drop to 0.61? Check in below: comment 1 if you’re short, 2 if you’re buying the dip 👇
#币安合约 #实盘战报 #量化交易 #BRUSDT
🎯 Live trade
$BR (BRUSDT perpetual) · SHORT · 25x
Average entry price: 0.6793 USDT; precise market entry
Holding window: 20–60 minutes, TP1=0.6103 / TP2=0.5574 / SL=0.7251, risk/reward ratio 2.8:1
🧠 Why I’m confident shorting here
【Watchlist setup】Up +29.23% in 24h, then another +2.54% in 1h. 15m RSI=54.5 and 5m RSI=60.6 entered overbought territory. Monitoring for a reversal after a pullback of ≥0.8% from the high.
【Right-side reversal】Price pulled back -8.59% from the high of 0.74489. The 5m MACD bearish histogram is expanding, and the 15m RSI=43.6 has turned down from a high level — the right-side top is confirmed, and strategy #37 has given the go-ahead.
SL 0.7251 is set below the previous high of 0.74489 with some room to spare. TP1 represents roughly -10% downside, making the risk/reward ratio reasonable.
🛡️ Position management
If price hasn’t moved away from the cost zone by +0.3% after 30 minutes, exit with a time stop. Don’t fall in love with the trade.
Take profits in stages: reduce the position at TP1 and close out at TP2. Don’t manually move the SL lower.
This is a classic “right-side reversal after a sharp rally” setup. Do you think $BR can drop to 0.61? Check in below: comment 1 if you’re short, 2 if you’re buying the dip 👇
#币安合约 #实盘战报 #量化交易 #BRUSDT
1
2
357
·
--
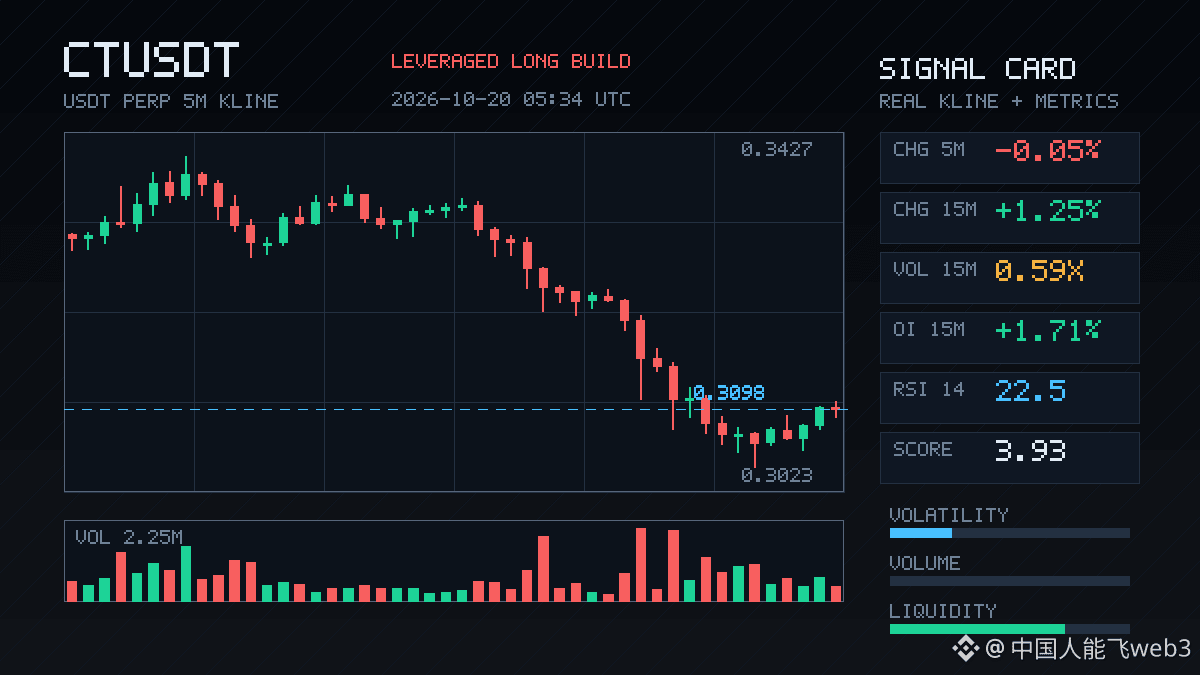
$CT 's 15m move isn't particularly strong (+1.25%), but OI jumped +1.71% in 15m, with notional up +149K. Combined with a 13.5% aggressive trade imbalance, a 1.31 buy/sell ratio, and funding rates near recent highs, this strongly suggests new leveraged longs are entering. Its anomaly percentile is 87.1%, ranking #19 across the entire pool, while its notional change ranks #37—not the most explosive, but still among the more anomalous assets. 24h trading volume is 152M, which is decent. The catch is that 15m volume is only 0.59x, suggesting a possible price-volume divergence. If you're considering chasing longs, stay alert and don't be fooled by the apparent boost from rising OI.
$CT 's 15m move isn't particularly strong (+1.25%), but OI jumped +1.71% in 15m, with notional up +149K. Combined with a 13.5% aggressive trade imbalance, a 1.31 buy/sell ratio, and funding rates near recent highs, this strongly suggests new leveraged longs are entering. Its anomaly percentile is 87.1%, ranking #19 across the entire pool, while its notional change ranks #37—not the most explosive, but still among the more anomalous assets. 24h trading volume is 152M, which is decent. The catch is that 15m volume is only 0.59x, suggesting a possible price-volume divergence. If you're considering chasing longs, stay alert and don't be fooled by the apparent boost from rising OI.
2
·
--
$BAT has made an interesting move over the past 15m: price is up 1.77%, breaking above the top of the range from the last 20 5m candles, while OI is falling—down 0.18% over 15m and 0.41% over 1h. This doesn’t look like new longs entering; it looks more like shorts covering or positions being closed out involuntarily. The taker volume imbalance is 9.3%, the buy/sell ratio is 1.21, so short-term buying is indeed pushing the price higher. The Z-score is 2.40, showing increased volatility, and volume is at 1.40x.
However, the OI anomaly percentile is already at 89.5%, ranking #37 across the entire pool. I generally wouldn’t chase a long in this kind of setup. Once a rally driven by short covering loses steam, it can easily give back all its gains. Let’s first see whether price can hold above the top of this range.
$BAT has made an interesting move over the past 15m: price is up 1.77%, breaking above the top of the range from the last 20 5m candles, while OI is falling—down 0.18% over 15m and 0.41% over 1h. This doesn’t look like new longs entering; it looks more like shorts covering or positions being closed out involuntarily. The taker volume imbalance is 9.3%, the buy/sell ratio is 1.21, so short-term buying is indeed pushing the price higher. The Z-score is 2.40, showing increased volatility, and volume is at 1.40x.
However, the OI anomaly percentile is already at 89.5%, ranking #37 across the entire pool. I generally wouldn’t chase a long in this kind of setup. Once a rally driven by short covering loses steam, it can easily give back all its gains. Let’s first see whether price can hold above the top of this range.
However, the OI anomaly percentile is already at 89.5%, ranking #37 across the entire pool. I generally wouldn’t chase a long in this kind of setup. Once a rally driven by short covering loses steam, it can easily give back all its gains. Let’s first see whether price can hold above the top of this range.
·
--
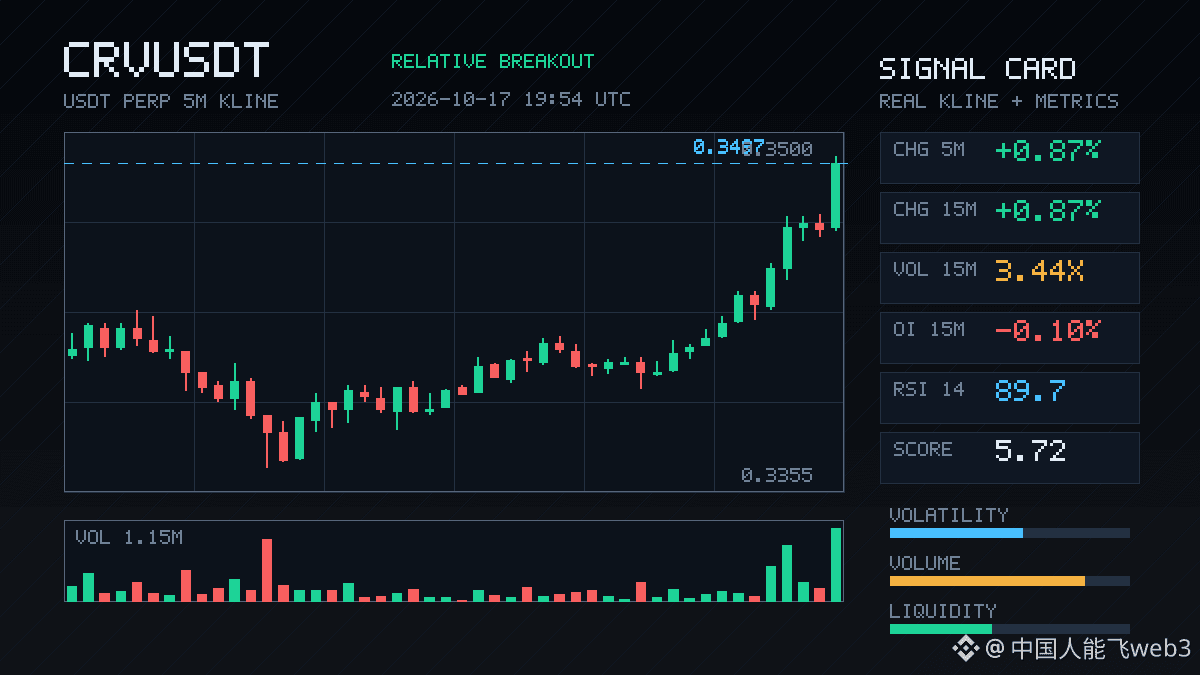
$CRV rallied 0.87% at 3:30 a.m., with volume surging to 3.44 times its previous level. But OI on the 15m timeframe edged down slightly—price up, open interest down. This isn’t fresh longs entering; it looks more like shorts covering or positions being closed out involuntarily.
The taker flow delta was +20.3%, the buy/sell ratio was 1.51, and the funding rate was also in a high percentile recently. This suggests the buying was biased in one direction, but OI didn’t rise along with price, so there’s limited appetite among bulls to add to their positions. OI on the 1h timeframe did tick up slightly (+0.05%, notional +457K), with decent consistency. Its anomaly percentile across the full pool was 73.6%, ranking #18; notional change ranked #37—toward the upper end of the middle tier.
The close broke above the upper boundary of the recent 20-bar 5m range, with volume confirming the move, but the structure isn’t very strong. With this combination of rising volume and price but falling OI, I’d lean toward waiting and seeing—let’s wait for OI and price to move in sync before making a call. Otherwise, the price could easily pull back once the short covering ends.
$CRV rallied 0.87% at 3:30 a.m., with volume surging to 3.44 times its previous level. But OI on the 15m timeframe edged down slightly—price up, open interest down. This isn’t fresh longs entering; it looks more like shorts covering or positions being closed out involuntarily.
The taker flow delta was +20.3%, the buy/sell ratio was 1.51, and the funding rate was also in a high percentile recently. This suggests the buying was biased in one direction, but OI didn’t rise along with price, so there’s limited appetite among bulls to add to their positions. OI on the 1h timeframe did tick up slightly (+0.05%, notional +457K), with decent consistency. Its anomaly percentile across the full pool was 73.6%, ranking #18; notional change ranked #37—toward the upper end of the middle tier.
The close broke above the upper boundary of the recent 20-bar 5m range, with volume confirming the move, but the structure isn’t very strong. With this combination of rising volume and price but falling OI, I’d lean toward waiting and seeing—let’s wait for OI and price to move in sync before making a call. Otherwise, the price could easily pull back once the short covering ends.
The taker flow delta was +20.3%, the buy/sell ratio was 1.51, and the funding rate was also in a high percentile recently. This suggests the buying was biased in one direction, but OI didn’t rise along with price, so there’s limited appetite among bulls to add to their positions. OI on the 1h timeframe did tick up slightly (+0.05%, notional +457K), with decent consistency. Its anomaly percentile across the full pool was 73.6%, ranking #18; notional change ranked #37—toward the upper end of the middle tier.
The close broke above the upper boundary of the recent 20-bar 5m range, with volume confirming the move, but the structure isn’t very strong. With this combination of rising volume and price but falling OI, I’d lean toward waiting and seeing—let’s wait for OI and price to move in sync before making a call. Otherwise, the price could easily pull back once the short covering ends.
1
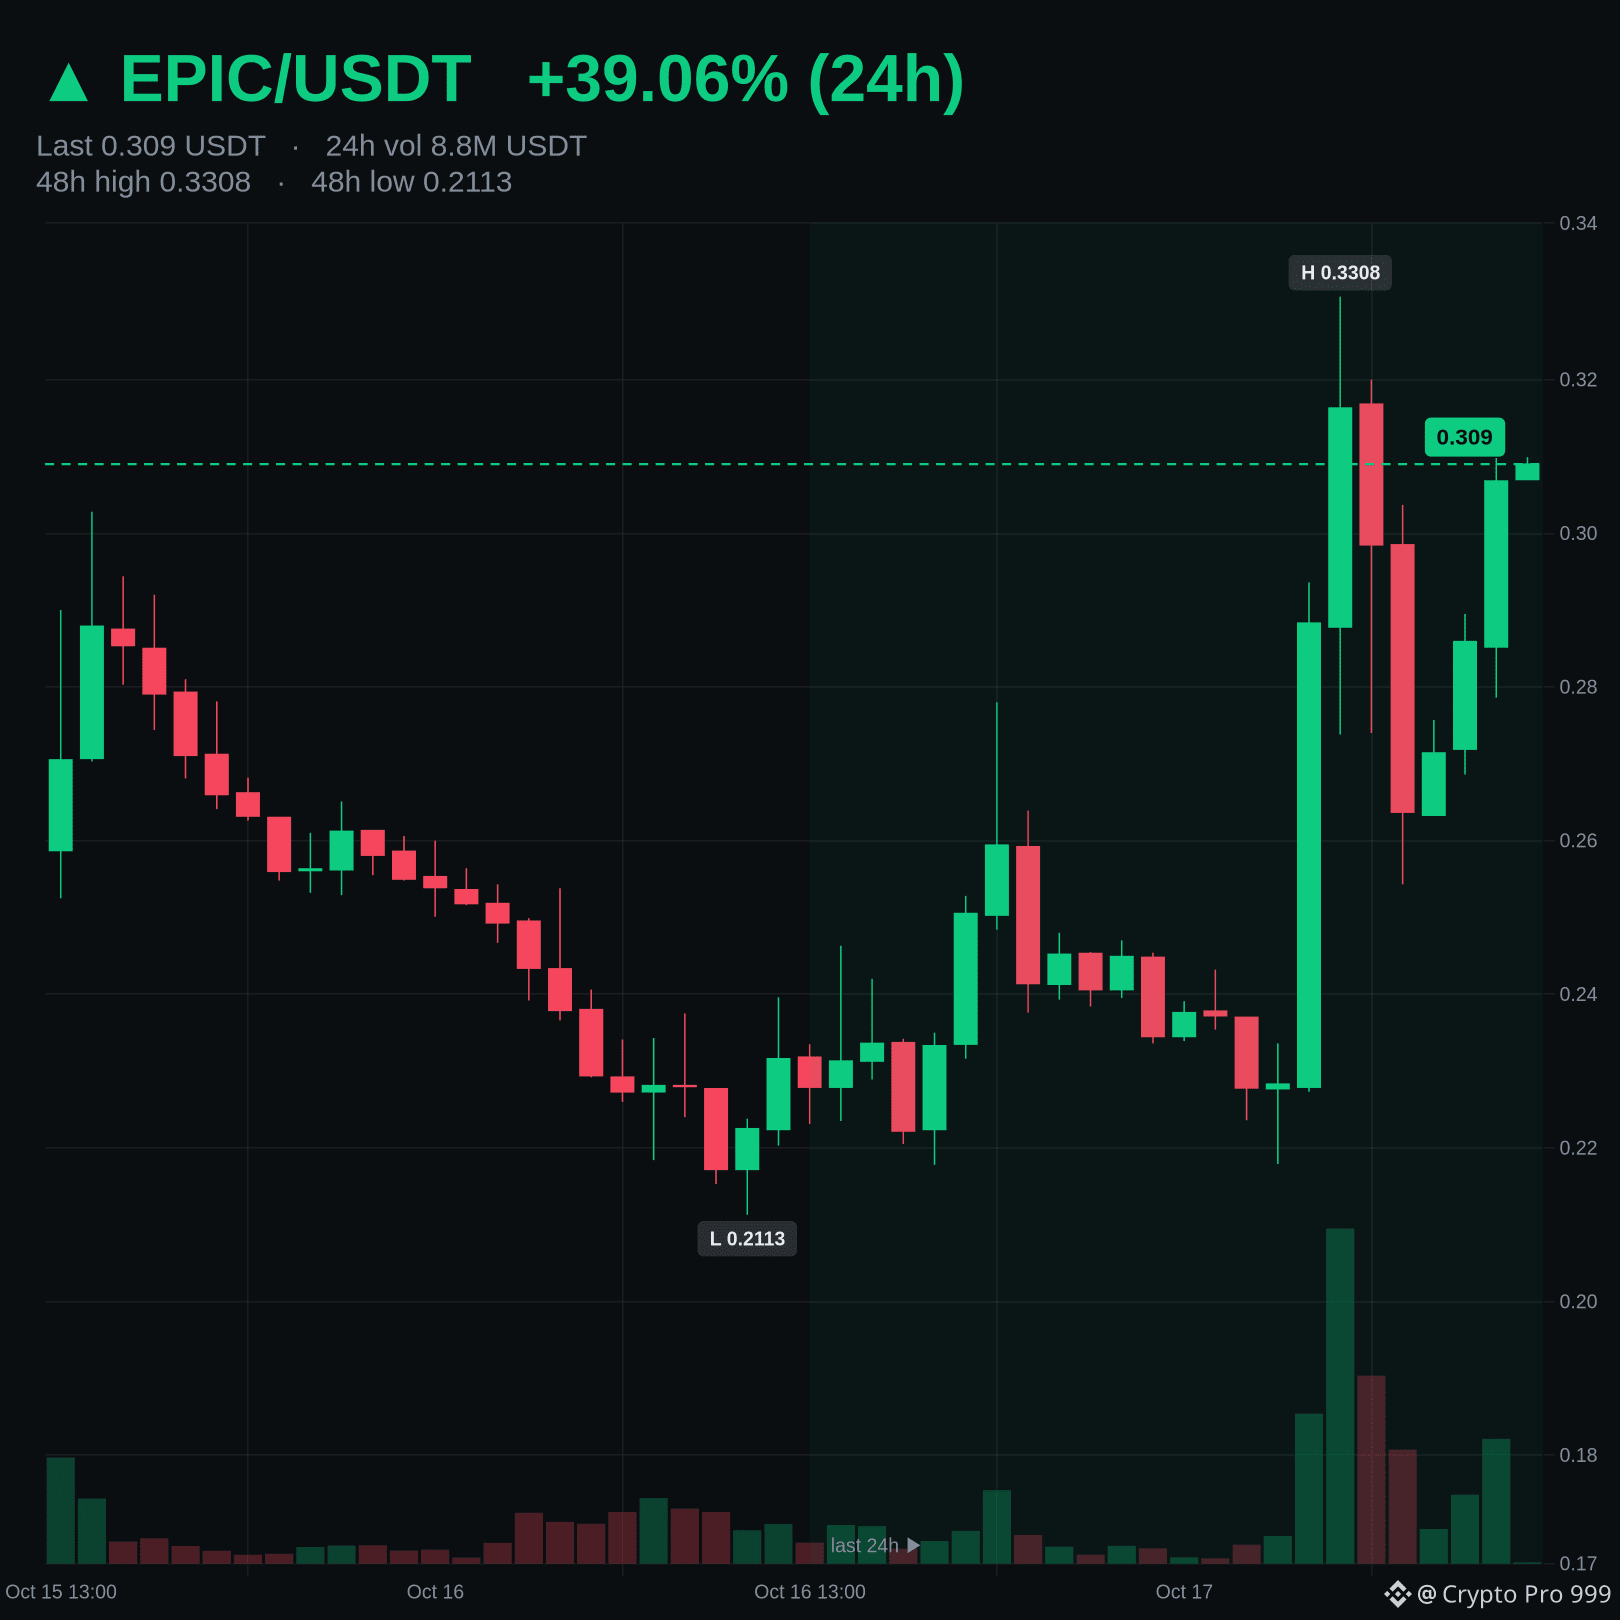
$EPIC moved up 39.06% in the last 24h and now trades at 0.309 USDT.
• 24h range: 0.2178 – 0.3308 USDT, in the middle of its 24h range
• 24h volume: 9,081,116 USDT (#37 of 54 liquid USDT pairs)
• Outperforming BTC (-1.27%)
Outperforming bitcoin despite being in the middle of its range.
Data: Binance spot, 2026-10-17 12:00 UTC. Educational content, not financial advice.
$EPIC moved up 39.06% in the last 24h and now trades at 0.309 USDT.
• 24h range: 0.2178 – 0.3308 USDT, in the middle of its 24h range
• 24h volume: 9,081,116 USDT (#37 of 54 liquid USDT pairs)
• Outperforming BTC (-1.27%)
Outperforming bitcoin despite being in the middle of its range.
Data: Binance spot, 2026-10-17 12:00 UTC. Educational content, not financial advice.
• 24h range: 0.2178 – 0.3308 USDT, in the middle of its 24h range
• 24h volume: 9,081,116 USDT (#37 of 54 liquid USDT pairs)
• Outperforming BTC (-1.27%)
Outperforming bitcoin despite being in the middle of its range.
Data: Binance spot, 2026-10-17 12:00 UTC. Educational content, not financial advice.
113
Log in to explore more content
Join global crypto users on Binance Square
⚡️ Get latest and useful information about crypto.
💬 Trusted by the world’s largest crypto exchange.
👍 Discover real insights from verified creators.
Email / Phone number
Trending Topics
1
#BinanceWithdrawalScamWarning
10,848 views
360 Discussing
2
#USMidtermElections
559,924 views
2,923 Discussing
3
#USOctoberNFP-AreRateCutsStillPossible
19,868 views
371 Discussing
4
#AppleEarningsAhead-CanStockHitNewHigh
6,489 views
270 Discussing
5
#Verify1to1BinanceReserves
19,371 views
298 Discussing
6
#BinanceRestores28FiatWithdrawals
96,642 views
931 Discussing
7
#StrategyRepurchases$208MSTRCAdds811Bitcoin
2,787 views
13 Discussing
8
#FATFLaunchesReviewOfCryptoHubsMoneyLaunderingControls
462 views
9 Discussing
9
#BinanceProcesses$4.65BWithdrawals
96,645 views
355 Discussing
10
#HKMALaunchesSAGEAgenticFinanceProject
2,562 views
146 Discussing