

#36
36
33,939 views
81 Discussing
Hot
Latest

·
--
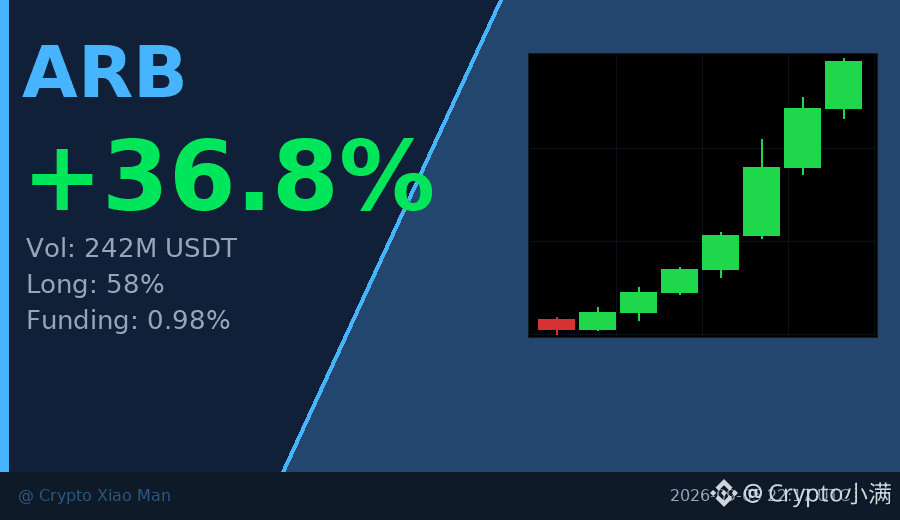
36% single-day gain, ARB is not just following the move this time.
$240 million in trading volume pushed the price from 0.128 to 0.178, and the hourly chart closed with three consecutive bullish candles. A funding rate of 0.98% is not extreme, but a 58% long ratio shows most people are already on board.
What’s interesting is that volume was denser at lower levels than at higher ones—$130 million was absorbed in the 0.14 to 0.15 range, and the 0.16 breakout alone saw $370 million. This isn’t a test; it’s real money changing hands.
In the short term, the key is whether 0.18 can hold. If it breaks the previous high of 0.181, there will be room to talk about more upside.
$ARB #Layer2 #36%涨幅
Click the card below to quickly check the market👇
36% single-day gain, ARB is not just following the move this time.
$240 million in trading volume pushed the price from 0.128 to 0.178, and the hourly chart closed with three consecutive bullish candles. A funding rate of 0.98% is not extreme, but a 58% long ratio shows most people are already on board.
What’s interesting is that volume was denser at lower levels than at higher ones—$130 million was absorbed in the 0.14 to 0.15 range, and the 0.16 breakout alone saw $370 million. This isn’t a test; it’s real money changing hands.
In the short term, the key is whether 0.18 can hold. If it breaks the previous high of 0.181, there will be room to talk about more upside.
$ARB #Layer2 #36%涨幅
Click the card below to quickly check the market👇
$240 million in trading volume pushed the price from 0.128 to 0.178, and the hourly chart closed with three consecutive bullish candles. A funding rate of 0.98% is not extreme, but a 58% long ratio shows most people are already on board.
What’s interesting is that volume was denser at lower levels than at higher ones—$130 million was absorbed in the 0.14 to 0.15 range, and the 0.16 breakout alone saw $370 million. This isn’t a test; it’s real money changing hands.
In the short term, the key is whether 0.18 can hold. If it breaks the previous high of 0.181, there will be room to talk about more upside.
$ARB #Layer2 #36%涨幅
Click the card below to quickly check the market👇
116

·
--
ORCA drops 1.6% in a notable move! These support levels are worth watchingAt 11:50 (3 minutes ago), ORCA dropped 1.6% at a key time point (5-minute window 11:45→11:50). As of 11:53:14, the current price is 2.916, up 24.6% over 24h. Other tokens with notable moves in the same batch include PUMP and PHAROS.
📅 Data as of 11:53:14 (event trigger times are noted for each item; prices are real-time snapshots taken when this was written)
📌 In a nutshell: Notable moves during key periods (candlestick closes / U.S. market open and close) often involve institutional participation, making the signals more credible.
Market overview: BTC 84,183.00 (-1.54%) · ETH 2,613.37 (-3.17%); across the market, 102 gainers / 389 decliners over 24h; top 24h gainer: Lobster +61.24%, top decliner: LYN -25.44%.
ORCA drops 1.6% in a notable move! These support levels are worth watching
At 11:50 (3 minutes ago), ORCA dropped 1.6% at a key time point (5-minute window 11:45→11:50). As of 11:53:14, the current price is 2.916, up 24.6% over 24h. Other tokens with notable moves in the same batch include PUMP and PHAROS.
📅 Data as of 11:53:14 (event trigger times are noted for each item; prices are real-time snapshots taken when this was written)
📌 In a nutshell: Notable moves during key periods (candlestick closes / U.S. market open and close) often involve institutional participation, making the signals more credible.
Market overview: BTC 84,183.00 (-1.54%) · ETH 2,613.37 (-3.17%); across the market, 102 gainers / 389 decliners over 24h; top 24h gainer: Lobster +61.24%, top decliner: LYN -25.44%.
📅 Data as of 11:53:14 (event trigger times are noted for each item; prices are real-time snapshots taken when this was written)
📌 In a nutshell: Notable moves during key periods (candlestick closes / U.S. market open and close) often involve institutional participation, making the signals more credible.
Market overview: BTC 84,183.00 (-1.54%) · ETH 2,613.37 (-3.17%); across the market, 102 gainers / 389 decliners over 24h; top 24h gainer: Lobster +61.24%, top decliner: LYN -25.44%.
1

·
--
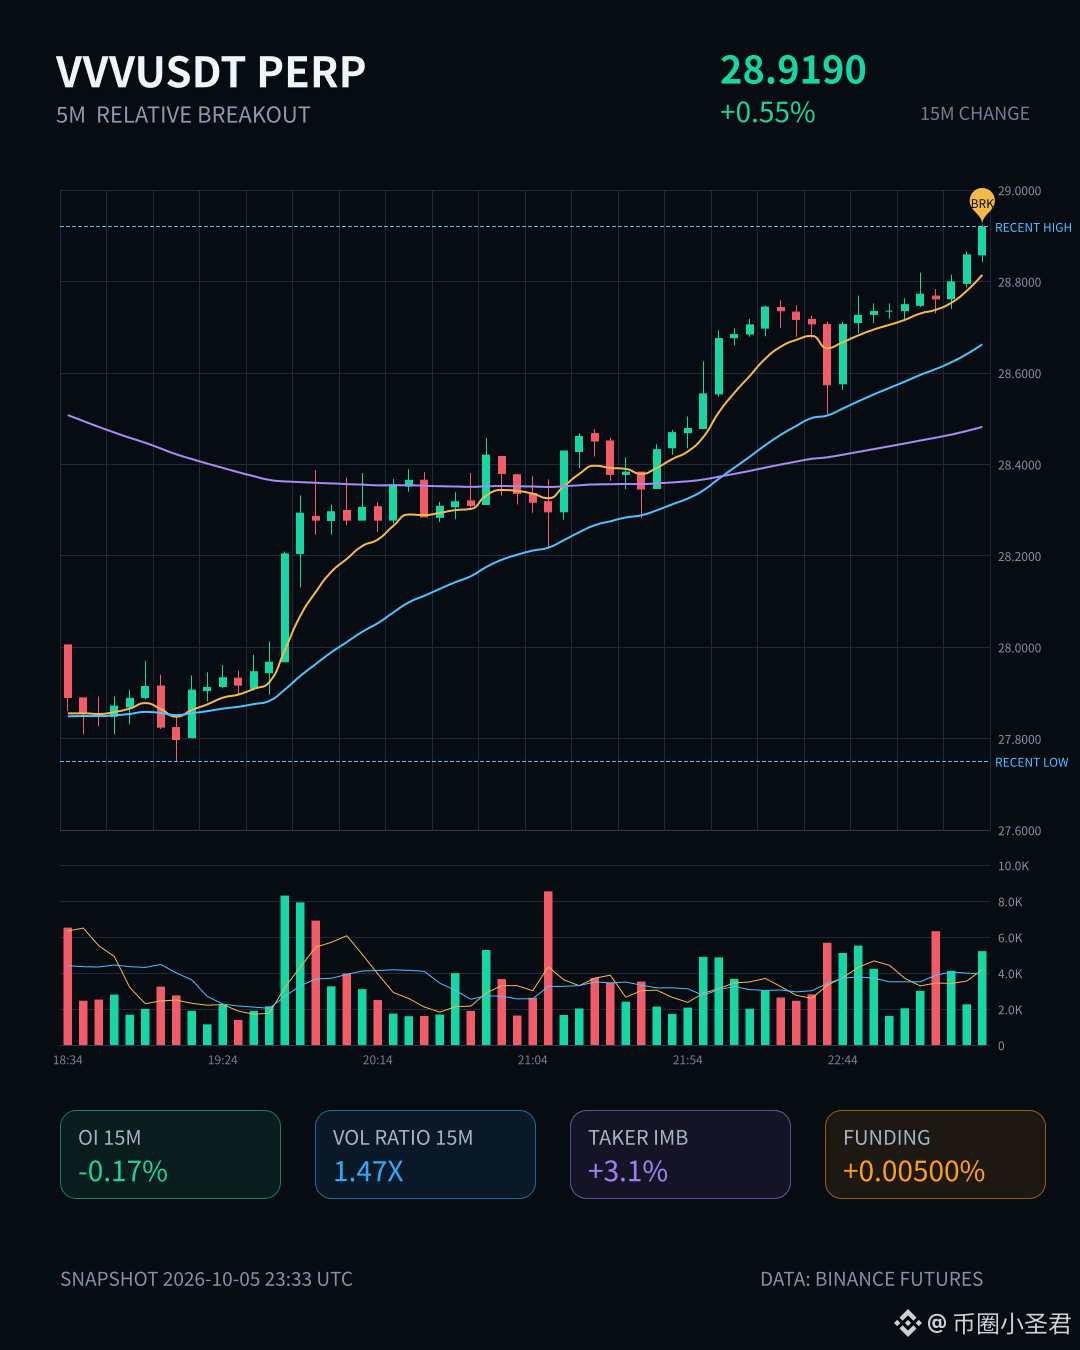
$VVV 15m just tested the upper edge of a nearly 20-bar 5m range. Volume is 1.47x, the buy/sell ratio is 1.06, and the taker flow imbalance is +3.1%. The price is slightly up, while OI is down 0.94% over 1h—a typical short-covering/position-reduction structure, not a major influx of new longs. Pool-wide anomaly rank: #40; notional rank: #36; notional change: 103K (+0.34%). Watch for follow-through: if OI keeps falling while the price holds steady, there may be more room for short covering.
$VVV 15m just tested the upper edge of a nearly 20-bar 5m range. Volume is 1.47x, the buy/sell ratio is 1.06, and the taker flow imbalance is +3.1%. The price is slightly up, while OI is down 0.94% over 1h—a typical short-covering/position-reduction structure, not a major influx of new longs. Pool-wide anomaly rank: #40; notional rank: #36; notional change: 103K (+0.34%). Watch for follow-through: if OI keeps falling while the price holds steady, there may be more room for short covering.
16

·
--
$ONE This drop isn’t that violent, but the structure is pretty interesting.
On the 15m chart, it fell by less than 1 point, yet the volume expanded to 1.63x, and the volatility “Z” hit 2.41—the volume came out first, while the price just slowly grinds downward. More importantly, OI is dropping in sync. In the 1h contracts, open interest fell by 1.81%, and the notional shrank by nearly 190k U. A combination of price down + positions down looks more like longs cutting risk or actively reducing exposure, rather than shorts opening new positions to press it lower.
Active trade imbalance: -13.7%, buy/sell ratio at 0.76. Selling pressure is indeed in control, and the close also broke below the lower edge of the last ~20 5m candles. But note: this is deleveraging-style selling, not capital rushing in to short.
In the whole pool’s abnormal ranking it’s #40, and notional change is #36—so it ranks relatively high among the pool’s notable moves, though the absolute magnitude isn’t huge.
My take: volume up while price falls + OI shrinking. After the short-term sell pressure is released, there may be a rebound, but the prerequisite is that positions don’t keep dropping. If OI continues to move lower, then positions are steadily exiting, and the rebound strength will be discounted. With 63M’s 24h trading value sitting there—liquidity is sufficient—don’t rush to pick the bottom. Wait until the active buy/sell ratio returns above 1 before considering it.
$ONE This drop isn’t that violent, but the structure is pretty interesting.
On the 15m chart, it fell by less than 1 point, yet the volume expanded to 1.63x, and the volatility “Z” hit 2.41—the volume came out first, while the price just slowly grinds downward. More importantly, OI is dropping in sync. In the 1h contracts, open interest fell by 1.81%, and the notional shrank by nearly 190k U. A combination of price down + positions down looks more like longs cutting risk or actively reducing exposure, rather than shorts opening new positions to press it lower.
Active trade imbalance: -13.7%, buy/sell ratio at 0.76. Selling pressure is indeed in control, and the close also broke below the lower edge of the last ~20 5m candles. But note: this is deleveraging-style selling, not capital rushing in to short.
In the whole pool’s abnormal ranking it’s #40, and notional change is #36—so it ranks relatively high among the pool’s notable moves, though the absolute magnitude isn’t huge.
My take: volume up while price falls + OI shrinking. After the short-term sell pressure is released, there may be a rebound, but the prerequisite is that positions don’t keep dropping. If OI continues to move lower, then positions are steadily exiting, and the rebound strength will be discounted. With 63M’s 24h trading value sitting there—liquidity is sufficient—don’t rush to pick the bottom. Wait until the active buy/sell ratio returns above 1 before considering it.
On the 15m chart, it fell by less than 1 point, yet the volume expanded to 1.63x, and the volatility “Z” hit 2.41—the volume came out first, while the price just slowly grinds downward. More importantly, OI is dropping in sync. In the 1h contracts, open interest fell by 1.81%, and the notional shrank by nearly 190k U. A combination of price down + positions down looks more like longs cutting risk or actively reducing exposure, rather than shorts opening new positions to press it lower.
Active trade imbalance: -13.7%, buy/sell ratio at 0.76. Selling pressure is indeed in control, and the close also broke below the lower edge of the last ~20 5m candles. But note: this is deleveraging-style selling, not capital rushing in to short.
In the whole pool’s abnormal ranking it’s #40, and notional change is #36—so it ranks relatively high among the pool’s notable moves, though the absolute magnitude isn’t huge.
My take: volume up while price falls + OI shrinking. After the short-term sell pressure is released, there may be a rebound, but the prerequisite is that positions don’t keep dropping. If OI continues to move lower, then positions are steadily exiting, and the rebound strength will be discounted. With 63M’s 24h trading value sitting there—liquidity is sufficient—don’t rush to pick the bottom. Wait until the active buy/sell ratio returns above 1 before considering it.
10

·
--
$CRO This time it’s not “wait a little longer for the vote.”
Cronos POS Proposal #36 / #37 have both PASSED: the community pool of 228 million $CRO tokens has been completed for burn, bringing the total burned to 428 million. With Ult + Cronos Launch going forward, 100% of product revenue will be used to buy $CRO in the open market, with monthly burns; the transaction hash will be made public. The staking rewards interpretation remains unchanged—continue under the Strategic Reserve.
When this was posted on the square on September 21, the angle was exactly “proposal ≠ passing.” Today, the voting result and the burn amount are delivered at the same time—this is a hard upgrade along the same line, not a re-skin of old news.
Checked: the cosmos gov API status is PROPOSAL_STATUS_PASSED; TokenPost / BlockBeats 370201 cites the Cronos Network. Not investment advice.
$CRO This time it’s not “wait a little longer for the vote.”
Cronos POS Proposal #36 / #37 have both PASSED: the community pool of 228 million $CRO tokens has been completed for burn, bringing the total burned to 428 million. With Ult + Cronos Launch going forward, 100% of product revenue will be used to buy $CRO in the open market, with monthly burns; the transaction hash will be made public. The staking rewards interpretation remains unchanged—continue under the Strategic Reserve.
When this was posted on the square on September 21, the angle was exactly “proposal ≠ passing.” Today, the voting result and the burn amount are delivered at the same time—this is a hard upgrade along the same line, not a re-skin of old news.
Checked: the cosmos gov API status is PROPOSAL_STATUS_PASSED; TokenPost / BlockBeats 370201 cites the Cronos Network. Not investment advice.
Cronos POS Proposal #36 / #37 have both PASSED: the community pool of 228 million $CRO tokens has been completed for burn, bringing the total burned to 428 million. With Ult + Cronos Launch going forward, 100% of product revenue will be used to buy $CRO in the open market, with monthly burns; the transaction hash will be made public. The staking rewards interpretation remains unchanged—continue under the Strategic Reserve.
When this was posted on the square on September 21, the angle was exactly “proposal ≠ passing.” Today, the voting result and the burn amount are delivered at the same time—this is a hard upgrade along the same line, not a re-skin of old news.
Checked: the cosmos gov API status is PROPOSAL_STATUS_PASSED; TokenPost / BlockBeats 370201 cites the Cronos Network. Not investment advice.
142
·
--
$SYN This move is a bit interesting—on the 15m chart it jumped directly by 1.34%. The trading volume hit 4.28x, with a Z value of 3.43. It’s not the kind of drift-and-flutter volatility.
The key is that OI is also rising: on 15m +0.90%, and on 1h +0.46%. Even though the nominal change isn’t particularly large, combined with the price breaking above the upper edge of nearly 20 consecutive 5m K lines, the aggressive volume delta is +16.1%, with a buy/sell ratio of 1.39. Structurally, it looks more like new leveraged longs are entering and pushing—not just a simple spot pump.
Across the whole pool, the abnormal percentile is 87.7%, with abnormal rank #19 and nominal change rank #36. It’s not the most explosive tier, but the depth confirmation is pretty solid: volume is higher than usual, it tags the boundary, and the directional bias is there. Most of the signals you’d want are basically in place.
In the past 24h, turnover is 18.91M. The pool isn’t that thick—if you chase at this position, you still need to keep a close eye on OI so it doesn’t suddenly reverse and get pulled away. First, let’s see whether it can hold steady at the top edge of this range.
$SYN This move is a bit interesting—on the 15m chart it jumped directly by 1.34%. The trading volume hit 4.28x, with a Z value of 3.43. It’s not the kind of drift-and-flutter volatility.
The key is that OI is also rising: on 15m +0.90%, and on 1h +0.46%. Even though the nominal change isn’t particularly large, combined with the price breaking above the upper edge of nearly 20 consecutive 5m K lines, the aggressive volume delta is +16.1%, with a buy/sell ratio of 1.39. Structurally, it looks more like new leveraged longs are entering and pushing—not just a simple spot pump.
Across the whole pool, the abnormal percentile is 87.7%, with abnormal rank #19 and nominal change rank #36. It’s not the most explosive tier, but the depth confirmation is pretty solid: volume is higher than usual, it tags the boundary, and the directional bias is there. Most of the signals you’d want are basically in place.
In the past 24h, turnover is 18.91M. The pool isn’t that thick—if you chase at this position, you still need to keep a close eye on OI so it doesn’t suddenly reverse and get pulled away. First, let’s see whether it can hold steady at the top edge of this range.
The key is that OI is also rising: on 15m +0.90%, and on 1h +0.46%. Even though the nominal change isn’t particularly large, combined with the price breaking above the upper edge of nearly 20 consecutive 5m K lines, the aggressive volume delta is +16.1%, with a buy/sell ratio of 1.39. Structurally, it looks more like new leveraged longs are entering and pushing—not just a simple spot pump.
Across the whole pool, the abnormal percentile is 87.7%, with abnormal rank #19 and nominal change rank #36. It’s not the most explosive tier, but the depth confirmation is pretty solid: volume is higher than usual, it tags the boundary, and the directional bias is there. Most of the signals you’d want are basically in place.
In the past 24h, turnover is 18.91M. The pool isn’t that thick—if you chase at this position, you still need to keep a close eye on OI so it doesn’t suddenly reverse and get pulled away. First, let’s see whether it can hold steady at the top edge of this range.
34
·
--
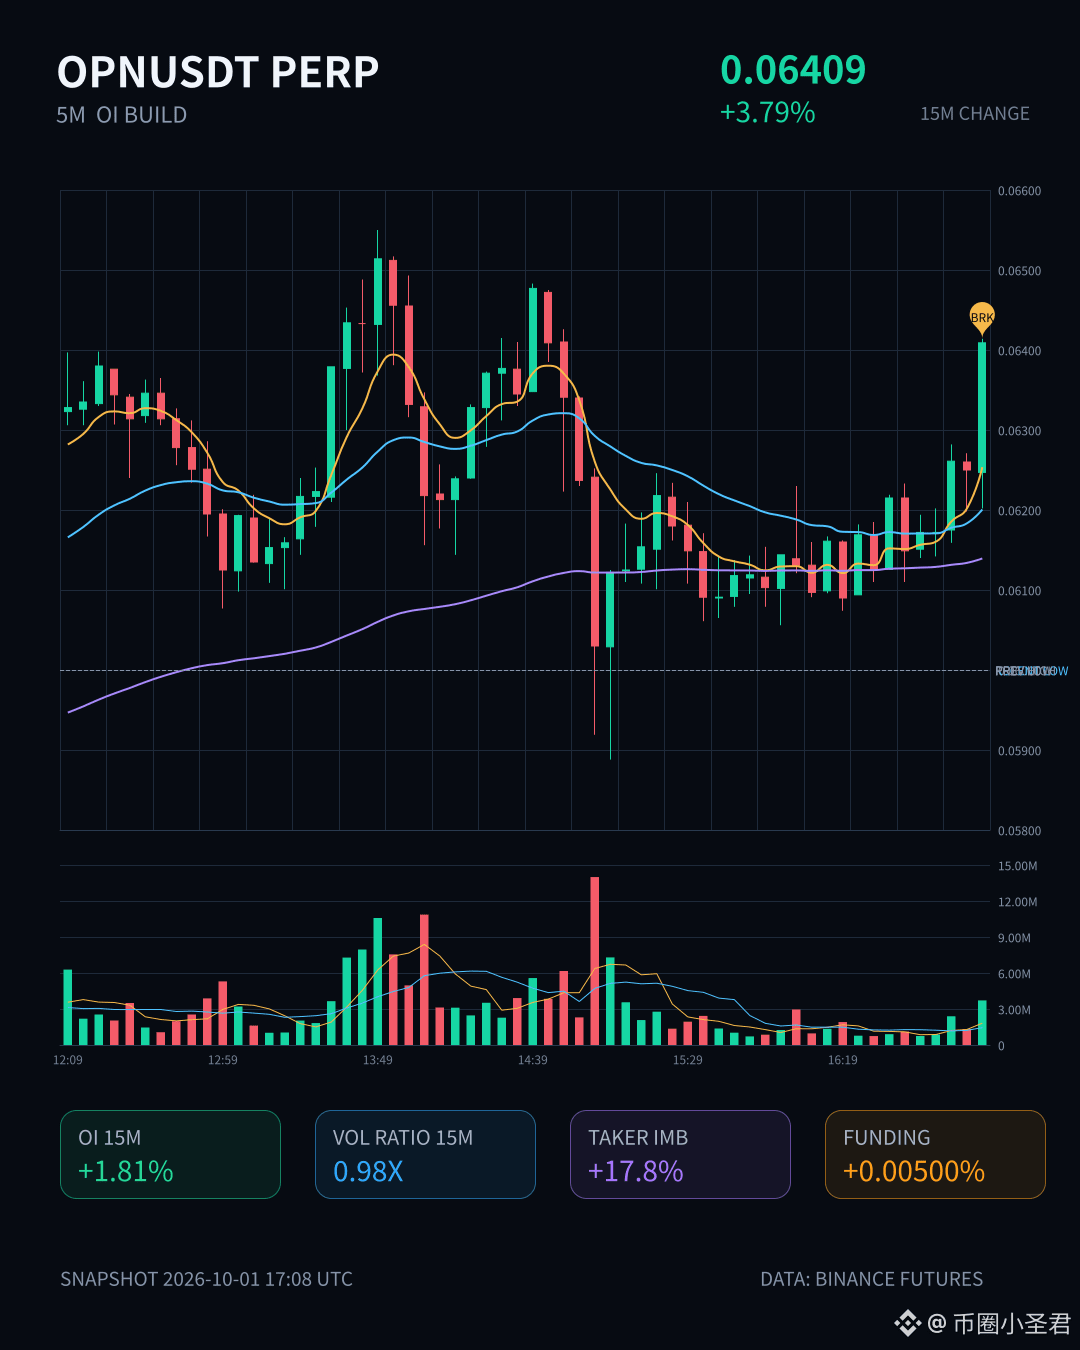
$OPN This move on the 15m is up 3.79%, but what’s truly worth watching isn’t the price—it’s the OI. On 15m: +1.81%, on 1h: +1.69%. The notional change stays continuously in the 270K–300K range for two consecutive cycles. Price rises and OI rises in sync—this is typical of leveraged longs building positions, not shorts covering and pushing.
More importantly, the abnormal percentile is 98.4%, ranking #1 across the whole pool. This position itself is right up against the historical extreme range boundary. Active trade difference is +17.8%, buy/sell ratio is 1.43, and the buy-side direction is biased. It’s also been sustained over multiple consecutive cycles, not just a single 15m spike.
However, note that the trading volume is only 0.98x—no expansion. The 24h turnover of 9.82M is also rather thin. The OI is abnormal at #1 , while the notional change is only #36—this suggests the anomaly pops out relative to its size, not that large capital is smashing in hard. This kind of structure is easiest to get two-sidedly harvested: either it keeps adding leverage and pushes up through the top of the range, or a single shift in aggressive trading flips direction and buries all the new longs.
Since it’s hugging the historical extreme with volume not following and OI piled up so fast, I won’t chase. Let’s see if it can hold steady above the boundary before deciding. If it breaks down, I’ll admit I’m wrong.
$OPN This move on the 15m is up 3.79%, but what’s truly worth watching isn’t the price—it’s the OI. On 15m: +1.81%, on 1h: +1.69%. The notional change stays continuously in the 270K–300K range for two consecutive cycles. Price rises and OI rises in sync—this is typical of leveraged longs building positions, not shorts covering and pushing.
More importantly, the abnormal percentile is 98.4%, ranking #1 across the whole pool. This position itself is right up against the historical extreme range boundary. Active trade difference is +17.8%, buy/sell ratio is 1.43, and the buy-side direction is biased. It’s also been sustained over multiple consecutive cycles, not just a single 15m spike.
However, note that the trading volume is only 0.98x—no expansion. The 24h turnover of 9.82M is also rather thin. The OI is abnormal at #1 , while the notional change is only #36—this suggests the anomaly pops out relative to its size, not that large capital is smashing in hard. This kind of structure is easiest to get two-sidedly harvested: either it keeps adding leverage and pushes up through the top of the range, or a single shift in aggressive trading flips direction and buries all the new longs.
Since it’s hugging the historical extreme with volume not following and OI piled up so fast, I won’t chase. Let’s see if it can hold steady above the boundary before deciding. If it breaks down, I’ll admit I’m wrong.
More importantly, the abnormal percentile is 98.4%, ranking #1 across the whole pool. This position itself is right up against the historical extreme range boundary. Active trade difference is +17.8%, buy/sell ratio is 1.43, and the buy-side direction is biased. It’s also been sustained over multiple consecutive cycles, not just a single 15m spike.
However, note that the trading volume is only 0.98x—no expansion. The 24h turnover of 9.82M is also rather thin. The OI is abnormal at #1 , while the notional change is only #36—this suggests the anomaly pops out relative to its size, not that large capital is smashing in hard. This kind of structure is easiest to get two-sidedly harvested: either it keeps adding leverage and pushes up through the top of the range, or a single shift in aggressive trading flips direction and buries all the new longs.
Since it’s hugging the historical extreme with volume not following and OI piled up so fast, I won’t chase. Let’s see if it can hold steady above the boundary before deciding. If it breaks down, I’ll admit I’m wrong.
19
·
--
ENA there’s something interesting here.
The price for 15m dropped 1.26%, but OI is rising—15m +0.36%, 1h +0.64%. The nominal change is negative, -4.71M. What does that mean? New shorts are coming in; it’s not just old longs closing.
The close broke below the lower edge of about the last 20 5m bars. Active trading is worse by -12.7%, the buy/sell ratio is 0.78, and sell pressure is taking the lead. Volume is 1.56x—higher than normal—and the funding rate is still in a high percentile recently. At this level, shorts are willing to pay to enter.
Whole-pool anomaly #36, nominal change #9—confirmed by depth checks. The 24h turnover is 460 million, liquidity is sufficient.
Structurally, it looks more like newly added leveraged shorts entering, not simply long position closures. Keep following.
ENA there’s something interesting here.
The price for 15m dropped 1.26%, but OI is rising—15m +0.36%, 1h +0.64%. The nominal change is negative, -4.71M. What does that mean? New shorts are coming in; it’s not just old longs closing.
The close broke below the lower edge of about the last 20 5m bars. Active trading is worse by -12.7%, the buy/sell ratio is 0.78, and sell pressure is taking the lead. Volume is 1.56x—higher than normal—and the funding rate is still in a high percentile recently. At this level, shorts are willing to pay to enter.
Whole-pool anomaly #36, nominal change #9—confirmed by depth checks. The 24h turnover is 460 million, liquidity is sufficient.
Structurally, it looks more like newly added leveraged shorts entering, not simply long position closures. Keep following.
The price for 15m dropped 1.26%, but OI is rising—15m +0.36%, 1h +0.64%. The nominal change is negative, -4.71M. What does that mean? New shorts are coming in; it’s not just old longs closing.
The close broke below the lower edge of about the last 20 5m bars. Active trading is worse by -12.7%, the buy/sell ratio is 0.78, and sell pressure is taking the lead. Volume is 1.56x—higher than normal—and the funding rate is still in a high percentile recently. At this level, shorts are willing to pay to enter.
Whole-pool anomaly #36, nominal change #9—confirmed by depth checks. The 24h turnover is 460 million, liquidity is sufficient.
Structurally, it looks more like newly added leveraged shorts entering, not simply long position closures. Keep following.
23
·
--
$CC There’s something interesting here. The price falls 1.15% on the 15m timeframe, volume directly reaches 5.2x, the buy/sell ratio is 0.21, and the active trading imbalance is -64.8%. The sell-off direction is very consistent, and the close even falls below the lower band of the most recent 20 5m candles.
But OI hasn’t dropped: 15m +0.15%, 1h +0.20%. Price is down while OI is up—combined with the funding rate sitting in a high percentile recently—it looks more like newly added leveraged short positions are entering, rather than a passive dump where longs are liquidated.
Abnormal percentile is 76.6%, full pool #11, notional change #36. Depth confirmation has also passed—the volume is higher than normal, it touches the boundary of the range, and the active direction is tilted. Over the past 24h, turnover is only 14.84M, so the pool isn’t that deep. In this kind of position, if shorts keep adding, it’s easy to trigger acceleration; conversely, if someone steps in to buy, short covering could happen very quickly.
For now, watch closely: see whether this 5m lower band is a real break or a fakeout.
$CC There’s something interesting here. The price falls 1.15% on the 15m timeframe, volume directly reaches 5.2x, the buy/sell ratio is 0.21, and the active trading imbalance is -64.8%. The sell-off direction is very consistent, and the close even falls below the lower band of the most recent 20 5m candles.
But OI hasn’t dropped: 15m +0.15%, 1h +0.20%. Price is down while OI is up—combined with the funding rate sitting in a high percentile recently—it looks more like newly added leveraged short positions are entering, rather than a passive dump where longs are liquidated.
Abnormal percentile is 76.6%, full pool #11, notional change #36. Depth confirmation has also passed—the volume is higher than normal, it touches the boundary of the range, and the active direction is tilted. Over the past 24h, turnover is only 14.84M, so the pool isn’t that deep. In this kind of position, if shorts keep adding, it’s easy to trigger acceleration; conversely, if someone steps in to buy, short covering could happen very quickly.
For now, watch closely: see whether this 5m lower band is a real break or a fakeout.
But OI hasn’t dropped: 15m +0.15%, 1h +0.20%. Price is down while OI is up—combined with the funding rate sitting in a high percentile recently—it looks more like newly added leveraged short positions are entering, rather than a passive dump where longs are liquidated.
Abnormal percentile is 76.6%, full pool #11, notional change #36. Depth confirmation has also passed—the volume is higher than normal, it touches the boundary of the range, and the active direction is tilted. Over the past 24h, turnover is only 14.84M, so the pool isn’t that deep. In this kind of position, if shorts keep adding, it’s easy to trigger acceleration; conversely, if someone steps in to buy, short covering could happen very quickly.
For now, watch closely: see whether this 5m lower band is a real break or a fakeout.

·
--
JUP—this move has something to it.
On the 15m chart, it directly broke through the upper edge of nearly 20 five-minute candles; the volume hit about 2x the usual level, the aggressive buy/sell ratio is 1.87, and buy-side order flow leans to around 30%. This isn’t the kind of volume that retail traders can accidentally “stir up” with shaky hands.
But the interesting part is that OI is falling—on the 15m it’s -0.03%, and on the 1h it’s -0.10%, while price is still climbing. This is a classic short-covering structure: shorts are being pushed around rather than new longs coming in hard to pull.
Funding rates are already sitting in the high percentile range recently, which also suggests the long side is starting to get crowded.
What this structure fears most is what happens after the covering ends—if nobody steps in to continue the momentum. The abnormality across the whole pool ranks at #15, nominal change is #36, 24h trading value is 22M. Attention isn’t at absolute peak, but it’s definitely not low either. Multiple cycles have continued in succession, and depth confirmation is sufficient.
My take: short-term sentiment has already been ignited, but you need to keep an eye on the OI divergence signal. If OI turns positive and price keeps pushing higher, that’s a real breakout. If OI keeps dropping and price stalls upward, then it’s likely just a short-covering pulse—don’t be the one to catch the falling knife when funding is already high.
$JUP
JUP—this move has something to it.
On the 15m chart, it directly broke through the upper edge of nearly 20 five-minute candles; the volume hit about 2x the usual level, the aggressive buy/sell ratio is 1.87, and buy-side order flow leans to around 30%. This isn’t the kind of volume that retail traders can accidentally “stir up” with shaky hands.
But the interesting part is that OI is falling—on the 15m it’s -0.03%, and on the 1h it’s -0.10%, while price is still climbing. This is a classic short-covering structure: shorts are being pushed around rather than new longs coming in hard to pull.
Funding rates are already sitting in the high percentile range recently, which also suggests the long side is starting to get crowded.
What this structure fears most is what happens after the covering ends—if nobody steps in to continue the momentum. The abnormality across the whole pool ranks at #15, nominal change is #36, 24h trading value is 22M. Attention isn’t at absolute peak, but it’s definitely not low either. Multiple cycles have continued in succession, and depth confirmation is sufficient.
My take: short-term sentiment has already been ignited, but you need to keep an eye on the OI divergence signal. If OI turns positive and price keeps pushing higher, that’s a real breakout. If OI keeps dropping and price stalls upward, then it’s likely just a short-covering pulse—don’t be the one to catch the falling knife when funding is already high.
$JUP
On the 15m chart, it directly broke through the upper edge of nearly 20 five-minute candles; the volume hit about 2x the usual level, the aggressive buy/sell ratio is 1.87, and buy-side order flow leans to around 30%. This isn’t the kind of volume that retail traders can accidentally “stir up” with shaky hands.
But the interesting part is that OI is falling—on the 15m it’s -0.03%, and on the 1h it’s -0.10%, while price is still climbing. This is a classic short-covering structure: shorts are being pushed around rather than new longs coming in hard to pull.
Funding rates are already sitting in the high percentile range recently, which also suggests the long side is starting to get crowded.
What this structure fears most is what happens after the covering ends—if nobody steps in to continue the momentum. The abnormality across the whole pool ranks at #15, nominal change is #36, 24h trading value is 22M. Attention isn’t at absolute peak, but it’s definitely not low either. Multiple cycles have continued in succession, and depth confirmation is sufficient.
My take: short-term sentiment has already been ignited, but you need to keep an eye on the OI divergence signal. If OI turns positive and price keeps pushing higher, that’s a real breakout. If OI keeps dropping and price stalls upward, then it’s likely just a short-covering pulse—don’t be the one to catch the falling knife when funding is already high.
$JUP
8

Article
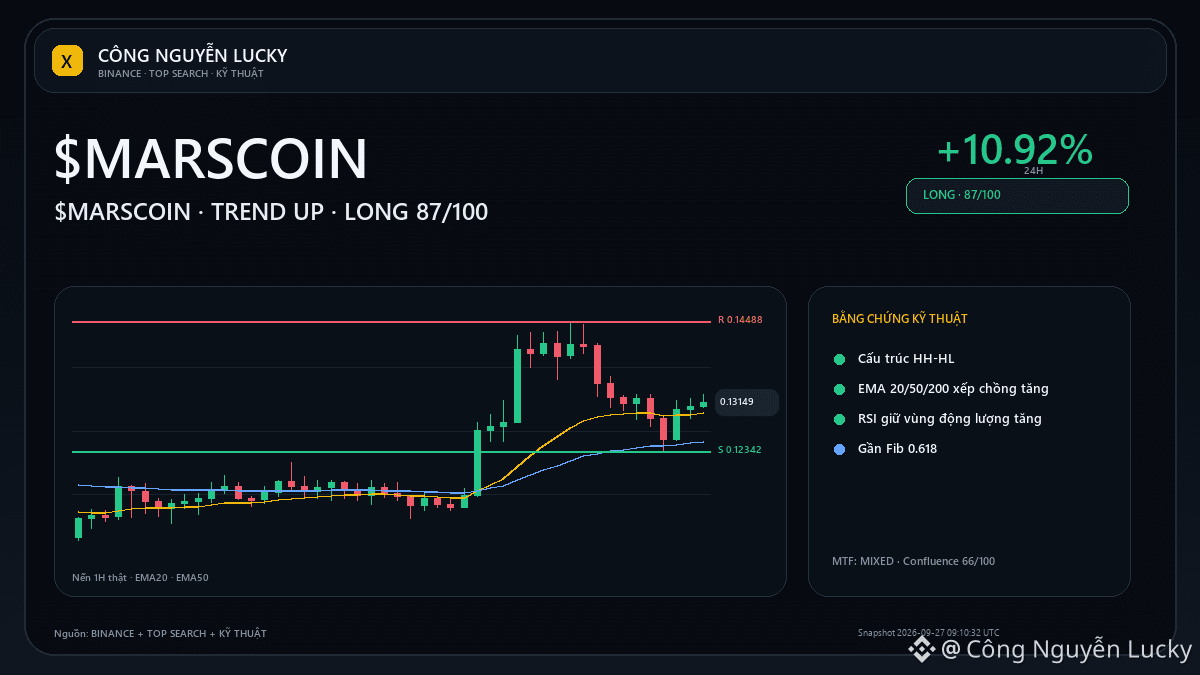
$MARSCOIN: HH_HL structure is controlling the chart$MARSCOIN has a notable signal — but which data really determines the next leg? Market: 0.12772 · 24h +10.92% · volume ~98.0M USDT · 1,189,204 trades.
Swing high near 0.14488 · swing low near 0.12342.
EMA50 0.12506876 · RSI14 55.4 · bias LONG 66/100. The indicator is used to confirm the structure, not to change the structure. Losing 0.12342 or breaking above 0.14488 is the point where the narrative changes most clearly. The technical layers being selected according to the regime:
$MARSCOIN: HH_HL structure is controlling the chart
$MARSCOIN has a notable signal — but which data really determines the next leg? Market: 0.12772 · 24h +10.92% · volume ~98.0M USDT · 1,189,204 trades.
Swing high near 0.14488 · swing low near 0.12342.
EMA50 0.12506876 · RSI14 55.4 · bias LONG 66/100. The indicator is used to confirm the structure, not to change the structure. Losing 0.12342 or breaking above 0.14488 is the point where the narrative changes most clearly. The technical layers being selected according to the regime:
Swing high near 0.14488 · swing low near 0.12342.
EMA50 0.12506876 · RSI14 55.4 · bias LONG 66/100. The indicator is used to confirm the structure, not to change the structure. Losing 0.12342 or breaking above 0.14488 is the point where the narrative changes most clearly. The technical layers being selected according to the regime:
20

·
--
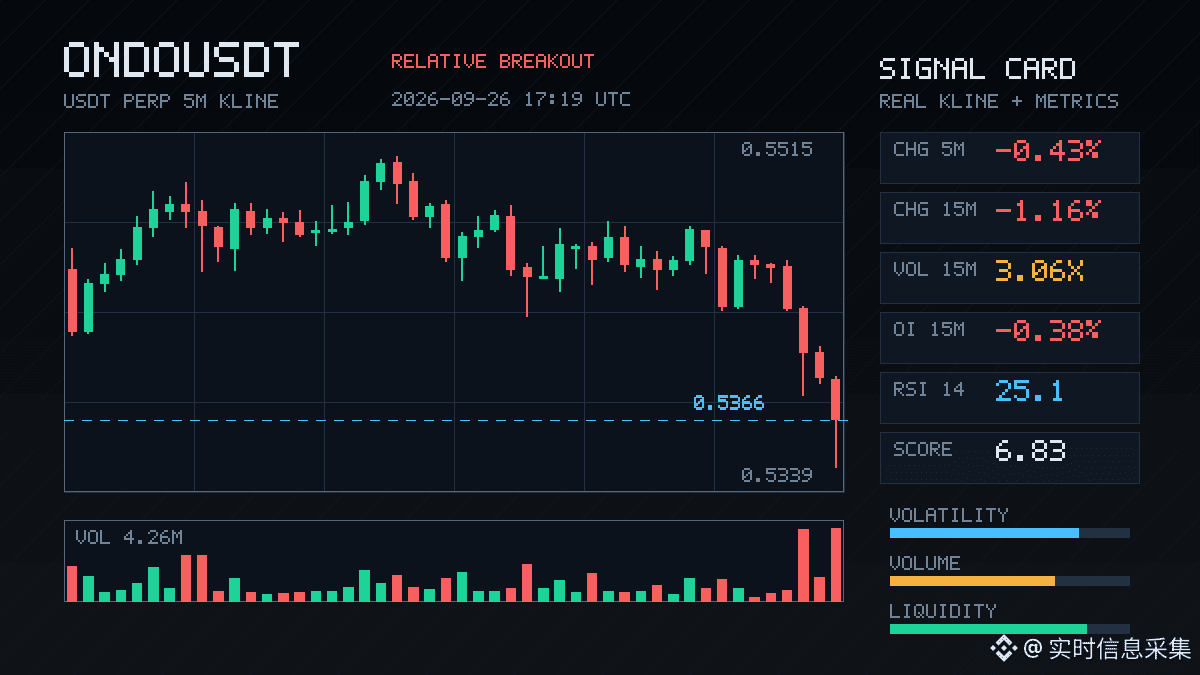
$ONDO This drop is kind of interesting.
The price fell 1.16%, but OI is also declining in sync—15m contracts -0.38%, 1h -0.41%, with notional value down by over 2 million U. This doesn’t look like new shorts coming in to smash the market; it feels more like the longs are withdrawing themselves—stopping out or reducing positions—there are strong vibes of deleveraging.
Look at the aggressive trade delta: -36.2%, and the buy-sell ratio is 0.47. Selling pressure does dominate, and the close also broke below the lower edge of the last ~20 5m candles. Volume is 3.06x, and the volatility Z is 3.14. The pace isn’t like a single needle drop and done; instead, multiple consecutive cycles are continuing.
The funding rate is still in the recent high percentile—this suggests the previous longs were really crowded. Now this move looks more like cooling down overheated positioning.
Whole pool anomaly #36, notional change #8—not the most extreme, but depth confirmation is certainly there. My take: first, see when this deleveraging wave stops. Only when OI stops falling and the price can reclaim above the lower edge of the range is there something to talk about. Chasing shorts right now isn’t great value, and chasing longs is even worse—basically taking a falling knife. Let it drop cleanly first.
$ONDO This drop is kind of interesting.
The price fell 1.16%, but OI is also declining in sync—15m contracts -0.38%, 1h -0.41%, with notional value down by over 2 million U. This doesn’t look like new shorts coming in to smash the market; it feels more like the longs are withdrawing themselves—stopping out or reducing positions—there are strong vibes of deleveraging.
Look at the aggressive trade delta: -36.2%, and the buy-sell ratio is 0.47. Selling pressure does dominate, and the close also broke below the lower edge of the last ~20 5m candles. Volume is 3.06x, and the volatility Z is 3.14. The pace isn’t like a single needle drop and done; instead, multiple consecutive cycles are continuing.
The funding rate is still in the recent high percentile—this suggests the previous longs were really crowded. Now this move looks more like cooling down overheated positioning.
Whole pool anomaly #36, notional change #8—not the most extreme, but depth confirmation is certainly there. My take: first, see when this deleveraging wave stops. Only when OI stops falling and the price can reclaim above the lower edge of the range is there something to talk about. Chasing shorts right now isn’t great value, and chasing longs is even worse—basically taking a falling knife. Let it drop cleanly first.
The price fell 1.16%, but OI is also declining in sync—15m contracts -0.38%, 1h -0.41%, with notional value down by over 2 million U. This doesn’t look like new shorts coming in to smash the market; it feels more like the longs are withdrawing themselves—stopping out or reducing positions—there are strong vibes of deleveraging.
Look at the aggressive trade delta: -36.2%, and the buy-sell ratio is 0.47. Selling pressure does dominate, and the close also broke below the lower edge of the last ~20 5m candles. Volume is 3.06x, and the volatility Z is 3.14. The pace isn’t like a single needle drop and done; instead, multiple consecutive cycles are continuing.
The funding rate is still in the recent high percentile—this suggests the previous longs were really crowded. Now this move looks more like cooling down overheated positioning.
Whole pool anomaly #36, notional change #8—not the most extreme, but depth confirmation is certainly there. My take: first, see when this deleveraging wave stops. Only when OI stops falling and the price can reclaim above the lower edge of the range is there something to talk about. Chasing shorts right now isn’t great value, and chasing longs is even worse—basically taking a falling knife. Let it drop cleanly first.
4

·
--
$H This move came a bit too fast.
In 15m, it directly surged 1.83%, with volume at 2.33x, breaking above the upper edge of the past ~20 consecutive 5m ranges. The aggressive buy/sell ratio is 1.40, aggressive trade value is 16.6% lower, and the funding rate is also pushed up to a high percentile recently.
But here’s the interesting part—OI is falling.
In 15m, OI is -0.08%; in 1h, -0.11%. Price is moving up while positions are declining. This is the classic pattern of short covering, not fresh longs entering.
Nominal change across the whole pool #36, abnormal percentile 90.5%, and it has continued for several consecutive periods—abnormal across the whole pool #13. In 24h, trading volume is 23.44M, and the volume/energy is sufficient.
How to describe this structure? It can be pushed up because shorts are running—not because longs are fiercely competing to buy. The breakout is real, and the direction of the aggressive order flow is also somewhat bullish, but you have to be clear about what the real driving force is.
High funding rate + OI shrinking = it smells like a short squeeze. After this leg up, if there’s no relay from new longs, it’s very easy for momentum to fizzle out.
It looks lively, but personally I don’t chase this. I’ll wait for OI to come back before saying anything.
$H This move came a bit too fast.
In 15m, it directly surged 1.83%, with volume at 2.33x, breaking above the upper edge of the past ~20 consecutive 5m ranges. The aggressive buy/sell ratio is 1.40, aggressive trade value is 16.6% lower, and the funding rate is also pushed up to a high percentile recently.
But here’s the interesting part—OI is falling.
In 15m, OI is -0.08%; in 1h, -0.11%. Price is moving up while positions are declining. This is the classic pattern of short covering, not fresh longs entering.
Nominal change across the whole pool #36, abnormal percentile 90.5%, and it has continued for several consecutive periods—abnormal across the whole pool #13. In 24h, trading volume is 23.44M, and the volume/energy is sufficient.
How to describe this structure? It can be pushed up because shorts are running—not because longs are fiercely competing to buy. The breakout is real, and the direction of the aggressive order flow is also somewhat bullish, but you have to be clear about what the real driving force is.
High funding rate + OI shrinking = it smells like a short squeeze. After this leg up, if there’s no relay from new longs, it’s very easy for momentum to fizzle out.
It looks lively, but personally I don’t chase this. I’ll wait for OI to come back before saying anything.
In 15m, it directly surged 1.83%, with volume at 2.33x, breaking above the upper edge of the past ~20 consecutive 5m ranges. The aggressive buy/sell ratio is 1.40, aggressive trade value is 16.6% lower, and the funding rate is also pushed up to a high percentile recently.
But here’s the interesting part—OI is falling.
In 15m, OI is -0.08%; in 1h, -0.11%. Price is moving up while positions are declining. This is the classic pattern of short covering, not fresh longs entering.
Nominal change across the whole pool #36, abnormal percentile 90.5%, and it has continued for several consecutive periods—abnormal across the whole pool #13. In 24h, trading volume is 23.44M, and the volume/energy is sufficient.
How to describe this structure? It can be pushed up because shorts are running—not because longs are fiercely competing to buy. The breakout is real, and the direction of the aggressive order flow is also somewhat bullish, but you have to be clear about what the real driving force is.
High funding rate + OI shrinking = it smells like a short squeeze. After this leg up, if there’s no relay from new longs, it’s very easy for momentum to fizzle out.
It looks lively, but personally I don’t chase this. I’ll wait for OI to come back before saying anything.
·
--
ZAMA This drop isn’t too aggressive, but the structure is quite interesting. The 15m price fell 0.89%, volume expanded to 1.59x, and price directly broke below the lower boundary of the last ~20 5m candles. The key is that OI is also declining: the 15m contract is -0.29% and 1h is -0.04%, with nominal changes all negative. This doesn’t look like new shorts rushing in to smash the market—it looks more like longs de-leveraging, taking stop losses, or actively shrinking positions.
The主动成交 difference (aggressive trade imbalance) is -15.1%, buy/sell ratio is 0.74. There is selling pressure, but not to the level of panic. Funding rate is still in a high percentile recently, suggesting longs were fairly crowded before. So this pullback seems more like clearing up floating positions.
Abnormal percentile across the whole pool is 70.4%, abnormal rank #20, nominal change rank #36. It’s not the most extreme tier, but considering that the trading volume is higher than normal, price has touched the edge of the range, and aggressive trading is skewed toward the sell side, the short-term directional choice is already fairly clear. 24h turnover is 34.62M; liquidity is decent—not like there’s nobody to take the other side.
My take: this combination of a selloff plus OI declining usually isn’t a signal of a trend reversal. It’s more like a short-term imbalance after passive reduction by longs. If OI keeps falling and price stabilizes, it could be a good observation point; but if OI rises again while price continues to drop, then you’d need to watch out for new shorts entering. $ZAMA
ZAMA This drop isn’t too aggressive, but the structure is quite interesting. The 15m price fell 0.89%, volume expanded to 1.59x, and price directly broke below the lower boundary of the last ~20 5m candles. The key is that OI is also declining: the 15m contract is -0.29% and 1h is -0.04%, with nominal changes all negative. This doesn’t look like new shorts rushing in to smash the market—it looks more like longs de-leveraging, taking stop losses, or actively shrinking positions.
The主动成交 difference (aggressive trade imbalance) is -15.1%, buy/sell ratio is 0.74. There is selling pressure, but not to the level of panic. Funding rate is still in a high percentile recently, suggesting longs were fairly crowded before. So this pullback seems more like clearing up floating positions.
Abnormal percentile across the whole pool is 70.4%, abnormal rank #20, nominal change rank #36. It’s not the most extreme tier, but considering that the trading volume is higher than normal, price has touched the edge of the range, and aggressive trading is skewed toward the sell side, the short-term directional choice is already fairly clear. 24h turnover is 34.62M; liquidity is decent—not like there’s nobody to take the other side.
My take: this combination of a selloff plus OI declining usually isn’t a signal of a trend reversal. It’s more like a short-term imbalance after passive reduction by longs. If OI keeps falling and price stabilizes, it could be a good observation point; but if OI rises again while price continues to drop, then you’d need to watch out for new shorts entering. $ZAMA
The主动成交 difference (aggressive trade imbalance) is -15.1%, buy/sell ratio is 0.74. There is selling pressure, but not to the level of panic. Funding rate is still in a high percentile recently, suggesting longs were fairly crowded before. So this pullback seems more like clearing up floating positions.
Abnormal percentile across the whole pool is 70.4%, abnormal rank #20, nominal change rank #36. It’s not the most extreme tier, but considering that the trading volume is higher than normal, price has touched the edge of the range, and aggressive trading is skewed toward the sell side, the short-term directional choice is already fairly clear. 24h turnover is 34.62M; liquidity is decent—not like there’s nobody to take the other side.
My take: this combination of a selloff plus OI declining usually isn’t a signal of a trend reversal. It’s more like a short-term imbalance after passive reduction by longs. If OI keeps falling and price stabilizes, it could be a good observation point; but if OI rises again while price continues to drop, then you’d need to watch out for new shorts entering. $ZAMA
13

·
--
** How to Do Daily Momentum Trading – Use 10%+ Gainers in 24 Hours on Binance SquareBittensor (TAOUSDT) is trending right now!
Rank: #36
** 📌 **Guide Purpose** This guide shows you step by step how to make entries and exits for cryptocurrencies on Binance Square that display **fast price action (momentum)** within the day (e.g., , , ). It includes **concrete examples, real-time market data, and practical application suggestions** for both beginners and intermediate traders. --- ### 1️⃣ Step – Choose “Moving” Coins **Why it matters?** Momentum trading targets assets whose price changes by **%5–15+ in a short time**, which allows for a higher potential to profit. **How?** | Symbol | 24h % Change | Current Price (USDT) | Daily Volume (USDT) | |--------|---------------|----------------------|---------------------| | | **+17.08 %** | 4.196 | 352 M | | | **+10.53 %** | 0.2445 | 56 M | | | **+10.03 %** | 11.372 | 147 M | | | **+9.88 %** | 0.09343 | 125 M | | | **+8.29 %** | 13.058 | 47 M | 🔎 **Practical:** On Binance Square, use the **“Top Movers”** tab to filter pairs showing **10%+** change. (In this guide, , , are the best examples.) --- ### 2️⃣ Step – Chart and Pattern Analysis **Why it matters?** Seeing where the price move is coming from and where it could go helps you **avoid false signals**. **Tools to use (Binance Square Chart):** | Tool | Description | Visual Clue | |------|----------|--------------| | **20-period EMA** | Short-term trend | If price is **above the EMA** = **bullish**; if below = **bearish** | | **50-period
** How to Do Daily Momentum Trading – Use 10%+ Gainers in 24 Hours on Binance Square
Bittensor (TAOUSDT) is trending right now!
Rank: #36
** 📌 **Guide Purpose** This guide shows you step by step how to make entries and exits for cryptocurrencies on Binance Square that display **fast price action (momentum)** within the day (e.g., , , ). It includes **concrete examples, real-time market data, and practical application suggestions** for both beginners and intermediate traders. --- ### 1️⃣ Step – Choose “Moving” Coins **Why it matters?** Momentum trading targets assets whose price changes by **%5–15+ in a short time**, which allows for a higher potential to profit. **How?** | Symbol | 24h % Change | Current Price (USDT) | Daily Volume (USDT) | |--------|---------------|----------------------|---------------------| | | **+17.08 %** | 4.196 | 352 M | | | **+10.53 %** | 0.2445 | 56 M | | | **+10.03 %** | 11.372 | 147 M | | | **+9.88 %** | 0.09343 | 125 M | | | **+8.29 %** | 13.058 | 47 M | 🔎 **Practical:** On Binance Square, use the **“Top Movers”** tab to filter pairs showing **10%+** change. (In this guide, , , are the best examples.) --- ### 2️⃣ Step – Chart and Pattern Analysis **Why it matters?** Seeing where the price move is coming from and where it could go helps you **avoid false signals**. **Tools to use (Binance Square Chart):** | Tool | Description | Visual Clue | |------|----------|--------------| | **20-period EMA** | Short-term trend | If price is **above the EMA** = **bullish**; if below = **bearish** | | **50-period
Rank: #36
** 📌 **Guide Purpose** This guide shows you step by step how to make entries and exits for cryptocurrencies on Binance Square that display **fast price action (momentum)** within the day (e.g., , , ). It includes **concrete examples, real-time market data, and practical application suggestions** for both beginners and intermediate traders. --- ### 1️⃣ Step – Choose “Moving” Coins **Why it matters?** Momentum trading targets assets whose price changes by **%5–15+ in a short time**, which allows for a higher potential to profit. **How?** | Symbol | 24h % Change | Current Price (USDT) | Daily Volume (USDT) | |--------|---------------|----------------------|---------------------| | | **+17.08 %** | 4.196 | 352 M | | | **+10.53 %** | 0.2445 | 56 M | | | **+10.03 %** | 11.372 | 147 M | | | **+9.88 %** | 0.09343 | 125 M | | | **+8.29 %** | 13.058 | 47 M | 🔎 **Practical:** On Binance Square, use the **“Top Movers”** tab to filter pairs showing **10%+** change. (In this guide, , , are the best examples.) --- ### 2️⃣ Step – Chart and Pattern Analysis **Why it matters?** Seeing where the price move is coming from and where it could go helps you **avoid false signals**. **Tools to use (Binance Square Chart):** | Tool | Description | Visual Clue | |------|----------|--------------| | **20-period EMA** | Short-term trend | If price is **above the EMA** = **bullish**; if below = **bearish** | | **50-period
58
·
--
$B2 This pull is a bit too aggressive—within 15m it’s directly +5.54%, and volume has been boosted to 1.57x. But OI has actually dropped instead of increasing—15m -2.20%, 1h -1.63%. Price moving up while positions are moving down: this kind of structure is mostly short-covering pushing rather than brand-new longs entering. The aggressive buy/sell ratio is 1.18, with a difference of 8.1%. The buy side is indeed getting filled, but it’s eating the stop-loss orders of shorts.
The abnormal percentile is 83.9%, and the overall pool’s notional change ranks #36. 24h turnover is 251M, and liquidity depth is sufficient. How long this short-covering move can run depends on when OI stabilizes and turns back up. If it keeps shrinking, once it’s pulled up, it turns into a pit.
$B2 This pull is a bit too aggressive—within 15m it’s directly +5.54%, and volume has been boosted to 1.57x. But OI has actually dropped instead of increasing—15m -2.20%, 1h -1.63%. Price moving up while positions are moving down: this kind of structure is mostly short-covering pushing rather than brand-new longs entering. The aggressive buy/sell ratio is 1.18, with a difference of 8.1%. The buy side is indeed getting filled, but it’s eating the stop-loss orders of shorts.
The abnormal percentile is 83.9%, and the overall pool’s notional change ranks #36. 24h turnover is 251M, and liquidity depth is sufficient. How long this short-covering move can run depends on when OI stabilizes and turns back up. If it keeps shrinking, once it’s pulled up, it turns into a pit.
The abnormal percentile is 83.9%, and the overall pool’s notional change ranks #36. 24h turnover is 251M, and liquidity depth is sufficient. How long this short-covering move can run depends on when OI stabilizes and turns back up. If it keeps shrinking, once it’s pulled up, it turns into a pit.
4
·
--
$TRUMP 15m Suddenly surged in volume to 3.18x, with the price up 1.13%, directly breaking above the upper edge of the past ~20 5m K-lines. OI is rising in sync—15m +0.21%, 1h +0.25%. While the nominal change isn’t extremely large, the abnormal percentile has reached 90.9%, and the entire pool is ranked at #36. Buy-sell ratio is 1.35, and the passive vs. aggressive execution spread is -15.1%, indicating the bias is clearly long. This structure looks more like newly added leveraged longs entering and pushing, not just a simple spot “pump.” 24h trading value is 130M, and the depth is sufficient. First, watch whether this 15m candle can hold above the upper edge—if it can’t, it’s a false breakout.
$TRUMP 15m Suddenly surged in volume to 3.18x, with the price up 1.13%, directly breaking above the upper edge of the past ~20 5m K-lines. OI is rising in sync—15m +0.21%, 1h +0.25%. While the nominal change isn’t extremely large, the abnormal percentile has reached 90.9%, and the entire pool is ranked at #36. Buy-sell ratio is 1.35, and the passive vs. aggressive execution spread is -15.1%, indicating the bias is clearly long. This structure looks more like newly added leveraged longs entering and pushing, not just a simple spot “pump.” 24h trading value is 130M, and the depth is sufficient. First, watch whether this 15m candle can hold above the upper edge—if it can’t, it’s a false breakout.
13
·
--
$GRIFFAIN This 15m drop isn’t that big—down 1.71%—but the trading volume hit 2.72x. The Z value is 1.65, which clearly suggests someone is actively moving it.
What’s interesting is the OI: on 15m it’s -0.73%, and on 1h it’s -0.48%. The notional changes are both around -98K. With price falling and OI dropping, this structure looks more like long positions getting de-leveraged or stop-loss orders being swept, not like brand-new shorts are aggressively entering.
Aggressive trade imbalance is -64.8%. The buy/sell ratio is 0.21—selling pressure is one-sided. The close also broke below the lower boundary of the past ~20 5m candles, and the price-range boundary has been breached as well.
The anomaly percentile for the whole pool is 91.9%, ranking #7. Notional change ranks #36, and the depth check is also passed. The 24h traded value is only 9.88M—this pool isn’t very deep. Such an impulse move on this kind of volume is worth watching to see whether it continues.
Not a recommendation—just recording what’s on the tape.
$GRIFFAIN This 15m drop isn’t that big—down 1.71%—but the trading volume hit 2.72x. The Z value is 1.65, which clearly suggests someone is actively moving it.
What’s interesting is the OI: on 15m it’s -0.73%, and on 1h it’s -0.48%. The notional changes are both around -98K. With price falling and OI dropping, this structure looks more like long positions getting de-leveraged or stop-loss orders being swept, not like brand-new shorts are aggressively entering.
Aggressive trade imbalance is -64.8%. The buy/sell ratio is 0.21—selling pressure is one-sided. The close also broke below the lower boundary of the past ~20 5m candles, and the price-range boundary has been breached as well.
The anomaly percentile for the whole pool is 91.9%, ranking #7. Notional change ranks #36, and the depth check is also passed. The 24h traded value is only 9.88M—this pool isn’t very deep. Such an impulse move on this kind of volume is worth watching to see whether it continues.
Not a recommendation—just recording what’s on the tape.
What’s interesting is the OI: on 15m it’s -0.73%, and on 1h it’s -0.48%. The notional changes are both around -98K. With price falling and OI dropping, this structure looks more like long positions getting de-leveraged or stop-loss orders being swept, not like brand-new shorts are aggressively entering.
Aggressive trade imbalance is -64.8%. The buy/sell ratio is 0.21—selling pressure is one-sided. The close also broke below the lower boundary of the past ~20 5m candles, and the price-range boundary has been breached as well.
The anomaly percentile for the whole pool is 91.9%, ranking #7. Notional change ranks #36, and the depth check is also passed. The 24h traded value is only 9.88M—this pool isn’t very deep. Such an impulse move on this kind of volume is worth watching to see whether it continues.
Not a recommendation—just recording what’s on the tape.
7
·
--
$KAT In these 15 minutes, the drop was pretty sharp. It fell straight by 3.58%, and the volume also swelled to 1.69x, with volatility (Z) at 1.75—this isn’t the kind of quiet, low-key grinding down.
What’s interesting is OI: the 15m contracts are up +2.75%, nominal change is +153K, but on the 1h dimension it’s actually -0.97%, -150K. That suggests short-term adds to positions, but the hourly timeframe doesn’t follow. This kind of structure, paired with the price decline, looks more like new leveraged shorts entering rather than old long holders closing.
Funding rate is -0.0273%, with the near-end percentile at 97%—this reading feels a bit extreme. With shorts crowded this much, the passive-to-active match is -2.0% and the buy/sell ratio is 0.96. There is selling pressure, but it’s not completely one-sided.
In the last 24h, turnover is 142.20M. The depth is sufficient. The abnormal pool percentile is 83.7%, rank #17, nominal change rank #36—somewhat high in abnormality but not the most eye-catching position.
My take: the short sentiment is being pushed too hard in the short term. At the 97% funding-rate percentile, chasing shorts further down isn’t great value; you should watch for a short squeeze. Of course, the premise is that price can first stabilize and stop falling. $KAT
$KAT In these 15 minutes, the drop was pretty sharp. It fell straight by 3.58%, and the volume also swelled to 1.69x, with volatility (Z) at 1.75—this isn’t the kind of quiet, low-key grinding down.
What’s interesting is OI: the 15m contracts are up +2.75%, nominal change is +153K, but on the 1h dimension it’s actually -0.97%, -150K. That suggests short-term adds to positions, but the hourly timeframe doesn’t follow. This kind of structure, paired with the price decline, looks more like new leveraged shorts entering rather than old long holders closing.
Funding rate is -0.0273%, with the near-end percentile at 97%—this reading feels a bit extreme. With shorts crowded this much, the passive-to-active match is -2.0% and the buy/sell ratio is 0.96. There is selling pressure, but it’s not completely one-sided.
In the last 24h, turnover is 142.20M. The depth is sufficient. The abnormal pool percentile is 83.7%, rank #17, nominal change rank #36—somewhat high in abnormality but not the most eye-catching position.
My take: the short sentiment is being pushed too hard in the short term. At the 97% funding-rate percentile, chasing shorts further down isn’t great value; you should watch for a short squeeze. Of course, the premise is that price can first stabilize and stop falling. $KAT
What’s interesting is OI: the 15m contracts are up +2.75%, nominal change is +153K, but on the 1h dimension it’s actually -0.97%, -150K. That suggests short-term adds to positions, but the hourly timeframe doesn’t follow. This kind of structure, paired with the price decline, looks more like new leveraged shorts entering rather than old long holders closing.
Funding rate is -0.0273%, with the near-end percentile at 97%—this reading feels a bit extreme. With shorts crowded this much, the passive-to-active match is -2.0% and the buy/sell ratio is 0.96. There is selling pressure, but it’s not completely one-sided.
In the last 24h, turnover is 142.20M. The depth is sufficient. The abnormal pool percentile is 83.7%, rank #17, nominal change rank #36—somewhat high in abnormality but not the most eye-catching position.
My take: the short sentiment is being pushed too hard in the short term. At the 97% funding-rate percentile, chasing shorts further down isn’t great value; you should watch for a short squeeze. Of course, the premise is that price can first stabilize and stop falling. $KAT
128
Article
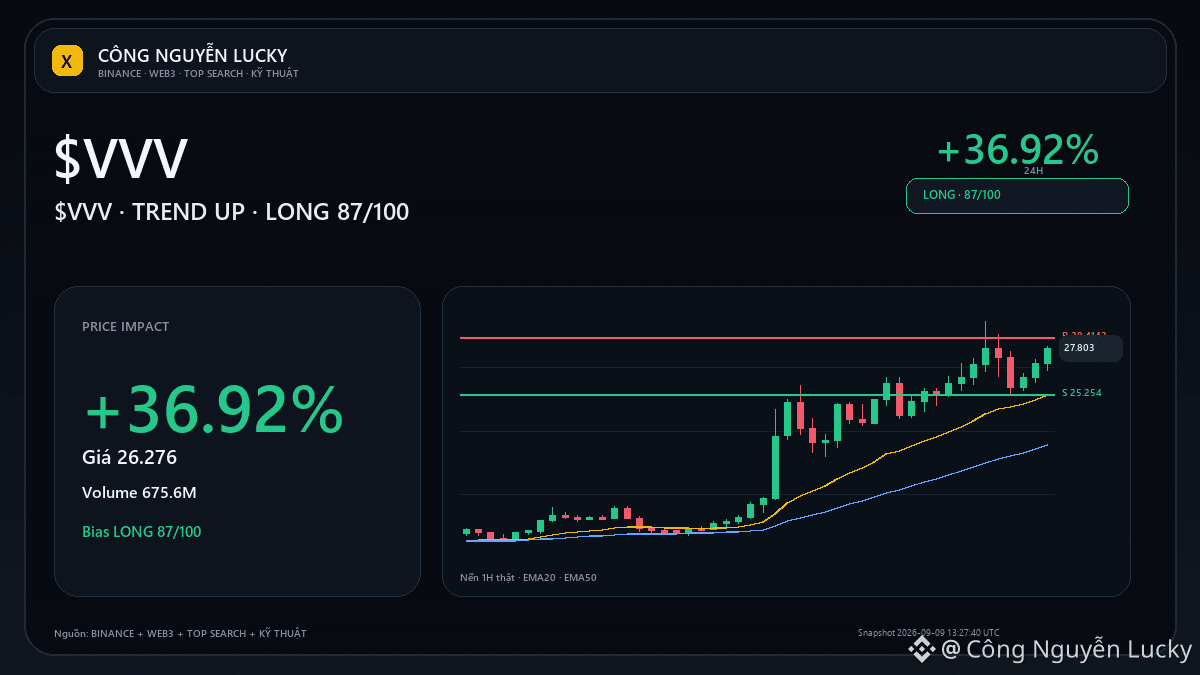
$VVV: Fib 0.236 is currently the trend validation zone📐 $VVV: instead of chasing the price, I’m looking at the 0.236 Fibonacci zone around 26.3702 of the most recent swing.
Market: 26.276 · 24h +36.92% · volume ~675.6M USDT · 6,525,649 trades.
Technical context: UPTREND · LONG bias 91/100.
Golden zone 0.50–0.618: 21.6456–23.105.
Confirmation point: price reacts in the right direction at the Fib zone and maintains the dominant structure/EMA.
Invalidation point: a break of 25.254 with momentum moving against the bias.
The technical layers being selected according to the regime:
$VVV: Fib 0.236 is currently the trend validation zone
📐 $VVV : instead of chasing the price, I’m looking at the 0.236 Fibonacci zone around 26.3702 of the most recent swing.
Market: 26.276 · 24h +36.92% · volume ~675.6M USDT · 6,525,649 trades.
Technical context: UPTREND · LONG bias 91/100.
Golden zone 0.50–0.618: 21.6456–23.105.
Confirmation point: price reacts in the right direction at the Fib zone and maintains the dominant structure/EMA.
Invalidation point: a break of 25.254 with momentum moving against the bias.
The technical layers being selected according to the regime:
Market: 26.276 · 24h +36.92% · volume ~675.6M USDT · 6,525,649 trades.
Technical context: UPTREND · LONG bias 91/100.
Golden zone 0.50–0.618: 21.6456–23.105.
Confirmation point: price reacts in the right direction at the Fib zone and maintains the dominant structure/EMA.
Invalidation point: a break of 25.254 with momentum moving against the bias.
The technical layers being selected according to the regime:
139
Log in to explore more content
Join global crypto users on Binance Square
⚡️ Get latest and useful information about crypto.
💬 Trusted by the world’s largest crypto exchange.
👍 Discover real insights from verified creators.
Email / Phone number
Trending Topics
1
#BinanceLaunchesBinanceIntelligence
790,748 views
4,967 Discussing
2
#BTCFallsBelow$84K
43,200 views
139 Discussing
3
#DubaiVARAIssuesReserveAssetAuditCircular
15,376 views
528 Discussing
4
#SECApproves3XBitcoinETF
13,211 views
453 Discussing
5
#WinklevossFilesSpotZcashETFApplication
22,693 views
569 Discussing
6
#SouthKoreaAITradeLiftsWorldcoinTo$7.41B
2,617 views
44 Discussing
7
#StrategyEstimates$4.1BIncomeTaxBenefit
1,607 views
23 Discussing
8
#IglooShutsDownAbstractBlockchain
10,109 views
303 Discussing
9
#StrategyMarketCapSurpassesRumble
53,727 views
1,038 Discussing
10
#StriveBuys2000BTCFor$169M
19,118 views
165 Discussing