
saadi_360
341 පෝස්ටු

saadi_360
වාර්තා කරන්න
පරිශීලක අවහිර කරන්න
නිතර වෙළෙන්දා
{වේලාව} වසර
4 හඹා යමින්
39 හඹා යන්නන්
63 කැමති විය
පෝස්ටු
සියල්ල
උපුටා දැක්වීම්
අමුණා ඇත
·
--
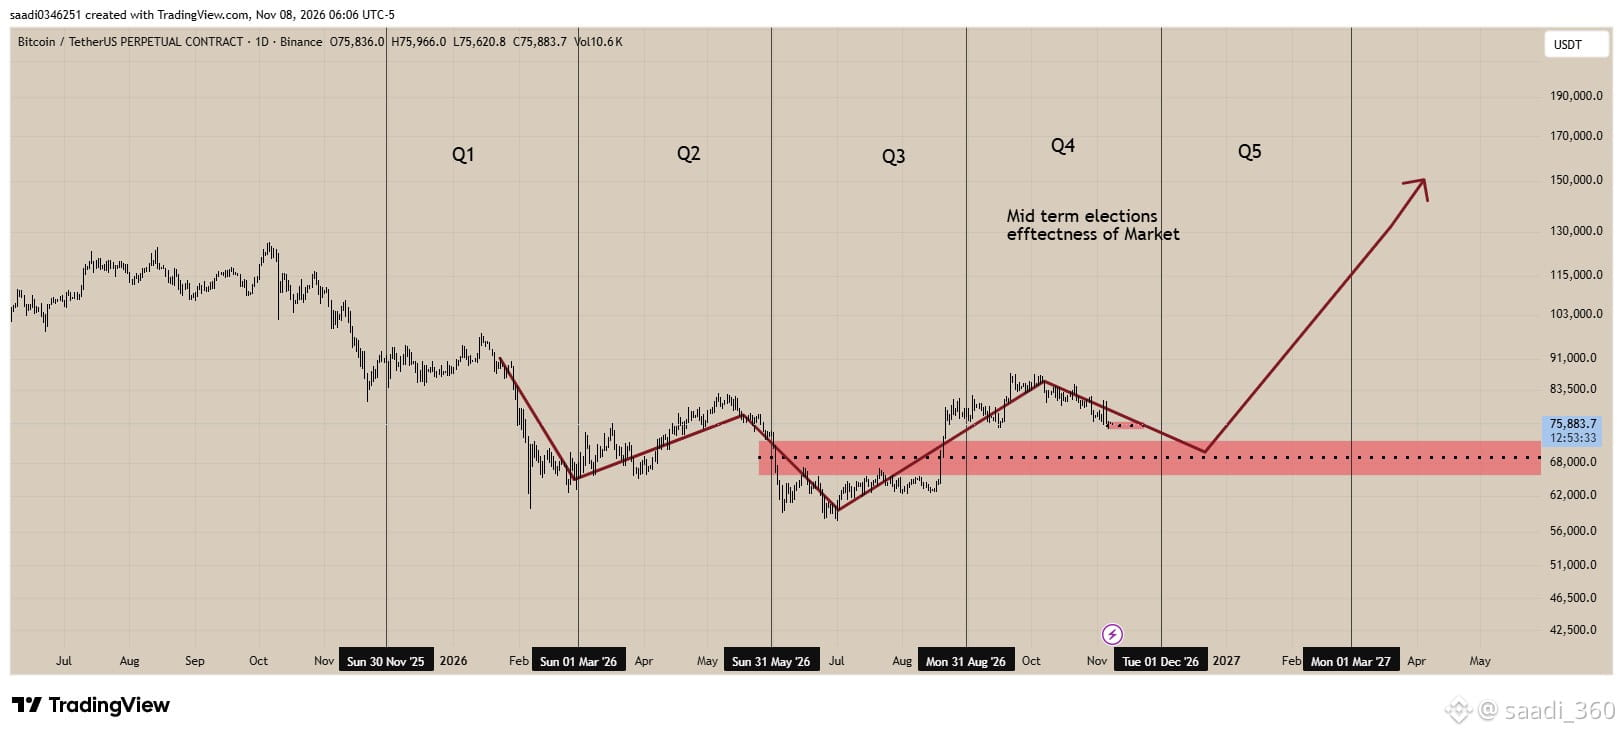
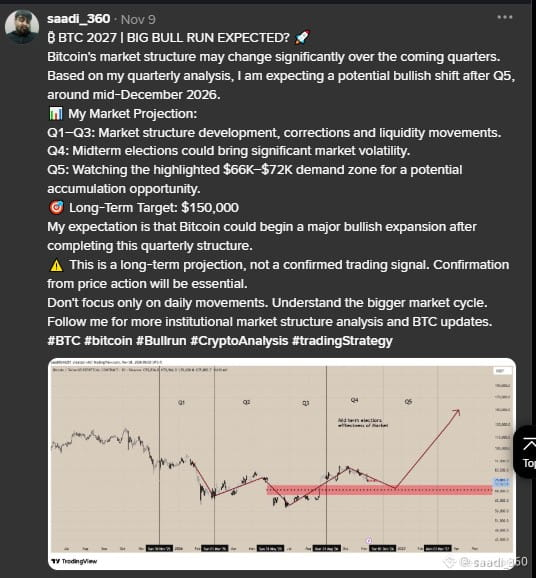
₿ BTC 2027 | BIG BULL RUN EXPECTED? 🚀
Bitcoin's market structure may change significantly over the coming quarters.
Based on my quarterly analysis, I am expecting a potential bullish shift after Q5, around mid-December 2026.
📊 My Market Projection:
Q1–Q3: Market structure development, corrections and liquidity movements.
Q4: Midterm elections could bring significant market volatility.
Q5: Watching the highlighted $66K–$72K demand zone for a potential accumulation opportunity.
🎯 Long-Term Target: $150,000
My expectation is that Bitcoin could begin a major bullish expansion after completing this quarterly structure.
⚠️ This is a long-term projection, not a confirmed trading signal. Confirmation from price action will be essential.
Don't focus only on daily movements. Understand the bigger market cycle.
Follow me for more institutional market structure analysis and BTC updates.
#BTC #bitcoin #Bullrun #CryptoAnalysis #tradingStrategy
₿ BTC 2027 | BIG BULL RUN EXPECTED? 🚀
Bitcoin's market structure may change significantly over the coming quarters.
Based on my quarterly analysis, I am expecting a potential bullish shift after Q5, around mid-December 2026.
📊 My Market Projection:
Q1–Q3: Market structure development, corrections and liquidity movements.
Q4: Midterm elections could bring significant market volatility.
Q5: Watching the highlighted $66K–$72K demand zone for a potential accumulation opportunity.
🎯 Long-Term Target: $150,000
My expectation is that Bitcoin could begin a major bullish expansion after completing this quarterly structure.
⚠️ This is a long-term projection, not a confirmed trading signal. Confirmation from price action will be essential.
Don't focus only on daily movements. Understand the bigger market cycle.
Follow me for more institutional market structure analysis and BTC updates.
#BTC #bitcoin #Bullrun #CryptoAnalysis #tradingStrategy
Bitcoin's market structure may change significantly over the coming quarters.
Based on my quarterly analysis, I am expecting a potential bullish shift after Q5, around mid-December 2026.
📊 My Market Projection:
Q1–Q3: Market structure development, corrections and liquidity movements.
Q4: Midterm elections could bring significant market volatility.
Q5: Watching the highlighted $66K–$72K demand zone for a potential accumulation opportunity.
🎯 Long-Term Target: $150,000
My expectation is that Bitcoin could begin a major bullish expansion after completing this quarterly structure.
⚠️ This is a long-term projection, not a confirmed trading signal. Confirmation from price action will be essential.
Don't focus only on daily movements. Understand the bigger market cycle.
Follow me for more institutional market structure analysis and BTC updates.
#BTC #bitcoin #Bullrun #CryptoAnalysis #tradingStrategy
1
455
අමුණා ඇත
·
--
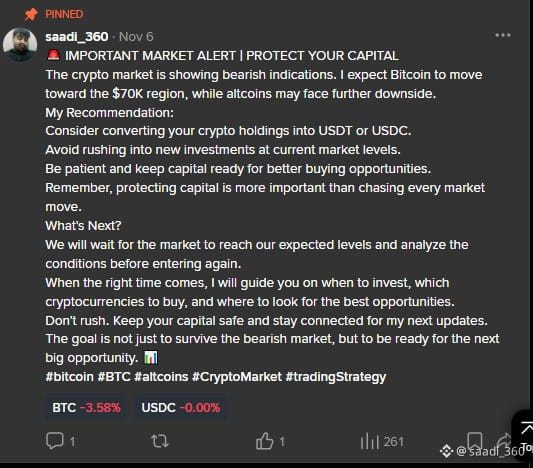
🚨 IMPORTANT MARKET ALERT | PROTECT YOUR CAPITAL
The crypto market is showing bearish indications. I expect Bitcoin to move toward the $70K region, while altcoins may face further downside.
My Recommendation:
Consider converting your crypto holdings into USDT or USDC.
Avoid rushing into new investments at current market levels.
Be patient and keep capital ready for better buying opportunities.
Remember, protecting capital is more important than chasing every market move.
What's Next?
We will wait for the market to reach our expected levels and analyze the conditions before entering again.
When the right time comes, I will guide you on when to invest, which cryptocurrencies to buy, and where to look for the best opportunities.
Don't rush. Keep your capital safe and stay connected for my next updates.
The goal is not just to survive the bearish market, but to be ready for the next big opportunity. 📊
#bitcoin #BTC #altcoins #CryptoMarket #tradingStrategy
🚨 IMPORTANT MARKET ALERT | PROTECT YOUR CAPITAL
The crypto market is showing bearish indications. I expect Bitcoin to move toward the $70K region, while altcoins may face further downside.
My Recommendation:
Consider converting your crypto holdings into USDT or USDC.
Avoid rushing into new investments at current market levels.
Be patient and keep capital ready for better buying opportunities.
Remember, protecting capital is more important than chasing every market move.
What's Next?
We will wait for the market to reach our expected levels and analyze the conditions before entering again.
When the right time comes, I will guide you on when to invest, which cryptocurrencies to buy, and where to look for the best opportunities.
Don't rush. Keep your capital safe and stay connected for my next updates.
The goal is not just to survive the bearish market, but to be ready for the next big opportunity. 📊
#bitcoin #BTC #altcoins #CryptoMarket #tradingStrategy
The crypto market is showing bearish indications. I expect Bitcoin to move toward the $70K region, while altcoins may face further downside.
My Recommendation:
Consider converting your crypto holdings into USDT or USDC.
Avoid rushing into new investments at current market levels.
Be patient and keep capital ready for better buying opportunities.
Remember, protecting capital is more important than chasing every market move.
What's Next?
We will wait for the market to reach our expected levels and analyze the conditions before entering again.
When the right time comes, I will guide you on when to invest, which cryptocurrencies to buy, and where to look for the best opportunities.
Don't rush. Keep your capital safe and stay connected for my next updates.
The goal is not just to survive the bearish market, but to be ready for the next big opportunity. 📊
#bitcoin #BTC #altcoins #CryptoMarket #tradingStrategy
1
1
261
·
--
GOLD ANALYSIS: Where Will Gold Form Its Major Bottom? | ICT + Fibonacci + FVGI am sharing my Gold analysis using two different charts: the original Gold commodity chart and the XAUTUSDT exchange chart.
Let me explain the logic behind this analysis. 👇
1️⃣ Original Gold Commodity Chart – Monthly Timeframe
On the original Gold chart, we have an important Fair Value Gap (FVG).
Price has pulled back from this FVG area. This zone is important for identifying a potential major reaction in Gold.
2️⃣ XAUTUSDT Chart – Fibonacci Analysis
The XAUTUSDT chart does not have sufficient historical data to identify the same FVG structure clearly.
For this reason, I am using Fibonacci extensions based on the weekly Swing High and Swing Low.
Interestingly, the 0.5 Fibonacci level on XAUTUSDT aligns with the FVG zone on the original Gold chart.
This confluence gives us an additional reference for our analysis.
3️⃣ Why Am I Watching the 2.5 and 3.0 Fibonacci Levels?
Look at Bitcoin's historical price action. During its decline from the $26K region, the 2.5 Fibonacci extension was an important downside reference in my analysis.
I am applying the same Fibonacci approach to Gold.
My important levels:
2.5 Fibonacci: Important downside level to monitor.3.0 Fibonacci: The final and most important level in my current analysis.
4️⃣ What Happens at the 3.0 Level?
This is the most important part of my analysis.
I consider the 3.0 Fibonacci extension the last major level where Gold could potentially pull back and establish a bullish reaction.
If Gold respects this level and buyers step in, we could see a recovery.
However, if Gold breaks this level, my expectation is that the existing market structure could break, opening the door for a strong bullish expansion and consecutive higher highs.
In other words:
Reaction from 3.0 = Potential bullish recovery.Break of 3.0 = Potential bullish market structure shift and higher highs.
🎯 Final Thoughts
I am combining:
Monthly Fair Value Gap.Weekly Fibonacci extensions.Historical Bitcoin price action.Swing High and Swing Low.Confluence between Gold commodity and XAUTUSDT charts.
I am not trying to predict every move. I am identifying important levels before the market reaches them.
The most important level in my entire Gold analysis is 3.0 Fibonacci. Watch how price reacts there.
What is your opinion? Will Gold respect the 3.0 level or break its structure and start making new higher highs?
Follow me for more ICT, Smart Money Concepts and institutional price action analysis. 📊
#GOLD #XAUUSD #XAUTUSDT #Fibonacci #ICT
GOLD ANALYSIS: Where Will Gold Form Its Major Bottom? | ICT + Fibonacci + FVG
I am sharing my Gold analysis using two different charts: the original Gold commodity chart and the XAUTUSDT exchange chart.
Let me explain the logic behind this analysis. 👇
1️⃣ Original Gold Commodity Chart – Monthly Timeframe
On the original Gold chart, we have an important Fair Value Gap (FVG).
Price has pulled back from this FVG area. This zone is important for identifying a potential major reaction in Gold.
2️⃣ XAUTUSDT Chart – Fibonacci Analysis
The XAUTUSDT chart does not have sufficient historical data to identify the same FVG structure clearly.
For this reason, I am using Fibonacci extensions based on the weekly Swing High and Swing Low.
Interestingly, the 0.5 Fibonacci level on XAUTUSDT aligns with the FVG zone on the original Gold chart.
This confluence gives us an additional reference for our analysis.
3️⃣ Why Am I Watching the 2.5 and 3.0 Fibonacci Levels?
Look at Bitcoin's historical price action. During its decline from the $26K region, the 2.5 Fibonacci extension was an important downside reference in my analysis.
I am applying the same Fibonacci approach to Gold.
My important levels:
2.5 Fibonacci: Important downside level to monitor.3.0 Fibonacci: The final and most important level in my current analysis.
4️⃣ What Happens at the 3.0 Level?
This is the most important part of my analysis.
I consider the 3.0 Fibonacci extension the last major level where Gold could potentially pull back and establish a bullish reaction.
If Gold respects this level and buyers step in, we could see a recovery.
However, if Gold breaks this level, my expectation is that the existing market structure could break, opening the door for a strong bullish expansion and consecutive higher highs.
In other words:
Reaction from 3.0 = Potential bullish recovery.Break of 3.0 = Potential bullish market structure shift and higher highs.
🎯 Final Thoughts
I am combining:
Monthly Fair Value Gap.Weekly Fibonacci extensions.Historical Bitcoin price action.Swing High and Swing Low.Confluence between Gold commodity and XAUTUSDT charts.
I am not trying to predict every move. I am identifying important levels before the market reaches them.
The most important level in my entire Gold analysis is 3.0 Fibonacci. Watch how price reacts there.
What is your opinion? Will Gold respect the 3.0 level or break its structure and start making new higher highs?
Follow me for more ICT, Smart Money Concepts and institutional price action analysis. 📊
#GOLD #XAUUSD #XAUTUSDT #Fibonacci #ICT
Let me explain the logic behind this analysis. 👇
1️⃣ Original Gold Commodity Chart – Monthly Timeframe
On the original Gold chart, we have an important Fair Value Gap (FVG).
Price has pulled back from this FVG area. This zone is important for identifying a potential major reaction in Gold.
2️⃣ XAUTUSDT Chart – Fibonacci Analysis
The XAUTUSDT chart does not have sufficient historical data to identify the same FVG structure clearly.
For this reason, I am using Fibonacci extensions based on the weekly Swing High and Swing Low.
Interestingly, the 0.5 Fibonacci level on XAUTUSDT aligns with the FVG zone on the original Gold chart.
This confluence gives us an additional reference for our analysis.
3️⃣ Why Am I Watching the 2.5 and 3.0 Fibonacci Levels?
Look at Bitcoin's historical price action. During its decline from the $26K region, the 2.5 Fibonacci extension was an important downside reference in my analysis.
I am applying the same Fibonacci approach to Gold.
My important levels:
2.5 Fibonacci: Important downside level to monitor.3.0 Fibonacci: The final and most important level in my current analysis.
4️⃣ What Happens at the 3.0 Level?
This is the most important part of my analysis.
I consider the 3.0 Fibonacci extension the last major level where Gold could potentially pull back and establish a bullish reaction.
If Gold respects this level and buyers step in, we could see a recovery.
However, if Gold breaks this level, my expectation is that the existing market structure could break, opening the door for a strong bullish expansion and consecutive higher highs.
In other words:
Reaction from 3.0 = Potential bullish recovery.Break of 3.0 = Potential bullish market structure shift and higher highs.
🎯 Final Thoughts
I am combining:
Monthly Fair Value Gap.Weekly Fibonacci extensions.Historical Bitcoin price action.Swing High and Swing Low.Confluence between Gold commodity and XAUTUSDT charts.
I am not trying to predict every move. I am identifying important levels before the market reaches them.
The most important level in my entire Gold analysis is 3.0 Fibonacci. Watch how price reacts there.
What is your opinion? Will Gold respect the 3.0 level or break its structure and start making new higher highs?
Follow me for more ICT, Smart Money Concepts and institutional price action analysis. 📊
#GOLD #XAUUSD #XAUTUSDT #Fibonacci #ICT
1
1
365
·
--
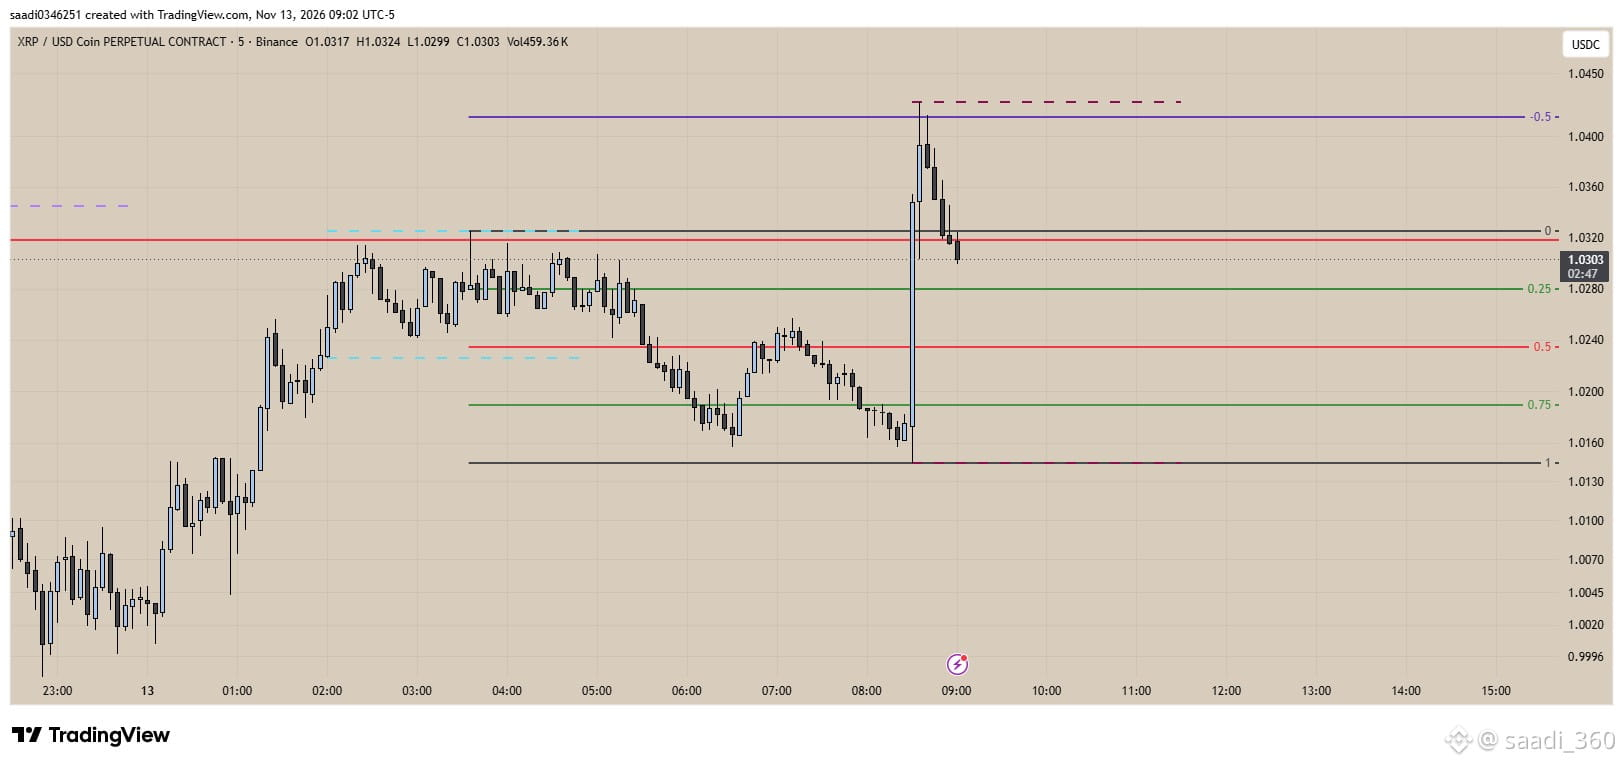
🚨 XRP NEWS TRADING SETUP | FIBONACCI EXTENSIONS
Sharing my XRP 5-minute chart and a news-based trading strategy.
📊 How I identify the setup:
Mark the highest swing high and lowest swing low between 7:00 AM and 8:30 AM.
Apply Fibonacci to this range.
At the 8:30 AM news release, observe which direction the market moves.
Mark Fibonacci extension levels: -0.5, -1 and -1.5.
If a candle body closes below one of these levels, wait for the next candle.
Open a SHORT position on the next candle.
Place your stop-loss above the previous rejection candle's high.
Set your target at the original swing low from where the upward move started.
🔄 Bullish Scenario:
Follow the exact same process in reverse. If price moves upward and a candle body closes above the corresponding extension level, enter LONG on the next candle. Place your stop-loss below the previous rejection candle's low.
🎯 My approach: Let the news move happen, identify the direction, wait for candle-close confirmation, and execute with a defined risk.
Don't chase the news spike. Wait for confirmation!
⚠️ Educational content only. Always manage your risk and backtest the strategy before trading live.
#xrp #cryptotrading #ICTTradingStrategy #Fibonacci #LiquiditySweep
🚨 XRP NEWS TRADING SETUP | FIBONACCI EXTENSIONS
Sharing my XRP 5-minute chart and a news-based trading strategy.
📊 How I identify the setup:
Mark the highest swing high and lowest swing low between 7:00 AM and 8:30 AM.
Apply Fibonacci to this range.
At the 8:30 AM news release, observe which direction the market moves.
Mark Fibonacci extension levels: -0.5, -1 and -1.5.
If a candle body closes below one of these levels, wait for the next candle.
Open a SHORT position on the next candle.
Place your stop-loss above the previous rejection candle's high.
Set your target at the original swing low from where the upward move started.
🔄 Bullish Scenario:
Follow the exact same process in reverse. If price moves upward and a candle body closes above the corresponding extension level, enter LONG on the next candle. Place your stop-loss below the previous rejection candle's low.
🎯 My approach: Let the news move happen, identify the direction, wait for candle-close confirmation, and execute with a defined risk.
Don't chase the news spike. Wait for confirmation!
⚠️ Educational content only. Always manage your risk and backtest the strategy before trading live.
#xrp #cryptotrading #ICTTradingStrategy #Fibonacci #LiquiditySweep
Sharing my XRP 5-minute chart and a news-based trading strategy.
📊 How I identify the setup:
Mark the highest swing high and lowest swing low between 7:00 AM and 8:30 AM.
Apply Fibonacci to this range.
At the 8:30 AM news release, observe which direction the market moves.
Mark Fibonacci extension levels: -0.5, -1 and -1.5.
If a candle body closes below one of these levels, wait for the next candle.
Open a SHORT position on the next candle.
Place your stop-loss above the previous rejection candle's high.
Set your target at the original swing low from where the upward move started.
🔄 Bullish Scenario:
Follow the exact same process in reverse. If price moves upward and a candle body closes above the corresponding extension level, enter LONG on the next candle. Place your stop-loss below the previous rejection candle's low.
🎯 My approach: Let the news move happen, identify the direction, wait for candle-close confirmation, and execute with a defined risk.
Don't chase the news spike. Wait for confirmation!
⚠️ Educational content only. Always manage your risk and backtest the strategy before trading live.
#xrp #cryptotrading #ICTTradingStrategy #Fibonacci #LiquiditySweep
2
1
343
·
--
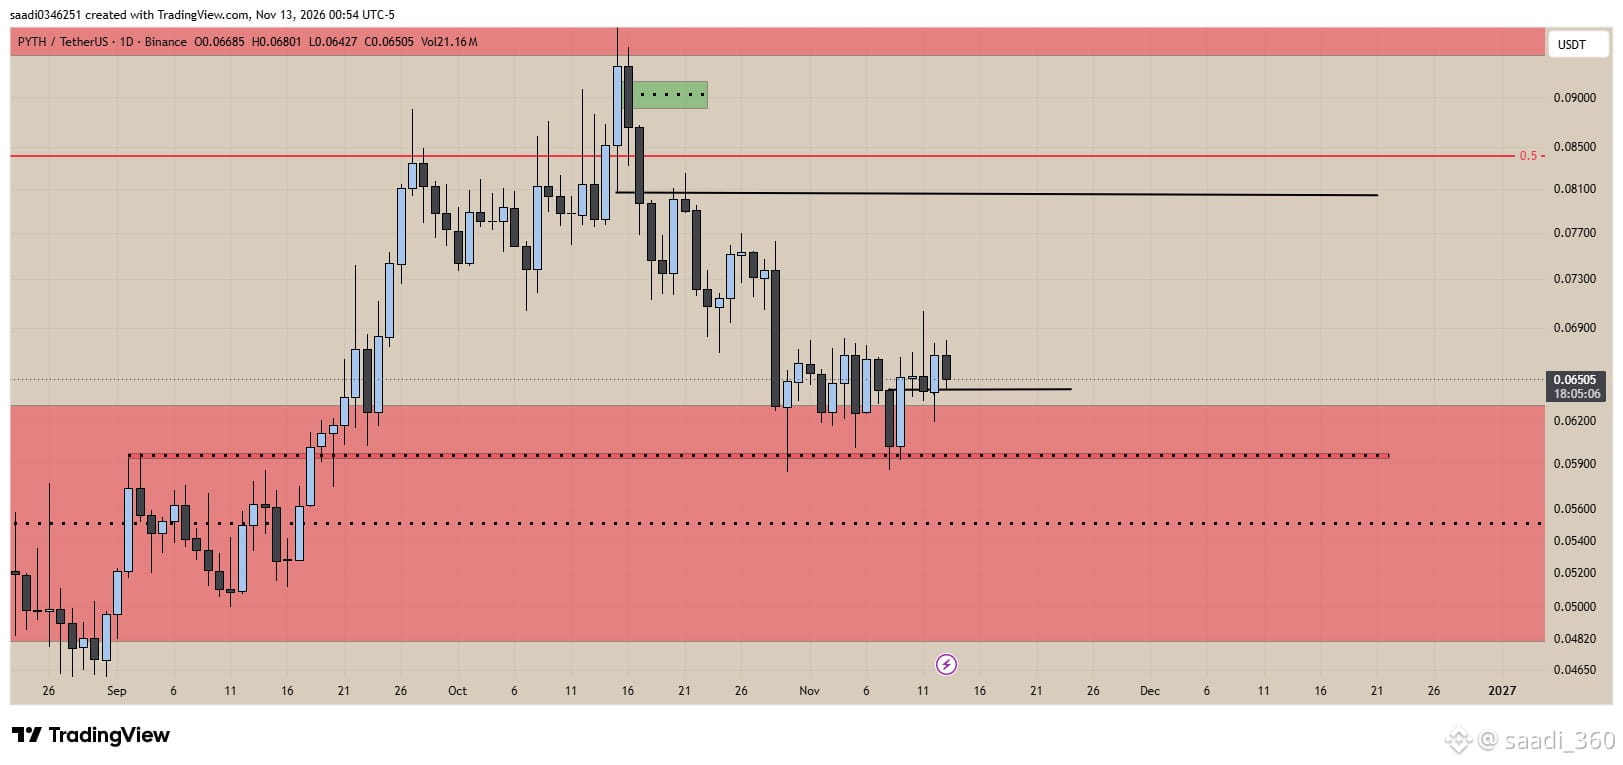
🚀 $PYTH — MY NOVEMBER 11 BUY CALL IS PLAYING OUT!
While many altcoins are facing selling pressure, PYTH is showing encouraging strength at its higher-timeframe support.
I shared my PYTH buying idea on November 11, when price was trading around the Weekly Breaker Support zone.
📊 Look at the November 13 chart!
The previous Daily candle closed bullish, showing a positive reaction from the support area. Price is still holding this important zone, and I'm watching for a potential bullish continuation.
🔥 Why I'm Interested in PYTH:
Weekly Breaker Support is the key area I'm watching.
Previous Daily candle closed bullish.
Price is showing a reaction from higher-timeframe support.
Around $507M market cap, PYTH deserves attention at these levels.
💰 My Strategy: I'm watching this support zone for a potential buying opportunity before a stronger move develops.
I shared my analysis BEFORE this bullish reaction. Check my November 11 post on my profile for proof!
The best opportunities are often spotted before the crowd notices them. 👀
Are you watching PYTH, or will you wait until it starts moving?
#PYTH #PYTHUSDT #cryptotrading #altcoins #BinanceSquare
Not financial advice. Always manage your risk.
{spot}(PYTHUSDT)
🚀 $PYTH — MY NOVEMBER 11 BUY CALL IS PLAYING OUT!
While many altcoins are facing selling pressure, PYTH is showing encouraging strength at its higher-timeframe support.
I shared my PYTH buying idea on November 11, when price was trading around the Weekly Breaker Support zone.
📊 Look at the November 13 chart!
The previous Daily candle closed bullish, showing a positive reaction from the support area. Price is still holding this important zone, and I'm watching for a potential bullish continuation.
🔥 Why I'm Interested in PYTH:
Weekly Breaker Support is the key area I'm watching.
Previous Daily candle closed bullish.
Price is showing a reaction from higher-timeframe support.
Around $507M market cap, PYTH deserves attention at these levels.
💰 My Strategy: I'm watching this support zone for a potential buying opportunity before a stronger move develops.
I shared my analysis BEFORE this bullish reaction. Check my November 11 post on my profile for proof!
The best opportunities are often spotted before the crowd notices them. 👀
Are you watching PYTH, or will you wait until it starts moving?
#PYTH #PYTHUSDT #cryptotrading #altcoins #BinanceSquare
Not financial advice. Always manage your risk.
While many altcoins are facing selling pressure, PYTH is showing encouraging strength at its higher-timeframe support.
I shared my PYTH buying idea on November 11, when price was trading around the Weekly Breaker Support zone.
📊 Look at the November 13 chart!
The previous Daily candle closed bullish, showing a positive reaction from the support area. Price is still holding this important zone, and I'm watching for a potential bullish continuation.
🔥 Why I'm Interested in PYTH:
Weekly Breaker Support is the key area I'm watching.
Previous Daily candle closed bullish.
Price is showing a reaction from higher-timeframe support.
Around $507M market cap, PYTH deserves attention at these levels.
💰 My Strategy: I'm watching this support zone for a potential buying opportunity before a stronger move develops.
I shared my analysis BEFORE this bullish reaction. Check my November 11 post on my profile for proof!
The best opportunities are often spotted before the crowd notices them. 👀
Are you watching PYTH, or will you wait until it starts moving?
#PYTH #PYTHUSDT #cryptotrading #altcoins #BinanceSquare
Not financial advice. Always manage your risk.
1
612
·
--
⚠️ BTC Bearish Warning | Protect Your Capital! 📉
Bitcoin could drop toward $63,000.
My market outlook remains bearish. I strongly recommend:
Avoid buying spot coins at current levels.
Avoid holding long positions.
Don't rush into new entries.
Wait for BTC to reach important liquidity and support levels.
Altcoins may also face further downside if BTC continues falling.
Capital protection comes first. Patience is better than getting trapped in the wrong direction.
Follow me for more market updates and accurate price-action analysis.
#BTC #bitcoin #CryptoMarket #trading #priceaction
⚠️ BTC Bearish Warning | Protect Your Capital! 📉
Bitcoin could drop toward $63,000.
My market outlook remains bearish. I strongly recommend:
Avoid buying spot coins at current levels.
Avoid holding long positions.
Don't rush into new entries.
Wait for BTC to reach important liquidity and support levels.
Altcoins may also face further downside if BTC continues falling.
Capital protection comes first. Patience is better than getting trapped in the wrong direction.
Follow me for more market updates and accurate price-action analysis.
#BTC #bitcoin #CryptoMarket #trading #priceaction
Bitcoin could drop toward $63,000.
My market outlook remains bearish. I strongly recommend:
Avoid buying spot coins at current levels.
Avoid holding long positions.
Don't rush into new entries.
Wait for BTC to reach important liquidity and support levels.
Altcoins may also face further downside if BTC continues falling.
Capital protection comes first. Patience is better than getting trapped in the wrong direction.
Follow me for more market updates and accurate price-action analysis.
#BTC #bitcoin #CryptoMarket #trading #priceaction
1
179
·
--
🚀 TWO BITCOIN PREDICTIONS. ONE SUCCESSFUL, ONE STILL AHEAD!
I shared two major Bitcoin market predictions, and both are pinned on my profile.
✅ Prediction #1 – BTC Bearish Move
When Bitcoin was trading around $76K, I warned about a potential drop toward the $70K region. The bearish prediction played out.
🚀 Prediction #2 – Q5 Bull Run
I also shared my quarterly market analysis. Based on my analysis, I expect a potential major bullish shift around mid-December 2026, after Q5 begins.
🎯 What's Next?
Now I am preparing to identify the best altcoins before the next potential bull run.
I will analyze the market structure, fundamentals, liquidity and institutional interest to select promising coins with strong upside potential.
📌 Both predictions are pinned on my profile. Go and check them yourself.
Connect with me, follow my analysis, and stay ahead of the next market opportunity!
I want to help you identify opportunities before the crowd notices them.
#bitcoin #BTC #altcoins #CryptoAnalysis #Bullrun
🚀 TWO BITCOIN PREDICTIONS. ONE SUCCESSFUL, ONE STILL AHEAD!
I shared two major Bitcoin market predictions, and both are pinned on my profile.
✅ Prediction #1 – BTC Bearish Move
When Bitcoin was trading around $76K, I warned about a potential drop toward the $70K region. The bearish prediction played out.
🚀 Prediction #2 – Q5 Bull Run
I also shared my quarterly market analysis. Based on my analysis, I expect a potential major bullish shift around mid-December 2026, after Q5 begins.
🎯 What's Next?
Now I am preparing to identify the best altcoins before the next potential bull run.
I will analyze the market structure, fundamentals, liquidity and institutional interest to select promising coins with strong upside potential.
📌 Both predictions are pinned on my profile. Go and check them yourself.
Connect with me, follow my analysis, and stay ahead of the next market opportunity!
I want to help you identify opportunities before the crowd notices them.
#bitcoin #BTC #altcoins #CryptoAnalysis #Bullrun
I shared two major Bitcoin market predictions, and both are pinned on my profile.
✅ Prediction #1 – BTC Bearish Move
When Bitcoin was trading around $76K, I warned about a potential drop toward the $70K region. The bearish prediction played out.
🚀 Prediction #2 – Q5 Bull Run
I also shared my quarterly market analysis. Based on my analysis, I expect a potential major bullish shift around mid-December 2026, after Q5 begins.
🎯 What's Next?
Now I am preparing to identify the best altcoins before the next potential bull run.
I will analyze the market structure, fundamentals, liquidity and institutional interest to select promising coins with strong upside potential.
📌 Both predictions are pinned on my profile. Go and check them yourself.
Connect with me, follow my analysis, and stay ahead of the next market opportunity!
I want to help you identify opportunities before the crowd notices them.
#bitcoin #BTC #altcoins #CryptoAnalysis #Bullrun
1
2.1k
·
--
SOLUSDT | SHORT TRADE SETUP 📉
A new short opportunity on Solana (SOL).
Trade Details:
Entry Price: 85.49 USDT
Stop Loss: 86.19 USDT
Take Profit: 81.30 USDT
Direction: SHORT 🔴
Follow proper risk management and avoid overleveraging.
Stay disciplined. Trade the setup, not emotions.
#sol #SOLUSDT! #cryptotrading #ShortSetup #BİNANCESQUARE
$SOL
{future}(SOLUSDT)
SOLUSDT | SHORT TRADE SETUP 📉
A new short opportunity on Solana (SOL).
Trade Details:
Entry Price: 85.49 USDT
Stop Loss: 86.19 USDT
Take Profit: 81.30 USDT
Direction: SHORT 🔴
Follow proper risk management and avoid overleveraging.
Stay disciplined. Trade the setup, not emotions.
#sol #SOLUSDT! #cryptotrading #ShortSetup #BİNANCESQUARE
$SOL
A new short opportunity on Solana (SOL).
Trade Details:
Entry Price: 85.49 USDT
Stop Loss: 86.19 USDT
Take Profit: 81.30 USDT
Direction: SHORT 🔴
Follow proper risk management and avoid overleveraging.
Stay disciplined. Trade the setup, not emotions.
#sol #SOLUSDT! #cryptotrading #ShortSetup #BİNANCESQUARE
$SOL
80
·
--
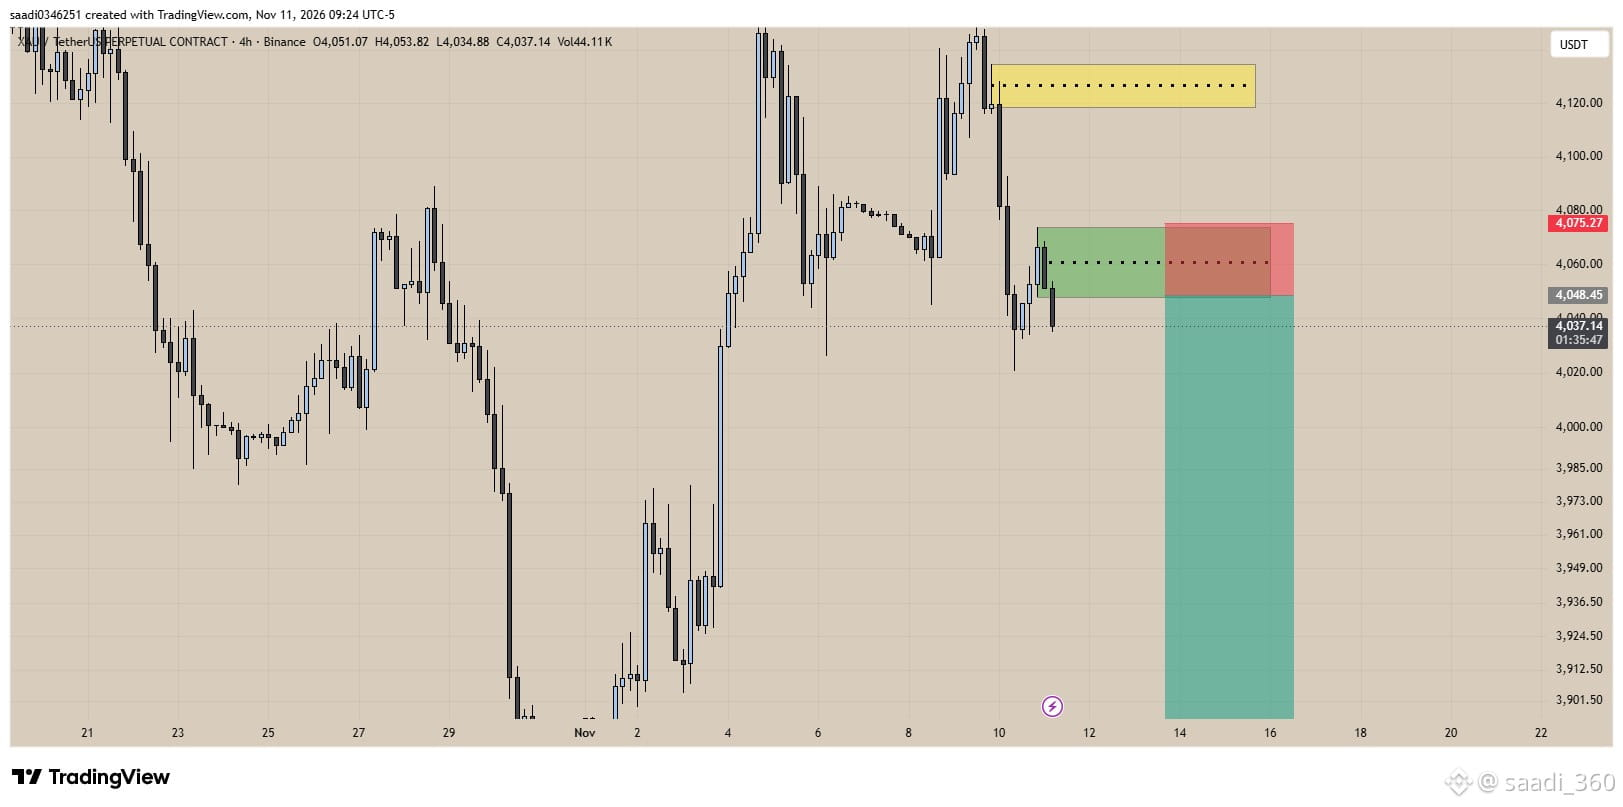
🚨 XAUUSDT – UPDATED 4H ORDER BLOCK SHORT SETUP
The market didn't reach our previous entry level, so we're updating our entry based on the 4-Hour Order Block (4H OB).
📉 Short Trade Setup:
Entry: 4,048.45
Stop Loss: 4,075.27
Take Profit: 3,627.01
🎯 Waiting for price to return to our 4H Order Block. No chasing the market!
Patience is key. Let the market come to our level.
❤️ Follow me for more ICT, Smart Money Concepts, and institutional trading setups.
#xauusdt #GOLD #4HSetup OB #ICTTradingStrategy #SmartMoneyConceptsCrypto
$XAU
{future}(XAUUSDT)
🚨 XAUUSDT – UPDATED 4H ORDER BLOCK SHORT SETUP
The market didn't reach our previous entry level, so we're updating our entry based on the 4-Hour Order Block (4H OB).
📉 Short Trade Setup:
Entry: 4,048.45
Stop Loss: 4,075.27
Take Profit: 3,627.01
🎯 Waiting for price to return to our 4H Order Block. No chasing the market!
Patience is key. Let the market come to our level.
❤️ Follow me for more ICT, Smart Money Concepts, and institutional trading setups.
#xauusdt #GOLD #4HSetup OB #ICTTradingStrategy #SmartMoneyConceptsCrypto
$XAU
The market didn't reach our previous entry level, so we're updating our entry based on the 4-Hour Order Block (4H OB).
📉 Short Trade Setup:
Entry: 4,048.45
Stop Loss: 4,075.27
Take Profit: 3,627.01
🎯 Waiting for price to return to our 4H Order Block. No chasing the market!
Patience is key. Let the market come to our level.
❤️ Follow me for more ICT, Smart Money Concepts, and institutional trading setups.
#xauusdt #GOLD #4HSetup OB #ICTTradingStrategy #SmartMoneyConceptsCrypto
$XAU
172
·
--
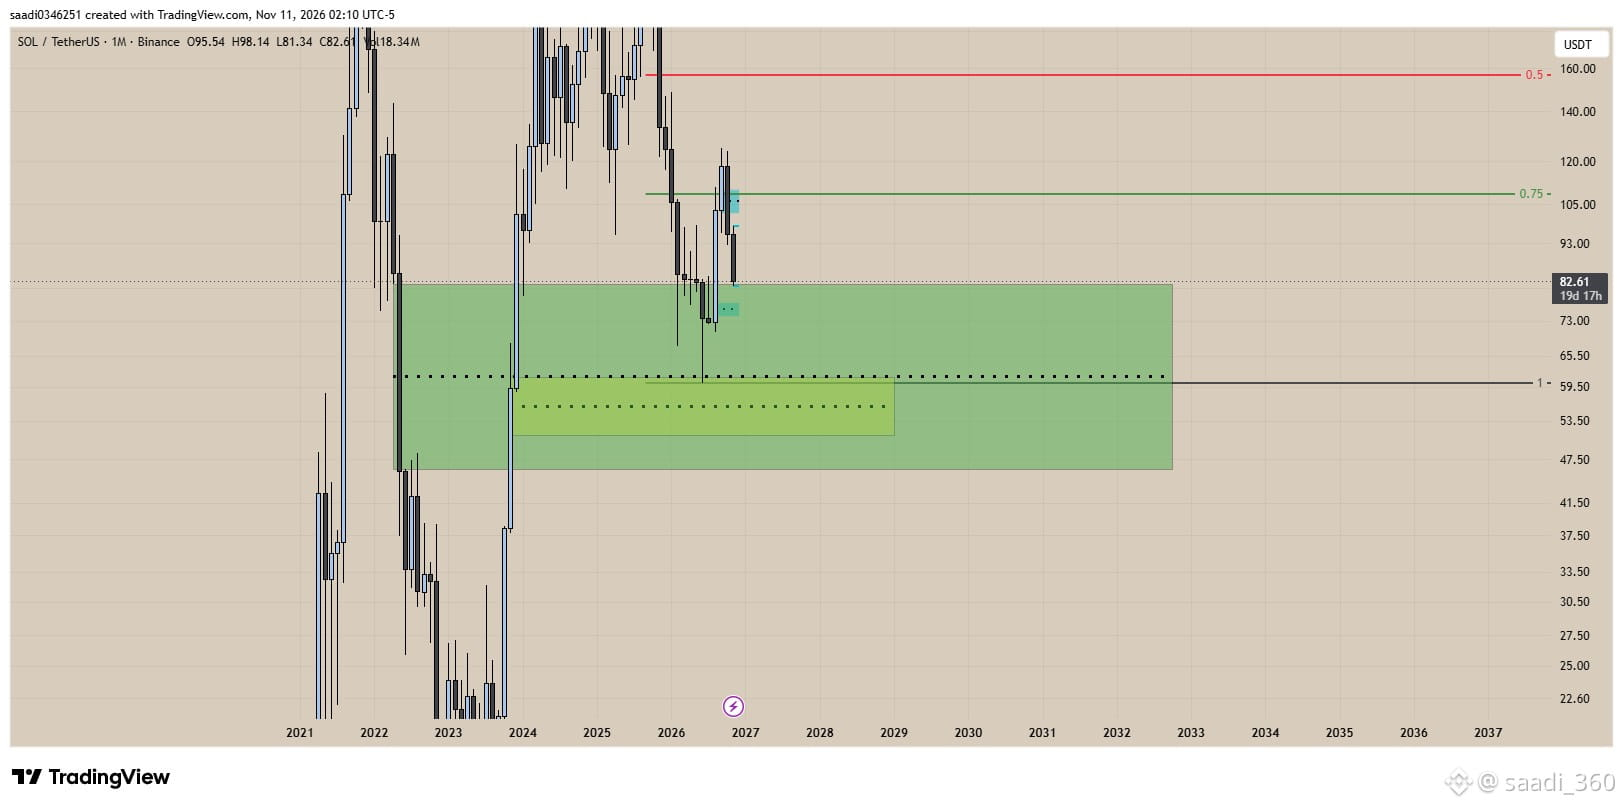
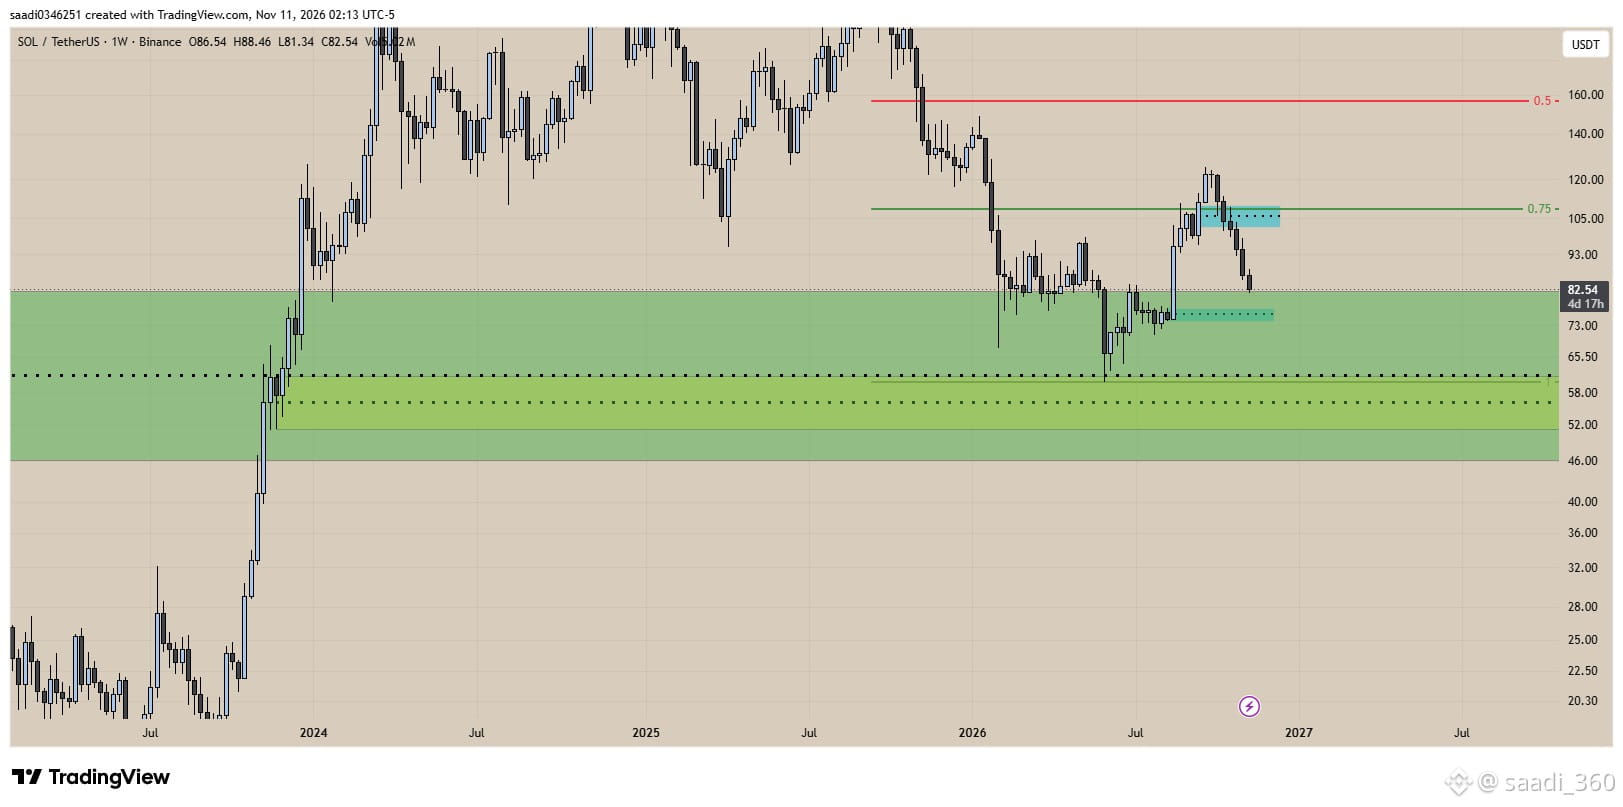
🚀 SOLANA (SOL) | SPOT BUYING ZONE
My expected buying zone for Solana is $56–$51 USDT.
I'm waiting for price to reach this zone to look for a long-term spot accumulation opportunity.
Patience is key. Don't rush into buying at current levels.
#sol #solana #crypto #SpotTrading #altcoins
$SOL
{spot}(SOLUSDT)
🚀 SOLANA (SOL) | SPOT BUYING ZONE
My expected buying zone for Solana is $56–$51 USDT.
I'm waiting for price to reach this zone to look for a long-term spot accumulation opportunity.
Patience is key. Don't rush into buying at current levels.
#sol #solana #crypto #SpotTrading #altcoins
$SOL
My expected buying zone for Solana is $56–$51 USDT.
I'm waiting for price to reach this zone to look for a long-term spot accumulation opportunity.
Patience is key. Don't rush into buying at current levels.
#sol #solana #crypto #SpotTrading #altcoins
$SOL
1
322
·
--
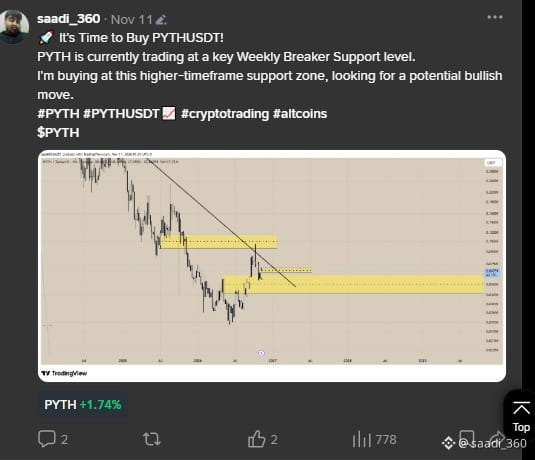
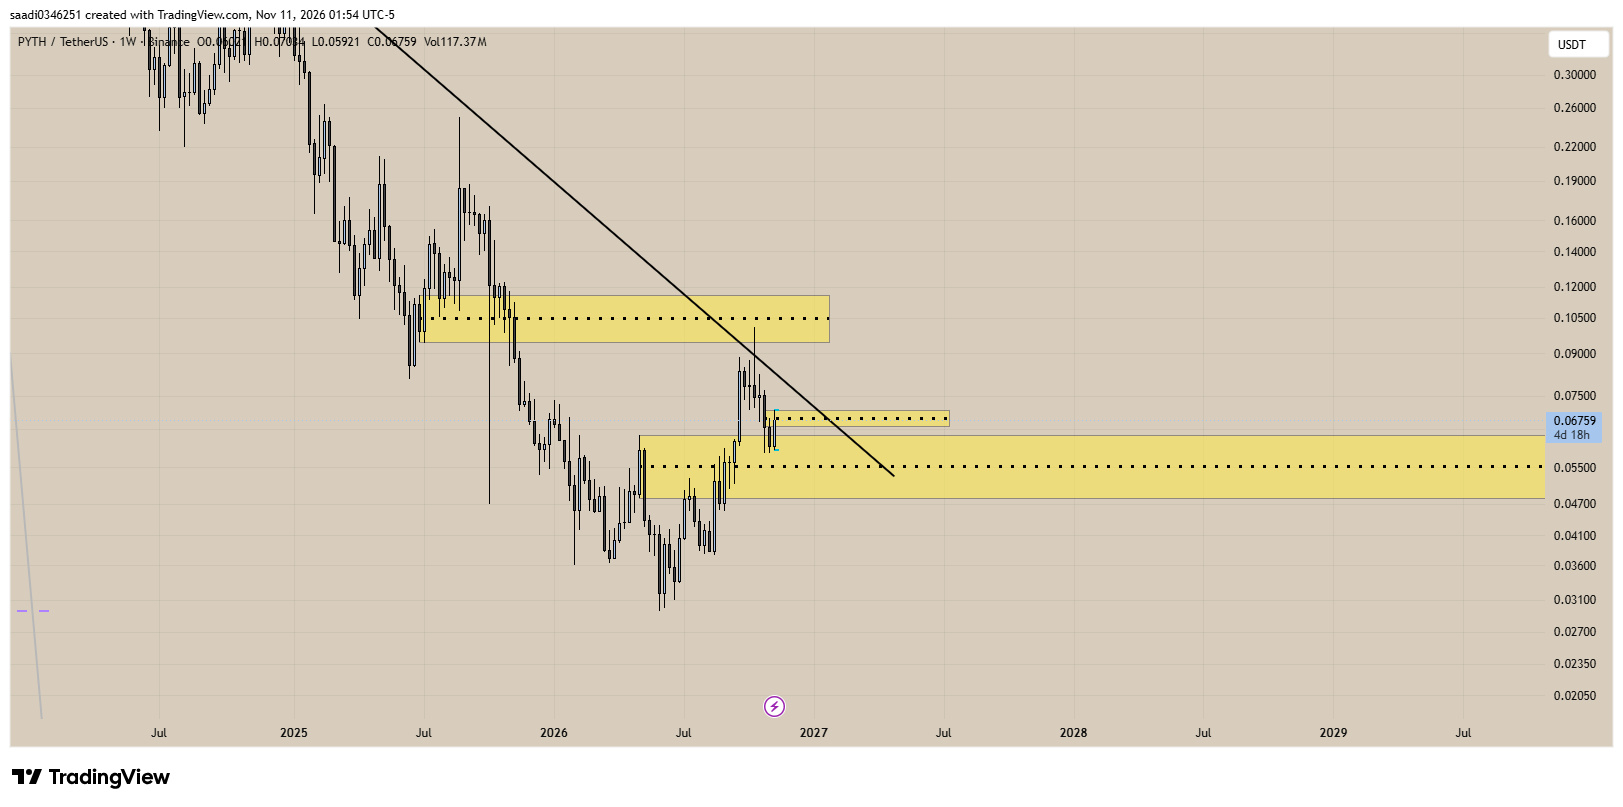
🚀 It's Time to Buy PYTHUSDT!
PYTH is currently trading at a key Weekly Breaker Support level.
I'm buying at this higher-timeframe support zone, looking for a potential bullish move.
#PYTH #PYTHUSDT📈 #cryptotrading #altcoins
$PYTH
{spot}(PYTHUSDT)
🚀 It's Time to Buy PYTHUSDT!
PYTH is currently trading at a key Weekly Breaker Support level.
I'm buying at this higher-timeframe support zone, looking for a potential bullish move.
#PYTH #PYTHUSDT📈 #cryptotrading #altcoins
$PYTH
PYTH is currently trading at a key Weekly Breaker Support level.
I'm buying at this higher-timeframe support zone, looking for a potential bullish move.
#PYTH #PYTHUSDT📈 #cryptotrading #altcoins
$PYTH
2
2
779
·
--
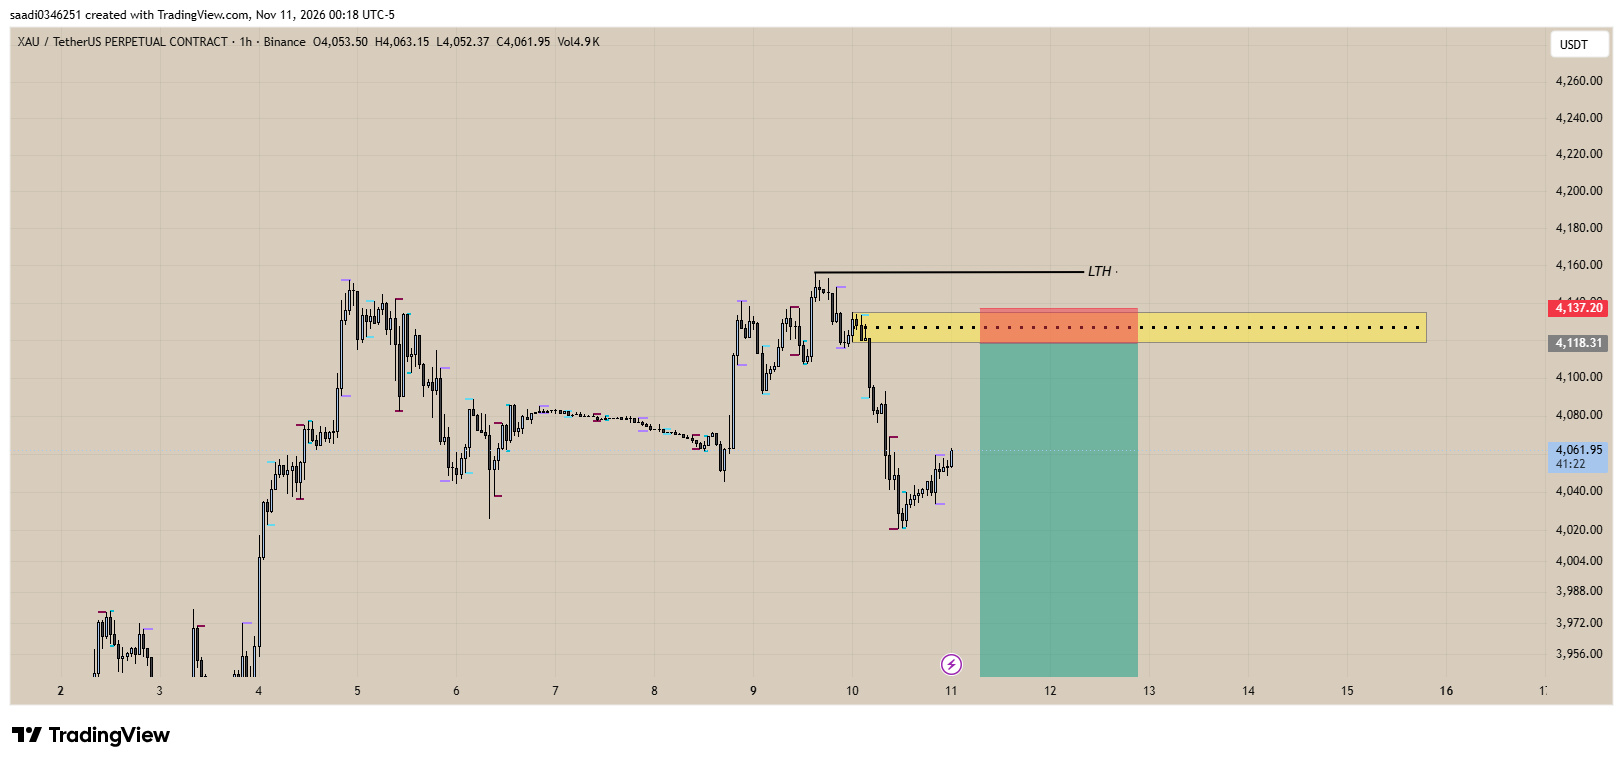
🚨 XAUUSDT – A POTENTIALLY LIFE-CHANGING SWING TRADE! 🚨
Opportunities like this don't come every day!
I've shared a high-conviction Gold swing trade setup based on detailed market structure and institutional price action.
🎯 This setup has the potential to deliver a significant move, but patience and proper risk management are essential.
📌 The complete XAUUSDT swing trade setup is PINNED on my profile.
Don't miss the analysis. Visit my profile and check the pinned setup.
❤️ Follow me for more high-quality trading opportunities and institutional market insights.
#xauusdt #GOLD #swingtrading #priceaction #SmartMoneyConceptsCrypto
$XAUT
{future}(XAUTUSDT)
🚨 XAUUSDT – A POTENTIALLY LIFE-CHANGING SWING TRADE! 🚨
Opportunities like this don't come every day!
I've shared a high-conviction Gold swing trade setup based on detailed market structure and institutional price action.
🎯 This setup has the potential to deliver a significant move, but patience and proper risk management are essential.
📌 The complete XAUUSDT swing trade setup is PINNED on my profile.
Don't miss the analysis. Visit my profile and check the pinned setup.
❤️ Follow me for more high-quality trading opportunities and institutional market insights.
#xauusdt #GOLD #swingtrading #priceaction #SmartMoneyConceptsCrypto
$XAUT
Opportunities like this don't come every day!
I've shared a high-conviction Gold swing trade setup based on detailed market structure and institutional price action.
🎯 This setup has the potential to deliver a significant move, but patience and proper risk management are essential.
📌 The complete XAUUSDT swing trade setup is PINNED on my profile.
Don't miss the analysis. Visit my profile and check the pinned setup.
❤️ Follow me for more high-quality trading opportunities and institutional market insights.
#xauusdt #GOLD #swingtrading #priceaction #SmartMoneyConceptsCrypto
$XAUT
3
949
·
--
🔥 XAUUSDT - SWING TRADE - SHORT SETUP 🔥
Gold is looking heavy from here. I am taking a Swing SHORT.
Pair: XAUUSDT (Gold)
Direction:SHORT 🔴
Type:Swing Trade
Entry:4118.37
Stop Loss:4137.20
Take Profit:3646.03
Risk : Reward = 1 : 25 🚀
Plan is simple: If price stays below 4137, we ride it down to 3646.
Don't chase. Wait for entry. Manage your risk. 1-2% risk only.
This is not financial advice, trade at your own risk.
What do you think? Will Gold drop to 3646?
#XAUUSDTPERP #GOLD #CryptoTrading #SwingTrade #TradingSignals
$XAUT
{future}(XAUTUSDT)
🔥 XAUUSDT - SWING TRADE - SHORT SETUP 🔥
Gold is looking heavy from here. I am taking a Swing SHORT.
Pair: XAUUSDT (Gold)
Direction:SHORT 🔴
Type:Swing Trade
Entry:4118.37
Stop Loss:4137.20
Take Profit:3646.03
Risk : Reward = 1 : 25 🚀
Plan is simple: If price stays below 4137, we ride it down to 3646.
Don't chase. Wait for entry. Manage your risk. 1-2% risk only.
This is not financial advice, trade at your own risk.
What do you think? Will Gold drop to 3646?
#XAUUSDTPERP #GOLD #CryptoTrading #SwingTrade #TradingSignals
$XAUT
Gold is looking heavy from here. I am taking a Swing SHORT.
Pair: XAUUSDT (Gold)
Direction:SHORT 🔴
Type:Swing Trade
Entry:4118.37
Stop Loss:4137.20
Take Profit:3646.03
Risk : Reward = 1 : 25 🚀
Plan is simple: If price stays below 4137, we ride it down to 3646.
Don't chase. Wait for entry. Manage your risk. 1-2% risk only.
This is not financial advice, trade at your own risk.
What do you think? Will Gold drop to 3646?
#XAUUSDTPERP #GOLD #CryptoTrading #SwingTrade #TradingSignals
$XAUT
282
·
--
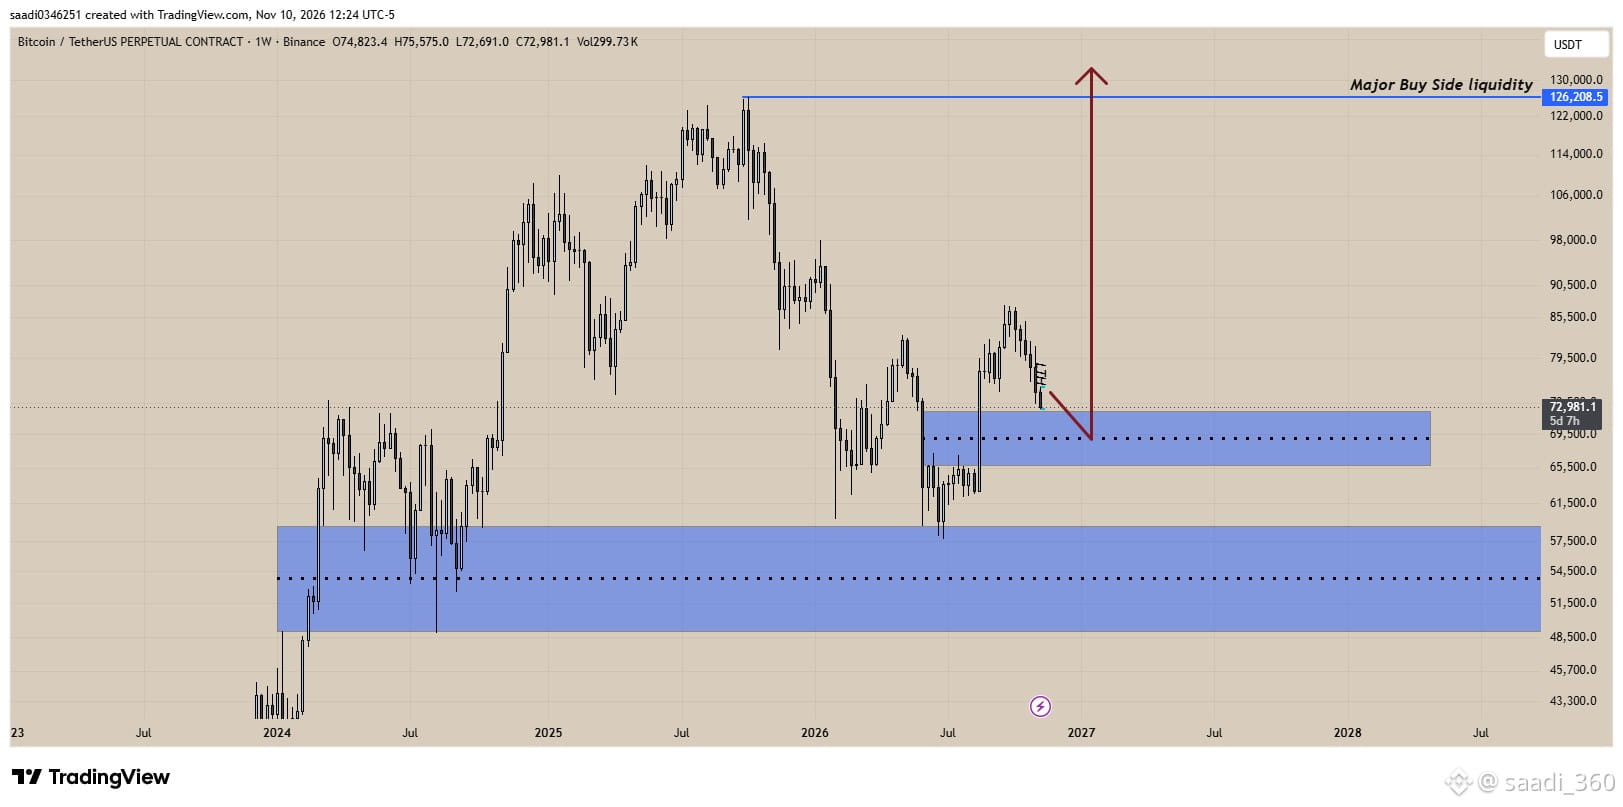
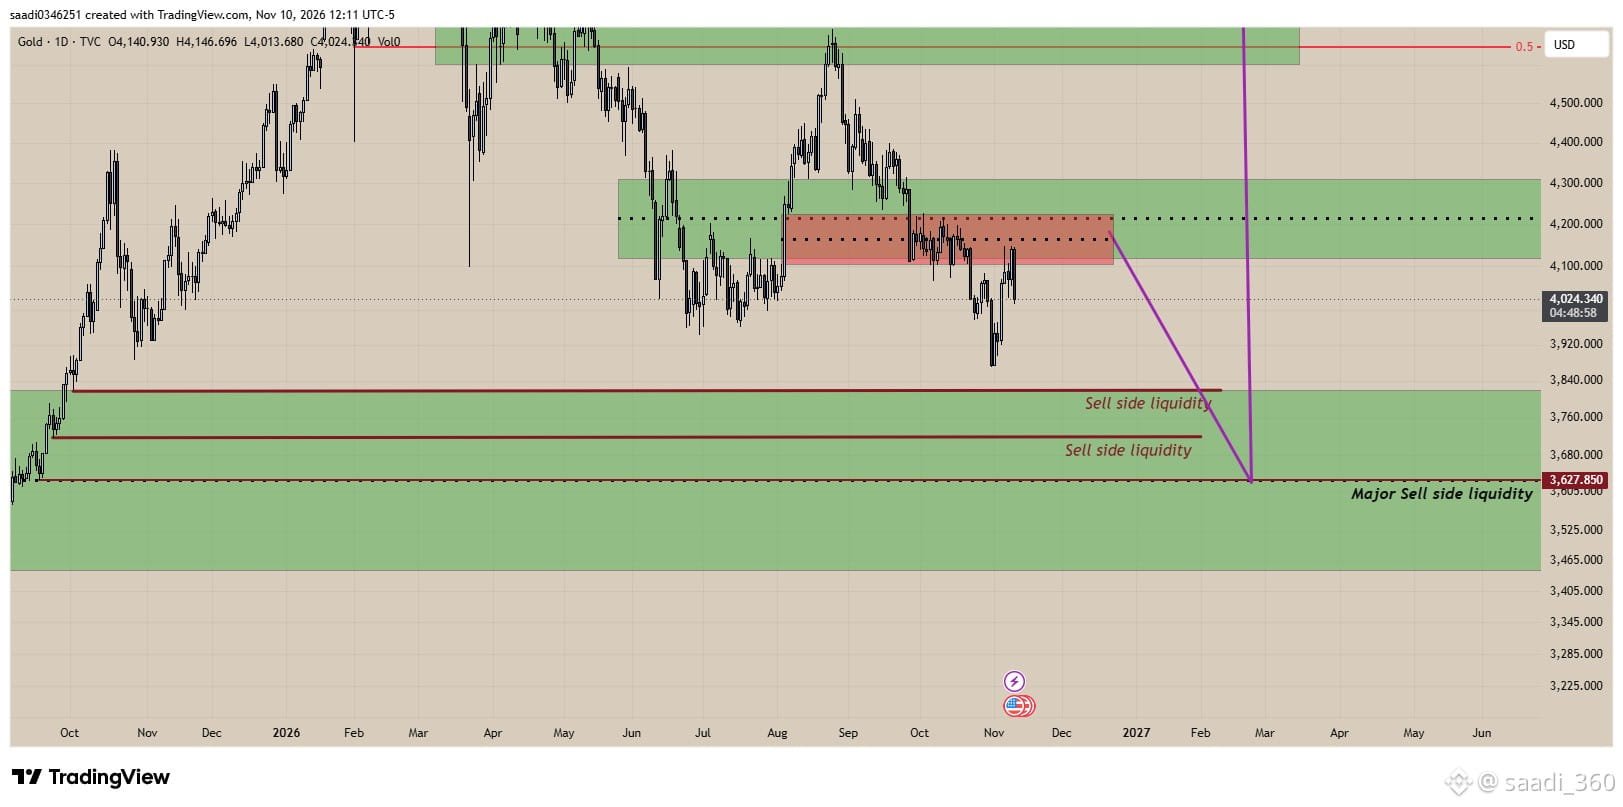
🚨 Market Update | No Spot Opportunities Yet
The current market conditions are not offering attractive Spot buying opportunities.
Here is my market outlook:
🟡 GOLD: Expecting a potential decline toward the 3,600 zone.
₿ BITCOIN: BTC is likely to move lower toward the $69K–$68K zone.
📉 ALTCOINS: Bitcoin's next move will determine the direction of the altcoin market. Currently, no altcoin pairs meet my technical criteria for a Spot entry.
My Strategy:
Avoid entering Spot positions at current levels.
Wait for price to reach important support zones.
Let the market complete its liquidity hunts.
Wait for proper confirmation before entering.
I will share clear Spot buying opportunities when the right conditions appear.
Capital protection comes first. Patience is part of trading. Don't force trades when the market offers no opportunity.
#bitcoin #BTC #altcoins #GOLD #cryptotrading
🚨 Market Update | No Spot Opportunities Yet
The current market conditions are not offering attractive Spot buying opportunities.
Here is my market outlook:
🟡 GOLD: Expecting a potential decline toward the 3,600 zone.
₿ BITCOIN: BTC is likely to move lower toward the $69K–$68K zone.
📉 ALTCOINS: Bitcoin's next move will determine the direction of the altcoin market. Currently, no altcoin pairs meet my technical criteria for a Spot entry.
My Strategy:
Avoid entering Spot positions at current levels.
Wait for price to reach important support zones.
Let the market complete its liquidity hunts.
Wait for proper confirmation before entering.
I will share clear Spot buying opportunities when the right conditions appear.
Capital protection comes first. Patience is part of trading. Don't force trades when the market offers no opportunity.
#bitcoin #BTC #altcoins #GOLD #cryptotrading
The current market conditions are not offering attractive Spot buying opportunities.
Here is my market outlook:
🟡 GOLD: Expecting a potential decline toward the 3,600 zone.
₿ BITCOIN: BTC is likely to move lower toward the $69K–$68K zone.
📉 ALTCOINS: Bitcoin's next move will determine the direction of the altcoin market. Currently, no altcoin pairs meet my technical criteria for a Spot entry.
My Strategy:
Avoid entering Spot positions at current levels.
Wait for price to reach important support zones.
Let the market complete its liquidity hunts.
Wait for proper confirmation before entering.
I will share clear Spot buying opportunities when the right conditions appear.
Capital protection comes first. Patience is part of trading. Don't force trades when the market offers no opportunity.
#bitcoin #BTC #altcoins #GOLD #cryptotrading
258
·
--
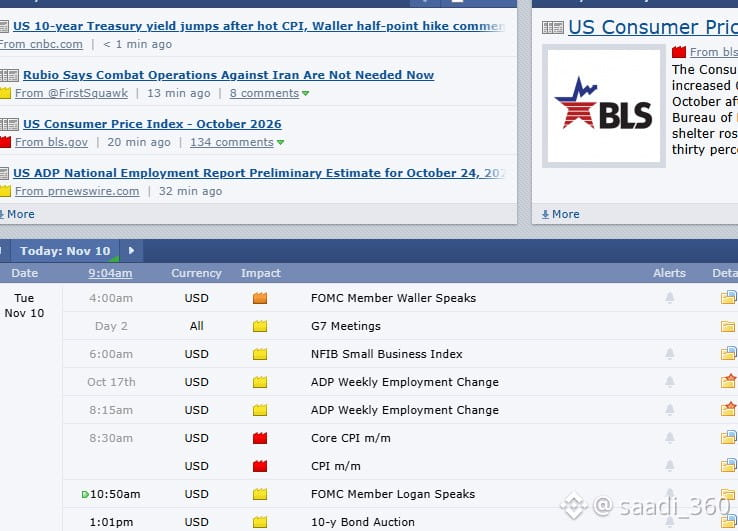
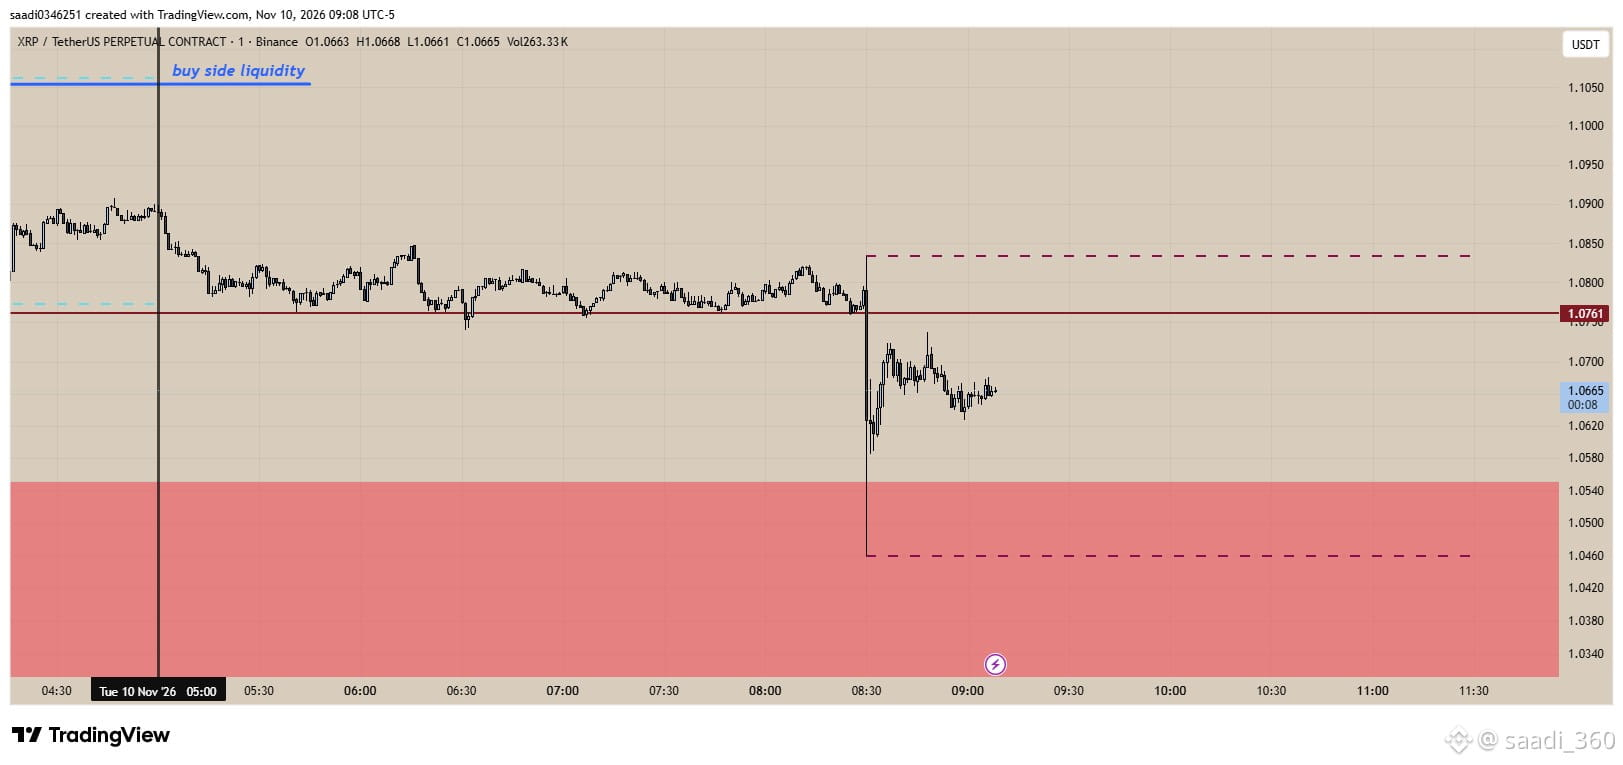
🚨 Why I Avoid Trading During High-Impact News!
Today at 8:30 AM New York time, a high-impact news release created massive volatility in the market.
Look at the 8:30 AM candle on my chart. Price moved aggressively in both directions, hunting liquidity and triggering stop-losses.
🔴 The red-folder event on Forex Factory indicates high-impact news.
Why I avoid trading during these events:
Liquidity can be hunted in both directions.
Stop-losses can get triggered unexpectedly.
Market direction becomes unpredictable.
Entering without confirmation is pure gambling.
I would rather miss a trade than risk my capital during unpredictable news volatility.
Remember: Not every market movement is an opportunity. Sometimes the best trade is NO TRADE.
I follow ICT and Smart Money Concepts. I wait for liquidity sweeps, market structure and confirmation before entering.
📊 Follow me for more market insights, liquidity analysis and trade setups.
#BTC #XRP #ict #LiquidityHunt #tradingpsychology
🚨 Why I Avoid Trading During High-Impact News!
Today at 8:30 AM New York time, a high-impact news release created massive volatility in the market.
Look at the 8:30 AM candle on my chart. Price moved aggressively in both directions, hunting liquidity and triggering stop-losses.
🔴 The red-folder event on Forex Factory indicates high-impact news.
Why I avoid trading during these events:
Liquidity can be hunted in both directions.
Stop-losses can get triggered unexpectedly.
Market direction becomes unpredictable.
Entering without confirmation is pure gambling.
I would rather miss a trade than risk my capital during unpredictable news volatility.
Remember: Not every market movement is an opportunity. Sometimes the best trade is NO TRADE.
I follow ICT and Smart Money Concepts. I wait for liquidity sweeps, market structure and confirmation before entering.
📊 Follow me for more market insights, liquidity analysis and trade setups.
#BTC #XRP #ict #LiquidityHunt #tradingpsychology
Today at 8:30 AM New York time, a high-impact news release created massive volatility in the market.
Look at the 8:30 AM candle on my chart. Price moved aggressively in both directions, hunting liquidity and triggering stop-losses.
🔴 The red-folder event on Forex Factory indicates high-impact news.
Why I avoid trading during these events:
Liquidity can be hunted in both directions.
Stop-losses can get triggered unexpectedly.
Market direction becomes unpredictable.
Entering without confirmation is pure gambling.
I would rather miss a trade than risk my capital during unpredictable news volatility.
Remember: Not every market movement is an opportunity. Sometimes the best trade is NO TRADE.
I follow ICT and Smart Money Concepts. I wait for liquidity sweeps, market structure and confirmation before entering.
📊 Follow me for more market insights, liquidity analysis and trade setups.
#BTC #XRP #ict #LiquidityHunt #tradingpsychology
173
·
--
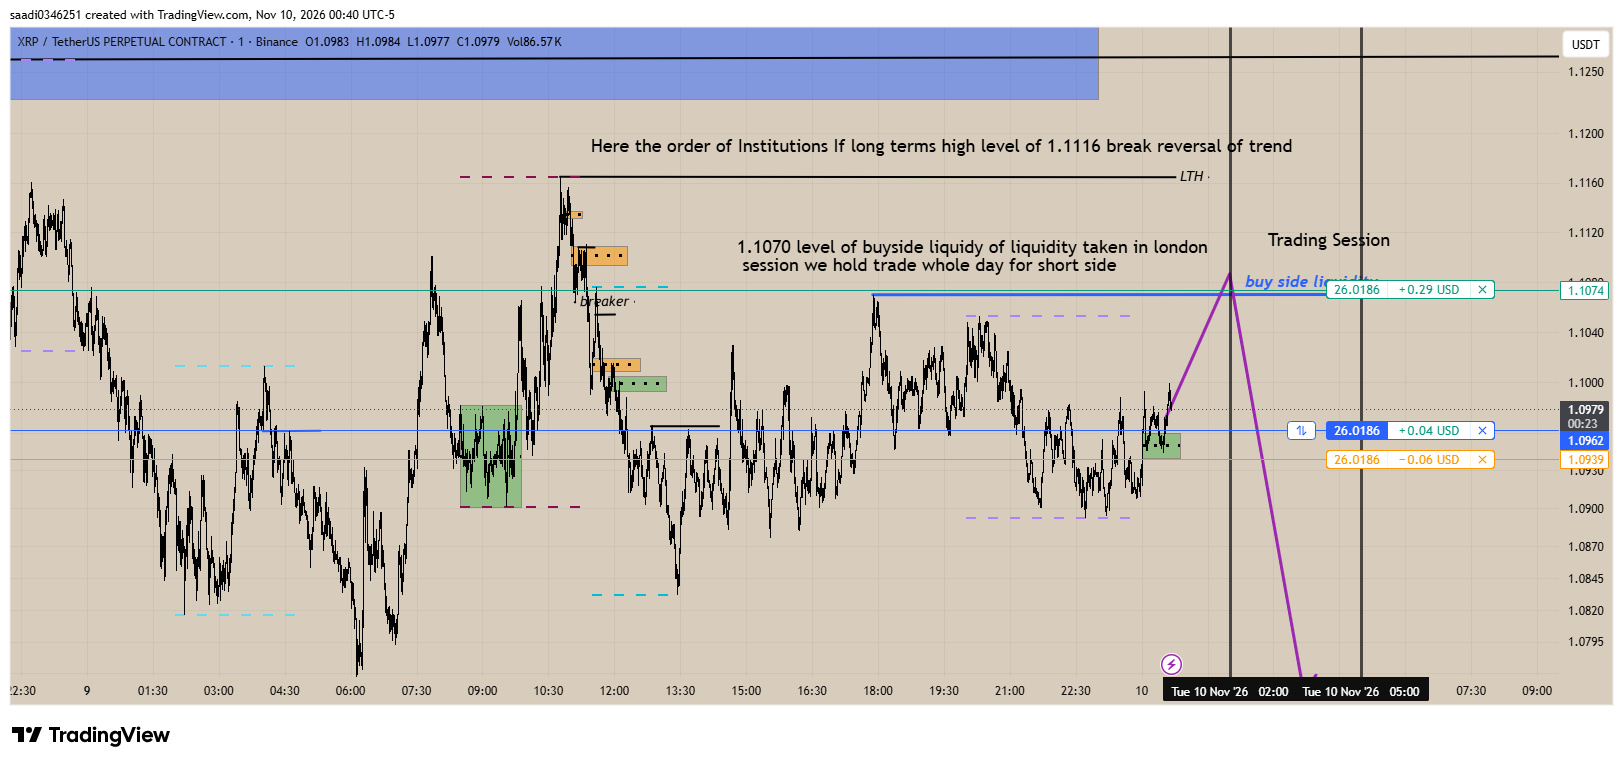
XRPUSDT | Institutional Liquidity Model 🎯
How I Read Institutional Order Flow
Institutions hunted the 1.1070 Buy-Side Liquidity (BSL) during the London session.
Here is my trading logic:
🔴 London Session – Buy-Side Liquidity Hunt
Once buy-side liquidity is hunted during the London session, my bias for the entire trading day becomes bearish.
I look for short opportunities during the 2:00 AM–5:00 AM New York time window.
My expectation is downside price delivery throughout the day.
There is no reason for me to chase higher prices after the London session has already taken the buy-side liquidity.
🟢 Long-Term High (LTH) Liquidity Hunt
If institutions hunt the Long-Term High at 1.1116, I expect bullish price delivery.
Price can continue moving higher and higher.
Important Levels:
1.1116 – Long-Term High (LTH)
1.1070 – Buy-Side Liquidity hunted in London
1.0962 – Intraday reference
1.0939 – Lower reference
My approach: I study where liquidity is taken, which session takes it, and what direction the market is likely to deliver next.
This is how I build my institutional market bias instead of blindly following indicators.
Follow me for more ICT, Smart Money Concepts, and institutional price-action analysis.
#xrp #ict #liquidity #smartmoney #priceaction
XRPUSDT | Institutional Liquidity Model 🎯
How I Read Institutional Order Flow
Institutions hunted the 1.1070 Buy-Side Liquidity (BSL) during the London session.
Here is my trading logic:
🔴 London Session – Buy-Side Liquidity Hunt
Once buy-side liquidity is hunted during the London session, my bias for the entire trading day becomes bearish.
I look for short opportunities during the 2:00 AM–5:00 AM New York time window.
My expectation is downside price delivery throughout the day.
There is no reason for me to chase higher prices after the London session has already taken the buy-side liquidity.
🟢 Long-Term High (LTH) Liquidity Hunt
If institutions hunt the Long-Term High at 1.1116, I expect bullish price delivery.
Price can continue moving higher and higher.
Important Levels:
1.1116 – Long-Term High (LTH)
1.1070 – Buy-Side Liquidity hunted in London
1.0962 – Intraday reference
1.0939 – Lower reference
My approach: I study where liquidity is taken, which session takes it, and what direction the market is likely to deliver next.
This is how I build my institutional market bias instead of blindly following indicators.
Follow me for more ICT, Smart Money Concepts, and institutional price-action analysis.
#xrp #ict #liquidity #smartmoney #priceaction
How I Read Institutional Order Flow
Institutions hunted the 1.1070 Buy-Side Liquidity (BSL) during the London session.
Here is my trading logic:
🔴 London Session – Buy-Side Liquidity Hunt
Once buy-side liquidity is hunted during the London session, my bias for the entire trading day becomes bearish.
I look for short opportunities during the 2:00 AM–5:00 AM New York time window.
My expectation is downside price delivery throughout the day.
There is no reason for me to chase higher prices after the London session has already taken the buy-side liquidity.
🟢 Long-Term High (LTH) Liquidity Hunt
If institutions hunt the Long-Term High at 1.1116, I expect bullish price delivery.
Price can continue moving higher and higher.
Important Levels:
1.1116 – Long-Term High (LTH)
1.1070 – Buy-Side Liquidity hunted in London
1.0962 – Intraday reference
1.0939 – Lower reference
My approach: I study where liquidity is taken, which session takes it, and what direction the market is likely to deliver next.
This is how I build my institutional market bias instead of blindly following indicators.
Follow me for more ICT, Smart Money Concepts, and institutional price-action analysis.
#xrp #ict #liquidity #smartmoney #priceaction
4
1.4k
·
--
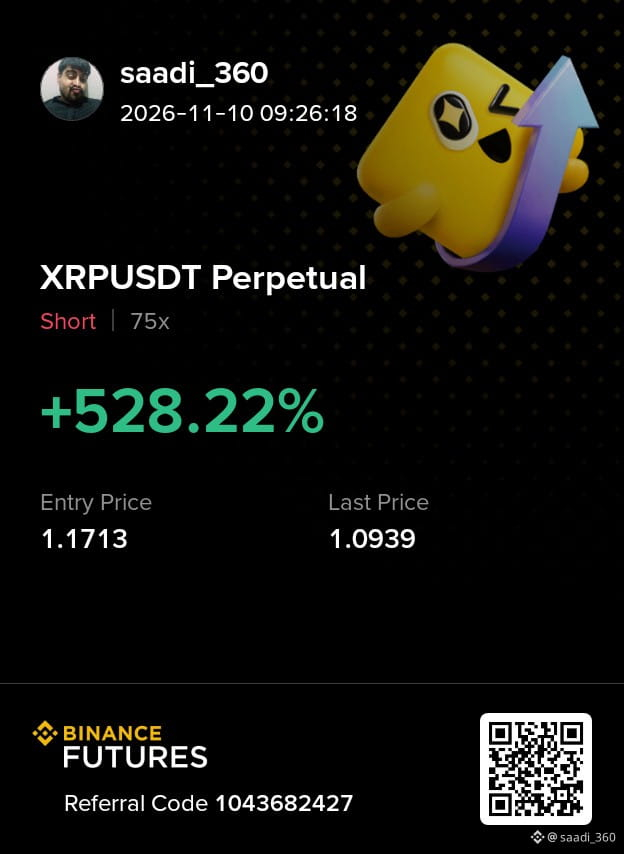
swing trade open when I say we will in bearish trend I'm holding this trade to th 0.89 level untill lower daily liquidity will not be sweep
swing trade open when I say we will in bearish trend I'm holding this trade to th 0.89 level untill lower daily liquidity will not be sweep
356
·
--
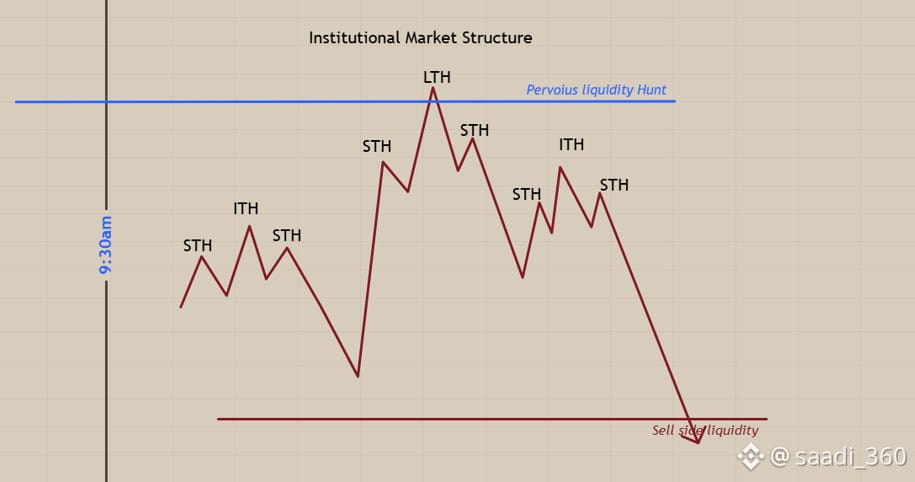
📉 Market Maker Sell Model | Institutional Market Structure
Learn how to identify a potential institutional sell setup after the 9:30 AM New York Open.
The idea is simple: Let price hunt buy-side liquidity, confirm bearish structure, and then look for short entries targeting sell-side liquidity.
🔍 Step-by-Step Trading Model
1️⃣ Buy-Side Liquidity Hunt
Wait for the 9:30 AM New York Open.
Watch for price to raid previous highs and take buy-side liquidity.
The highest point after this raid becomes the Long-Term High (LTH).
2️⃣ Identify Market Structure
After the LTH forms, look for an Intermediate-Term High (ITH) below it.
Short-Term Highs (STH) should develop as price starts moving lower.
3️⃣ Bearish Confirmation
Wait for a bearish Market Structure Shift (MSS).
Once bearish structure is confirmed, identify an FVG or Order Block for a potential short entry.
4️⃣ Target Sell-Side Liquidity
Look for price to expand lower toward sell-side liquidity.
Avoid entering before confirmation.
⚠️ Important Rule – ITH Must Hold
While price is moving lower, the Intermediate-Term High (ITH) should not break.
ITH holds: Bearish continuation remains valid.
ITH breaks: The sell model is invalidated, and price may move back toward the Long-Term High (LTH).
Remember: Don't chase price. Wait for the liquidity raid, market structure shift, and a proper entry.
💬 Question: Do you use the 9:30 AM New York liquidity model in your trading? Share your thoughts below!
#ICTTradingStrategy #SmartMoneyConceptsCrypto #Marketstructure #liquidity #tradingStrategy
📉 Market Maker Sell Model | Institutional Market Structure
Learn how to identify a potential institutional sell setup after the 9:30 AM New York Open.
The idea is simple: Let price hunt buy-side liquidity, confirm bearish structure, and then look for short entries targeting sell-side liquidity.
🔍 Step-by-Step Trading Model
1️⃣ Buy-Side Liquidity Hunt
Wait for the 9:30 AM New York Open.
Watch for price to raid previous highs and take buy-side liquidity.
The highest point after this raid becomes the Long-Term High (LTH).
2️⃣ Identify Market Structure
After the LTH forms, look for an Intermediate-Term High (ITH) below it.
Short-Term Highs (STH) should develop as price starts moving lower.
3️⃣ Bearish Confirmation
Wait for a bearish Market Structure Shift (MSS).
Once bearish structure is confirmed, identify an FVG or Order Block for a potential short entry.
4️⃣ Target Sell-Side Liquidity
Look for price to expand lower toward sell-side liquidity.
Avoid entering before confirmation.
⚠️ Important Rule – ITH Must Hold
While price is moving lower, the Intermediate-Term High (ITH) should not break.
ITH holds: Bearish continuation remains valid.
ITH breaks: The sell model is invalidated, and price may move back toward the Long-Term High (LTH).
Remember: Don't chase price. Wait for the liquidity raid, market structure shift, and a proper entry.
💬 Question: Do you use the 9:30 AM New York liquidity model in your trading? Share your thoughts below!
#ICTTradingStrategy #SmartMoneyConceptsCrypto #Marketstructure #liquidity #tradingStrategy
Learn how to identify a potential institutional sell setup after the 9:30 AM New York Open.
The idea is simple: Let price hunt buy-side liquidity, confirm bearish structure, and then look for short entries targeting sell-side liquidity.
🔍 Step-by-Step Trading Model
1️⃣ Buy-Side Liquidity Hunt
Wait for the 9:30 AM New York Open.
Watch for price to raid previous highs and take buy-side liquidity.
The highest point after this raid becomes the Long-Term High (LTH).
2️⃣ Identify Market Structure
After the LTH forms, look for an Intermediate-Term High (ITH) below it.
Short-Term Highs (STH) should develop as price starts moving lower.
3️⃣ Bearish Confirmation
Wait for a bearish Market Structure Shift (MSS).
Once bearish structure is confirmed, identify an FVG or Order Block for a potential short entry.
4️⃣ Target Sell-Side Liquidity
Look for price to expand lower toward sell-side liquidity.
Avoid entering before confirmation.
⚠️ Important Rule – ITH Must Hold
While price is moving lower, the Intermediate-Term High (ITH) should not break.
ITH holds: Bearish continuation remains valid.
ITH breaks: The sell model is invalidated, and price may move back toward the Long-Term High (LTH).
Remember: Don't chase price. Wait for the liquidity raid, market structure shift, and a proper entry.
💬 Question: Do you use the 9:30 AM New York liquidity model in your trading? Share your thoughts below!
#ICTTradingStrategy #SmartMoneyConceptsCrypto #Marketstructure #liquidity #tradingStrategy
2
286
·
--
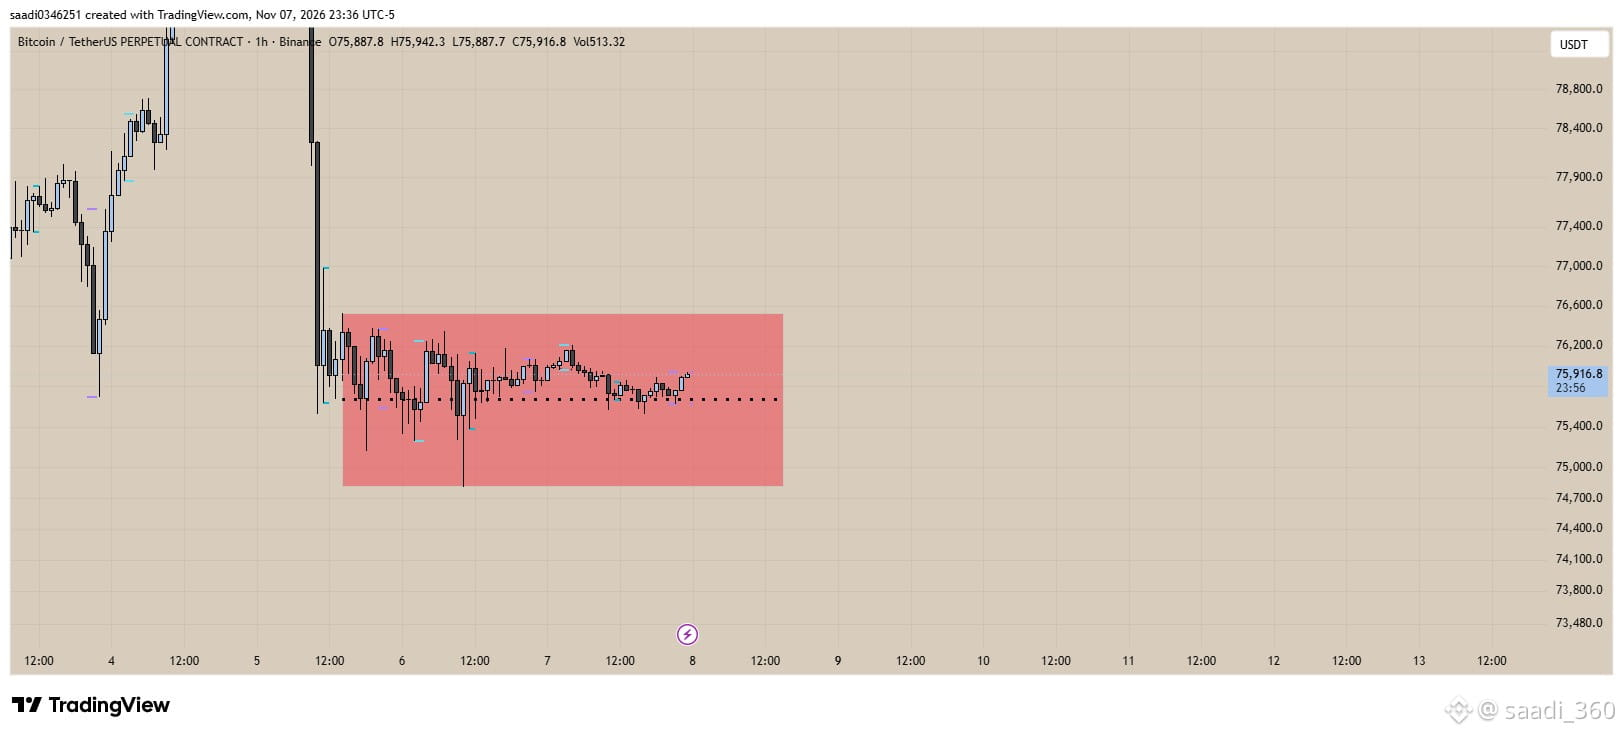
BTCUSDT | Weekend Market Update – No Trade
I avoid providing trade setups on Saturday and Sunday because the market often moves in consolidation during the weekend.
As shown in my 1H BTC chart, price has been moving inside a defined range without clear directional momentum.
Why I Avoid Weekend Trading:
Price remains trapped in consolidation.
Liquidity can be hunted in both directions.
Fake breakouts can trap retail traders.
Clear market structure and confirmation are missing.
Risk-to-reward opportunities are often not attractive.
I also avoided giving trades yesterday, and I will continue avoiding trades today.
My Trading Rule:
Don't force trades when the market offers no clear opportunity. Protecting capital is more important than taking unnecessary trades.
As I mentioned in my previous post, avoid trading inside the highlighted consolidation zone. We will wait for a clear breakout, liquidity sweep, and confirmation before looking for the next setup.
Patience is part of trading. No setup means no trade.
#BTC #bitcoin #tradingStrategy #ict #SmartMoneyConceptsCrypto
BTCUSDT | Weekend Market Update – No Trade
I avoid providing trade setups on Saturday and Sunday because the market often moves in consolidation during the weekend.
As shown in my 1H BTC chart, price has been moving inside a defined range without clear directional momentum.
Why I Avoid Weekend Trading:
Price remains trapped in consolidation.
Liquidity can be hunted in both directions.
Fake breakouts can trap retail traders.
Clear market structure and confirmation are missing.
Risk-to-reward opportunities are often not attractive.
I also avoided giving trades yesterday, and I will continue avoiding trades today.
My Trading Rule:
Don't force trades when the market offers no clear opportunity. Protecting capital is more important than taking unnecessary trades.
As I mentioned in my previous post, avoid trading inside the highlighted consolidation zone. We will wait for a clear breakout, liquidity sweep, and confirmation before looking for the next setup.
Patience is part of trading. No setup means no trade.
#BTC #bitcoin #tradingStrategy #ict #SmartMoneyConceptsCrypto
I avoid providing trade setups on Saturday and Sunday because the market often moves in consolidation during the weekend.
As shown in my 1H BTC chart, price has been moving inside a defined range without clear directional momentum.
Why I Avoid Weekend Trading:
Price remains trapped in consolidation.
Liquidity can be hunted in both directions.
Fake breakouts can trap retail traders.
Clear market structure and confirmation are missing.
Risk-to-reward opportunities are often not attractive.
I also avoided giving trades yesterday, and I will continue avoiding trades today.
My Trading Rule:
Don't force trades when the market offers no clear opportunity. Protecting capital is more important than taking unnecessary trades.
As I mentioned in my previous post, avoid trading inside the highlighted consolidation zone. We will wait for a clear breakout, liquidity sweep, and confirmation before looking for the next setup.
Patience is part of trading. No setup means no trade.
#BTC #bitcoin #tradingStrategy #ict #SmartMoneyConceptsCrypto
1
124
තවත් අන්තර්ගතයන් ගවේෂණය කිරීමට ඇතුල් වන්න
Binance චතුරශ්රය හි ගෝලීය ක්රිප්ටෝ පරිශීලකයින් හා එක්වන්න
⚡️ ක්රිප්ටෝ පිළිබඳ නවතම සහ ප්රයෝජනවත් තොරතුරු ලබා ගන්න.
💬 ලොව විශාලතම ක්රිප්ටෝ හුවමාරුව මගින් විශ්වාස කෙරේ.
👍 සත්යායනය කරන ලද නිර්මාණකරුවන්ගෙන් සැබෑ විදසුන් සොයා ගන්න.
විද්යුත් තැපෑල / දුරකථන අංකය
නැගී එන මාතෘකා
WhoWillSucceedJensenHuangatNvidia?
2 නැරඹීම්
5 සාකච්ඡා කරමින්
🚨 $PIEVERSE LONG SETUP💚
2.8R POTENTIAL
Bulls are pressing right back into the highs after a clean bounce off $1.63. 60 whales ($13.36M) and 107 smart traders ($13.57M) are heavily positioned long in profit, while 71 short whales are trapped underwater at $1.44.
Bright yellow liquidity pools between $1.77 – $1.86 are stacked right above current price, ready to fuel a squeeze through the $1.7691 high. Don't chase green candles — wait for a clean pullback into support before entering.
🟢 ENTRY: $1.6950 – $1.7150
🛑 STOP LOSS: $1.6550
🎯 TARGETS:
TP1: $1.7680
TP2: $1.8150
TP3: $1.8600
Book some profit at TP1 and move your SL to entry. Stay patient and let price come to you.
#WhoWillSucceedJensenHuangatNvidia? #WhatWillDriveCryptoandStocks’NextRebound? #USPPIMissMayEaseBTCPressure #TradFiForBeginners
HaZel_Trades
·0 කැමත්ත දැක්වීම්
·15 නැරඹීම්
WhatWillDriveCryptoandStocks’NextRebound?
252,995 නැරඹීම්
1,977 සාකච්ඡා කරමින්
USPPIMissMayEaseBTCPressure
108,011 නැරඹීම්
1,334 සාකච්ඡා කරමින්