
CryptoWithGanesh
78 පෝස්ටු

CryptoWithGanesh
වාර්තා කරන්න
පරිශීලක අවහිර කරන්න
Simple Crypto Updates BTC ETH Altcoins Visual insights Data first No hype.
විවෘත වෙළෙඳාම
අධි-සංඛ්යාත වෙළෙන්දා
{වේලාව} වසර
1.2K+ හඹා යමින්
243 හඹා යන්නන්
52 කැමති විය
පෝස්ටු
ආයෝජන කළඹ
සියල්ල
උපුටා දැක්වීම්
·
--
උසබ තත්ත්වය
Welcome to Crypto With Ganesh 🌍🤖
Hello everyone! I’m Ganesh, and this page is for simple, visual, and data-focused crypto market updates.
Here you’ll find:
📊 Quick updates on BTC, ETH, and altcoins
🤖 Cartoon-style crypto explainers
📰 Major market news in simple English
📈 Key signals like volume, sentiment, and market trends
🛡️ Risk-aware content without hype or promises
My goal is to make crypto easier to follow for everyone—whether you are new to the market or already tracking it daily.
I’ll focus on facts, visuals, and clear explanations. Crypto moves fast, so always do your own research and manage risk.
Follow the page and let’s learn through the market together.
Follow @GaneshCrypto for simple crypto updates. 🤖
What coin are you watching most right now—BTC, ETH, SOL, or another one? Comment below 👇
Crypto #Bitcoin #Ethereum #Altcoins #CryptoMarket #MarketUpdate #BinanceSquare #CryptoEducation💡🚀
Welcome to Crypto With Ganesh 🌍🤖
Hello everyone! I’m Ganesh, and this page is for simple, visual, and data-focused crypto market updates.
Here you’ll find:
📊 Quick updates on BTC, ETH, and altcoins
🤖 Cartoon-style crypto explainers
📰 Major market news in simple English
📈 Key signals like volume, sentiment, and market trends
🛡️ Risk-aware content without hype or promises
My goal is to make crypto easier to follow for everyone—whether you are new to the market or already tracking it daily.
I’ll focus on facts, visuals, and clear explanations. Crypto moves fast, so always do your own research and manage risk.
Follow the page and let’s learn through the market together.
Follow @GaneshCrypto for simple crypto updates. 🤖
What coin are you watching most right now—BTC, ETH, SOL, or another one? Comment below 👇
Crypto #Bitcoin #Ethereum #Altcoins #CryptoMarket #MarketUpdate #BinanceSquare #CryptoEducation💡🚀
Hello everyone! I’m Ganesh, and this page is for simple, visual, and data-focused crypto market updates.
Here you’ll find:
📊 Quick updates on BTC, ETH, and altcoins
🤖 Cartoon-style crypto explainers
📰 Major market news in simple English
📈 Key signals like volume, sentiment, and market trends
🛡️ Risk-aware content without hype or promises
My goal is to make crypto easier to follow for everyone—whether you are new to the market or already tracking it daily.
I’ll focus on facts, visuals, and clear explanations. Crypto moves fast, so always do your own research and manage risk.
Follow the page and let’s learn through the market together.
Follow @GaneshCrypto for simple crypto updates. 🤖
What coin are you watching most right now—BTC, ETH, SOL, or another one? Comment below 👇
Crypto #Bitcoin #Ethereum #Altcoins #CryptoMarket #MarketUpdate #BinanceSquare #CryptoEducation💡🚀
113

ලිපිය
which one🤔 asked yourselfwhich one🤔 asked yourself first and then choose one below 👇 from Three major scenarios
#fed ,#intrestratehike ,#economy ,#FOMO
A. Disinflation / softer-landing scenario
If upcoming inflation data cools while employment and consumer activity do not weaken sharply, markets may interpret it as room for less restrictive Fed policy later. That environment can support rate-sensitive small-cap shares and may weigh on inverse small-cap products such as $TZA.ETF
B. Sticky-inflation scenario
If core inflation stays elevated or re-accelerates, the Fed may keep a restrictive tone for longer. Treasury yields can remain high, financial conditions may stay tight, and smaller companies may face more pressure because refinancing costs matter more for them. This can be relatively supportive for TZA’s underlying inverse exposure, though daily moves remain volatile.
C. Growth-slowdown scenario
If jobs, consumption or credit conditions deteriorate materially, markets can initially become risk-off. Russell 2000/$IWV.ETF often reacts strongly because it has broad domestic and cyclical exposure. However, if the slowdown becomes severe enough to increase expectations of future easing, markets can reverse quickly—so the path matters, not only the final Fed decision.
Comment share with me about your point of view
Follow @GaneshCrypto for simple crypto updates.
which one🤔 asked yourself
which one🤔 asked yourself first and then choose one below 👇 from Three major scenarios
#fed ,#intrestratehike ,#economy ,#FOMO
A. Disinflation / softer-landing scenario
If upcoming inflation data cools while employment and consumer activity do not weaken sharply, markets may interpret it as room for less restrictive Fed policy later. That environment can support rate-sensitive small-cap shares and may weigh on inverse small-cap products such as $TZA.ETF
B. Sticky-inflation scenario
If core inflation stays elevated or re-accelerates, the Fed may keep a restrictive tone for longer. Treasury yields can remain high, financial conditions may stay tight, and smaller companies may face more pressure because refinancing costs matter more for them. This can be relatively supportive for TZA’s underlying inverse exposure, though daily moves remain volatile.
C. Growth-slowdown scenario
If jobs, consumption or credit conditions deteriorate materially, markets can initially become risk-off. Russell 2000/$IWV.ETF often reacts strongly because it has broad domestic and cyclical exposure. However, if the slowdown becomes severe enough to increase expectations of future easing, markets can reverse quickly—so the path matters, not only the final Fed decision.
Comment share with me about your point of view
Follow @GaneshCrypto for simple crypto updates.
#fed ,#intrestratehike ,#economy ,#FOMO
A. Disinflation / softer-landing scenario
If upcoming inflation data cools while employment and consumer activity do not weaken sharply, markets may interpret it as room for less restrictive Fed policy later. That environment can support rate-sensitive small-cap shares and may weigh on inverse small-cap products such as $TZA.ETF
B. Sticky-inflation scenario
If core inflation stays elevated or re-accelerates, the Fed may keep a restrictive tone for longer. Treasury yields can remain high, financial conditions may stay tight, and smaller companies may face more pressure because refinancing costs matter more for them. This can be relatively supportive for TZA’s underlying inverse exposure, though daily moves remain volatile.
C. Growth-slowdown scenario
If jobs, consumption or credit conditions deteriorate materially, markets can initially become risk-off. Russell 2000/$IWV.ETF often reacts strongly because it has broad domestic and cyclical exposure. However, if the slowdown becomes severe enough to increase expectations of future easing, markets can reverse quickly—so the path matters, not only the final Fed decision.
Comment share with me about your point of view
Follow @GaneshCrypto for simple crypto updates.
IWVETF+2.41%
TZAETF+0.11%
61

ලිපිය
""Fed Role play """"Fed ko balance banana hota hai: rate jaldi kam kare to inflation wapas badh sakti hai; bahut der high rakhe to growth aur jobs par pressure badh sakta hai.""
Let's understand it
Fed ka kaam economy ko na zyada garam hone dena hai, na zyada thanda। Isliye use inflation aur growth/jobs ke beech balance banana padta hai।
1) Fed ke paas main tool kya hai?
Fed ka sabse bada tool interest rate hai—specifically federal funds rate.
Is rate ka effect poori economy me dheere-dheere failta hai:
Fed rate badhata/high rakhta hai → loans mehange → spending aur borrowing slow → demand thandi → prices par pressure kam → inflation cool
Aur ulta:
Fed rate ghatata hai → loans saste → borrowing/spending badh sakti hai → demand tez → business sales aur hiring support → lekin prices fir se tez badhne ka risk
Fed ko in dono risks ko saath dekhna hota hai।
2) Inflation actually hoti kaise hai?
Inflation ka simple matlab hai: average prices time ke saath badh rahe hain।
Maan lo ek city me logon ke paas income aur credit dono achanak zyada available ho gaye। Log zyada:
cars,
homes,
travel,
restaurant services,
electronics,
business equipment
kharidne lage।
Agar supply utni tez nahi badh sakti—jaise factories, workers, houses, flights ya raw materials limited hain—businesses prices badha dete hain।
Bahut zyada demand + limited supply = inflation pressure.
Kuch inflation external shocks se bhi hoti hai, jaise oil price shock, supply-chain disruption ya food production problem। Interest rates in shocks ko seedha khatam nahi karti, lekin Fed demand ko cool karke inflation ke spread ko kam karne ki koshish karta hai।
3) Rate high rakhne se inflation kaise kam hoti hai?
A. Consumers par effect
High rates se credit-card interest, auto loan, mortgage aur personal loan ki cost badh sakti hai।
Maan lo koi family ghar kharidna chahti hai।
Lower mortgage rate par monthly installment manageable lag sakti hai।
Higher mortgage rate par wahi ghar ki monthly installment zyada ho jaati hai।
Kuch families purchase postpone kar deti hain। Housing demand dheemi hoti hai। Builders, furniture, appliances aur related services ki demand bhi relatively slow ho sakti hai।
Ye ek family ka example hai; jab lakho households aur businesses spending postpone karte hain, total demand par effect aata hai।
B. Businesses par effect
High rates par companies ke liye:
expansion loan,warehouse financing,new machinery loan,working-capital credit,old debt refinance
sab mehange ho sakte hain।
Maan lo ek small company ko nayi factory line lagane ke liye loan chahiye। Agar interest cost zyada ho, to expected profit kam lag sakta hai। Company project delay kar sakti hai, kam hiring kar sakti hai, ya expenses control kar sakti hai।
Isse economy me demand aur investment dono ki speed kam hoti hai।
C. Asset prices aur confidence par effect
Higher interest rates bonds aur savings products ka return relatively attractive bana sakte hain। Isse risky assets—jaise high-growth stocks, small caps aur crypto—ki valuations par pressure aa sakta hai।
Agar asset prices weak hon, households aur companies apni future spending me cautious ho sakte hain। Isse bhi demand cool ho sakti hai।
D. Labour market par effect
Jab companies sales aur expansion ko leke cautious hoti hain, hiring ki speed slow ho sakti hai। Job openings kam ho sakti hain, wage growth moderate ho sakti hai।
Agar wages aur demand bahut tez na badhein, service prices par pressure dheere-dheere kam ho sakta hai।
4) Fed “restrictive” kab kehlata hai?
Har economy ke liye ek approximate neutral rate hota hai—aisa rate jo na economy ko strongly stimulate kare aur na strongly slow करे। Exact neutral rate pata nahi hota; Fed ise estimates se judge karta hai।
Jab policy rate neutral level se upar hota hai aur borrowing/spending par noticeable brake lagata hai, policy ko restrictive kaha jata hai।
Iska goal punishment nahi hota। Goal hai demand ko itna cool karna ki inflation target ke paas aa sake—bina unnecessary recession ke।
5) Rate jaldi kam karne se inflation wapas kaise badh sakti hai?
Maan lo inflation 6% se girkar 3% ho gayi, lekin Fed ka target 2% hai। Agar Fed is stage par rates bahut jaldi aur bahut zyada cut kar de, to markets aur borrowers ko signal mil sakta hai ki money fir se easy ho rahi hai।
Possible chain:
Fast rate cuts → borrowing cheaper → homes/cars/business loans ki demand badhe → spending aur investment tez → companies ko prices badhane ki power mile → inflation 2% par rukne ke bajay fir se badhe
Isme ek aur factor hai: expectations।
Agar households aur businesses maan lein ki prices future me fast badhenge, to:
workers higher wages demand kar sakte hain;
companies future cost badhne ke darr se prices pehle hi badha sakti hain;
consumers purchases jaldi karne lag sakte hain।
Ye inflation ko sticky bana sakta hai। Fed isliye inflation expectations ko anchored rakhna chahta hai—yaani logon ko vishwas rahe ki medium term me inflation low aur stable rahegi।
Hypothetical example
Maan lo:
inflation 5% thi;
rate hikes ke baad inflation 3% ho gayi;
lekin rent aur services abhi bhi fast grow kar rahi hain।
Agar isi waqt rates sharply cut ho jaayen, demand fir se accelerate ho sakti hai। Result ye ho sakta hai ki inflation 2% tak aane ke bajay 3%–4% ke zone me atki rahe ya wapas badhe। Ye sirf example hai; actual outcome energy, jobs, fiscal spending aur global supply par bhi depend karega।
6) Rate bahut der high rakhne se growth aur jobs par pressure kaise aata hai?
High rates ka effect immediately nahi dikhta। Loans fixed period ke ho sakte hain, companies ke paas cash reserves ho sakte hain, aur consumers kuch time tak spend karte reh sakte hain।
Lekin time ke saath:
High rate for long → debt refinance mehenga → investment slow → sales growth slow → hiring kam → unemployment badhne ka risk → household income growth slow → spending aur slow
Agar ye cycle bahut far tak chali gayi, economy recession me ja sakti hai।
Example: Small business
Maan lo ek restaurant chain ko purana business loan renew karna hai।
Pehle uska interest cost low thi।
Renewal par rate kaafi high ho gaya।
Ab monthly interest bill badh gaya।
Company ke paas options ho sakte hain:
new outlets na kholna,renovations delay karna,hiring freeze,staff hours reduce karna,prices badhana।
Agar bahut businesses aisa karte hain, jobs aur growth dono par pressure badh sakta hai।
Example: Household
Ek household ka mortgage fixed rate par hai, isliye un par immediate effect nahi hua। Lekin unka car loan, credit card, ya naya home purchase mehenga ho gaya। Woh discretionary spending—travel, dining, electronics—reduce kar sakte hain।
Jab bahut households spending cut karte hain, businesses ki sales kam ho sakti hain। Businesses hiring/investment cut karte hain। Isse jobs par pressure aa sakta hai।
7) Fed ka “balance” exactly kya hai?
Fed ek single number nahi dekhta। Woh bahut data dekhta hai, jaise:
Inflation dataHeadline PCE: overall inflationCore PCE: food aur energy hata kar underlying inflationCPI: consumer prices ka early and widely watched signalrent, services, wages, goods aur energy ke price trendsJobs dataunemployment ratemonthly job creationjob openingswage growthlayoffsweekly unemployment claimsGrowth dataconsumer spendingretail salesGDPmanufacturing and services activityhousing marketbusiness investmentFinancial conditionsTreasury yieldsmortgage and corporate borrowing costsdollar strengthbank lending standardscredit spreadsstock-market and broader risk sentiment
Fed in sabko dekhkar estimate karta hai ki current policy:
inflation ko enough cool kar rahi hai ya nahi;
economy ko unnecessary damage to nahi de rahi;
inflation future me target ke paas sustainably ja sakti hai ya nahi।
8) Fed ke saamne common scenarios
Scenario 1: Inflation high, jobs strong
Agar prices fast badh rahi hain aur jobs market strong hai, Fed inflation ko priority de sakta hai। Rates high reh sakti hain, ya policy aur tight ho sakti hai।
Reason: strong demand inflation ko sustain kar sakti hai।
Scenario 2: Inflation neeche aa rahi hai, jobs stable hain
Ye relatively favorable setup hota hai।
Fed wait karke dekhta hai ki disinflation sustainable hai ya nahi। Agar inflation target ki taraf consistently badh rahi ho aur jobs weak na ho, to policy future me gradually less restrictive ho sakti hai।
Scenario 3: Inflation high, growth/jobs weak
Ye difficult case hai, jise kabhi-kabhi stagflation-type pressure kaha jata hai।
Fed ke paas easy answer nahi hota:
rate high rakhe to jobs/growth aur hurt ho sakte hain;
rate jaldi cut kare to inflation control mushkil ho sakta hai।
Isliye Fed usually data trend, inflation expectations aur slowdown ki severity ko closely dekhta hai।
Scenario 4: Inflation near target, jobs quickly weak
Agar inflation enough cool ho aur unemployment/firing trend sharply worsen ho, Fed growth and employment risks ko zyada weight de sakta hai। Policy easing ki probability badh sakti hai।
9) “Lag effect” kyun important hai?
Fed aaj rate change kare, uska full effect kal nahi aata।
Roughly:
financial markets often react immediately;
new mortgage/loan rates relatively quickly adjust ho sakte hain;
household spending and business investment ka effect months me build hota hai;
inflation aur labour market par broader impact aur zyada time le sakta hai।
Isliye Fed ko future-looking hona padta hai। Sirf aaj ke inflation number par reaction dena risky ho sakta hai, kyunki current policy ka full impact abhi economy me baaki ho sakta hai।
10) Ek full simplified story
Maan lo economy me demand bahut fast chal rahi hai:
Jobs strong hain, wages badh rahi hain, log spending kar rahe hain।
Businesses ke paas customers zyada hain; woh prices badha dete hain।
Inflation 2% se upar chali jaati hai।
Fed rates high karta hai।
Loans aur mortgages mehange hote hain।
Households aur businesses kuch purchases/investments postpone karte hain।
Demand gradual slow hoti hai।
Businesses ko prices utni fast badhana mushkil hota hai।
Inflation cool hoti hai।
Lekin agar Fed step 4 me itna zyada ya itne lambe time tak tight rahe ki steps 5–7 bahut strongly ho jaayen, to:
business revenue weak ho sakta hai,
hiring kam ho sakti hai,
layoffs badh sakte hain,
growth sharply slow ho sakti hai।
Aur agar Fed inflation cool hote hi policy ko bahut jaldi loose kar de, to steps 1–3 dobara start hone ka risk hota hai।
{future}(IWMUSDT)
Isi ko Fed ka balance kehte hain: inflation ko 2% ke paas lana, lekin economy aur jobs ko unnecessarily crash ki taraf na dhakelna।
{etf_us}(IWS.ETF)
11) Russell 2000, TZA aur crypto se connection
Russell 2000 / small caps
Small-cap companies aksar:
borrowing cost ke liye zyada sensitive hoti hain;
domestic US demand par zyada depend karti hain;
refinancing risk zyada face kar sakti hain।
Isliye high-for-long rate environment small caps par pressure daal sakta hai। Agar financial conditions ease hoti hain, to small caps ka sentiment improve ho sakta hai—but actual outcome earnings, credit conditions aur growth data par depend karta hai।
TZA
TZA Russell 2000 ki daily inverse leveraged exposure dene ka target rakhta hai। Agar Russell 2000 weak ho, TZA daily basis par opposite direction me move karne ki koshish kar sakta hai। Lekin ye daily-reset structure wala product hai; multi-day performance simple inverse multiple jaisa hona zaroori nahi।
Crypto
Fed policy crypto ko mainly:
global liquidity,
US dollar,
Treasury yields,
risk appetite
ke through impact karti hai। Tighter conditions risk assets ke liye headwind ban sakti hain, lekin crypto ki move sirf Fed par depend nahi karti—adoption, regulation, flows, token-specific news aur market positioning bhi important hain।
{future}(TMFUSDT)
Short me: Fed inflation ko control karne ke liye demand par brake lagata hai, lekin brake itna hard ya itne lambe time tak nahi lagana chahta ki economy aur jobs ko unnecessary nuksan ho।
If you are clear out or understand this concept or old mis conception about fed
Follow @GaneshCrypto for simple crypto updates.
#Fed ,#FOMC ,#Concept: ,#Misconception
""Fed Role play ""
""Fed ko balance banana hota hai: rate jaldi kam kare to inflation wapas badh sakti hai; bahut der high rakhe to growth aur jobs par pressure badh sakta hai.""
Let's understand it
Fed ka kaam economy ko na zyada garam hone dena hai, na zyada thanda। Isliye use inflation aur growth/jobs ke beech balance banana padta hai।
1) Fed ke paas main tool kya hai?
Fed ka sabse bada tool interest rate hai—specifically federal funds rate.
Is rate ka effect poori economy me dheere-dheere failta hai:
Fed rate badhata/high rakhta hai → loans mehange → spending aur borrowing slow → demand thandi → prices par pressure kam → inflation cool
Aur ulta:
Fed rate ghatata hai → loans saste → borrowing/spending badh sakti hai → demand tez → business sales aur hiring support → lekin prices fir se tez badhne ka risk
Fed ko in dono risks ko saath dekhna hota hai।
2) Inflation actually hoti kaise hai?
Inflation ka simple matlab hai: average prices time ke saath badh rahe hain।
Maan lo ek city me logon ke paas income aur credit dono achanak zyada available ho gaye। Log zyada:
cars,
homes,
travel,
restaurant services,
electronics,
business equipment
kharidne lage।
Agar supply utni tez nahi badh sakti—jaise factories, workers, houses, flights ya raw materials limited hain—businesses prices badha dete hain।
Bahut zyada demand + limited supply = inflation pressure.
Kuch inflation external shocks se bhi hoti hai, jaise oil price shock, supply-chain disruption ya food production problem। Interest rates in shocks ko seedha khatam nahi karti, lekin Fed demand ko cool karke inflation ke spread ko kam karne ki koshish karta hai।
3) Rate high rakhne se inflation kaise kam hoti hai?
A. Consumers par effect
High rates se credit-card interest, auto loan, mortgage aur personal loan ki cost badh sakti hai।
Maan lo koi family ghar kharidna chahti hai।
Lower mortgage rate par monthly installment manageable lag sakti hai।
Higher mortgage rate par wahi ghar ki monthly installment zyada ho jaati hai।
Kuch families purchase postpone kar deti hain। Housing demand dheemi hoti hai। Builders, furniture, appliances aur related services ki demand bhi relatively slow ho sakti hai।
Ye ek family ka example hai; jab lakho households aur businesses spending postpone karte hain, total demand par effect aata hai।
B. Businesses par effect
High rates par companies ke liye:
expansion loan,warehouse financing,new machinery loan,working-capital credit,old debt refinance
sab mehange ho sakte hain।
Maan lo ek small company ko nayi factory line lagane ke liye loan chahiye। Agar interest cost zyada ho, to expected profit kam lag sakta hai। Company project delay kar sakti hai, kam hiring kar sakti hai, ya expenses control kar sakti hai।
Isse economy me demand aur investment dono ki speed kam hoti hai।
C. Asset prices aur confidence par effect
Higher interest rates bonds aur savings products ka return relatively attractive bana sakte hain। Isse risky assets—jaise high-growth stocks, small caps aur crypto—ki valuations par pressure aa sakta hai।
Agar asset prices weak hon, households aur companies apni future spending me cautious ho sakte hain। Isse bhi demand cool ho sakti hai।
D. Labour market par effect
Jab companies sales aur expansion ko leke cautious hoti hain, hiring ki speed slow ho sakti hai। Job openings kam ho sakti hain, wage growth moderate ho sakti hai।
Agar wages aur demand bahut tez na badhein, service prices par pressure dheere-dheere kam ho sakta hai।
4) Fed “restrictive” kab kehlata hai?
Har economy ke liye ek approximate neutral rate hota hai—aisa rate jo na economy ko strongly stimulate kare aur na strongly slow करे। Exact neutral rate pata nahi hota; Fed ise estimates se judge karta hai।
Jab policy rate neutral level se upar hota hai aur borrowing/spending par noticeable brake lagata hai, policy ko restrictive kaha jata hai।
Iska goal punishment nahi hota। Goal hai demand ko itna cool karna ki inflation target ke paas aa sake—bina unnecessary recession ke।
5) Rate jaldi kam karne se inflation wapas kaise badh sakti hai?
Maan lo inflation 6% se girkar 3% ho gayi, lekin Fed ka target 2% hai। Agar Fed is stage par rates bahut jaldi aur bahut zyada cut kar de, to markets aur borrowers ko signal mil sakta hai ki money fir se easy ho rahi hai।
Possible chain:
Fast rate cuts → borrowing cheaper → homes/cars/business loans ki demand badhe → spending aur investment tez → companies ko prices badhane ki power mile → inflation 2% par rukne ke bajay fir se badhe
Isme ek aur factor hai: expectations।
Agar households aur businesses maan lein ki prices future me fast badhenge, to:
workers higher wages demand kar sakte hain;
companies future cost badhne ke darr se prices pehle hi badha sakti hain;
consumers purchases jaldi karne lag sakte hain।
Ye inflation ko sticky bana sakta hai। Fed isliye inflation expectations ko anchored rakhna chahta hai—yaani logon ko vishwas rahe ki medium term me inflation low aur stable rahegi।
Hypothetical example
Maan lo:
inflation 5% thi;
rate hikes ke baad inflation 3% ho gayi;
lekin rent aur services abhi bhi fast grow kar rahi hain।
Agar isi waqt rates sharply cut ho jaayen, demand fir se accelerate ho sakti hai। Result ye ho sakta hai ki inflation 2% tak aane ke bajay 3%–4% ke zone me atki rahe ya wapas badhe। Ye sirf example hai; actual outcome energy, jobs, fiscal spending aur global supply par bhi depend karega।
6) Rate bahut der high rakhne se growth aur jobs par pressure kaise aata hai?
High rates ka effect immediately nahi dikhta। Loans fixed period ke ho sakte hain, companies ke paas cash reserves ho sakte hain, aur consumers kuch time tak spend karte reh sakte hain।
Lekin time ke saath:
High rate for long → debt refinance mehenga → investment slow → sales growth slow → hiring kam → unemployment badhne ka risk → household income growth slow → spending aur slow
Agar ye cycle bahut far tak chali gayi, economy recession me ja sakti hai।
Example: Small business
Maan lo ek restaurant chain ko purana business loan renew karna hai।
Pehle uska interest cost low thi।
Renewal par rate kaafi high ho gaya।
Ab monthly interest bill badh gaya।
Company ke paas options ho sakte hain:
new outlets na kholna,renovations delay karna,hiring freeze,staff hours reduce karna,prices badhana।
Agar bahut businesses aisa karte hain, jobs aur growth dono par pressure badh sakta hai।
Example: Household
Ek household ka mortgage fixed rate par hai, isliye un par immediate effect nahi hua। Lekin unka car loan, credit card, ya naya home purchase mehenga ho gaya। Woh discretionary spending—travel, dining, electronics—reduce kar sakte hain।
Jab bahut households spending cut karte hain, businesses ki sales kam ho sakti hain। Businesses hiring/investment cut karte hain। Isse jobs par pressure aa sakta hai।
7) Fed ka “balance” exactly kya hai?
Fed ek single number nahi dekhta। Woh bahut data dekhta hai, jaise:
Inflation dataHeadline PCE: overall inflationCore PCE: food aur energy hata kar underlying inflationCPI: consumer prices ka early and widely watched signalrent, services, wages, goods aur energy ke price trendsJobs dataunemployment ratemonthly job creationjob openingswage growthlayoffsweekly unemployment claimsGrowth dataconsumer spendingretail salesGDPmanufacturing and services activityhousing marketbusiness investmentFinancial conditionsTreasury yieldsmortgage and corporate borrowing costsdollar strengthbank lending standardscredit spreadsstock-market and broader risk sentiment
Fed in sabko dekhkar estimate karta hai ki current policy:
inflation ko enough cool kar rahi hai ya nahi;
economy ko unnecessary damage to nahi de rahi;
inflation future me target ke paas sustainably ja sakti hai ya nahi।
8) Fed ke saamne common scenarios
Scenario 1: Inflation high, jobs strong
Agar prices fast badh rahi hain aur jobs market strong hai, Fed inflation ko priority de sakta hai। Rates high reh sakti hain, ya policy aur tight ho sakti hai।
Reason: strong demand inflation ko sustain kar sakti hai।
Scenario 2: Inflation neeche aa rahi hai, jobs stable hain
Ye relatively favorable setup hota hai।
Fed wait karke dekhta hai ki disinflation sustainable hai ya nahi। Agar inflation target ki taraf consistently badh rahi ho aur jobs weak na ho, to policy future me gradually less restrictive ho sakti hai।
Scenario 3: Inflation high, growth/jobs weak
Ye difficult case hai, jise kabhi-kabhi stagflation-type pressure kaha jata hai।
Fed ke paas easy answer nahi hota:
rate high rakhe to jobs/growth aur hurt ho sakte hain;
rate jaldi cut kare to inflation control mushkil ho sakta hai।
Isliye Fed usually data trend, inflation expectations aur slowdown ki severity ko closely dekhta hai।
Scenario 4: Inflation near target, jobs quickly weak
Agar inflation enough cool ho aur unemployment/firing trend sharply worsen ho, Fed growth and employment risks ko zyada weight de sakta hai। Policy easing ki probability badh sakti hai।
9) “Lag effect” kyun important hai?
Fed aaj rate change kare, uska full effect kal nahi aata।
Roughly:
financial markets often react immediately;
new mortgage/loan rates relatively quickly adjust ho sakte hain;
household spending and business investment ka effect months me build hota hai;
inflation aur labour market par broader impact aur zyada time le sakta hai।
Isliye Fed ko future-looking hona padta hai। Sirf aaj ke inflation number par reaction dena risky ho sakta hai, kyunki current policy ka full impact abhi economy me baaki ho sakta hai।
10) Ek full simplified story
Maan lo economy me demand bahut fast chal rahi hai:
Jobs strong hain, wages badh rahi hain, log spending kar rahe hain।
Businesses ke paas customers zyada hain; woh prices badha dete hain।
Inflation 2% se upar chali jaati hai।
Fed rates high karta hai।
Loans aur mortgages mehange hote hain।
Households aur businesses kuch purchases/investments postpone karte hain।
Demand gradual slow hoti hai।
Businesses ko prices utni fast badhana mushkil hota hai।
Inflation cool hoti hai।
Lekin agar Fed step 4 me itna zyada ya itne lambe time tak tight rahe ki steps 5–7 bahut strongly ho jaayen, to:
business revenue weak ho sakta hai,
hiring kam ho sakti hai,
layoffs badh sakte hain,
growth sharply slow ho sakti hai।
Aur agar Fed inflation cool hote hi policy ko bahut jaldi loose kar de, to steps 1–3 dobara start hone ka risk hota hai।
Isi ko Fed ka balance kehte hain: inflation ko 2% ke paas lana, lekin economy aur jobs ko unnecessarily crash ki taraf na dhakelna।
11) Russell 2000, TZA aur crypto se connection
Russell 2000 / small caps
Small-cap companies aksar:
borrowing cost ke liye zyada sensitive hoti hain;
domestic US demand par zyada depend karti hain;
refinancing risk zyada face kar sakti hain।
Isliye high-for-long rate environment small caps par pressure daal sakta hai। Agar financial conditions ease hoti hain, to small caps ka sentiment improve ho sakta hai—but actual outcome earnings, credit conditions aur growth data par depend karta hai।
TZA
TZA Russell 2000 ki daily inverse leveraged exposure dene ka target rakhta hai। Agar Russell 2000 weak ho, TZA daily basis par opposite direction me move karne ki koshish kar sakta hai। Lekin ye daily-reset structure wala product hai; multi-day performance simple inverse multiple jaisa hona zaroori nahi।
Crypto
Fed policy crypto ko mainly:
global liquidity,
US dollar,
Treasury yields,
risk appetite
ke through impact karti hai। Tighter conditions risk assets ke liye headwind ban sakti hain, lekin crypto ki move sirf Fed par depend nahi karti—adoption, regulation, flows, token-specific news aur market positioning bhi important hain।
Short me: Fed inflation ko control karne ke liye demand par brake lagata hai, lekin brake itna hard ya itne lambe time tak nahi lagana chahta ki economy aur jobs ko unnecessary nuksan ho।
If you are clear out or understand this concept or old mis conception about fed
Follow @GaneshCrypto for simple crypto updates.
#Fed ,#FOMC ,#Concept: ,#Misconception
Let's understand it
Fed ka kaam economy ko na zyada garam hone dena hai, na zyada thanda। Isliye use inflation aur growth/jobs ke beech balance banana padta hai।
1) Fed ke paas main tool kya hai?
Fed ka sabse bada tool interest rate hai—specifically federal funds rate.
Is rate ka effect poori economy me dheere-dheere failta hai:
Fed rate badhata/high rakhta hai → loans mehange → spending aur borrowing slow → demand thandi → prices par pressure kam → inflation cool
Aur ulta:
Fed rate ghatata hai → loans saste → borrowing/spending badh sakti hai → demand tez → business sales aur hiring support → lekin prices fir se tez badhne ka risk
Fed ko in dono risks ko saath dekhna hota hai।
2) Inflation actually hoti kaise hai?
Inflation ka simple matlab hai: average prices time ke saath badh rahe hain।
Maan lo ek city me logon ke paas income aur credit dono achanak zyada available ho gaye। Log zyada:
cars,
homes,
travel,
restaurant services,
electronics,
business equipment
kharidne lage।
Agar supply utni tez nahi badh sakti—jaise factories, workers, houses, flights ya raw materials limited hain—businesses prices badha dete hain।
Bahut zyada demand + limited supply = inflation pressure.
Kuch inflation external shocks se bhi hoti hai, jaise oil price shock, supply-chain disruption ya food production problem। Interest rates in shocks ko seedha khatam nahi karti, lekin Fed demand ko cool karke inflation ke spread ko kam karne ki koshish karta hai।
3) Rate high rakhne se inflation kaise kam hoti hai?
A. Consumers par effect
High rates se credit-card interest, auto loan, mortgage aur personal loan ki cost badh sakti hai।
Maan lo koi family ghar kharidna chahti hai।
Lower mortgage rate par monthly installment manageable lag sakti hai।
Higher mortgage rate par wahi ghar ki monthly installment zyada ho jaati hai।
Kuch families purchase postpone kar deti hain। Housing demand dheemi hoti hai। Builders, furniture, appliances aur related services ki demand bhi relatively slow ho sakti hai।
Ye ek family ka example hai; jab lakho households aur businesses spending postpone karte hain, total demand par effect aata hai।
B. Businesses par effect
High rates par companies ke liye:
expansion loan,warehouse financing,new machinery loan,working-capital credit,old debt refinance
sab mehange ho sakte hain।
Maan lo ek small company ko nayi factory line lagane ke liye loan chahiye। Agar interest cost zyada ho, to expected profit kam lag sakta hai। Company project delay kar sakti hai, kam hiring kar sakti hai, ya expenses control kar sakti hai।
Isse economy me demand aur investment dono ki speed kam hoti hai।
C. Asset prices aur confidence par effect
Higher interest rates bonds aur savings products ka return relatively attractive bana sakte hain। Isse risky assets—jaise high-growth stocks, small caps aur crypto—ki valuations par pressure aa sakta hai।
Agar asset prices weak hon, households aur companies apni future spending me cautious ho sakte hain। Isse bhi demand cool ho sakti hai।
D. Labour market par effect
Jab companies sales aur expansion ko leke cautious hoti hain, hiring ki speed slow ho sakti hai। Job openings kam ho sakti hain, wage growth moderate ho sakti hai।
Agar wages aur demand bahut tez na badhein, service prices par pressure dheere-dheere kam ho sakta hai।
4) Fed “restrictive” kab kehlata hai?
Har economy ke liye ek approximate neutral rate hota hai—aisa rate jo na economy ko strongly stimulate kare aur na strongly slow करे। Exact neutral rate pata nahi hota; Fed ise estimates se judge karta hai।
Jab policy rate neutral level se upar hota hai aur borrowing/spending par noticeable brake lagata hai, policy ko restrictive kaha jata hai।
Iska goal punishment nahi hota। Goal hai demand ko itna cool karna ki inflation target ke paas aa sake—bina unnecessary recession ke।
5) Rate jaldi kam karne se inflation wapas kaise badh sakti hai?
Maan lo inflation 6% se girkar 3% ho gayi, lekin Fed ka target 2% hai। Agar Fed is stage par rates bahut jaldi aur bahut zyada cut kar de, to markets aur borrowers ko signal mil sakta hai ki money fir se easy ho rahi hai।
Possible chain:
Fast rate cuts → borrowing cheaper → homes/cars/business loans ki demand badhe → spending aur investment tez → companies ko prices badhane ki power mile → inflation 2% par rukne ke bajay fir se badhe
Isme ek aur factor hai: expectations।
Agar households aur businesses maan lein ki prices future me fast badhenge, to:
workers higher wages demand kar sakte hain;
companies future cost badhne ke darr se prices pehle hi badha sakti hain;
consumers purchases jaldi karne lag sakte hain।
Ye inflation ko sticky bana sakta hai। Fed isliye inflation expectations ko anchored rakhna chahta hai—yaani logon ko vishwas rahe ki medium term me inflation low aur stable rahegi।
Hypothetical example
Maan lo:
inflation 5% thi;
rate hikes ke baad inflation 3% ho gayi;
lekin rent aur services abhi bhi fast grow kar rahi hain।
Agar isi waqt rates sharply cut ho jaayen, demand fir se accelerate ho sakti hai। Result ye ho sakta hai ki inflation 2% tak aane ke bajay 3%–4% ke zone me atki rahe ya wapas badhe। Ye sirf example hai; actual outcome energy, jobs, fiscal spending aur global supply par bhi depend karega।
6) Rate bahut der high rakhne se growth aur jobs par pressure kaise aata hai?
High rates ka effect immediately nahi dikhta। Loans fixed period ke ho sakte hain, companies ke paas cash reserves ho sakte hain, aur consumers kuch time tak spend karte reh sakte hain।
Lekin time ke saath:
High rate for long → debt refinance mehenga → investment slow → sales growth slow → hiring kam → unemployment badhne ka risk → household income growth slow → spending aur slow
Agar ye cycle bahut far tak chali gayi, economy recession me ja sakti hai।
Example: Small business
Maan lo ek restaurant chain ko purana business loan renew karna hai।
Pehle uska interest cost low thi।
Renewal par rate kaafi high ho gaya।
Ab monthly interest bill badh gaya।
Company ke paas options ho sakte hain:
new outlets na kholna,renovations delay karna,hiring freeze,staff hours reduce karna,prices badhana।
Agar bahut businesses aisa karte hain, jobs aur growth dono par pressure badh sakta hai।
Example: Household
Ek household ka mortgage fixed rate par hai, isliye un par immediate effect nahi hua। Lekin unka car loan, credit card, ya naya home purchase mehenga ho gaya। Woh discretionary spending—travel, dining, electronics—reduce kar sakte hain।
Jab bahut households spending cut karte hain, businesses ki sales kam ho sakti hain। Businesses hiring/investment cut karte hain। Isse jobs par pressure aa sakta hai।
7) Fed ka “balance” exactly kya hai?
Fed ek single number nahi dekhta। Woh bahut data dekhta hai, jaise:
Inflation dataHeadline PCE: overall inflationCore PCE: food aur energy hata kar underlying inflationCPI: consumer prices ka early and widely watched signalrent, services, wages, goods aur energy ke price trendsJobs dataunemployment ratemonthly job creationjob openingswage growthlayoffsweekly unemployment claimsGrowth dataconsumer spendingretail salesGDPmanufacturing and services activityhousing marketbusiness investmentFinancial conditionsTreasury yieldsmortgage and corporate borrowing costsdollar strengthbank lending standardscredit spreadsstock-market and broader risk sentiment
Fed in sabko dekhkar estimate karta hai ki current policy:
inflation ko enough cool kar rahi hai ya nahi;
economy ko unnecessary damage to nahi de rahi;
inflation future me target ke paas sustainably ja sakti hai ya nahi।
8) Fed ke saamne common scenarios
Scenario 1: Inflation high, jobs strong
Agar prices fast badh rahi hain aur jobs market strong hai, Fed inflation ko priority de sakta hai। Rates high reh sakti hain, ya policy aur tight ho sakti hai।
Reason: strong demand inflation ko sustain kar sakti hai।
Scenario 2: Inflation neeche aa rahi hai, jobs stable hain
Ye relatively favorable setup hota hai।
Fed wait karke dekhta hai ki disinflation sustainable hai ya nahi। Agar inflation target ki taraf consistently badh rahi ho aur jobs weak na ho, to policy future me gradually less restrictive ho sakti hai।
Scenario 3: Inflation high, growth/jobs weak
Ye difficult case hai, jise kabhi-kabhi stagflation-type pressure kaha jata hai।
Fed ke paas easy answer nahi hota:
rate high rakhe to jobs/growth aur hurt ho sakte hain;
rate jaldi cut kare to inflation control mushkil ho sakta hai।
Isliye Fed usually data trend, inflation expectations aur slowdown ki severity ko closely dekhta hai।
Scenario 4: Inflation near target, jobs quickly weak
Agar inflation enough cool ho aur unemployment/firing trend sharply worsen ho, Fed growth and employment risks ko zyada weight de sakta hai। Policy easing ki probability badh sakti hai।
9) “Lag effect” kyun important hai?
Fed aaj rate change kare, uska full effect kal nahi aata।
Roughly:
financial markets often react immediately;
new mortgage/loan rates relatively quickly adjust ho sakte hain;
household spending and business investment ka effect months me build hota hai;
inflation aur labour market par broader impact aur zyada time le sakta hai।
Isliye Fed ko future-looking hona padta hai। Sirf aaj ke inflation number par reaction dena risky ho sakta hai, kyunki current policy ka full impact abhi economy me baaki ho sakta hai।
10) Ek full simplified story
Maan lo economy me demand bahut fast chal rahi hai:
Jobs strong hain, wages badh rahi hain, log spending kar rahe hain।
Businesses ke paas customers zyada hain; woh prices badha dete hain।
Inflation 2% se upar chali jaati hai।
Fed rates high karta hai।
Loans aur mortgages mehange hote hain।
Households aur businesses kuch purchases/investments postpone karte hain।
Demand gradual slow hoti hai।
Businesses ko prices utni fast badhana mushkil hota hai।
Inflation cool hoti hai।
Lekin agar Fed step 4 me itna zyada ya itne lambe time tak tight rahe ki steps 5–7 bahut strongly ho jaayen, to:
business revenue weak ho sakta hai,
hiring kam ho sakti hai,
layoffs badh sakte hain,
growth sharply slow ho sakti hai।
Aur agar Fed inflation cool hote hi policy ko bahut jaldi loose kar de, to steps 1–3 dobara start hone ka risk hota hai।
Isi ko Fed ka balance kehte hain: inflation ko 2% ke paas lana, lekin economy aur jobs ko unnecessarily crash ki taraf na dhakelna।
11) Russell 2000, TZA aur crypto se connection
Russell 2000 / small caps
Small-cap companies aksar:
borrowing cost ke liye zyada sensitive hoti hain;
domestic US demand par zyada depend karti hain;
refinancing risk zyada face kar sakti hain।
Isliye high-for-long rate environment small caps par pressure daal sakta hai। Agar financial conditions ease hoti hain, to small caps ka sentiment improve ho sakta hai—but actual outcome earnings, credit conditions aur growth data par depend karta hai।
TZA
TZA Russell 2000 ki daily inverse leveraged exposure dene ka target rakhta hai। Agar Russell 2000 weak ho, TZA daily basis par opposite direction me move karne ki koshish kar sakta hai। Lekin ye daily-reset structure wala product hai; multi-day performance simple inverse multiple jaisa hona zaroori nahi।
Crypto
Fed policy crypto ko mainly:
global liquidity,
US dollar,
Treasury yields,
risk appetite
ke through impact karti hai। Tighter conditions risk assets ke liye headwind ban sakti hain, lekin crypto ki move sirf Fed par depend nahi karti—adoption, regulation, flows, token-specific news aur market positioning bhi important hain।
Short me: Fed inflation ko control karne ke liye demand par brake lagata hai, lekin brake itna hard ya itne lambe time tak nahi lagana chahta ki economy aur jobs ko unnecessary nuksan ho।
If you are clear out or understand this concept or old mis conception about fed
Follow @GaneshCrypto for simple crypto updates.
#Fed ,#FOMC ,#Concept: ,#Misconception
1
74
ලිපිය
How Do High Interest Rates Reduce Inflation?How Do High Interest Rates Reduce Inflation?
When a central bank keeps interest rates high, borrowing becomes more expensive. That may sound technical—but it affects everyday life, from buying a home to running a business.
A. Impact on Consumers
Higher rates can raise the cost of:
Credit-card borrowing Auto loans Home loans / mortgages Personal loans
Imagine a family planning to buy a house.
With a lower mortgage rate, the monthly installment may feel affordable. But when mortgage rates rise, the installment for the same house becomes much higher.
As a result, some families delay buying a home.
When this happens across millions of households:
Housing demand slows
Demand for furniture, appliances, interiors, and related services may soften
Overall consumer spending becomes more cautious
Less demand means businesses find it harder to keep increasing prices. Over time, this can help bring inflation under control.
B. Impact on Businesses
High interest rates also make borrowing more costly for companies. Expenses can rise for:
Expansion loans Warehouse financing New machinery and equipment Working-capital credit Refinancing older debt
Because funding becomes expensive, some businesses postpone expansion, hiring, inventory purchases, or major investments.
This can reduce overall demand in the economy—and when demand cools, price pressure may also ease.
The Simple Idea
High interest rates do not reduce inflation overnight.
They work by making borrowing and spending slower, which cools excess demand in the economy.
However, there is a trade-off: if rates stay too high for too long, growth, jobs, and business activity can also be affected.
In one line:
Higher rates → Costlier borrowing → Lower spending and investment → Slower demand → Lower inflation pressure.
Follow @GaneshCrypto for simple crypto updates.
#fed ,#infilation ,#EconomicAlert ,#EconomicInsight
{future}(TMFUSDT)
{future}(TQQQUSDT)
{future}(TZAUSDT)
How Do High Interest Rates Reduce Inflation?
How Do High Interest Rates Reduce Inflation?
When a central bank keeps interest rates high, borrowing becomes more expensive. That may sound technical—but it affects everyday life, from buying a home to running a business.
A. Impact on Consumers
Higher rates can raise the cost of:
Credit-card borrowing Auto loans Home loans / mortgages Personal loans
Imagine a family planning to buy a house.
With a lower mortgage rate, the monthly installment may feel affordable. But when mortgage rates rise, the installment for the same house becomes much higher.
As a result, some families delay buying a home.
When this happens across millions of households:
Housing demand slows
Demand for furniture, appliances, interiors, and related services may soften
Overall consumer spending becomes more cautious
Less demand means businesses find it harder to keep increasing prices. Over time, this can help bring inflation under control.
B. Impact on Businesses
High interest rates also make borrowing more costly for companies. Expenses can rise for:
Expansion loans Warehouse financing New machinery and equipment Working-capital credit Refinancing older debt
Because funding becomes expensive, some businesses postpone expansion, hiring, inventory purchases, or major investments.
This can reduce overall demand in the economy—and when demand cools, price pressure may also ease.
The Simple Idea
High interest rates do not reduce inflation overnight.
They work by making borrowing and spending slower, which cools excess demand in the economy.
However, there is a trade-off: if rates stay too high for too long, growth, jobs, and business activity can also be affected.
In one line:
Higher rates → Costlier borrowing → Lower spending and investment → Slower demand → Lower inflation pressure.
Follow @GaneshCrypto for simple crypto updates.
#fed ,#infilation ,#EconomicAlert ,#EconomicInsight
When a central bank keeps interest rates high, borrowing becomes more expensive. That may sound technical—but it affects everyday life, from buying a home to running a business.
A. Impact on Consumers
Higher rates can raise the cost of:
Credit-card borrowing Auto loans Home loans / mortgages Personal loans
Imagine a family planning to buy a house.
With a lower mortgage rate, the monthly installment may feel affordable. But when mortgage rates rise, the installment for the same house becomes much higher.
As a result, some families delay buying a home.
When this happens across millions of households:
Housing demand slows
Demand for furniture, appliances, interiors, and related services may soften
Overall consumer spending becomes more cautious
Less demand means businesses find it harder to keep increasing prices. Over time, this can help bring inflation under control.
B. Impact on Businesses
High interest rates also make borrowing more costly for companies. Expenses can rise for:
Expansion loans Warehouse financing New machinery and equipment Working-capital credit Refinancing older debt
Because funding becomes expensive, some businesses postpone expansion, hiring, inventory purchases, or major investments.
This can reduce overall demand in the economy—and when demand cools, price pressure may also ease.
The Simple Idea
High interest rates do not reduce inflation overnight.
They work by making borrowing and spending slower, which cools excess demand in the economy.
However, there is a trade-off: if rates stay too high for too long, growth, jobs, and business activity can also be affected.
In one line:
Higher rates → Costlier borrowing → Lower spending and investment → Slower demand → Lower inflation pressure.
Follow @GaneshCrypto for simple crypto updates.
#fed ,#infilation ,#EconomicAlert ,#EconomicInsight
1
44
A: Disinflation/softer-landing
B: Sticky-inflation scenario
C: Growth-slowdown scenario
Please vote with choose one!
6 දින ඉතිරිව ඇත
BTC-0.46%
TZAETF+0.11%
1
208

ලිපිය
“Policy rate restrictive”#FOMC ,#FedInterestRate
{future}(TMFUSDT)
{spot}(BTCUSDT)
“Policy rate restrictive” ka matlab: Fed ki interest rate itni high hai ki loan lena aur spending karna mehenga padta hai, jisse inflation ko thanda karne ki koshish hoti hai.
September PCE 3.60% aur core PCE 3.10% ka matlab: prices abhi bhi pichhle saal se zyada hain aur inflation Fed ke 2% target se upar hai.
Fed ko balance banana hota hai: rate jaldi kam kare to inflation wapas badh sakti hai; bahut der high rakhe to growth aur jobs par pressure badh sakta hai.
Is statement ka simple meaning hai: US mein mehngai abhi poori tarah control nahi hui hai, isliye Fed interest rates ko relatively high rakh raha hai. High rates economy ki speed ko slow karti hain, taaki prices itni tez na badhein.
1) Policy rate kya hota hai?
Policy rate Fed ki benchmark interest rate hoti hai. Banks ek-doosre ko short-term paise kis cost par lend karte hain, us par iska asar hota hai. Phir yahi effect aage credit-card interest, personal loan, business loan, mortgage aur corporate borrowing cost tak pahunchta hai.
Jab Fed rate badhata ya high rakhta hai:
loan lena mehenga hota hai;
log aur companies borrowing/spending kam kar sakte hain;
businesses expansion aur hiring dheemi kar sakti hain;
demand dheere padti hai;
demand thandi hone par companies ko prices tez badhane ki kam power milti hai.
Is process ko economy ko restrictive rakhna kehte hain—yaani rate normal ya neutral level se upar hai aur economic demand par brake laga raha hai.
2) PCE inflation kya measure karta hai?
PCE = Personal Consumption Expenditures. Ye US consumers ki cheezon aur services par spending ke prices ko track karta hai. Fed ise inflation dekhne ke liye bahut importance deta hai.
September PCE 3.60% YoY ka arth: September mein consumers ne jo basket kharida, uski average price ek saal pehle ke September se 3.60% zyada thi.
YoY (year-on-year) ka matlab hai: isi mahine ko pichhle saal ke isi mahine se compare karna.
Fed ka long-run inflation target 2% hai. Isliye 3.60% target se upar hai: inflation cool hui ho sakti hai, lekin abhi desired level par nahi hai.
3) Core PCE alag kyun dekha jata hai?
Core PCE headline PCE se food aur energy prices ko hata kar dekhta hai.
Food aur fuel ki prices weather, war, oil supply ya seasonal factors se achanak bahut move kar sakti hain. Unko hata kar core PCE economy ki underlying price pressure ko zyada clearly dikhane ki koshish karta hai.
Core PCE 3.10% YoY ka matlab: food aur energy ko chhodkar prices ek saal mein 3.10% badhe. Ye bhi Fed ke 2% target se upar hai, isliye Fed ke liye inflation concern abhi khatam nahi hota.
4) Headline 3.60% aur core 3.10% mein farq kya bolta hai?
Headline inflation core se 0.50 percentage point zyada hai. Iska matlab us period mein food/energy ya unse related volatile components ne overall inflation ko relatively zyada push kiya.
Lekin core bhi 3.10% hai, to sirf oil ya food ko blame karke inflation concern ignore nahi kiya ja sakta. Services—jaise rent, insurance, healthcare, travel aur labour-intensive services—mein price pressure policy makers closely dekhte hain.
5) Fed rate high rakhne ka actual chain reaction
Ek simplified chain dekho:
High Fed rate → banks aur markets ki funding cost high → loans/mortgages/business financing costly → demand dheemi → price increases par pressure kam → inflation gradually cool
Ye effect turant nahi hota. Monetary policy ka impact aksar months mein economy tak pahunchta hai, aur har sector par same speed se nahi aata.
6) Hypothetical example
Maan lo ek business ko expansion ke liye loan chahiye:
Low-rate environment mein loan interest 4% ho sakta tha.
Restrictive-rate environment mein wohi funding cost 8% ho jaye.
Higher cost dekhkar company expansion postpone kar sakti hai. Agar bahut si companies aur consumers aisa karein, economy ki total demand slow hoti hai. Demand slow hone par retailers aur service providers ke liye prices fast badhana mushkil ho sakta hai.
Yeh sirf samjhane ka example hai; actual loan rates har borrower, bank aur loan type ke hisaab se alag hote hain.
7) Is data ke baad Fed ke saamne teen broad situations
Inflation dheere-dheere 2% ke paas aaye aur jobs stable rahein: policy ko future mein less restrictive karne ki guzarish market mein badh sakti hai.
Inflation 3% ke aas-paas chipki rahe ya phir badhe: Fed restrictive tone zyada der tak rakh sakta hai, kyunki jaldi easing se inflation dobara accelerate hone ka risk hota hai.
Growth aur jobs noticeably weak hon, lekin inflation high rahe: ye difficult situation hoti hai. Fed ko inflation control aur economic weakness—dono risks ko balance karna padta hai.
8) Markets par iska asar
US dollar aur Treasury yields: Fed ka hawkish tone—yaani inflation ko control karne ke liye tight policy par focus—yields aur dollar ko support de sakta hai.
Large-cap stocks: profitable, cash-rich companies comparatively resilient ho sakti hain, par valuation pressure aa sakta hai.
Russell 2000 / small caps: small companies debt aur domestic demand ke liye zyada sensitive ho sakti hain. High borrowing cost unke margins aur refinancing par pressure bana sakti hai.
KOSPI 200 aur global equities: US rates, dollar aur global risk appetite ke through indirect effect aa sakta hai.
Crypto: liquidity conditions aur risk appetite important hote hain. Tighter financial conditions risk assets ke liye headwind ban sakti hain, lekin crypto reaction sirf Fed par depend nahi karta.
Isliye ek hi inflation number dekhkar market ka fixed direction maan lena sahi nahi hai. Market reaction is baat par depend karta hai ki data expectations ke against kaisa aaya, labour market kya signal de raha hai, aur Fed apni future policy ke baare mein kya language use karta hai.
The above is market analysis and does not constitute investment advice.
“Policy rate restrictive”
#FOMC ,#FedInterestRate
“Policy rate restrictive” ka matlab: Fed ki interest rate itni high hai ki loan lena aur spending karna mehenga padta hai, jisse inflation ko thanda karne ki koshish hoti hai.
September PCE 3.60% aur core PCE 3.10% ka matlab: prices abhi bhi pichhle saal se zyada hain aur inflation Fed ke 2% target se upar hai.
Fed ko balance banana hota hai: rate jaldi kam kare to inflation wapas badh sakti hai; bahut der high rakhe to growth aur jobs par pressure badh sakta hai.
Is statement ka simple meaning hai: US mein mehngai abhi poori tarah control nahi hui hai, isliye Fed interest rates ko relatively high rakh raha hai. High rates economy ki speed ko slow karti hain, taaki prices itni tez na badhein.
1) Policy rate kya hota hai?
Policy rate Fed ki benchmark interest rate hoti hai. Banks ek-doosre ko short-term paise kis cost par lend karte hain, us par iska asar hota hai. Phir yahi effect aage credit-card interest, personal loan, business loan, mortgage aur corporate borrowing cost tak pahunchta hai.
Jab Fed rate badhata ya high rakhta hai:
loan lena mehenga hota hai;
log aur companies borrowing/spending kam kar sakte hain;
businesses expansion aur hiring dheemi kar sakti hain;
demand dheere padti hai;
demand thandi hone par companies ko prices tez badhane ki kam power milti hai.
Is process ko economy ko restrictive rakhna kehte hain—yaani rate normal ya neutral level se upar hai aur economic demand par brake laga raha hai.
2) PCE inflation kya measure karta hai?
PCE = Personal Consumption Expenditures. Ye US consumers ki cheezon aur services par spending ke prices ko track karta hai. Fed ise inflation dekhne ke liye bahut importance deta hai.
September PCE 3.60% YoY ka arth: September mein consumers ne jo basket kharida, uski average price ek saal pehle ke September se 3.60% zyada thi.
YoY (year-on-year) ka matlab hai: isi mahine ko pichhle saal ke isi mahine se compare karna.
Fed ka long-run inflation target 2% hai. Isliye 3.60% target se upar hai: inflation cool hui ho sakti hai, lekin abhi desired level par nahi hai.
3) Core PCE alag kyun dekha jata hai?
Core PCE headline PCE se food aur energy prices ko hata kar dekhta hai.
Food aur fuel ki prices weather, war, oil supply ya seasonal factors se achanak bahut move kar sakti hain. Unko hata kar core PCE economy ki underlying price pressure ko zyada clearly dikhane ki koshish karta hai.
Core PCE 3.10% YoY ka matlab: food aur energy ko chhodkar prices ek saal mein 3.10% badhe. Ye bhi Fed ke 2% target se upar hai, isliye Fed ke liye inflation concern abhi khatam nahi hota.
4) Headline 3.60% aur core 3.10% mein farq kya bolta hai?
Headline inflation core se 0.50 percentage point zyada hai. Iska matlab us period mein food/energy ya unse related volatile components ne overall inflation ko relatively zyada push kiya.
Lekin core bhi 3.10% hai, to sirf oil ya food ko blame karke inflation concern ignore nahi kiya ja sakta. Services—jaise rent, insurance, healthcare, travel aur labour-intensive services—mein price pressure policy makers closely dekhte hain.
5) Fed rate high rakhne ka actual chain reaction
Ek simplified chain dekho:
High Fed rate → banks aur markets ki funding cost high → loans/mortgages/business financing costly → demand dheemi → price increases par pressure kam → inflation gradually cool
Ye effect turant nahi hota. Monetary policy ka impact aksar months mein economy tak pahunchta hai, aur har sector par same speed se nahi aata.
6) Hypothetical example
Maan lo ek business ko expansion ke liye loan chahiye:
Low-rate environment mein loan interest 4% ho sakta tha.
Restrictive-rate environment mein wohi funding cost 8% ho jaye.
Higher cost dekhkar company expansion postpone kar sakti hai. Agar bahut si companies aur consumers aisa karein, economy ki total demand slow hoti hai. Demand slow hone par retailers aur service providers ke liye prices fast badhana mushkil ho sakta hai.
Yeh sirf samjhane ka example hai; actual loan rates har borrower, bank aur loan type ke hisaab se alag hote hain.
7) Is data ke baad Fed ke saamne teen broad situations
Inflation dheere-dheere 2% ke paas aaye aur jobs stable rahein: policy ko future mein less restrictive karne ki guzarish market mein badh sakti hai.
Inflation 3% ke aas-paas chipki rahe ya phir badhe: Fed restrictive tone zyada der tak rakh sakta hai, kyunki jaldi easing se inflation dobara accelerate hone ka risk hota hai.
Growth aur jobs noticeably weak hon, lekin inflation high rahe: ye difficult situation hoti hai. Fed ko inflation control aur economic weakness—dono risks ko balance karna padta hai.
8) Markets par iska asar
US dollar aur Treasury yields: Fed ka hawkish tone—yaani inflation ko control karne ke liye tight policy par focus—yields aur dollar ko support de sakta hai.
Large-cap stocks: profitable, cash-rich companies comparatively resilient ho sakti hain, par valuation pressure aa sakta hai.
Russell 2000 / small caps: small companies debt aur domestic demand ke liye zyada sensitive ho sakti hain. High borrowing cost unke margins aur refinancing par pressure bana sakti hai.
KOSPI 200 aur global equities: US rates, dollar aur global risk appetite ke through indirect effect aa sakta hai.
Crypto: liquidity conditions aur risk appetite important hote hain. Tighter financial conditions risk assets ke liye headwind ban sakti hain, lekin crypto reaction sirf Fed par depend nahi karta.
Isliye ek hi inflation number dekhkar market ka fixed direction maan lena sahi nahi hai. Market reaction is baat par depend karta hai ki data expectations ke against kaisa aaya, labour market kya signal de raha hai, aur Fed apni future policy ke baare mein kya language use karta hai.
The above is market analysis and does not constitute investment advice.
“Policy rate restrictive” ka matlab: Fed ki interest rate itni high hai ki loan lena aur spending karna mehenga padta hai, jisse inflation ko thanda karne ki koshish hoti hai.
September PCE 3.60% aur core PCE 3.10% ka matlab: prices abhi bhi pichhle saal se zyada hain aur inflation Fed ke 2% target se upar hai.
Fed ko balance banana hota hai: rate jaldi kam kare to inflation wapas badh sakti hai; bahut der high rakhe to growth aur jobs par pressure badh sakta hai.
Is statement ka simple meaning hai: US mein mehngai abhi poori tarah control nahi hui hai, isliye Fed interest rates ko relatively high rakh raha hai. High rates economy ki speed ko slow karti hain, taaki prices itni tez na badhein.
1) Policy rate kya hota hai?
Policy rate Fed ki benchmark interest rate hoti hai. Banks ek-doosre ko short-term paise kis cost par lend karte hain, us par iska asar hota hai. Phir yahi effect aage credit-card interest, personal loan, business loan, mortgage aur corporate borrowing cost tak pahunchta hai.
Jab Fed rate badhata ya high rakhta hai:
loan lena mehenga hota hai;
log aur companies borrowing/spending kam kar sakte hain;
businesses expansion aur hiring dheemi kar sakti hain;
demand dheere padti hai;
demand thandi hone par companies ko prices tez badhane ki kam power milti hai.
Is process ko economy ko restrictive rakhna kehte hain—yaani rate normal ya neutral level se upar hai aur economic demand par brake laga raha hai.
2) PCE inflation kya measure karta hai?
PCE = Personal Consumption Expenditures. Ye US consumers ki cheezon aur services par spending ke prices ko track karta hai. Fed ise inflation dekhne ke liye bahut importance deta hai.
September PCE 3.60% YoY ka arth: September mein consumers ne jo basket kharida, uski average price ek saal pehle ke September se 3.60% zyada thi.
YoY (year-on-year) ka matlab hai: isi mahine ko pichhle saal ke isi mahine se compare karna.
Fed ka long-run inflation target 2% hai. Isliye 3.60% target se upar hai: inflation cool hui ho sakti hai, lekin abhi desired level par nahi hai.
3) Core PCE alag kyun dekha jata hai?
Core PCE headline PCE se food aur energy prices ko hata kar dekhta hai.
Food aur fuel ki prices weather, war, oil supply ya seasonal factors se achanak bahut move kar sakti hain. Unko hata kar core PCE economy ki underlying price pressure ko zyada clearly dikhane ki koshish karta hai.
Core PCE 3.10% YoY ka matlab: food aur energy ko chhodkar prices ek saal mein 3.10% badhe. Ye bhi Fed ke 2% target se upar hai, isliye Fed ke liye inflation concern abhi khatam nahi hota.
4) Headline 3.60% aur core 3.10% mein farq kya bolta hai?
Headline inflation core se 0.50 percentage point zyada hai. Iska matlab us period mein food/energy ya unse related volatile components ne overall inflation ko relatively zyada push kiya.
Lekin core bhi 3.10% hai, to sirf oil ya food ko blame karke inflation concern ignore nahi kiya ja sakta. Services—jaise rent, insurance, healthcare, travel aur labour-intensive services—mein price pressure policy makers closely dekhte hain.
5) Fed rate high rakhne ka actual chain reaction
Ek simplified chain dekho:
High Fed rate → banks aur markets ki funding cost high → loans/mortgages/business financing costly → demand dheemi → price increases par pressure kam → inflation gradually cool
Ye effect turant nahi hota. Monetary policy ka impact aksar months mein economy tak pahunchta hai, aur har sector par same speed se nahi aata.
6) Hypothetical example
Maan lo ek business ko expansion ke liye loan chahiye:
Low-rate environment mein loan interest 4% ho sakta tha.
Restrictive-rate environment mein wohi funding cost 8% ho jaye.
Higher cost dekhkar company expansion postpone kar sakti hai. Agar bahut si companies aur consumers aisa karein, economy ki total demand slow hoti hai. Demand slow hone par retailers aur service providers ke liye prices fast badhana mushkil ho sakta hai.
Yeh sirf samjhane ka example hai; actual loan rates har borrower, bank aur loan type ke hisaab se alag hote hain.
7) Is data ke baad Fed ke saamne teen broad situations
Inflation dheere-dheere 2% ke paas aaye aur jobs stable rahein: policy ko future mein less restrictive karne ki guzarish market mein badh sakti hai.
Inflation 3% ke aas-paas chipki rahe ya phir badhe: Fed restrictive tone zyada der tak rakh sakta hai, kyunki jaldi easing se inflation dobara accelerate hone ka risk hota hai.
Growth aur jobs noticeably weak hon, lekin inflation high rahe: ye difficult situation hoti hai. Fed ko inflation control aur economic weakness—dono risks ko balance karna padta hai.
8) Markets par iska asar
US dollar aur Treasury yields: Fed ka hawkish tone—yaani inflation ko control karne ke liye tight policy par focus—yields aur dollar ko support de sakta hai.
Large-cap stocks: profitable, cash-rich companies comparatively resilient ho sakti hain, par valuation pressure aa sakta hai.
Russell 2000 / small caps: small companies debt aur domestic demand ke liye zyada sensitive ho sakti hain. High borrowing cost unke margins aur refinancing par pressure bana sakti hai.
KOSPI 200 aur global equities: US rates, dollar aur global risk appetite ke through indirect effect aa sakta hai.
Crypto: liquidity conditions aur risk appetite important hote hain. Tighter financial conditions risk assets ke liye headwind ban sakti hain, lekin crypto reaction sirf Fed par depend nahi karta.
Isliye ek hi inflation number dekhkar market ka fixed direction maan lena sahi nahi hai. Market reaction is baat par depend karta hai ki data expectations ke against kaisa aaya, labour market kya signal de raha hai, aur Fed apni future policy ke baare mein kya language use karta hai.
The above is market analysis and does not constitute investment advice.
1
23

ලිපිය
inflation is above the Fed’s 2% objective, while consumer spending was still positive but real...Inflation: latest confirmed data
The latest confirmed Fed-preferred inflation reading is September 2026 PCE:
Headline PCE inflation: 3.60% year-on-yearCore PCE inflation: 3.10% year-on-yearMonthly headline PCE: +0.50%Monthly core PCE: +0.30%Personal spending: +0.50% month-on-monthReal consumer spending: roughly flat month-on-monthPersonal saving rate: 3.80%
BEA data therefore shows inflation is above the Fed’s 2% objective, while consumer spending was still positive but real spending momentum was weak. (bea.gov)
The next PCE release, covering October 2026, is scheduled for 2026-11-25. (bea.gov)
#confirmratehike
CPI consumer prices ka broad measure hai; PCE consumer spending aur substitution patterns ko zyada dynamically capture karta hai.
Core PCE, PCE se food aur energy ko hata deta hai, taaki underlying inflation trend clearer dikhe.
Fed policy mein Core PCE ko khas importance deta hai, jabki CPI market reaction ke liye bhi bahut important hota hai.
1) CPI kya hai?
CPI = Consumer Price Index.
Ye measure karta hai ki aam consumers ke liye daily goods aur services—jaise rent, food, petrol, kapde, medical care—kitne mehange hue.
CPI ek fixed-type basket ko track karta hai. Isliye agar kisi item ki price bahut badh jaaye aur log uska cheaper alternative lene lagen, CPI us change ko comparatively kam reflect kar sakta hai.
2) PCE kya hai?
PCE = Personal Consumption Expenditures Price Index.
Ye bhi US consumers ki prices measure karta hai, lekin isme consumer spending ka wider picture hota hai.
PCE mein data businesses se bhi aata hai—jaise hospitals, retailers aur service providers. Ye consumer behavior ke changes ko zyada adjust karta hai: agar beef mehenga ho aur log chicken zyada lene lagen, PCE us substitution ko better capture karne ki koshish karta hai.
3) Core PCE kya hai?
Core PCE = PCE inflation, food aur energy ko hata kar.
Food aur petrol/oil prices weather, supply disruption ya geopolitical events ki wajah se jaldi aur sharply move kar sakte hain. Inko remove karke Core PCE underlying inflation pressure ko dikhata hai—jaise rent, wages-linked services, healthcare aur insurance.
Ek simple hypothetical example
Maan lo ek saal mein:
petrol prices bahut badh jaati hain,
lekin rent, healthcare aur baaki services relatively stable hain.
To headline CPI/PCE zyada high aa sakta hai, kyunki energy prices add hui hain.
Lekin Core PCE comparatively lower aa sakta hai, kyunki petrol aur food usme include nahi hote.
Ulta, agar energy stable hai lekin rent aur services consistently mehange ho rahe hain, to Core PCE elevated reh sakta hai—Fed isko zyada concerning signal maan sakta hai.
Main difference, ek table mein
| Measure | Kya cover karta hai | Food & energy | Kaun release karta hai | Fed ke liye relevance |
|---|---|---|---|---|#Fed ,#fomc
| CPI | Consumer basket ki prices | Included | Bureau of Labor Statistics | Inflation ka early, widely watched signal |
| PCE | Consumer spending ka broader measure | Included | Bureau of Economic Analysis | Fed ka preferred headline inflation gauge |
| Core PCE | PCE minus food and energy | Excluded | Bureau of Economic Analysis | Underlying inflation trend ke liye Fed ka key measure |
Trader ke liye kyun important hai?
CPI expected se high aaye, to market soch sakta hai Fed rates longer time high rakhega; yields aur US dollar react kar sakte hain, aur risk assets par pressure aa sakta hai.
PCE/Core PCE high rahe, to Fed ke 2% inflation target tak pahunchne ki progress slow lag sakti hai.
Data expectations se lower aaye, to markets less-restrictive policy ki possibility price kar sakte hain.
Market sirf number nahi dekhta—woh actual data ko expectations, jobs data, growth aur Fed ki language ke against compare karta hai.
Yeh sirf market education ke liye hai, investment advice nahi hai।
{future}(TMFUSDT)
{future}(TQQQUSDT)
inflation is above the Fed’s 2% objective, while consumer spending was still positive but real...
Inflation: latest confirmed data
The latest confirmed Fed-preferred inflation reading is September 2026 PCE:
Headline PCE inflation: 3.60% year-on-yearCore PCE inflation: 3.10% year-on-yearMonthly headline PCE: +0.50%Monthly core PCE: +0.30%Personal spending: +0.50% month-on-monthReal consumer spending: roughly flat month-on-monthPersonal saving rate: 3.80%
BEA data therefore shows inflation is above the Fed’s 2% objective, while consumer spending was still positive but real spending momentum was weak. (bea.gov)
The next PCE release, covering October 2026, is scheduled for 2026-11-25. (bea.gov)
#confirmratehike
CPI consumer prices ka broad measure hai; PCE consumer spending aur substitution patterns ko zyada dynamically capture karta hai.
Core PCE, PCE se food aur energy ko hata deta hai, taaki underlying inflation trend clearer dikhe.
Fed policy mein Core PCE ko khas importance deta hai, jabki CPI market reaction ke liye bhi bahut important hota hai.
1) CPI kya hai?
CPI = Consumer Price Index.
Ye measure karta hai ki aam consumers ke liye daily goods aur services—jaise rent, food, petrol, kapde, medical care—kitne mehange hue.
CPI ek fixed-type basket ko track karta hai. Isliye agar kisi item ki price bahut badh jaaye aur log uska cheaper alternative lene lagen, CPI us change ko comparatively kam reflect kar sakta hai.
2) PCE kya hai?
PCE = Personal Consumption Expenditures Price Index.
Ye bhi US consumers ki prices measure karta hai, lekin isme consumer spending ka wider picture hota hai.
PCE mein data businesses se bhi aata hai—jaise hospitals, retailers aur service providers. Ye consumer behavior ke changes ko zyada adjust karta hai: agar beef mehenga ho aur log chicken zyada lene lagen, PCE us substitution ko better capture karne ki koshish karta hai.
3) Core PCE kya hai?
Core PCE = PCE inflation, food aur energy ko hata kar.
Food aur petrol/oil prices weather, supply disruption ya geopolitical events ki wajah se jaldi aur sharply move kar sakte hain. Inko remove karke Core PCE underlying inflation pressure ko dikhata hai—jaise rent, wages-linked services, healthcare aur insurance.
Ek simple hypothetical example
Maan lo ek saal mein:
petrol prices bahut badh jaati hain,
lekin rent, healthcare aur baaki services relatively stable hain.
To headline CPI/PCE zyada high aa sakta hai, kyunki energy prices add hui hain.
Lekin Core PCE comparatively lower aa sakta hai, kyunki petrol aur food usme include nahi hote.
Ulta, agar energy stable hai lekin rent aur services consistently mehange ho rahe hain, to Core PCE elevated reh sakta hai—Fed isko zyada concerning signal maan sakta hai.
Main difference, ek table mein
| Measure | Kya cover karta hai | Food & energy | Kaun release karta hai | Fed ke liye relevance |
|---|---|---|---|---|#Fed ,#fomc
| CPI | Consumer basket ki prices | Included | Bureau of Labor Statistics | Inflation ka early, widely watched signal |
| PCE | Consumer spending ka broader measure | Included | Bureau of Economic Analysis | Fed ka preferred headline inflation gauge |
| Core PCE | PCE minus food and energy | Excluded | Bureau of Economic Analysis | Underlying inflation trend ke liye Fed ka key measure |
Trader ke liye kyun important hai?
CPI expected se high aaye, to market soch sakta hai Fed rates longer time high rakhega; yields aur US dollar react kar sakte hain, aur risk assets par pressure aa sakta hai.
PCE/Core PCE high rahe, to Fed ke 2% inflation target tak pahunchne ki progress slow lag sakti hai.
Data expectations se lower aaye, to markets less-restrictive policy ki possibility price kar sakte hain.
Market sirf number nahi dekhta—woh actual data ko expectations, jobs data, growth aur Fed ki language ke against compare karta hai.
Yeh sirf market education ke liye hai, investment advice nahi hai।
The latest confirmed Fed-preferred inflation reading is September 2026 PCE:
Headline PCE inflation: 3.60% year-on-yearCore PCE inflation: 3.10% year-on-yearMonthly headline PCE: +0.50%Monthly core PCE: +0.30%Personal spending: +0.50% month-on-monthReal consumer spending: roughly flat month-on-monthPersonal saving rate: 3.80%
BEA data therefore shows inflation is above the Fed’s 2% objective, while consumer spending was still positive but real spending momentum was weak. (bea.gov)
The next PCE release, covering October 2026, is scheduled for 2026-11-25. (bea.gov)
#confirmratehike
CPI consumer prices ka broad measure hai; PCE consumer spending aur substitution patterns ko zyada dynamically capture karta hai.
Core PCE, PCE se food aur energy ko hata deta hai, taaki underlying inflation trend clearer dikhe.
Fed policy mein Core PCE ko khas importance deta hai, jabki CPI market reaction ke liye bhi bahut important hota hai.
1) CPI kya hai?
CPI = Consumer Price Index.
Ye measure karta hai ki aam consumers ke liye daily goods aur services—jaise rent, food, petrol, kapde, medical care—kitne mehange hue.
CPI ek fixed-type basket ko track karta hai. Isliye agar kisi item ki price bahut badh jaaye aur log uska cheaper alternative lene lagen, CPI us change ko comparatively kam reflect kar sakta hai.
2) PCE kya hai?
PCE = Personal Consumption Expenditures Price Index.
Ye bhi US consumers ki prices measure karta hai, lekin isme consumer spending ka wider picture hota hai.
PCE mein data businesses se bhi aata hai—jaise hospitals, retailers aur service providers. Ye consumer behavior ke changes ko zyada adjust karta hai: agar beef mehenga ho aur log chicken zyada lene lagen, PCE us substitution ko better capture karne ki koshish karta hai.
3) Core PCE kya hai?
Core PCE = PCE inflation, food aur energy ko hata kar.
Food aur petrol/oil prices weather, supply disruption ya geopolitical events ki wajah se jaldi aur sharply move kar sakte hain. Inko remove karke Core PCE underlying inflation pressure ko dikhata hai—jaise rent, wages-linked services, healthcare aur insurance.
Ek simple hypothetical example
Maan lo ek saal mein:
petrol prices bahut badh jaati hain,
lekin rent, healthcare aur baaki services relatively stable hain.
To headline CPI/PCE zyada high aa sakta hai, kyunki energy prices add hui hain.
Lekin Core PCE comparatively lower aa sakta hai, kyunki petrol aur food usme include nahi hote.
Ulta, agar energy stable hai lekin rent aur services consistently mehange ho rahe hain, to Core PCE elevated reh sakta hai—Fed isko zyada concerning signal maan sakta hai.
Main difference, ek table mein
| Measure | Kya cover karta hai | Food & energy | Kaun release karta hai | Fed ke liye relevance |
|---|---|---|---|---|#Fed ,#fomc
| CPI | Consumer basket ki prices | Included | Bureau of Labor Statistics | Inflation ka early, widely watched signal |
| PCE | Consumer spending ka broader measure | Included | Bureau of Economic Analysis | Fed ka preferred headline inflation gauge |
| Core PCE | PCE minus food and energy | Excluded | Bureau of Economic Analysis | Underlying inflation trend ke liye Fed ka key measure |
Trader ke liye kyun important hai?
CPI expected se high aaye, to market soch sakta hai Fed rates longer time high rakhega; yields aur US dollar react kar sakte hain, aur risk assets par pressure aa sakta hai.
PCE/Core PCE high rahe, to Fed ke 2% inflation target tak pahunchne ki progress slow lag sakti hai.
Data expectations se lower aaye, to markets less-restrictive policy ki possibility price kar sakte hain.
Market sirf number nahi dekhta—woh actual data ko expectations, jobs data, growth aur Fed ki language ke against compare karta hai.
Yeh sirf market education ke liye hai, investment advice nahi hai।
1
147

ලිපිය
Current macro snapshot — as of 2026-11-14 (inside Detailing){future}(BTCUSDT)
{future}(TZAUSDT)
{future}(IWMUSDT)
Russell 2000 aur crypto markets short-term volatility will start soon
Current US macro picture: policy rate is still restrictive, while September PCE inflation was 3.60% YoY and core PCE 3.10% YoY.
Main market trigger is the December 8–9, 2026 Fed meeting; the decision, updated projections and dot plot can move US equities, Russell 2000-linked contracts and crypto.
Outlook depends on whether inflation cools without jobs/growth weakening sharply; both upside and downside scenarios remain open.
Current macro snapshot — as of 2026-11-14
1) Fed rate and key dates
The next Fed/FOMC meeting is 2026-12-08 to 2026-12-09. This meeting includes updated economic projections and the dot plot, so the market will focus not only on the rate decision but also on the Fed’s inflation and growth language. The Federal Reserve’s official calendar confirms this schedule. (federalreserve.gov)
The latest policy decision was on 2026-10-28. For the current exact fed-funds target range, I would rely on the Fed’s latest statement rather than estimate it from market commentary.
#RateHike
2) Inflation: latest confirmed data
The latest confirmed Fed-preferred inflation reading is September 2026 PCE:
Headline PCE inflation: 3.60% year-on-yearCore PCE inflation: 3.10% year-on-yearMonthly headline PCE: +0.50%Monthly core PCE: +0.30%Personal spending: +0.50% month-on-monthReal consumer spending: roughly flat month-on-monthPersonal saving rate: 3.80%#FOMC
BEA data therefore shows inflation is above the Fed’s 2% objective, while consumer spending was still positive but real spending momentum was weak. (bea.gov)
The next PCE release, covering October 2026, is scheduled for 2026-11-25. (bea.gov)
3) US economy: current reading
The mixed picture is:
Inflation: still higher than the Fed’s target.
Consumer demand: nominal spending remains positive, but inflation-adjusted spending has softened.
Rates: restrictive policy remains a headwind for small caps, lower-quality credit, housing-sensitive sectors and leveraged businesses.
Russell 2000 / small caps: these are especially sensitive to borrowing costs, bank lending conditions and domestic-growth expectations.
For contracts such as TZAUSDT—which tracks the inverse leveraged small-cap ETF—the most important inputs are Russell 2000 direction, bond yields, Fed messaging and growth data.
4) Three major scenarios
A. Disinflation / softer-landing scenario
If upcoming inflation data cools while employment and consumer activity do not weaken sharply, markets may interpret it as room for less restrictive Fed policy later. That environment can support rate-sensitive small-cap shares and may weigh on inverse small-cap products such as TZA.
B. Sticky-inflation scenario
If core inflation stays elevated or re-accelerates, the Fed may keep a restrictive tone for longer. Treasury yields can remain high, financial conditions may stay tight, and smaller companies may face more pressure because refinancing costs matter more for them. This can be relatively supportive for TZA’s underlying inverse exposure, though daily moves remain volatile.
C. Growth-slowdown scenario
If jobs, consumption or credit conditions deteriorate materially, markets can initially become risk-off. Russell 2000 often reacts strongly because it has broad domestic and cyclical exposure. However, if the slowdown becomes severe enough to increase expectations of future easing, markets can reverse quickly—so the path matters, not only the final Fed decision.
#FedMeeting
5) Global response to watch
Global markets are broadly reacting to four themes:
US dollar and Treasury yields: higher yields/dollar can pressure emerging markets, commodities and risk assets.Central-bank divergence: markets compare the Fed’s stance with Europe, Japan, China and other major economies; policy gaps can move FX and capital flows.Growth and trade conditions: weaker global demand can hurt cyclical equities and industrials, while renewed demand can improve risk appetite.Oil and geopolitical risk: higher energy prices can feed inflation expectations and complicate the Fed’s task.
What matters most before the Fed meeting
October PCE inflation on 2026-11-25 Upcoming US jobs data Treasury-yield and US-dollar reaction Fed speakers’ language on inflation progress versus growth risks Whether Russell 2000 breadth improves or remains weak relative to large-cap stocks
Yeh market analysis hai, investment advice nahi hai.
#fed
Agle Fed/FOMC interest-rate decision ki date 9 December 2026, Wednesday hai. Meeting 8–9 December ko hogi, aur rate statement/decision 2:00 PM New York time (ET) par aayega—India mein lagbhag 10 December, 12:30 AM IST. Is meeting ke saath Fed projections aur dot plot bhi release honge. (federalreserve.gov)
Fed rate decision USD, US stocks, Russell 2000 aur crypto markets mein short-term volatility la sakta hai; actual reaction inflation outlook, growth outlook aur Fed ke guidance par depend karega.
#FedMeeting
Current macro snapshot — as of 2026-11-14 (inside Detailing)
Russell 2000 aur crypto markets short-term volatility will start soon
Current US macro picture: policy rate is still restrictive, while September PCE inflation was 3.60% YoY and core PCE 3.10% YoY.
Main market trigger is the December 8–9, 2026 Fed meeting; the decision, updated projections and dot plot can move US equities, Russell 2000-linked contracts and crypto.
Outlook depends on whether inflation cools without jobs/growth weakening sharply; both upside and downside scenarios remain open.
Current macro snapshot — as of 2026-11-14
1) Fed rate and key dates
The next Fed/FOMC meeting is 2026-12-08 to 2026-12-09. This meeting includes updated economic projections and the dot plot, so the market will focus not only on the rate decision but also on the Fed’s inflation and growth language. The Federal Reserve’s official calendar confirms this schedule. (federalreserve.gov)
The latest policy decision was on 2026-10-28. For the current exact fed-funds target range, I would rely on the Fed’s latest statement rather than estimate it from market commentary.
#RateHike
2) Inflation: latest confirmed data
The latest confirmed Fed-preferred inflation reading is September 2026 PCE:
Headline PCE inflation: 3.60% year-on-yearCore PCE inflation: 3.10% year-on-yearMonthly headline PCE: +0.50%Monthly core PCE: +0.30%Personal spending: +0.50% month-on-monthReal consumer spending: roughly flat month-on-monthPersonal saving rate: 3.80%#FOMC
BEA data therefore shows inflation is above the Fed’s 2% objective, while consumer spending was still positive but real spending momentum was weak. (bea.gov)
The next PCE release, covering October 2026, is scheduled for 2026-11-25. (bea.gov)
3) US economy: current reading
The mixed picture is:
Inflation: still higher than the Fed’s target.
Consumer demand: nominal spending remains positive, but inflation-adjusted spending has softened.
Rates: restrictive policy remains a headwind for small caps, lower-quality credit, housing-sensitive sectors and leveraged businesses.
Russell 2000 / small caps: these are especially sensitive to borrowing costs, bank lending conditions and domestic-growth expectations.
For contracts such as TZAUSDT—which tracks the inverse leveraged small-cap ETF—the most important inputs are Russell 2000 direction, bond yields, Fed messaging and growth data.
4) Three major scenarios
A. Disinflation / softer-landing scenario
If upcoming inflation data cools while employment and consumer activity do not weaken sharply, markets may interpret it as room for less restrictive Fed policy later. That environment can support rate-sensitive small-cap shares and may weigh on inverse small-cap products such as TZA.
B. Sticky-inflation scenario
If core inflation stays elevated or re-accelerates, the Fed may keep a restrictive tone for longer. Treasury yields can remain high, financial conditions may stay tight, and smaller companies may face more pressure because refinancing costs matter more for them. This can be relatively supportive for TZA’s underlying inverse exposure, though daily moves remain volatile.
C. Growth-slowdown scenario
If jobs, consumption or credit conditions deteriorate materially, markets can initially become risk-off. Russell 2000 often reacts strongly because it has broad domestic and cyclical exposure. However, if the slowdown becomes severe enough to increase expectations of future easing, markets can reverse quickly—so the path matters, not only the final Fed decision.
#FedMeeting
5) Global response to watch
Global markets are broadly reacting to four themes:
US dollar and Treasury yields: higher yields/dollar can pressure emerging markets, commodities and risk assets.Central-bank divergence: markets compare the Fed’s stance with Europe, Japan, China and other major economies; policy gaps can move FX and capital flows.Growth and trade conditions: weaker global demand can hurt cyclical equities and industrials, while renewed demand can improve risk appetite.Oil and geopolitical risk: higher energy prices can feed inflation expectations and complicate the Fed’s task.
What matters most before the Fed meeting
October PCE inflation on 2026-11-25 Upcoming US jobs data Treasury-yield and US-dollar reaction Fed speakers’ language on inflation progress versus growth risks Whether Russell 2000 breadth improves or remains weak relative to large-cap stocks
Yeh market analysis hai, investment advice nahi hai.
#fed
Agle Fed/FOMC interest-rate decision ki date 9 December 2026, Wednesday hai. Meeting 8–9 December ko hogi, aur rate statement/decision 2:00 PM New York time (ET) par aayega—India mein lagbhag 10 December, 12:30 AM IST. Is meeting ke saath Fed projections aur dot plot bhi release honge. (federalreserve.gov)
Fed rate decision USD, US stocks, Russell 2000 aur crypto markets mein short-term volatility la sakta hai; actual reaction inflation outlook, growth outlook aur Fed ke guidance par depend karega.
#FedMeeting
Current US macro picture: policy rate is still restrictive, while September PCE inflation was 3.60% YoY and core PCE 3.10% YoY.
Main market trigger is the December 8–9, 2026 Fed meeting; the decision, updated projections and dot plot can move US equities, Russell 2000-linked contracts and crypto.
Outlook depends on whether inflation cools without jobs/growth weakening sharply; both upside and downside scenarios remain open.
Current macro snapshot — as of 2026-11-14
1) Fed rate and key dates
The next Fed/FOMC meeting is 2026-12-08 to 2026-12-09. This meeting includes updated economic projections and the dot plot, so the market will focus not only on the rate decision but also on the Fed’s inflation and growth language. The Federal Reserve’s official calendar confirms this schedule. (federalreserve.gov)
The latest policy decision was on 2026-10-28. For the current exact fed-funds target range, I would rely on the Fed’s latest statement rather than estimate it from market commentary.
#RateHike
2) Inflation: latest confirmed data
The latest confirmed Fed-preferred inflation reading is September 2026 PCE:
Headline PCE inflation: 3.60% year-on-yearCore PCE inflation: 3.10% year-on-yearMonthly headline PCE: +0.50%Monthly core PCE: +0.30%Personal spending: +0.50% month-on-monthReal consumer spending: roughly flat month-on-monthPersonal saving rate: 3.80%#FOMC
BEA data therefore shows inflation is above the Fed’s 2% objective, while consumer spending was still positive but real spending momentum was weak. (bea.gov)
The next PCE release, covering October 2026, is scheduled for 2026-11-25. (bea.gov)
3) US economy: current reading
The mixed picture is:
Inflation: still higher than the Fed’s target.
Consumer demand: nominal spending remains positive, but inflation-adjusted spending has softened.
Rates: restrictive policy remains a headwind for small caps, lower-quality credit, housing-sensitive sectors and leveraged businesses.
Russell 2000 / small caps: these are especially sensitive to borrowing costs, bank lending conditions and domestic-growth expectations.
For contracts such as TZAUSDT—which tracks the inverse leveraged small-cap ETF—the most important inputs are Russell 2000 direction, bond yields, Fed messaging and growth data.
4) Three major scenarios
A. Disinflation / softer-landing scenario
If upcoming inflation data cools while employment and consumer activity do not weaken sharply, markets may interpret it as room for less restrictive Fed policy later. That environment can support rate-sensitive small-cap shares and may weigh on inverse small-cap products such as TZA.
B. Sticky-inflation scenario
If core inflation stays elevated or re-accelerates, the Fed may keep a restrictive tone for longer. Treasury yields can remain high, financial conditions may stay tight, and smaller companies may face more pressure because refinancing costs matter more for them. This can be relatively supportive for TZA’s underlying inverse exposure, though daily moves remain volatile.
C. Growth-slowdown scenario
If jobs, consumption or credit conditions deteriorate materially, markets can initially become risk-off. Russell 2000 often reacts strongly because it has broad domestic and cyclical exposure. However, if the slowdown becomes severe enough to increase expectations of future easing, markets can reverse quickly—so the path matters, not only the final Fed decision.
#FedMeeting
5) Global response to watch
Global markets are broadly reacting to four themes:
US dollar and Treasury yields: higher yields/dollar can pressure emerging markets, commodities and risk assets.Central-bank divergence: markets compare the Fed’s stance with Europe, Japan, China and other major economies; policy gaps can move FX and capital flows.Growth and trade conditions: weaker global demand can hurt cyclical equities and industrials, while renewed demand can improve risk appetite.Oil and geopolitical risk: higher energy prices can feed inflation expectations and complicate the Fed’s task.
What matters most before the Fed meeting
October PCE inflation on 2026-11-25 Upcoming US jobs data Treasury-yield and US-dollar reaction Fed speakers’ language on inflation progress versus growth risks Whether Russell 2000 breadth improves or remains weak relative to large-cap stocks
Yeh market analysis hai, investment advice nahi hai.
#fed
Agle Fed/FOMC interest-rate decision ki date 9 December 2026, Wednesday hai. Meeting 8–9 December ko hogi, aur rate statement/decision 2:00 PM New York time (ET) par aayega—India mein lagbhag 10 December, 12:30 AM IST. Is meeting ke saath Fed projections aur dot plot bhi release honge. (federalreserve.gov)
Fed rate decision USD, US stocks, Russell 2000 aur crypto markets mein short-term volatility la sakta hai; actual reaction inflation outlook, growth outlook aur Fed ke guidance par depend karega.
#FedMeeting
1
163
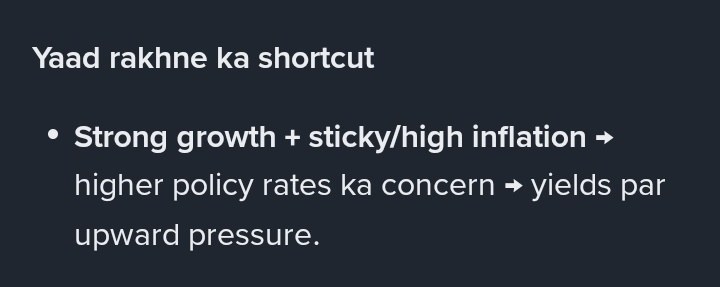
ලිපිය
Neutral rate ko aam taur par r-star kaha jata hai. Iska matlab hai aisi policy jo...... let's see#Fed , #RateHike , #fomc ,#TMFUSDT
{future}(TQQQUSDT)
{future}(TMFUSDT)
""Har economy ke liye ek approximate neutral rate hota hai—aisa rate jo na economy ko strongly stimulate kare aur na strongly slow करे। Exact neutral rate pata nahi hota; Fed ise estimates se judge karta hai।""
kya dekh ke judge karte hai; kaise malum padta hai nutral level kitna hoga?
Neutral rate ko aam taur par r-star (r\) kaha jata hai. Iska matlab hai aisi policy-rate level jo, inflation target ke paas ho aur economy normal capacity par chal rahi ho, to demand ko na extra push de aur na extra brake lagaye.
Iska exact number kisi ko real time mein pata nahi hota. Fed ise direct measure nahi kar sakta—jaise thermometer se temperature. Yeh data patterns aur economic models se estimate kiya jata hai, aur baad mein estimate revise bhi ho sakta hai.
Fed kya-kya dekhkar judge karta hai?
1) Inflation ka trend
Fed dekhta hai inflation 2% target ke aas-paas stable ho rahi hai ya nahi।
Inflation lagatar target se upar ho, to rates neutral se neeche ya financial conditions bahut easy ho sakti hain।
Inflation target ki taraf aa rahi ho, bina economy ko sharply slow kiye, to policy neutral ke kareeb ho sakti hai।
Inflation bahut neeche ho aur demand weak ho, to rates neutral se upar—yaani restrictive—ho sakte hain।
Sirf ek month ka CPI/PCE number enough nahi hota. Trend, services inflation, wage-linked pressure aur inflation expectations bhi dekhe jaate hain।
2) Jobs market
Fed employment side par dekhta hai:
unemployment rate
job creation
job openings
layoffs aur unemployment claims
wage growth
labour-force participation
Agar hiring unusually strong ho, job openings bahut zyada hon aur wages fast badh rahe hon, to demand strong ho sakti hai. Agar unemployment rising ho, layoffs badh rahe hon aur hiring weak ho, to policy economy ko zyada slow kar rahi ho sakti hai।
3) Growth aur spending
Fed dekhta hai households aur companies ki activity normal pace par hai ya nahi:
consumer spending
retail sales
GDP growth
business investment
manufacturing aur services surveys
housing activity
Agar spending, investment aur housing unusually fast hon, demand supply capacity se aage nikal sakti hai. Agar sab slow ho, rate pressure zyada hone ka signal mil sakta hai।
4) Credit ki availability aur loan costs
Fed ka policy rate sirf starting point hai. Woh dekhta hai banks aur markets ne usko actual economy tak kitna pass on kiya:
mortgage rates
auto loans aur credit-card rates
corporate borrowing cost
bank lending standards
small-business credit
loan demand aur delinquencies
Example: Fed rate unchanged rahe, lekin banks suddenly loans dena tough kar dein. Economy par effective brake badh jaati hai, chahe official policy rate wahi ho।
5) Financial conditions
Fed broader market conditions bhi dekhta hai:
Treasury yields
US dollar
corporate-bond spreads
stock valuations
risk appetite
liquidity conditions
Agar long-term yields ya dollar sharply badh jaaye, companies aur households ke liye financing already tight ho sakti hai. Is situation mein same Fed rate pehle se zyada restrictive effect de sakti hai।
6) Productivity, demographics aur long-term saving/investment
Neutral rate time ke saath change hota hai. Isliye Fed long-run factors bhi estimate karta hai:
productivity growth
population aur workforce growth
ageing population ki saving habits
global savings
government borrowing
demand for safe assets
business investment opportunities
Agar productivity aur investment opportunities strong hon, economy relatively higher rate handle kar sakti hai. Agar growth potential weak aur savings high hon, neutral rate lower ho sakta hai।
Nominal aur real neutral rate
Yahan ek important distinction hai:
Nominal rate: jo headline interest rate hota hai, jaise policy rate।
Real rate: inflation adjust karne ke baad effective rate।
Simplified relationship:
Real rate ≈ nominal policy rate − expected inflation
Fed generally real policy rate ko estimated real neutral rate se compare karta hai:
Real rate > r\ → policy restrictive ho sakti hai
Real rate ≈ r\ → policy roughly neutral ho sakti hai
Real rate < r\ → policy accommodative/stimulative ho sakti hai
Example sirf samajhne ke liye: agar nominal rate 5% aur expected inflation 2% ho, estimated real rate lagbhag 3% banta hai. Agar estimated real neutral rate 1% ho, to policy ka stance restrictive lag sakta hai. Lekin real-world mein expected inflation aur neutral rate dono estimates hote hain, fixed facts nahi।
Exact neutral level kaise estimate hota hai?
Fed aur economists kai methods ko combine karte hain:
Statistical models: past data se rates, inflation, unemployment aur GDP ke relationships analyse karte hain।
Market signals: Treasury yields, inflation-linked bonds aur inflation expectations ko dekhte hain।
Surveys: households, businesses aur professional forecasters future inflation, growth aur rates ke baare mein kya soch rahe hain।
Actual economy ka response: high rates ke baad demand, hiring, credit aur inflation kitni slow hoti hai। Yeh real-world feedback bahut important hota hai।
Fed projections: policymakers apne long-run policy-rate projections publish karte hain. Yeh r\* ka exact declaration nahi, lekin unke neutral-rate view ka ek useful clue ho sakta hai।
Kaise pata chalta hai ki rate neutral ke upar ya neeche hai?
Fed ek single test se nahi kehta ki “neutral exactly yahi hai.” Woh combined evidence dekhta hai।
Restrictive hone ke signals
inflation dheere-dheere cool ho rahi ho
borrowing aur loan demand weak ho
housing aur business investment slow ho
hiring aur wage growth moderate ho
credit conditions tight ho
growth potential se neeche aa rahi ho
Too loose hone ke signals
inflation target se upar ja rahi ho
spending aur credit growth bahut fast ho
labour market unusually tight ho
wages aur services prices fast badh rahe hon
asset valuations aur borrowing exuberant hon
Neutral ke kareeb hone ka possible pattern
inflation target ke aas-paas stable ho
jobs market neither overheated nor sharply weak ho
GDP growth sustainable pace par ho
credit available ho, par excessive na ho
policy ke baad economy me large imbalance na ban raha ho
Ek simple “car speed” example
Economy ko car samjho:
Neutral rate: accelerator aur brake dono lightly balanced hain; car stable speed se chal rahi hai।
Rate neutral se neeche: accelerator zyada dab raha hai; spending, borrowing aur demand speed pakad sakte hain; overheat hone par inflation badh sakti hai।
Rate neutral se upar: brake laga hai; demand slow hoti hai; inflation cool ho sakti hai।
Rate bahut upar / bahut der tak high: brake hard ho jata hai; growth aur jobs weak hone lag sakte hain।
Fed rear-view mirror se sirf aaj ki speed nahi dekhta; road condition, engine temperature aur aage ka traffic bhi dekhta hai. Isi wajah se neutral rate ka estimate uncertain hota hai aur naye data ke saath badal sakta hai।
Yeh market education ke liye hai, investment advice nahi hai।
Neutral rate ko aam taur par r-star kaha jata hai. Iska matlab hai aisi policy jo...... let's see
#Fed , #RateHike , #fomc ,#TMFUSDT
""Har economy ke liye ek approximate neutral rate hota hai—aisa rate jo na economy ko strongly stimulate kare aur na strongly slow करे। Exact neutral rate pata nahi hota; Fed ise estimates se judge karta hai।""
kya dekh ke judge karte hai; kaise malum padta hai nutral level kitna hoga?
Neutral rate ko aam taur par r-star (r\) kaha jata hai. Iska matlab hai aisi policy-rate level jo, inflation target ke paas ho aur economy normal capacity par chal rahi ho, to demand ko na extra push de aur na extra brake lagaye.
Iska exact number kisi ko real time mein pata nahi hota. Fed ise direct measure nahi kar sakta—jaise thermometer se temperature. Yeh data patterns aur economic models se estimate kiya jata hai, aur baad mein estimate revise bhi ho sakta hai.
Fed kya-kya dekhkar judge karta hai?
1) Inflation ka trend
Fed dekhta hai inflation 2% target ke aas-paas stable ho rahi hai ya nahi।
Inflation lagatar target se upar ho, to rates neutral se neeche ya financial conditions bahut easy ho sakti hain।
Inflation target ki taraf aa rahi ho, bina economy ko sharply slow kiye, to policy neutral ke kareeb ho sakti hai।
Inflation bahut neeche ho aur demand weak ho, to rates neutral se upar—yaani restrictive—ho sakte hain।
Sirf ek month ka CPI/PCE number enough nahi hota. Trend, services inflation, wage-linked pressure aur inflation expectations bhi dekhe jaate hain।
2) Jobs market
Fed employment side par dekhta hai:
unemployment rate
job creation
job openings
layoffs aur unemployment claims
wage growth
labour-force participation
Agar hiring unusually strong ho, job openings bahut zyada hon aur wages fast badh rahe hon, to demand strong ho sakti hai. Agar unemployment rising ho, layoffs badh rahe hon aur hiring weak ho, to policy economy ko zyada slow kar rahi ho sakti hai।
3) Growth aur spending
Fed dekhta hai households aur companies ki activity normal pace par hai ya nahi:
consumer spending
retail sales
GDP growth
business investment
manufacturing aur services surveys
housing activity
Agar spending, investment aur housing unusually fast hon, demand supply capacity se aage nikal sakti hai. Agar sab slow ho, rate pressure zyada hone ka signal mil sakta hai।
4) Credit ki availability aur loan costs
Fed ka policy rate sirf starting point hai. Woh dekhta hai banks aur markets ne usko actual economy tak kitna pass on kiya:
mortgage rates
auto loans aur credit-card rates
corporate borrowing cost
bank lending standards
small-business credit
loan demand aur delinquencies
Example: Fed rate unchanged rahe, lekin banks suddenly loans dena tough kar dein. Economy par effective brake badh jaati hai, chahe official policy rate wahi ho।
5) Financial conditions
Fed broader market conditions bhi dekhta hai:
Treasury yields
US dollar
corporate-bond spreads
stock valuations
risk appetite
liquidity conditions
Agar long-term yields ya dollar sharply badh jaaye, companies aur households ke liye financing already tight ho sakti hai. Is situation mein same Fed rate pehle se zyada restrictive effect de sakti hai।
6) Productivity, demographics aur long-term saving/investment
Neutral rate time ke saath change hota hai. Isliye Fed long-run factors bhi estimate karta hai:
productivity growth
population aur workforce growth
ageing population ki saving habits
global savings
government borrowing
demand for safe assets
business investment opportunities
Agar productivity aur investment opportunities strong hon, economy relatively higher rate handle kar sakti hai. Agar growth potential weak aur savings high hon, neutral rate lower ho sakta hai।
Nominal aur real neutral rate
Yahan ek important distinction hai:
Nominal rate: jo headline interest rate hota hai, jaise policy rate।
Real rate: inflation adjust karne ke baad effective rate।
Simplified relationship:
Real rate ≈ nominal policy rate − expected inflation
Fed generally real policy rate ko estimated real neutral rate se compare karta hai:
Real rate > r\ → policy restrictive ho sakti hai
Real rate ≈ r\ → policy roughly neutral ho sakti hai
Real rate < r\ → policy accommodative/stimulative ho sakti hai
Example sirf samajhne ke liye: agar nominal rate 5% aur expected inflation 2% ho, estimated real rate lagbhag 3% banta hai. Agar estimated real neutral rate 1% ho, to policy ka stance restrictive lag sakta hai. Lekin real-world mein expected inflation aur neutral rate dono estimates hote hain, fixed facts nahi।
Exact neutral level kaise estimate hota hai?
Fed aur economists kai methods ko combine karte hain:
Statistical models: past data se rates, inflation, unemployment aur GDP ke relationships analyse karte hain।
Market signals: Treasury yields, inflation-linked bonds aur inflation expectations ko dekhte hain।
Surveys: households, businesses aur professional forecasters future inflation, growth aur rates ke baare mein kya soch rahe hain।
Actual economy ka response: high rates ke baad demand, hiring, credit aur inflation kitni slow hoti hai। Yeh real-world feedback bahut important hota hai।
Fed projections: policymakers apne long-run policy-rate projections publish karte hain. Yeh r\* ka exact declaration nahi, lekin unke neutral-rate view ka ek useful clue ho sakta hai।
Kaise pata chalta hai ki rate neutral ke upar ya neeche hai?
Fed ek single test se nahi kehta ki “neutral exactly yahi hai.” Woh combined evidence dekhta hai।
Restrictive hone ke signals
inflation dheere-dheere cool ho rahi ho
borrowing aur loan demand weak ho
housing aur business investment slow ho
hiring aur wage growth moderate ho
credit conditions tight ho
growth potential se neeche aa rahi ho
Too loose hone ke signals
inflation target se upar ja rahi ho
spending aur credit growth bahut fast ho
labour market unusually tight ho
wages aur services prices fast badh rahe hon
asset valuations aur borrowing exuberant hon
Neutral ke kareeb hone ka possible pattern
inflation target ke aas-paas stable ho
jobs market neither overheated nor sharply weak ho
GDP growth sustainable pace par ho
credit available ho, par excessive na ho
policy ke baad economy me large imbalance na ban raha ho
Ek simple “car speed” example
Economy ko car samjho:
Neutral rate: accelerator aur brake dono lightly balanced hain; car stable speed se chal rahi hai।
Rate neutral se neeche: accelerator zyada dab raha hai; spending, borrowing aur demand speed pakad sakte hain; overheat hone par inflation badh sakti hai।
Rate neutral se upar: brake laga hai; demand slow hoti hai; inflation cool ho sakti hai।
Rate bahut upar / bahut der tak high: brake hard ho jata hai; growth aur jobs weak hone lag sakte hain।
Fed rear-view mirror se sirf aaj ki speed nahi dekhta; road condition, engine temperature aur aage ka traffic bhi dekhta hai. Isi wajah se neutral rate ka estimate uncertain hota hai aur naye data ke saath badal sakta hai।
Yeh market education ke liye hai, investment advice nahi hai।
""Har economy ke liye ek approximate neutral rate hota hai—aisa rate jo na economy ko strongly stimulate kare aur na strongly slow करे। Exact neutral rate pata nahi hota; Fed ise estimates se judge karta hai।""
kya dekh ke judge karte hai; kaise malum padta hai nutral level kitna hoga?
Neutral rate ko aam taur par r-star (r\) kaha jata hai. Iska matlab hai aisi policy-rate level jo, inflation target ke paas ho aur economy normal capacity par chal rahi ho, to demand ko na extra push de aur na extra brake lagaye.
Iska exact number kisi ko real time mein pata nahi hota. Fed ise direct measure nahi kar sakta—jaise thermometer se temperature. Yeh data patterns aur economic models se estimate kiya jata hai, aur baad mein estimate revise bhi ho sakta hai.
Fed kya-kya dekhkar judge karta hai?
1) Inflation ka trend
Fed dekhta hai inflation 2% target ke aas-paas stable ho rahi hai ya nahi।
Inflation lagatar target se upar ho, to rates neutral se neeche ya financial conditions bahut easy ho sakti hain।
Inflation target ki taraf aa rahi ho, bina economy ko sharply slow kiye, to policy neutral ke kareeb ho sakti hai।
Inflation bahut neeche ho aur demand weak ho, to rates neutral se upar—yaani restrictive—ho sakte hain।
Sirf ek month ka CPI/PCE number enough nahi hota. Trend, services inflation, wage-linked pressure aur inflation expectations bhi dekhe jaate hain।
2) Jobs market
Fed employment side par dekhta hai:
unemployment rate
job creation
job openings
layoffs aur unemployment claims
wage growth
labour-force participation
Agar hiring unusually strong ho, job openings bahut zyada hon aur wages fast badh rahe hon, to demand strong ho sakti hai. Agar unemployment rising ho, layoffs badh rahe hon aur hiring weak ho, to policy economy ko zyada slow kar rahi ho sakti hai।
3) Growth aur spending
Fed dekhta hai households aur companies ki activity normal pace par hai ya nahi:
consumer spending
retail sales
GDP growth
business investment
manufacturing aur services surveys
housing activity
Agar spending, investment aur housing unusually fast hon, demand supply capacity se aage nikal sakti hai. Agar sab slow ho, rate pressure zyada hone ka signal mil sakta hai।
4) Credit ki availability aur loan costs
Fed ka policy rate sirf starting point hai. Woh dekhta hai banks aur markets ne usko actual economy tak kitna pass on kiya:
mortgage rates
auto loans aur credit-card rates
corporate borrowing cost
bank lending standards
small-business credit
loan demand aur delinquencies
Example: Fed rate unchanged rahe, lekin banks suddenly loans dena tough kar dein. Economy par effective brake badh jaati hai, chahe official policy rate wahi ho।
5) Financial conditions
Fed broader market conditions bhi dekhta hai:
Treasury yields
US dollar
corporate-bond spreads
stock valuations
risk appetite
liquidity conditions
Agar long-term yields ya dollar sharply badh jaaye, companies aur households ke liye financing already tight ho sakti hai. Is situation mein same Fed rate pehle se zyada restrictive effect de sakti hai।
6) Productivity, demographics aur long-term saving/investment
Neutral rate time ke saath change hota hai. Isliye Fed long-run factors bhi estimate karta hai:
productivity growth
population aur workforce growth
ageing population ki saving habits
global savings
government borrowing
demand for safe assets
business investment opportunities
Agar productivity aur investment opportunities strong hon, economy relatively higher rate handle kar sakti hai. Agar growth potential weak aur savings high hon, neutral rate lower ho sakta hai।
Nominal aur real neutral rate
Yahan ek important distinction hai:
Nominal rate: jo headline interest rate hota hai, jaise policy rate।
Real rate: inflation adjust karne ke baad effective rate।
Simplified relationship:
Real rate ≈ nominal policy rate − expected inflation
Fed generally real policy rate ko estimated real neutral rate se compare karta hai:
Real rate > r\ → policy restrictive ho sakti hai
Real rate ≈ r\ → policy roughly neutral ho sakti hai
Real rate < r\ → policy accommodative/stimulative ho sakti hai
Example sirf samajhne ke liye: agar nominal rate 5% aur expected inflation 2% ho, estimated real rate lagbhag 3% banta hai. Agar estimated real neutral rate 1% ho, to policy ka stance restrictive lag sakta hai. Lekin real-world mein expected inflation aur neutral rate dono estimates hote hain, fixed facts nahi।
Exact neutral level kaise estimate hota hai?
Fed aur economists kai methods ko combine karte hain:
Statistical models: past data se rates, inflation, unemployment aur GDP ke relationships analyse karte hain।
Market signals: Treasury yields, inflation-linked bonds aur inflation expectations ko dekhte hain।
Surveys: households, businesses aur professional forecasters future inflation, growth aur rates ke baare mein kya soch rahe hain।
Actual economy ka response: high rates ke baad demand, hiring, credit aur inflation kitni slow hoti hai। Yeh real-world feedback bahut important hota hai।
Fed projections: policymakers apne long-run policy-rate projections publish karte hain. Yeh r\* ka exact declaration nahi, lekin unke neutral-rate view ka ek useful clue ho sakta hai।
Kaise pata chalta hai ki rate neutral ke upar ya neeche hai?
Fed ek single test se nahi kehta ki “neutral exactly yahi hai.” Woh combined evidence dekhta hai।
Restrictive hone ke signals
inflation dheere-dheere cool ho rahi ho
borrowing aur loan demand weak ho
housing aur business investment slow ho
hiring aur wage growth moderate ho
credit conditions tight ho
growth potential se neeche aa rahi ho
Too loose hone ke signals
inflation target se upar ja rahi ho
spending aur credit growth bahut fast ho
labour market unusually tight ho
wages aur services prices fast badh rahe hon
asset valuations aur borrowing exuberant hon
Neutral ke kareeb hone ka possible pattern
inflation target ke aas-paas stable ho
jobs market neither overheated nor sharply weak ho
GDP growth sustainable pace par ho
credit available ho, par excessive na ho
policy ke baad economy me large imbalance na ban raha ho
Ek simple “car speed” example
Economy ko car samjho:
Neutral rate: accelerator aur brake dono lightly balanced hain; car stable speed se chal rahi hai।
Rate neutral se neeche: accelerator zyada dab raha hai; spending, borrowing aur demand speed pakad sakte hain; overheat hone par inflation badh sakti hai।
Rate neutral se upar: brake laga hai; demand slow hoti hai; inflation cool ho sakti hai।
Rate bahut upar / bahut der tak high: brake hard ho jata hai; growth aur jobs weak hone lag sakte hain।
Fed rear-view mirror se sirf aaj ki speed nahi dekhta; road condition, engine temperature aur aage ka traffic bhi dekhta hai. Isi wajah se neutral rate ka estimate uncertain hota hai aur naye data ke saath badal sakta hai।
Yeh market education ke liye hai, investment advice nahi hai।
3
96
#russia
may be more excitement to see how market will react after dollar strength goes more stronger than now
Euro may goes dip against after 22November
#russia
may be more excitement to see how market will react after dollar strength goes more stronger than now
Euro may goes dip against after 22November
may be more excitement to see how market will react after dollar strength goes more stronger than now
Euro may goes dip against after 22November
1
65
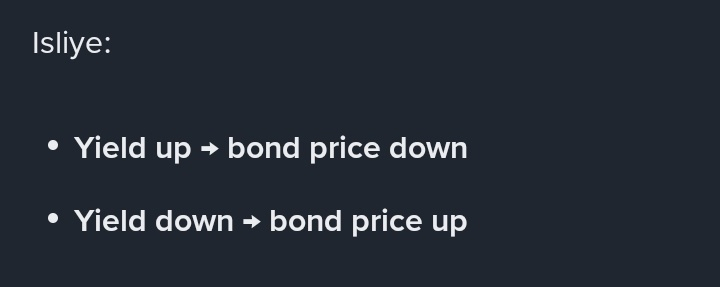
ලිපිය
""Strong growth data se bond yields badh sakti hain, kyunki demand aur inflation dono ka role play#TBF
#TMF
#TMFUSDT
#TBTUSDT
{spot}(TMFBUSDT)
{future}(TMFUSDT)
""Strong growth data se bond yields badh sakti hain, kyunki demand aur inflation dono firm rehne ki possibility hoti hai. Lekin agar growth ke saath inflation soft ho, market reaction more balanced ho sakta hai.""
' ye point muje samaj nahi aya matlab samja firse batao ye kis tarah kam karta hai kis prakar hota hai role play?
Let's again understand it' role play Bilkul—isko ek role-play se samajhte hain.
Sochiye economy ek bazaar hai, aur bond market us bazaar ko dekhkar decide karta hai ki government ko paise udhaar dene ke badle kitna return chahiye—isi return ko yield kehte hain.
Scenario 1: Growth strong hai aur inflation bhi garam ho rahi hai
Data aata hai:
factories zyada production kar rahi hain,
log zyada kharid rahe hain,
jobs aur salaries improve ho rahi hain.
Economy: “Demand strong hai. Log kharch kar rahe hain.”
Businesses: “Customers bahut hain, hum prices badha sakte hain.”
Inflation: “Prices tezi se badhne ka risk hai.”
Central bank: “Inflation control mein rakhne ke liye interest rates high rakhne ya badhane pad sakte hain.”
Bond investor: “Agar future mein interest rates high rahenge, purane low-interest bonds less attractive ho jayenge. Mujhe naya bond kharidne ke liye higher return chahiye.”
Result: Bond sellers ko buyers attract karne ke liye lower price accept karna pad sakta hai.
Bond price neeche → yield upar.
Yaani, strong growth jab inflation ko bhi push kare, to market ko lagta hai rates longer time tak high reh sakte hain. Isliye yields badhne lag sakti hain.
Scenario 2: Growth strong hai, lekin inflation soft hai
Ab wahi strong growth maan lijiye—jobs, output aur spending theek hai—but prices rapidly nahi badh rahe.
Economy: “Growth chal rahi hai.”
Inflation: “Main control mein hoon; prices bahut tezi se nahi badh rahe.”
Central bank: “Growth achchi hai, par inflation calm hai. Humein zaroori nahi ki rates aur high karne padें.”
Bond investor: “High growth zaroor hai, par rate hikes ya long period tak very high rates ka risk utna clear nahi hai.”
Result:
Yields thodi badh sakti hain, kyunki economy strong hai aur borrowing demand high ho sakti hai;
ya stable reh sakti hain, kyunki inflation aur tighter policy ka threat kam hai;
kabhi ghat bhi sakti hain, agar market ko lage growth sustainable hai aur future inflation controlled rahegi.
Isiliye is reaction ko balanced kaha: growth ka positive signal ek taraf hai, lekin soft inflation central bank ko aggressive hone se rok sakti hai.
Ek simple analogy: car aur accelerator
Growth = car ki speed
Inflation = engine ka temperature
Central bank rates = brake
Agar car fast chal rahi hai aur engine overheat ho raha hai, driver brake zyada laga sakta hai.
Yahan: strong growth + high inflation → rate hikes/high rates ka risk → yields up.
Agar car fast chal rahi hai par engine ka temperature normal hai, driver ko hard braking ki zarurat nahi.
Yahan: strong growth + soft inflation → rate hikes ka risk lower → yields ka response limited ya mixed.
Bond price aur yield ka connection
Ek simple example:
Purana bond ₹100 ka hai aur har saal ₹5 interest deta hai.
Iski yield roughly 5% hai.
Agar market ko lagta hai future interest rates higher honge, to ₹5 interest wala bond itna attractive nahi lagega. Iska price, maan lijiye, ₹95 ho jata hai.
Ab wahi ₹5 interest ₹95 ke price ke against mil raha hai—buyer ka effective return badh jaata hai.
Isliye price giri, yield badhi.
Opposite bhi sach hai: bonds ki strong demand aaye to price badhta hai aur yield lower hoti hai.
Yaad rakhne ka shortcut
Strong growth + sticky/high inflation → higher policy rates ka concern → yields par upward pressure.
Strong growth + soft inflation → policy tightening ka concern kam → yields ka move milder ya mixed.
Weak growth + soft inflation → rate cuts/safe-haven demand ka expectation → yields par downward pressure aa sakta hai.
Yeh fixed rule nahi hai, kyunki government borrowing, RBI liquidity, crude oil, US Treasury yields aur foreign investment flows bhi yields ko ek saath influence karte hain.
""Strong growth data se bond yields badh sakti hain, kyunki demand aur inflation dono ka role play
#TBF
#TMF
#TMFUSDT
#TBTUSDT
""Strong growth data se bond yields badh sakti hain, kyunki demand aur inflation dono firm rehne ki possibility hoti hai. Lekin agar growth ke saath inflation soft ho, market reaction more balanced ho sakta hai.""
' ye point muje samaj nahi aya matlab samja firse batao ye kis tarah kam karta hai kis prakar hota hai role play?
Let's again understand it' role play Bilkul—isko ek role-play se samajhte hain.
Sochiye economy ek bazaar hai, aur bond market us bazaar ko dekhkar decide karta hai ki government ko paise udhaar dene ke badle kitna return chahiye—isi return ko yield kehte hain.
Scenario 1: Growth strong hai aur inflation bhi garam ho rahi hai
Data aata hai:
factories zyada production kar rahi hain,
log zyada kharid rahe hain,
jobs aur salaries improve ho rahi hain.
Economy: “Demand strong hai. Log kharch kar rahe hain.”
Businesses: “Customers bahut hain, hum prices badha sakte hain.”
Inflation: “Prices tezi se badhne ka risk hai.”
Central bank: “Inflation control mein rakhne ke liye interest rates high rakhne ya badhane pad sakte hain.”
Bond investor: “Agar future mein interest rates high rahenge, purane low-interest bonds less attractive ho jayenge. Mujhe naya bond kharidne ke liye higher return chahiye.”
Result: Bond sellers ko buyers attract karne ke liye lower price accept karna pad sakta hai.
Bond price neeche → yield upar.
Yaani, strong growth jab inflation ko bhi push kare, to market ko lagta hai rates longer time tak high reh sakte hain. Isliye yields badhne lag sakti hain.
Scenario 2: Growth strong hai, lekin inflation soft hai
Ab wahi strong growth maan lijiye—jobs, output aur spending theek hai—but prices rapidly nahi badh rahe.
Economy: “Growth chal rahi hai.”
Inflation: “Main control mein hoon; prices bahut tezi se nahi badh rahe.”
Central bank: “Growth achchi hai, par inflation calm hai. Humein zaroori nahi ki rates aur high karne padें.”
Bond investor: “High growth zaroor hai, par rate hikes ya long period tak very high rates ka risk utna clear nahi hai.”
Result:
Yields thodi badh sakti hain, kyunki economy strong hai aur borrowing demand high ho sakti hai;
ya stable reh sakti hain, kyunki inflation aur tighter policy ka threat kam hai;
kabhi ghat bhi sakti hain, agar market ko lage growth sustainable hai aur future inflation controlled rahegi.
Isiliye is reaction ko balanced kaha: growth ka positive signal ek taraf hai, lekin soft inflation central bank ko aggressive hone se rok sakti hai.
Ek simple analogy: car aur accelerator
Growth = car ki speed
Inflation = engine ka temperature
Central bank rates = brake
Agar car fast chal rahi hai aur engine overheat ho raha hai, driver brake zyada laga sakta hai.
Yahan: strong growth + high inflation → rate hikes/high rates ka risk → yields up.
Agar car fast chal rahi hai par engine ka temperature normal hai, driver ko hard braking ki zarurat nahi.
Yahan: strong growth + soft inflation → rate hikes ka risk lower → yields ka response limited ya mixed.
Bond price aur yield ka connection
Ek simple example:
Purana bond ₹100 ka hai aur har saal ₹5 interest deta hai.
Iski yield roughly 5% hai.
Agar market ko lagta hai future interest rates higher honge, to ₹5 interest wala bond itna attractive nahi lagega. Iska price, maan lijiye, ₹95 ho jata hai.
Ab wahi ₹5 interest ₹95 ke price ke against mil raha hai—buyer ka effective return badh jaata hai.
Isliye price giri, yield badhi.
Opposite bhi sach hai: bonds ki strong demand aaye to price badhta hai aur yield lower hoti hai.
Yaad rakhne ka shortcut
Strong growth + sticky/high inflation → higher policy rates ka concern → yields par upward pressure.
Strong growth + soft inflation → policy tightening ka concern kam → yields ka move milder ya mixed.
Weak growth + soft inflation → rate cuts/safe-haven demand ka expectation → yields par downward pressure aa sakta hai.
Yeh fixed rule nahi hai, kyunki government borrowing, RBI liquidity, crude oil, US Treasury yields aur foreign investment flows bhi yields ko ek saath influence karte hain.
#TMF
#TMFUSDT
#TBTUSDT
""Strong growth data se bond yields badh sakti hain, kyunki demand aur inflation dono firm rehne ki possibility hoti hai. Lekin agar growth ke saath inflation soft ho, market reaction more balanced ho sakta hai.""
' ye point muje samaj nahi aya matlab samja firse batao ye kis tarah kam karta hai kis prakar hota hai role play?
Let's again understand it' role play Bilkul—isko ek role-play se samajhte hain.
Sochiye economy ek bazaar hai, aur bond market us bazaar ko dekhkar decide karta hai ki government ko paise udhaar dene ke badle kitna return chahiye—isi return ko yield kehte hain.
Scenario 1: Growth strong hai aur inflation bhi garam ho rahi hai
Data aata hai:
factories zyada production kar rahi hain,
log zyada kharid rahe hain,
jobs aur salaries improve ho rahi hain.
Economy: “Demand strong hai. Log kharch kar rahe hain.”
Businesses: “Customers bahut hain, hum prices badha sakte hain.”
Inflation: “Prices tezi se badhne ka risk hai.”
Central bank: “Inflation control mein rakhne ke liye interest rates high rakhne ya badhane pad sakte hain.”
Bond investor: “Agar future mein interest rates high rahenge, purane low-interest bonds less attractive ho jayenge. Mujhe naya bond kharidne ke liye higher return chahiye.”
Result: Bond sellers ko buyers attract karne ke liye lower price accept karna pad sakta hai.
Bond price neeche → yield upar.
Yaani, strong growth jab inflation ko bhi push kare, to market ko lagta hai rates longer time tak high reh sakte hain. Isliye yields badhne lag sakti hain.
Scenario 2: Growth strong hai, lekin inflation soft hai
Ab wahi strong growth maan lijiye—jobs, output aur spending theek hai—but prices rapidly nahi badh rahe.
Economy: “Growth chal rahi hai.”
Inflation: “Main control mein hoon; prices bahut tezi se nahi badh rahe.”
Central bank: “Growth achchi hai, par inflation calm hai. Humein zaroori nahi ki rates aur high karne padें.”
Bond investor: “High growth zaroor hai, par rate hikes ya long period tak very high rates ka risk utna clear nahi hai.”
Result:
Yields thodi badh sakti hain, kyunki economy strong hai aur borrowing demand high ho sakti hai;
ya stable reh sakti hain, kyunki inflation aur tighter policy ka threat kam hai;
kabhi ghat bhi sakti hain, agar market ko lage growth sustainable hai aur future inflation controlled rahegi.
Isiliye is reaction ko balanced kaha: growth ka positive signal ek taraf hai, lekin soft inflation central bank ko aggressive hone se rok sakti hai.
Ek simple analogy: car aur accelerator
Growth = car ki speed
Inflation = engine ka temperature
Central bank rates = brake
Agar car fast chal rahi hai aur engine overheat ho raha hai, driver brake zyada laga sakta hai.
Yahan: strong growth + high inflation → rate hikes/high rates ka risk → yields up.
Agar car fast chal rahi hai par engine ka temperature normal hai, driver ko hard braking ki zarurat nahi.
Yahan: strong growth + soft inflation → rate hikes ka risk lower → yields ka response limited ya mixed.
Bond price aur yield ka connection
Ek simple example:
Purana bond ₹100 ka hai aur har saal ₹5 interest deta hai.
Iski yield roughly 5% hai.
Agar market ko lagta hai future interest rates higher honge, to ₹5 interest wala bond itna attractive nahi lagega. Iska price, maan lijiye, ₹95 ho jata hai.
Ab wahi ₹5 interest ₹95 ke price ke against mil raha hai—buyer ka effective return badh jaata hai.
Isliye price giri, yield badhi.
Opposite bhi sach hai: bonds ki strong demand aaye to price badhta hai aur yield lower hoti hai.
Yaad rakhne ka shortcut
Strong growth + sticky/high inflation → higher policy rates ka concern → yields par upward pressure.
Strong growth + soft inflation → policy tightening ka concern kam → yields ka move milder ya mixed.
Weak growth + soft inflation → rate cuts/safe-haven demand ka expectation → yields par downward pressure aa sakta hai.
Yeh fixed rule nahi hai, kyunki government borrowing, RBI liquidity, crude oil, US Treasury yields aur foreign investment flows bhi yields ko ek saath influence karte hain.
3
127

ලිපිය
TBTUSDT#tbt
#TBTUSDT
{future}(TBTUSDT)
{etf_us}(TBT.ETF)
TBTUSDT Perpetual Contract ka matlab hai ki ye ek USDT-settled perpetual contract hai jo ProShares UltraShort 20+ Year Treasury ETF (ticker: TBT) ki price movement ko track karta hai—ye aapko actual ETF shares own karaye bina uski price exposure deta hai.
TBT khud kya hai?
TBT ek leveraged inverse ETF hai. Iska objective US long-term Treasury bonds—khaaskar 20+ year maturity wale bonds—ke daily performance ka lagbhag ulta aur 2x exposure dena hai.
Simplified relation:
Long-term US Treasury bond prices girti hain → TBT aam taur par badhta hai
Long-term US Treasury bond prices badhti hain → TBT aam taur par girta hai
Long-term yields badhti hain → bond prices aam taur par girti hain → TBT ko support mil sakta hai
Long-term yields girti hain → bond prices aam taur par badhti hain → TBT par pressure aa sakta hai
Isliye TBT ko broadly “long-duration US government bonds ke against inverse bet” samjha ja sakta hai—lekin ye daily-reset product hai.
“2x inverse” ka practical meaning
Agar underlying long-term Treasury index ek din mein 1% neeche jata hai, to TBT ka target roughly 2% upar jana hota hai. Agar index 1% upar jata hai, TBT ka target roughly 2% neeche hota hai.
Lekin yeh daily target hai, long-term fixed relationship nahi. Roz rebalance hone ki wajah se volatile/choppy market mein compounding effect aa sakta hai. Isliye 1 mahine mein bond index ka total move aur TBT ka “exact -2x” return match karna zaroori nahi.
TBTUSDT perpetual actual mein kaise kaam karta hai?
Aap TBT ETF nahi kharid rahe. Aap ek derivative contract trade kar rahe hote hain:
Quote currency / settlement: USDT
Reference asset: TBT ETF
Perpetual: koi fixed expiry date nahi hoti
Long position: contract price badhne par value badh sakti hai; girne par loss ho sakta hai
Short position: contract price girne par value badh sakti hai; badhne par loss ho sakta hai
Margin: position maintain karne ke liye collateral use hota hai
Liquidation risk: leverage ke saath adverse move par margin insufficient ho sakta hai aur position forcibly close ho sakti hai
Yahan aapka PnL contract ke entry aur exit/mark price ke difference se banta hai; aapko TBT ke shareholder rights, cash dividends, ya ETF voting rights nahi milte.
Price TBT ko kaise track karti hai?
Contract ka price underlying TBT reference price ke aas-paas rehne ke liye designed hota hai. Perpetual structure mein aam taur par mark price, index/reference price aur funding mechanism use hote hain, taaki contract ka market price reference se bahut door na chala jaye.
Do alag cheezein yaad rakhein:
TBT ki reference price: US equity-market hours mein underlying ETF ki trading se linked hoti hai.
Perpetual contract price: crypto-style market mein zyada lambe hours tak trade ho sakta hai, isliye US market band hone par liquidity, spreads aur reference-price updates ka behavior alag ho sakta hai.
Is wajah se off-hours mein contract movement aur underlying ETF ke previous close mein temporary gap ho sakta hai.
Funding rate kyun hota hai?
Perpetual contract ki expiry nahi hoti; funding rate longs aur shorts ke beech periodic payment mechanism hota hai.
Funding positive ho to aam taur par longs shorts ko payment karte hain.
Funding negative ho to aam taur par shorts longs ko payment karte hain.
Funding rate platform fee nahi hoti; eligible open-position holders ke beech transfer hoti hai. Lekin bar-bar funding payments leveraged position ki carrying cost ko materially affect kar sakte hain.
TBT ke major drivers kya hain?
TBTUSDT ko samajhne ke liye sirf crypto charts dekhna kaafi nahi—US rates market bhi dekhna hota hai:
US 20-year / 30-year Treasury yields
Long-end yields mein changes sabse important drivers hain.
Federal Reserve policy expectations
Rate cuts/hikes, policy guidance aur inflation outlook long-duration bonds ko affect karte hain.
US inflation data
CPI, PCE, wage data inflation expectations aur yields ko move kar sakte hain.
Jobs data
Payrolls, unemployment aur wage growth bond-market pricing ko affect kar sakte hain.
Treasury auctions and fiscal supply
Long-term Treasury issuance aur auction demand weak/strong hone par yields move kar sakti hain.
Risk-off events
Recession fear ya global stress mein investors Treasuries kharid sakte hain; us situation mein bond prices badhkar TBT ko pressure de sakti hain.
Ismein double layer risk kyun hai?
TBTUSDT mein risk do layers mein aa sakta hai:
Layer 1: TBT itself leveraged inverse ETF hai. Daily reset aur compounding effect hota hai.
Layer 2: Perpetual contract leverage. Futures leverage se gains aur losses dono amplify ho sakte hain.
Isliye underlying bond market ka chhota move bhi TBT mein larger move aur phir leveraged contract position mein aur larger PnL swing create kar sakta hai.
Simple hypothetical example
Maan lijiye long-term Treasury index ek trading day mein 1% girta hai. TBT ka stated daily target roughly +2% ke aas-paas ho sakta hai, before fees, tracking differences aur market conditions.
Agar TBTUSDT bhi us reference move ko closely follow kare, to contract price upward move dikha sakta hai. Lekin exact result guaranteed nahi hota, kyunki ETF tracking, contract premium/discount, liquidity, funding, spreads aur off-hours pricing alag effect daal sakte hain.
Ye normal BTC perpetual se kaise different hai?
| Aspect | BTCUSDT Perpetual | TBTUSDT Perpetual |
|---|---|---|
| Reference asset | BTC | US-listed leveraged inverse Treasury ETF |
| Main drivers | Crypto demand, liquidity, macro, on-chain sentiment | US bond yields, inflation, Fed expectations, Treasury auctions |
| Underlying market hours | Crypto, 24/7 | US equity-market linked |
| Embedded leverage in underlying | Nahi | Haan, TBT itself daily 2x inverse exposure deta hai |
| Key risk | Crypto volatility | Rates volatility + daily-reset decay + perpetual leverage |
Bottom line
TBTUSDT ko ek macro/rates derivative ki tarah samjhiye. Isme view long-term US Treasury bond prices aur yields par hota hai, lekin underlying exposure already inverse aur daily leveraged hai. Isliye ye instrument simple “US bonds up/down” contract se zyada complex hai—especially jab position leveraged ho ya US market hours ke bahar trade ho.
Yeh product information hai, investment advice nahi hai.
TBTUSDT
#tbt
#TBTUSDT
TBTUSDT Perpetual Contract ka matlab hai ki ye ek USDT-settled perpetual contract hai jo ProShares UltraShort 20+ Year Treasury ETF (ticker: TBT) ki price movement ko track karta hai—ye aapko actual ETF shares own karaye bina uski price exposure deta hai.
TBT khud kya hai?
TBT ek leveraged inverse ETF hai. Iska objective US long-term Treasury bonds—khaaskar 20+ year maturity wale bonds—ke daily performance ka lagbhag ulta aur 2x exposure dena hai.
Simplified relation:
Long-term US Treasury bond prices girti hain → TBT aam taur par badhta hai
Long-term US Treasury bond prices badhti hain → TBT aam taur par girta hai
Long-term yields badhti hain → bond prices aam taur par girti hain → TBT ko support mil sakta hai
Long-term yields girti hain → bond prices aam taur par badhti hain → TBT par pressure aa sakta hai
Isliye TBT ko broadly “long-duration US government bonds ke against inverse bet” samjha ja sakta hai—lekin ye daily-reset product hai.
“2x inverse” ka practical meaning
Agar underlying long-term Treasury index ek din mein 1% neeche jata hai, to TBT ka target roughly 2% upar jana hota hai. Agar index 1% upar jata hai, TBT ka target roughly 2% neeche hota hai.
Lekin yeh daily target hai, long-term fixed relationship nahi. Roz rebalance hone ki wajah se volatile/choppy market mein compounding effect aa sakta hai. Isliye 1 mahine mein bond index ka total move aur TBT ka “exact -2x” return match karna zaroori nahi.
TBTUSDT perpetual actual mein kaise kaam karta hai?
Aap TBT ETF nahi kharid rahe. Aap ek derivative contract trade kar rahe hote hain:
Quote currency / settlement: USDT
Reference asset: TBT ETF
Perpetual: koi fixed expiry date nahi hoti
Long position: contract price badhne par value badh sakti hai; girne par loss ho sakta hai
Short position: contract price girne par value badh sakti hai; badhne par loss ho sakta hai
Margin: position maintain karne ke liye collateral use hota hai
Liquidation risk: leverage ke saath adverse move par margin insufficient ho sakta hai aur position forcibly close ho sakti hai
Yahan aapka PnL contract ke entry aur exit/mark price ke difference se banta hai; aapko TBT ke shareholder rights, cash dividends, ya ETF voting rights nahi milte.
Price TBT ko kaise track karti hai?
Contract ka price underlying TBT reference price ke aas-paas rehne ke liye designed hota hai. Perpetual structure mein aam taur par mark price, index/reference price aur funding mechanism use hote hain, taaki contract ka market price reference se bahut door na chala jaye.
Do alag cheezein yaad rakhein:
TBT ki reference price: US equity-market hours mein underlying ETF ki trading se linked hoti hai.
Perpetual contract price: crypto-style market mein zyada lambe hours tak trade ho sakta hai, isliye US market band hone par liquidity, spreads aur reference-price updates ka behavior alag ho sakta hai.
Is wajah se off-hours mein contract movement aur underlying ETF ke previous close mein temporary gap ho sakta hai.
Funding rate kyun hota hai?
Perpetual contract ki expiry nahi hoti; funding rate longs aur shorts ke beech periodic payment mechanism hota hai.
Funding positive ho to aam taur par longs shorts ko payment karte hain.
Funding negative ho to aam taur par shorts longs ko payment karte hain.
Funding rate platform fee nahi hoti; eligible open-position holders ke beech transfer hoti hai. Lekin bar-bar funding payments leveraged position ki carrying cost ko materially affect kar sakte hain.
TBT ke major drivers kya hain?
TBTUSDT ko samajhne ke liye sirf crypto charts dekhna kaafi nahi—US rates market bhi dekhna hota hai:
US 20-year / 30-year Treasury yields
Long-end yields mein changes sabse important drivers hain.
Federal Reserve policy expectations
Rate cuts/hikes, policy guidance aur inflation outlook long-duration bonds ko affect karte hain.
US inflation data
CPI, PCE, wage data inflation expectations aur yields ko move kar sakte hain.
Jobs data
Payrolls, unemployment aur wage growth bond-market pricing ko affect kar sakte hain.
Treasury auctions and fiscal supply
Long-term Treasury issuance aur auction demand weak/strong hone par yields move kar sakti hain.
Risk-off events
Recession fear ya global stress mein investors Treasuries kharid sakte hain; us situation mein bond prices badhkar TBT ko pressure de sakti hain.
Ismein double layer risk kyun hai?
TBTUSDT mein risk do layers mein aa sakta hai:
Layer 1: TBT itself leveraged inverse ETF hai. Daily reset aur compounding effect hota hai.
Layer 2: Perpetual contract leverage. Futures leverage se gains aur losses dono amplify ho sakte hain.
Isliye underlying bond market ka chhota move bhi TBT mein larger move aur phir leveraged contract position mein aur larger PnL swing create kar sakta hai.
Simple hypothetical example
Maan lijiye long-term Treasury index ek trading day mein 1% girta hai. TBT ka stated daily target roughly +2% ke aas-paas ho sakta hai, before fees, tracking differences aur market conditions.
Agar TBTUSDT bhi us reference move ko closely follow kare, to contract price upward move dikha sakta hai. Lekin exact result guaranteed nahi hota, kyunki ETF tracking, contract premium/discount, liquidity, funding, spreads aur off-hours pricing alag effect daal sakte hain.
Ye normal BTC perpetual se kaise different hai?
| Aspect | BTCUSDT Perpetual | TBTUSDT Perpetual |
|---|---|---|
| Reference asset | BTC | US-listed leveraged inverse Treasury ETF |
| Main drivers | Crypto demand, liquidity, macro, on-chain sentiment | US bond yields, inflation, Fed expectations, Treasury auctions |
| Underlying market hours | Crypto, 24/7 | US equity-market linked |
| Embedded leverage in underlying | Nahi | Haan, TBT itself daily 2x inverse exposure deta hai |
| Key risk | Crypto volatility | Rates volatility + daily-reset decay + perpetual leverage |
Bottom line
TBTUSDT ko ek macro/rates derivative ki tarah samjhiye. Isme view long-term US Treasury bond prices aur yields par hota hai, lekin underlying exposure already inverse aur daily leveraged hai. Isliye ye instrument simple “US bonds up/down” contract se zyada complex hai—especially jab position leveraged ho ya US market hours ke bahar trade ho.
Yeh product information hai, investment advice nahi hai.
#TBTUSDT
TBTUSDT Perpetual Contract ka matlab hai ki ye ek USDT-settled perpetual contract hai jo ProShares UltraShort 20+ Year Treasury ETF (ticker: TBT) ki price movement ko track karta hai—ye aapko actual ETF shares own karaye bina uski price exposure deta hai.
TBT khud kya hai?
TBT ek leveraged inverse ETF hai. Iska objective US long-term Treasury bonds—khaaskar 20+ year maturity wale bonds—ke daily performance ka lagbhag ulta aur 2x exposure dena hai.
Simplified relation:
Long-term US Treasury bond prices girti hain → TBT aam taur par badhta hai
Long-term US Treasury bond prices badhti hain → TBT aam taur par girta hai
Long-term yields badhti hain → bond prices aam taur par girti hain → TBT ko support mil sakta hai
Long-term yields girti hain → bond prices aam taur par badhti hain → TBT par pressure aa sakta hai
Isliye TBT ko broadly “long-duration US government bonds ke against inverse bet” samjha ja sakta hai—lekin ye daily-reset product hai.
“2x inverse” ka practical meaning
Agar underlying long-term Treasury index ek din mein 1% neeche jata hai, to TBT ka target roughly 2% upar jana hota hai. Agar index 1% upar jata hai, TBT ka target roughly 2% neeche hota hai.
Lekin yeh daily target hai, long-term fixed relationship nahi. Roz rebalance hone ki wajah se volatile/choppy market mein compounding effect aa sakta hai. Isliye 1 mahine mein bond index ka total move aur TBT ka “exact -2x” return match karna zaroori nahi.
TBTUSDT perpetual actual mein kaise kaam karta hai?
Aap TBT ETF nahi kharid rahe. Aap ek derivative contract trade kar rahe hote hain:
Quote currency / settlement: USDT
Reference asset: TBT ETF
Perpetual: koi fixed expiry date nahi hoti
Long position: contract price badhne par value badh sakti hai; girne par loss ho sakta hai
Short position: contract price girne par value badh sakti hai; badhne par loss ho sakta hai
Margin: position maintain karne ke liye collateral use hota hai
Liquidation risk: leverage ke saath adverse move par margin insufficient ho sakta hai aur position forcibly close ho sakti hai
Yahan aapka PnL contract ke entry aur exit/mark price ke difference se banta hai; aapko TBT ke shareholder rights, cash dividends, ya ETF voting rights nahi milte.
Price TBT ko kaise track karti hai?
Contract ka price underlying TBT reference price ke aas-paas rehne ke liye designed hota hai. Perpetual structure mein aam taur par mark price, index/reference price aur funding mechanism use hote hain, taaki contract ka market price reference se bahut door na chala jaye.
Do alag cheezein yaad rakhein:
TBT ki reference price: US equity-market hours mein underlying ETF ki trading se linked hoti hai.
Perpetual contract price: crypto-style market mein zyada lambe hours tak trade ho sakta hai, isliye US market band hone par liquidity, spreads aur reference-price updates ka behavior alag ho sakta hai.
Is wajah se off-hours mein contract movement aur underlying ETF ke previous close mein temporary gap ho sakta hai.
Funding rate kyun hota hai?
Perpetual contract ki expiry nahi hoti; funding rate longs aur shorts ke beech periodic payment mechanism hota hai.
Funding positive ho to aam taur par longs shorts ko payment karte hain.
Funding negative ho to aam taur par shorts longs ko payment karte hain.
Funding rate platform fee nahi hoti; eligible open-position holders ke beech transfer hoti hai. Lekin bar-bar funding payments leveraged position ki carrying cost ko materially affect kar sakte hain.
TBT ke major drivers kya hain?
TBTUSDT ko samajhne ke liye sirf crypto charts dekhna kaafi nahi—US rates market bhi dekhna hota hai:
US 20-year / 30-year Treasury yields
Long-end yields mein changes sabse important drivers hain.
Federal Reserve policy expectations
Rate cuts/hikes, policy guidance aur inflation outlook long-duration bonds ko affect karte hain.
US inflation data
CPI, PCE, wage data inflation expectations aur yields ko move kar sakte hain.
Jobs data
Payrolls, unemployment aur wage growth bond-market pricing ko affect kar sakte hain.
Treasury auctions and fiscal supply
Long-term Treasury issuance aur auction demand weak/strong hone par yields move kar sakti hain.
Risk-off events
Recession fear ya global stress mein investors Treasuries kharid sakte hain; us situation mein bond prices badhkar TBT ko pressure de sakti hain.
Ismein double layer risk kyun hai?
TBTUSDT mein risk do layers mein aa sakta hai:
Layer 1: TBT itself leveraged inverse ETF hai. Daily reset aur compounding effect hota hai.
Layer 2: Perpetual contract leverage. Futures leverage se gains aur losses dono amplify ho sakte hain.
Isliye underlying bond market ka chhota move bhi TBT mein larger move aur phir leveraged contract position mein aur larger PnL swing create kar sakta hai.
Simple hypothetical example
Maan lijiye long-term Treasury index ek trading day mein 1% girta hai. TBT ka stated daily target roughly +2% ke aas-paas ho sakta hai, before fees, tracking differences aur market conditions.
Agar TBTUSDT bhi us reference move ko closely follow kare, to contract price upward move dikha sakta hai. Lekin exact result guaranteed nahi hota, kyunki ETF tracking, contract premium/discount, liquidity, funding, spreads aur off-hours pricing alag effect daal sakte hain.
Ye normal BTC perpetual se kaise different hai?
| Aspect | BTCUSDT Perpetual | TBTUSDT Perpetual |
|---|---|---|
| Reference asset | BTC | US-listed leveraged inverse Treasury ETF |
| Main drivers | Crypto demand, liquidity, macro, on-chain sentiment | US bond yields, inflation, Fed expectations, Treasury auctions |
| Underlying market hours | Crypto, 24/7 | US equity-market linked |
| Embedded leverage in underlying | Nahi | Haan, TBT itself daily 2x inverse exposure deta hai |
| Key risk | Crypto volatility | Rates volatility + daily-reset decay + perpetual leverage |
Bottom line
TBTUSDT ko ek macro/rates derivative ki tarah samjhiye. Isme view long-term US Treasury bond prices aur yields par hota hai, lekin underlying exposure already inverse aur daily leveraged hai. Isliye ye instrument simple “US bonds up/down” contract se zyada complex hai—especially jab position leveraged ho ya US market hours ke bahar trade ho.
Yeh product information hai, investment advice nahi hai.
TBTETF-0.05%
TBT-1.42%
2
95

ලිපිය
TBTUSDT perpetual#TBTUSDT
{future}(TBTUSDT)
isko samajhne ka sabse important point yeh hai ki TBTUSDT ek “double-layer derivative” hai:
TBT khud US long-term Treasury bonds ke opposite direction mein daily leveraged ETF hai.
TBTUSDT perpetual us TBT ETF ki price ko track karne wala USDT-margined perpetual contract hai.
Isliye yeh direct Treasury bond, normal stock, ya BTC perpetual jaisa simple instrument nahi hai.
1) Sabse pehle: TBT kya track karta hai?
TBT = ProShares UltraShort 20+ Year Treasury ETF.
Yeh ETF US government ke bahut long-duration Treasury bonds—20 saal ya usse zyada maturity wale bonds—ke daily performance ka approximately -2x target karta hai.
Aasaan bhaasha mein:
Long-term Treasury bond prices down → TBT generally up
Long-term Treasury bond prices up → TBT generally down
Long-term Treasury yields up → bonds ka price usually down → TBT ko support mil sakta hai
Long-term Treasury yields down → bonds ka price usually up → TBT pressure mein aa sakta hai
Yeh relationship bond-price aur yield ke inverse relation se aata hai.
2) Bond prices aur yields opposite kyun hote hain?
Maan lijiye purana bond 4% interest de raha hai. Agar market mein naye bonds 5% dene lagen, to purane 4% bond ki demand kam hoti hai. Uska market price neeche jaata hai—taaki uska effective return naye 5% yield ke kareeb aa sake.
Isliye:
Yield up → bond price down
Yield down → bond price up
TBT isi long-duration bond-price movement ke against exposure banata hai.
3) “UltraShort” aur “2x inverse” exactly kya matlab hai?
“UltraShort” ka matlab yahan short-duration bond nahi hai. Iska matlab short/inverse exposure hai.
Agar target Treasury index ek din mein:
1% girta hai, TBT ka daily objective lagbhag 2% badhna hota hai.
1% badhta hai, TBT ka daily objective lagbhag 2% girna hota hai.
Lekin yeh sirf daily basis par target hai. Yeh kehna galat hoga ki “bond index 1 mahine mein 10% gira, to TBT hamesha 20% badhega.”
4) Daily reset: sabse bada hidden concept
TBT daily rebalance hota hai. Har trading day ke end par fund apna exposure reset karta hai, taaki agle din ke liye phir se approximately -2x exposure rahe.
Isse compounding effect aata hai.
Hypothetical example
Underlying bond index:
Day 1: -10%
Day 2: +11.11%
Do din baad index roughly apni starting level par wapas aa gaya.
Lekin -2x daily target ke hisaab se TBT ka rough sequence:
Day 1: +20%
Day 2: -22.22%
Result: TBT starting level par exactly wapas nahi aata; woh lower reh sakta hai. Isse volatile sideways market mein volatility decay ya path dependency kaha jaata hai.
Isliye TBT ko long holding period ke liye sirf “2x inverse bond” samajhna incomplete hai. Daily path matter karta hai.
5) TBTUSDT Perpetual mein aap actual TBT ETF nahi kharidte
Jab aap TBTUSDT perpetual trade karte hain:
aap actual US-listed TBT ETF shares own nahi karte;
aapko shareholder rights nahi milte;
ETF ka dividend aapko directly nahi milta;
aap USDT collateral ke against contract ki price move par exposure lete hain;
aapka profit/loss entry price aur exit/mark price ke difference se determine hota hai.
Yaani yeh contract TBT ke market movement ko represent karta hai, TBT ownership ko nahi.
6) “Tracks the price” ka actual mechanism
Contract ke paas ek reference/index price hota hai jo underlying TBT ETF ki price information se related hota hai. Perpetual contract ka traded price us reference ke aas-paas rehne ke liye design kiya jata hai.
Is process mein aam taur par teen cheezein important hoti hain:
Index/reference price: underlying TBT ka benchmark price
Mark price: unrealized PnL aur liquidation calculation ke liye fair-price estimate
Funding mechanism: perpetual contract ko reference ke close rakhne ka mechanism
Agar futures perpetual price reference se zyada premium par trade kare, funding longs ke liye expensive ho sakti hai; agar discount ho, funding dynamics reverse ho sakte hain. Exact funding har settlement period mein market conditions se change hoti hai.
7) Funding rate kaise kaam karti hai?
Perpetual contract ki koi expiry nahi hoti. Funding rate longs aur shorts ke beech periodic transfer hai—yeh generally Binance ki trading fee nahi hoti.
Positive funding: longs, shorts ko pay karte hain
Negative funding: shorts, longs ko pay karte hain
Agar aap funding timestamp par position hold karte hain, funding payment ya receipt PnL ko affect kar sakti hai. Long-term holding mein funding cost, spread aur fees ka effect important ho sakta hai.
8) TBTUSDT 24/7 hota hai, lekin TBT ETF nahi
TBT ETF US market structure se linked hai, jabki perpetual contract crypto-market style access de sakta hai. Isliye US equity market closed hone par aapko kuch extra risks samajhne chahiye:
underlying ETF ka fresh cash-market price available na ho;
contract liquidity kam ho sakti hai;
bid–ask spread wide ho sakta hai;
market reopening par gap risk aa sakta hai;
macro news ke baad underlying ETF aur contract ke reference dynamics abruptly adjust ho sakte hain.
Yeh weekend ya US market close ke aas-paas especially relevant ho sakta hai.
9) TBTUSDT ke main market drivers
TBTUSDT ka direction largely US long-end interest-rate market se influenced hota hai—not crypto-specific narratives se.
Important drivers
US 20-year aur 30-year Treasury yields
Federal Reserve policy expectations
US CPI / PCE inflation data
Jobs data: payrolls, unemployment, wages
Treasury auction demand aur government borrowing supply
Economic growth / recession expectations
Risk-off events: safe-haven demand Treasuries mein aa sakti hai
US fiscal deficit aur long-term inflation expectations
Agar inflation expectations ya term premium increase ho, long-term yields move kar sakti hain. Agar growth scare ya risk-off mood aaye, investors long-term Treasuries ki taraf ja sakte hain. Lekin koi bhi ek factor future move ko guarantee nahi karta.
10) Ismein risk “double” kyun ho sakta hai?
TBTUSDT mein do leverage-like layers hoti hain:
| Layer | Kya hota hai |
|---|---|
| Underlying layer | TBT khud daily approximately -2x Treasury exposure target karta hai |
| Contract layer | Perpetual contract par leverage available ho sakta hai |
Isliye long-duration Treasury market mein relatively modest move bhi TBT mein amplified move bana sakta hai, aur agar perpetual position par leverage use ho to PnL swings aur bade ho sakte hain.
Saath mein funding, spread, mark-price movement, liquidation threshold aur overnight/weekend gap ka risk bhi hota hai.
11) Long aur short position ka economic meaning
Agar koi TBTUSDT long karta hai
Uska exposure broadly tab favorable ho sakta hai jab:
TBT reference price upar jaye;
long-term Treasury bond prices neeche aayen;
long-term yields upar move karein.
Agar koi TBTUSDT short karta hai
Uska exposure broadly tab favorable ho sakta hai jab:
TBT reference price neeche aaye;
long-term Treasury bond prices upar jaayen;
long-term yields neeche move karein.
Yeh sirf payoff direction explain karta hai, kisi trade ko initiate ya hold karne ka signal nahi hai.
12) Normal bond ETF, TBT, aur TBTUSDT ka difference
| Product | Exposure | Daily reset? | Perpetual funding? | Actual ownership? |
|---|---|---:|---:|---:|
| Normal Treasury bond ETF | Bond prices ke same direction | Usually nahi | Nahi | ETF shares |
| TBT ETF | Long-duration Treasury bonds ka approx. daily -2x | Haan | Nahi | ETF shares |
| TBTUSDT perpetual | TBT ETF price movement | TBT layer par haan | Haan | Nahi, contract exposure |
13) Is product ko samajhne ke liye kya monitor karein
TBTUSDT dekhte waqt ek hi chart par depend karna incomplete ho sakta hai. Context ke liye dekhein:
TBT ka reference/index price aur contract mark price
Funding rate aur next funding time
Open interest aur liquidity
US 20Y/30Y yields
US inflation, jobs aur Fed calendar
US Treasury auction schedule
US market trading hours aur upcoming holiday closures
Bottom line: TBTUSDT ek macro-focused perpetual contract hai jo ek already leveraged inverse ETF ko track karta hai. Yeh essentially long-term US Treasury bond market, yields, inflation aur Fed expectations se linked exposure deta hai—magar daily-reset effect aur perpetual-contract mechanics ke kaaran iski risk profile ordinary bond exposure se kaafi different ho sakti hai.
TBTUSDT perpetual
#TBTUSDT
isko samajhne ka sabse important point yeh hai ki TBTUSDT ek “double-layer derivative” hai:
TBT khud US long-term Treasury bonds ke opposite direction mein daily leveraged ETF hai.
TBTUSDT perpetual us TBT ETF ki price ko track karne wala USDT-margined perpetual contract hai.
Isliye yeh direct Treasury bond, normal stock, ya BTC perpetual jaisa simple instrument nahi hai.
1) Sabse pehle: TBT kya track karta hai?
TBT = ProShares UltraShort 20+ Year Treasury ETF.
Yeh ETF US government ke bahut long-duration Treasury bonds—20 saal ya usse zyada maturity wale bonds—ke daily performance ka approximately -2x target karta hai.
Aasaan bhaasha mein:
Long-term Treasury bond prices down → TBT generally up
Long-term Treasury bond prices up → TBT generally down
Long-term Treasury yields up → bonds ka price usually down → TBT ko support mil sakta hai
Long-term Treasury yields down → bonds ka price usually up → TBT pressure mein aa sakta hai
Yeh relationship bond-price aur yield ke inverse relation se aata hai.
2) Bond prices aur yields opposite kyun hote hain?
Maan lijiye purana bond 4% interest de raha hai. Agar market mein naye bonds 5% dene lagen, to purane 4% bond ki demand kam hoti hai. Uska market price neeche jaata hai—taaki uska effective return naye 5% yield ke kareeb aa sake.
Isliye:
Yield up → bond price down
Yield down → bond price up
TBT isi long-duration bond-price movement ke against exposure banata hai.
3) “UltraShort” aur “2x inverse” exactly kya matlab hai?
“UltraShort” ka matlab yahan short-duration bond nahi hai. Iska matlab short/inverse exposure hai.
Agar target Treasury index ek din mein:
1% girta hai, TBT ka daily objective lagbhag 2% badhna hota hai.
1% badhta hai, TBT ka daily objective lagbhag 2% girna hota hai.
Lekin yeh sirf daily basis par target hai. Yeh kehna galat hoga ki “bond index 1 mahine mein 10% gira, to TBT hamesha 20% badhega.”
4) Daily reset: sabse bada hidden concept
TBT daily rebalance hota hai. Har trading day ke end par fund apna exposure reset karta hai, taaki agle din ke liye phir se approximately -2x exposure rahe.
Isse compounding effect aata hai.
Hypothetical example
Underlying bond index:
Day 1: -10%
Day 2: +11.11%
Do din baad index roughly apni starting level par wapas aa gaya.
Lekin -2x daily target ke hisaab se TBT ka rough sequence:
Day 1: +20%
Day 2: -22.22%
Result: TBT starting level par exactly wapas nahi aata; woh lower reh sakta hai. Isse volatile sideways market mein volatility decay ya path dependency kaha jaata hai.
Isliye TBT ko long holding period ke liye sirf “2x inverse bond” samajhna incomplete hai. Daily path matter karta hai.
5) TBTUSDT Perpetual mein aap actual TBT ETF nahi kharidte
Jab aap TBTUSDT perpetual trade karte hain:
aap actual US-listed TBT ETF shares own nahi karte;
aapko shareholder rights nahi milte;
ETF ka dividend aapko directly nahi milta;
aap USDT collateral ke against contract ki price move par exposure lete hain;
aapka profit/loss entry price aur exit/mark price ke difference se determine hota hai.
Yaani yeh contract TBT ke market movement ko represent karta hai, TBT ownership ko nahi.
6) “Tracks the price” ka actual mechanism
Contract ke paas ek reference/index price hota hai jo underlying TBT ETF ki price information se related hota hai. Perpetual contract ka traded price us reference ke aas-paas rehne ke liye design kiya jata hai.
Is process mein aam taur par teen cheezein important hoti hain:
Index/reference price: underlying TBT ka benchmark price
Mark price: unrealized PnL aur liquidation calculation ke liye fair-price estimate
Funding mechanism: perpetual contract ko reference ke close rakhne ka mechanism
Agar futures perpetual price reference se zyada premium par trade kare, funding longs ke liye expensive ho sakti hai; agar discount ho, funding dynamics reverse ho sakte hain. Exact funding har settlement period mein market conditions se change hoti hai.
7) Funding rate kaise kaam karti hai?
Perpetual contract ki koi expiry nahi hoti. Funding rate longs aur shorts ke beech periodic transfer hai—yeh generally Binance ki trading fee nahi hoti.
Positive funding: longs, shorts ko pay karte hain
Negative funding: shorts, longs ko pay karte hain
Agar aap funding timestamp par position hold karte hain, funding payment ya receipt PnL ko affect kar sakti hai. Long-term holding mein funding cost, spread aur fees ka effect important ho sakta hai.
8) TBTUSDT 24/7 hota hai, lekin TBT ETF nahi
TBT ETF US market structure se linked hai, jabki perpetual contract crypto-market style access de sakta hai. Isliye US equity market closed hone par aapko kuch extra risks samajhne chahiye:
underlying ETF ka fresh cash-market price available na ho;
contract liquidity kam ho sakti hai;
bid–ask spread wide ho sakta hai;
market reopening par gap risk aa sakta hai;
macro news ke baad underlying ETF aur contract ke reference dynamics abruptly adjust ho sakte hain.
Yeh weekend ya US market close ke aas-paas especially relevant ho sakta hai.
9) TBTUSDT ke main market drivers
TBTUSDT ka direction largely US long-end interest-rate market se influenced hota hai—not crypto-specific narratives se.
Important drivers
US 20-year aur 30-year Treasury yields
Federal Reserve policy expectations
US CPI / PCE inflation data
Jobs data: payrolls, unemployment, wages
Treasury auction demand aur government borrowing supply
Economic growth / recession expectations
Risk-off events: safe-haven demand Treasuries mein aa sakti hai
US fiscal deficit aur long-term inflation expectations
Agar inflation expectations ya term premium increase ho, long-term yields move kar sakti hain. Agar growth scare ya risk-off mood aaye, investors long-term Treasuries ki taraf ja sakte hain. Lekin koi bhi ek factor future move ko guarantee nahi karta.
10) Ismein risk “double” kyun ho sakta hai?
TBTUSDT mein do leverage-like layers hoti hain:
| Layer | Kya hota hai |
|---|---|
| Underlying layer | TBT khud daily approximately -2x Treasury exposure target karta hai |
| Contract layer | Perpetual contract par leverage available ho sakta hai |
Isliye long-duration Treasury market mein relatively modest move bhi TBT mein amplified move bana sakta hai, aur agar perpetual position par leverage use ho to PnL swings aur bade ho sakte hain.
Saath mein funding, spread, mark-price movement, liquidation threshold aur overnight/weekend gap ka risk bhi hota hai.
11) Long aur short position ka economic meaning
Agar koi TBTUSDT long karta hai
Uska exposure broadly tab favorable ho sakta hai jab:
TBT reference price upar jaye;
long-term Treasury bond prices neeche aayen;
long-term yields upar move karein.
Agar koi TBTUSDT short karta hai
Uska exposure broadly tab favorable ho sakta hai jab:
TBT reference price neeche aaye;
long-term Treasury bond prices upar jaayen;
long-term yields neeche move karein.
Yeh sirf payoff direction explain karta hai, kisi trade ko initiate ya hold karne ka signal nahi hai.
12) Normal bond ETF, TBT, aur TBTUSDT ka difference
| Product | Exposure | Daily reset? | Perpetual funding? | Actual ownership? |
|---|---|---:|---:|---:|
| Normal Treasury bond ETF | Bond prices ke same direction | Usually nahi | Nahi | ETF shares |
| TBT ETF | Long-duration Treasury bonds ka approx. daily -2x | Haan | Nahi | ETF shares |
| TBTUSDT perpetual | TBT ETF price movement | TBT layer par haan | Haan | Nahi, contract exposure |
13) Is product ko samajhne ke liye kya monitor karein
TBTUSDT dekhte waqt ek hi chart par depend karna incomplete ho sakta hai. Context ke liye dekhein:
TBT ka reference/index price aur contract mark price
Funding rate aur next funding time
Open interest aur liquidity
US 20Y/30Y yields
US inflation, jobs aur Fed calendar
US Treasury auction schedule
US market trading hours aur upcoming holiday closures
Bottom line: TBTUSDT ek macro-focused perpetual contract hai jo ek already leveraged inverse ETF ko track karta hai. Yeh essentially long-term US Treasury bond market, yields, inflation aur Fed expectations se linked exposure deta hai—magar daily-reset effect aur perpetual-contract mechanics ke kaaran iski risk profile ordinary bond exposure se kaafi different ho sakti hai.
isko samajhne ka sabse important point yeh hai ki TBTUSDT ek “double-layer derivative” hai:
TBT khud US long-term Treasury bonds ke opposite direction mein daily leveraged ETF hai.
TBTUSDT perpetual us TBT ETF ki price ko track karne wala USDT-margined perpetual contract hai.
Isliye yeh direct Treasury bond, normal stock, ya BTC perpetual jaisa simple instrument nahi hai.
1) Sabse pehle: TBT kya track karta hai?
TBT = ProShares UltraShort 20+ Year Treasury ETF.
Yeh ETF US government ke bahut long-duration Treasury bonds—20 saal ya usse zyada maturity wale bonds—ke daily performance ka approximately -2x target karta hai.
Aasaan bhaasha mein:
Long-term Treasury bond prices down → TBT generally up
Long-term Treasury bond prices up → TBT generally down
Long-term Treasury yields up → bonds ka price usually down → TBT ko support mil sakta hai
Long-term Treasury yields down → bonds ka price usually up → TBT pressure mein aa sakta hai
Yeh relationship bond-price aur yield ke inverse relation se aata hai.
2) Bond prices aur yields opposite kyun hote hain?
Maan lijiye purana bond 4% interest de raha hai. Agar market mein naye bonds 5% dene lagen, to purane 4% bond ki demand kam hoti hai. Uska market price neeche jaata hai—taaki uska effective return naye 5% yield ke kareeb aa sake.
Isliye:
Yield up → bond price down
Yield down → bond price up
TBT isi long-duration bond-price movement ke against exposure banata hai.
3) “UltraShort” aur “2x inverse” exactly kya matlab hai?
“UltraShort” ka matlab yahan short-duration bond nahi hai. Iska matlab short/inverse exposure hai.
Agar target Treasury index ek din mein:
1% girta hai, TBT ka daily objective lagbhag 2% badhna hota hai.
1% badhta hai, TBT ka daily objective lagbhag 2% girna hota hai.
Lekin yeh sirf daily basis par target hai. Yeh kehna galat hoga ki “bond index 1 mahine mein 10% gira, to TBT hamesha 20% badhega.”
4) Daily reset: sabse bada hidden concept
TBT daily rebalance hota hai. Har trading day ke end par fund apna exposure reset karta hai, taaki agle din ke liye phir se approximately -2x exposure rahe.
Isse compounding effect aata hai.
Hypothetical example
Underlying bond index:
Day 1: -10%
Day 2: +11.11%
Do din baad index roughly apni starting level par wapas aa gaya.
Lekin -2x daily target ke hisaab se TBT ka rough sequence:
Day 1: +20%
Day 2: -22.22%
Result: TBT starting level par exactly wapas nahi aata; woh lower reh sakta hai. Isse volatile sideways market mein volatility decay ya path dependency kaha jaata hai.
Isliye TBT ko long holding period ke liye sirf “2x inverse bond” samajhna incomplete hai. Daily path matter karta hai.
5) TBTUSDT Perpetual mein aap actual TBT ETF nahi kharidte
Jab aap TBTUSDT perpetual trade karte hain:
aap actual US-listed TBT ETF shares own nahi karte;
aapko shareholder rights nahi milte;
ETF ka dividend aapko directly nahi milta;
aap USDT collateral ke against contract ki price move par exposure lete hain;
aapka profit/loss entry price aur exit/mark price ke difference se determine hota hai.
Yaani yeh contract TBT ke market movement ko represent karta hai, TBT ownership ko nahi.
6) “Tracks the price” ka actual mechanism
Contract ke paas ek reference/index price hota hai jo underlying TBT ETF ki price information se related hota hai. Perpetual contract ka traded price us reference ke aas-paas rehne ke liye design kiya jata hai.
Is process mein aam taur par teen cheezein important hoti hain:
Index/reference price: underlying TBT ka benchmark price
Mark price: unrealized PnL aur liquidation calculation ke liye fair-price estimate
Funding mechanism: perpetual contract ko reference ke close rakhne ka mechanism
Agar futures perpetual price reference se zyada premium par trade kare, funding longs ke liye expensive ho sakti hai; agar discount ho, funding dynamics reverse ho sakte hain. Exact funding har settlement period mein market conditions se change hoti hai.
7) Funding rate kaise kaam karti hai?
Perpetual contract ki koi expiry nahi hoti. Funding rate longs aur shorts ke beech periodic transfer hai—yeh generally Binance ki trading fee nahi hoti.
Positive funding: longs, shorts ko pay karte hain
Negative funding: shorts, longs ko pay karte hain
Agar aap funding timestamp par position hold karte hain, funding payment ya receipt PnL ko affect kar sakti hai. Long-term holding mein funding cost, spread aur fees ka effect important ho sakta hai.
8) TBTUSDT 24/7 hota hai, lekin TBT ETF nahi
TBT ETF US market structure se linked hai, jabki perpetual contract crypto-market style access de sakta hai. Isliye US equity market closed hone par aapko kuch extra risks samajhne chahiye:
underlying ETF ka fresh cash-market price available na ho;
contract liquidity kam ho sakti hai;
bid–ask spread wide ho sakta hai;
market reopening par gap risk aa sakta hai;
macro news ke baad underlying ETF aur contract ke reference dynamics abruptly adjust ho sakte hain.
Yeh weekend ya US market close ke aas-paas especially relevant ho sakta hai.
9) TBTUSDT ke main market drivers
TBTUSDT ka direction largely US long-end interest-rate market se influenced hota hai—not crypto-specific narratives se.
Important drivers
US 20-year aur 30-year Treasury yields
Federal Reserve policy expectations
US CPI / PCE inflation data
Jobs data: payrolls, unemployment, wages
Treasury auction demand aur government borrowing supply
Economic growth / recession expectations
Risk-off events: safe-haven demand Treasuries mein aa sakti hai
US fiscal deficit aur long-term inflation expectations
Agar inflation expectations ya term premium increase ho, long-term yields move kar sakti hain. Agar growth scare ya risk-off mood aaye, investors long-term Treasuries ki taraf ja sakte hain. Lekin koi bhi ek factor future move ko guarantee nahi karta.
10) Ismein risk “double” kyun ho sakta hai?
TBTUSDT mein do leverage-like layers hoti hain:
| Layer | Kya hota hai |
|---|---|
| Underlying layer | TBT khud daily approximately -2x Treasury exposure target karta hai |
| Contract layer | Perpetual contract par leverage available ho sakta hai |
Isliye long-duration Treasury market mein relatively modest move bhi TBT mein amplified move bana sakta hai, aur agar perpetual position par leverage use ho to PnL swings aur bade ho sakte hain.
Saath mein funding, spread, mark-price movement, liquidation threshold aur overnight/weekend gap ka risk bhi hota hai.
11) Long aur short position ka economic meaning
Agar koi TBTUSDT long karta hai
Uska exposure broadly tab favorable ho sakta hai jab:
TBT reference price upar jaye;
long-term Treasury bond prices neeche aayen;
long-term yields upar move karein.
Agar koi TBTUSDT short karta hai
Uska exposure broadly tab favorable ho sakta hai jab:
TBT reference price neeche aaye;
long-term Treasury bond prices upar jaayen;
long-term yields neeche move karein.
Yeh sirf payoff direction explain karta hai, kisi trade ko initiate ya hold karne ka signal nahi hai.
12) Normal bond ETF, TBT, aur TBTUSDT ka difference
| Product | Exposure | Daily reset? | Perpetual funding? | Actual ownership? |
|---|---|---:|---:|---:|
| Normal Treasury bond ETF | Bond prices ke same direction | Usually nahi | Nahi | ETF shares |
| TBT ETF | Long-duration Treasury bonds ka approx. daily -2x | Haan | Nahi | ETF shares |
| TBTUSDT perpetual | TBT ETF price movement | TBT layer par haan | Haan | Nahi, contract exposure |
13) Is product ko samajhne ke liye kya monitor karein
TBTUSDT dekhte waqt ek hi chart par depend karna incomplete ho sakta hai. Context ke liye dekhein:
TBT ka reference/index price aur contract mark price
Funding rate aur next funding time
Open interest aur liquidity
US 20Y/30Y yields
US inflation, jobs aur Fed calendar
US Treasury auction schedule
US market trading hours aur upcoming holiday closures
Bottom line: TBTUSDT ek macro-focused perpetual contract hai jo ek already leveraged inverse ETF ko track karta hai. Yeh essentially long-term US Treasury bond market, yields, inflation aur Fed expectations se linked exposure deta hai—magar daily-reset effect aur perpetual-contract mechanics ke kaaran iski risk profile ordinary bond exposure se kaafi different ho sakti hai.
2
99
imp
imp


Binance Academy
·
--
如何在币安合约平台交易 POPMART、TMF、TBT 和 BITO
免责声明:本内容仅作一般资讯及教育用途。您所在地区可能不提供本文提及的产品。
要点
币安合约于 2026 年 7 月 23 日至 27 日期间上线 4 个 [TradFi](https://www.binance.com/en/academy/glossary/tradfi) 永续合约:POPMARTUSDT、TMFUSDT、TBTUSDT 和 BITOUSDT。POPMARTUSDT 追踪泡泡玛特国际集团(HKEX:9992)的股价。该公司是一家总部位于中国、在香港交易所上市的设计师玩具与潮流文化公司。TMFUSDT 与 TBTUSDT 追踪杠杆及反向的美国国债 ETF,为交易者提供对美国长期政府债券市场的方向性敞口。BITOUSDT 追踪 ProShares 比特币 ETF(NYSE Arca:BITO)。该 ETF 与比特币挂钩,持有的是比特币期货合约,而非现货比特币。这 4 个合约均以 USDT 结算,最高支持 25 倍杠杆,可 7×24 小时交易,不受传统交易所交易时段限制。
简介
币安合约平台持续拓展其传统金融 (TradFi) 永续合约产品线,使交易者能够接触到加密资产以外的标的。2026 年 7 月 23 日至 27 日期间,币安上线了 4 个新的 USDT 本位永续合约:POPMARTUSDT、TMFUSDT、TBTUSDT 和 BITOUSDT。
这批合约覆盖了多元化的基础资产:一个在香港上市的消费品牌、两只杠杆型美国国债 ETF,以及一只与比特币挂钩的 ETF。本文将逐一介绍各合约追踪的标的、运作方式,以及交易者在参与前需要了解的关键风险。
什么是 TradFi 永续合约?
[永续合约](https://www.binance.com/en/academy/articles/what-are-forward-and-futures-contracts)是一种没有到期日的合约,交易者可无限期持有仓位,并通过资金费率机制使合约价格始终贴近基础资产的现货价格。
TradFi 永续合约将这一结构应用于传统金融资产,合约追踪的不再是加密货币,而是股票、ETF、大宗商品或指数。这意味着交易者无需实际持有标的股票,也无需受传统经纪商交易时段约束,即可获得对这些资产的敞口。
在币安合约平台上,这些合约以 USDT 结算,支持杠杆,且可 7×24 小时不间断交易。需注意的是,合约并不赋予持有者对基础资产的所有权。
4 个新合约
POPMARTUSDT:泡泡玛特国际集团
POPMARTUSDT 追踪泡泡玛特国际集团有限公司(HKEX:9992)的股价。该公司总部位于中国,是一家以可收藏盲盒手办著称的设计师玩具与潮流文化公司。
泡泡玛特专注于设计师玩具的设计、生产与销售,渠道覆盖零售门店、机器人商店 (roboshop)、电商平台及批发网络。公司已拓展至国际市场,旗下核心 IP 包括精灵天团 (The Monsters)、Skullpanda 和哭娃 (Crybaby)。
POPMARTUSDT 永续合约于 2026 年 7 月 23 日 02:30 (UTC) 上线,最高支持 25 倍杠杆,以 USDT 结算。其标的股票在香港交易所于当地市场交易时段内进行交易,而该永续合约本身则在币安合约平台上提供 7×24 小时不间断交易。
TMFUSDT:Direxion Daily 20+ Year Treasury Bull 3X ETF
TMFUSDT 追踪 Direxion Daily 20+ Year Treasury Bull 3X ETF(NYSE Arca:TMF)。这是一只杠杆 ETF,旨在扣除费用和开支之前,实现 ICE US Treasury 20+ Year Bond Index 每日表现 300% 的回报。
该指数衡量的是剩余期限在 20 年及以上的美国国债表现。TMF 的费用率约为 0.91%。
由于 TMF 为 3 倍杠杆产品,会放大每日价格波动。若基础指数单日上涨 1%,该 ETF 对应上涨约 3%;若基础指数单日下跌 1%,则对应下跌约 3%。
杠杆每日重置,受复利效应影响,长期回报可能与指数回报的 3 倍存在显著差异。
TMFUSDT 于 2026 年 7 月 27 日 13:30 (UTC) 上线,最高支持 25 倍杠杆,以 USDT 结算。
TBTUSDT:ProShares UltraShort 20+ Year Treasury
TBTUSDT 追踪 ProShares UltraShort 20+ Year Treasury ETF(NYSE Arca:TBT)。这是一只反向杠杆 ETF,旨在扣除费用和开支之前,实现 ICE US Treasury 20+ Year Bond Index 每日表现反向两倍(-2 倍)的回报。TBT 的费用率约为 0.93%。
TBT 的设计目标是在长期国债价格下跌时上涨,而长期国债价格下跌通常发生在利率上升时期。若基础指数单日下跌 1%,该 ETF 对应上涨约 2%;若基础指数单日上涨 1%,则对应下跌约 2%。与 TMF 类似,其杠杆每日重置,在更长周期内会产生复利效应。
TBTUSDT 于 2026 年 7 月 27 日 13:35 (UTC) 上线,最高支持 25 倍杠杆,以 USDT 结算。
BITOUSDT:ProShares 比特币 ETF
BITOUSDT 追踪 ProShares [比特币 ETF](https://www.binance.com/en/academy/articles/bitcoin-etfs-explained)(NYSE Arca:BITO)。BITO 是美国首只与比特币挂钩的 ETF,于 2021 年 10 月推出,旨在实现与比特币表现相对应的回报。
BITO 并不持有现货比特币,而是主要投资于在芝加哥商品交易所 (CME) 交易的比特币期货合约。BITO 的费用率约为 0.95%。
由于 BITO 持有的是期货而非现货比特币,其回报可能与比特币现货价格出现偏差。期货合约到期后需展期至新合约,这一过程可能产生成本,并随时间推移对回报形成一定侵蚀。
在期货溢价市场中,期货价格高于现货价格,展期成本可能侵蚀收益表现。这意味着 BITO 的表现可能因市场状况及期货曲线形态的不同,而相对于比特币现货跑输或跑赢。
BITOUSDT 于 2026 年 7 月 27 日 13:40 (UTC) 上线,最高支持 25 倍杠杆,以 USDT 结算。
TradFi 永续合约在币安的运作机制
这 4 个合约与币安合约平台上的其他 USDT 本位永续合约遵循相同的运作逻辑。
交易者通过存入 USDT 作为保证金来开仓。合约采用每 8 小时结算一次的[资金费率](https://www.binance.com/en/academy/articles/what-are-funding-rates-in-crypto-markets)机制,确保合约价格与基础资产价格保持一致。当合约价格高于现货价格时,多头仓位向空头仓位支付资金费用;当合约价格低于现货价格时,空头仓位向多头仓位支付资金费用。
这 4 个合约均最高支持 25 倍[杠杆](https://www.binance.com/en/academy/articles/what-is-leverage-in-crypto-trading),意味着交易者可开立最高为保证金规模 25 倍的仓位。资金费率上限为每个结算周期 +2%/-2%。每个合约的最低名义价值为 5 USDT。
合约支持联合保证金模式,允许交易者使用多种资产作为保证金。这 4 个合约均不适用 8.1 资金费率结算间隔调整规则,也就是说,即使资金费率触及上限或下限,资金费率的结算间隔也不会从每 8 小时临时调整为每 1 小时。
如何在币安合约平台交易 TradFi 资产
2. 展开下拉菜单,搜索要交易的资产。
您也可以在【TradFi】类别下找到这些合约及其他相关合约。
3. 在右下角可查看您的合约账户余额。若余额为零,可通过【划转】、【买币】或【兑换】功能添加资金。
首次使用币安合约时,您需要开通合约账户。
开始交易前,您可能还需完成一份合约知识测验。
4. 准备就绪后,可通过订单面板买入或卖出合约。
5. 点击右上角的【全仓】,可在全仓模式与逐仓模式之间切换。
全仓保证金模式:计算保证金和强平价格时,系统会将您合约账户中的所有资产和所有合约仓位一并考虑。这意味着即使是不同资产的未平仓位,彼此也会相互影响。
例如,为弥补 TMF 仓位的亏损,您的 BITO 仓位可能遭到强制平仓,即便这是两个不同的交易对。
逐仓保证金模式:将每个仓位的风险限定于特定资产,实现单个仓位的独立管理。因此,您的逐仓仓位不会受到其他未平仓位波动的影响。
如需了解详情,请参阅以下文章:[加密货币交易逐仓保证金和全仓保证金介绍](https://www.binance.com/en/academy/articles/what-are-isolated-margin-and-cross-margin-in-crypto-trading)。
需要了解的关键风险
杠杆与反向 ETF 的衰减
TMF 和 TBT 均为专为短期交易设计的杠杆与反向产品。其回报每日重置,复利效应可能在波动较大或横盘整理的市场中随时间推移侵蚀价值。
这种效应称为“波动率衰减”,意味着长期持有这些产品所产生的回报,可能与基础指数预期倍数的表现存在显著差异。
使用 TMFUSDT 或 TBTUSDT 永续合约的交易者应当了解,相关 ETF 基础资产本身已带有杠杆收益特征,而叠加合约层面的杠杆会进一步放大这一效应。
期货基差与展期成本
BITO 持有的是比特币期货合约,而非现货比特币。期货合约到期后须展期至新合约,这一过程可能产生成本,并会随时间推移拉低回报。这意味着 BITO 的表现未必能与比特币现货价格完全同步。持有 BITOUSDT 永续合约的交易者需同时面对 BITO 自身的期货基差风险以及永续合约的资金费率影响。
市场交易时段与价格跳空
传统市场设有固定的交易时段。香港交易所与 NYSE Arca 均在特定时段内运行。币安永续合约虽可 7×24 小时交易,但其基础资产的价格仅在各自市场的交易时段内更新。这可能导致传统市场开盘时出现价格跳空,因为永续合约价格需要调整以反映基础资产在非交易时段的隔夜变动。
杠杆风险
这 4 个合约均支持最高 25 倍杠杆。杠杆虽能放大潜在收益,但也会同步放大亏损。即使是小幅不利的价格波动,也可能导致高杠杆仓位被强制平仓。交易者应善用止损单等风险管理工具,并根据自身风险承受能力合理控制仓位规模。
常见问题
什么是 TradFi 永续合约?
TradFi 永续合约是一种追踪传统金融资产(如股票、ETF、大宗商品或指数)的永续合约。在币安合约平台上,这些合约以 USDT 结算,可 7×24 小时交易,但不赋予持有者对基础资产的所有权。合约采用资金费率机制,使合约价格始终贴近现货价格。
这些合约是否会赋予基础股票的所有权?
不会。永续合约属于衍生品,仅提供对基础资产的价格敞口,并不赋予股东权利、股息分配或实际股票/ETF 份额的所有权。
TMF 与 TBT 有何区别?
TMF 是一只 3 倍杠杆做多 ETF,旨在实现 ICE US Treasury 20+ Year Bond Index 每日表现 300% 的回报;TBT 则是一只 2 倍反向 ETF,旨在实现同一指数每日表现 -200% 的回报。当长期美债价格上涨(收益率下降)时,TMF 上涨;当长期美债价格下跌(收益率上升)时,TBT 上涨。
为什么 BITO 无法完美追踪比特币现货价格?
BITO 持有的是比特币期货合约,而非现货比特币。期货合约到期后须展期至新合约,这一过程会产生成本。在期货溢价市场中,期货价格高于现货价格,展期成本可能随时间推移侵蚀回报。
这种结构性差异意味着,BITO 的表现可能跑输或跑赢比特币现货,具体取决于市场环境。
传统市场休市时会发生什么?
币安永续合约支持 7×24 小时不间断交易,但基础资产的价格仅在各自交易所的交易时段内更新。当传统市场休市时,永续合约价格可能因新闻事件、市场情绪及加密货币市场动态而波动。待传统市场重新开盘时,合约价格可能相应调整以反映新的基础资产价格,从而产生价格跳空。
结语
这 4 个新合约展现了币安合约平台正在不断突破加密货币与传统金融之间的边界。POPMARTUSDT 将香港上市的消费品牌引入平台;TMFUSDT 与 TBTUSDT 通过杠杆及反向 ETF 提供对美国国债市场的方向性敞口;BITOUSDT 则为交易者提供了接触比特币相关 ETF 产品的渠道。
每个合约都有其独特的风险特征。交易者在承担风险之前,应充分了解基础资产与永续合约各自的运作机制。
延伸阅读
[什么是远期合约和期货合约?](https://www.binance.com/en/academy/articles/what-are-forward-and-futures-contracts)[什么是加密货币市场的资金费率?](https://www.binance.com/en/academy/articles/what-are-funding-rates-in-crypto-markets)[加密货币交易中的杠杆是什么?](https://www.binance.com/en/academy/articles/what-is-leverage-in-crypto-trading)[什么是比特币 ETF?](https://www.binance.com/en/academy/articles/bitcoin-etfs-explained)[一文读懂股票代币](https://www.binance.com/en/academy/articles/what-are-tokenized-stocks)
免责声明:本文内容按“原样”提供,仅作一般资讯及教育用途,不构成任何陈述或保证。本文不应解释为财务、法律或其他专业建议,且未推荐您购买任何特定产品或服务。您应自行向合适的专业顾问寻求建议。如内容由第三方投稿,请注意相关观点属于第三方投稿人,不一定反映币安学院的观点。数字资产价格可能会波动。您的投资价值可能会下跌或上涨,且投资本金可能无法收回。您对自己的投资决策全权负责,币安学院对您可能遭受的任何损失概不负责。欲知详情,敬请参阅我们的[使用条款](https://www.binance.com/en/terms)、[风险提示](https://www.binance.com/en/risk-warning)和[币安学院条款](https://www.binance.com/en/about-legal/terms-academy)。
要点
币安合约于 2026 年 7 月 23 日至 27 日期间上线 4 个 [TradFi](https://www.binance.com/en/academy/glossary/tradfi) 永续合约:POPMARTUSDT、TMFUSDT、TBTUSDT 和 BITOUSDT。POPMARTUSDT 追踪泡泡玛特国际集团(HKEX:9992)的股价。该公司是一家总部位于中国、在香港交易所上市的设计师玩具与潮流文化公司。TMFUSDT 与 TBTUSDT 追踪杠杆及反向的美国国债 ETF,为交易者提供对美国长期政府债券市场的方向性敞口。BITOUSDT 追踪 ProShares 比特币 ETF(NYSE Arca:BITO)。该 ETF 与比特币挂钩,持有的是比特币期货合约,而非现货比特币。这 4 个合约均以 USDT 结算,最高支持 25 倍杠杆,可 7×24 小时交易,不受传统交易所交易时段限制。
简介
币安合约平台持续拓展其传统金融 (TradFi) 永续合约产品线,使交易者能够接触到加密资产以外的标的。2026 年 7 月 23 日至 27 日期间,币安上线了 4 个新的 USDT 本位永续合约:POPMARTUSDT、TMFUSDT、TBTUSDT 和 BITOUSDT。
这批合约覆盖了多元化的基础资产:一个在香港上市的消费品牌、两只杠杆型美国国债 ETF,以及一只与比特币挂钩的 ETF。本文将逐一介绍各合约追踪的标的、运作方式,以及交易者在参与前需要了解的关键风险。
什么是 TradFi 永续合约?
[永续合约](https://www.binance.com/en/academy/articles/what-are-forward-and-futures-contracts)是一种没有到期日的合约,交易者可无限期持有仓位,并通过资金费率机制使合约价格始终贴近基础资产的现货价格。
TradFi 永续合约将这一结构应用于传统金融资产,合约追踪的不再是加密货币,而是股票、ETF、大宗商品或指数。这意味着交易者无需实际持有标的股票,也无需受传统经纪商交易时段约束,即可获得对这些资产的敞口。
在币安合约平台上,这些合约以 USDT 结算,支持杠杆,且可 7×24 小时不间断交易。需注意的是,合约并不赋予持有者对基础资产的所有权。
4 个新合约
POPMARTUSDT:泡泡玛特国际集团
POPMARTUSDT 追踪泡泡玛特国际集团有限公司(HKEX:9992)的股价。该公司总部位于中国,是一家以可收藏盲盒手办著称的设计师玩具与潮流文化公司。
泡泡玛特专注于设计师玩具的设计、生产与销售,渠道覆盖零售门店、机器人商店 (roboshop)、电商平台及批发网络。公司已拓展至国际市场,旗下核心 IP 包括精灵天团 (The Monsters)、Skullpanda 和哭娃 (Crybaby)。
POPMARTUSDT 永续合约于 2026 年 7 月 23 日 02:30 (UTC) 上线,最高支持 25 倍杠杆,以 USDT 结算。其标的股票在香港交易所于当地市场交易时段内进行交易,而该永续合约本身则在币安合约平台上提供 7×24 小时不间断交易。
TMFUSDT:Direxion Daily 20+ Year Treasury Bull 3X ETF
TMFUSDT 追踪 Direxion Daily 20+ Year Treasury Bull 3X ETF(NYSE Arca:TMF)。这是一只杠杆 ETF,旨在扣除费用和开支之前,实现 ICE US Treasury 20+ Year Bond Index 每日表现 300% 的回报。
该指数衡量的是剩余期限在 20 年及以上的美国国债表现。TMF 的费用率约为 0.91%。
由于 TMF 为 3 倍杠杆产品,会放大每日价格波动。若基础指数单日上涨 1%,该 ETF 对应上涨约 3%;若基础指数单日下跌 1%,则对应下跌约 3%。
杠杆每日重置,受复利效应影响,长期回报可能与指数回报的 3 倍存在显著差异。
TMFUSDT 于 2026 年 7 月 27 日 13:30 (UTC) 上线,最高支持 25 倍杠杆,以 USDT 结算。
TBTUSDT:ProShares UltraShort 20+ Year Treasury
TBTUSDT 追踪 ProShares UltraShort 20+ Year Treasury ETF(NYSE Arca:TBT)。这是一只反向杠杆 ETF,旨在扣除费用和开支之前,实现 ICE US Treasury 20+ Year Bond Index 每日表现反向两倍(-2 倍)的回报。TBT 的费用率约为 0.93%。
TBT 的设计目标是在长期国债价格下跌时上涨,而长期国债价格下跌通常发生在利率上升时期。若基础指数单日下跌 1%,该 ETF 对应上涨约 2%;若基础指数单日上涨 1%,则对应下跌约 2%。与 TMF 类似,其杠杆每日重置,在更长周期内会产生复利效应。
TBTUSDT 于 2026 年 7 月 27 日 13:35 (UTC) 上线,最高支持 25 倍杠杆,以 USDT 结算。
BITOUSDT:ProShares 比特币 ETF
BITOUSDT 追踪 ProShares [比特币 ETF](https://www.binance.com/en/academy/articles/bitcoin-etfs-explained)(NYSE Arca:BITO)。BITO 是美国首只与比特币挂钩的 ETF,于 2021 年 10 月推出,旨在实现与比特币表现相对应的回报。
BITO 并不持有现货比特币,而是主要投资于在芝加哥商品交易所 (CME) 交易的比特币期货合约。BITO 的费用率约为 0.95%。
由于 BITO 持有的是期货而非现货比特币,其回报可能与比特币现货价格出现偏差。期货合约到期后需展期至新合约,这一过程可能产生成本,并随时间推移对回报形成一定侵蚀。
在期货溢价市场中,期货价格高于现货价格,展期成本可能侵蚀收益表现。这意味着 BITO 的表现可能因市场状况及期货曲线形态的不同,而相对于比特币现货跑输或跑赢。
BITOUSDT 于 2026 年 7 月 27 日 13:40 (UTC) 上线,最高支持 25 倍杠杆,以 USDT 结算。
TradFi 永续合约在币安的运作机制
这 4 个合约与币安合约平台上的其他 USDT 本位永续合约遵循相同的运作逻辑。
交易者通过存入 USDT 作为保证金来开仓。合约采用每 8 小时结算一次的[资金费率](https://www.binance.com/en/academy/articles/what-are-funding-rates-in-crypto-markets)机制,确保合约价格与基础资产价格保持一致。当合约价格高于现货价格时,多头仓位向空头仓位支付资金费用;当合约价格低于现货价格时,空头仓位向多头仓位支付资金费用。
这 4 个合约均最高支持 25 倍[杠杆](https://www.binance.com/en/academy/articles/what-is-leverage-in-crypto-trading),意味着交易者可开立最高为保证金规模 25 倍的仓位。资金费率上限为每个结算周期 +2%/-2%。每个合约的最低名义价值为 5 USDT。
合约支持联合保证金模式,允许交易者使用多种资产作为保证金。这 4 个合约均不适用 8.1 资金费率结算间隔调整规则,也就是说,即使资金费率触及上限或下限,资金费率的结算间隔也不会从每 8 小时临时调整为每 1 小时。
如何在币安合约平台交易 TradFi 资产
2. 展开下拉菜单,搜索要交易的资产。
您也可以在【TradFi】类别下找到这些合约及其他相关合约。
3. 在右下角可查看您的合约账户余额。若余额为零,可通过【划转】、【买币】或【兑换】功能添加资金。
首次使用币安合约时,您需要开通合约账户。
开始交易前,您可能还需完成一份合约知识测验。
4. 准备就绪后,可通过订单面板买入或卖出合约。
5. 点击右上角的【全仓】,可在全仓模式与逐仓模式之间切换。
全仓保证金模式:计算保证金和强平价格时,系统会将您合约账户中的所有资产和所有合约仓位一并考虑。这意味着即使是不同资产的未平仓位,彼此也会相互影响。
例如,为弥补 TMF 仓位的亏损,您的 BITO 仓位可能遭到强制平仓,即便这是两个不同的交易对。
逐仓保证金模式:将每个仓位的风险限定于特定资产,实现单个仓位的独立管理。因此,您的逐仓仓位不会受到其他未平仓位波动的影响。
如需了解详情,请参阅以下文章:[加密货币交易逐仓保证金和全仓保证金介绍](https://www.binance.com/en/academy/articles/what-are-isolated-margin-and-cross-margin-in-crypto-trading)。
需要了解的关键风险
杠杆与反向 ETF 的衰减
TMF 和 TBT 均为专为短期交易设计的杠杆与反向产品。其回报每日重置,复利效应可能在波动较大或横盘整理的市场中随时间推移侵蚀价值。
这种效应称为“波动率衰减”,意味着长期持有这些产品所产生的回报,可能与基础指数预期倍数的表现存在显著差异。
使用 TMFUSDT 或 TBTUSDT 永续合约的交易者应当了解,相关 ETF 基础资产本身已带有杠杆收益特征,而叠加合约层面的杠杆会进一步放大这一效应。
期货基差与展期成本
BITO 持有的是比特币期货合约,而非现货比特币。期货合约到期后须展期至新合约,这一过程可能产生成本,并会随时间推移拉低回报。这意味着 BITO 的表现未必能与比特币现货价格完全同步。持有 BITOUSDT 永续合约的交易者需同时面对 BITO 自身的期货基差风险以及永续合约的资金费率影响。
市场交易时段与价格跳空
传统市场设有固定的交易时段。香港交易所与 NYSE Arca 均在特定时段内运行。币安永续合约虽可 7×24 小时交易,但其基础资产的价格仅在各自市场的交易时段内更新。这可能导致传统市场开盘时出现价格跳空,因为永续合约价格需要调整以反映基础资产在非交易时段的隔夜变动。
杠杆风险
这 4 个合约均支持最高 25 倍杠杆。杠杆虽能放大潜在收益,但也会同步放大亏损。即使是小幅不利的价格波动,也可能导致高杠杆仓位被强制平仓。交易者应善用止损单等风险管理工具,并根据自身风险承受能力合理控制仓位规模。
常见问题
什么是 TradFi 永续合约?
TradFi 永续合约是一种追踪传统金融资产(如股票、ETF、大宗商品或指数)的永续合约。在币安合约平台上,这些合约以 USDT 结算,可 7×24 小时交易,但不赋予持有者对基础资产的所有权。合约采用资金费率机制,使合约价格始终贴近现货价格。
这些合约是否会赋予基础股票的所有权?
不会。永续合约属于衍生品,仅提供对基础资产的价格敞口,并不赋予股东权利、股息分配或实际股票/ETF 份额的所有权。
TMF 与 TBT 有何区别?
TMF 是一只 3 倍杠杆做多 ETF,旨在实现 ICE US Treasury 20+ Year Bond Index 每日表现 300% 的回报;TBT 则是一只 2 倍反向 ETF,旨在实现同一指数每日表现 -200% 的回报。当长期美债价格上涨(收益率下降)时,TMF 上涨;当长期美债价格下跌(收益率上升)时,TBT 上涨。
为什么 BITO 无法完美追踪比特币现货价格?
BITO 持有的是比特币期货合约,而非现货比特币。期货合约到期后须展期至新合约,这一过程会产生成本。在期货溢价市场中,期货价格高于现货价格,展期成本可能随时间推移侵蚀回报。
这种结构性差异意味着,BITO 的表现可能跑输或跑赢比特币现货,具体取决于市场环境。
传统市场休市时会发生什么?
币安永续合约支持 7×24 小时不间断交易,但基础资产的价格仅在各自交易所的交易时段内更新。当传统市场休市时,永续合约价格可能因新闻事件、市场情绪及加密货币市场动态而波动。待传统市场重新开盘时,合约价格可能相应调整以反映新的基础资产价格,从而产生价格跳空。
结语
这 4 个新合约展现了币安合约平台正在不断突破加密货币与传统金融之间的边界。POPMARTUSDT 将香港上市的消费品牌引入平台;TMFUSDT 与 TBTUSDT 通过杠杆及反向 ETF 提供对美国国债市场的方向性敞口;BITOUSDT 则为交易者提供了接触比特币相关 ETF 产品的渠道。
每个合约都有其独特的风险特征。交易者在承担风险之前,应充分了解基础资产与永续合约各自的运作机制。
延伸阅读
[什么是远期合约和期货合约?](https://www.binance.com/en/academy/articles/what-are-forward-and-futures-contracts)[什么是加密货币市场的资金费率?](https://www.binance.com/en/academy/articles/what-are-funding-rates-in-crypto-markets)[加密货币交易中的杠杆是什么?](https://www.binance.com/en/academy/articles/what-is-leverage-in-crypto-trading)[什么是比特币 ETF?](https://www.binance.com/en/academy/articles/bitcoin-etfs-explained)[一文读懂股票代币](https://www.binance.com/en/academy/articles/what-are-tokenized-stocks)
免责声明:本文内容按“原样”提供,仅作一般资讯及教育用途,不构成任何陈述或保证。本文不应解释为财务、法律或其他专业建议,且未推荐您购买任何特定产品或服务。您应自行向合适的专业顾问寻求建议。如内容由第三方投稿,请注意相关观点属于第三方投稿人,不一定反映币安学院的观点。数字资产价格可能会波动。您的投资价值可能会下跌或上涨,且投资本金可能无法收回。您对自己的投资决策全权负责,币安学院对您可能遭受的任何损失概不负责。欲知详情,敬请参阅我们的[使用条款](https://www.binance.com/en/terms)、[风险提示](https://www.binance.com/en/risk-warning)和[币安学院条款](https://www.binance.com/en/about-legal/terms-academy)。
1
3
·
--
උසබ තත්ත්වය
i am filling bullish
what do you think ?
wrong or it' time to take it
i am filling bullish
what do you think ?
wrong or it' time to take it
what do you think ?
wrong or it' time to take it
564
This is 100% real — no clich or misconceptions
i am still wested for get some new but...
guys i want to share too much experience i have it from day 1 i remember still date and when came here too much excited about getting some new
instead of big boss
now i never lay down you guys from your expectations
I’d love to start livestreaming, but I don’t have enough followers yet. 🥹
It’s such a bummer! If you don’t mind, could you give me a follow?
or help me if can do
#BTC
#GOLD
#oil
#cryptouniverseofficial
This is 100% real — no clich or misconceptions
i am still wested for get some new but...
guys i want to share too much experience i have it from day 1 i remember still date and when came here too much excited about getting some new
instead of big boss
now i never lay down you guys from your expectations
I’d love to start livestreaming, but I don’t have enough followers yet. 🥹
It’s such a bummer! If you don’t mind, could you give me a follow?
or help me if can do
#BTC
#GOLD
#oil
#cryptouniverseofficial
i am still wested for get some new but...
guys i want to share too much experience i have it from day 1 i remember still date and when came here too much excited about getting some new
instead of big boss
now i never lay down you guys from your expectations
I’d love to start livestreaming, but I don’t have enough followers yet. 🥹
It’s such a bummer! If you don’t mind, could you give me a follow?
or help me if can do
#BTC
#GOLD
#oil
#cryptouniverseofficial
1
386
·
--
බෙයාරිෂ්
tik tik time bom will activate soon about big boom 💥💥💥 hipe related Bitcoin and dfi market nuts and it starts soon before November second half and it regular time money pried cycle yet new deep for inflow of money 💰💰💰💰
and socially guys i have done it before time and eye on this again again when something happened into economic pressure and global supply chain management
trick triks simple is that know has we aslo follow to make money instead of big another
let's see it we more deep to get more profit into dfi market
#bitcoin
#GoldenOpportunity
#decentralization
#difi理财
what will happen within second half of November 2026
tik tik time bom will activate soon about big boom 💥💥💥 hipe related Bitcoin and dfi market nuts and it starts soon before November second half and it regular time money pried cycle yet new deep for inflow of money 💰💰💰💰
and socially guys i have done it before time and eye on this again again when something happened into economic pressure and global supply chain management
trick triks simple is that know has we aslo follow to make money instead of big another
let's see it we more deep to get more profit into dfi market
#bitcoin
#GoldenOpportunity
#decentralization
#difi理财
what will happen within second half of November 2026
and socially guys i have done it before time and eye on this again again when something happened into economic pressure and global supply chain management
trick triks simple is that know has we aslo follow to make money instead of big another
let's see it we more deep to get more profit into dfi market
#bitcoin
#GoldenOpportunity
#decentralization
#difi理财
what will happen within second half of November 2026
get more deep in downward
80%
or up
20%
5 ඡන්ද • ඡන්දය අවසන්
260
guys take it entry point before miss out because may it' will has reverse trend will happen towards upside
what do you think ?
i am right or wrong
pls comment share our feedback to comment box it's valuable part of my analytical information or hypothetical part also
pls share this post with our community group and ask also then and follow me also to be nest time touch other topics with me
share like and follow guys eachother for make hipe
#silvar
#commodities
#goldfollowers
#silverfollower
guys take it entry point before miss out because may it' will has reverse trend will happen towards upside
what do you think ?
i am right or wrong
pls comment share our feedback to comment box it's valuable part of my analytical information or hypothetical part also
pls share this post with our community group and ask also then and follow me also to be nest time touch other topics with me
share like and follow guys eachother for make hipe
#silvar
#commodities
#goldfollowers
#silverfollower
what do you think ?
i am right or wrong
pls comment share our feedback to comment box it's valuable part of my analytical information or hypothetical part also
pls share this post with our community group and ask also then and follow me also to be nest time touch other topics with me
share like and follow guys eachother for make hipe
#silvar
#commodities
#goldfollowers
#silverfollower
422
that's too much not enough
my friend first time you also motivated me to learn new language
and definitely i am trying yet now in this time
my friend i want also your help when i want so 🙏pls do fever like big brother , family do when i want it because
i am learning new things,new language so when i want help like big brother
and one again thank you much friend
that's too much not enough
my friend first time you also motivated me to learn new language
and definitely i am trying yet now in this time
my friend i want also your help when i want so 🙏pls do fever like big brother , family do when i want it because
i am learning new things,new language so when i want help like big brother
and one again thank you much friend
my friend first time you also motivated me to learn new language
and definitely i am trying yet now in this time
my friend i want also your help when i want so 🙏pls do fever like big brother , family do when i want it because
i am learning new things,new language so when i want help like big brother
and one again thank you much friend

Agusting_交易40
·
--
[අවසන්] 🎙️ BUENAS tardes Equipo 💪🚧🚧🚧
176 සවන්දීම්
151
Ni hao (hi guys ) all of you guys all
may hop your doing well
glad to hear informed you guys Bitcoin has correcting himself soon before setup new trend
and trust me guys it will happen within few days or weeks and booooom 💥💥💥
then he new take down back or looking himself downward trend may be hopefully it happen level of market intrest cause fuel cycle has not started yet and last two years big announcement is deployments issue and wors situation triggered back to back
that's why gold cycle has too much strong at specific level of support and intrensic value price
and news is guys gold , crude has it theing owned self marginal line owned it has all ready improved so it now time currently money cycle too much teit and new cycle yet new making it ways , sources till period of time pending it.
but good news it all our big god father means inflation days let's soon triggered it and trust it will happen within few weeks or may get it take out month may be
but it will definitely happen so keep patience guys countdown all started when Bitcoin has touched level below $bitcoin $60000
#bitcoin
#GOLD
#crude
#GlobalFinance
chill guys cool relaxing like me
let's party whenever you want with me
so all guys follow , like and share also your ideas mental mindset with me
do you want join us , share follow me join as good friend or part of our community , family ?
Ni hao (hi guys ) all of you guys all
may hop your doing well
glad to hear informed you guys Bitcoin has correcting himself soon before setup new trend
and trust me guys it will happen within few days or weeks and booooom 💥💥💥
then he new take down back or looking himself downward trend may be hopefully it happen level of market intrest cause fuel cycle has not started yet and last two years big announcement is deployments issue and wors situation triggered back to back
that's why gold cycle has too much strong at specific level of support and intrensic value price
and news is guys gold , crude has it theing owned self marginal line owned it has all ready improved so it now time currently money cycle too much teit and new cycle yet new making it ways , sources till period of time pending it.
but good news it all our big god father means inflation days let's soon triggered it and trust it will happen within few weeks or may get it take out month may be
but it will definitely happen so keep patience guys countdown all started when Bitcoin has touched level below $bitcoin $60000
#bitcoin
#GOLD
#crude
#GlobalFinance
chill guys cool relaxing like me
let's party whenever you want with me
so all guys follow , like and share also your ideas mental mindset with me
do you want join us , share follow me join as good friend or part of our community , family ?
may hop your doing well
glad to hear informed you guys Bitcoin has correcting himself soon before setup new trend
and trust me guys it will happen within few days or weeks and booooom 💥💥💥
then he new take down back or looking himself downward trend may be hopefully it happen level of market intrest cause fuel cycle has not started yet and last two years big announcement is deployments issue and wors situation triggered back to back
that's why gold cycle has too much strong at specific level of support and intrensic value price
and news is guys gold , crude has it theing owned self marginal line owned it has all ready improved so it now time currently money cycle too much teit and new cycle yet new making it ways , sources till period of time pending it.
but good news it all our big god father means inflation days let's soon triggered it and trust it will happen within few weeks or may get it take out month may be
but it will definitely happen so keep patience guys countdown all started when Bitcoin has touched level below $bitcoin $60000
#bitcoin
#GOLD
#crude
#GlobalFinance
chill guys cool relaxing like me
let's party whenever you want with me
so all guys follow , like and share also your ideas mental mindset with me
do you want join us , share follow me join as good friend or part of our community , family ?
so guys says yes
100%
or no so wait write down why
0%
3 ඡන්ද • ඡන්දය අවසන්
2
191
තවත් අන්තර්ගතයන් ගවේෂණය කිරීමට ඇතුල් වන්න
Binance චතුරශ්රය හි ගෝලීය ක්රිප්ටෝ පරිශීලකයින් හා එක්වන්න
⚡️ ක්රිප්ටෝ පිළිබඳ නවතම සහ ප්රයෝජනවත් තොරතුරු ලබා ගන්න.
💬 ලොව විශාලතම ක්රිප්ටෝ හුවමාරුව මගින් විශ්වාස කෙරේ.
👍 සත්යායනය කරන ලද නිර්මාණකරුවන්ගෙන් සැබෑ විදසුන් සොයා ගන්න.
විද්යුත් තැපෑල / දුරකථන අංකය
නැගී එන මාතෘකා
NvidiaBeatsEstimatesWith$130BQ4Outlook
2,700 නැරඹීම්
55 සාකච්ඡා කරමින්
Nvidia Beats With $115.8 Billion in Revenue, Guides to $130 Billion and Adds $150 Billion Buyback
Binance News
·25 කැමත්ත දැක්වීම්
·31.3k නැරඹීම්
AnthropicIPOPriceCouldExceed$80
6,553 නැරඹීම්
60 සාකච්ඡා කරමින්
CanNvidia’sDataCenterGrowthContinue?
14,508 නැරඹීම්
258 සාකච්ඡා කරමින්