

#volume
volume
815,785 නැරඹීම්
2,659 සාකච්ඡා කරමින්
උණුසුම්
නවතම

🚀 Why does a surge in volume matter more than a price tick?
Ethereum is up +0.9% in the last 24 h, trading around $2,346.3 with a 24‑hour volume of $475 M. The price move looks modest, but the volume spike tells a deeper story. When volume climbs sharply alongside price, it confirms that real buying interest backs the move, reducing the chance of a false breakout. Conversely, a price rise on thin volume often fizzles out because there aren’t enough hands to sustain it.
In practice, watch the volume bar: if it’s at least 1.5‑2× the 7‑day average and the price is breaking a key resistance, you’ve got a higher‑probability bullish signal. If volume stays flat while price nudges higher, stay cautious—many traders get trapped in “pump‑and‑dump” traps.
🔎 How do you currently filter trades—by price alone or by combining volume clues?
#CryptoEducation #Volume
We post every algo signal's REAL result openly and the full live track record + a free preview channel are in our bio/profile. $ETH

·
--
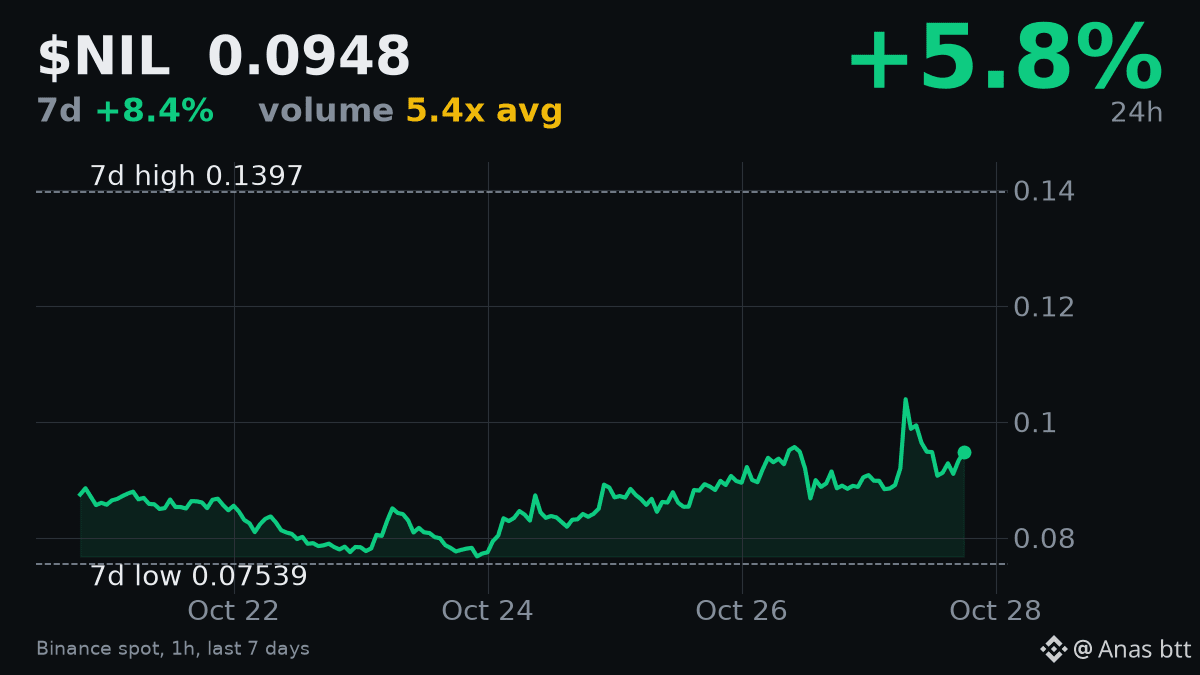
Today's 24-hour volume for $NIL is 5.415 times its 7-day average. This significant increase in volume is notable, as $NIL is up 5.768% in the past 24 hours and 8.373% over seven days. However, the current price of $0.0948 remains 32.131% below its 7-day high of $0.1397. The Relative Strength Index is at 54.3, indicating a neutral momentum. I am currently neutral on $NIL. While the volume is strong today, the coin is still far from its recent peak. A clear move and close above $0.1397 would shift my view to cautiously bullish, showing a potential reversal. Until then, I am watching for sustained buying interest at these levels, supported by continued high volume.
#NIL #Volume
Today's 24-hour volume for $NIL is 5.415 times its 7-day average. This significant increase in volume is notable, as $NIL is up 5.768% in the past 24 hours and 8.373% over seven days. However, the current price of $0.0948 remains 32.131% below its 7-day high of $0.1397. The Relative Strength Index is at 54.3, indicating a neutral momentum. I am currently neutral on $NIL . While the volume is strong today, the coin is still far from its recent peak. A clear move and close above $0.1397 would shift my view to cautiously bullish, showing a potential reversal. Until then, I am watching for sustained buying interest at these levels, supported by continued high volume.
#NIL #Volume
#NIL #Volume
246

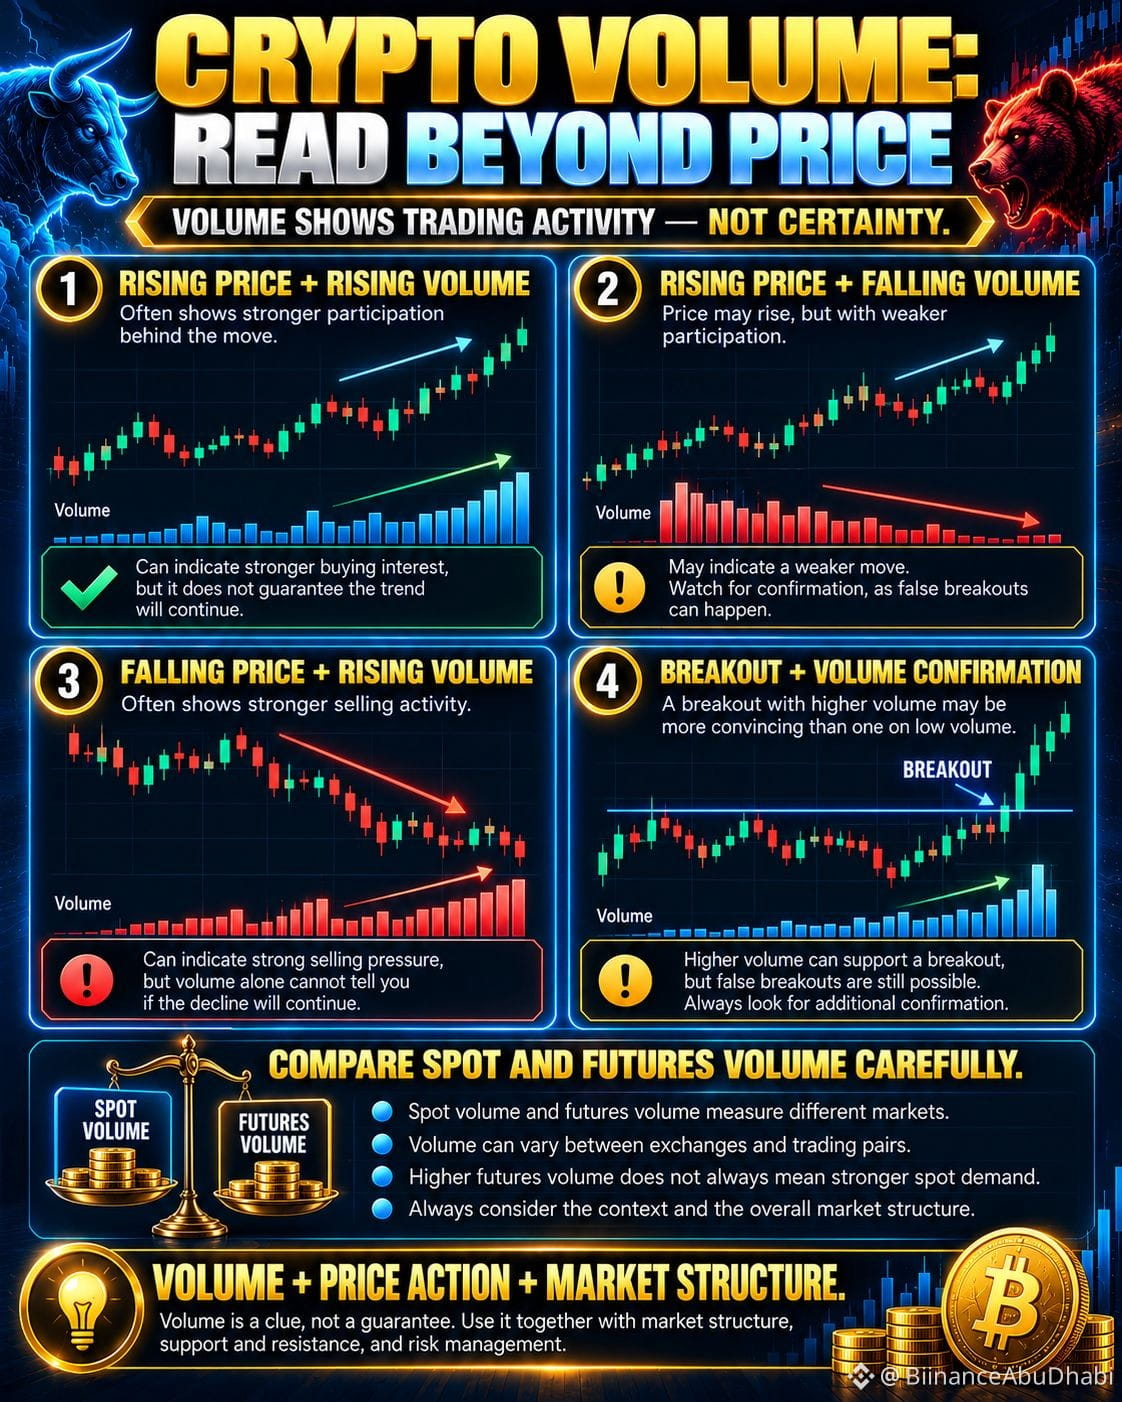
📊 CRYPTO VOLUME: WHAT IS THE MARKET REALLY TELLING YOU?
.
Price shows where a coin is trading. Volume helps show how much trading activity is happening. 👇
.
🔹 1. WHAT IS VOLUME?
.
Trading volume measures how much of an asset is traded during a specific period.
.
🔹 2. PRICE RISE + HIGH VOLUME 📈
.
A rising price with increasing volume can suggest stronger participation behind the move—but it doesn't guarantee continuation.
.
🔹 3. PRICE RISE + LOW VOLUME ⚠️
.
The move may have weaker participation. Watch for confirmation rather than assuming a breakout will succeed.
.
🔹 4. PRICE FALL + HIGH VOLUME 📉
.
This can indicate strong selling activity, but volume alone cannot tell you whether the decline will continue.
.
🔹 5. BREAKOUT + VOLUME 🚀
.
A breakout accompanied by rising volume may be more convincing than one on thin activity. Still, false breakouts happen.
.
🔹 6. CHECK THE RIGHT VOLUME
.
Spot volume and futures volume measure different markets. Exchange coverage, trading pairs, and data quality also matter.
.
🧠 THE SMARTER APPROACH
.
Combine volume with market structure, support and resistance, liquidity, and price action. Never use one indicator as your entire trading strategy.
.
💬 DISCUSSION: When you analyze a breakout, do you check volume first—or market structure?
.
#BTC $BTC #BinanceSquare #TradingEducation #Volume
.
Price shows where a coin is trading. Volume helps show how much trading activity is happening. 👇
.
🔹 1. WHAT IS VOLUME?
.
Trading volume measures how much of an asset is traded during a specific period.
.
🔹 2. PRICE RISE + HIGH VOLUME 📈
.
A rising price with increasing volume can suggest stronger participation behind the move—but it doesn't guarantee continuation.
.
🔹 3. PRICE RISE + LOW VOLUME ⚠️
.
The move may have weaker participation. Watch for confirmation rather than assuming a breakout will succeed.
.
🔹 4. PRICE FALL + HIGH VOLUME 📉
.
This can indicate strong selling activity, but volume alone cannot tell you whether the decline will continue.
.
🔹 5. BREAKOUT + VOLUME 🚀
.
A breakout accompanied by rising volume may be more convincing than one on thin activity. Still, false breakouts happen.
.
🔹 6. CHECK THE RIGHT VOLUME
.
Spot volume and futures volume measure different markets. Exchange coverage, trading pairs, and data quality also matter.
.
🧠 THE SMARTER APPROACH
.
Combine volume with market structure, support and resistance, liquidity, and price action. Never use one indicator as your entire trading strategy.
.
💬 DISCUSSION: When you analyze a breakout, do you check volume first—or market structure?
.
#BTC $BTC #BinanceSquare #TradingEducation #Volume
11
·
--
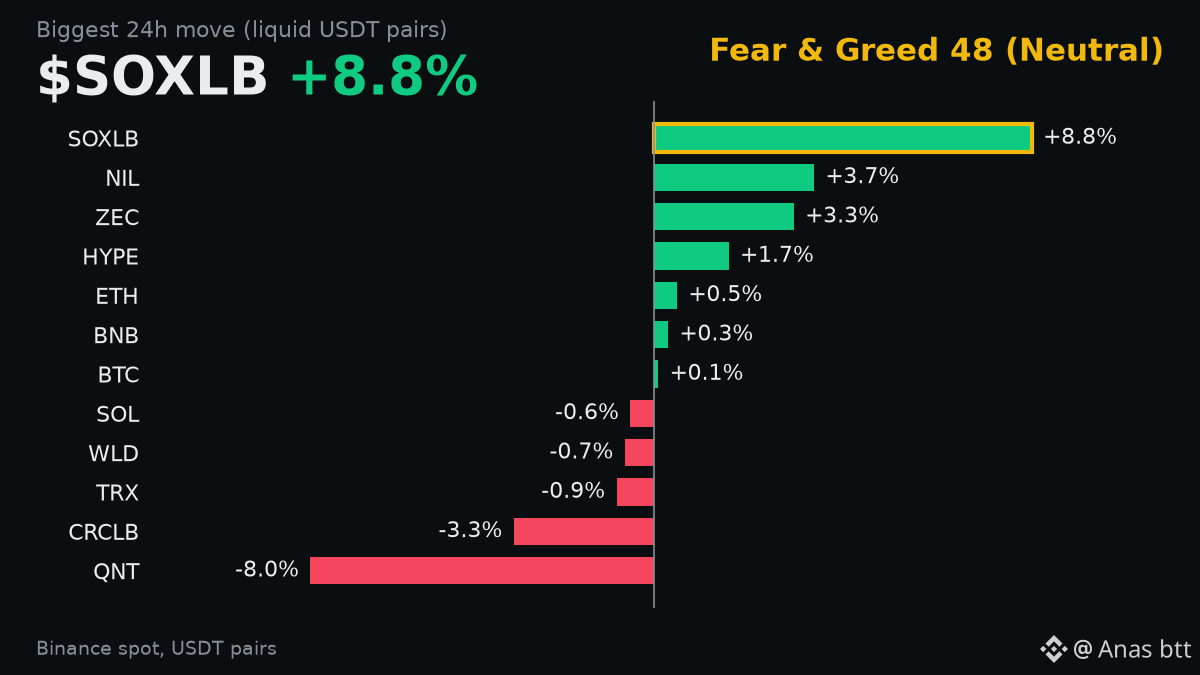
The top gainer today, $SOXLB, surged 8.828% to $95.05. This upward move recorded only $27.793 million in 24-hour volume. A rally of this size usually needs stronger volume to show conviction and sustain momentum. Without increased buying interest, these moves often fail to hold their gains. I am neutral on $SOXLB at this level. A clear breakout above $100 with a significant uptick in volume would change my outlook. I will watch the volume closely in the coming days.
#SOXLB #Volume
The top gainer today, $SOXLB , surged 8.828% to $95.05. This upward move recorded only $27.793 million in 24-hour volume. A rally of this size usually needs stronger volume to show conviction and sustain momentum. Without increased buying interest, these moves often fail to hold their gains. I am neutral on $SOXLB at this level. A clear breakout above $100 with a significant uptick in volume would change my outlook. I will watch the volume closely in the coming days.
#SOXLB #Volume
#SOXLB #Volume
99

·
--
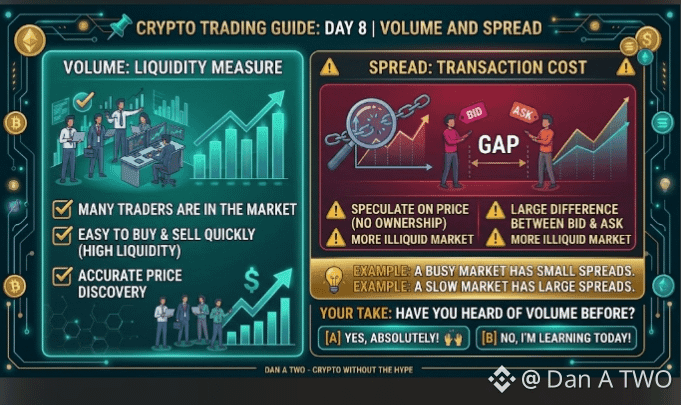
📌 Day 8: Volume and Spread
Why are some coins easy to buy and sell, while others are not? 🧐
Volume: the amount bought or sold in a given period. High volume means many people are in the market.
Spread: the difference between the buying price and the selling price. A small spread is good.
Example: in a market, when everyone is looking for goods, they sell quickly. When there are no buyers, you have to wait.
Have you ever heard the word "volume" before? 👇
#trading #Volume #DanATWO #BinanceSquare #BinanceAcademy
Not financial advice.
$ARIA $DODOX $DOS
1
489
·
--
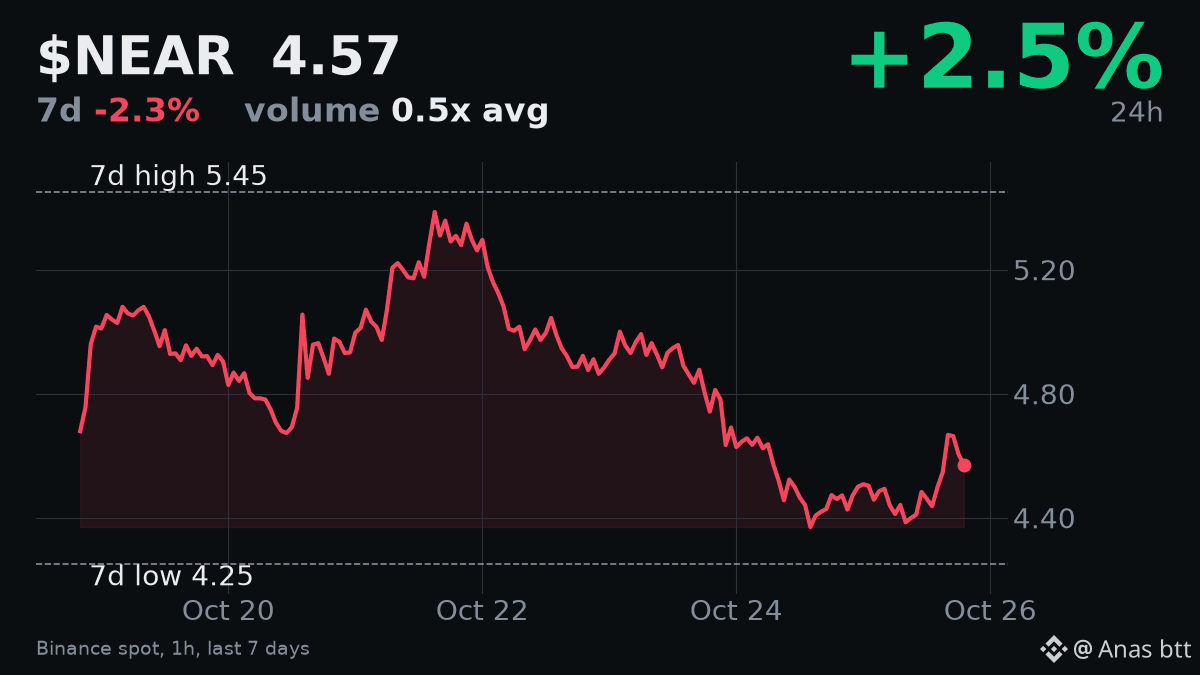
Trading volume for $NEAR today is notably low at 0.5329 times its 7-day average, despite a 2.534% gain in the last 24 hours to $4.572. This weak volume suggests the recent upward movement may not have strong conviction.
$NEAR is still 16.125% below its 7-day high of $5.451, and the price is down 2.308% over the past seven days. The RSI is neutral at 54.7. The overall market sentiment is also neutral at 54, slightly up from yesterday's 51.
I remain neutral on $NEAR. I would need to see a clear break above $4.80 on strong volume for a bullish view. Until then, the risk of fading short-term rallies is present. I am waiting for volume confirmation on any significant move.
#NEAR #Volume
Trading volume for $NEAR today is notably low at 0.5329 times its 7-day average, despite a 2.534% gain in the last 24 hours to $4.572. This weak volume suggests the recent upward movement may not have strong conviction.
$NEAR is still 16.125% below its 7-day high of $5.451, and the price is down 2.308% over the past seven days. The RSI is neutral at 54.7. The overall market sentiment is also neutral at 54, slightly up from yesterday's 51.
I remain neutral on $NEAR . I would need to see a clear break above $4.80 on strong volume for a bullish view. Until then, the risk of fading short-term rallies is present. I am waiting for volume confirmation on any significant move.
#NEAR #Volume
108

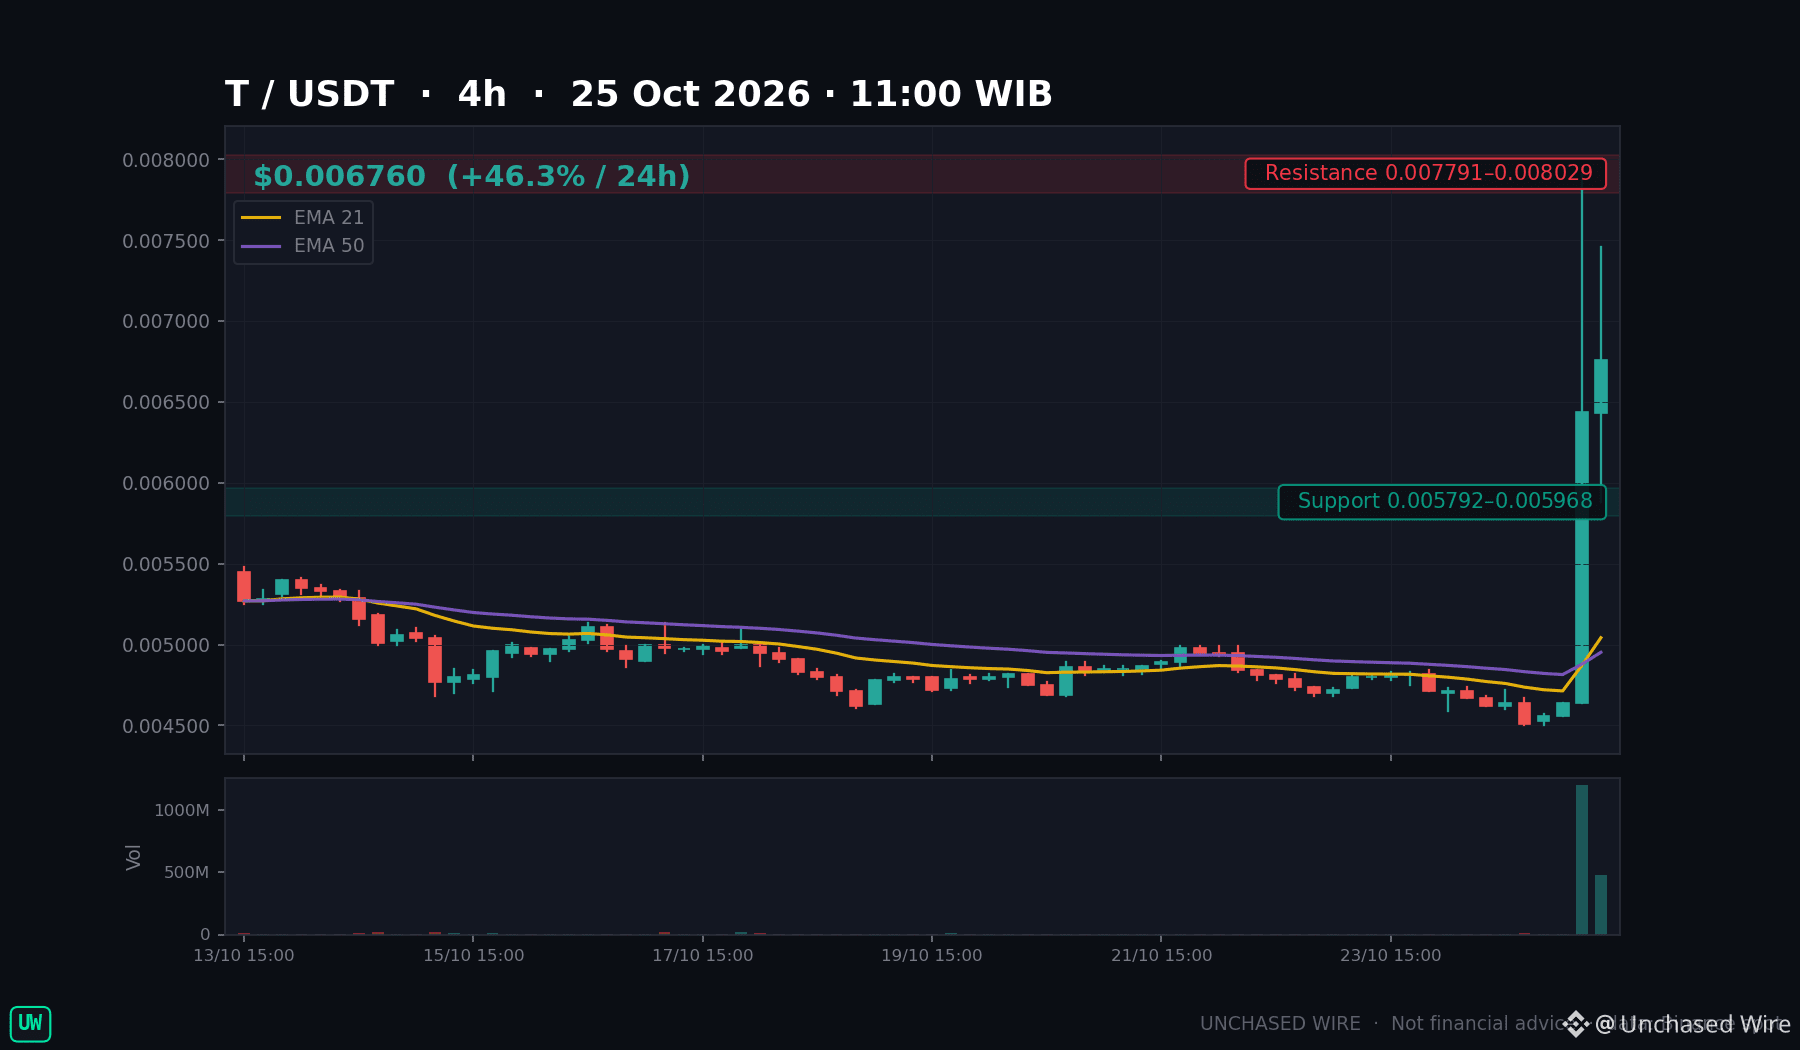
One 4-hour candle traded 1.2 billion $T. The ten before it averaged under 6 million.
I'm reading that as the story: Threshold sat near $0.0046 for days, then one candle ripped to $0.00791 on volume more than 200 times the norm, and the follow-through closed above $0.0064. It now trades near $0.0068, up about 47% in 24 hours on $11.3 million of spot volume.
Threshold is the network behind threshold-cryptography tooling for dApps, the Keep–NuCypher merger coin — so this isn't a launch chasing a narrative. But I found no verified announcement behind the spike, and a one-candle move is the easiest kind to give back.
Support: $0.00588, the follow-through candle's low.
Resistance: $0.00791, the spike high.
A 4-hour close under $0.00588 re-opens the $0.0046 base; a reclaim of $0.00791 puts the spike back in play.
Your invalidation line — $0.00588, or lower?
Not financial advice.
$T #CryptoMarkets #Threshold #Volume #CryptoTrading
One 4-hour candle traded 1.2 billion $T . The ten before it averaged under 6 million.
I'm reading that as the story: Threshold sat near $0.0046 for days, then one candle ripped to $0.00791 on volume more than 200 times the norm, and the follow-through closed above $0.0064. It now trades near $0.0068, up about 47% in 24 hours on $11.3 million of spot volume.
Threshold is the network behind threshold-cryptography tooling for dApps, the Keep–NuCypher merger coin — so this isn't a launch chasing a narrative. But I found no verified announcement behind the spike, and a one-candle move is the easiest kind to give back.
Support: $0.00588, the follow-through candle's low.
Resistance: $0.00791, the spike high.
A 4-hour close under $0.00588 re-opens the $0.0046 base; a reclaim of $0.00791 puts the spike back in play.
Your invalidation line — $0.00588, or lower?
Not financial advice.
$T #CryptoMarkets #Threshold #Volume #CryptoTrading
29
·
--
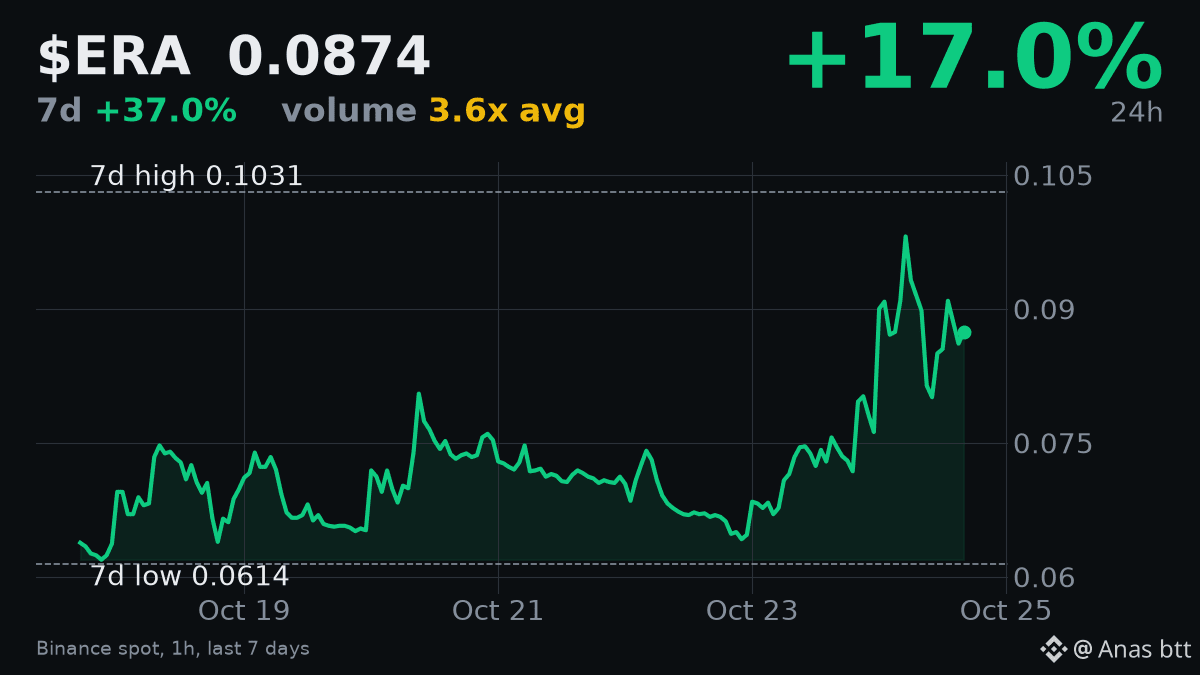
$ERA trading volume is significantly high today, at 3.646 times its 7-day average, with $27.64 million exchanged. The coin is currently priced at $0.0874, having surged 17.001% in the last 24 hours and 36.991% over the past seven days. Despite these strong gains, $ERA remains 15.228% below its 7-day high of $0.1031.
The 14-hour RSI is at 54.8, indicating neutral momentum. While the elevated volume suggests genuine interest, the inability to hold its recent high means I am not ready for a strong directional call. My view is neutral for now. I would turn bullish if $ERA can reclaim and hold above the $0.1031 level on good volume. A drop below $0.07 would suggest further consolidation or a deeper pullback.
I am watching for confirmation of either a breakout or a clear support level.
#ERACoin #Volume
170

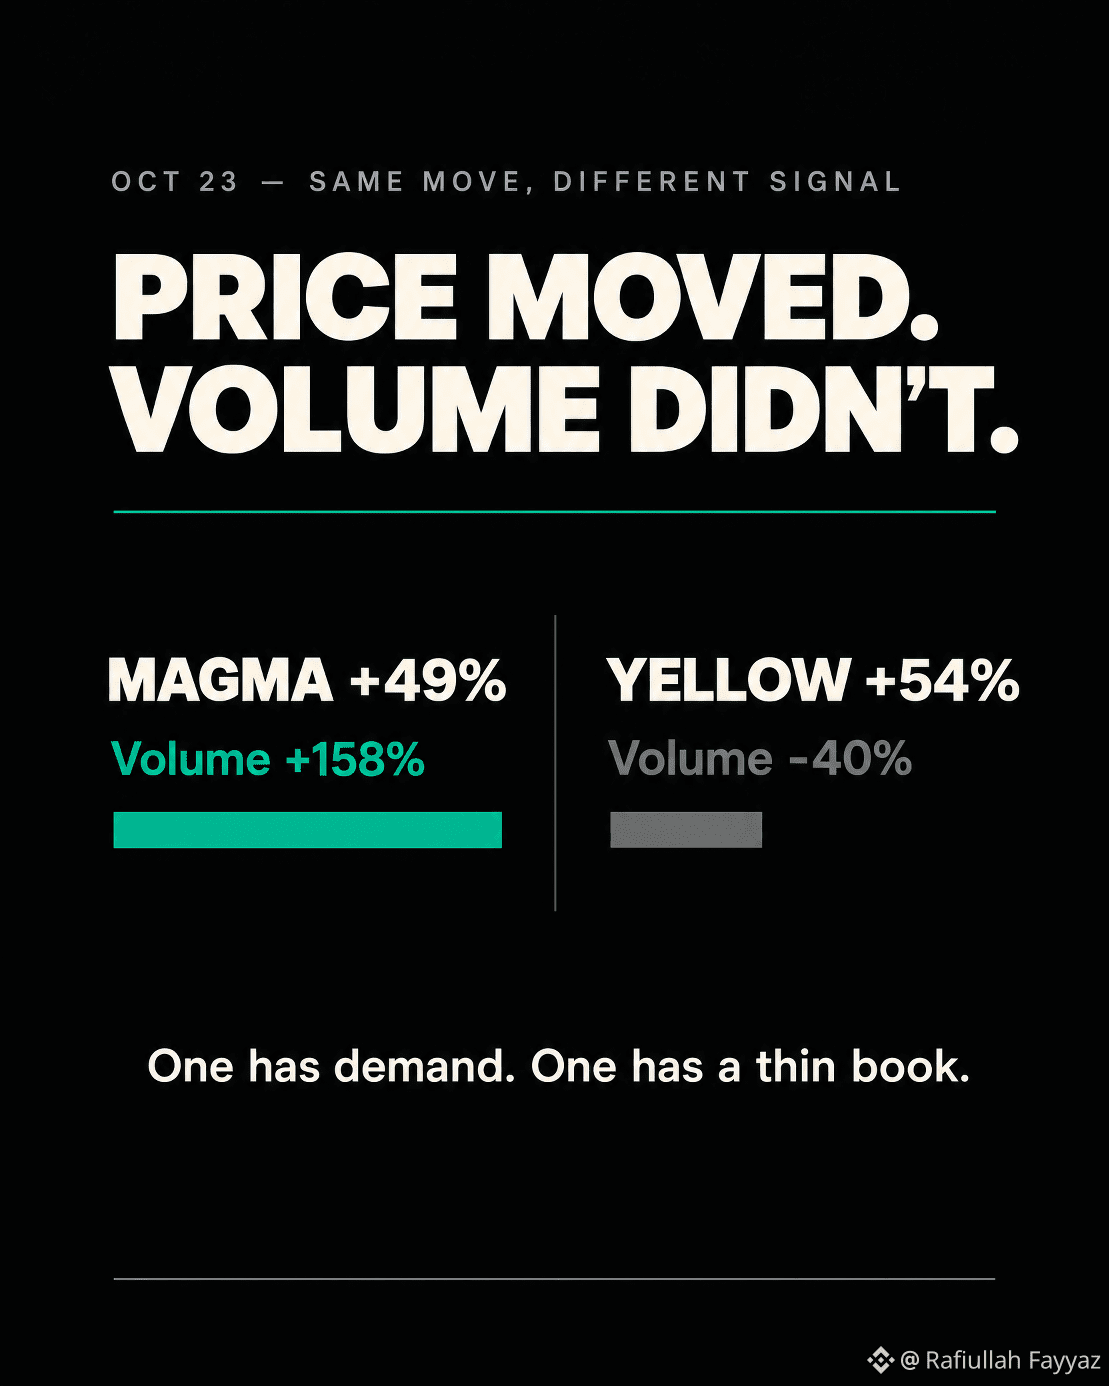
MAGMA is up 49% today. Volume rose 158%. The trigger wasn't news — whale wallets opened $1.5M in 2x leveraged longs, and the low float did the rest.
Yellow is also up 54%. But volume fell 40%.
Same green candle. Opposite confirmation.
A price move on rising volume means real demand is meeting the sellers. A price move on falling volume means the order book is thin and a few buys moved the price.
MAGMA has volume behind it. Yellow doesn't.
$MAGMA
#crypto #research #Volume #Marketstructure #BinanceSquareFamily
{future}(MAGMAUSDT)
MAGMA is up 49% today. Volume rose 158%. The trigger wasn't news — whale wallets opened $1.5M in 2x leveraged longs, and the low float did the rest.
Yellow is also up 54%. But volume fell 40%.
Same green candle. Opposite confirmation.
A price move on rising volume means real demand is meeting the sellers. A price move on falling volume means the order book is thin and a few buys moved the price.
MAGMA has volume behind it. Yellow doesn't.
$MAGMA
#crypto #research #Volume #Marketstructure #BinanceSquareFamily
324
🚀 Why does a dip with solid volume matter?
$NEAR just slid ‑0.9% in the last 24 h, sitting around $4.93 with a 24‑hour volume of $107 M. The price drop alone could be dismissed as noise, but the hefty trading volume tells a different story. When volume spikes alongside a move, it confirms that real participants—buyers and sellers—are active, giving the price action credibility. In contrast, a low‑volume dip often fizzles out because only a few hands are moving the market.
By watching volume, you can filter false breakouts and decide whether a pull‑back is a genuine correction or a temporary wobble. If the volume stays high on a down move, expect the price to keep testing lower levels; if it dries up, the market may be ready to bounce.
💡 How do you currently use volume to validate your entry or exit points?
#CryptoEducation #Volume
We post every algo signal's REAL result openly and the full live track record + a free preview channel are in our bio/profile.
25

·
--
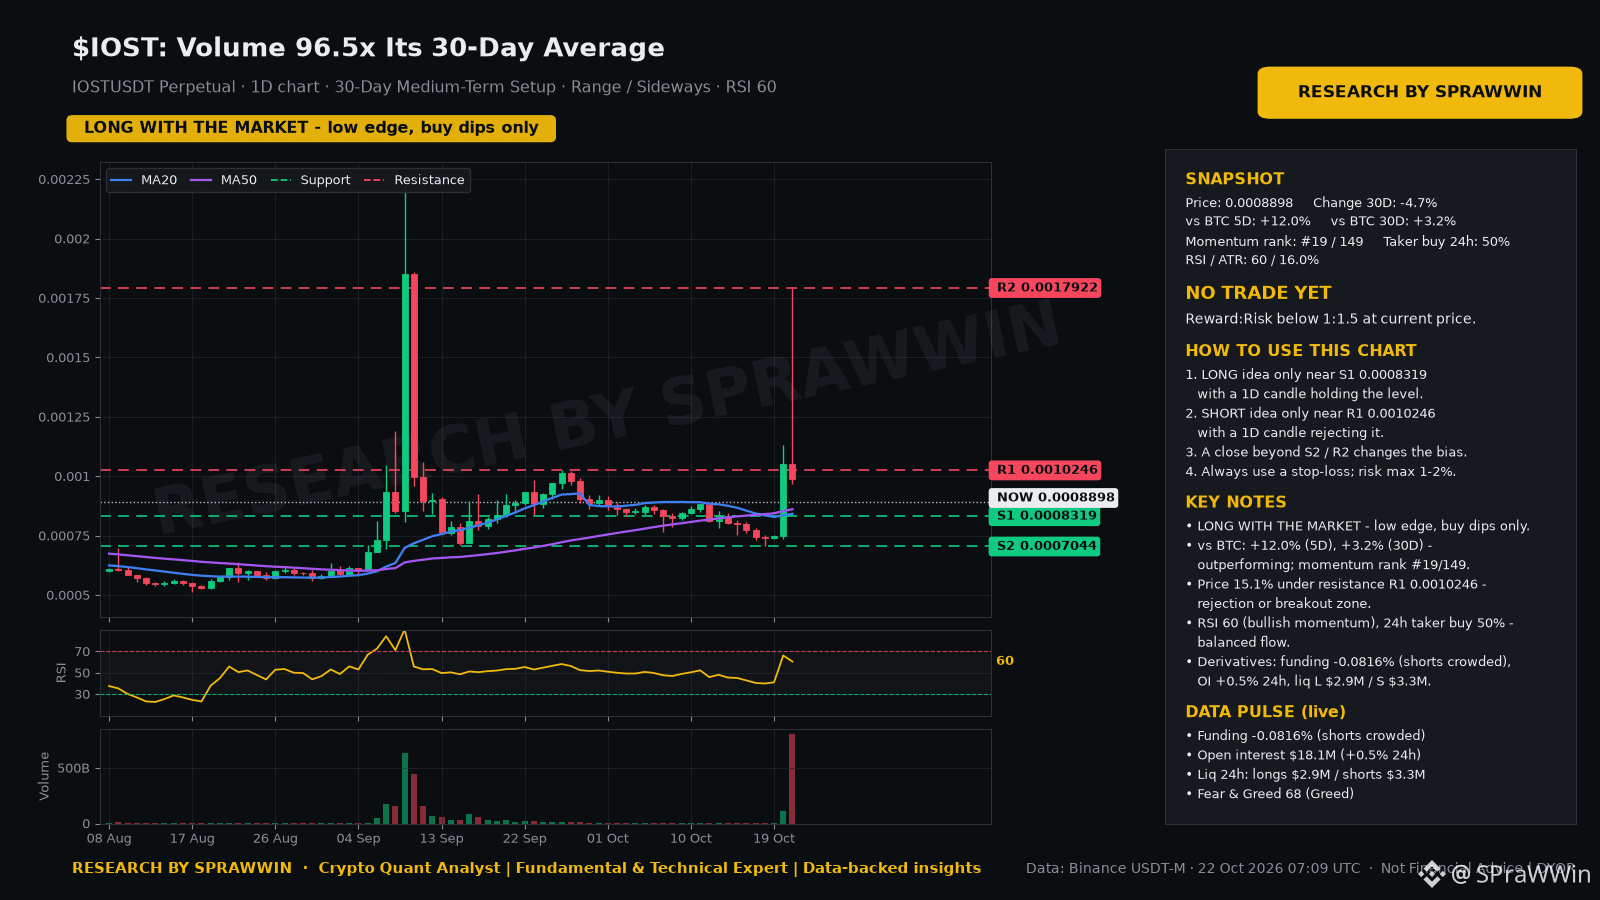
$IOST: Volume 96.5x Its 30-Day Average
The data leans bullish. Price 0.0008899 · trend: uptrend · daily RSI 60
What stands out:
• 24h volume is 96.5x the 30-day average — unusual attention on this coin.
• Open interest moved -16.8% in 24h (now 10M USD) — leverage is being flushed out.
• Still 65% below its 1-year high — deep drawdown; rallies may meet supply.
Quant outlook (measured, not guessed):
• Next 24h, 68% range: 0.0007944 – 0.0009969. This band held on 75% of days over the past year.
• Next 7 days, 68% range: 0.0006589 – 0.0012018 (90%: 0.0005428 – 0.0014589).
• 30D momentum: middle of the pack (top 48%), where history shows no edge either way.
• 24h direction is close to a coin flip in our backtests, so trade the levels, not a forecast.
Key levels: support 0.0008319 / 0.0007044 · resistance 0.0010246 / 0.0017922
Plan: no clean reward-to-risk right now. A daily close above 0.0010246 or below 0.0008319 sets the next move.
💬 What do you think is driving the volume spike?
Not financial advice · DYOR · Data: Binance Futures
$IOST #IOST #Volume #CryptoAnalysis
— Crypto Quant Analyst | Fundamental & Technical Expert | Data-backed insights
$IOST : Volume 96.5x Its 30-Day Average
The data leans bullish. Price 0.0008899 · trend: uptrend · daily RSI 60
What stands out:
• 24h volume is 96.5x the 30-day average — unusual attention on this coin.
• Open interest moved -16.8% in 24h (now 10M USD) — leverage is being flushed out.
• Still 65% below its 1-year high — deep drawdown; rallies may meet supply.
Quant outlook (measured, not guessed):
• Next 24h, 68% range: 0.0007944 – 0.0009969. This band held on 75% of days over the past year.
• Next 7 days, 68% range: 0.0006589 – 0.0012018 (90%: 0.0005428 – 0.0014589).
• 30D momentum: middle of the pack (top 48%), where history shows no edge either way.
• 24h direction is close to a coin flip in our backtests, so trade the levels, not a forecast.
Key levels: support 0.0008319 / 0.0007044 · resistance 0.0010246 / 0.0017922
Plan: no clean reward-to-risk right now. A daily close above 0.0010246 or below 0.0008319 sets the next move.
💬 What do you think is driving the volume spike?
Not financial advice · DYOR · Data: Binance Futures
$IOST #IOST #Volume #CryptoAnalysis
— Crypto Quant Analyst | Fundamental & Technical Expert | Data-backed insights
1
316

·
--
උසබ තත්ත්වය
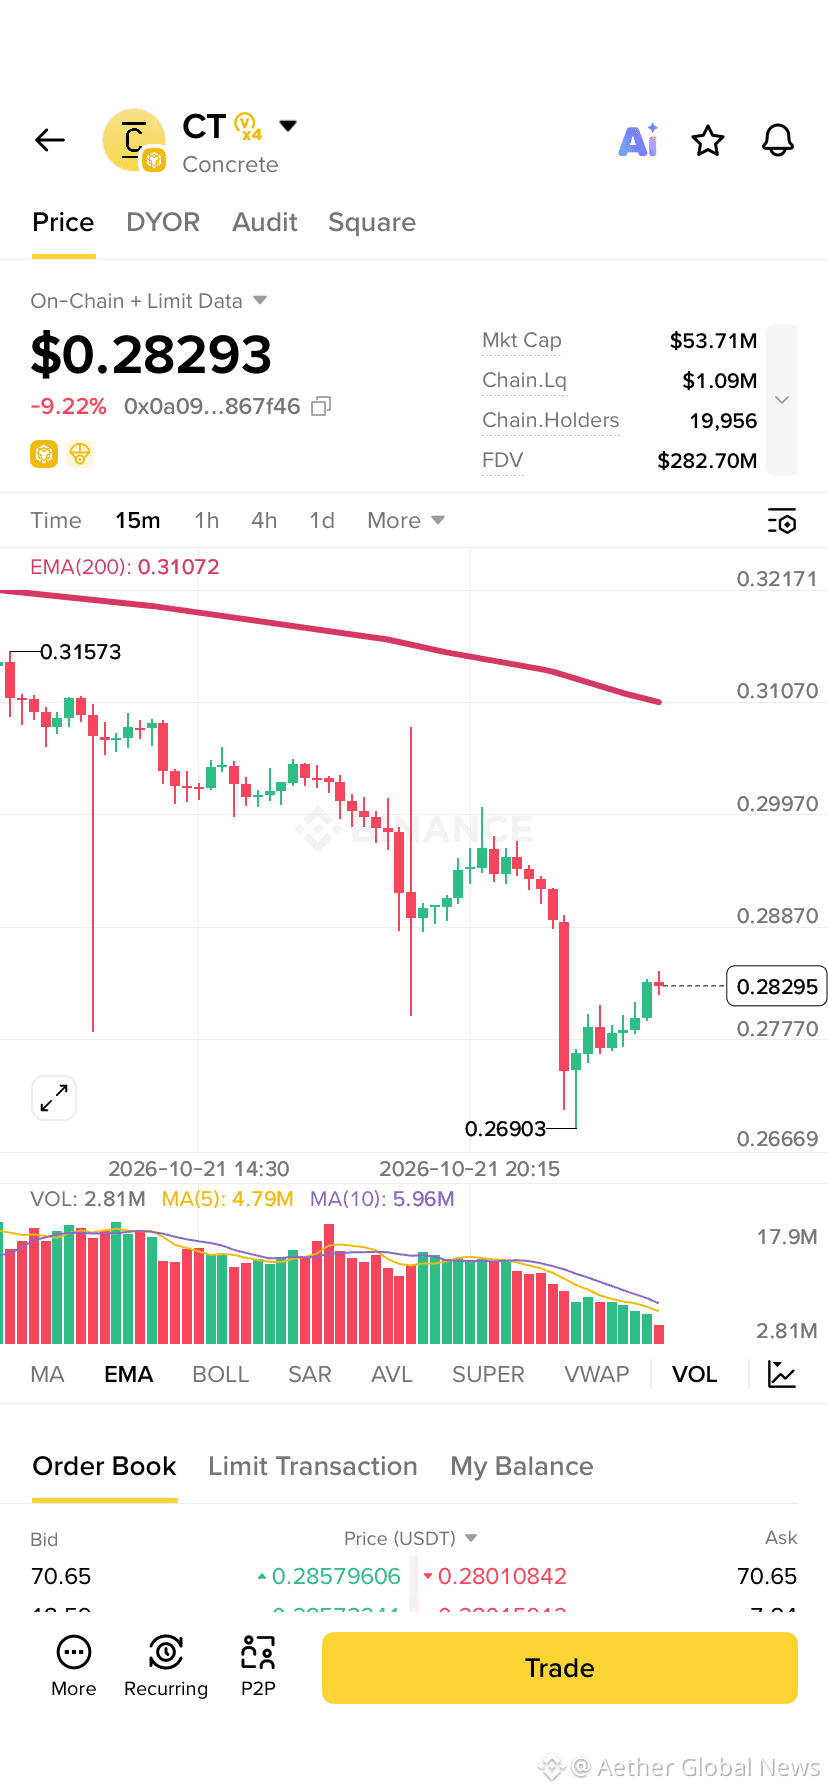
$CT Today top 1 alpha volume
over 900 million volume traded alpha CT
$DNA holding second first around $250 million
$DGAI placing third as volume #EarningsSeason #Volume #bnb #ALPHA
$CT Today top 1 alpha volume
over 900 million volume traded alpha CT
$DNA holding second first around $250 million
$DGAI placing third as volume #EarningsSeason #Volume #bnb #ALPHA
over 900 million volume traded alpha CT
$DNA holding second first around $250 million
$DGAI placing third as volume #EarningsSeason #Volume #bnb #ALPHA

Follow get packet
Aether Global News වෙතින්
4
1.5k
Ever wondered why a 2% rally can feel so shaky?
Right now $BTC is up 2.0% in 24 h, sitting at $83,830 with a whopping $1.143 B of volume. The price jump looks strong, but the real test is the volume behind it. High, sustained volume means many traders are backing the move, turning a short‑term spike into a credible trend. If the price rose on thin volume, it would likely snap back as soon as a few larger players step in.
Key takeaway: always match price action with volume spikes. A genuine breakout should be accompanied by volume at least 1.5‑2× the recent average; anything less is a red flag.
What’s the most reliable volume signal you’ve used to confirm a move? $BTC
We post every algo signal’s REAL result openly, and the full live track record + a free preview channel are in our bio/profile. #CryptoEducation #Volume
30

·
--
两只宽基ETF成交额暴增!上证50ETF破60亿,科创50ETF近100亿。市场交投活跃,投资者信心回暖。ETF市场热度持续,加密ETF未来值得期待!
#ETF #成交量
$BTC
Massive volume surge in two major ETFs! SSE 50 ETF exceeded 6B yuan while STAR 50 ETF hit nearly 10B yuan. Active trading indicates improving market sentiment. As ETF markets heat up, keep an eye on potential crypto ETF developments - they could be the next big thing!
#ETF #Volume
$BTC
44
Why does a sudden jump in volume matter more than price moves?
Take $SUI as a live case: it’s down 4.4% in the last 24 h, trading around $1.0397, while 24‑hour volume spiked to $76 M. The price dip alone could signal weakness, but the hefty volume tells a different story. High volume confirms that many traders are actively buying or selling, adding credibility to the move. If the volume had stayed low, the dip might have been a false alarm—easily filled by a single large order.
In this scenario, the surge in volume suggests that the market is absorbing the sell‑off, which often precedes a stabilization or even a rebound. Traders watch for such volume confirmation to decide whether to hold, add, or exit positions, rather than reacting to price alone.
What volume clues have helped you avoid a bad trade recently?
we post every algo signal's REAL result openly and the full live track record + a free preview channel are in our bio/profile. #CryptoEducation #Volume
44

·
--
🚨 Q 涨疯了!24H 涨幅达 16.5%,1小时再拉 11.5%,成交量放大 22.7 倍,现价约 $0.032!
但真正奇怪的是:OI 同时上升 13.1%,散户看多情绪冲到 14.5 倍,X 已有 156 次提及,却没有 KOL 参与,情绪明显拥挤。
📊 这意味着什么?所有人都怕踏空,追涨资金正在加速涌入;可一旦量能撤退,最晚进场的人,可能就成了最后一棒。看对方向,不代表能在高位全身而退。
我的看法:短线趋势偏多,但绝不盲目追高!量能继续维持,才有机会延续;一旦放量衰退、冲高失败,要警惕多头拥挤后的快速回吐。数据部分仍待核验。
你觉得 Q 下一步是继续冲高,还是量能一撤直接回吐?👇 #volume-spike #crowded-longs
但真正奇怪的是:OI 同时上升 13.1%,散户看多情绪冲到 14.5 倍,X 已有 156 次提及,却没有 KOL 参与,情绪明显拥挤。
📊 这意味着什么?所有人都怕踏空,追涨资金正在加速涌入;可一旦量能撤退,最晚进场的人,可能就成了最后一棒。看对方向,不代表能在高位全身而退。
我的看法:短线趋势偏多,但绝不盲目追高!量能继续维持,才有机会延续;一旦放量衰退、冲高失败,要警惕多头拥挤后的快速回吐。数据部分仍待核验。
你觉得 Q 下一步是继续冲高,还是量能一撤直接回吐?👇 #volume-spike #crowded-longs
14

·
--
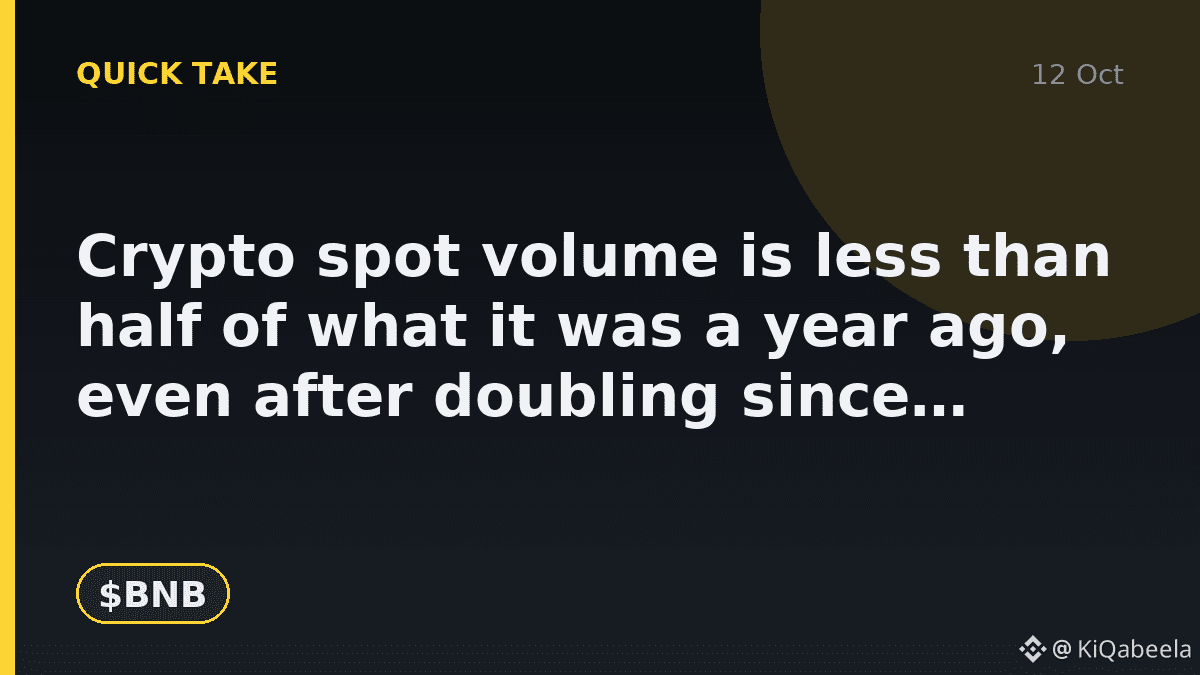
Crypto spot volume is less than half of what it was a year ago, even after doubling since August.
CoinDesk Research puts the four-week average to September 27 at about $279B per week on centralized exchanges. The crash week of October 2025 saw $801B, and August bottomed near $135B.
My take: the market feels busier than summer, but it is nowhere near the frenzy that set up last year's wipeout. Lower volume with deeper order books for the majors is, in my view, a healthier mix. Exchange tokens such as $BNB tend to track how much people trade, so this is worth watching.
💬 Does lower volume worry you or reassure you?
#Crypto #Volume
13
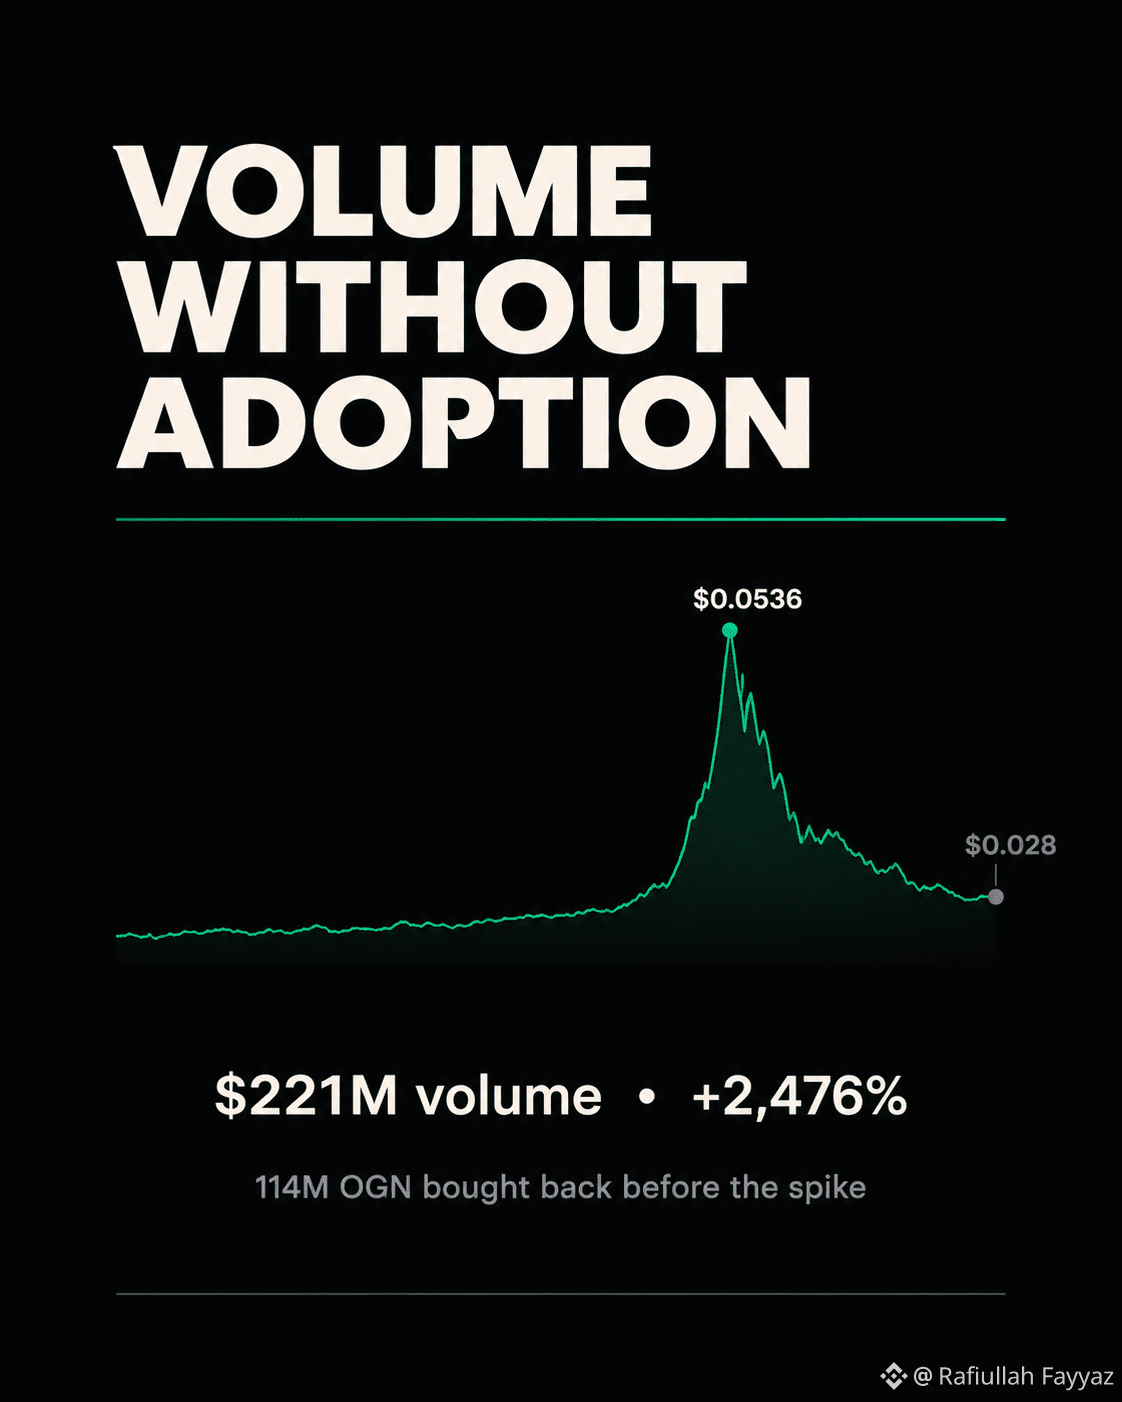
OGN went from $0.0175 to $0.0536 in a day. Volume hit $221M — a 2,476% jump.
Then it gave most of it back. Down 47% from the high now.
That's the pattern worth studying. Origin Protocol had already bought back 114M OGN by end of September. Real supply reduction. But the rally overshot on thin liquidity, and the unwind was just as violent.
Volume like that doesn't mean adoption. It means a crowded trade found an exit.
$OGN
#Marketpulse #Volume #BinanceSquare
{spot}(OGNUSDT)
OGN went from $0.0175 to $0.0536 in a day. Volume hit $221M — a 2,476% jump.
Then it gave most of it back. Down 47% from the high now.
That's the pattern worth studying. Origin Protocol had already bought back 114M OGN by end of September. Real supply reduction. But the rally overshot on thin liquidity, and the unwind was just as violent.
Volume like that doesn't mean adoption. It means a crowded trade found an exit.
$OGN
#Marketpulse #Volume #BinanceSquare
266

What is Volume? 📊
Volume is the total number of units of an asset traded during a specific period of time. 💱
Price can be manipulated, but Volume cannot be faked easily. Volume tells you the Power behind a move. 💪
It includes both BUY and SELL transactions. It is shown as a vertical bar (histogram) below the price chart. 📈
3 Main Things Volume Shows You: 👇
1️⃣ Interest (Participation):
High Volume = Many traders are interested 👀
Low Volume = No interest 😴
2️⃣ Strength (Conviction):
If price moves with High Volume, the move is strong and real ✅
If price moves with Low Volume, the move is weak and fake ⚠️
3️⃣ Reversal / Exhaustion:
Extremely High Volume at the top or bottom often means the trend is ending. It shows climax - everyone has bought/sold, now no one is left 🔄
Example 💡:
SOL pumps with a big green candle but Volume is very low = Trap 🪤 Don't Buy.
SOL pumps with a big green candle and Volume is also high = Real Move 🚀 You can Buy.
Price tells you WHAT happened.
Volume tells you WHY it happened.
#trading #Volume #priceaction #FaisalHasnain $BTC $SOL

125
📉 Why is $SUI sliding 6.9% in the last 24 h while its 24‑hour volume surged to $84 M? This is a textbook case of **volume confirmation**, a simple yet powerful way to gauge whether a price move has real backing.
When price drops and volume spikes, sellers are stepping in with conviction, turning a minor dip into a potentially sustained downtrend. Conversely, a price rise on low volume often signals a weak rally that can reverse quickly. In $SUI’s case, the heavy sell‑side volume confirms the bearish pressure, suggesting the current $1.122 level may act as a short‑term support if the sell‑off eases.
🔎 Keep an eye on the volume bars: a clear rise together with price movement usually validates the direction, while a divergence warns of a possible reversal.
Do you spot similar volume‑price mismatches in other coins? #CryptoEducation #Volume
We post every algo signal's REAL result openly and the full live track record + a free preview channel are in our bio/profile.
📉 Why is $SUI sliding 6.9% in the last 24 h while its 24‑hour volume surged to $84 M? This is a textbook case of **volume confirmation**, a simple yet powerful way to gauge whether a price move has real backing.
When price drops and volume spikes, sellers are stepping in with conviction, turning a minor dip into a potentially sustained downtrend. Conversely, a price rise on low volume often signals a weak rally that can reverse quickly. In $SUI ’s case, the heavy sell‑side volume confirms the bearish pressure, suggesting the current $1.122 level may act as a short‑term support if the sell‑off eases.
🔎 Keep an eye on the volume bars: a clear rise together with price movement usually validates the direction, while a divergence warns of a possible reversal.
Do you spot similar volume‑price mismatches in other coins? #CryptoEducation #Volume
We post every algo signal's REAL result openly and the full live track record + a free preview channel are in our bio/profile.
61
තවත් අන්තර්ගතයන් ගවේෂණය කිරීමට ඇතුල් වන්න
Binance චතුරශ්රය හි ගෝලීය ක්රිප්ටෝ පරිශීලකයින් හා එක්වන්න
⚡️ ක්රිප්ටෝ පිළිබඳ නවතම සහ ප්රයෝජනවත් තොරතුරු ලබා ගන්න.
💬 ලොව විශාලතම ක්රිප්ටෝ හුවමාරුව මගින් විශ්වාස කෙරේ.
👍 සත්යායනය කරන ලද නිර්මාණකරුවන්ගෙන් සැබෑ විදසුන් සොයා ගන්න.
විද්යුත් තැපෑල / දුරකථන අංකය
නැගී එන මාතෘකා
1
#CanMicrosoftDeliverOnAI
221,659 නැරඹීම්
1,872 සාකච්ඡා කරමින්
2
#CanGoogleDefindItsCore
125,057 නැරඹීම්
1,371 සාකච්ඡා කරමින්
3
#EarningsSeason
5.8M නැරඹීම්
27,837 සාකච්ඡා කරමින්
4
#BitcoinSurpasses$81K
31 නැරඹීම්
22 සාකච්ඡා කරමින්
5
#KOSPISurges6.63%BackAbove6000
1 නැරඹීම්
24 සාකච්ඡා කරමින්
6
#DatavaultAICantWithdrawBitcoinFromBiconomy
735 නැරඹීම්
41 සාකච්ඡා කරමින්
7
#FOMCWatch
9.2M නැරඹීම්
29,065 සාකච්ඡා කරමින්
8
#HKPlacesTokenizedFundSecondaryTradingUnderETFLikeFramework
516 නැරඹීම්
27 සාකච්ඡා කරමින්
9
#USGovSellsFTXLinkedAnthropicSharesFor$627M
783 නැරඹීම්
29 සාකච්ඡා කරමින්
10
#MoodysAssignsRLUSDA2LongTermDepositRating
5,939 නැරඹීම්
200 සාකච්ඡා කරමින්