

#smc
smc
1.5M views
15,558 සාකච්ඡා කරමින්
උණුසුම්
නවතම


·
--
散户和机构,同一张K线,看到的是两个不同的世界。
昨晚BTC从$82,000拉升到$83,500,很多散户追进去了。机构在那一刻干了什么?
他们在卖。
这不是阴谋,这是SMC的核心逻辑:聪明钱利用散户的FOMO情绪来出货,利用散户的恐慌情绪来建仓。方向永远相反。
🔍 如何识别背离信号
散户行为特征:价格突破前高就追多,价格跌破支撑就割肉,跟着K线走,永远滞后。
机构行为特征:在散户止损集中的区域下方建仓,在散户FOMO追涨的区域减仓,用流动性,不被流动性驱使。
具体怎么看?盯大户持仓比例和散户比例的分歧。当前BTC大户持仓约65%多,散户却在追涨。分歧越大,背离越明显,意味着一方即将被教育。
📌 当前BTC结构
$83,000附近是关键——这个位置上方有密集的散户止损(上次下跌时形成的空单止损),机构有动力把价格推上去触发这些止损,吃掉流动性后再决定方向。如果你看到价格突破$83,500后快速回落,不要奇怪,那就是止损猎杀完成信号。
操作结论:不在散户疯狂追涨的位置追多,等价格回到机构真正想要的OB区域($81,000~$81,500),跟着聪明钱,不跟着情绪。
见过太多人在涨3%的地方进场,跌5%的地方出场。
那不是运气差,那是站错了队。
关注我,每晚21:00直播+SMC教学
🌿 姓赵不宣 | 不是建议
#BTC #SMC #聪明钱
散户和机构,同一张K线,看到的是两个不同的世界。
昨晚BTC从$82,000拉升到$83,500,很多散户追进去了。机构在那一刻干了什么?
他们在卖。
这不是阴谋,这是SMC的核心逻辑:聪明钱利用散户的FOMO情绪来出货,利用散户的恐慌情绪来建仓。方向永远相反。
🔍 如何识别背离信号
散户行为特征:价格突破前高就追多,价格跌破支撑就割肉,跟着K线走,永远滞后。
机构行为特征:在散户止损集中的区域下方建仓,在散户FOMO追涨的区域减仓,用流动性,不被流动性驱使。
具体怎么看?盯大户持仓比例和散户比例的分歧。当前BTC大户持仓约65%多,散户却在追涨。分歧越大,背离越明显,意味着一方即将被教育。
📌 当前BTC结构
$83,000附近是关键——这个位置上方有密集的散户止损(上次下跌时形成的空单止损),机构有动力把价格推上去触发这些止损,吃掉流动性后再决定方向。如果你看到价格突破$83,500后快速回落,不要奇怪,那就是止损猎杀完成信号。
操作结论:不在散户疯狂追涨的位置追多,等价格回到机构真正想要的OB区域($81,000~$81,500),跟着聪明钱,不跟着情绪。
见过太多人在涨3%的地方进场,跌5%的地方出场。
那不是运气差,那是站错了队。
关注我,每晚21:00直播+SMC教学
🌿 姓赵不宣 | 不是建议
#BTC #SMC #聪明钱
昨晚BTC从$82,000拉升到$83,500,很多散户追进去了。机构在那一刻干了什么?
他们在卖。
这不是阴谋,这是SMC的核心逻辑:聪明钱利用散户的FOMO情绪来出货,利用散户的恐慌情绪来建仓。方向永远相反。
🔍 如何识别背离信号
散户行为特征:价格突破前高就追多,价格跌破支撑就割肉,跟着K线走,永远滞后。
机构行为特征:在散户止损集中的区域下方建仓,在散户FOMO追涨的区域减仓,用流动性,不被流动性驱使。
具体怎么看?盯大户持仓比例和散户比例的分歧。当前BTC大户持仓约65%多,散户却在追涨。分歧越大,背离越明显,意味着一方即将被教育。
📌 当前BTC结构
$83,000附近是关键——这个位置上方有密集的散户止损(上次下跌时形成的空单止损),机构有动力把价格推上去触发这些止损,吃掉流动性后再决定方向。如果你看到价格突破$83,500后快速回落,不要奇怪,那就是止损猎杀完成信号。
操作结论:不在散户疯狂追涨的位置追多,等价格回到机构真正想要的OB区域($81,000~$81,500),跟着聪明钱,不跟着情绪。
见过太多人在涨3%的地方进场,跌5%的地方出场。
那不是运气差,那是站错了队。
关注我,每晚21:00直播+SMC教学
🌿 姓赵不宣 | 不是建议
#BTC #SMC #聪明钱
3
571

·
--
බෙයාරිෂ්
$US BEARISH BIAS: the latest confirmed H1 close at 0.021677 reinforces the bearish CHoCH below 0.030001 and the failed rebound to 0.027233.
Wyckoff suggests potential distribution transitioning into markdown, while a fresh bearish imbalance at 0.022788–0.023370 and volume at 1.21× the preceding 20-candle average support the breakdown.
BEARISH BIAS — NO ENTRY YET: consider only a confirmed failed retest of 0.026000–0.027000, with SL at 0.027600, TP1 at 0.021388 and TP2 at 0.019627, offering 4.65R and 6.25R from the entry midpoint before costs.
An H1 close above 0.027600 invalidates this setup; avoid chasing the drop, and if the retest never comes, let the trade go.
Will the next bounce expose trapped buyers? #Wyckoff #SMC
Paper analysis only; not financial advice
{future}(USUSDT)
$US BEARISH BIAS: the latest confirmed H1 close at 0.021677 reinforces the bearish CHoCH below 0.030001 and the failed rebound to 0.027233.
Wyckoff suggests potential distribution transitioning into markdown, while a fresh bearish imbalance at 0.022788–0.023370 and volume at 1.21× the preceding 20-candle average support the breakdown.
BEARISH BIAS — NO ENTRY YET: consider only a confirmed failed retest of 0.026000–0.027000, with SL at 0.027600, TP1 at 0.021388 and TP2 at 0.019627, offering 4.65R and 6.25R from the entry midpoint before costs.
An H1 close above 0.027600 invalidates this setup; avoid chasing the drop, and if the retest never comes, let the trade go.
Will the next bounce expose trapped buyers? #Wyckoff #SMC
Paper analysis only; not financial advice
Wyckoff suggests potential distribution transitioning into markdown, while a fresh bearish imbalance at 0.022788–0.023370 and volume at 1.21× the preceding 20-candle average support the breakdown.
BEARISH BIAS — NO ENTRY YET: consider only a confirmed failed retest of 0.026000–0.027000, with SL at 0.027600, TP1 at 0.021388 and TP2 at 0.019627, offering 4.65R and 6.25R from the entry midpoint before costs.
An H1 close above 0.027600 invalidates this setup; avoid chasing the drop, and if the retest never comes, let the trade go.
Will the next bounce expose trapped buyers? #Wyckoff #SMC
Paper analysis only; not financial advice
2
656

📊 What Is Liquidity in Trading?
Liquidity is where large amounts of Stop Losses and Pending Orders are resting. 🎯
💡 How does it work?
The market often moves toward liquidity zones to trigger orders before making its next significant move.
🔹 Buy-Side Liquidity (BSL): Usually found above previous highs, where buy stops may rest.
🔹 Sell-Side Liquidity (SSL): Usually found below previous lows, where sell stops may rest.
🔹 Liquidity Sweep: When price moves beyond a key high or low to trigger orders, then potentially reverses or continues in a new direction.
📈 How to identify liquidity:
• Previous swing highs and lows
• Equal highs and equal lows
• Support and resistance levels
• Areas where traders may place stop-loss orders
⚠️ Remember: A liquidity sweep does not guarantee a reversal. Always wait for price-action confirmation before making a trading decision.
🎯 Learn | Practice | Trade Smarter
#liquidity #SmartMoneyConcepts #smc #priceaction
📊 What Is Liquidity in Trading?
Liquidity is where large amounts of Stop Losses and Pending Orders are resting. 🎯
💡 How does it work?
The market often moves toward liquidity zones to trigger orders before making its next significant move.
🔹 Buy-Side Liquidity (BSL): Usually found above previous highs, where buy stops may rest.
🔹 Sell-Side Liquidity (SSL): Usually found below previous lows, where sell stops may rest.
🔹 Liquidity Sweep: When price moves beyond a key high or low to trigger orders, then potentially reverses or continues in a new direction.
📈 How to identify liquidity:
• Previous swing highs and lows
• Equal highs and equal lows
• Support and resistance levels
• Areas where traders may place stop-loss orders
⚠️ Remember: A liquidity sweep does not guarantee a reversal. Always wait for price-action confirmation before making a trading decision.
🎯 Learn | Practice | Trade Smarter
#liquidity #SmartMoneyConcepts #smc #priceaction
Liquidity is where large amounts of Stop Losses and Pending Orders are resting. 🎯
💡 How does it work?
The market often moves toward liquidity zones to trigger orders before making its next significant move.
🔹 Buy-Side Liquidity (BSL): Usually found above previous highs, where buy stops may rest.
🔹 Sell-Side Liquidity (SSL): Usually found below previous lows, where sell stops may rest.
🔹 Liquidity Sweep: When price moves beyond a key high or low to trigger orders, then potentially reverses or continues in a new direction.
📈 How to identify liquidity:
• Previous swing highs and lows
• Equal highs and equal lows
• Support and resistance levels
• Areas where traders may place stop-loss orders
⚠️ Remember: A liquidity sweep does not guarantee a reversal. Always wait for price-action confirmation before making a trading decision.
🎯 Learn | Practice | Trade Smarter
#liquidity #SmartMoneyConcepts #smc #priceaction
81

W is hovering just under the 25.5 mark, pressure building for a move higher. Volume spikes hint the next push could be decisive.
━━━━━━━━━━━━━━━━━━━━━
🟢 $W LONG 📈
━━━━━━━━━━━━━━━━━━━━━
📍 Entry Range: $0.017497 – $0.017533
🛑 Stop Loss: $0.016990 (-3.0%)
🎯 TP1: $0.017778 (+1.5%)
🏆 TP2: $0.018391 (+5.0%)
⚡ R/R Ratio: 1:1.7
📊 Confidence: 65%
━━━━━━━━━━━━━━━━━━━━━
The CHoCH broke the last swing low, while CVD surged confirming buying pressure. An FVG lines up with the OB on the 1‑hour, creating a POI where the two overlap, so the structure now reads a bullish continuation.
A 3.0 % stop is relatively tight, so a 5‑6x leverage keeps risk in check.
Take half off at the first target around 27.0 to lock in profit.
Not financial advice — trade only what you can afford to lose 🙏
$W #WUSDT #SMC #TradingSignals #Write2Earn
W is hovering just under the 25.5 mark, pressure building for a move higher. Volume spikes hint the next push could be decisive.
━━━━━━━━━━━━━━━━━━━━━
🟢 $W LONG 📈
━━━━━━━━━━━━━━━━━━━━━
📍 Entry Range: $0.017497 – $0.017533
🛑 Stop Loss: $0.016990 (-3.0%)
🎯 TP1: $0.017778 (+1.5%)
🏆 TP2: $0.018391 (+5.0%)
⚡ R/R Ratio: 1:1.7
📊 Confidence: 65%
━━━━━━━━━━━━━━━━━━━━━
The CHoCH broke the last swing low, while CVD surged confirming buying pressure. An FVG lines up with the OB on the 1‑hour, creating a POI where the two overlap, so the structure now reads a bullish continuation.
A 3.0 % stop is relatively tight, so a 5‑6x leverage keeps risk in check.
Take half off at the first target around 27.0 to lock in profit.
Not financial advice — trade only what you can afford to lose 🙏
$W #WUSDT #SMC #TradingSignals #Write2Earn
━━━━━━━━━━━━━━━━━━━━━
🟢 $W LONG 📈
━━━━━━━━━━━━━━━━━━━━━
📍 Entry Range: $0.017497 – $0.017533
🛑 Stop Loss: $0.016990 (-3.0%)
🎯 TP1: $0.017778 (+1.5%)
🏆 TP2: $0.018391 (+5.0%)
⚡ R/R Ratio: 1:1.7
📊 Confidence: 65%
━━━━━━━━━━━━━━━━━━━━━
The CHoCH broke the last swing low, while CVD surged confirming buying pressure. An FVG lines up with the OB on the 1‑hour, creating a POI where the two overlap, so the structure now reads a bullish continuation.
A 3.0 % stop is relatively tight, so a 5‑6x leverage keeps risk in check.
Take half off at the first target around 27.0 to lock in profit.
Not financial advice — trade only what you can afford to lose 🙏
$W #WUSDT #SMC #TradingSignals #Write2Earn
14
·
--
🚨 $NVDA BEARISH BIAS: THE BOUNCE FAILED. WAIT FOR A RETEST—DON’T CHASE RED.
NVDAUSDT USD-M Futures last closed at $231.68 on 9 Oct 2026, 14:59:59 UTC. All 300 closed H1 candles passed validation.
Three clues favor sellers:
1️⃣ H1 confirmed bearish BOS below $234.01, closing at $232.99.
2️⃣ The recovery stalled at a lower high of $235.81; the latest sell candle closed at $231.19 on 3.66× its preceding 20-hour average volume.
3️⃣ That displacement left a fresh bearish imbalance at $231.95–$233.99.
Wyckoff: developing markdown; no stable H1 range supports a confirmed distribution label. SMC retains bearish structure. The $235.81 lower high is the local invalidation reference, while $230.15 remains downside liquidity.
🔴 BEARISH BIAS — NO ENTRY YET
ONE CONDITIONAL SHORT MAP
Trigger: H1 close below $234.01 — confirmed.
Entry: $233.99–$234.31, the lost support area beside the imbalance. Require a bounce into the zone that fails to reclaim structure, then H1 closes back below $234.01. Entry is valid only while price remains in or very near the zone.
SL: $235.95, above the $235.81 lower high.
TP1: $231.37, nearby liquidity / reaction level — 1.54R.
TP2: $230.15, prior swing low — 2.22R.
R:R uses entry midpoint $234.15, before fees and slippage.
Thesis invalidation: H1 close above $235.81.
The last candle swept below nearby lows and recovered on 1.61× volume. That warns against selling into support; it does not yet confirm bullish reversal. The planned failed retest has not appeared.
No early Short. No chasing the displacement candle.
$NVDA #Wyckoff #SMC
Paper analysis only. Not financial advice.
Will sellers defend the lost support when the next bounce arrives? 👇
🚨 $NVDA BEARISH BIAS: THE BOUNCE FAILED. WAIT FOR A RETEST—DON’T CHASE RED.
NVDAUSDT USD-M Futures last closed at $231.68 on 9 Oct 2026, 14:59:59 UTC. All 300 closed H1 candles passed validation.
Three clues favor sellers:
1️⃣ H1 confirmed bearish BOS below $234.01, closing at $232.99.
2️⃣ The recovery stalled at a lower high of $235.81; the latest sell candle closed at $231.19 on 3.66× its preceding 20-hour average volume.
3️⃣ That displacement left a fresh bearish imbalance at $231.95–$233.99.
Wyckoff: developing markdown; no stable H1 range supports a confirmed distribution label. SMC retains bearish structure. The $235.81 lower high is the local invalidation reference, while $230.15 remains downside liquidity.
🔴 BEARISH BIAS — NO ENTRY YET
ONE CONDITIONAL SHORT MAP
Trigger: H1 close below $234.01 — confirmed.
Entry: $233.99–$234.31, the lost support area beside the imbalance. Require a bounce into the zone that fails to reclaim structure, then H1 closes back below $234.01. Entry is valid only while price remains in or very near the zone.
SL: $235.95, above the $235.81 lower high.
TP1: $231.37, nearby liquidity / reaction level — 1.54R.
TP2: $230.15, prior swing low — 2.22R.
R:R uses entry midpoint $234.15, before fees and slippage.
Thesis invalidation: H1 close above $235.81.
The last candle swept below nearby lows and recovered on 1.61× volume. That warns against selling into support; it does not yet confirm bullish reversal. The planned failed retest has not appeared.
No early Short. No chasing the displacement candle.
$NVDA #Wyckoff #SMC
Paper analysis only. Not financial advice.
Will sellers defend the lost support when the next bounce arrives? 👇
NVDAUSDT USD-M Futures last closed at $231.68 on 9 Oct 2026, 14:59:59 UTC. All 300 closed H1 candles passed validation.
Three clues favor sellers:
1️⃣ H1 confirmed bearish BOS below $234.01, closing at $232.99.
2️⃣ The recovery stalled at a lower high of $235.81; the latest sell candle closed at $231.19 on 3.66× its preceding 20-hour average volume.
3️⃣ That displacement left a fresh bearish imbalance at $231.95–$233.99.
Wyckoff: developing markdown; no stable H1 range supports a confirmed distribution label. SMC retains bearish structure. The $235.81 lower high is the local invalidation reference, while $230.15 remains downside liquidity.
🔴 BEARISH BIAS — NO ENTRY YET
ONE CONDITIONAL SHORT MAP
Trigger: H1 close below $234.01 — confirmed.
Entry: $233.99–$234.31, the lost support area beside the imbalance. Require a bounce into the zone that fails to reclaim structure, then H1 closes back below $234.01. Entry is valid only while price remains in or very near the zone.
SL: $235.95, above the $235.81 lower high.
TP1: $231.37, nearby liquidity / reaction level — 1.54R.
TP2: $230.15, prior swing low — 2.22R.
R:R uses entry midpoint $234.15, before fees and slippage.
Thesis invalidation: H1 close above $235.81.
The last candle swept below nearby lows and recovered on 1.61× volume. That warns against selling into support; it does not yet confirm bullish reversal. The planned failed retest has not appeared.
No early Short. No chasing the displacement candle.
$NVDA #Wyckoff #SMC
Paper analysis only. Not financial advice.
Will sellers defend the lost support when the next bounce arrives? 👇
1
1
212
·
--
很多人说自己看OB,但99%的人识别的是假的。
真正的Order Block不是随便一根大阴/大阳线。
是机构在「最后一次逆势」时留下的脚印——
那根蜡烛的本质是:主力在这里建仓了,还没吃完。
【如何识别有效OB】
有效多头OB:下跌趋势中最后一根阴线,后面接着一波强势突破(BOS)
有效空头OB:上涨趋势中最后一根阳线,后面接着一波强势跌破
两个硬条件:①紧跟BOS/CHoCH结构突破②形成后未被完全穿越
穿越了就废了。不要用已经被吃掉的OB做单。
【BTC实例 · 当前价格 $82,482】
看4H图:$81,200~$81,600区间有一个多头OB——
那是10月7日凌晨最后一根下跌阴线,之后价格直接拉升突破$83,000。
这个OB目前完整,未被穿越。
如果BTC回踩$81,200~$81,600,这是结构上第一个机构级别的承接区。
【可操作结论】
不要追涨。等回踩。
$81,200~$81,600 OB区域挂单或确认后入场做多
止损放OB结构下方$80,600
破了说明OB失效,OB失效=机构没有在那里防守,离场
见过太多人把随便一根长影线叫OB。真正的OB是结构级别的,是机构行为的痕迹,不是K线形态游戏。
关注我,每晚21:00直播+SMC教学
🌿 姓赵不宣 | 不是建议
#SMC #OrderBlock #BTC
很多人说自己看OB,但99%的人识别的是假的。
真正的Order Block不是随便一根大阴/大阳线。
是机构在「最后一次逆势」时留下的脚印——
那根蜡烛的本质是:主力在这里建仓了,还没吃完。
【如何识别有效OB】
有效多头OB:下跌趋势中最后一根阴线,后面接着一波强势突破(BOS)
有效空头OB:上涨趋势中最后一根阳线,后面接着一波强势跌破
两个硬条件:①紧跟BOS/CHoCH结构突破②形成后未被完全穿越
穿越了就废了。不要用已经被吃掉的OB做单。
【BTC实例 · 当前价格 $82,482】
看4H图:$81,200~$81,600区间有一个多头OB——
那是10月7日凌晨最后一根下跌阴线,之后价格直接拉升突破$83,000。
这个OB目前完整,未被穿越。
如果BTC回踩$81,200~$81,600,这是结构上第一个机构级别的承接区。
【可操作结论】
不要追涨。等回踩。
$81,200~$81,600 OB区域挂单或确认后入场做多
止损放OB结构下方$80,600
破了说明OB失效,OB失效=机构没有在那里防守,离场
见过太多人把随便一根长影线叫OB。真正的OB是结构级别的,是机构行为的痕迹,不是K线形态游戏。
关注我,每晚21:00直播+SMC教学
🌿 姓赵不宣 | 不是建议
#SMC #OrderBlock #BTC
真正的Order Block不是随便一根大阴/大阳线。
是机构在「最后一次逆势」时留下的脚印——
那根蜡烛的本质是:主力在这里建仓了,还没吃完。
【如何识别有效OB】
有效多头OB:下跌趋势中最后一根阴线,后面接着一波强势突破(BOS)
有效空头OB:上涨趋势中最后一根阳线,后面接着一波强势跌破
两个硬条件:①紧跟BOS/CHoCH结构突破②形成后未被完全穿越
穿越了就废了。不要用已经被吃掉的OB做单。
【BTC实例 · 当前价格 $82,482】
看4H图:$81,200~$81,600区间有一个多头OB——
那是10月7日凌晨最后一根下跌阴线,之后价格直接拉升突破$83,000。
这个OB目前完整,未被穿越。
如果BTC回踩$81,200~$81,600,这是结构上第一个机构级别的承接区。
【可操作结论】
不要追涨。等回踩。
$81,200~$81,600 OB区域挂单或确认后入场做多
止损放OB结构下方$80,600
破了说明OB失效,OB失效=机构没有在那里防守,离场
见过太多人把随便一根长影线叫OB。真正的OB是结构级别的,是机构行为的痕迹,不是K线形态游戏。
关注我,每晚21:00直播+SMC教学
🌿 姓赵不宣 | 不是建议
#SMC #OrderBlock #BTC
1
691
·
--
$BTC $SOL #technicalanalysis #binancesquare #SMC
BTC/USDT Bearish Setup (5M/1H SMC Analysis) 🔻
Bitcoin premium area se reject ho kar niche shift ho raha hai. HTF structure aur LTF execution align hain.
Trade Setup:
• Direction: SHORT / SELL
• Entry: 82,600
• Stop Loss: 83,150
• Target: 80,600
• Risk to Reward: ~ 1:4
Bitcoin is rejecting from the premium zone and shifting lower. Both HTF bias and LTF execution are aligned.
$BTC $SOL #technicalanalysis #binancesquare #SMC
BTC/USDT Bearish Setup (5M/1H SMC Analysis) 🔻
Bitcoin premium area se reject ho kar niche shift ho raha hai. HTF structure aur LTF execution align hain.
Trade Setup:
• Direction: SHORT / SELL
• Entry: 82,600
• Stop Loss: 83,150
• Target: 80,600
• Risk to Reward: ~ 1:4
Bitcoin is rejecting from the premium zone and shifting lower. Both HTF bias and LTF execution are aligned.
BTC/USDT Bearish Setup (5M/1H SMC Analysis) 🔻
Bitcoin premium area se reject ho kar niche shift ho raha hai. HTF structure aur LTF execution align hain.
Trade Setup:
• Direction: SHORT / SELL
• Entry: 82,600
• Stop Loss: 83,150
• Target: 80,600
• Risk to Reward: ~ 1:4
Bitcoin is rejecting from the premium zone and shifting lower. Both HTF bias and LTF execution are aligned.
41
·
--
$BTC $PAXG #SMC #Goldtrading #CryptoTrading
XAU/USD (Gold) Precision SMC Trade Breakdown 🎯
From Setup Identification to Full TP Hit! 📈
Setup: Market Structure Shift (MSS) + Clean Order Block (OB) tap.
Execution: Perfect risk-to-reward entry with minimal drawdown.
Result: Target smashed cleanly! 🔥
Institutional concepts like SMC/ICT never fail when you wait for proper liquidity sweeps and market structure shifts.
What’s your setup for Gold today? Let’s discuss in the comments! 👇
$BTC $PAXG #SMC #Goldtrading #CryptoTrading
XAU/USD (Gold) Precision SMC Trade Breakdown 🎯
From Setup Identification to Full TP Hit! 📈
Setup: Market Structure Shift (MSS) + Clean Order Block (OB) tap.
Execution: Perfect risk-to-reward entry with minimal drawdown.
Result: Target smashed cleanly! 🔥
Institutional concepts like SMC/ICT never fail when you wait for proper liquidity sweeps and market structure shifts.
What’s your setup for Gold today? Let’s discuss in the comments! 👇
XAU/USD (Gold) Precision SMC Trade Breakdown 🎯
From Setup Identification to Full TP Hit! 📈
Setup: Market Structure Shift (MSS) + Clean Order Block (OB) tap.
Execution: Perfect risk-to-reward entry with minimal drawdown.
Result: Target smashed cleanly! 🔥
Institutional concepts like SMC/ICT never fail when you wait for proper liquidity sweeps and market structure shifts.
What’s your setup for Gold today? Let’s discuss in the comments! 👇
181
·
--
XAU/USD (Gold) SMC Trade Breakdown 📈
Clean Order Block (OB) tap followed by strong bullish momentum!
Currently running in +$49.58 USD profit 🔥
What are your thoughts on Gold for today?👇
#SMC $PAXG #GoldTrading #ICT $BTC
XAU/USD (Gold) SMC Trade Breakdown 📈
Clean Order Block (OB) tap followed by strong bullish momentum!
Currently running in +$49.58 USD profit 🔥
What are your thoughts on Gold for today?👇
#SMC $PAXG #GoldTrading #ICT $BTC
Clean Order Block (OB) tap followed by strong bullish momentum!
Currently running in +$49.58 USD profit 🔥
What are your thoughts on Gold for today?👇
#SMC $PAXG #GoldTrading #ICT $BTC
271
·
--
ලිපිය
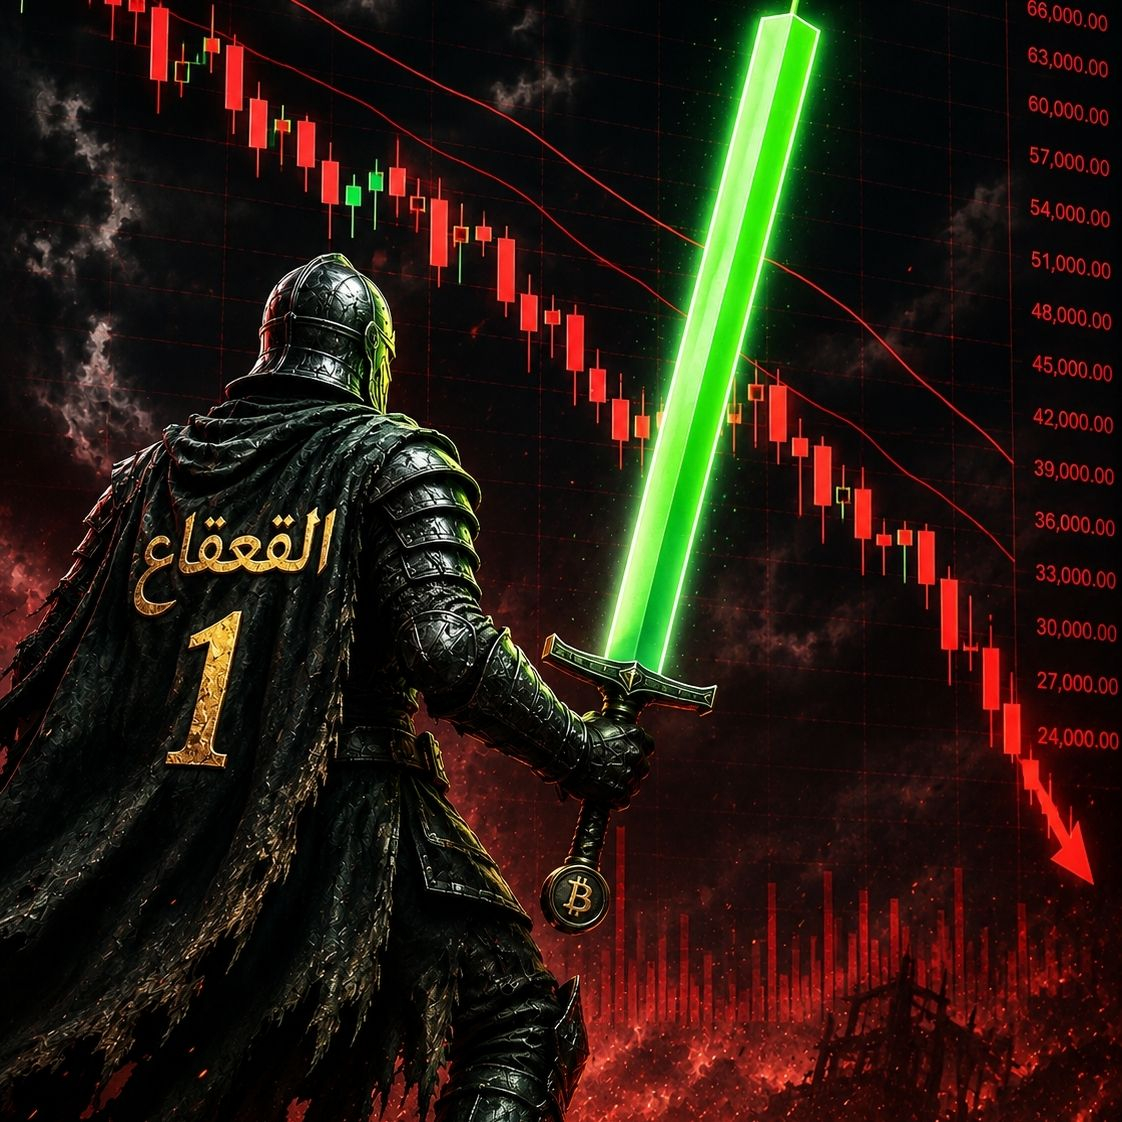
سلسلة مفاهيم المال الذكي (SMC) | الدرس #3 كتل الأوامر (Order Block) وأنواعها الاحترافيةمرحباً بكم زملائي المتداولين في المحطة الثالثة من سلسلتنا التعليمية لمفاهيم المال الذكي (**SMC**).
بعد أن تعلمنا في الدرس السابقة كيف نحدد اتجاه هيكلية السوق عن طريق الـ BOS والـ CHoCH، نأتي اليوم للبحث عن المكان الدقيق الذي يختبئ فيه صناع السوق لدخول الصفقات: كتل الأوامر (Order Blocks).
---
🎯 القاعدة #1: "كتل الأوامر ليست مجرد شموع ملونة، بل هي بصمات أصابع تركها المال الذكي عندما دخل بأحجام ضخمة ولم يستكمل تعبئة كافة أوامره"
---
💡 1️⃣ ما هي كتلة الأوامر (Order Block - OB)؟
عندما تشرع المؤسسات المالية في تجميع كمية شراء ضخمة، فإنها تضغط السعر لأسفل أولاً لتعبئة الأوامر المعلقة، ثم ينطلق السعر بقوة شديدة مفاجئة لترك منطقة صريحة من عدم التوازن (**Imbalance / FVG**).
* كتلة الأوامر الشرائية (Bullish Order Block): هي آخر شمعة هابطة سبقت الانفجار السعري الصاعد الذي أدى إلى كسر الهيكل (**BOS**).
* كتلة الأوامر البيعية (Bearish Order Block): هي آخر شمعة صاعدة سبقت الانفجار السعري الهابط الذي أدى إلى كسر الهيكل (**BOS**).
---
🧬 2️⃣ الشروط الثلاثة لتأكيد صحة وقوة الـ Order Block
ليست كل شمعة هابطة أو صاعدة تُعتبر Order Block صالحاً للتداول. لكي تعتمد المنطقة، يجب أن تتوفر فيها الشروط الثلاثة التالية:
1. كسر هيكل صريح (BOS / CHoCH): يجب أن تكون الشمعة هي المسبب المباشر لحركة أدت إلى إغلاق بجسم الشمعة فوق قمة/قاع سابقة.
2. وجود عدم توازن سعري (Fair Value Gap - FVG): يجب أن تترك الحركة الصادرة عن الـ OB فجوة عدم توازن بين الشمعة الأولى والثالثة، مما يدل على قوة وانحياز صانع السوق.
3. سحب السيولة (Liquidity Sweep): يُفضل أن تكون شمعة الـ OB قد ضربت أو قنصت قيعان/قمم سابقة قبل الانطلاق.
---
🔍 3️⃣ أنواع كتل الأوامر المتقدمة
بجانب الـ Order Block التقليدي، ستواجه نماذج معدلة أكثر قوة على الشارت:
### 1. كتل Breaker Blocks (الكتل المكسورة):
هي كتلة أوامر فشلت في الصمود وتم كسرها بقوة، فتحولت وظيفتها من دعم إلى مقاومة (أو العكس).
* مثال: كتلة شراء (Bullish OB) تم كسرها لأسفل بشمعة قوية؛ عند عودة السعر إليها من أسفل، تُصبح Breaker Block بيعي ممتاز للدخول.
### 2. كتل Mitigation Blocks:
تشبه الـ Breaker Block ولكنها تُشكل عند فشل السعر في عمل قمة/قاع جديدة (أي عدم سحب سيولة جديدة) قبل الكسر. تُستخدم لدخول صفقات مع الاتجاه الجديد عند إعادة الاختبار.
---
⚖️ كيف تتداول الـ Order Block في الميدان؟
1. ضع الأمر المعلق (Limit Order): عند بداية جسم شمعة الـ OB أو عند منتصف الشمعة (50% Mean Threshold).
2. وقف الخسارة (Stop Loss): أسفل القاع/القمة الخاصة بشمعة الـ OB بضع نقاط لحمايتها.
3. الهدف (Take Profit): عند منطقة السيولة التالية أو الـ Order Block المعاكس.
---
⚖️ خلاصة الدرس الثالث:
"الـ Order Block هو بمثابة المحطة التي سيعود إليها قطار المال الذكي لاستكمال الركاب (تعبئة باقي الأوامر) قبل الانطلاق في رحلته الكبرى."
---
💬 شاركونا في التعليقات:
هل تعتمد في تحديد الـ Order Block على جسم الشمعة فقط، أم تشمل الذيل بالكامل في منطقتك؟
#BinanceSquare #smc #cryptotrading #orderblock #القعقاع_1 $NVDAB $AAPLB $MSFTB
{spot}(BTCUSDT)
{spot}(ETHUSDT)
{spot}(BNBUSDT)
سلسلة مفاهيم المال الذكي (SMC) | الدرس #3 كتل الأوامر (Order Block) وأنواعها الاحترافية
مرحباً بكم زملائي المتداولين في المحطة الثالثة من سلسلتنا التعليمية لمفاهيم المال الذكي (**SMC**).
بعد أن تعلمنا في الدرس السابقة كيف نحدد اتجاه هيكلية السوق عن طريق الـ BOS والـ CHoCH، نأتي اليوم للبحث عن المكان الدقيق الذي يختبئ فيه صناع السوق لدخول الصفقات: كتل الأوامر (Order Blocks).
---
🎯 القاعدة #1: "كتل الأوامر ليست مجرد شموع ملونة، بل هي بصمات أصابع تركها المال الذكي عندما دخل بأحجام ضخمة ولم يستكمل تعبئة كافة أوامره"
---
💡 1️⃣ ما هي كتلة الأوامر (Order Block - OB)؟
عندما تشرع المؤسسات المالية في تجميع كمية شراء ضخمة، فإنها تضغط السعر لأسفل أولاً لتعبئة الأوامر المعلقة، ثم ينطلق السعر بقوة شديدة مفاجئة لترك منطقة صريحة من عدم التوازن (**Imbalance / FVG**).
* كتلة الأوامر الشرائية (Bullish Order Block): هي آخر شمعة هابطة سبقت الانفجار السعري الصاعد الذي أدى إلى كسر الهيكل (**BOS**).
* كتلة الأوامر البيعية (Bearish Order Block): هي آخر شمعة صاعدة سبقت الانفجار السعري الهابط الذي أدى إلى كسر الهيكل (**BOS**).
---
🧬 2️⃣ الشروط الثلاثة لتأكيد صحة وقوة الـ Order Block
ليست كل شمعة هابطة أو صاعدة تُعتبر Order Block صالحاً للتداول. لكي تعتمد المنطقة، يجب أن تتوفر فيها الشروط الثلاثة التالية:
1. كسر هيكل صريح (BOS / CHoCH): يجب أن تكون الشمعة هي المسبب المباشر لحركة أدت إلى إغلاق بجسم الشمعة فوق قمة/قاع سابقة.
2. وجود عدم توازن سعري (Fair Value Gap - FVG): يجب أن تترك الحركة الصادرة عن الـ OB فجوة عدم توازن بين الشمعة الأولى والثالثة، مما يدل على قوة وانحياز صانع السوق.
3. سحب السيولة (Liquidity Sweep): يُفضل أن تكون شمعة الـ OB قد ضربت أو قنصت قيعان/قمم سابقة قبل الانطلاق.
---
🔍 3️⃣ أنواع كتل الأوامر المتقدمة
بجانب الـ Order Block التقليدي، ستواجه نماذج معدلة أكثر قوة على الشارت:
### 1. كتل Breaker Blocks (الكتل المكسورة):
هي كتلة أوامر فشلت في الصمود وتم كسرها بقوة، فتحولت وظيفتها من دعم إلى مقاومة (أو العكس).
* مثال: كتلة شراء (Bullish OB) تم كسرها لأسفل بشمعة قوية؛ عند عودة السعر إليها من أسفل، تُصبح Breaker Block بيعي ممتاز للدخول.
### 2. كتل Mitigation Blocks:
تشبه الـ Breaker Block ولكنها تُشكل عند فشل السعر في عمل قمة/قاع جديدة (أي عدم سحب سيولة جديدة) قبل الكسر. تُستخدم لدخول صفقات مع الاتجاه الجديد عند إعادة الاختبار.
---
⚖️ كيف تتداول الـ Order Block في الميدان؟
1. ضع الأمر المعلق (Limit Order): عند بداية جسم شمعة الـ OB أو عند منتصف الشمعة (50% Mean Threshold).
2. وقف الخسارة (Stop Loss): أسفل القاع/القمة الخاصة بشمعة الـ OB بضع نقاط لحمايتها.
3. الهدف (Take Profit): عند منطقة السيولة التالية أو الـ Order Block المعاكس.
---
⚖️ خلاصة الدرس الثالث:
"الـ Order Block هو بمثابة المحطة التي سيعود إليها قطار المال الذكي لاستكمال الركاب (تعبئة باقي الأوامر) قبل الانطلاق في رحلته الكبرى."
---
💬 شاركونا في التعليقات:
هل تعتمد في تحديد الـ Order Block على جسم الشمعة فقط، أم تشمل الذيل بالكامل في منطقتك؟
#BinanceSquare #smc #cryptotrading #orderblock #القعقاع_1 $NVDAB $AAPLB $MSFTB
بعد أن تعلمنا في الدرس السابقة كيف نحدد اتجاه هيكلية السوق عن طريق الـ BOS والـ CHoCH، نأتي اليوم للبحث عن المكان الدقيق الذي يختبئ فيه صناع السوق لدخول الصفقات: كتل الأوامر (Order Blocks).
---
🎯 القاعدة #1: "كتل الأوامر ليست مجرد شموع ملونة، بل هي بصمات أصابع تركها المال الذكي عندما دخل بأحجام ضخمة ولم يستكمل تعبئة كافة أوامره"
---
💡 1️⃣ ما هي كتلة الأوامر (Order Block - OB)؟
عندما تشرع المؤسسات المالية في تجميع كمية شراء ضخمة، فإنها تضغط السعر لأسفل أولاً لتعبئة الأوامر المعلقة، ثم ينطلق السعر بقوة شديدة مفاجئة لترك منطقة صريحة من عدم التوازن (**Imbalance / FVG**).
* كتلة الأوامر الشرائية (Bullish Order Block): هي آخر شمعة هابطة سبقت الانفجار السعري الصاعد الذي أدى إلى كسر الهيكل (**BOS**).
* كتلة الأوامر البيعية (Bearish Order Block): هي آخر شمعة صاعدة سبقت الانفجار السعري الهابط الذي أدى إلى كسر الهيكل (**BOS**).
---
🧬 2️⃣ الشروط الثلاثة لتأكيد صحة وقوة الـ Order Block
ليست كل شمعة هابطة أو صاعدة تُعتبر Order Block صالحاً للتداول. لكي تعتمد المنطقة، يجب أن تتوفر فيها الشروط الثلاثة التالية:
1. كسر هيكل صريح (BOS / CHoCH): يجب أن تكون الشمعة هي المسبب المباشر لحركة أدت إلى إغلاق بجسم الشمعة فوق قمة/قاع سابقة.
2. وجود عدم توازن سعري (Fair Value Gap - FVG): يجب أن تترك الحركة الصادرة عن الـ OB فجوة عدم توازن بين الشمعة الأولى والثالثة، مما يدل على قوة وانحياز صانع السوق.
3. سحب السيولة (Liquidity Sweep): يُفضل أن تكون شمعة الـ OB قد ضربت أو قنصت قيعان/قمم سابقة قبل الانطلاق.
---
🔍 3️⃣ أنواع كتل الأوامر المتقدمة
بجانب الـ Order Block التقليدي، ستواجه نماذج معدلة أكثر قوة على الشارت:
### 1. كتل Breaker Blocks (الكتل المكسورة):
هي كتلة أوامر فشلت في الصمود وتم كسرها بقوة، فتحولت وظيفتها من دعم إلى مقاومة (أو العكس).
* مثال: كتلة شراء (Bullish OB) تم كسرها لأسفل بشمعة قوية؛ عند عودة السعر إليها من أسفل، تُصبح Breaker Block بيعي ممتاز للدخول.
### 2. كتل Mitigation Blocks:
تشبه الـ Breaker Block ولكنها تُشكل عند فشل السعر في عمل قمة/قاع جديدة (أي عدم سحب سيولة جديدة) قبل الكسر. تُستخدم لدخول صفقات مع الاتجاه الجديد عند إعادة الاختبار.
---
⚖️ كيف تتداول الـ Order Block في الميدان؟
1. ضع الأمر المعلق (Limit Order): عند بداية جسم شمعة الـ OB أو عند منتصف الشمعة (50% Mean Threshold).
2. وقف الخسارة (Stop Loss): أسفل القاع/القمة الخاصة بشمعة الـ OB بضع نقاط لحمايتها.
3. الهدف (Take Profit): عند منطقة السيولة التالية أو الـ Order Block المعاكس.
---
⚖️ خلاصة الدرس الثالث:
"الـ Order Block هو بمثابة المحطة التي سيعود إليها قطار المال الذكي لاستكمال الركاب (تعبئة باقي الأوامر) قبل الانطلاق في رحلته الكبرى."
---
💬 شاركونا في التعليقات:
هل تعتمد في تحديد الـ Order Block على جسم الشمعة فقط، أم تشمل الذيل بالكامل في منطقتك؟
#BinanceSquare #smc #cryptotrading #orderblock #القعقاع_1 $NVDAB $AAPLB $MSFTB
3
119

·
--
3 Concepts That Changed My Trading 🧠
You don’t need a complicated system. Start by mastering these three concepts:
1️⃣ Liquidity (LQ) — Know where stops and orders may be resting.
2️⃣ Break of Structure (BOS) — Wait for evidence of a potential shift.
3️⃣ Fair Value Gap (FVG) — Identify potential areas for price to retrace into.
#SMC #ICTTrading #PriceAction #Trading
3 Concepts That Changed My Trading 🧠
You don’t need a complicated system. Start by mastering these three concepts:
1️⃣ Liquidity (LQ) — Know where stops and orders may be resting.
2️⃣ Break of Structure (BOS) — Wait for evidence of a potential shift.
3️⃣ Fair Value Gap (FVG) — Identify potential areas for price to retrace into.
#SMC #ICTTrading #PriceAction #Trading
You don’t need a complicated system. Start by mastering these three concepts:
1️⃣ Liquidity (LQ) — Know where stops and orders may be resting.
2️⃣ Break of Structure (BOS) — Wait for evidence of a potential shift.
3️⃣ Fair Value Gap (FVG) — Identify potential areas for price to retrace into.
#SMC #ICTTrading #PriceAction #Trading
9
839
·
--
🚨 $ZEC’S BOUNCE HASN’T REPAIRED H1 STRUCTURE. WAIT FOR SELLERS — DON’T CHASE THE DROP.
ZECUSDT Futures last closed at $1,317.78 (7 Oct, 12:59 UTC / 19:59 Vietnam).
Three reasons sellers retain the edge:
1️⃣ An H1 close at $1,323.45 confirmed bearish CHoCH below $1,331.
2️⃣ The rebound stalled below overhead supply; price later broke the $1,298.22 low and reached $1,288.10.
3️⃣ That latest sell candle carried 1.87× the previous 20-hour average volume. The recovery recorded 1.38×, but remains below the broken $1,331 structure.
Wyckoff: potential distribution with developing SOW evidence. The earlier upper-range rejection is a candidate event, not proof of a completed distribution sequence.
SMC: bearish displacement left a partially filled imbalance at $1,333.45–$1,359.90 and fresh supply at $1,359.90–$1,369.65. The $1,369.65 high protects the local bearish thesis.
🔴 BEARISH BIAS — NO ENTRY YET
Conditional SHORT:
• Trigger: H1 close below $1,331 — confirmed.
• Entry watch: $1,360–$1,368.
• Require a failed retest with an H1 close back below $1,360; merely touching supply is insufficient.
• SL: $1,372, above $1,369.65.
• TP1: $1,329.57, the recent swing high beneath supply.
• TP2: $1,288.10, the latest downside liquidity reference.
From the $1,364 midpoint, theoretical R:R is 4.30:1 to TP1 and 9.49:1 to TP2, before fees and slippage. These ratios apply only if a valid entry forms at the proposed retest.
Price is far below entry and no qualifying failed retest has appeared there. An H1 close above $1,369.65 invalidates this local bearish thesis.
The active bounce warns against Shorting into nearby support. No early entry. No chasing red candles. If supply is never retested, skip it.
Will sellers defend $1,360–$1,368 on the next recovery? 👀
$ZEC #Wyckoff #SMC
Paper analysis only. Not financial advice.
🚨 $ZEC ’S BOUNCE HASN’T REPAIRED H1 STRUCTURE. WAIT FOR SELLERS — DON’T CHASE THE DROP.
ZECUSDT Futures last closed at $1,317.78 (7 Oct, 12:59 UTC / 19:59 Vietnam).
Three reasons sellers retain the edge:
1️⃣ An H1 close at $1,323.45 confirmed bearish CHoCH below $1,331.
2️⃣ The rebound stalled below overhead supply; price later broke the $1,298.22 low and reached $1,288.10.
3️⃣ That latest sell candle carried 1.87× the previous 20-hour average volume. The recovery recorded 1.38×, but remains below the broken $1,331 structure.
Wyckoff: potential distribution with developing SOW evidence. The earlier upper-range rejection is a candidate event, not proof of a completed distribution sequence.
SMC: bearish displacement left a partially filled imbalance at $1,333.45–$1,359.90 and fresh supply at $1,359.90–$1,369.65. The $1,369.65 high protects the local bearish thesis.
🔴 BEARISH BIAS — NO ENTRY YET
Conditional SHORT:
• Trigger: H1 close below $1,331 — confirmed.
• Entry watch: $1,360–$1,368.
• Require a failed retest with an H1 close back below $1,360; merely touching supply is insufficient.
• SL: $1,372, above $1,369.65.
• TP1: $1,329.57, the recent swing high beneath supply.
• TP2: $1,288.10, the latest downside liquidity reference.
From the $1,364 midpoint, theoretical R:R is 4.30:1 to TP1 and 9.49:1 to TP2, before fees and slippage. These ratios apply only if a valid entry forms at the proposed retest.
Price is far below entry and no qualifying failed retest has appeared there. An H1 close above $1,369.65 invalidates this local bearish thesis.
The active bounce warns against Shorting into nearby support. No early entry. No chasing red candles. If supply is never retested, skip it.
Will sellers defend $1,360–$1,368 on the next recovery? 👀
$ZEC #Wyckoff #SMC
Paper analysis only. Not financial advice.
ZECUSDT Futures last closed at $1,317.78 (7 Oct, 12:59 UTC / 19:59 Vietnam).
Three reasons sellers retain the edge:
1️⃣ An H1 close at $1,323.45 confirmed bearish CHoCH below $1,331.
2️⃣ The rebound stalled below overhead supply; price later broke the $1,298.22 low and reached $1,288.10.
3️⃣ That latest sell candle carried 1.87× the previous 20-hour average volume. The recovery recorded 1.38×, but remains below the broken $1,331 structure.
Wyckoff: potential distribution with developing SOW evidence. The earlier upper-range rejection is a candidate event, not proof of a completed distribution sequence.
SMC: bearish displacement left a partially filled imbalance at $1,333.45–$1,359.90 and fresh supply at $1,359.90–$1,369.65. The $1,369.65 high protects the local bearish thesis.
🔴 BEARISH BIAS — NO ENTRY YET
Conditional SHORT:
• Trigger: H1 close below $1,331 — confirmed.
• Entry watch: $1,360–$1,368.
• Require a failed retest with an H1 close back below $1,360; merely touching supply is insufficient.
• SL: $1,372, above $1,369.65.
• TP1: $1,329.57, the recent swing high beneath supply.
• TP2: $1,288.10, the latest downside liquidity reference.
From the $1,364 midpoint, theoretical R:R is 4.30:1 to TP1 and 9.49:1 to TP2, before fees and slippage. These ratios apply only if a valid entry forms at the proposed retest.
Price is far below entry and no qualifying failed retest has appeared there. An H1 close above $1,369.65 invalidates this local bearish thesis.
The active bounce warns against Shorting into nearby support. No early entry. No chasing red candles. If supply is never retested, skip it.
Will sellers defend $1,360–$1,368 on the next recovery? 👀
$ZEC #Wyckoff #SMC
Paper analysis only. Not financial advice.
1
1
249
·
--
🚨 $BR’S RECOVERY HAS LOST H1 STRUCTURE. I’M WAITING FOR A FAILED BOUNCE.
BRUSDT Futures last closed at $0.53440 (7 Oct, 09:59 UTC / 16:59 Vietnam).
Three reasons sellers have the edge:
1️⃣ An H1 close at $0.51959 broke the $0.53244 swing low, confirming bearish CHoCH.
2️⃣ The rally rejected $0.67700; later highs at $0.64887 and $0.61288 stayed below it.
3️⃣ The latest recovery carried only 0.52× the previous 20-hour average volume, versus 1.25× on the earlier rejection from $0.61001.
Wyckoff: potential distribution after an upside climax and repeated failed recoveries. The $0.67700 peak is a BC candidate; a complete distribution sequence is not confirmed.
SMC: the local bullish shift has failed. The $0.61288 high now protects bearish structure, while the $0.51111 low is a downside liquidity reference. The latest reclaim of $0.53244 makes an immediate Short premature.
🔴 BEARISH BIAS — NO ENTRY YET
Conditional SHORT:
• Trigger: H1 close below $0.53244 — confirmed, but currently reclaimed.
• Entry watch: $0.58000–$0.60000, inside the bearish order block.
• Require a failed retest and closed H1 rejection back below $0.58000; touching supply alone is insufficient.
• SL: $0.61500, above $0.61288.
• TP1: $0.53244, the broken swing level.
• TP2: $0.48253, the earlier reaction low.
From the $0.59000 midpoint, theoretical R:R is 2.30:1 to TP1 and 4.30:1 to TP2, before fees and slippage.
No qualifying failed retest has appeared in the entry zone. An H1 close above $0.61288 invalidates this local bearish thesis.
No early entry. Don’t Short into $0.51111 support or chase a red candle. If the bounce never offers a valid retest, skip it.
Can sellers turn $0.58000–$0.60000 into the next failed recovery? 👀
$BR #Wyckoff #SMC
Paper analysis only. Not financial advice.
🚨 $BR ’S RECOVERY HAS LOST H1 STRUCTURE. I’M WAITING FOR A FAILED BOUNCE.
BRUSDT Futures last closed at $0.53440 (7 Oct, 09:59 UTC / 16:59 Vietnam).
Three reasons sellers have the edge:
1️⃣ An H1 close at $0.51959 broke the $0.53244 swing low, confirming bearish CHoCH.
2️⃣ The rally rejected $0.67700; later highs at $0.64887 and $0.61288 stayed below it.
3️⃣ The latest recovery carried only 0.52× the previous 20-hour average volume, versus 1.25× on the earlier rejection from $0.61001.
Wyckoff: potential distribution after an upside climax and repeated failed recoveries. The $0.67700 peak is a BC candidate; a complete distribution sequence is not confirmed.
SMC: the local bullish shift has failed. The $0.61288 high now protects bearish structure, while the $0.51111 low is a downside liquidity reference. The latest reclaim of $0.53244 makes an immediate Short premature.
🔴 BEARISH BIAS — NO ENTRY YET
Conditional SHORT:
• Trigger: H1 close below $0.53244 — confirmed, but currently reclaimed.
• Entry watch: $0.58000–$0.60000, inside the bearish order block.
• Require a failed retest and closed H1 rejection back below $0.58000; touching supply alone is insufficient.
• SL: $0.61500, above $0.61288.
• TP1: $0.53244, the broken swing level.
• TP2: $0.48253, the earlier reaction low.
From the $0.59000 midpoint, theoretical R:R is 2.30:1 to TP1 and 4.30:1 to TP2, before fees and slippage.
No qualifying failed retest has appeared in the entry zone. An H1 close above $0.61288 invalidates this local bearish thesis.
No early entry. Don’t Short into $0.51111 support or chase a red candle. If the bounce never offers a valid retest, skip it.
Can sellers turn $0.58000–$0.60000 into the next failed recovery? 👀
$BR #Wyckoff #SMC
Paper analysis only. Not financial advice.
BRUSDT Futures last closed at $0.53440 (7 Oct, 09:59 UTC / 16:59 Vietnam).
Three reasons sellers have the edge:
1️⃣ An H1 close at $0.51959 broke the $0.53244 swing low, confirming bearish CHoCH.
2️⃣ The rally rejected $0.67700; later highs at $0.64887 and $0.61288 stayed below it.
3️⃣ The latest recovery carried only 0.52× the previous 20-hour average volume, versus 1.25× on the earlier rejection from $0.61001.
Wyckoff: potential distribution after an upside climax and repeated failed recoveries. The $0.67700 peak is a BC candidate; a complete distribution sequence is not confirmed.
SMC: the local bullish shift has failed. The $0.61288 high now protects bearish structure, while the $0.51111 low is a downside liquidity reference. The latest reclaim of $0.53244 makes an immediate Short premature.
🔴 BEARISH BIAS — NO ENTRY YET
Conditional SHORT:
• Trigger: H1 close below $0.53244 — confirmed, but currently reclaimed.
• Entry watch: $0.58000–$0.60000, inside the bearish order block.
• Require a failed retest and closed H1 rejection back below $0.58000; touching supply alone is insufficient.
• SL: $0.61500, above $0.61288.
• TP1: $0.53244, the broken swing level.
• TP2: $0.48253, the earlier reaction low.
From the $0.59000 midpoint, theoretical R:R is 2.30:1 to TP1 and 4.30:1 to TP2, before fees and slippage.
No qualifying failed retest has appeared in the entry zone. An H1 close above $0.61288 invalidates this local bearish thesis.
No early entry. Don’t Short into $0.51111 support or chase a red candle. If the bounce never offers a valid retest, skip it.
Can sellers turn $0.58000–$0.60000 into the next failed recovery? 👀
$BR #Wyckoff #SMC
Paper analysis only. Not financial advice.
1
1
249
·
--
🚨 $WLD LOST ANOTHER H1 SUPPORT. DON’T SHORT THE DROP — WAIT FOR A FAILED BOUNCE.
WLDUSDT Futures last closed at $0.5223 (7 Oct, 05:59 UTC / 12:59 Vietnam).
Three reasons sellers hold the edge:
1️⃣ An H1 close below $0.5464 confirmed another bearish BOS.
2️⃣ Lower highs stepped down from $0.5824 to $0.5706 and $0.5546.
3️⃣ The flush to $0.5078 carried 7.62× the previous 20-hour average volume; the latest recovery candle recorded only 0.85×.
Wyckoff: potential markdown after the earlier range failed. There is no stable new H1 range to confirm a fresh accumulation or distribution sequence.
SMC: bearish displacement left overhead imbalances at $0.5266–$0.5410 and $0.5437–$0.5486. The $0.5546 high protects the local bearish structure; $0.5078 remains a downside liquidity reference, not a guaranteed target.
🔴 BEARISH BIAS — NO ENTRY YET
Conditional SHORT map:
• Trigger: H1 close below $0.5464 — confirmed.
• Entry watch: $0.5410–$0.5486.
• Require a fresh failed retest and closed H1 rejection back below $0.5464. A touch alone is insufficient.
• SL: $0.5555, above $0.5546.
• TP1: $0.5175, a recent close cluster.
• TP2: $0.5078, the latest swing low.
From the $0.5448 midpoint, theoretical R:R is 2.55:1 to TP1 and 3.46:1 to TP2, before fees and slippage.
Price is below entry; no qualifying retest exists there yet. An H1 close above $0.5546 invalidates this local bearish thesis.
The rebound is not proof of a reversal, but Shorting into nearby lows is poor timing. No early entry. No chasing red candles.
Will sellers turn $0.5410–$0.5486 into a failed retest? 👀
$WLD #Wyckoff #SMC
Paper analysis only. Not financial advice.
🚨 $WLD LOST ANOTHER H1 SUPPORT. DON’T SHORT THE DROP — WAIT FOR A FAILED BOUNCE.
WLDUSDT Futures last closed at $0.5223 (7 Oct, 05:59 UTC / 12:59 Vietnam).
Three reasons sellers hold the edge:
1️⃣ An H1 close below $0.5464 confirmed another bearish BOS.
2️⃣ Lower highs stepped down from $0.5824 to $0.5706 and $0.5546.
3️⃣ The flush to $0.5078 carried 7.62× the previous 20-hour average volume; the latest recovery candle recorded only 0.85×.
Wyckoff: potential markdown after the earlier range failed. There is no stable new H1 range to confirm a fresh accumulation or distribution sequence.
SMC: bearish displacement left overhead imbalances at $0.5266–$0.5410 and $0.5437–$0.5486. The $0.5546 high protects the local bearish structure; $0.5078 remains a downside liquidity reference, not a guaranteed target.
🔴 BEARISH BIAS — NO ENTRY YET
Conditional SHORT map:
• Trigger: H1 close below $0.5464 — confirmed.
• Entry watch: $0.5410–$0.5486.
• Require a fresh failed retest and closed H1 rejection back below $0.5464. A touch alone is insufficient.
• SL: $0.5555, above $0.5546.
• TP1: $0.5175, a recent close cluster.
• TP2: $0.5078, the latest swing low.
From the $0.5448 midpoint, theoretical R:R is 2.55:1 to TP1 and 3.46:1 to TP2, before fees and slippage.
Price is below entry; no qualifying retest exists there yet. An H1 close above $0.5546 invalidates this local bearish thesis.
The rebound is not proof of a reversal, but Shorting into nearby lows is poor timing. No early entry. No chasing red candles.
Will sellers turn $0.5410–$0.5486 into a failed retest? 👀
$WLD #Wyckoff #SMC
Paper analysis only. Not financial advice.
WLDUSDT Futures last closed at $0.5223 (7 Oct, 05:59 UTC / 12:59 Vietnam).
Three reasons sellers hold the edge:
1️⃣ An H1 close below $0.5464 confirmed another bearish BOS.
2️⃣ Lower highs stepped down from $0.5824 to $0.5706 and $0.5546.
3️⃣ The flush to $0.5078 carried 7.62× the previous 20-hour average volume; the latest recovery candle recorded only 0.85×.
Wyckoff: potential markdown after the earlier range failed. There is no stable new H1 range to confirm a fresh accumulation or distribution sequence.
SMC: bearish displacement left overhead imbalances at $0.5266–$0.5410 and $0.5437–$0.5486. The $0.5546 high protects the local bearish structure; $0.5078 remains a downside liquidity reference, not a guaranteed target.
🔴 BEARISH BIAS — NO ENTRY YET
Conditional SHORT map:
• Trigger: H1 close below $0.5464 — confirmed.
• Entry watch: $0.5410–$0.5486.
• Require a fresh failed retest and closed H1 rejection back below $0.5464. A touch alone is insufficient.
• SL: $0.5555, above $0.5546.
• TP1: $0.5175, a recent close cluster.
• TP2: $0.5078, the latest swing low.
From the $0.5448 midpoint, theoretical R:R is 2.55:1 to TP1 and 3.46:1 to TP2, before fees and slippage.
Price is below entry; no qualifying retest exists there yet. An H1 close above $0.5546 invalidates this local bearish thesis.
The rebound is not proof of a reversal, but Shorting into nearby lows is poor timing. No early entry. No chasing red candles.
Will sellers turn $0.5410–$0.5486 into a failed retest? 👀
$WLD #Wyckoff #SMC
Paper analysis only. Not financial advice.
1
1
382
·
--
🚨 $NMR HAS BULLISH H1 STRUCTURE — BUT CHASING THIS MOVE IS THE WRONG TRADE.
NMRUSDT Futures closed its latest H1 candle at $16.399 (7 Oct, 01:59 UTC / 08:59 Vietnam).
Three reasons buyers still hold the edge:
1️⃣ A confirmed bullish CHoCH above $12.150 launched a major displacement move.
2️⃣ The pullback held $15.171, then price rebuilt above $15.62 and printed a higher recovery close.
3️⃣ The open bullish imbalance at $12.025–$14.850 remains below price, while the next visible liquidity sits around $16.473–$17.424.
Wyckoff: no stable H1 range confirms accumulation or reaccumulation yet; this is only a potential continuation phase after expansion.
SMC: bullish structure is intact, but the latest candle’s volume was only 0.68× the previous 20-hour average. Momentum is cooling beneath overhead liquidity.
🟢 BULLISH BIAS — NO ENTRY YET
Conditional LONG map:
• Trigger: H1 close above $12.150 — confirmed.
• Entry watch: $15.300–$15.620, only after a retest holds and buyers reclaim the zone.
• SL: $15.150, below the $15.171 strong low.
• TP1: $16.473.
• TP2: $17.424.
From the $15.460 entry midpoint, theoretical R:R is 3.27:1 to TP1 and 6.34:1 to TP2, before fees and slippage.
Price is already $16.399, well above the entry zone. No early entry and no Long chase. An H1 close below $15.171 invalidates the bullish thesis.
Will buyers offer a clean retest of $15.300–$15.620, or run straight into $17.424 liquidity? 👀
$NMR #Wyckoff #SMC
Paper analysis only. Not financial advice.
🚨 $NMR HAS BULLISH H1 STRUCTURE — BUT CHASING THIS MOVE IS THE WRONG TRADE.
NMRUSDT Futures closed its latest H1 candle at $16.399 (7 Oct, 01:59 UTC / 08:59 Vietnam).
Three reasons buyers still hold the edge:
1️⃣ A confirmed bullish CHoCH above $12.150 launched a major displacement move.
2️⃣ The pullback held $15.171, then price rebuilt above $15.62 and printed a higher recovery close.
3️⃣ The open bullish imbalance at $12.025–$14.850 remains below price, while the next visible liquidity sits around $16.473–$17.424.
Wyckoff: no stable H1 range confirms accumulation or reaccumulation yet; this is only a potential continuation phase after expansion.
SMC: bullish structure is intact, but the latest candle’s volume was only 0.68× the previous 20-hour average. Momentum is cooling beneath overhead liquidity.
🟢 BULLISH BIAS — NO ENTRY YET
Conditional LONG map:
• Trigger: H1 close above $12.150 — confirmed.
• Entry watch: $15.300–$15.620, only after a retest holds and buyers reclaim the zone.
• SL: $15.150, below the $15.171 strong low.
• TP1: $16.473.
• TP2: $17.424.
From the $15.460 entry midpoint, theoretical R:R is 3.27:1 to TP1 and 6.34:1 to TP2, before fees and slippage.
Price is already $16.399, well above the entry zone. No early entry and no Long chase. An H1 close below $15.171 invalidates the bullish thesis.
Will buyers offer a clean retest of $15.300–$15.620, or run straight into $17.424 liquidity? 👀
$NMR #Wyckoff #SMC
Paper analysis only. Not financial advice.
NMRUSDT Futures closed its latest H1 candle at $16.399 (7 Oct, 01:59 UTC / 08:59 Vietnam).
Three reasons buyers still hold the edge:
1️⃣ A confirmed bullish CHoCH above $12.150 launched a major displacement move.
2️⃣ The pullback held $15.171, then price rebuilt above $15.62 and printed a higher recovery close.
3️⃣ The open bullish imbalance at $12.025–$14.850 remains below price, while the next visible liquidity sits around $16.473–$17.424.
Wyckoff: no stable H1 range confirms accumulation or reaccumulation yet; this is only a potential continuation phase after expansion.
SMC: bullish structure is intact, but the latest candle’s volume was only 0.68× the previous 20-hour average. Momentum is cooling beneath overhead liquidity.
🟢 BULLISH BIAS — NO ENTRY YET
Conditional LONG map:
• Trigger: H1 close above $12.150 — confirmed.
• Entry watch: $15.300–$15.620, only after a retest holds and buyers reclaim the zone.
• SL: $15.150, below the $15.171 strong low.
• TP1: $16.473.
• TP2: $17.424.
From the $15.460 entry midpoint, theoretical R:R is 3.27:1 to TP1 and 6.34:1 to TP2, before fees and slippage.
Price is already $16.399, well above the entry zone. No early entry and no Long chase. An H1 close below $15.171 invalidates the bullish thesis.
Will buyers offer a clean retest of $15.300–$15.620, or run straight into $17.424 liquidity? 👀
$NMR #Wyckoff #SMC
Paper analysis only. Not financial advice.
1
1
339
·
--
🚨 $FIL IS HOLDING ITS H1 STRUCTURE, BUT THIS IS NOT A CLEAN LONG OR SHORT.
FILUSDT Futures last closed at $1.1554 (6 Oct, 22:59 UTC / 7 Oct, 05:59 Vietnam).
Three facts matter:
1️⃣ The last confirmed structure break was a bullish BOS above $1.1184.
2️⃣ Price later reached $1.2110, but the recovery now remains capped beneath $1.1750–$1.1878 overhead resistance.
3️⃣ Participation is fading: the latest candle recorded only 0.41× the previous 20-hour average volume.
Wyckoff: no sufficiently stable H1 trading range confirms accumulation or distribution.
SMC: the bullish structure has not fully failed, but the $1.1515 swing low is under pressure. A bullish imbalance remains open at $1.0913–$1.1267, while a bearish imbalance at $1.1822–$1.1878 sits overhead.
⚪ NO CLEAR EDGE — SKIP TRADE
Why no Long? Buyers have not reclaimed overhead resistance with conviction or produced a valid retest.
Why no Short? The last confirmed BOS is still bullish, and sellers have not closed H1 below $1.1515 to confirm a bearish shift.
A bullish setup needs an H1 reclaim above $1.1878 followed by a retest that holds. An H1 close below $1.1515 would weaken the recovery and expose $1.1267–$1.1184, but a breakdown candle is not a chase entry.
No trigger, entry, SL or targets are assigned while the evidence remains split.
Don’t Long into resistance. Don’t Short before structure breaks. Let the next confirmed close and retest do the talking.
Which level resolves first: $1.1878 or $1.1515? 👀
$FIL #Wyckoff #SMC
Paper analysis only. Not financial advice.
🚨 $FIL IS HOLDING ITS H1 STRUCTURE, BUT THIS IS NOT A CLEAN LONG OR SHORT.
FILUSDT Futures last closed at $1.1554 (6 Oct, 22:59 UTC / 7 Oct, 05:59 Vietnam).
Three facts matter:
1️⃣ The last confirmed structure break was a bullish BOS above $1.1184.
2️⃣ Price later reached $1.2110, but the recovery now remains capped beneath $1.1750–$1.1878 overhead resistance.
3️⃣ Participation is fading: the latest candle recorded only 0.41× the previous 20-hour average volume.
Wyckoff: no sufficiently stable H1 trading range confirms accumulation or distribution.
SMC: the bullish structure has not fully failed, but the $1.1515 swing low is under pressure. A bullish imbalance remains open at $1.0913–$1.1267, while a bearish imbalance at $1.1822–$1.1878 sits overhead.
⚪ NO CLEAR EDGE — SKIP TRADE
Why no Long? Buyers have not reclaimed overhead resistance with conviction or produced a valid retest.
Why no Short? The last confirmed BOS is still bullish, and sellers have not closed H1 below $1.1515 to confirm a bearish shift.
A bullish setup needs an H1 reclaim above $1.1878 followed by a retest that holds. An H1 close below $1.1515 would weaken the recovery and expose $1.1267–$1.1184, but a breakdown candle is not a chase entry.
No trigger, entry, SL or targets are assigned while the evidence remains split.
Don’t Long into resistance. Don’t Short before structure breaks. Let the next confirmed close and retest do the talking.
Which level resolves first: $1.1878 or $1.1515? 👀
$FIL #Wyckoff #SMC
Paper analysis only. Not financial advice.
FILUSDT Futures last closed at $1.1554 (6 Oct, 22:59 UTC / 7 Oct, 05:59 Vietnam).
Three facts matter:
1️⃣ The last confirmed structure break was a bullish BOS above $1.1184.
2️⃣ Price later reached $1.2110, but the recovery now remains capped beneath $1.1750–$1.1878 overhead resistance.
3️⃣ Participation is fading: the latest candle recorded only 0.41× the previous 20-hour average volume.
Wyckoff: no sufficiently stable H1 trading range confirms accumulation or distribution.
SMC: the bullish structure has not fully failed, but the $1.1515 swing low is under pressure. A bullish imbalance remains open at $1.0913–$1.1267, while a bearish imbalance at $1.1822–$1.1878 sits overhead.
⚪ NO CLEAR EDGE — SKIP TRADE
Why no Long? Buyers have not reclaimed overhead resistance with conviction or produced a valid retest.
Why no Short? The last confirmed BOS is still bullish, and sellers have not closed H1 below $1.1515 to confirm a bearish shift.
A bullish setup needs an H1 reclaim above $1.1878 followed by a retest that holds. An H1 close below $1.1515 would weaken the recovery and expose $1.1267–$1.1184, but a breakdown candle is not a chase entry.
No trigger, entry, SL or targets are assigned while the evidence remains split.
Don’t Long into resistance. Don’t Short before structure breaks. Let the next confirmed close and retest do the talking.
Which level resolves first: $1.1878 or $1.1515? 👀
$FIL #Wyckoff #SMC
Paper analysis only. Not financial advice.
1
1
186
·
--
ලිපිය
سلسلة مفاهيم المال الذكي (SMC) الدرس #2 هيكلية السوق، كسر الهيكل (BOS) والتغير في السلوك (CHoCH)مرحباً بكم مجدداً زملائي المتداولين في ثاني دروس سلسلتنا المخصصة لـ مفاهيم المال الذكي (SMC).
في الدرس الأول، فهمنا كيف يفكر صناع السوق وكيف يحسكون السيولة. اليوم ننتقل إلى الخريطة الأساسية للشارت: كيف تقرأ هيكلية السوق (Market Structure) بأسلوب المؤسسات، وتحدد نقطة الانعكاس قبل الجميع؟
---
🎯 القاعدة #1: "المال الذكي لا يشتري لمجرد أن السعر هبط، بل يشتري عندما يُغير السعر سلوكه وهيكليته الرسمية على الشارت"
---
💡 1️⃣ المكونات الأساسية لهيكلية السوق
قبل أن تبحث عن صفقات، يجب أن تحدد الإتجاه الحاكم من خلال القمم والقيعان:
* الاتجاه الصاعد (Uptrend): يتكون من قمم أعلى (**Higher Highs - HH**) وقيعان أعلى (**Higher Lows - HL**).
* الاتجاه الهابط (Downtrend): يتكون من قيعان أقل (**Lower Lows - LL**) وقمم أقل (**Lower Highs - LH**).
---
🧬 2️⃣ كسر الهيكل (Break of Structure - BOS)
ما هو الـ BOS؟
هو استمرار وتأكيد للاتجاه الحالي. يحدث عندما يتجاوز السعر القمة أو القاع السابقة ويُغلق فوقها/تحتها بوضوح.
• BOS الصاعد (Bullish BOS): يكسر السعر القمة السابقة (HH) ويُغلق بشمعة كاملة أعلاها. هذا يعني أن المشترين ما زالوا في موقع السيطرة، والمال الذكي يواصل التجميع.
• BOS الهابط (Bearish BOS): يكسر السعر القاع السابق (LL) ويُغلق بشمعة كاملة أسفله. هذا يعني استمرار الضغط البيعي من المؤسسات.
> ⚠️ شرط مهم جداً: في تداول SMC، لا نعتبر الـ BOS صحيحاً إلا إذا كان الكسر بجسم الشمعة (Body Close) وليس مجرد ذيل شمعة (Wick). الذيل غالباً ما يكون مجرد سحب للسيولة (Liquidity Sweep).
---
🔍 3️⃣ التغير في السلوك السعري (Change of Character - CHoCH)
ما هو الـ CHoCH؟
هو أول إشارة على أن الاتجاه الحالي قارب على الانتهاء وأن تحولاً حاسماً في ميزان القوى يحدث الآن بين المشترين والبائعين.
• CHoCH صاعد (Bullish CHoCH): يحدث في نهاية الاتجاه الهابط، عندما ينجح السعر في اختراق آخر قمة هابطة (LH) أدت إلى تكوين القاع الأخير.
• CHoCH سلبي (Bearish CHoCH): يحدث في نهاية الاتجاه الصاعد، عندما يكسر السعر آخر قاع صاعد (HL) أدى إلى تكوين القمة الأخيرة.
---
⚖️️ كيف تستفيد من هذه المعادلة في التداول؟
1. الـ CHoCH يعطيك الإنذار المبكر: يُخبرك أن اتجاه السوق قد تغير، وهو الوقت المناسب للتوقف عن الصفقات القادمة مع الاتجاه القديم.
2. الـ BOS يمنحك التأكيد والأمان: يثبت أن الاتجاه الجديد أصبح مستقراً وقوياً، وأن الحركة الانعكاسية ليست مجرد تصحيح مؤقت.
---
⚖️ خلاصة الدرس الثاني:
"هيكلية السوق هي البوصلة؛ الـ CHoCH يخبرك متى يتغير اتجاه البوصلة، والـ BOS يخبرك كم تبلغ قوة هذا الاتجاه الجديد."
---
💬 شاركونا في التعليقات:
هل تبحث عن الكسر بجسم الشمعة فقط للتأكد من BOS، أم تعتمد أحياناً على ذيول الشموع؟
#smc #cryptotrading #bos #choch #القعقاع_1
$NVDAB $AAPLB $MSFTB
{spot}(BTCUSDT)
{spot}(ETHUSDT)
{spot}(SOLUSDT)
سلسلة مفاهيم المال الذكي (SMC) الدرس #2 هيكلية السوق، كسر الهيكل (BOS) والتغير في السلوك (CHoCH)
مرحباً بكم مجدداً زملائي المتداولين في ثاني دروس سلسلتنا المخصصة لـ مفاهيم المال الذكي (SMC).
في الدرس الأول، فهمنا كيف يفكر صناع السوق وكيف يحسكون السيولة. اليوم ننتقل إلى الخريطة الأساسية للشارت: كيف تقرأ هيكلية السوق (Market Structure) بأسلوب المؤسسات، وتحدد نقطة الانعكاس قبل الجميع؟
---
🎯 القاعدة #1: "المال الذكي لا يشتري لمجرد أن السعر هبط، بل يشتري عندما يُغير السعر سلوكه وهيكليته الرسمية على الشارت"
---
💡 1️⃣ المكونات الأساسية لهيكلية السوق
قبل أن تبحث عن صفقات، يجب أن تحدد الإتجاه الحاكم من خلال القمم والقيعان:
* الاتجاه الصاعد (Uptrend): يتكون من قمم أعلى (**Higher Highs - HH**) وقيعان أعلى (**Higher Lows - HL**).
* الاتجاه الهابط (Downtrend): يتكون من قيعان أقل (**Lower Lows - LL**) وقمم أقل (**Lower Highs - LH**).
---
🧬 2️⃣ كسر الهيكل (Break of Structure - BOS)
ما هو الـ BOS؟
هو استمرار وتأكيد للاتجاه الحالي. يحدث عندما يتجاوز السعر القمة أو القاع السابقة ويُغلق فوقها/تحتها بوضوح.
• BOS الصاعد (Bullish BOS): يكسر السعر القمة السابقة (HH) ويُغلق بشمعة كاملة أعلاها. هذا يعني أن المشترين ما زالوا في موقع السيطرة، والمال الذكي يواصل التجميع.
• BOS الهابط (Bearish BOS): يكسر السعر القاع السابق (LL) ويُغلق بشمعة كاملة أسفله. هذا يعني استمرار الضغط البيعي من المؤسسات.
> ⚠️ شرط مهم جداً: في تداول SMC، لا نعتبر الـ BOS صحيحاً إلا إذا كان الكسر بجسم الشمعة (Body Close) وليس مجرد ذيل شمعة (Wick). الذيل غالباً ما يكون مجرد سحب للسيولة (Liquidity Sweep).
---
🔍 3️⃣ التغير في السلوك السعري (Change of Character - CHoCH)
ما هو الـ CHoCH؟
هو أول إشارة على أن الاتجاه الحالي قارب على الانتهاء وأن تحولاً حاسماً في ميزان القوى يحدث الآن بين المشترين والبائعين.
• CHoCH صاعد (Bullish CHoCH): يحدث في نهاية الاتجاه الهابط، عندما ينجح السعر في اختراق آخر قمة هابطة (LH) أدت إلى تكوين القاع الأخير.
• CHoCH سلبي (Bearish CHoCH): يحدث في نهاية الاتجاه الصاعد، عندما يكسر السعر آخر قاع صاعد (HL) أدى إلى تكوين القمة الأخيرة.
---
⚖️️ كيف تستفيد من هذه المعادلة في التداول؟
1. الـ CHoCH يعطيك الإنذار المبكر: يُخبرك أن اتجاه السوق قد تغير، وهو الوقت المناسب للتوقف عن الصفقات القادمة مع الاتجاه القديم.
2. الـ BOS يمنحك التأكيد والأمان: يثبت أن الاتجاه الجديد أصبح مستقراً وقوياً، وأن الحركة الانعكاسية ليست مجرد تصحيح مؤقت.
---
⚖️ خلاصة الدرس الثاني:
"هيكلية السوق هي البوصلة؛ الـ CHoCH يخبرك متى يتغير اتجاه البوصلة، والـ BOS يخبرك كم تبلغ قوة هذا الاتجاه الجديد."
---
💬 شاركونا في التعليقات:
هل تبحث عن الكسر بجسم الشمعة فقط للتأكد من BOS، أم تعتمد أحياناً على ذيول الشموع؟
#smc #cryptotrading #bos #choch #القعقاع_1
$NVDAB $AAPLB $MSFTB
في الدرس الأول، فهمنا كيف يفكر صناع السوق وكيف يحسكون السيولة. اليوم ننتقل إلى الخريطة الأساسية للشارت: كيف تقرأ هيكلية السوق (Market Structure) بأسلوب المؤسسات، وتحدد نقطة الانعكاس قبل الجميع؟
---
🎯 القاعدة #1: "المال الذكي لا يشتري لمجرد أن السعر هبط، بل يشتري عندما يُغير السعر سلوكه وهيكليته الرسمية على الشارت"
---
💡 1️⃣ المكونات الأساسية لهيكلية السوق
قبل أن تبحث عن صفقات، يجب أن تحدد الإتجاه الحاكم من خلال القمم والقيعان:
* الاتجاه الصاعد (Uptrend): يتكون من قمم أعلى (**Higher Highs - HH**) وقيعان أعلى (**Higher Lows - HL**).
* الاتجاه الهابط (Downtrend): يتكون من قيعان أقل (**Lower Lows - LL**) وقمم أقل (**Lower Highs - LH**).
---
🧬 2️⃣ كسر الهيكل (Break of Structure - BOS)
ما هو الـ BOS؟
هو استمرار وتأكيد للاتجاه الحالي. يحدث عندما يتجاوز السعر القمة أو القاع السابقة ويُغلق فوقها/تحتها بوضوح.
• BOS الصاعد (Bullish BOS): يكسر السعر القمة السابقة (HH) ويُغلق بشمعة كاملة أعلاها. هذا يعني أن المشترين ما زالوا في موقع السيطرة، والمال الذكي يواصل التجميع.
• BOS الهابط (Bearish BOS): يكسر السعر القاع السابق (LL) ويُغلق بشمعة كاملة أسفله. هذا يعني استمرار الضغط البيعي من المؤسسات.
> ⚠️ شرط مهم جداً: في تداول SMC، لا نعتبر الـ BOS صحيحاً إلا إذا كان الكسر بجسم الشمعة (Body Close) وليس مجرد ذيل شمعة (Wick). الذيل غالباً ما يكون مجرد سحب للسيولة (Liquidity Sweep).
---
🔍 3️⃣ التغير في السلوك السعري (Change of Character - CHoCH)
ما هو الـ CHoCH؟
هو أول إشارة على أن الاتجاه الحالي قارب على الانتهاء وأن تحولاً حاسماً في ميزان القوى يحدث الآن بين المشترين والبائعين.
• CHoCH صاعد (Bullish CHoCH): يحدث في نهاية الاتجاه الهابط، عندما ينجح السعر في اختراق آخر قمة هابطة (LH) أدت إلى تكوين القاع الأخير.
• CHoCH سلبي (Bearish CHoCH): يحدث في نهاية الاتجاه الصاعد، عندما يكسر السعر آخر قاع صاعد (HL) أدى إلى تكوين القمة الأخيرة.
---
⚖️️ كيف تستفيد من هذه المعادلة في التداول؟
1. الـ CHoCH يعطيك الإنذار المبكر: يُخبرك أن اتجاه السوق قد تغير، وهو الوقت المناسب للتوقف عن الصفقات القادمة مع الاتجاه القديم.
2. الـ BOS يمنحك التأكيد والأمان: يثبت أن الاتجاه الجديد أصبح مستقراً وقوياً، وأن الحركة الانعكاسية ليست مجرد تصحيح مؤقت.
---
⚖️ خلاصة الدرس الثاني:
"هيكلية السوق هي البوصلة؛ الـ CHoCH يخبرك متى يتغير اتجاه البوصلة، والـ BOS يخبرك كم تبلغ قوة هذا الاتجاه الجديد."
---
💬 شاركونا في التعليقات:
هل تبحث عن الكسر بجسم الشمعة فقط للتأكد من BOS، أم تعتمد أحياناً على ذيول الشموع؟
#smc #cryptotrading #bos #choch #القعقاع_1
$NVDAB $AAPLB $MSFTB
2
88
·
--
🚨 $ORCA IS RUNNING HOT. DON’T LET FOMO CHOOSE YOUR LONG ENTRY.
ORCAUSDT Futures last closed at $3.064 (6 Oct, 21:59 UTC / 7 Oct, 04:59 Vietnam).
Three facts matter:
1️⃣ An H1 close at $3.118 confirmed bullish BOS above $2.746, reaching $3.198.
2️⃣ That breakout carried 4.67× the previous 20-hour average volume, but the following sell candle printed 3.14×.
3️⃣ The pullback reached $2.770 and recovered. The latest candle tested $3.179 but closed at $3.064, beneath the peak, on 1.37× volume.
Wyckoff: potential developing markup; no stable H1 range supports a confirmed accumulation or distribution sequence.
SMC: bullish structure remains intact. The $2.723–$2.810 bullish imbalance was partially filled. Its presence is not an automatic buy signal.
⚪ NO CLEAR EDGE — SKIP TRADE
The trend leans up, but a directional view is not permission to enter at any price. Using $2.550 below the $2.566 swing low as a stop reference and $3.198 as the target, chasing at $3.064 offers only about 0.26:1 reward-to-risk before fees.
That is a risk illustration, not a trade map. No justified second target or fresh breakout-and-retest entry has been established here.
An H1 close below $2.566 would invalidate the current bullish continuation structure. Sellers have not confirmed that reversal yet.
Don’t Long into the recent high. Don’t Short just because the rally looks stretched. Wait for a valid retest and enough reward—or let this move go.
Can buyers turn the $3.198 ceiling into confirmed support? 👀
$ORCA #Wyckoff #SMC
Paper analysis only. Not financial advice.
🚨 $ORCA IS RUNNING HOT. DON’T LET FOMO CHOOSE YOUR LONG ENTRY.
ORCAUSDT Futures last closed at $3.064 (6 Oct, 21:59 UTC / 7 Oct, 04:59 Vietnam).
Three facts matter:
1️⃣ An H1 close at $3.118 confirmed bullish BOS above $2.746, reaching $3.198.
2️⃣ That breakout carried 4.67× the previous 20-hour average volume, but the following sell candle printed 3.14×.
3️⃣ The pullback reached $2.770 and recovered. The latest candle tested $3.179 but closed at $3.064, beneath the peak, on 1.37× volume.
Wyckoff: potential developing markup; no stable H1 range supports a confirmed accumulation or distribution sequence.
SMC: bullish structure remains intact. The $2.723–$2.810 bullish imbalance was partially filled. Its presence is not an automatic buy signal.
⚪ NO CLEAR EDGE — SKIP TRADE
The trend leans up, but a directional view is not permission to enter at any price. Using $2.550 below the $2.566 swing low as a stop reference and $3.198 as the target, chasing at $3.064 offers only about 0.26:1 reward-to-risk before fees.
That is a risk illustration, not a trade map. No justified second target or fresh breakout-and-retest entry has been established here.
An H1 close below $2.566 would invalidate the current bullish continuation structure. Sellers have not confirmed that reversal yet.
Don’t Long into the recent high. Don’t Short just because the rally looks stretched. Wait for a valid retest and enough reward—or let this move go.
Can buyers turn the $3.198 ceiling into confirmed support? 👀
$ORCA #Wyckoff #SMC
Paper analysis only. Not financial advice.
ORCAUSDT Futures last closed at $3.064 (6 Oct, 21:59 UTC / 7 Oct, 04:59 Vietnam).
Three facts matter:
1️⃣ An H1 close at $3.118 confirmed bullish BOS above $2.746, reaching $3.198.
2️⃣ That breakout carried 4.67× the previous 20-hour average volume, but the following sell candle printed 3.14×.
3️⃣ The pullback reached $2.770 and recovered. The latest candle tested $3.179 but closed at $3.064, beneath the peak, on 1.37× volume.
Wyckoff: potential developing markup; no stable H1 range supports a confirmed accumulation or distribution sequence.
SMC: bullish structure remains intact. The $2.723–$2.810 bullish imbalance was partially filled. Its presence is not an automatic buy signal.
⚪ NO CLEAR EDGE — SKIP TRADE
The trend leans up, but a directional view is not permission to enter at any price. Using $2.550 below the $2.566 swing low as a stop reference and $3.198 as the target, chasing at $3.064 offers only about 0.26:1 reward-to-risk before fees.
That is a risk illustration, not a trade map. No justified second target or fresh breakout-and-retest entry has been established here.
An H1 close below $2.566 would invalidate the current bullish continuation structure. Sellers have not confirmed that reversal yet.
Don’t Long into the recent high. Don’t Short just because the rally looks stretched. Wait for a valid retest and enough reward—or let this move go.
Can buyers turn the $3.198 ceiling into confirmed support? 👀
$ORCA #Wyckoff #SMC
Paper analysis only. Not financial advice.
1
1
180
·
--
උසබ තත්ත්වය
🚨 $QNT’S BOUNCE GOT REJECTED. I’M WAITING FOR CLARITY, NOT CHASING.
QNTUSDT Futures last closed at $257.25 (6 Oct, 18:59 UTC / 7 Oct, 01:59 Vietnam).
Three things matter:
1️⃣ The earlier bullish BOS above $263.37 remains the latest confirmed structure break.
2️⃣ The bounce reached $266.80 but failed beneath the $269.38 high, then slipped back below the breakout level.
3️⃣ That rejection candle carried 2.00× the previous 20-hour average volume. The latest candle recorded only 0.65×.
Wyckoff: upper-range rejection suggests potential distribution, but the evidence does not justify a confirmed UTAD or markdown label.
SMC: bullish structure has not fully flipped bearish. The latest swing low at $252.03 remains intact, while bearish displacement left an unfilled imbalance at $258.83–$260.90.
⚪ NO CLEAR EDGE — SKIP TRADE
Buying now means facing overhead rejection. Shorting now means betting against an unbroken swing low. Neither offers a sufficiently confirmed setup.
No entry, SL or targets are assigned while the edge remains unclear.
An H1 close below $252.03 would weaken the bullish structure; a sustained reclaim of $269.38 would challenge the distribution candidate.
Don’t let one green candle—or one red candle—choose your trade. Wait for a confirmed break, a valid retest and enough reward for the risk.
Will QNT resolve this compression with convincing volume, or keep testing traders’ patience? 👀
$QNT #Wyckoff #SMC
Paper analysis only. Not financial advice.
{future}(QNTUSDT)
🚨 $QNT ’S BOUNCE GOT REJECTED. I’M WAITING FOR CLARITY, NOT CHASING.
QNTUSDT Futures last closed at $257.25 (6 Oct, 18:59 UTC / 7 Oct, 01:59 Vietnam).
Three things matter:
1️⃣ The earlier bullish BOS above $263.37 remains the latest confirmed structure break.
2️⃣ The bounce reached $266.80 but failed beneath the $269.38 high, then slipped back below the breakout level.
3️⃣ That rejection candle carried 2.00× the previous 20-hour average volume. The latest candle recorded only 0.65×.
Wyckoff: upper-range rejection suggests potential distribution, but the evidence does not justify a confirmed UTAD or markdown label.
SMC: bullish structure has not fully flipped bearish. The latest swing low at $252.03 remains intact, while bearish displacement left an unfilled imbalance at $258.83–$260.90.
⚪ NO CLEAR EDGE — SKIP TRADE
Buying now means facing overhead rejection. Shorting now means betting against an unbroken swing low. Neither offers a sufficiently confirmed setup.
No entry, SL or targets are assigned while the edge remains unclear.
An H1 close below $252.03 would weaken the bullish structure; a sustained reclaim of $269.38 would challenge the distribution candidate.
Don’t let one green candle—or one red candle—choose your trade. Wait for a confirmed break, a valid retest and enough reward for the risk.
Will QNT resolve this compression with convincing volume, or keep testing traders’ patience? 👀
$QNT #Wyckoff #SMC
Paper analysis only. Not financial advice.
QNTUSDT Futures last closed at $257.25 (6 Oct, 18:59 UTC / 7 Oct, 01:59 Vietnam).
Three things matter:
1️⃣ The earlier bullish BOS above $263.37 remains the latest confirmed structure break.
2️⃣ The bounce reached $266.80 but failed beneath the $269.38 high, then slipped back below the breakout level.
3️⃣ That rejection candle carried 2.00× the previous 20-hour average volume. The latest candle recorded only 0.65×.
Wyckoff: upper-range rejection suggests potential distribution, but the evidence does not justify a confirmed UTAD or markdown label.
SMC: bullish structure has not fully flipped bearish. The latest swing low at $252.03 remains intact, while bearish displacement left an unfilled imbalance at $258.83–$260.90.
⚪ NO CLEAR EDGE — SKIP TRADE
Buying now means facing overhead rejection. Shorting now means betting against an unbroken swing low. Neither offers a sufficiently confirmed setup.
No entry, SL or targets are assigned while the edge remains unclear.
An H1 close below $252.03 would weaken the bullish structure; a sustained reclaim of $269.38 would challenge the distribution candidate.
Don’t let one green candle—or one red candle—choose your trade. Wait for a confirmed break, a valid retest and enough reward for the risk.
Will QNT resolve this compression with convincing volume, or keep testing traders’ patience? 👀
$QNT #Wyckoff #SMC
Paper analysis only. Not financial advice.
1
204

·
--
🚨 $QNT REJECTS HIGHER LIQUIDITY AS SMART MONEY WAITS FOR STRUCTURAL CLARITY 🦈
$QNT just delivered an aggressive rejection near $266.80 on double average volume, pushing price back below the $263.37 breakout level. While upper range liquidity was tapped, the key swing low at $252.03 remains fully intact. 🔍
An overhead imbalance at $258.83–$260.90 sits unfilled as volume compresses. 📊 Chasing long into overhead resistance or shorting directly into support offers no defined statistical edge—patience remains the institutional play. 💡
Will $QNT breakdown below the $252.03 demand pivot, or will buyers step in to reclaim $269.38? 👇
⚠️ Not financial advice. Always manage your risk. 🛡️
🏷️ #QNT #SMC #MarketStructure #Crypto
🦈 👁️
🚨 $QNT REJECTS HIGHER LIQUIDITY AS SMART MONEY WAITS FOR STRUCTURAL CLARITY 🦈
$QNT just delivered an aggressive rejection near $266.80 on double average volume, pushing price back below the $263.37 breakout level. While upper range liquidity was tapped, the key swing low at $252.03 remains fully intact. 🔍
An overhead imbalance at $258.83–$260.90 sits unfilled as volume compresses. 📊 Chasing long into overhead resistance or shorting directly into support offers no defined statistical edge—patience remains the institutional play. 💡
Will $QNT breakdown below the $252.03 demand pivot, or will buyers step in to reclaim $269.38? 👇
⚠️ Not financial advice. Always manage your risk. 🛡️
🏷️ #QNT #SMC #MarketStructure #Crypto
🦈 👁️
$QNT just delivered an aggressive rejection near $266.80 on double average volume, pushing price back below the $263.37 breakout level. While upper range liquidity was tapped, the key swing low at $252.03 remains fully intact. 🔍
An overhead imbalance at $258.83–$260.90 sits unfilled as volume compresses. 📊 Chasing long into overhead resistance or shorting directly into support offers no defined statistical edge—patience remains the institutional play. 💡
Will $QNT breakdown below the $252.03 demand pivot, or will buyers step in to reclaim $269.38? 👇
⚠️ Not financial advice. Always manage your risk. 🛡️
🏷️ #QNT #SMC #MarketStructure #Crypto
🦈 👁️
45
තවත් අන්තර්ගතයන් ගවේෂණය කිරීමට ඇතුල් වන්න
Binance චතුරශ්රය හි ගෝලීය ක්රිප්ටෝ පරිශීලකයින් හා එක්වන්න
⚡️ ක්රිප්ටෝ පිළිබඳ නවතම සහ ප්රයෝජනවත් තොරතුරු ලබා ගන්න.
💬 ලොව විශාලතම ක්රිප්ටෝ හුවමාරුව මගින් විශ්වාස කෙරේ.
👍 සත්යායනය කරන ලද නිර්මාණකරුවන්ගෙන් සැබෑ විදසුන් සොයා ගන්න.
විද්යුත් තැපෑල / දුරකථන අංකය
නැගී එන මාතෘකා
1
#EtherETFsExtendOutflowsToNineDays
436 views
35 සාකච්ඡා කරමින්
2
#EthereumSurpasses2500USDT
196,172 views
1,273 සාකච්ඡා කරමින්
3
#XRPLedgerPatchesXRPCreationBug
243,309 views
2,042 සාකච්ඡා කරමින්
4
#STRKRisesAbout20%In24Hours
233,118 views
1,969 සාකච්ඡා කරමින්
5
#TetherFreezesUSDTLinkedToLedgerTheft
85,175 views
1,273 සාකච්ඡා කරමින්
6
#CFTCMovesToFoldEventContractsIntoSwapsRules
37,189 views
827 සාකච්ඡා කරමින්
7
#LedgerPausesCryptoBilisSales
66,934 views
720 සාකච්ඡා කරමින්
8
#EvernorthCompletesSPACMergerWithArmadaII
43,612 views
461 සාකච්ඡා කරමින්
9
#NEARAccountsSupportPostQuantumMLDSA
40,913 views
396 සාකච්ඡා කරමින්
10
#B3PlansSecuritiesTokenizationPlatformForFirstHalfOf2027
3,319 views
56 සාකච්ඡා කරමින්