

#cryptodata
cryptodata
124,958 නැරඹීම්
3,647 සාකච්ඡා කරමින්
උණුසුම්
නවතම

·
--
{spot}(BTCUSDT)
$BTC
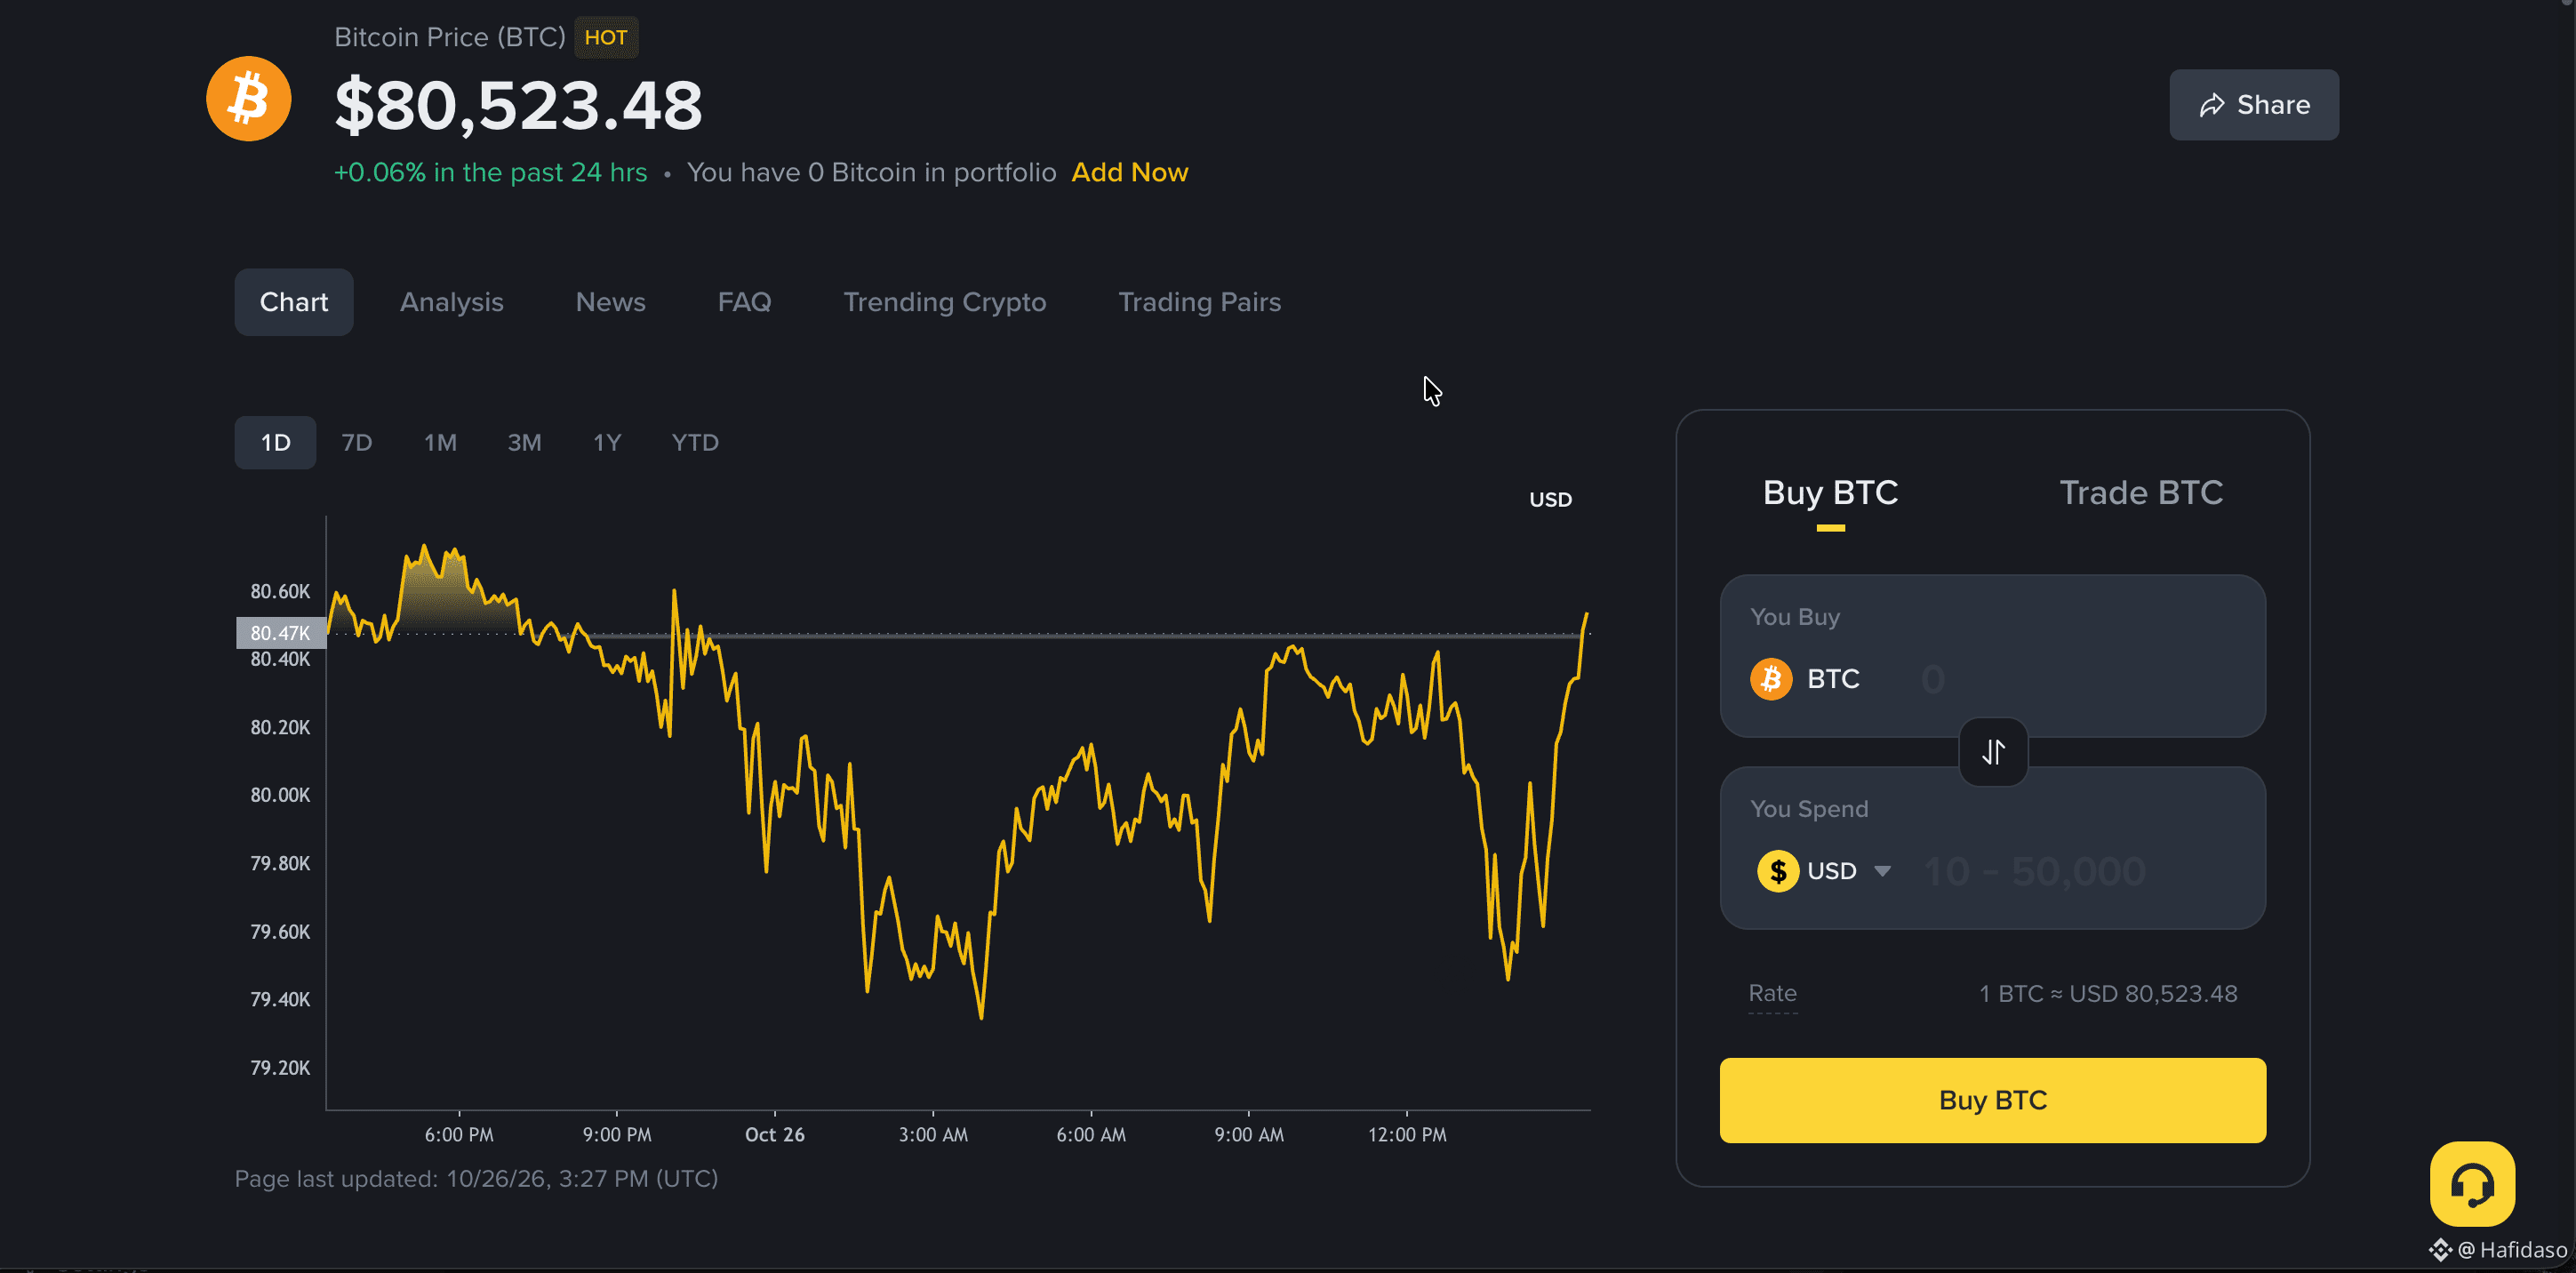
📊 Most People Watch Bitcoin's Price. I Watch the Data Behind It.
Everyone asks the same question:
"Will $BTC go up or down?"
But price alone doesn't tell the whole story.
Here are 3 things worth examining:
📈 1. Price: Shows where the market is trading, not where it must go next.
📊 2. Trading Volume: Helps us understand how much trading activity accompanies a price move.
⚡ 3. Volatility: Measures how dramatically prices fluctuate, in either direction.
Here's the important part:
More data doesn't automatically mean better predictions.
The real skill is understanding what each indicator reveals, and what it doesn't.
💬 Your turn: If you could follow only ONE indicator for Bitcoin, which would you choose: Price, Volume, or Volatility? Why?
#Bitcoin #BTC #CryptoData #BinanceSquare
Educational content only. Not financial advice.
1
90

·
--
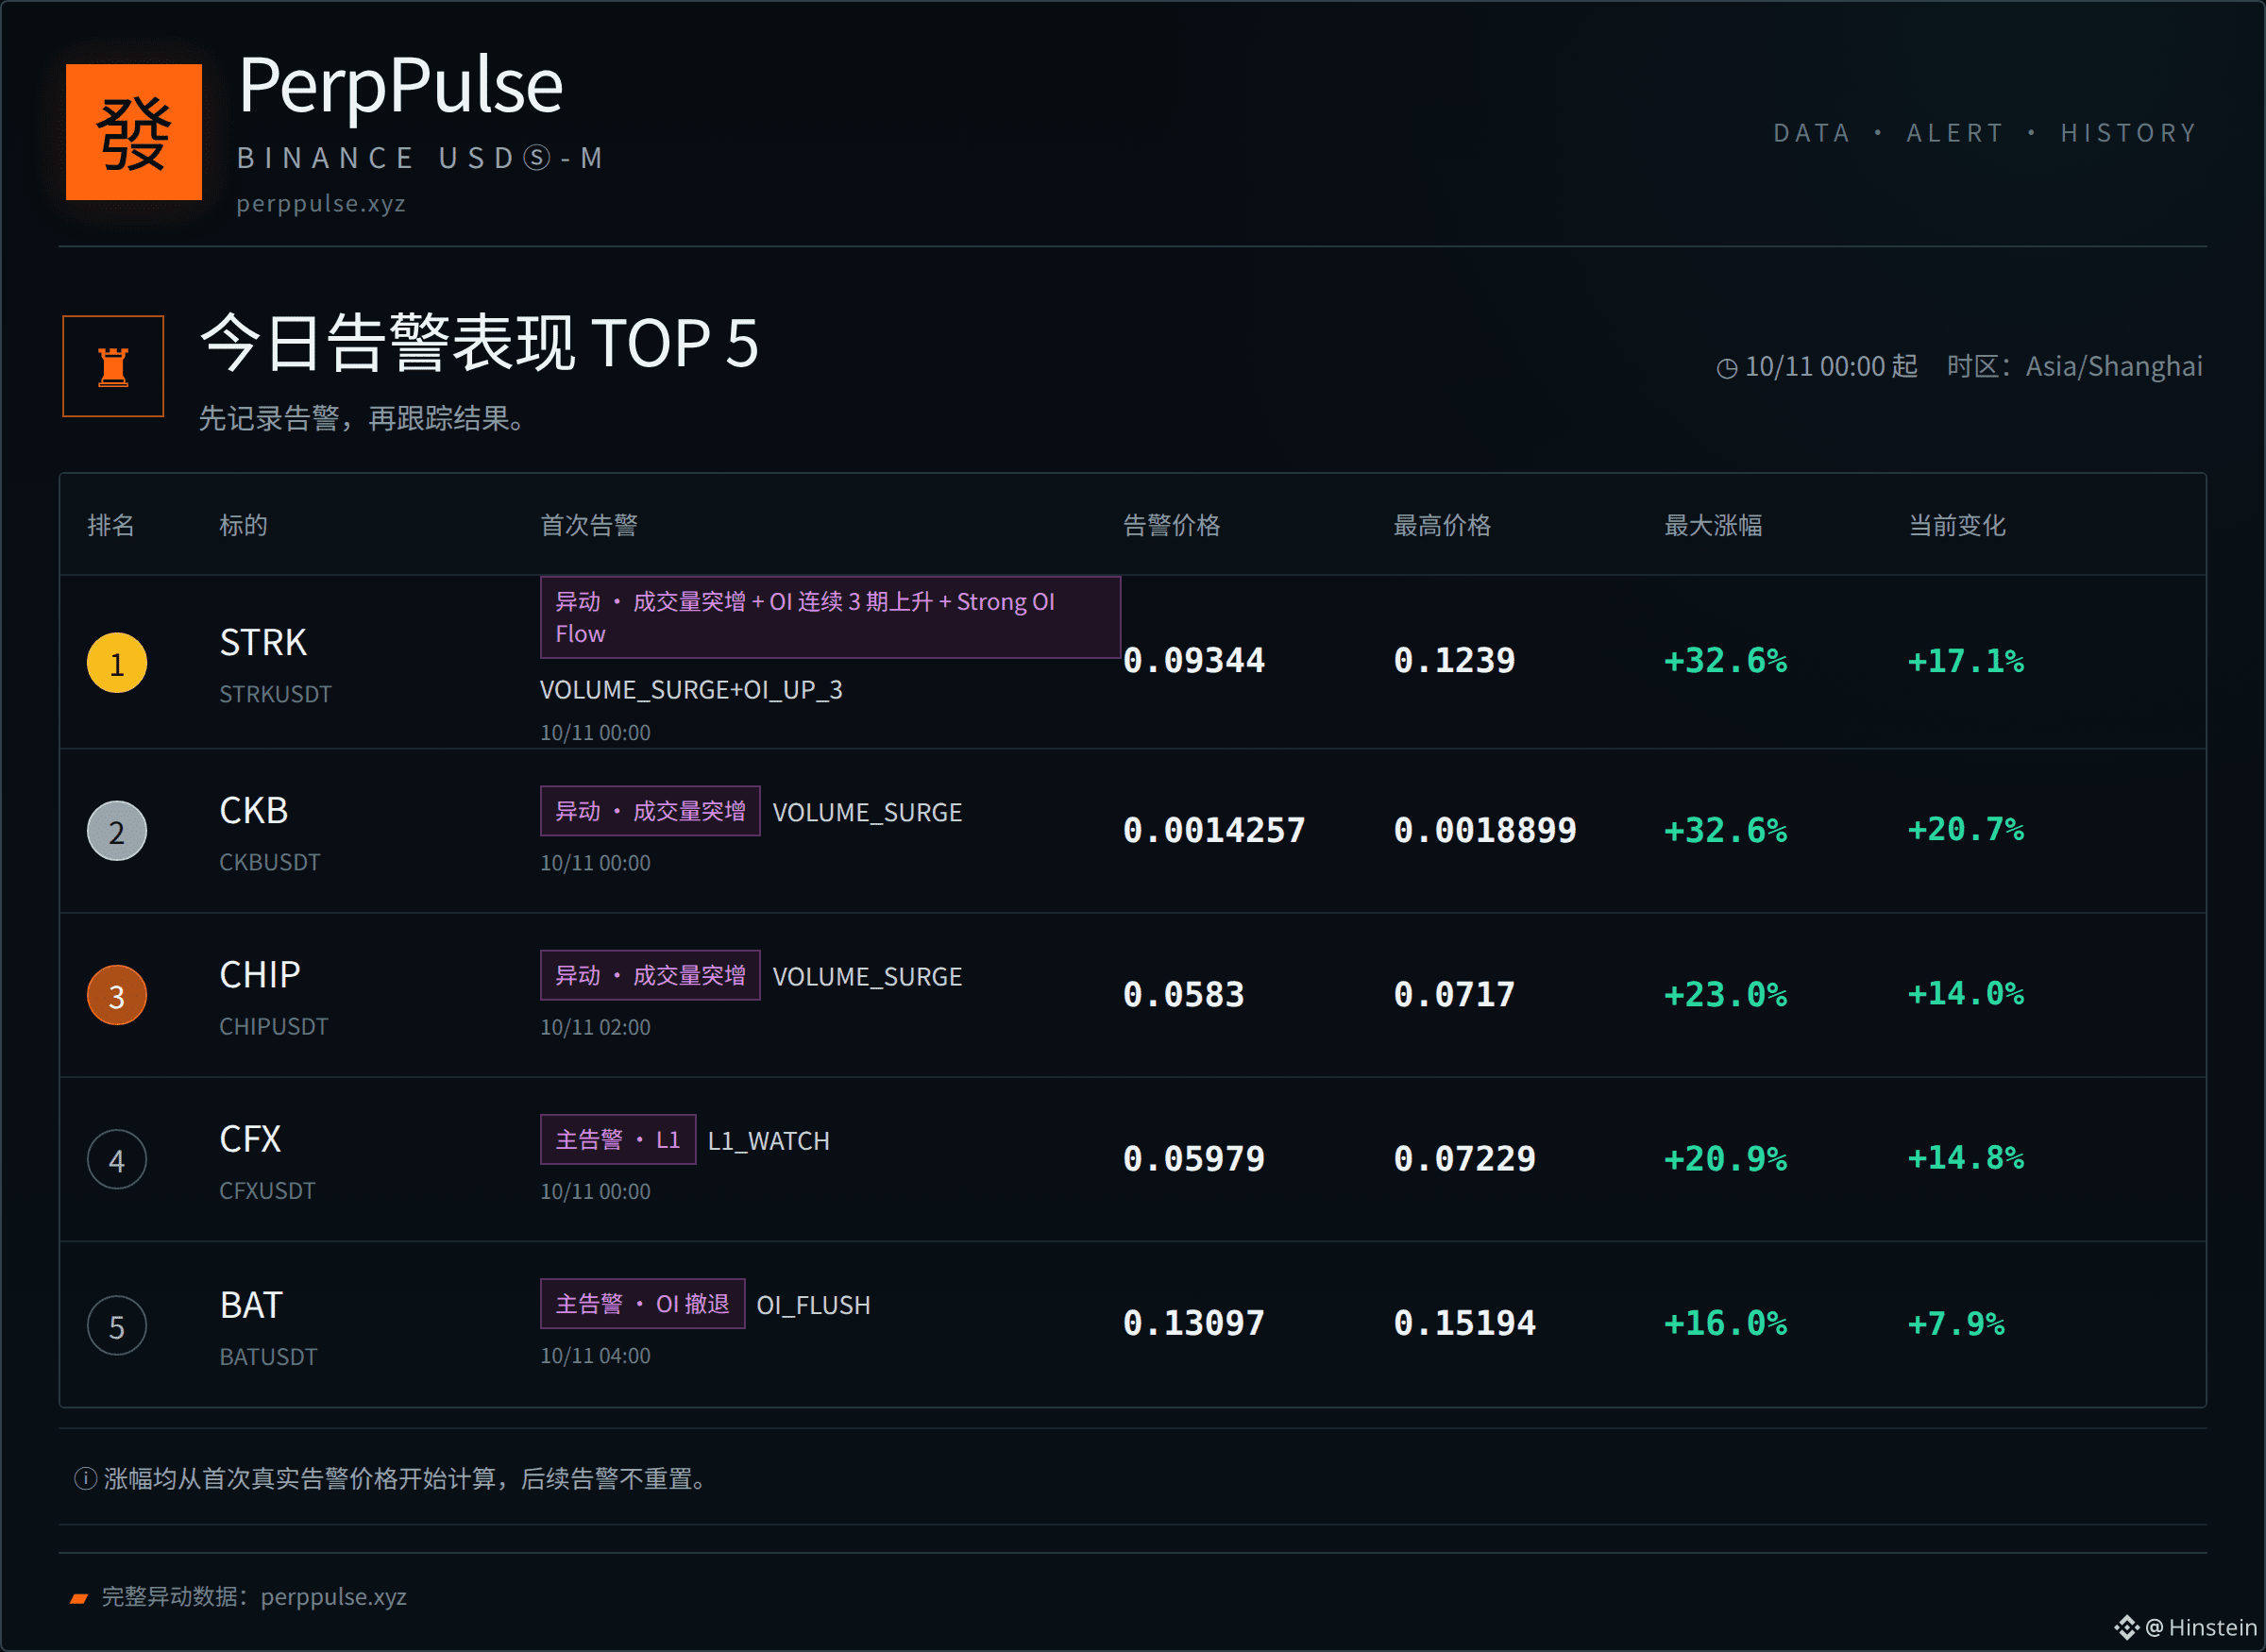
📊 今日异动表现榜
1. $STRK +32.6%
2. $CKB +32.6%
3. $CHIP +23.0%
4. CFX +20.9%
5. BAT +16.0%
统计口径:当天首次有效告警 → 此后最高价格。
只记录市场留下的结果,不把历史最高变化当成交易收益。
#MarketMovers #CryptoData
完整异动数据:perppulse.xyz
📊 今日异动表现榜
1. $STRK +32.6%
2. $CKB +32.6%
3. $CHIP +23.0%
4. CFX +20.9%
5. BAT +16.0%
统计口径:当天首次有效告警 → 此后最高价格。
只记录市场留下的结果,不把历史最高变化当成交易收益。
#MarketMovers #CryptoData
完整异动数据:perppulse.xyz
1. $STRK +32.6%
2. $CKB +32.6%
3. $CHIP +23.0%
4. CFX +20.9%
5. BAT +16.0%
统计口径:当天首次有效告警 → 此后最高价格。
只记录市场留下的结果,不把历史最高变化当成交易收益。
#MarketMovers #CryptoData
完整异动数据:perppulse.xyz
38
·
--
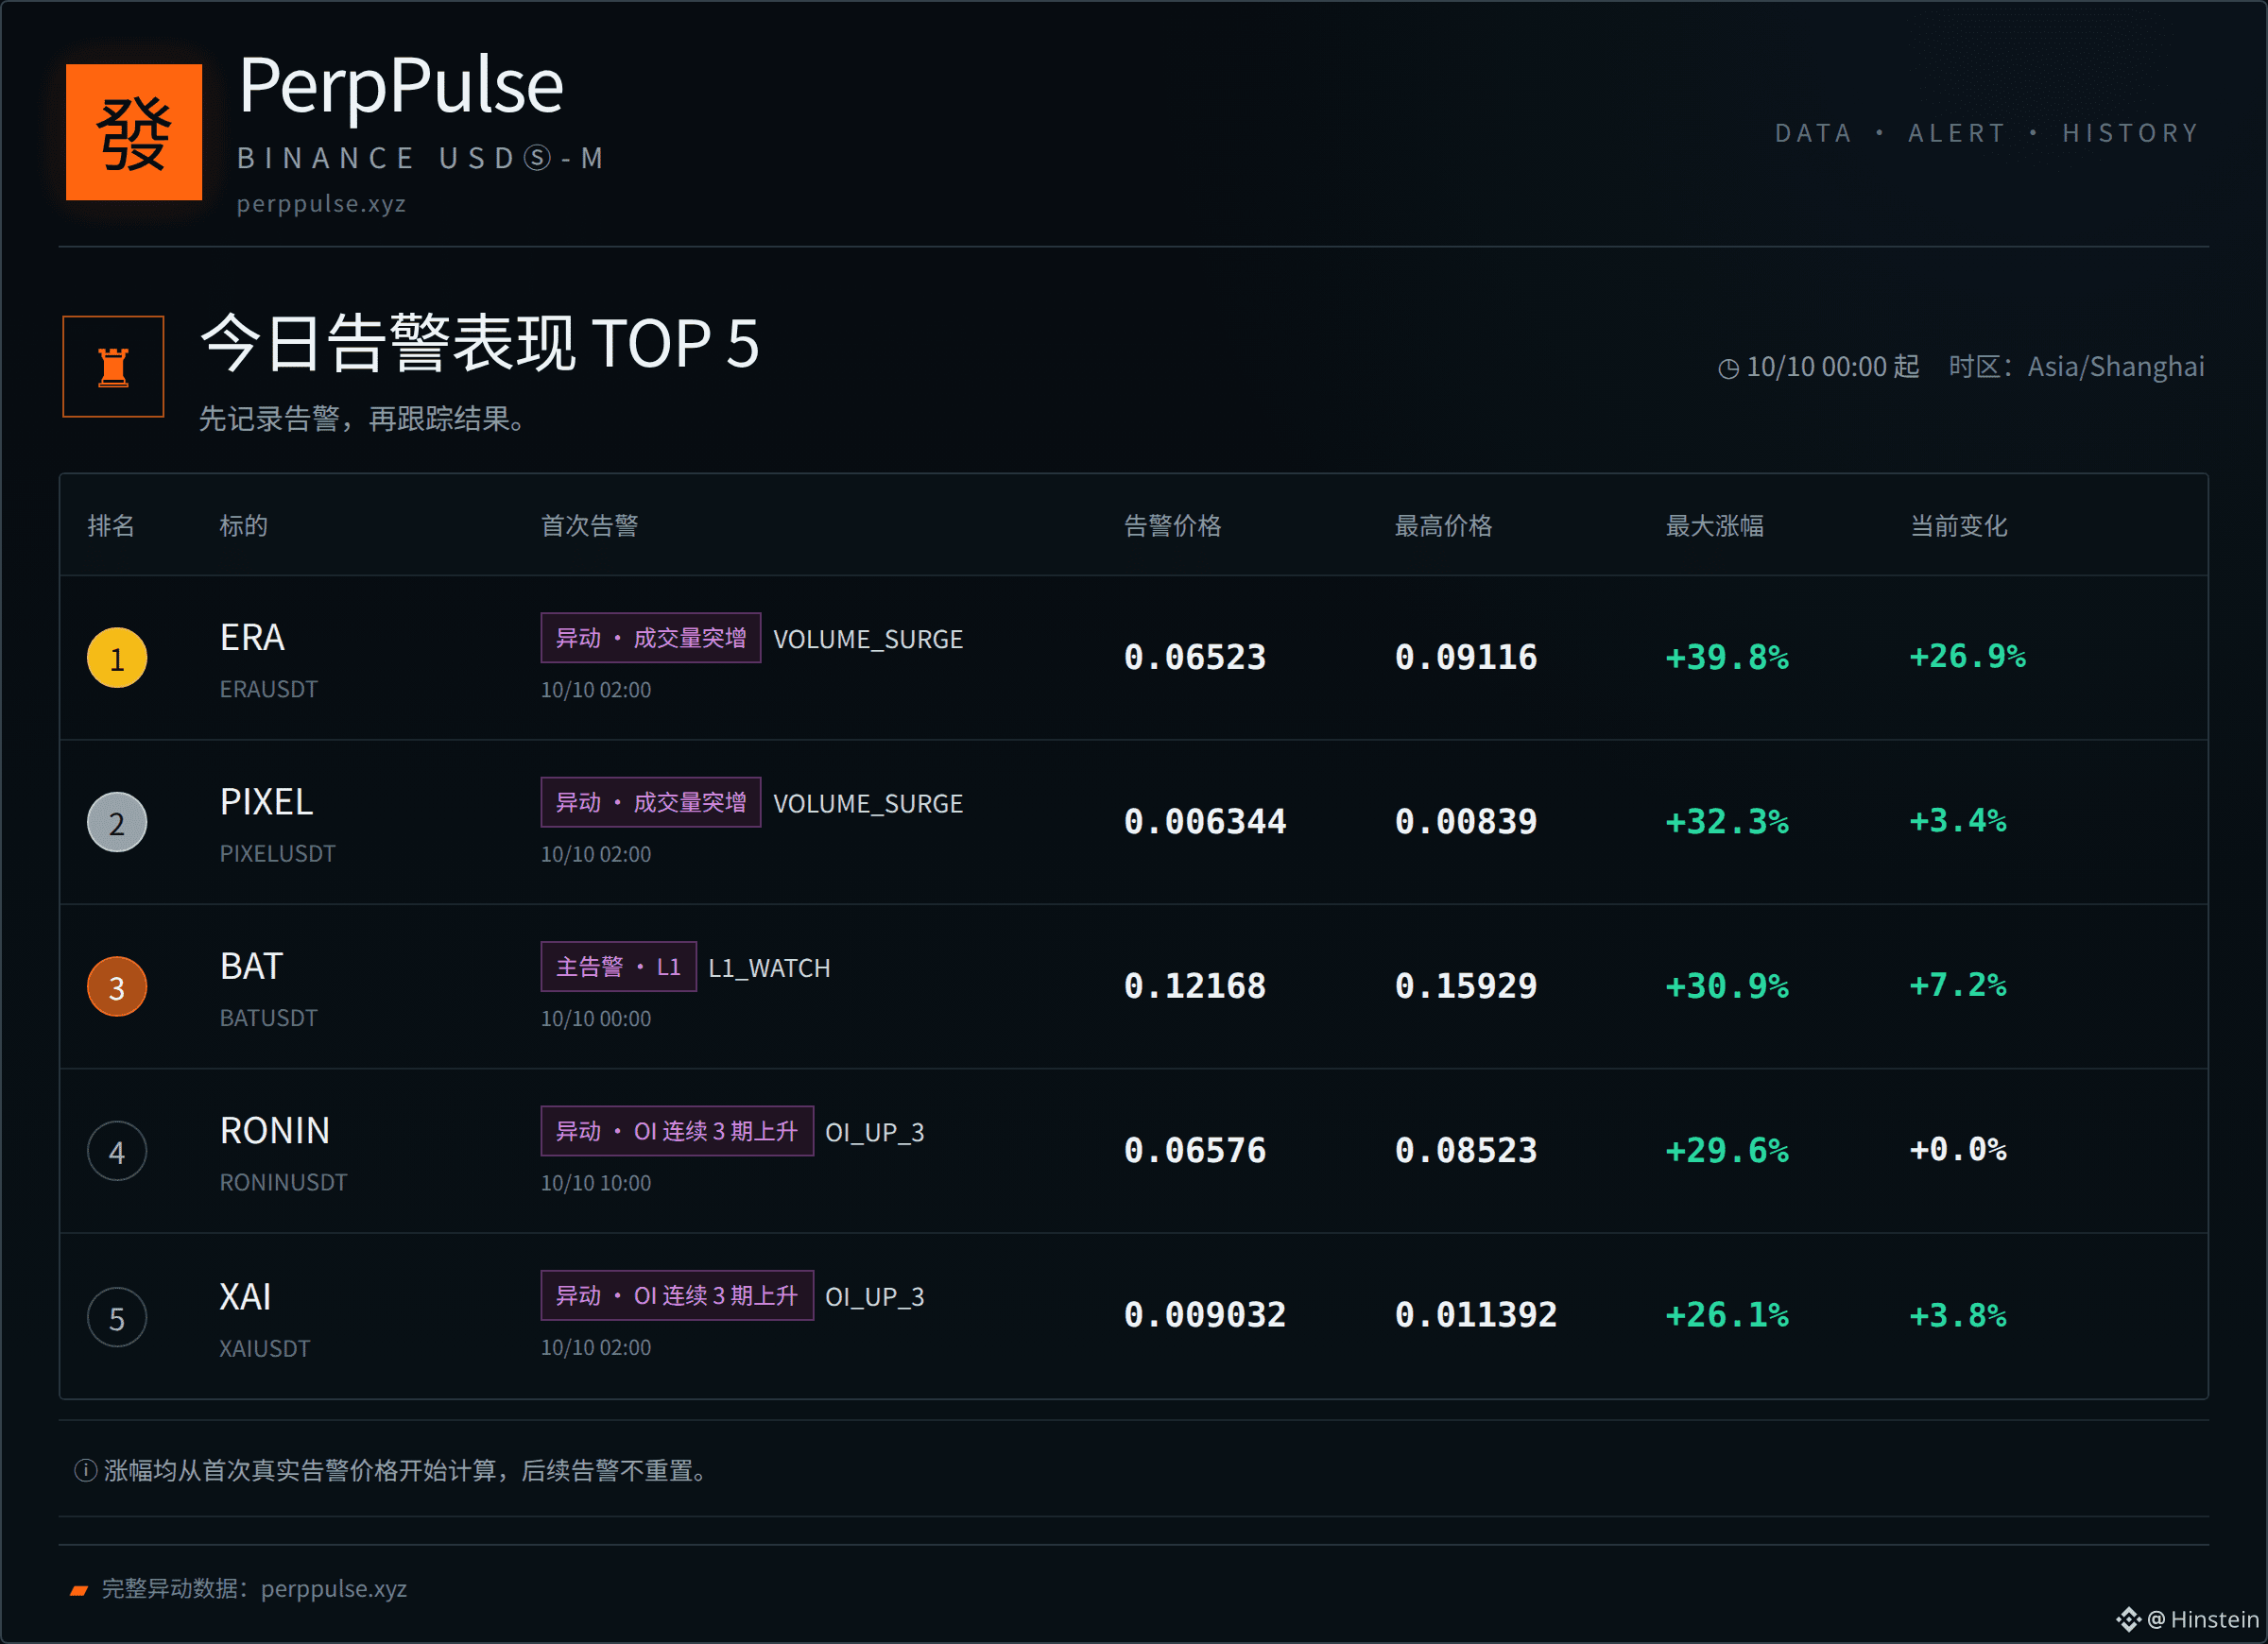
📊 今日异动表现榜
1. $ERA +39.8%
2. $PIXEL +32.3%
3. $BAT +30.9%
4. RONIN +29.6%
5. XAI +26.1%
统计口径:当天首次有效告警 → 此后最高价格。
只记录市场留下的结果,不把历史最高变化当成交易收益。
#MarketMovers #CryptoData
完整异动数据:perppulse.xyz
📊 今日异动表现榜
1. $ERA +39.8%
2. $PIXEL +32.3%
3. $BAT +30.9%
4. RONIN +29.6%
5. XAI +26.1%
统计口径:当天首次有效告警 → 此后最高价格。
只记录市场留下的结果,不把历史最高变化当成交易收益。
#MarketMovers #CryptoData
完整异动数据:perppulse.xyz
1. $ERA +39.8%
2. $PIXEL +32.3%
3. $BAT +30.9%
4. RONIN +29.6%
5. XAI +26.1%
统计口径:当天首次有效告警 → 此后最高价格。
只记录市场留下的结果,不把历史最高变化当成交易收益。
#MarketMovers #CryptoData
完整异动数据:perppulse.xyz
14
·
--
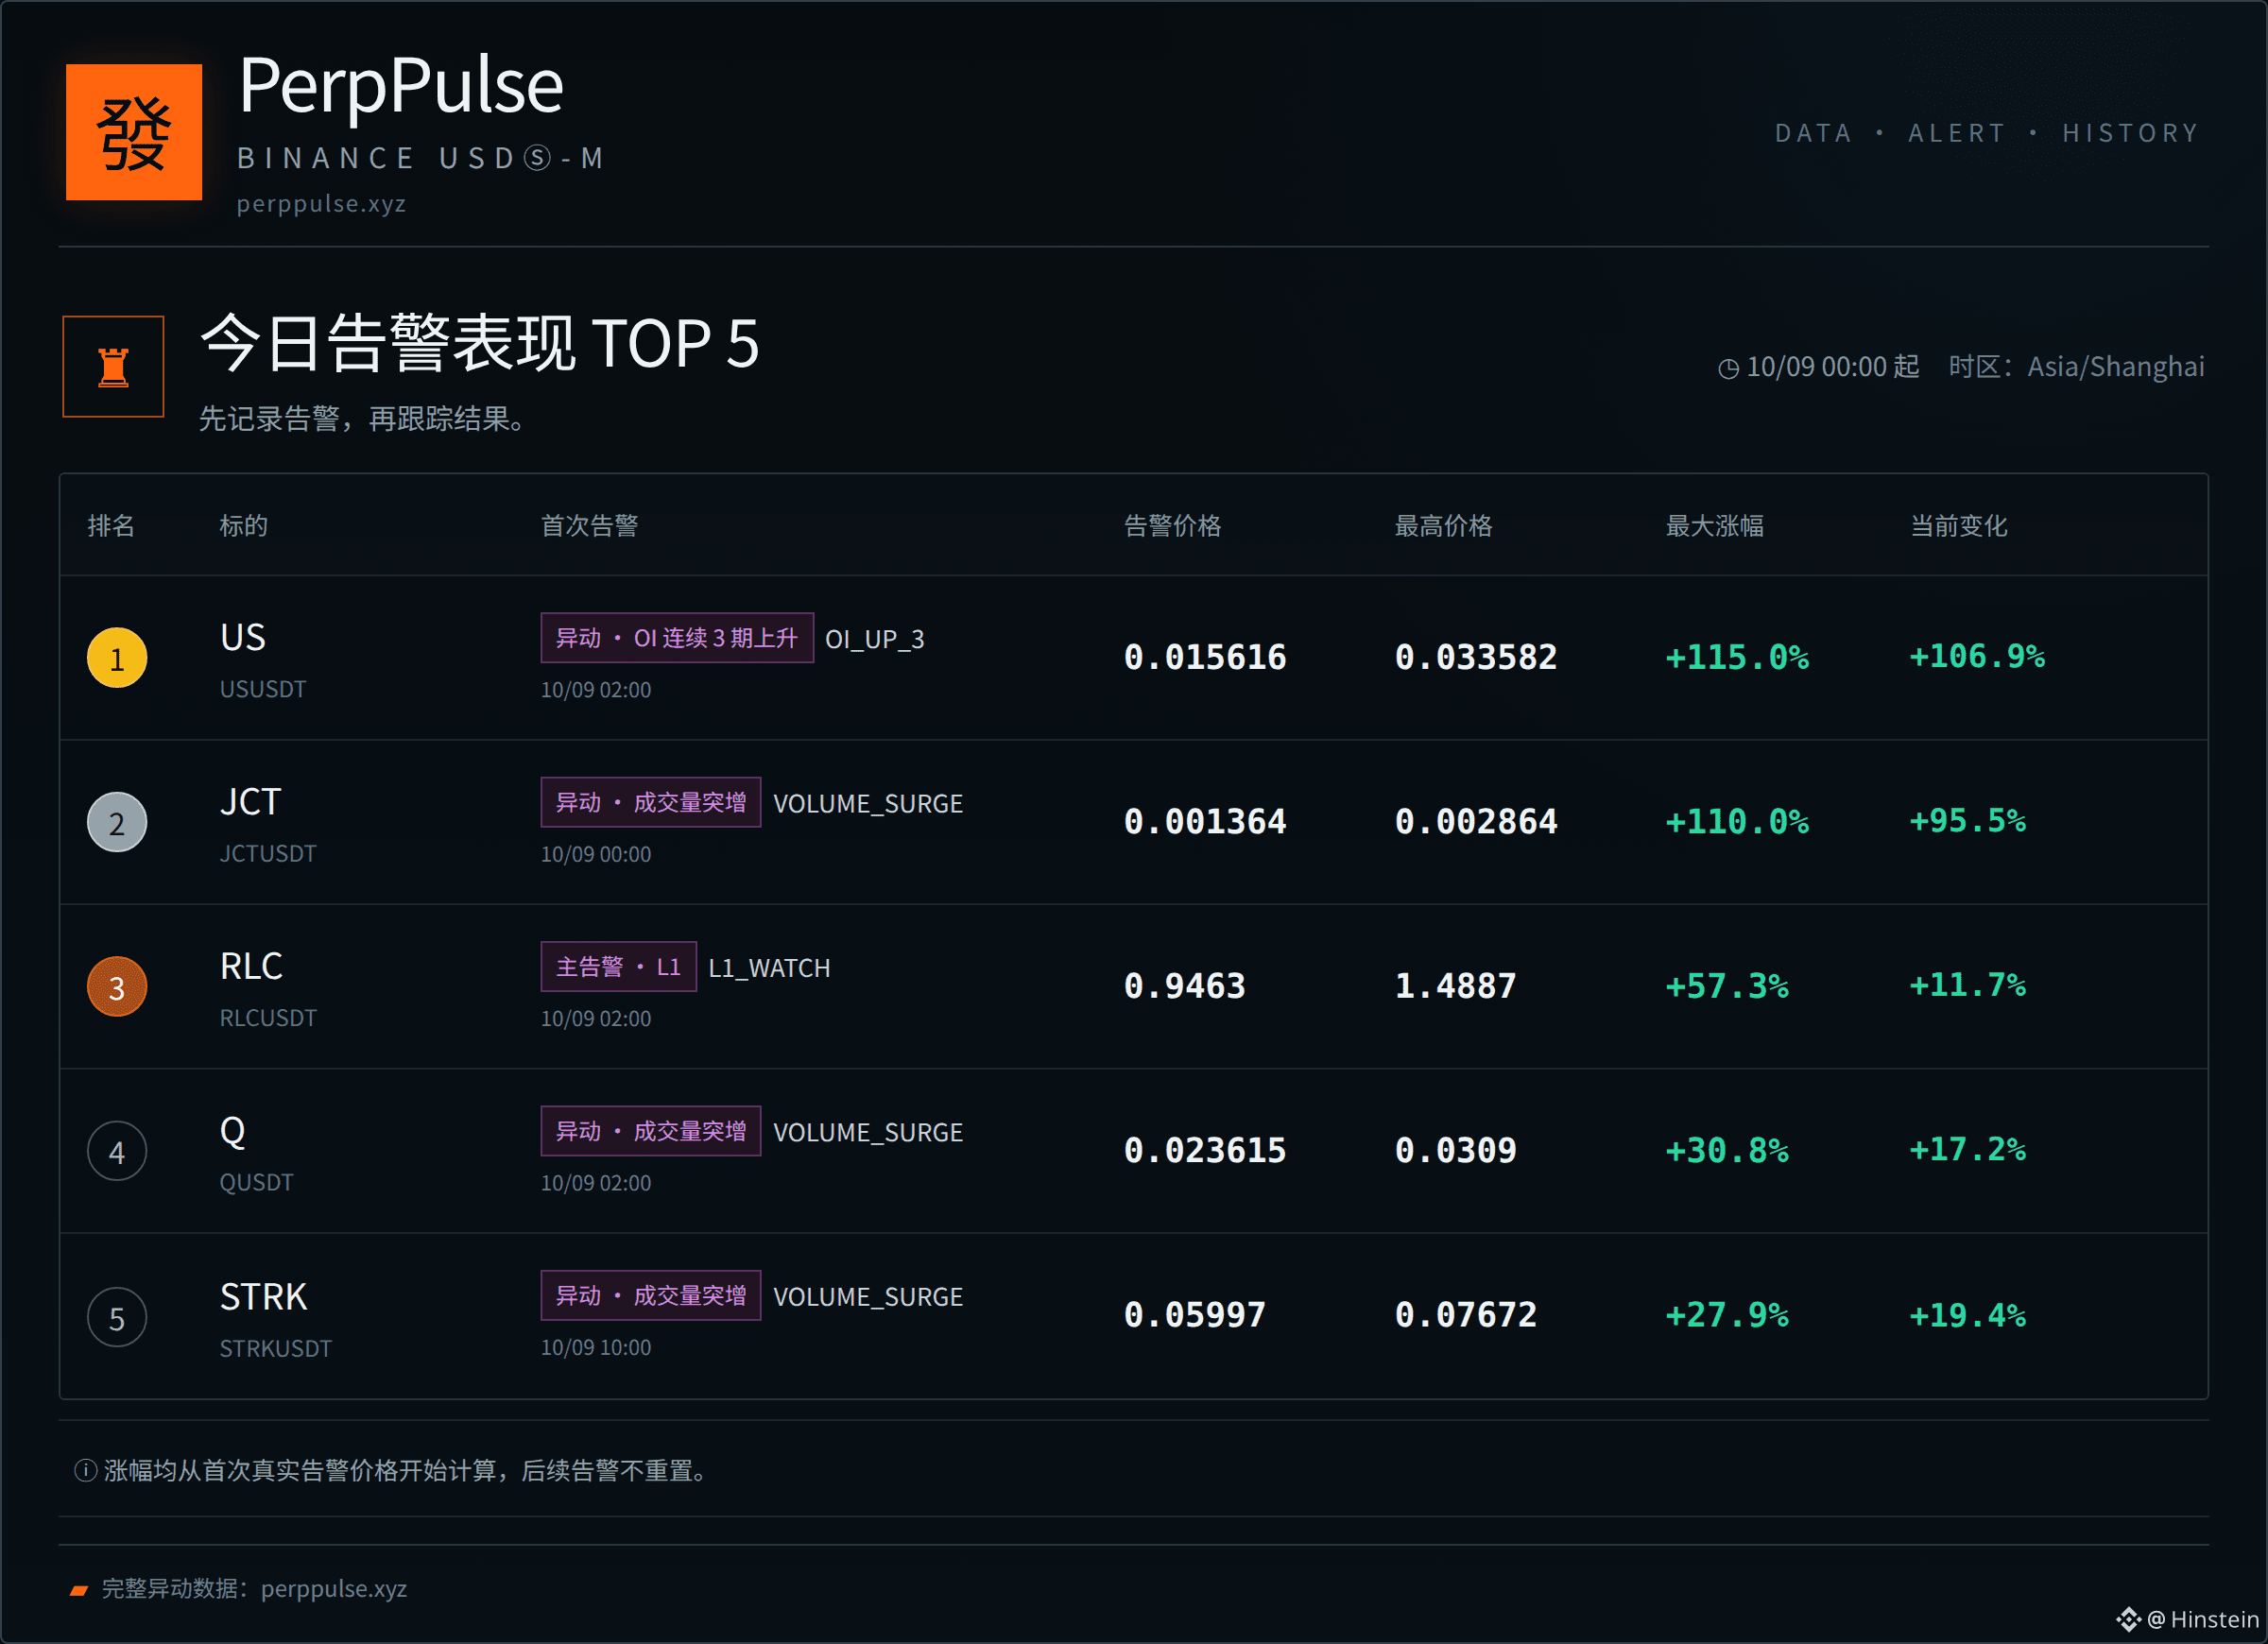
📊 今日异动表现榜
1. $US +115.0%
2. $JCT +110.0%
3. $RLC +57.3%
4. Q +30.8%
5. STRK +27.9%
统计口径:当天首次有效告警 → 此后最高价格。
只记录市场留下的结果,不把历史最高变化当成交易收益。
#MarketMovers #CryptoData
完整异动数据:perppulse.xyz
📊 今日异动表现榜
1. $US +115.0%
2. $JCT +110.0%
3. $RLC +57.3%
4. Q +30.8%
5. STRK +27.9%
统计口径:当天首次有效告警 → 此后最高价格。
只记录市场留下的结果,不把历史最高变化当成交易收益。
#MarketMovers #CryptoData
完整异动数据:perppulse.xyz
1. $US +115.0%
2. $JCT +110.0%
3. $RLC +57.3%
4. Q +30.8%
5. STRK +27.9%
统计口径:当天首次有效告警 → 此后最高价格。
只记录市场留下的结果,不把历史最高变化当成交易收益。
#MarketMovers #CryptoData
完整异动数据:perppulse.xyz
22
·
--
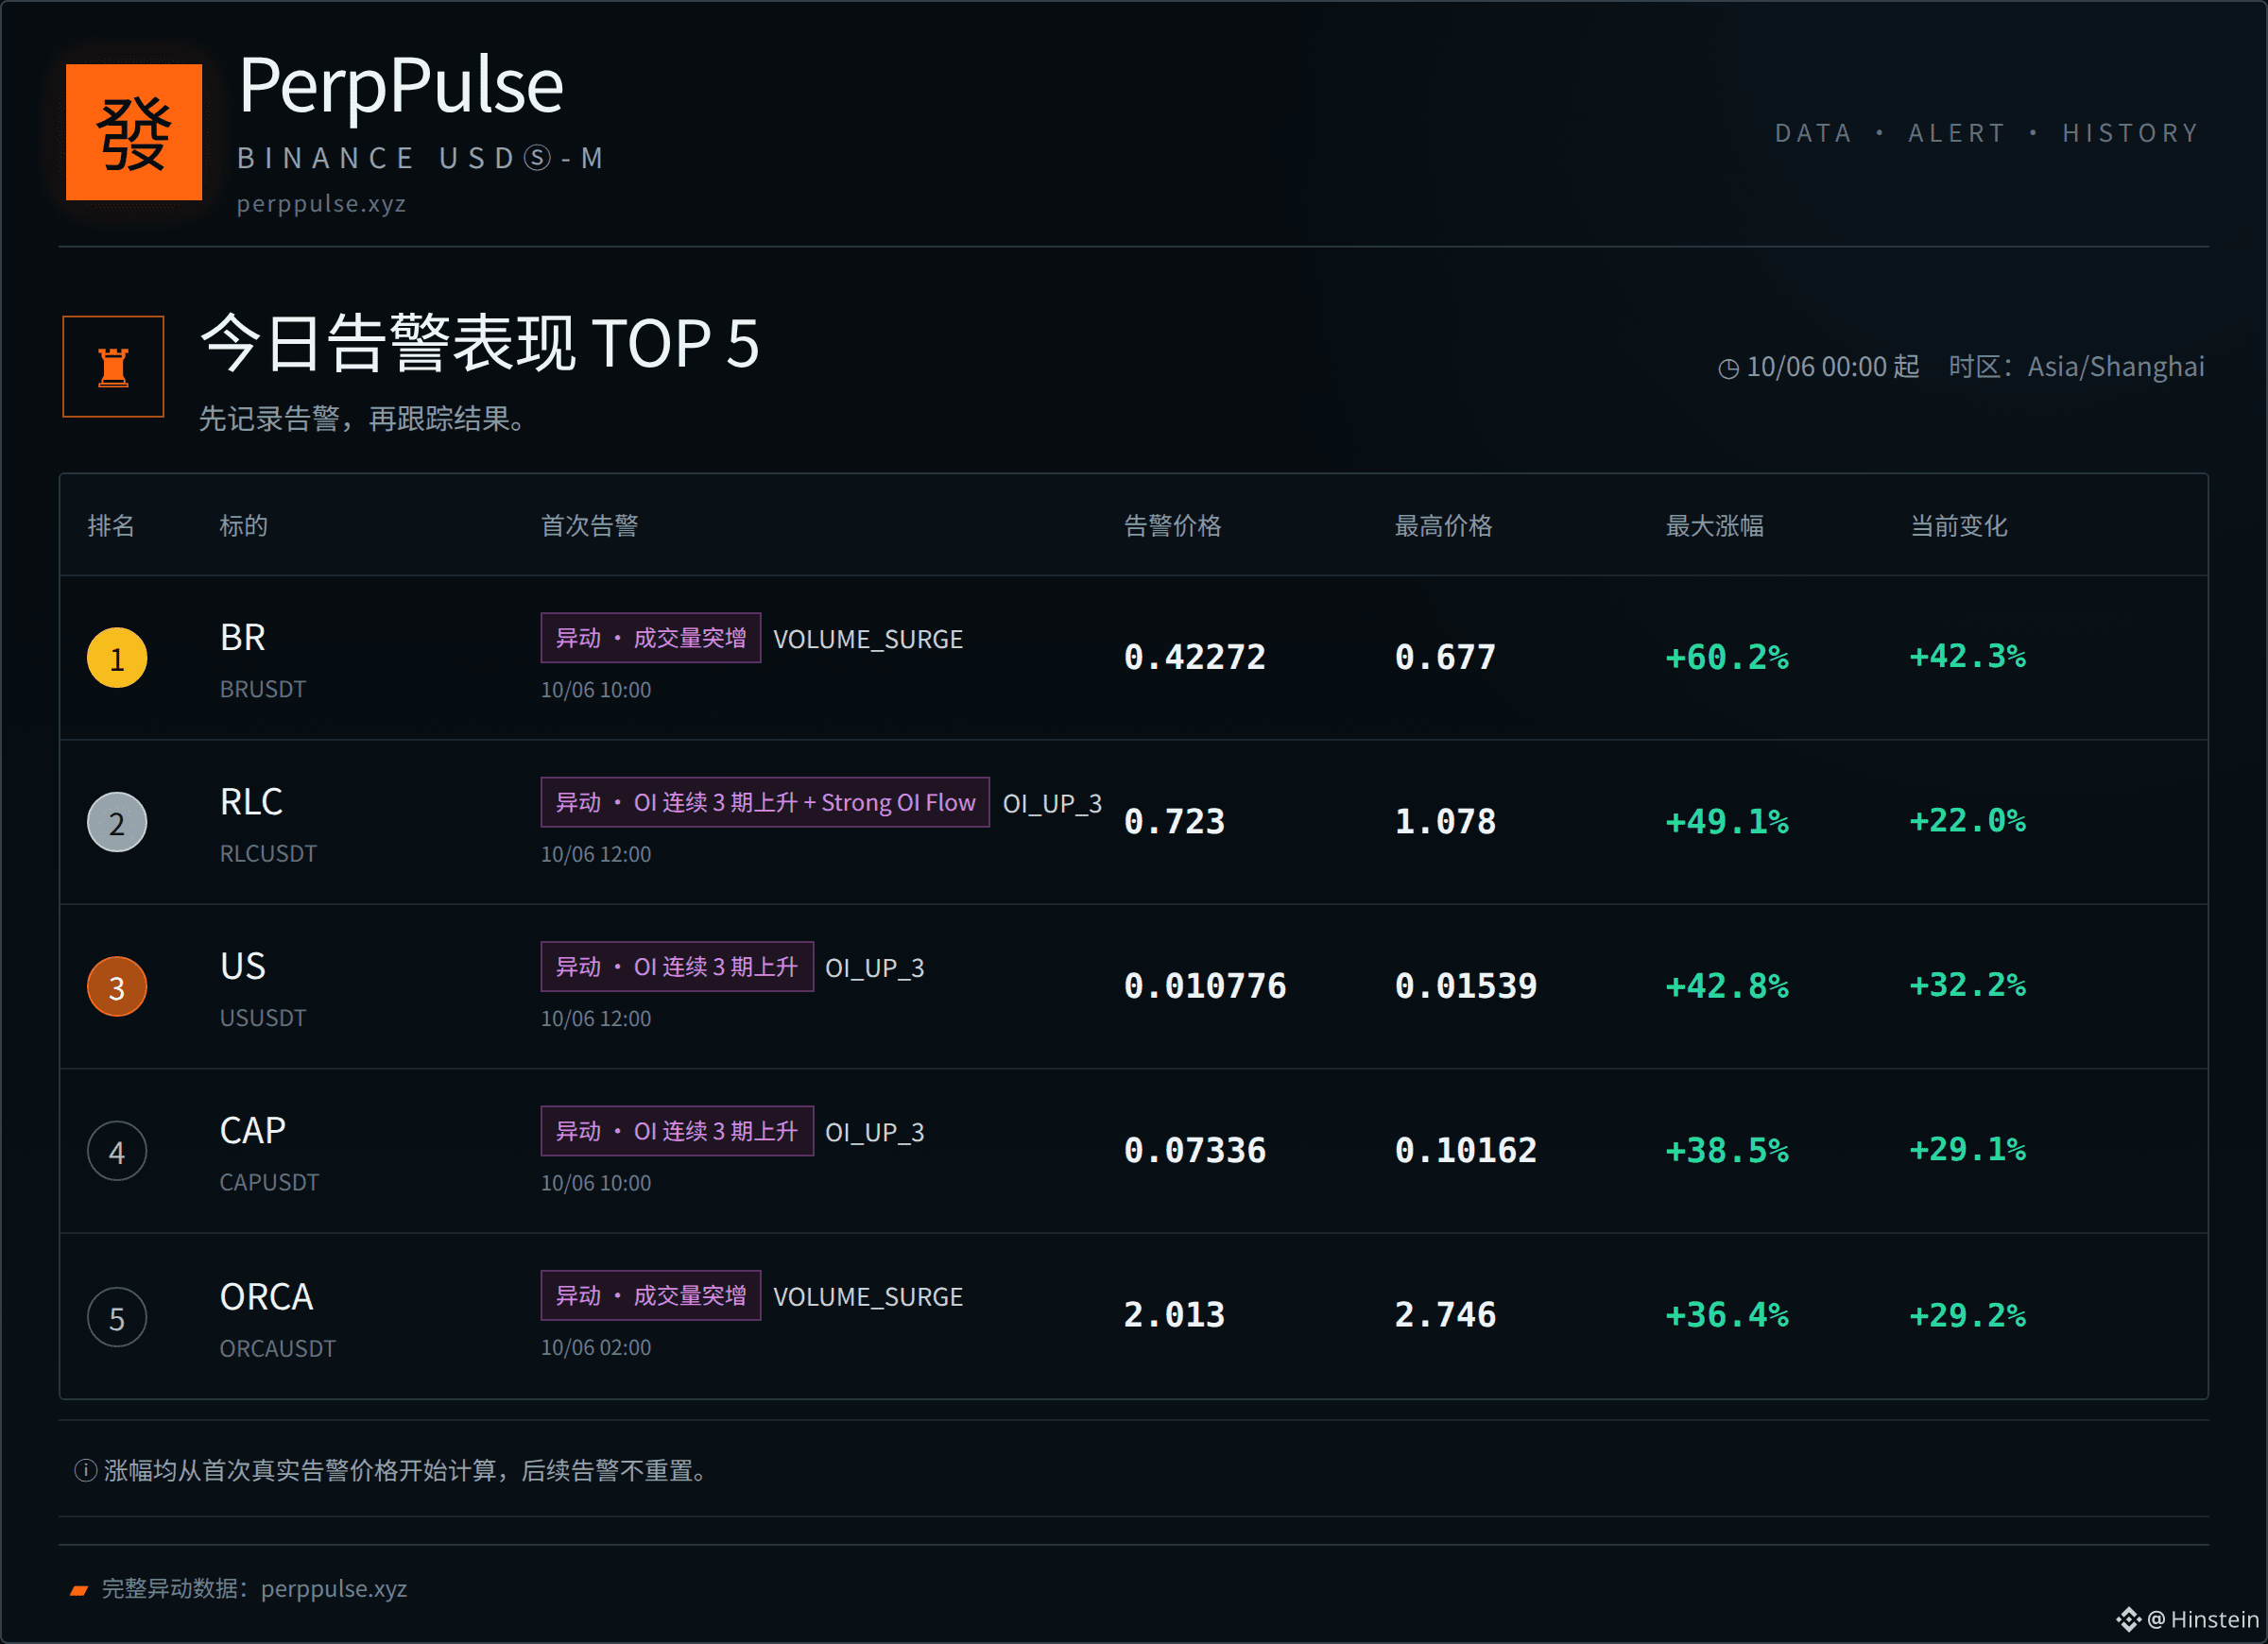
📊 今日异动表现榜
1. $BR +60.2%
2. $RLC +49.1%
3. $US +42.8%
4. CAP +38.5%
5. ORCA +36.4%
统计口径:当天首次有效告警 → 此后最高价格。
只记录市场留下的结果,不把历史最高变化当成交易收益。
#MarketMovers #CryptoData
完整异动数据:perppulse.xyz
📊 今日异动表现榜
1. $BR +60.2%
2. $RLC +49.1%
3. $US +42.8%
4. CAP +38.5%
5. ORCA +36.4%
统计口径:当天首次有效告警 → 此后最高价格。
只记录市场留下的结果,不把历史最高变化当成交易收益。
#MarketMovers #CryptoData
完整异动数据:perppulse.xyz
1. $BR +60.2%
2. $RLC +49.1%
3. $US +42.8%
4. CAP +38.5%
5. ORCA +36.4%
统计口径:当天首次有效告警 → 此后最高价格。
只记录市场留下的结果,不把历史最高变化当成交易收益。
#MarketMovers #CryptoData
完整异动数据:perppulse.xyz
15

·
--
:📊 Real Data Check: BTC Holds $86K, ETF Flows Stay Positive & Whale Stablecoins Flood BinanceAs of October 5, 2026, Bitcoin is trading around $86,000–$86,300, with the total crypto market cap near $2.93–$2.95 trillion and BTC dominance sitting at approximately 59%.Here’s the latest verified data:US Spot Bitcoin ETFs: Third consecutive week of net inflows, bringing in $241 million last week (Sept 28–Oct 2). BlackRock’s IBIT continues to lead. Month-to-date October already shows solid positive flows after strong September performance (~$2.65B).
BNB: Trading near $790, up roughly 3–5% over the past week and month. Market cap sits around $105 billion. The token remains one of the stronger large-caps with clean structure near the psychological $800 level.
Stablecoin signals on Binance: Whale transfers (>$1M) of stablecoins into Binance have jumped more than 40% over the past 30 days, reaching $30.5 billion cumulative. Daily stablecoin inflows to the exchange have frequently exceeded $1 billion, keeping significant buying power on the platform.
Sentiment: Fear & Greed Index around 70 (Greed).
These flows — ETF capital returning, large stablecoin deposits concentrating on Binance, and BTC consolidating above $85K — point to continued institutional and whale interest rather than pure retail FOMO.Are you watching the ETF flow numbers, BNB’s approach to $800, or the stablecoin dry powder on Binance most closely right now?Not financial advice. Always DYOR and manage your risk. #Binance #CryptoData #MarketUpdate #BTC #BinanceSquare
103
·
--
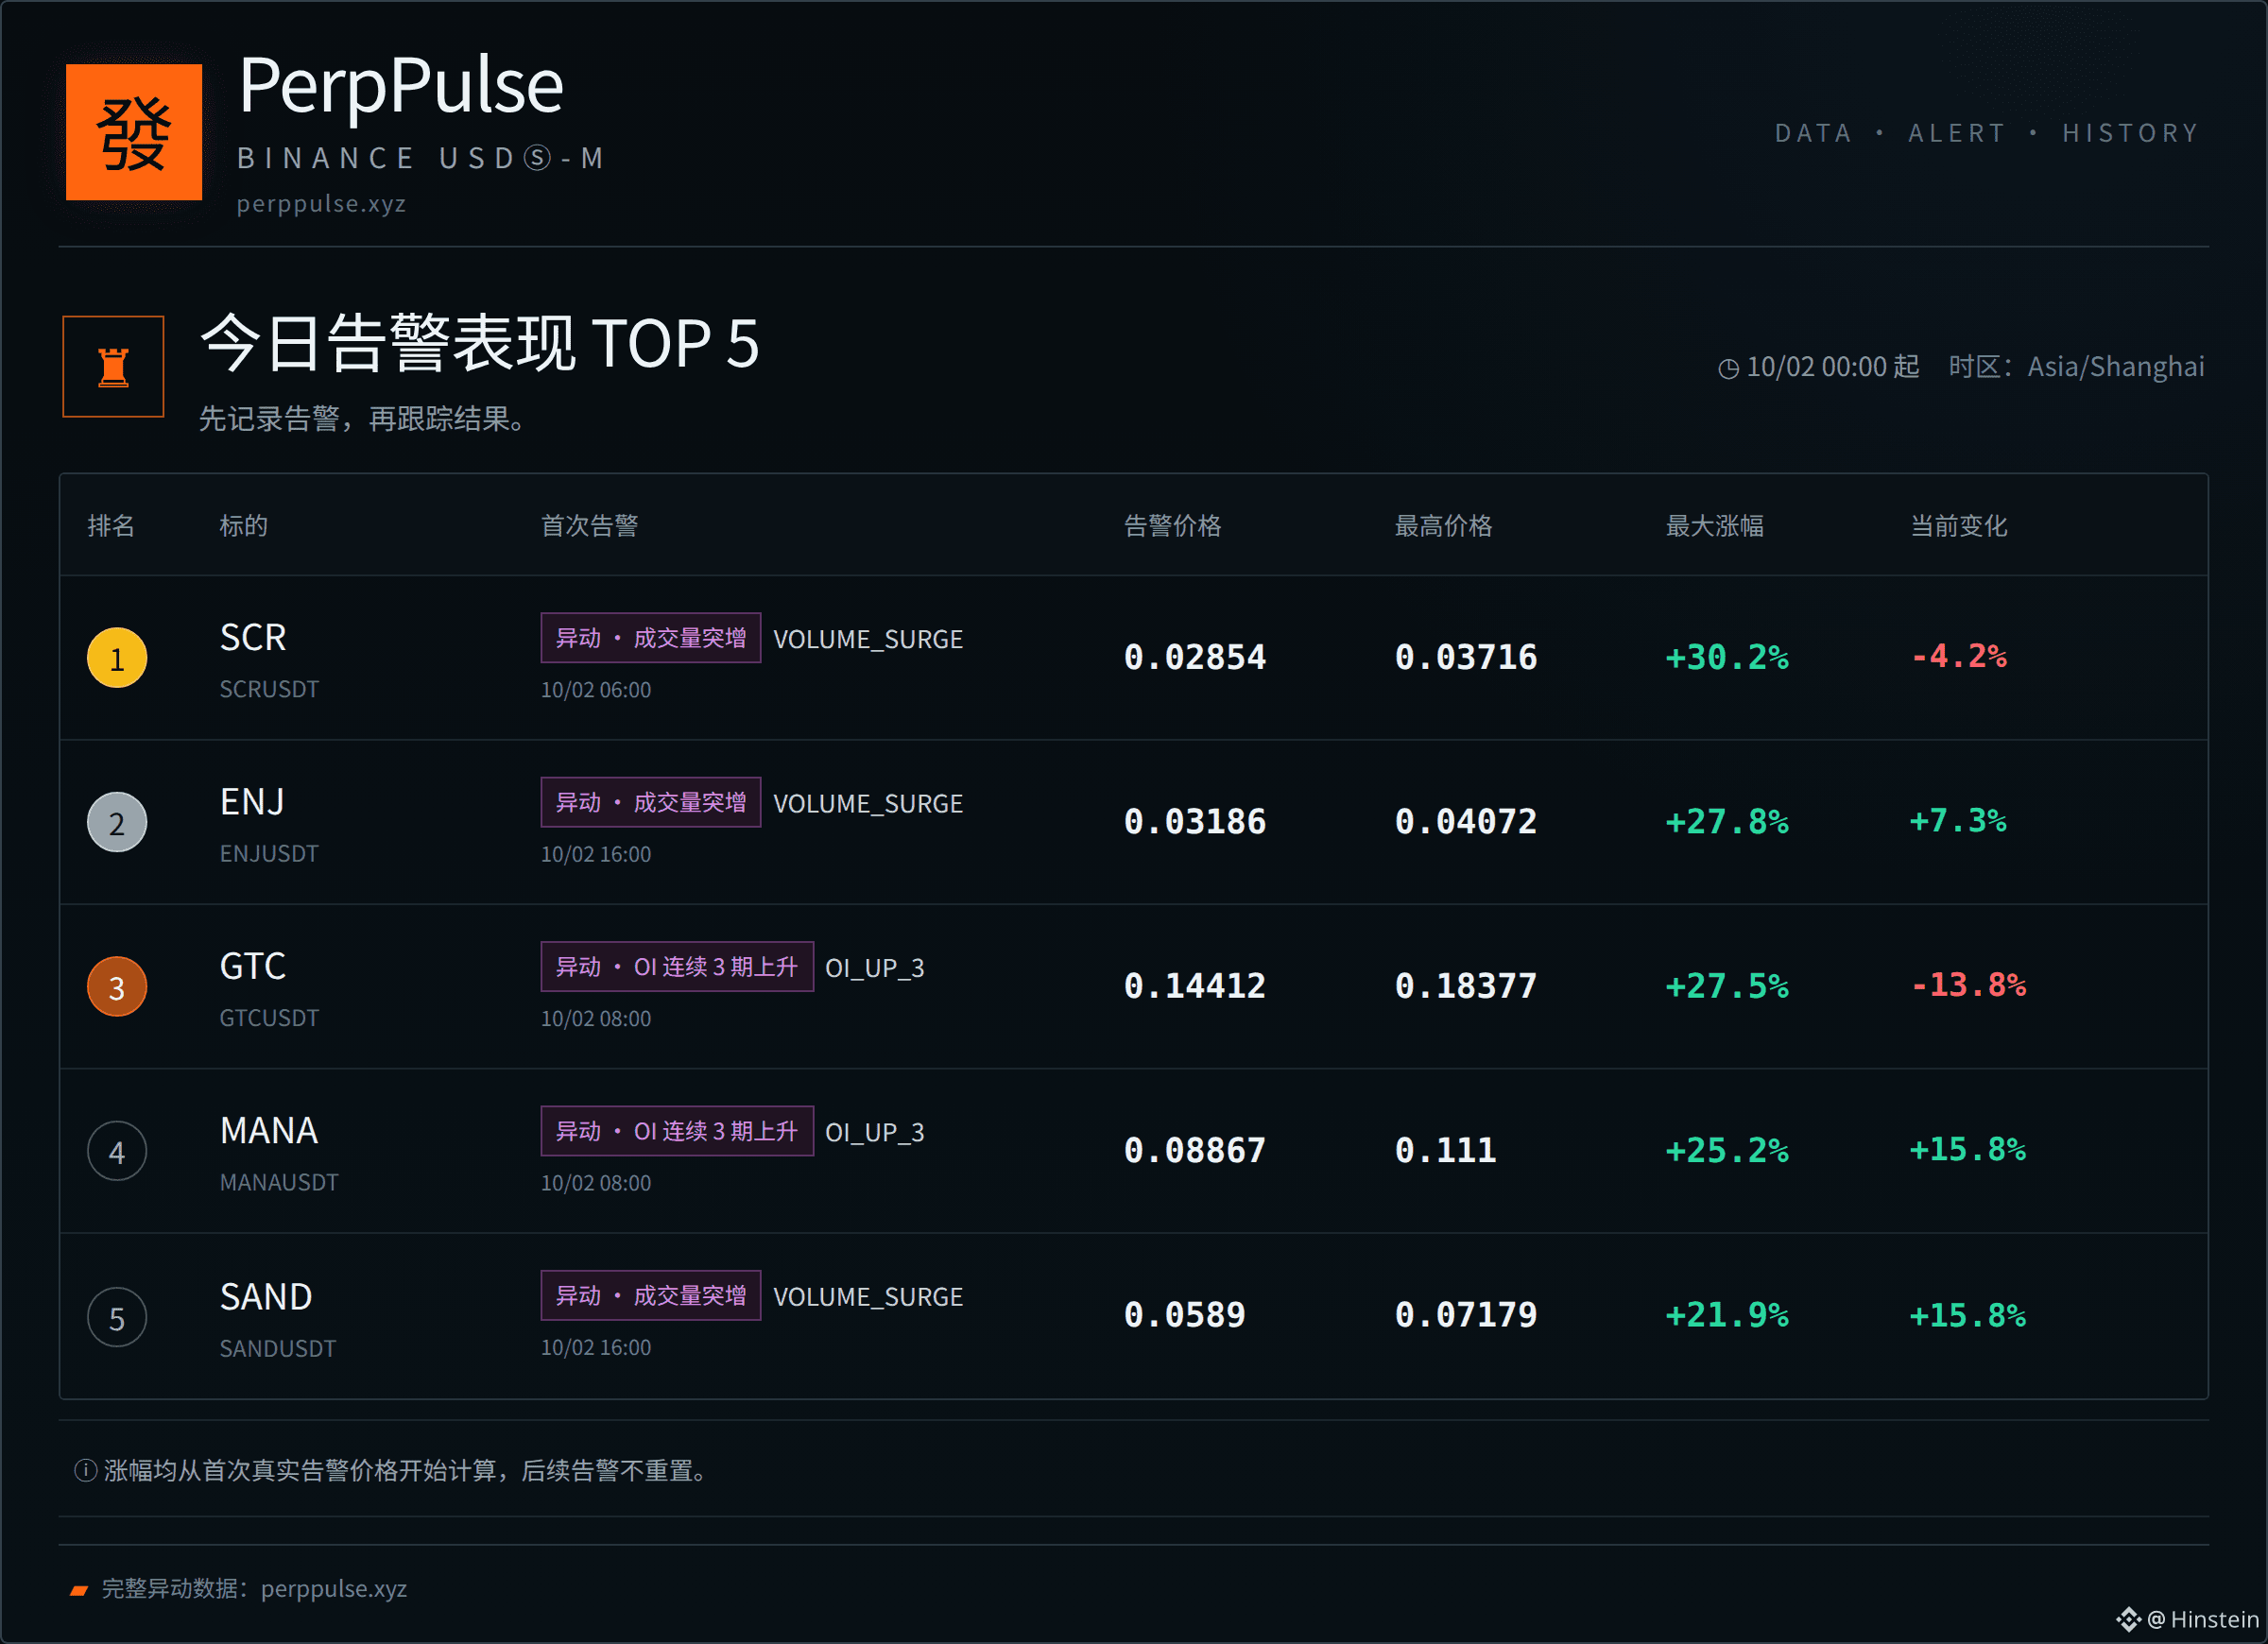
📊 今日异动表现榜
1. $SCR +30.2%
2. $ENJ +27.8%
3. $GTC +27.5%
4. MANA +25.2%
5. SAND +21.9%
统计口径:当天首次有效告警 → 此后最高价格。
只记录市场留下的结果,不把历史最高变化当成交易收益。
#MarketMovers #CryptoData
完整异动数据:perppulse.xyz
📊 今日异动表现榜
1. $SCR +30.2%
2. $ENJ +27.8%
3. $GTC +27.5%
4. MANA +25.2%
5. SAND +21.9%
统计口径:当天首次有效告警 → 此后最高价格。
只记录市场留下的结果,不把历史最高变化当成交易收益。
#MarketMovers #CryptoData
完整异动数据:perppulse.xyz
1. $SCR +30.2%
2. $ENJ +27.8%
3. $GTC +27.5%
4. MANA +25.2%
5. SAND +21.9%
统计口径:当天首次有效告警 → 此后最高价格。
只记录市场留下的结果,不把历史最高变化当成交易收益。
#MarketMovers #CryptoData
完整异动数据:perppulse.xyz
26
·
--
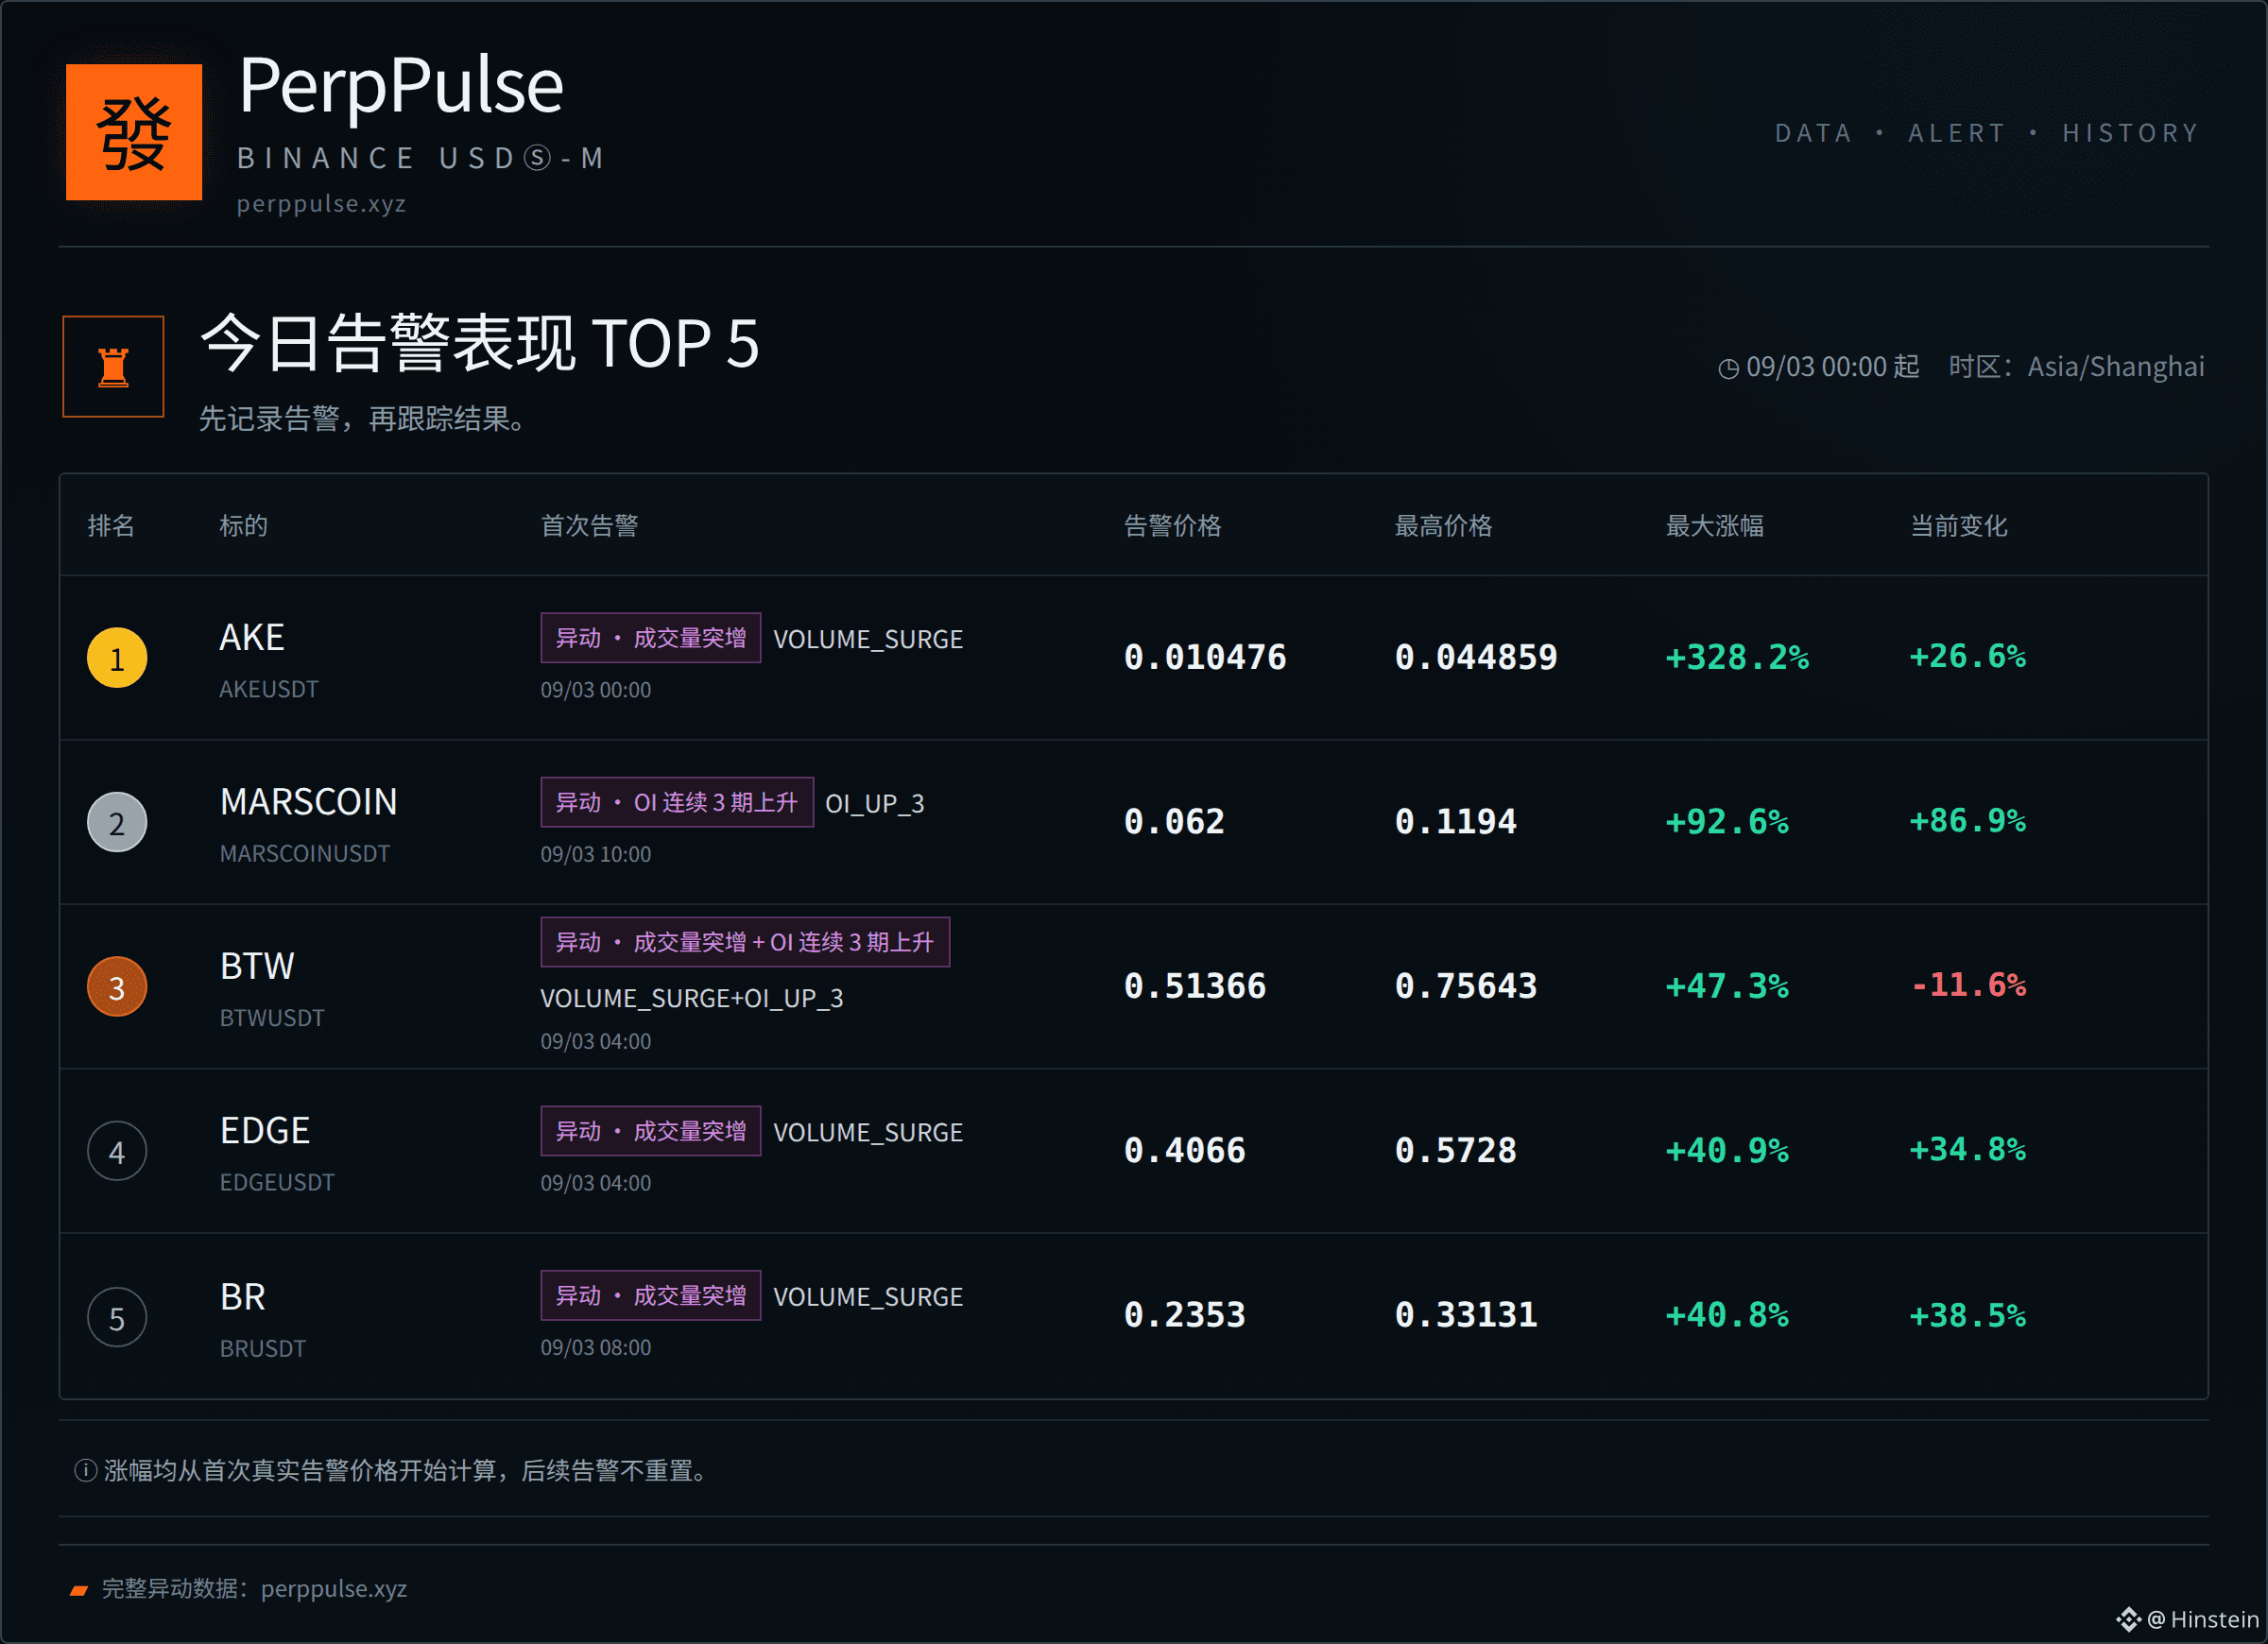
📊 今日异动表现榜
1. $AKE +328.2%
2. $MARSCOIN +92.6%
3. $BTW +47.3%
4. EDGE +40.9%
5. BR +40.8%
统计口径:当天首次有效告警 → 此后最高价格。
只记录市场留下的结果,不把历史最高变化当成交易收益。
#MarketMovers #CryptoData
完整异动数据:perppulse.xyz
📊 今日异动表现榜
1. $AKE +328.2%
2. $MARSCOIN +92.6%
3. $BTW +47.3%
4. EDGE +40.9%
5. BR +40.8%
统计口径:当天首次有效告警 → 此后最高价格。
只记录市场留下的结果,不把历史最高变化当成交易收益。
#MarketMovers #CryptoData
完整异动数据:perppulse.xyz
1. $AKE +328.2%
2. $MARSCOIN +92.6%
3. $BTW +47.3%
4. EDGE +40.9%
5. BR +40.8%
统计口径:当天首次有效告警 → 此后最高价格。
只记录市场留下的结果,不把历史最高变化当成交易收益。
#MarketMovers #CryptoData
完整异动数据:perppulse.xyz
18

One market-cap number can hide two different universes.
At 21:32 ICT on Aug 15, CoinMarketCap estimated total crypto value at $2.17T, while CoinGecko showed $2.25T. Yet both measured the 24-hour change near +0.6%, and their reported daily volume was close at roughly $37.8B–$38.4B. The gap is not necessarily bad data: aggregators track different asset sets and apply different supply, pricing, and exclusion rules.
Market lesson: use one provider consistently when studying a trend. Comparing today’s figure from one dashboard with yesterday’s from another can create a false signal. Focus on direction, methodology, and timestamp—not a single headline total. #CryptoData
9

·
--
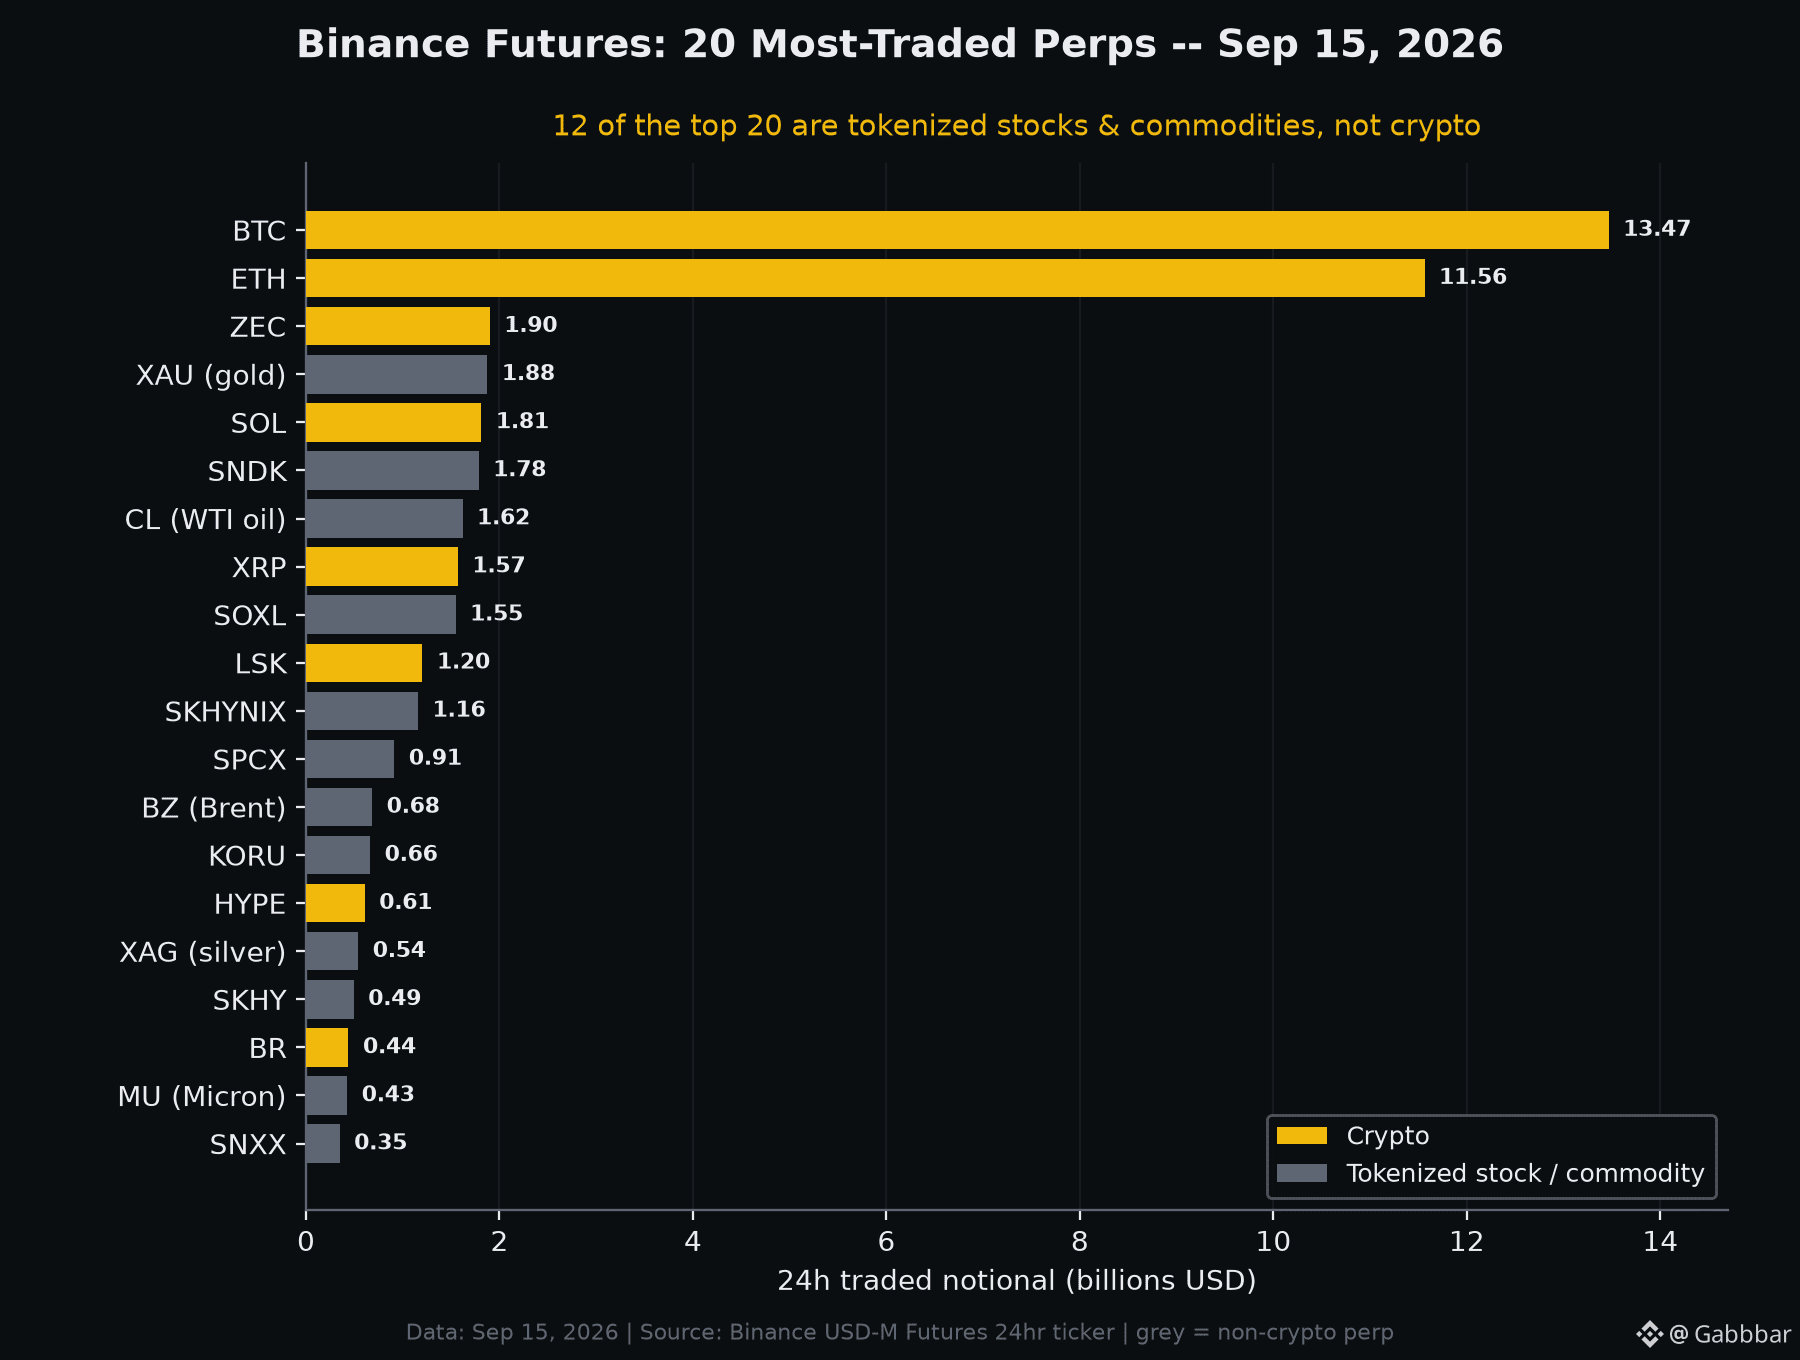
Only 8 of the 20 most-traded contracts on Binance USD-M Futures right now are actually crypto. The other 12 are tokenized stocks and commodities -- gold, oil, and chip names sitting shoulder-to-shoulder with BTC and ETH. Data as of September 15, 2026.
Top 20 Binance perpetual futures by 24h traded notional (USD):
1. BTC - $13.47B
2. ETH - $11.56B
3. ZEC - $1.90B
4. XAU (gold) - $1.88B
5. SOL - $1.81B
6. SNDK (SanDisk) - $1.78B
7. CL (WTI oil) - $1.62B
8. XRP - $1.57B
9. SOXL (semis ETF) - $1.55B
10. LSK - $1.20B
11. SKHYNIX - $1.16B
12. SPCX (SpaceX) - $0.91B
13. BZ (Brent oil) - $0.68B
14. KORU - $0.66B
15. HYPE - $0.61B
16. XAG (silver) - $0.54B
17. SKHY - $0.49B
18. BR - $0.44B
19. MU (Micron) - $0.43B
20. SNXX - $0.35B
A few facts that stand out on Sep 15, 2026:
- Across all 718 USDT-margined perps, 24h traded notional totaled about $56.3B.
- BTC and ETH alone accounted for roughly $25.0B of that -- about 44% of the entire perp market in just two contracts.
- The top 20 names made up about 79% of all perp volume, meaning the remaining ~700 contracts split only a fifth of it.
- Among crypto, ZEC ($1.90B) out-traded SOL and XRP, and LSK still churned $1.20B despite dropping ~47% on the day.
The bigger shift: a crypto derivatives venue where gold, oil and semiconductors trade billions a day next to Bitcoin. When an exchange blends crypto and tokenized TradFi in one book, does the line between 'crypto volume' and 'market volume' still mean much to you?
#BinanceFutures #Perpetuals #CryptoData
276

·
--
ලිපිය
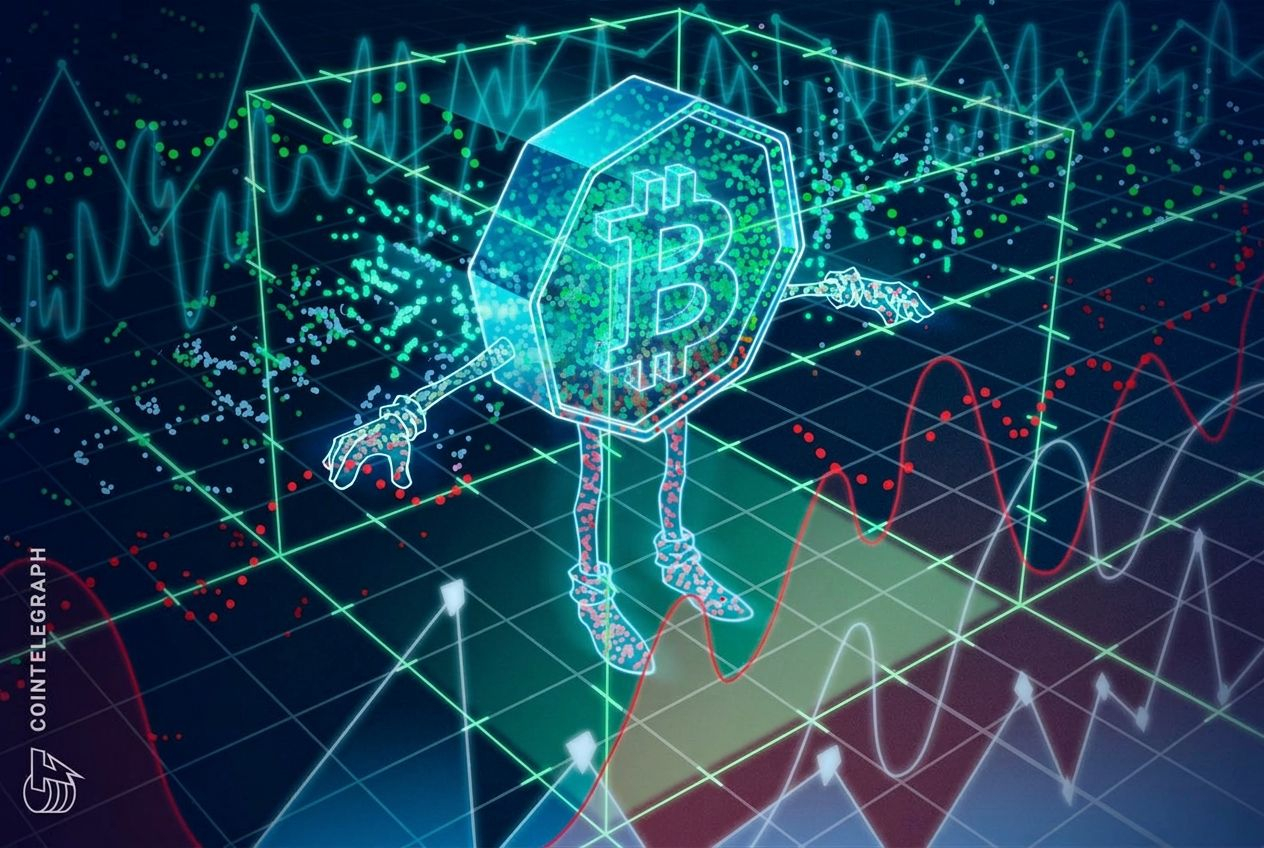
BREAKING: BIS REVEALS $BTC TRANSFER DATA IS A MESSBIS paper finds major gap in Bitcoin onchain transfer estimates
The Bank for International Settlements (BIS) has just dropped a bombshell that could rewrite how we see the flow of money in the crypto world. Their latest study shows that the most widely used on‑chain metrics—think the numbers you see on CoinMarketCap, Glassnode, or IntoTheBlock—are seriously underestimating the real economic activity in Bitcoin, Ethereum, and even stablecoins. In plain English, the numbers you’ve been trusting are a *complete lie*.
The proof is staggering: BIS analysts discovered that the standard on‑chain data sources miss up to 30% of transfer volume for $BTC and $ETH, and the gaps widen even further for stablecoins like USDT and USDC. This means that the actual flow of capital across the network is far higher than the charts suggest. #Bitcoin #Ethereum #CryptoData
What does this mean for the market? If the true volume is higher, the liquidity and network health of $BTC and $ETH are far stronger than we thought. Institutional investors who rely on these metrics for risk assessment might be underestimating exposure. Meanwhile, the flood of hidden activity could explain the recent surge in price volatility—smart money is moving in ways the public eye can’t see. #MarketImpact #CryptoInsights
So, what should you do? Don’t sit on the sidelines. Dive into the data, adjust your models, and consider that the real story of crypto liquidity is more robust than ever. The flood has started—are you ready to ride it?
BREAKING: BIS REVEALS $BTC TRANSFER DATA IS A MESS
BIS paper finds major gap in Bitcoin onchain transfer estimates
The Bank for International Settlements (BIS) has just dropped a bombshell that could rewrite how we see the flow of money in the crypto world. Their latest study shows that the most widely used on‑chain metrics—think the numbers you see on CoinMarketCap, Glassnode, or IntoTheBlock—are seriously underestimating the real economic activity in Bitcoin, Ethereum, and even stablecoins. In plain English, the numbers you’ve been trusting are a *complete lie*.
The proof is staggering: BIS analysts discovered that the standard on‑chain data sources miss up to 30% of transfer volume for $BTC and $ETH , and the gaps widen even further for stablecoins like USDT and USDC. This means that the actual flow of capital across the network is far higher than the charts suggest. #Bitcoin #Ethereum #CryptoData
What does this mean for the market? If the true volume is higher, the liquidity and network health of $BTC and $ETH are far stronger than we thought. Institutional investors who rely on these metrics for risk assessment might be underestimating exposure. Meanwhile, the flood of hidden activity could explain the recent surge in price volatility—smart money is moving in ways the public eye can’t see. #MarketImpact #CryptoInsights
So, what should you do? Don’t sit on the sidelines. Dive into the data, adjust your models, and consider that the real story of crypto liquidity is more robust than ever. The flood has started—are you ready to ride it?
98
·
--
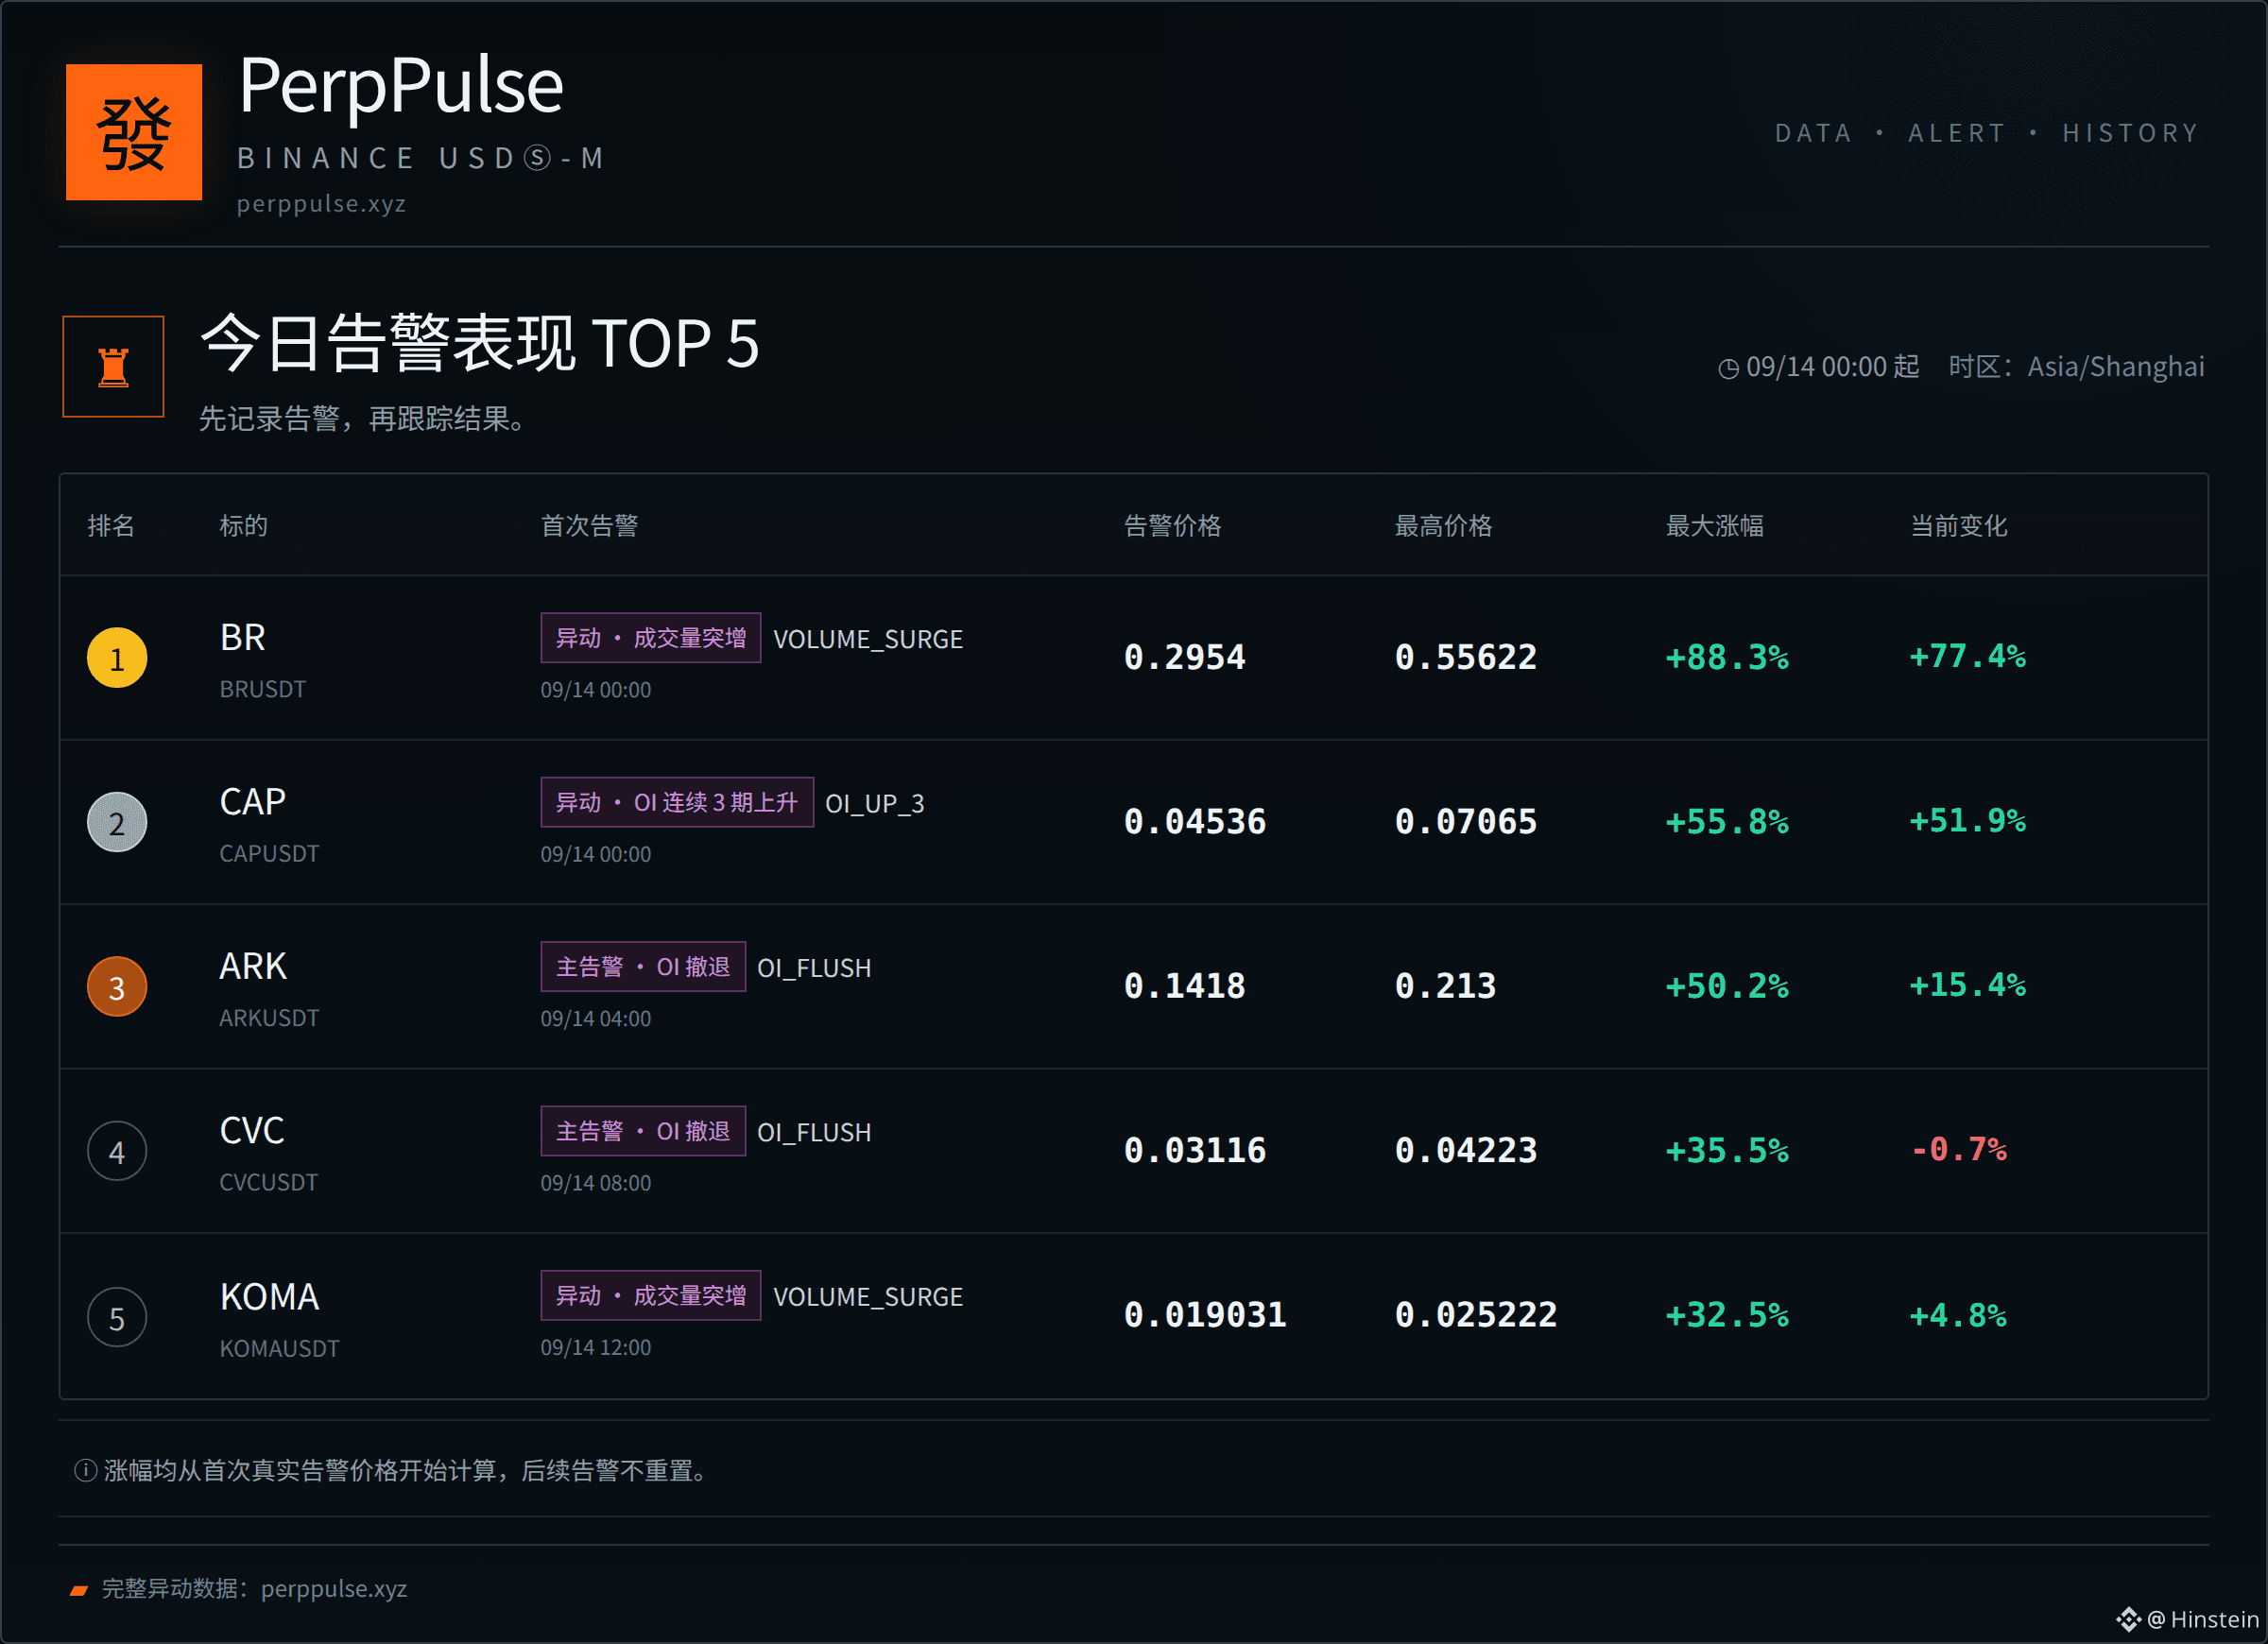
📊 今日异动表现榜
1. $BR +88.3%
2. $CAP +55.8%
3. $ARK +50.2%
4. CVC +35.5%
5. KOMA +32.5%
统计口径:当天首次有效告警 → 此后最高价格。
只记录市场留下的结果,不把历史最高变化当成交易收益。
#MarketMovers #CryptoData
完整异动数据:perppulse.xyz
📊 今日异动表现榜
1. $BR +88.3%
2. $CAP +55.8%
3. $ARK +50.2%
4. CVC +35.5%
5. KOMA +32.5%
统计口径:当天首次有效告警 → 此后最高价格。
只记录市场留下的结果,不把历史最高变化当成交易收益。
#MarketMovers #CryptoData
完整异动数据:perppulse.xyz
1. $BR +88.3%
2. $CAP +55.8%
3. $ARK +50.2%
4. CVC +35.5%
5. KOMA +32.5%
统计口径:当天首次有效告警 → 此后最高价格。
只记录市场留下的结果,不把历史最高变化当成交易收益。
#MarketMovers #CryptoData
完整异动数据:perppulse.xyz
35
·
--
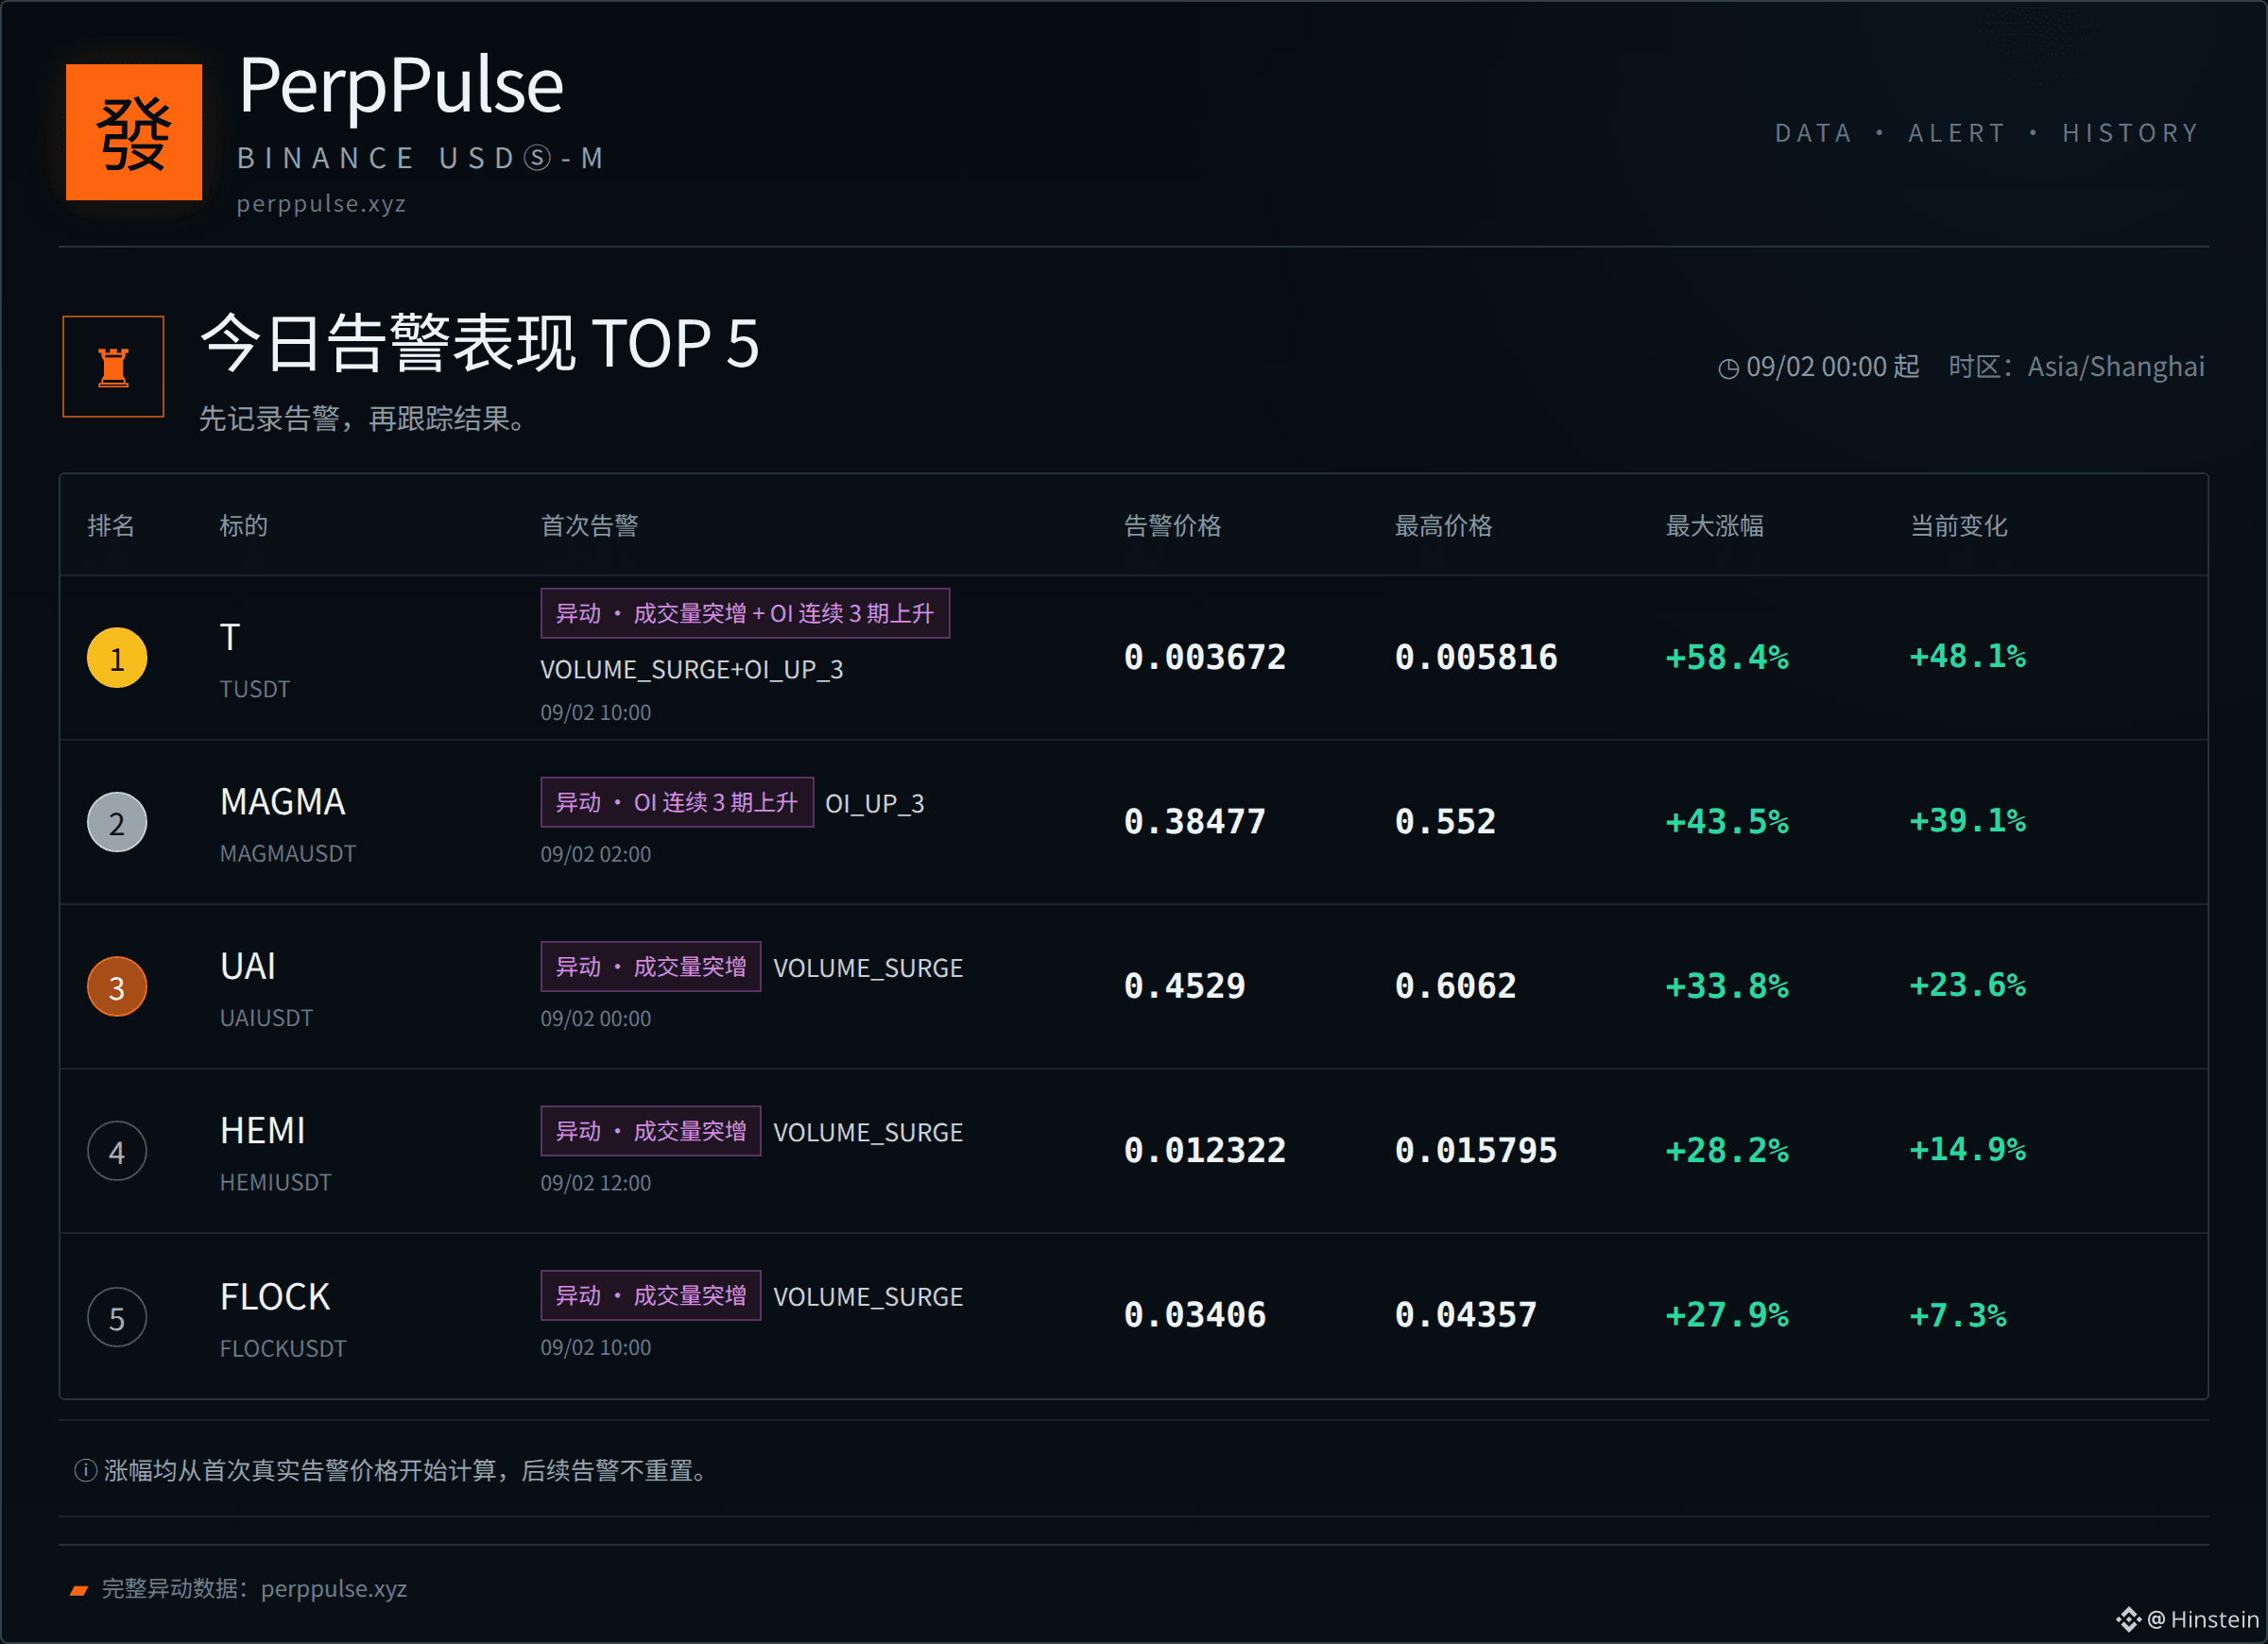
📊 今日异动表现榜
1. $T +58.4%
2. $MAGMA +43.5%
3. $UAI +33.8%
4. HEMI +28.2%
5. FLOCK +27.9%
统计口径:当天首次有效告警 → 此后最高价格。
只记录市场留下的结果,不把历史最高变化当成交易收益。
#MarketMovers #CryptoData
完整异动数据:perppulse.xyz
📊 今日异动表现榜
1. $T +58.4%
2. $MAGMA +43.5%
3. $UAI +33.8%
4. HEMI +28.2%
5. FLOCK +27.9%
统计口径:当天首次有效告警 → 此后最高价格。
只记录市场留下的结果,不把历史最高变化当成交易收益。
#MarketMovers #CryptoData
完整异动数据:perppulse.xyz
1. $T +58.4%
2. $MAGMA +43.5%
3. $UAI +33.8%
4. HEMI +28.2%
5. FLOCK +27.9%
统计口径:当天首次有效告警 → 此后最高价格。
只记录市场留下的结果,不把历史最高变化当成交易收益。
#MarketMovers #CryptoData
完整异动数据:perppulse.xyz
33
·
--
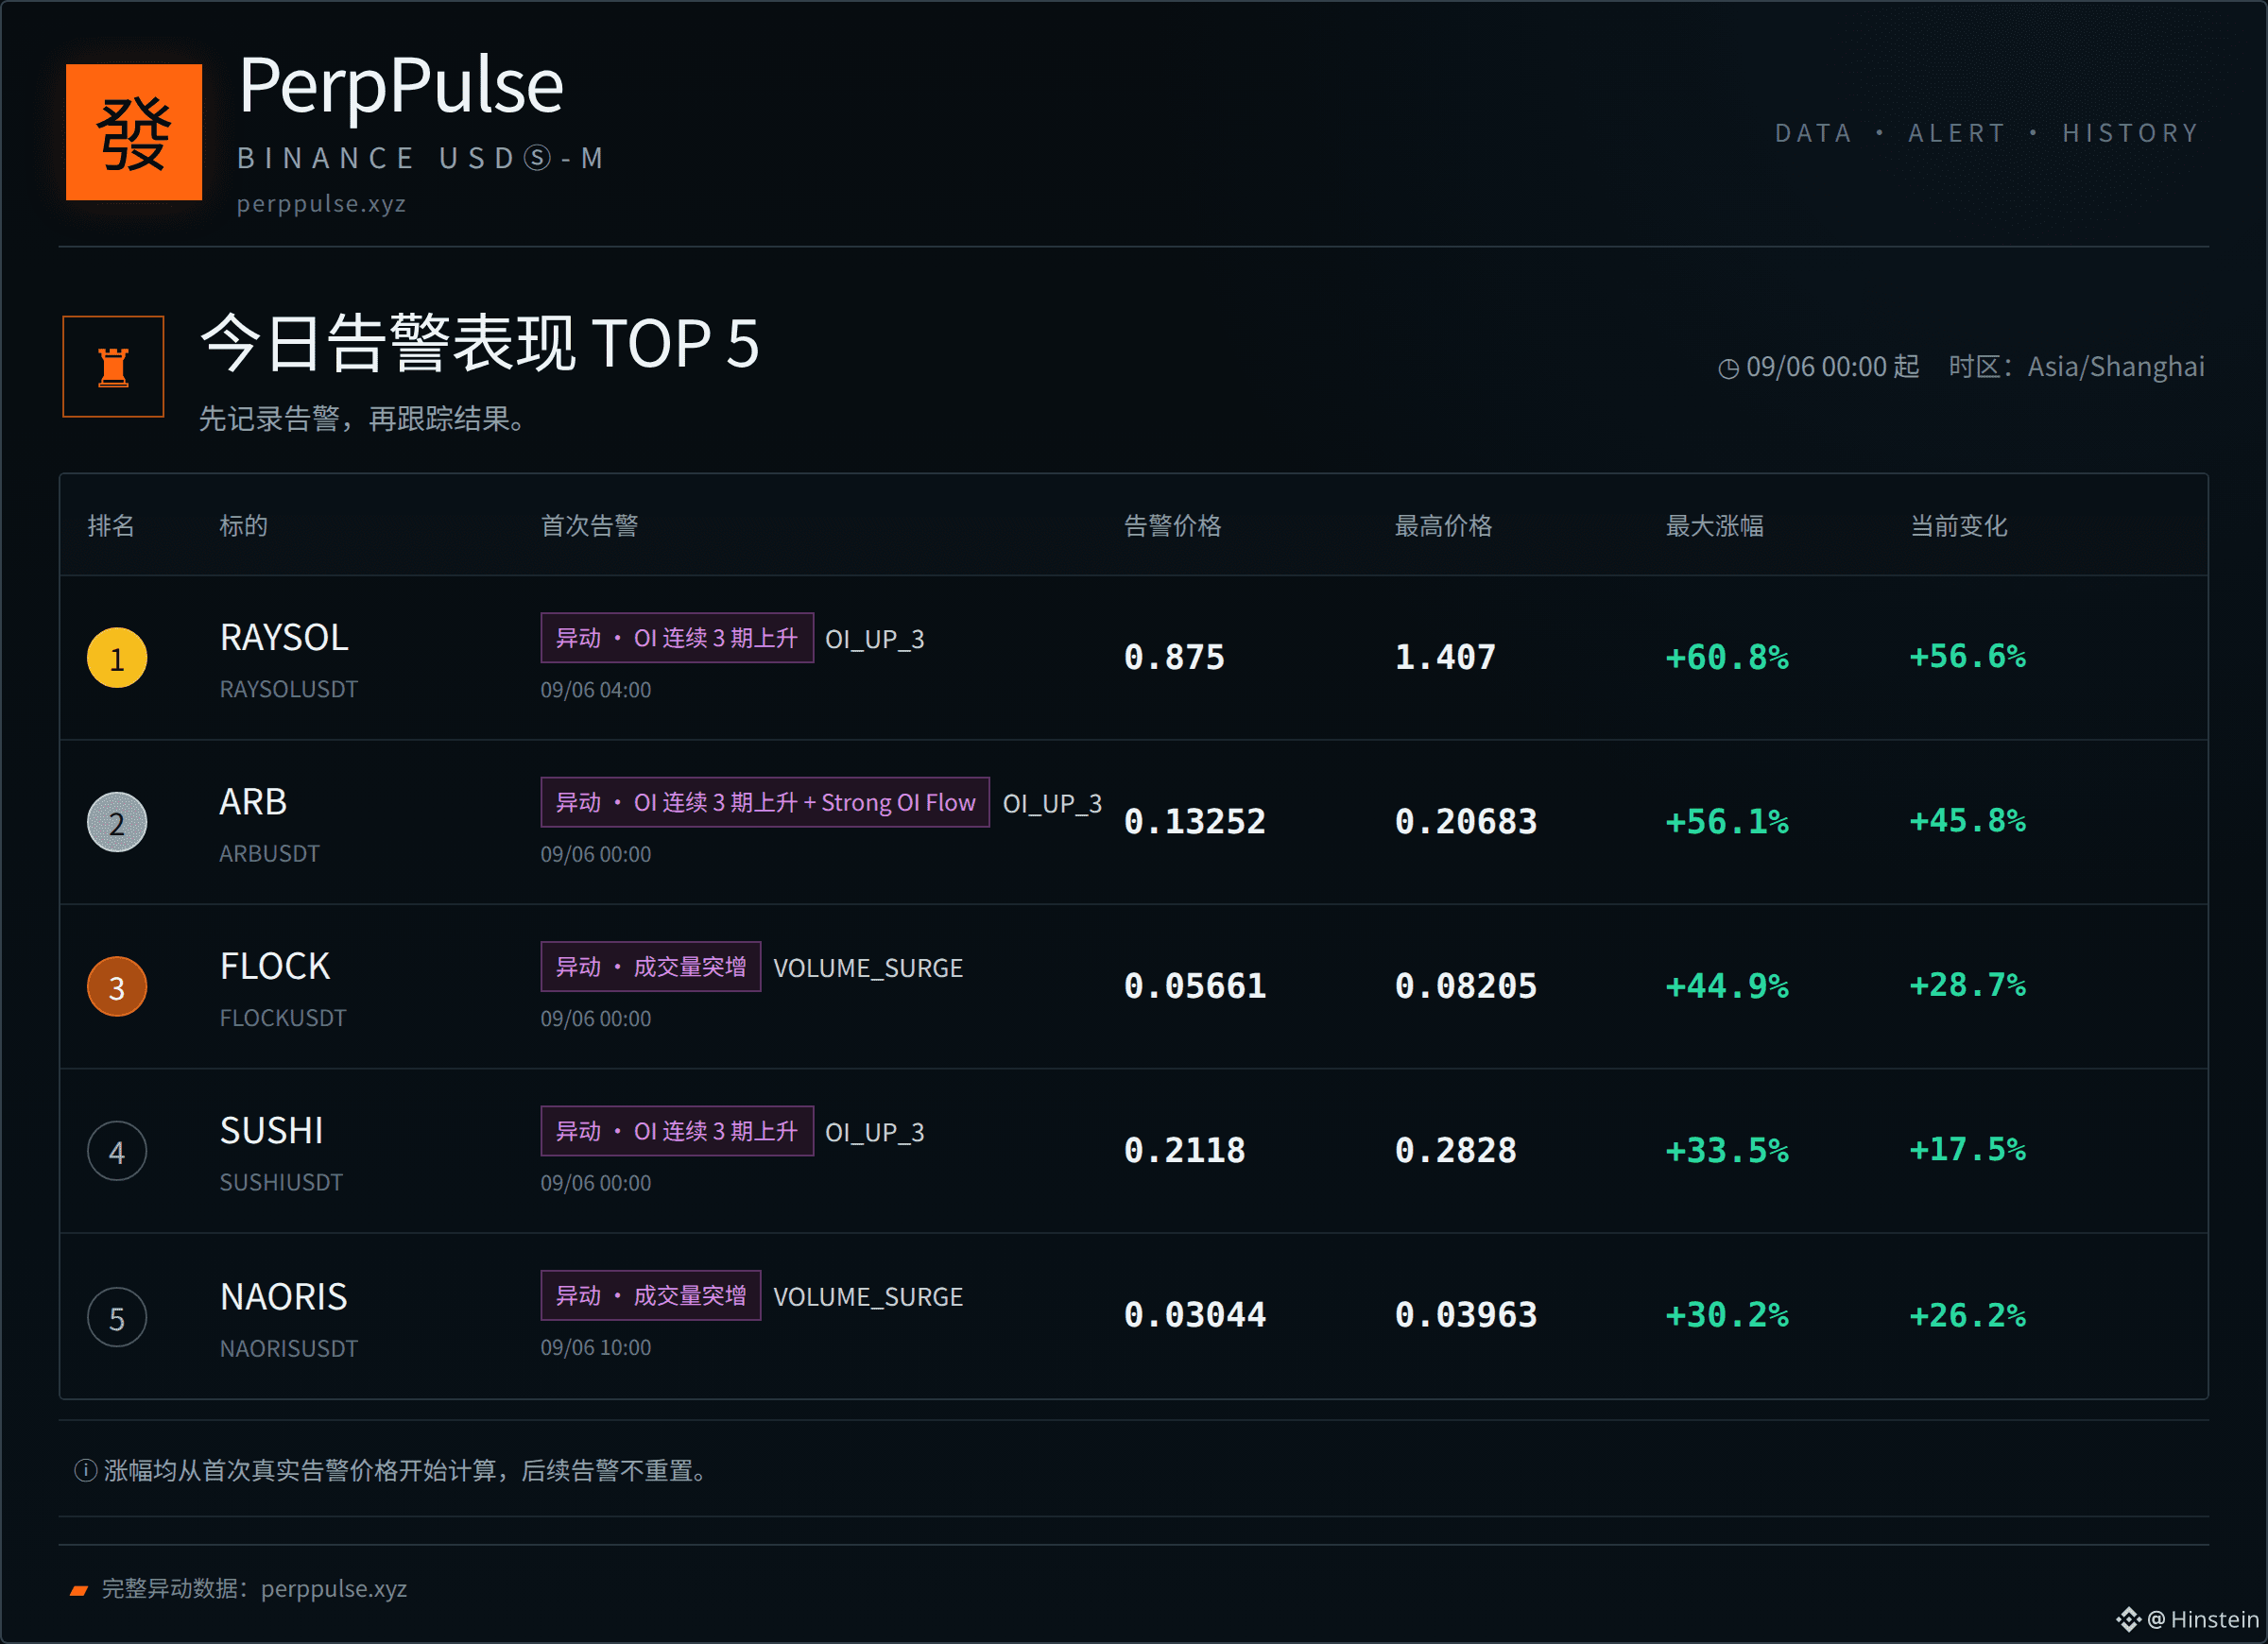
📊 今日异动表现榜
1. $RAYSOL +60.8%
2. $ARB +56.1%
3. $FLOCK +44.9%
4. SUSHI +33.5%
5. NAORIS +30.2%
统计口径:当天首次有效告警 → 此后最高价格。
只记录市场留下的结果,不把历史最高变化当成交易收益。
#MarketMovers #CryptoData
完整异动数据:perppulse.xyz
📊 今日异动表现榜
1. $RAYSOL +60.8%
2. $ARB +56.1%
3. $FLOCK +44.9%
4. SUSHI +33.5%
5. NAORIS +30.2%
统计口径:当天首次有效告警 → 此后最高价格。
只记录市场留下的结果,不把历史最高变化当成交易收益。
#MarketMovers #CryptoData
完整异动数据:perppulse.xyz
1. $RAYSOL +60.8%
2. $ARB +56.1%
3. $FLOCK +44.9%
4. SUSHI +33.5%
5. NAORIS +30.2%
统计口径:当天首次有效告警 → 此后最高价格。
只记录市场留下的结果,不把历史最高变化当成交易收益。
#MarketMovers #CryptoData
完整异动数据:perppulse.xyz
38
·
--
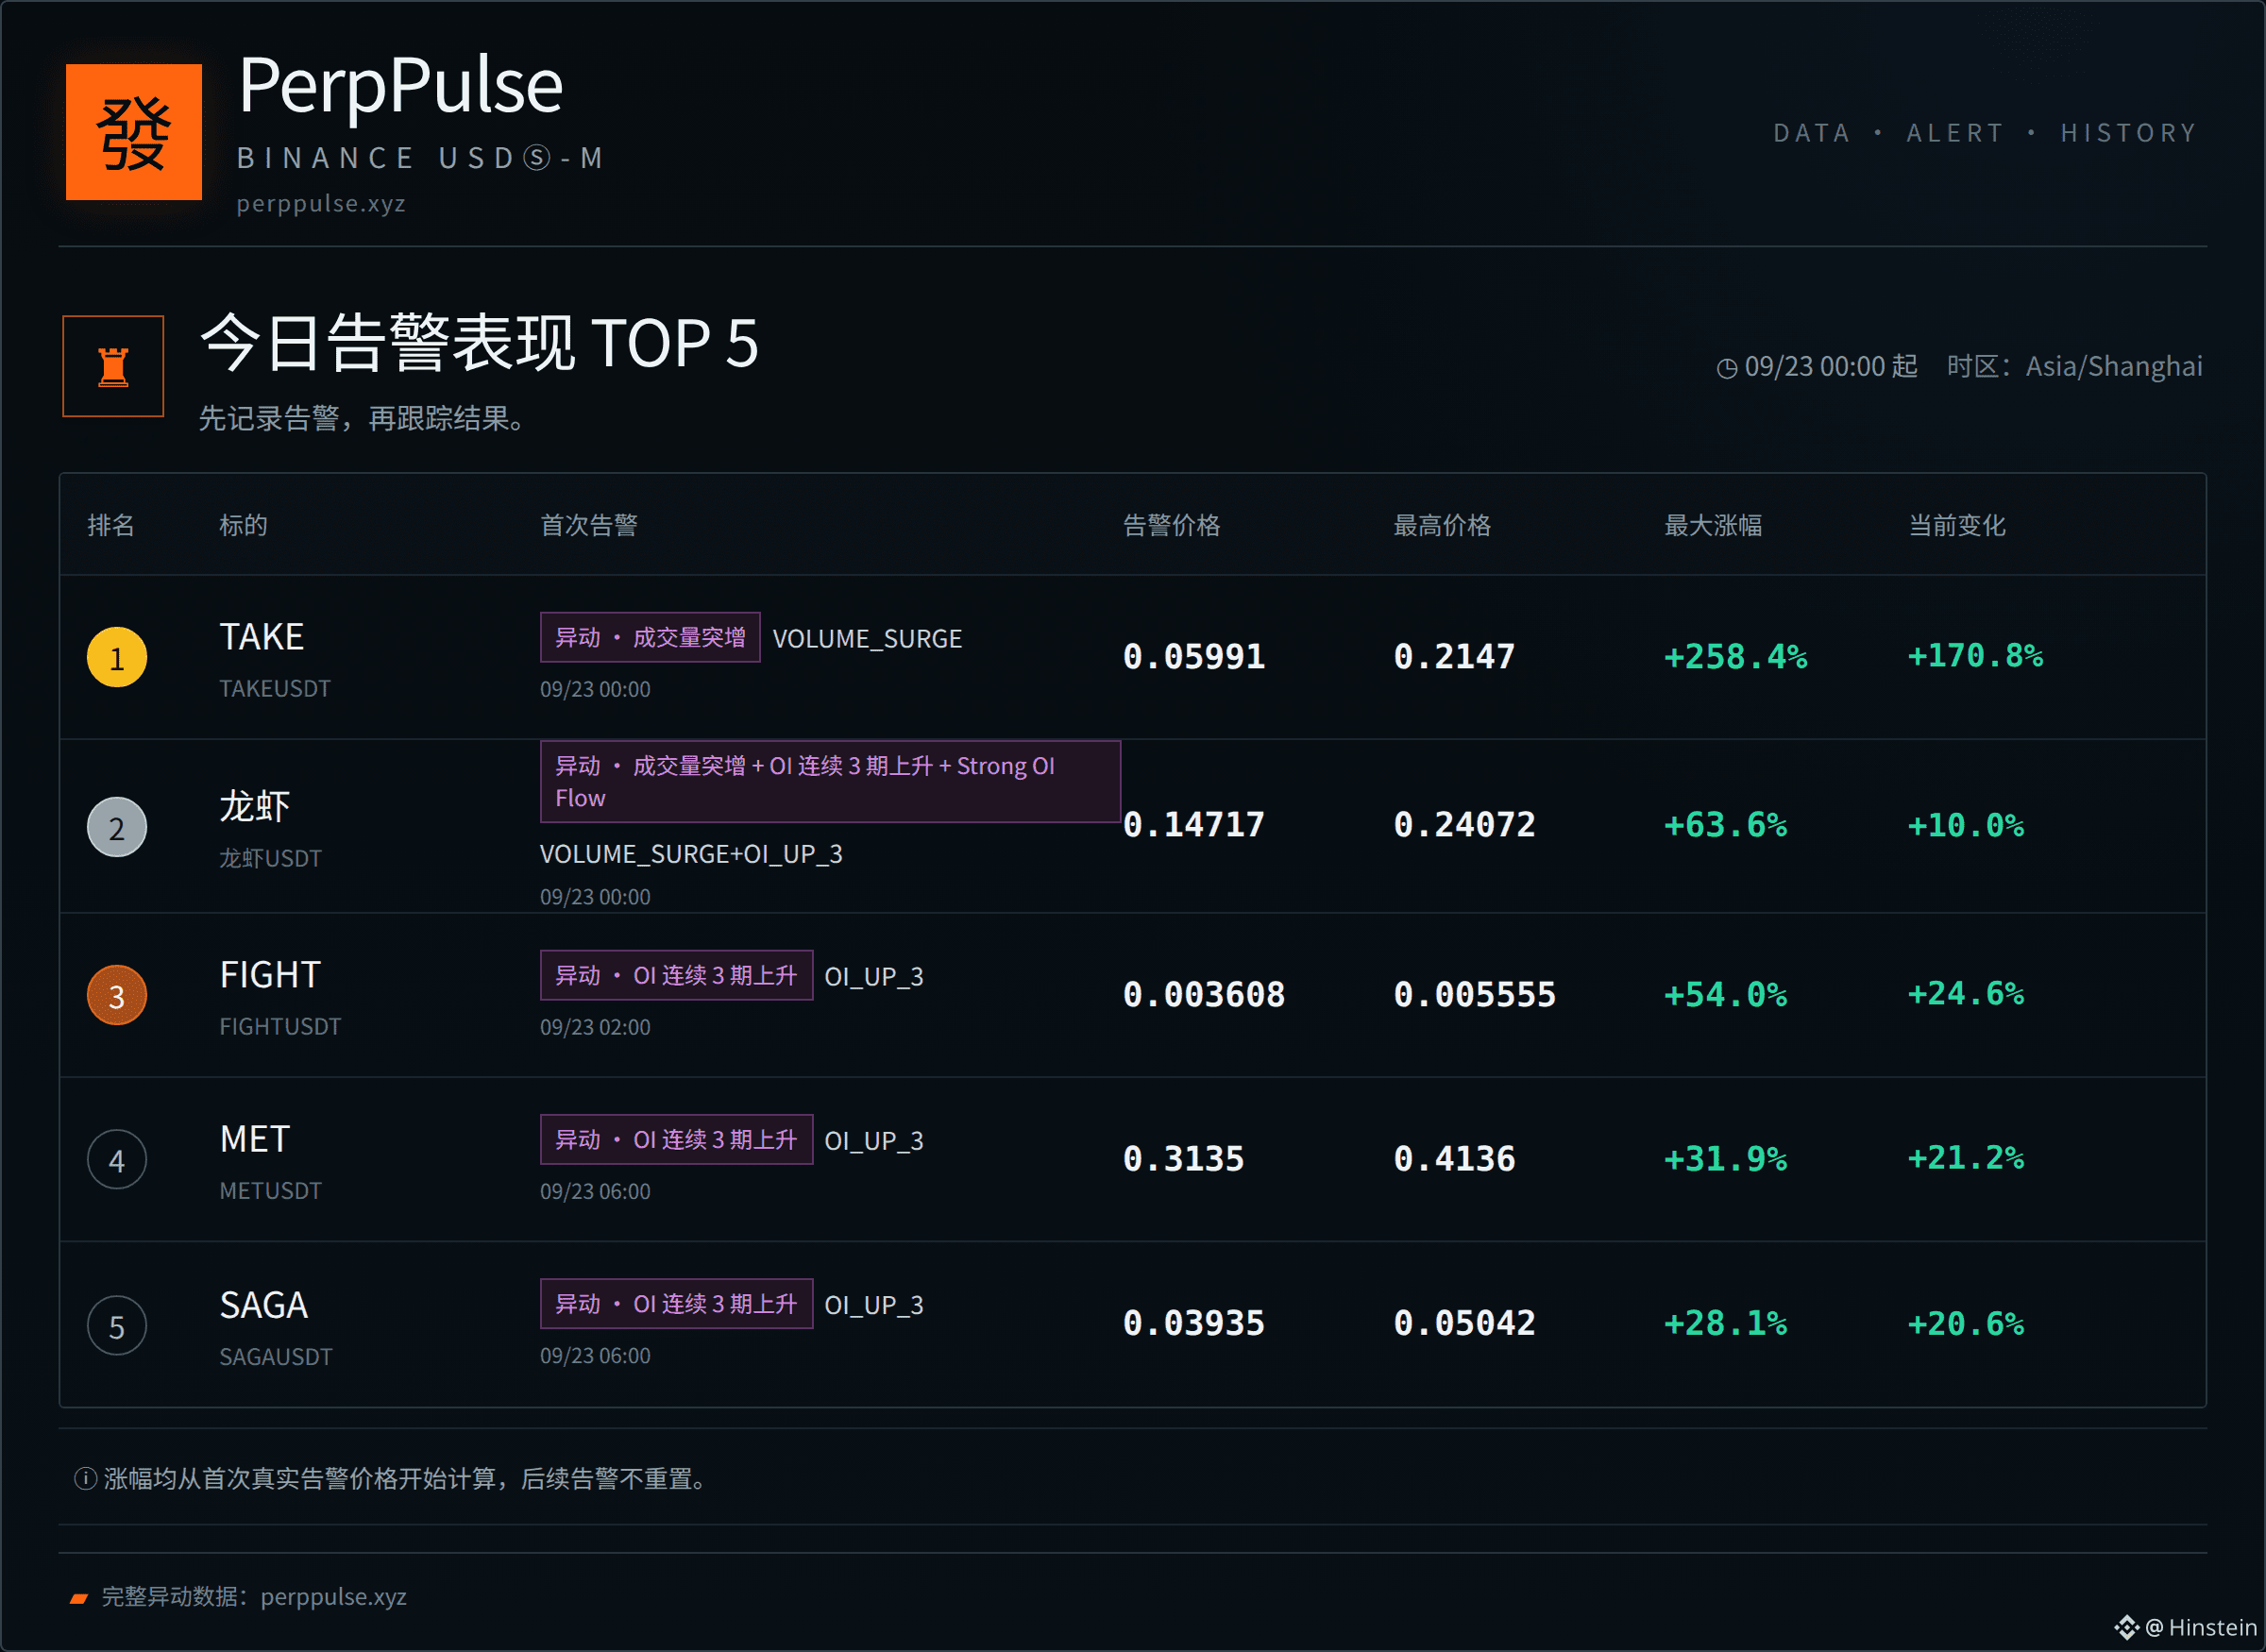
📊 今日异动表现榜
1. $TAKE +258.4%
2. $龙虾 +63.6%
3. $FIGHT +54.0%
4. $MET +31.9%
5. SAGA +28.1%
统计口径:当天首次有效告警 → 此后最高价格。
只记录市场留下的结果,不把历史最高变化当成交易收益。
#MarketMovers #CryptoData
完整异动数据:perppulse.xyz
📊 今日异动表现榜
1. $TAKE +258.4%
2. $龙虾 +63.6%
3. $FIGHT +54.0%
4. $MET +31.9%
5. SAGA +28.1%
统计口径:当天首次有效告警 → 此后最高价格。
只记录市场留下的结果,不把历史最高变化当成交易收益。
#MarketMovers #CryptoData
完整异动数据:perppulse.xyz
1. $TAKE +258.4%
2. $龙虾 +63.6%
3. $FIGHT +54.0%
4. $MET +31.9%
5. SAGA +28.1%
统计口径:当天首次有效告警 → 此后最高价格。
只记录市场留下的结果,不把历史最高变化当成交易收益。
#MarketMovers #CryptoData
完整异动数据:perppulse.xyz
56

📊 Volume Composition: Breaking Down $59.8B in Daily Trades
On July 11, 2026, total crypto volume of $59.81B reveals clear patterns. $USDT accounts for the majority at $39.27B, while $BTC follows with $23.46B in trading activity across exchanges.
Among volatile assets, $ETH leads with $7.44B in 24-hour volume. The distribution shows exactly where market attention and liquidity are concentrated today.
Understanding volume composition helps traders identify the most active markets with the best execution quality.
📌 Key Takeaway:
Volume composition reveals market focus: stablecoins dominate the majority, ETH leads volatile asset trading.
#Volume #MarketAnalysis #CryptoData
#BinanceAlphaAlert
1
82
·
--
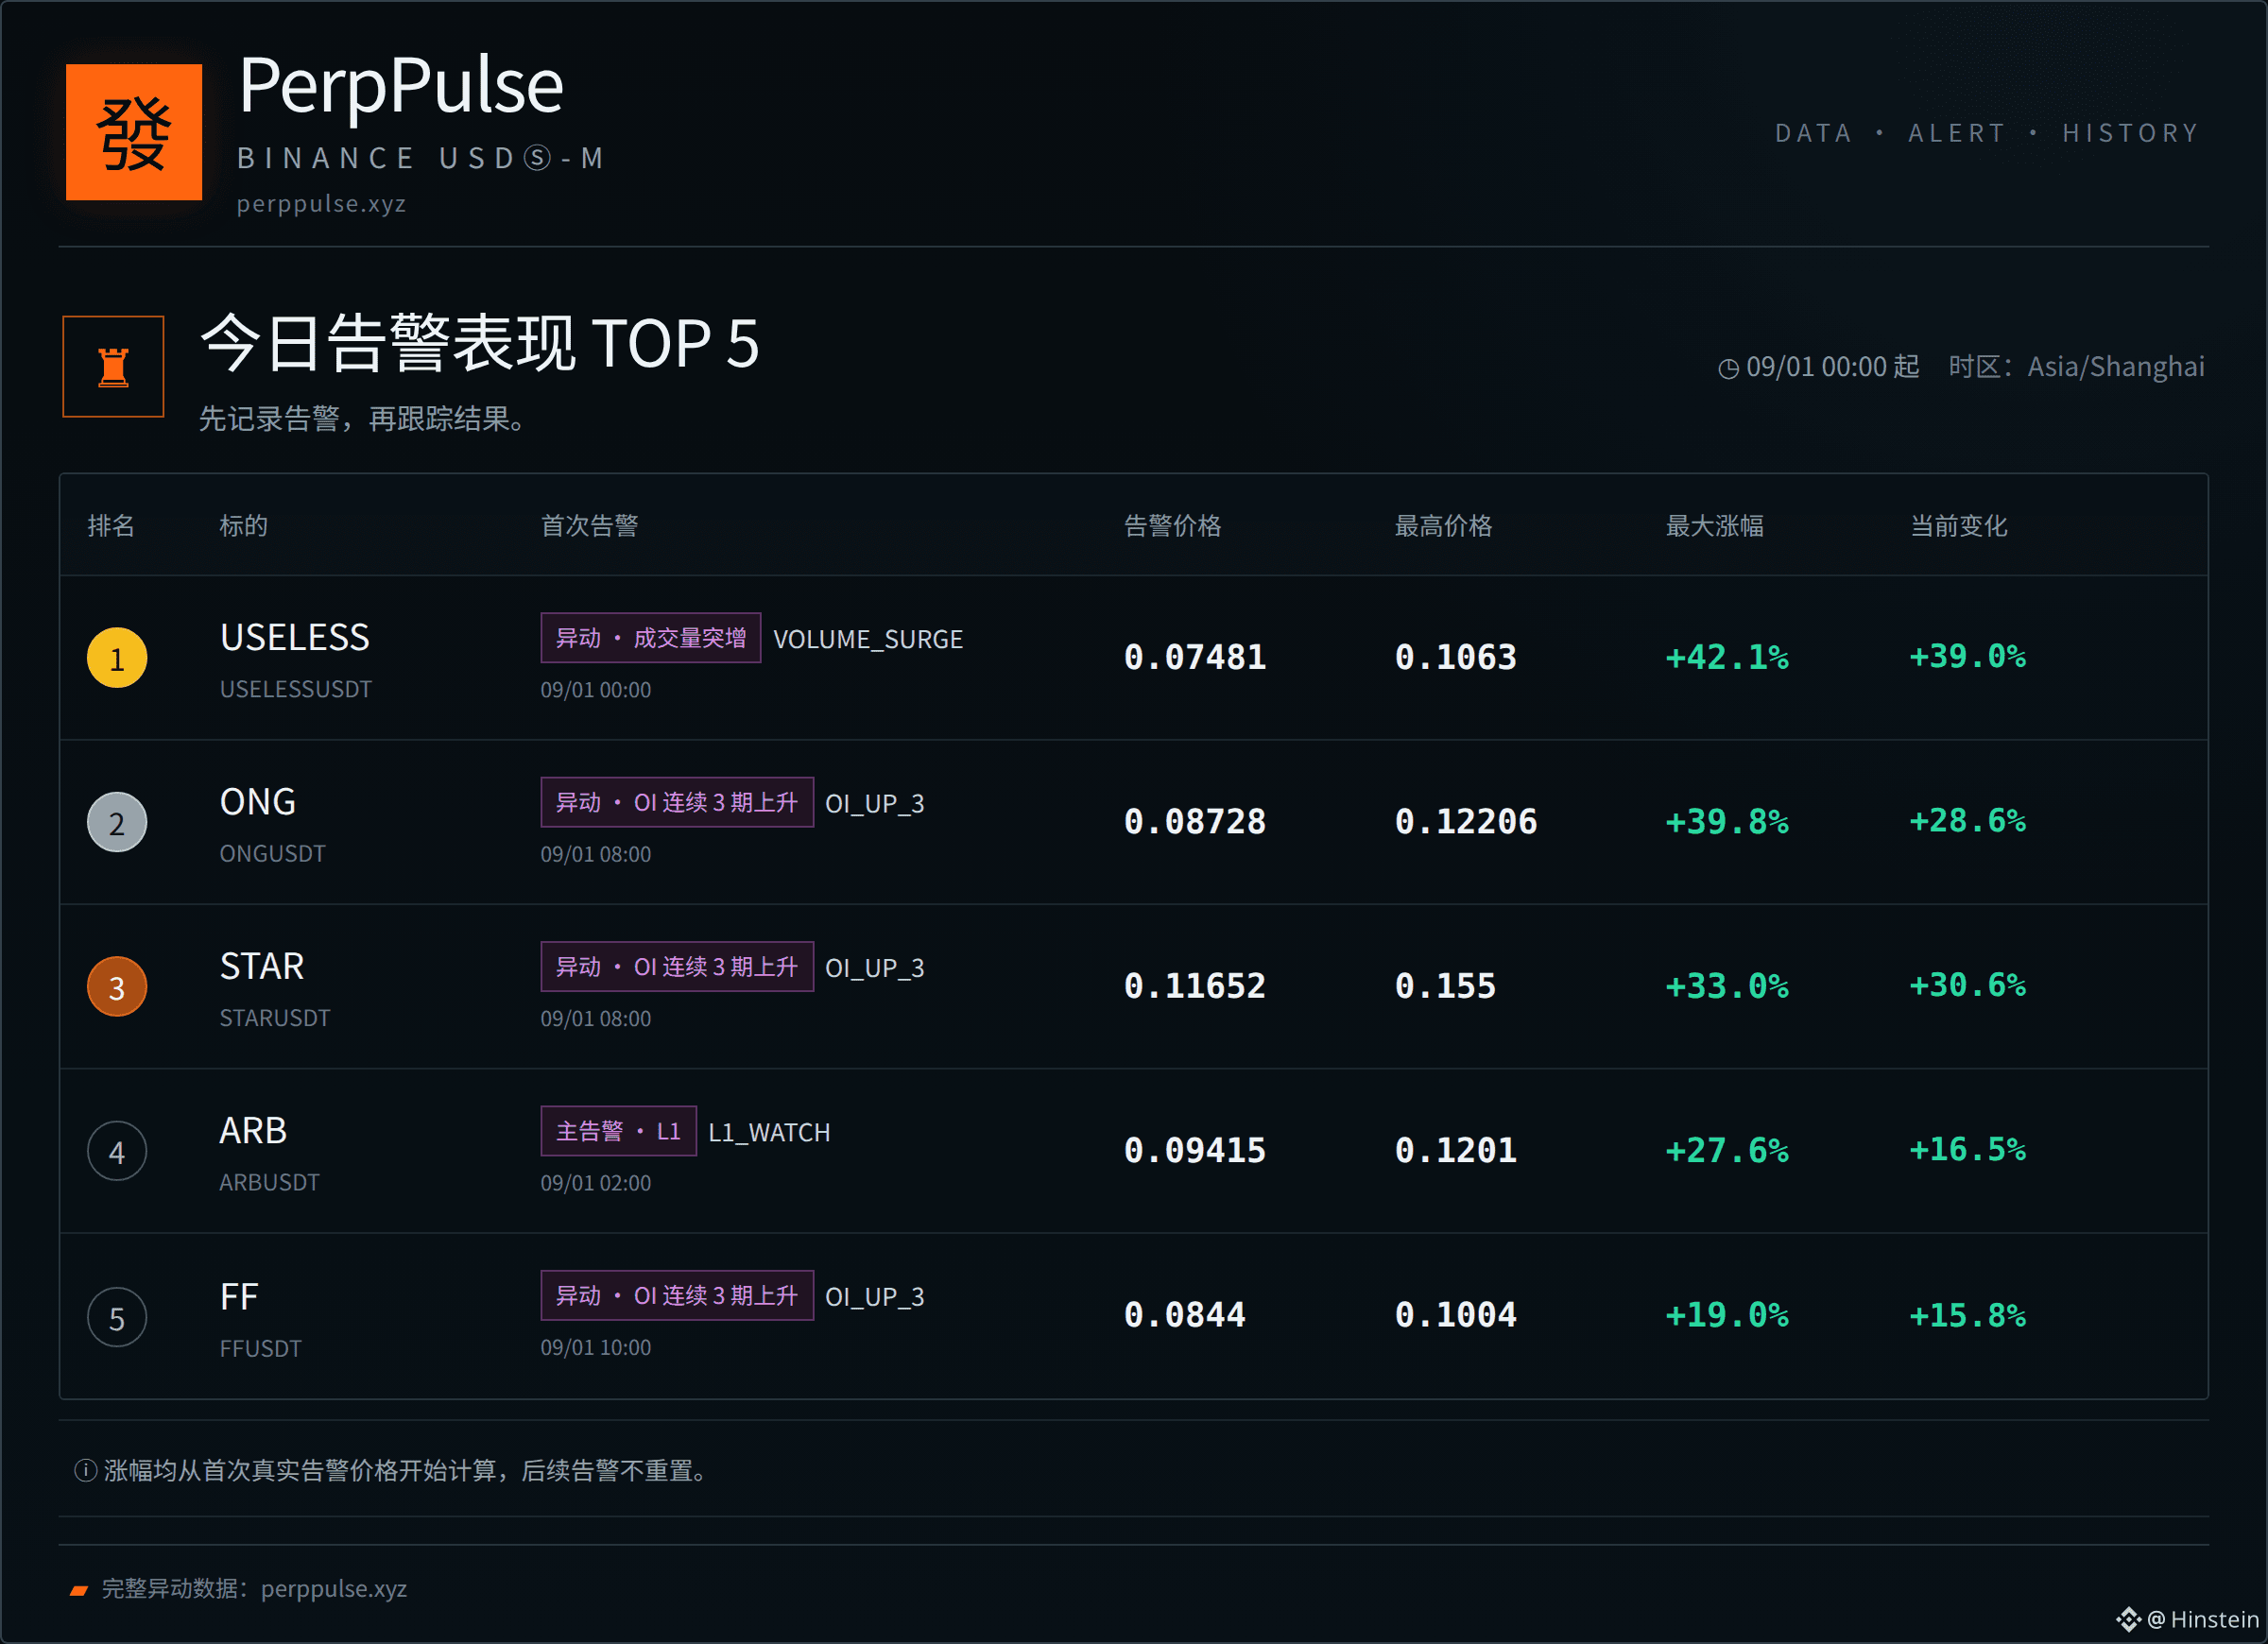
📊 今日异动表现榜
1. $USELESS +42.1%
2. $ONG +39.8%
3. $STAR +33.0%
4. ARB +27.6%
5. FF +19.0%
统计口径:当天首次有效告警 → 此后最高价格。
只记录市场留下的结果,不把历史最高变化当成交易收益。
#MarketMovers #CryptoData
完整异动数据:perppulse.xyz
📊 今日异动表现榜
1. $USELESS +42.1%
2. $ONG +39.8%
3. $STAR +33.0%
4. ARB +27.6%
5. FF +19.0%
统计口径:当天首次有效告警 → 此后最高价格。
只记录市场留下的结果,不把历史最高变化当成交易收益。
#MarketMovers #CryptoData
完整异动数据:perppulse.xyz
1. $USELESS +42.1%
2. $ONG +39.8%
3. $STAR +33.0%
4. ARB +27.6%
5. FF +19.0%
统计口径:当天首次有效告警 → 此后最高价格。
只记录市场留下的结果,不把历史最高变化当成交易收益。
#MarketMovers #CryptoData
完整异动数据:perppulse.xyz
29

·
--
උසබ තත්ත්වය
What the data actually shows during today's Iran-driven selloff
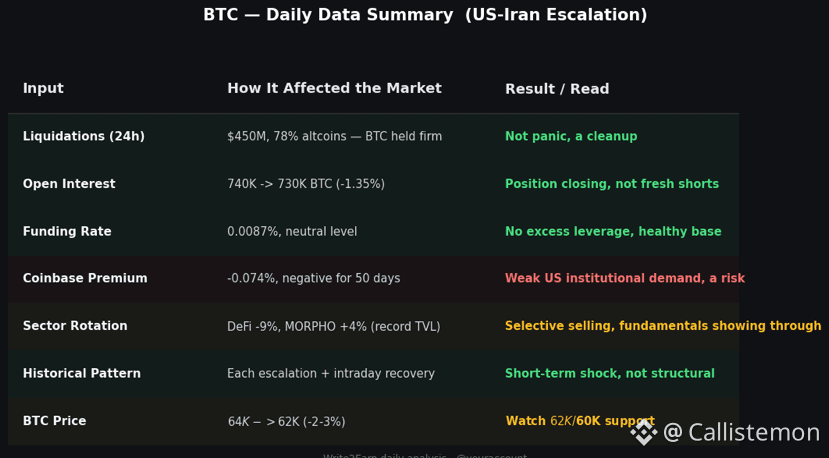
Everyone's posting "BTC is down" today. Here's what's actually happening underneath that headline.
Liquidations: $450M, but 78% of it was altcoins. BTC pairs only accounted for ~$100M. JUP, ETHFI and PUMP fell 5.5-9.3%. SOL wiped out its entire July rally. This wasn't a Bitcoin-led crash — it was a leverage flush concentrated in the riskiest corner of the market.
Open interest is falling, not rising. BTC futures OI dropped from 740K to 730K BTC in 24h. That matters: falling OI alongside falling price means real position-closing, not fresh short-building. Traders aren't piling on bearish bets, they're stepping to the sidelines. That's a meaningfully different setup than a shorting cascade.
Sector rotation wasn't uniform. DeFi took the hardest hit at -9%, while other sectors ranged -1% to -7%. But MORPHO bucked the entire trend, up 4% on a record 4M ETH in TVL — fundamentals outrunning fear, even on a red day.
History rhymes here. Each Iran escalation in 2026 has cost the market 2-5% and triggered a liquidation spike (Jun 28 IRGC strikes: $934M liquidated, BTC below $73K). But de-escalation headlines have reversed those moves within days, not weeks — the "peace deal" three weeks ago saw $150M in shorts squeezed as BTC reclaimed $65-66K almost immediately.
The demand backdrop underneath all of this: Coinbase Premium has now been negative for 50 straight days — the longest streak on record — signaling persistently weak US institutional buying even before today's news.
None of this predicts tomorrow. But it's a more complete picture than "number go down."
#BTC #CryptoData #OnChain
9
7
9.7k
·
--
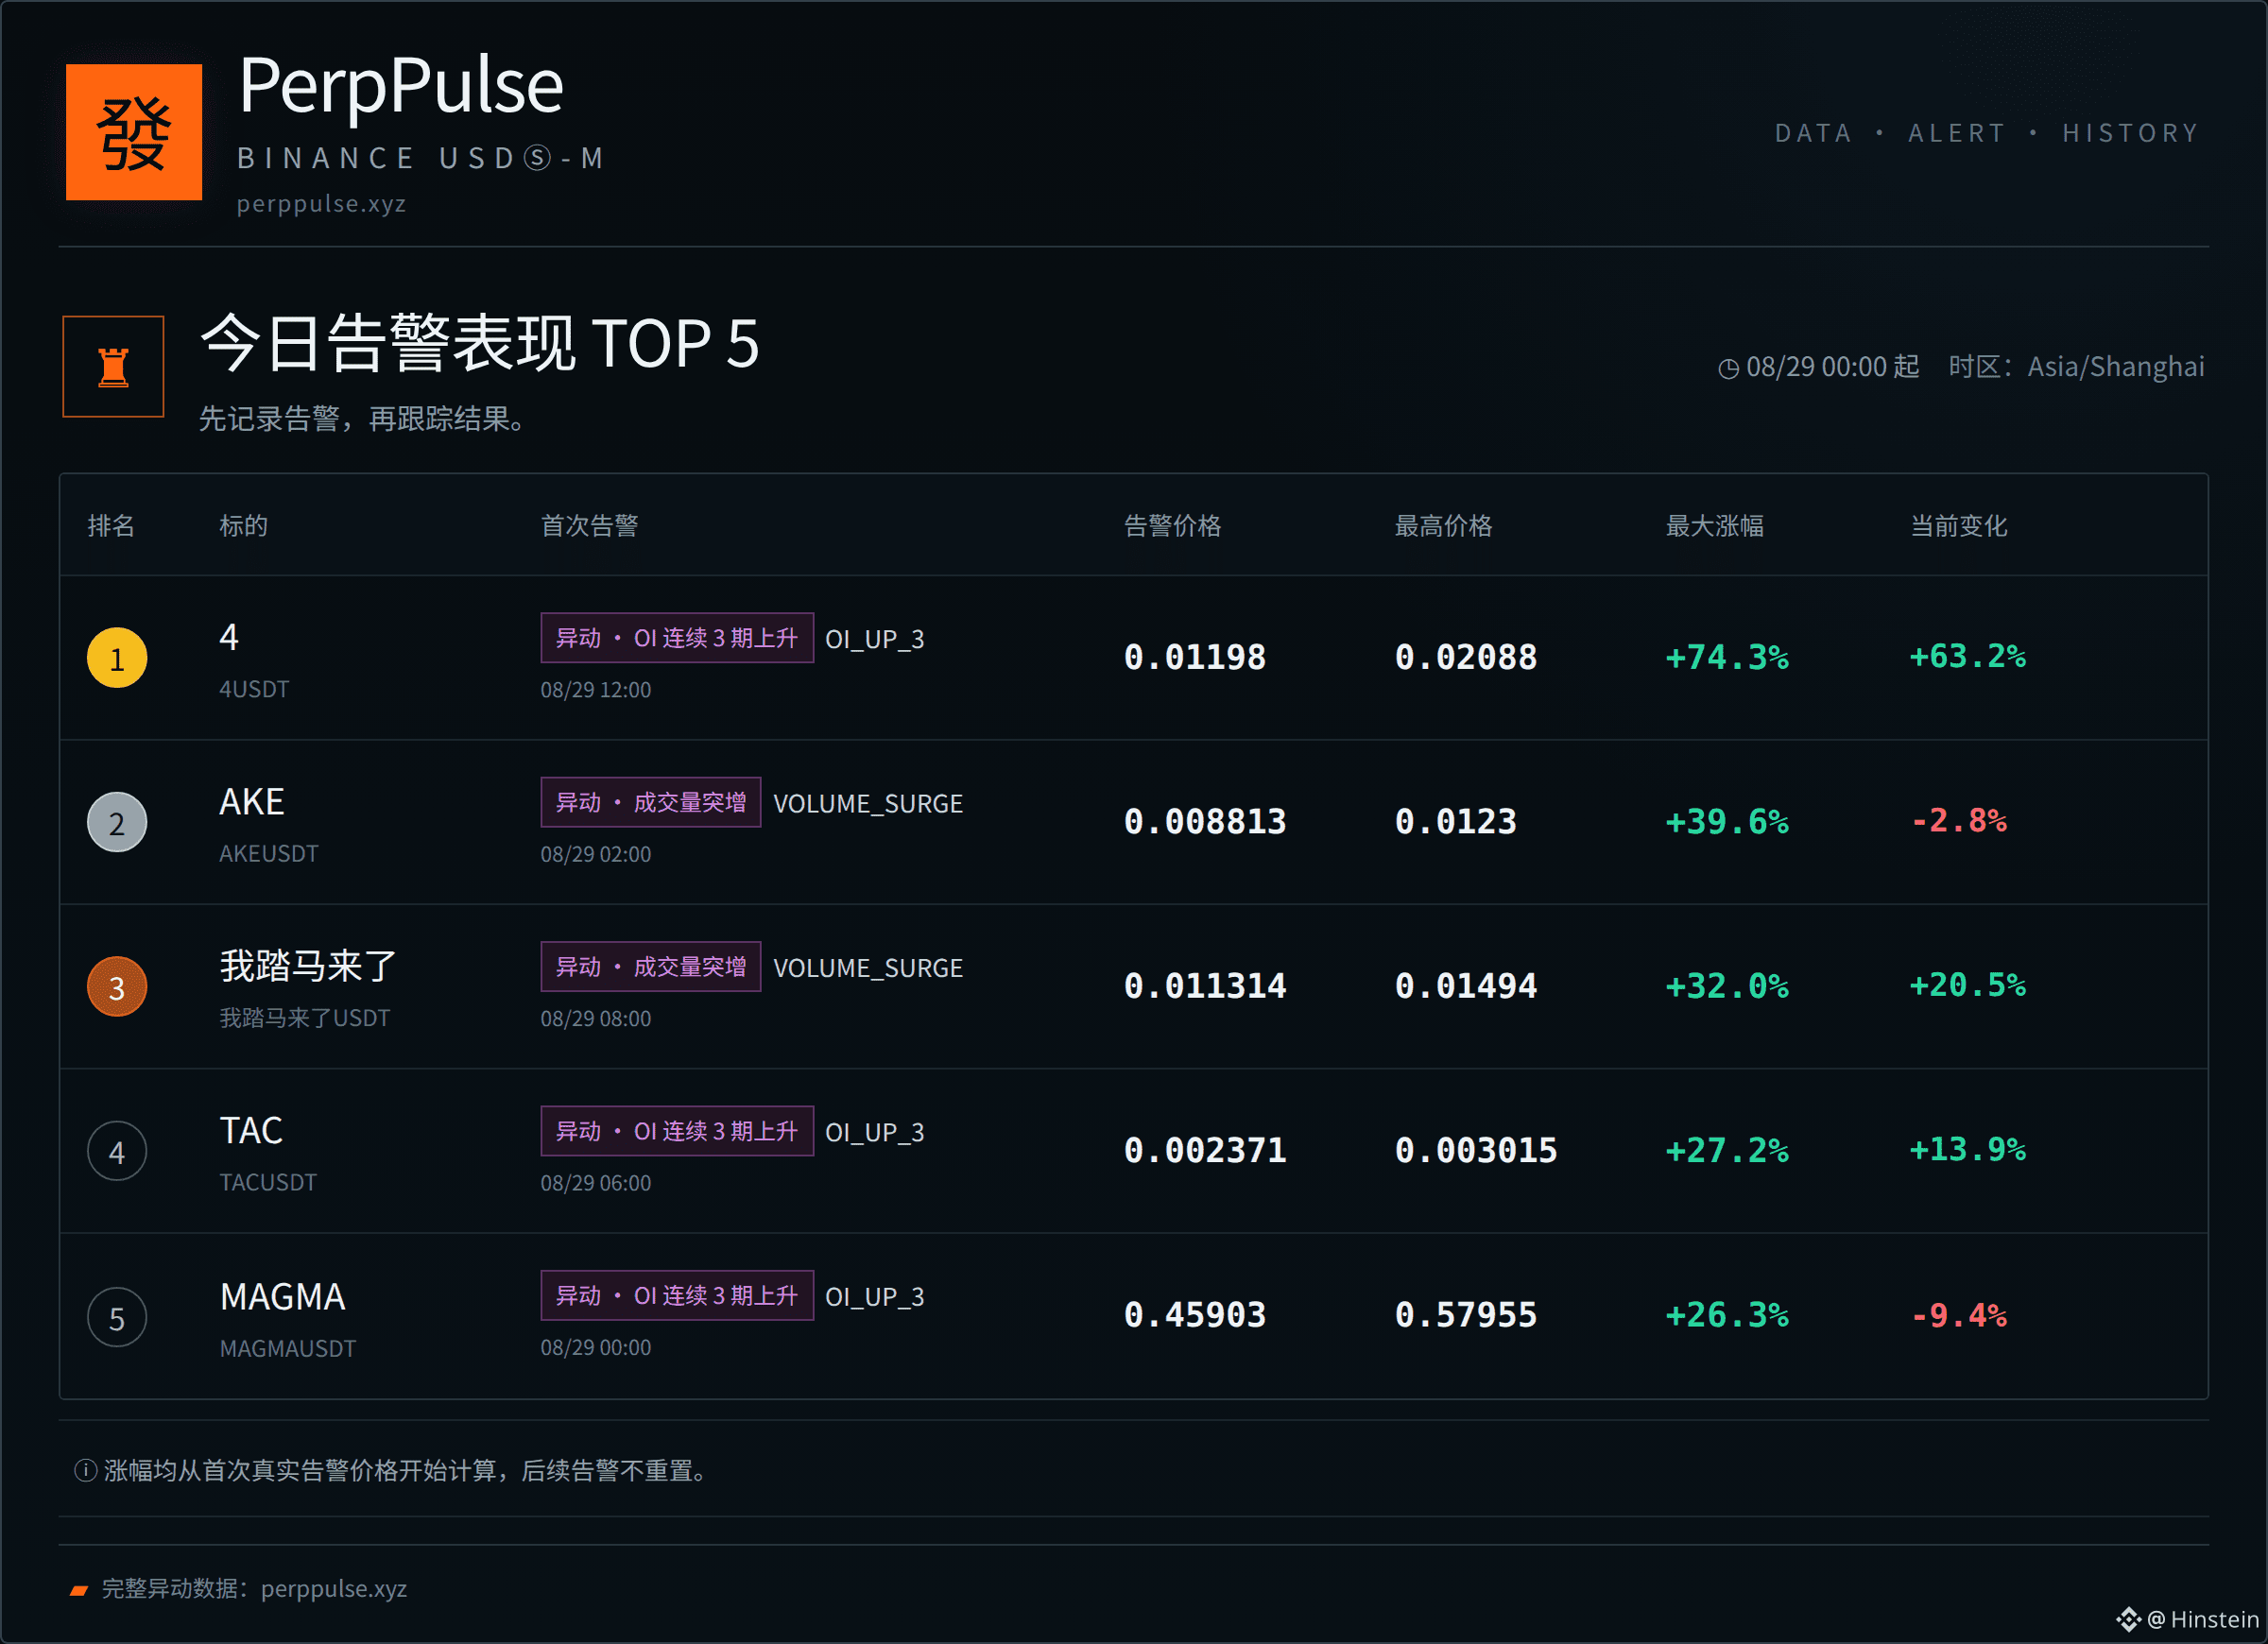
📊 今日异动表现榜
1. $4 +74.3%
2. $AKE +39.6%
3. $我踏马来了 +32.0%
4. $TAC +27.2%
5. $MAGMA +26.3%
统计口径:当天首次有效告警 → 此后最高价格。
只记录市场留下的结果,不把历史最高变化当成交易收益。
#MarketMovers #CryptoData
完整异动数据:perppulse.xyz
📊 今日异动表现榜
1. $4 +74.3%
2. $AKE +39.6%
3. $我踏马来了 +32.0%
4. $TAC +27.2%
5. $MAGMA +26.3%
统计口径:当天首次有效告警 → 此后最高价格。
只记录市场留下的结果,不把历史最高变化当成交易收益。
#MarketMovers #CryptoData
完整异动数据:perppulse.xyz
1. $4 +74.3%
2. $AKE +39.6%
3. $我踏马来了 +32.0%
4. $TAC +27.2%
5. $MAGMA +26.3%
统计口径:当天首次有效告警 → 此后最高价格。
只记录市场留下的结果,不把历史最高变化当成交易收益。
#MarketMovers #CryptoData
完整异动数据:perppulse.xyz
77

·
--
Seeing the newest hdw-crypto-data package land on PyPI makes me think about how quickly the data pipeline for crypto is maturing. The library pulls raw streams from Binance Vision and the regular REST endpoints, then normalizes timestamps, formats and fills missing fields. For traders who rely on clean OHLCV or order‑book snapshots, that removes a lot of manual wrangling and reduces the chance of silent bugs in back‑tests. It also bundles verification steps, so you can be sure the data hasn't been altered in transit – a small but meaningful step toward reproducible research.
Do you think easier access to verified Binance data will level the playing field for retail algo traders, or will it simply accelerate the arms race among larger firms?
#CryptoData #BinanceTools #AlgoTrading #GAMERXERO
Do you think easier access to verified Binance data will level the playing field for retail algo traders, or will it simply accelerate the arms race among larger firms?
#CryptoData #BinanceTools #AlgoTrading #GAMERXERO


29
තවත් අන්තර්ගතයන් ගවේෂණය කිරීමට ඇතුල් වන්න
Binance චතුරශ්රය හි ගෝලීය ක්රිප්ටෝ පරිශීලකයින් හා එක්වන්න
⚡️ ක්රිප්ටෝ පිළිබඳ නවතම සහ ප්රයෝජනවත් තොරතුරු ලබා ගන්න.
💬 ලොව විශාලතම ක්රිප්ටෝ හුවමාරුව මගින් විශ්වාස කෙරේ.
👍 සත්යායනය කරන ලද නිර්මාණකරුවන්ගෙන් සැබෑ විදසුන් සොයා ගන්න.
විද්යුත් තැපෑල / දුරකථන අංකය
නැගී එන මාතෘකා
1
#BinancePick
3.3M නැරඹීම්
161,452 සාකච්ඡා කරමින්
2
#EarningsSeason
5.4M නැරඹීම්
26,534 සාකච්ඡා කරමින්
3
#StrategySkipsBitcoinPurchasesSpends$205MOnSTRCBuybacks
56 නැරඹීම්
6 සාකච්ඡා කරමින්
4
#BitmineAdds10452ETH
3,875 නැරඹීම්
102 සාකච්ඡා කරමින්
5
#SouthKoreaConsidersEducationTaxOnCryptoExchanges
3,837 නැරඹීම්
96 සාකච්ඡා කරමින්
6
#OCCUrgesCommunityBanksToEnterStablecoinPayments
3,121 නැරඹීම්
63 සාකච්ඡා කරමින්
7
#RippleWinsFullApprovalAsNationalTrustBank
2,872 නැරඹීම්
64 සාකච්ඡා කරමින්
8
#AkashSelectsSolanaAsMigrationTarget
1,235 නැරඹීම්
24 සාකච්ඡා කරමින්
9
#OndoToOpenSubscriptionsForOpenAIPreIPOTokenizedNotes
110 නැරඹීම්
7 සාකච්ඡා කරමින්
10
#AnthropicTTMRevenueGrewAbout1200%
51,483 නැරඹීම්
537 සාකච්ඡා කරමින්