
Callistemon
553 පෝස්ටු

Callistemon
වාර්තා කරන්න
පරිශීලක අවහිර කරන්න
Investor/Trader/Architect
153 හඹා යමින්
4.1K+ හඹා යන්නන්
7.4K+ කැමති විය
පෝස්ටු
සියල්ල
උපුටා දැක්වීම්
වීඩියෝ
·
--
උසබ තත්ත්වය
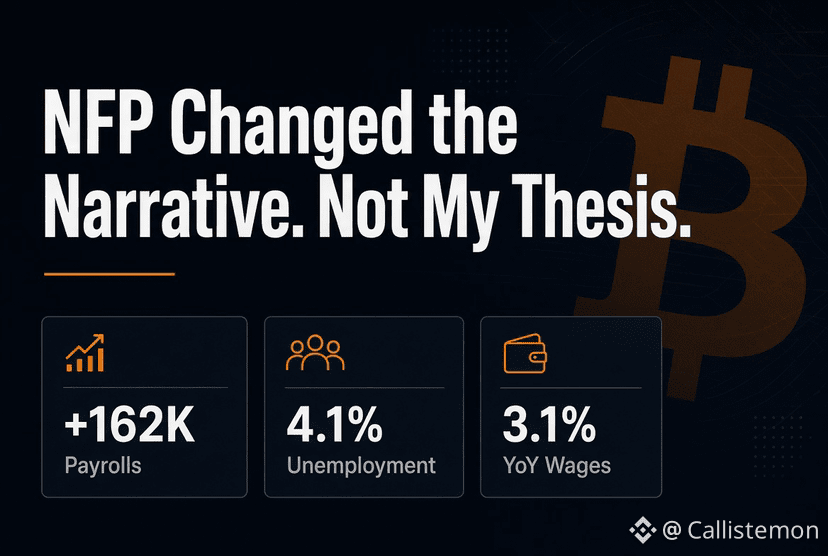
NFP روایتத்தை மாற்றியது. என் تھیஸிஸ் அல்ல.
Binance Square-இல் இருந்து ஒரு மாதம் விடுப்பு எடுத்தேன்.
சந்தை நகர்ந்தது.
என் تھیஸிஸ் நகரவில்லை.
ஆகஸ்ட் ஊதியப் பட்டியல் +162K ஆக வந்தது. வேலையின்மை 4.1%ல் நிலைத்தது.
ஊதிய வளர்ச்சி YoY-க்கு 3.1% என கட்டுப்பாட்டில் இருந்தது.
ஆம், இந்த வெளியீடு Fed-க்கு எதிராக hawkish-ஆ இருக்கிறது.
இல்லை, உடைந்த பொருளாதாரம் ஒன்றைக் காணவில்லை.
ஊதிய அழுத்தம் இன்னும் கட்டுப்பாட்டில் இருக்கும்போது, வேலைவாய்ப்பு சந்தை இன்னும் நன்றாக தாங்கி நிற்கிறது என்பதைக் காண்கிறேன். அது முக்கியம்.
முந்தைய bull நிலைக்கு எல்லா macro எண்ணிக்கைகளும் dovish-ஆ வர வேண்டும் என்பதும் தேவையில்லை.
பொருளாதாரம் மந்தநிலைக்கு செல்லாமல் போதுமான வலுவாக இருக்க வேண்டும்; அதே சமயம் பணவீக்கம் இறுதியில் Fed-க்கு தளர்வு வழங்கும் அளவுக்கு குறைய வேண்டும்.
இப்போதைய நிலை:
வளர்ச்சி தாங்கி நிற்கிறது.
தொழில்/வேலை தாங்கி நிற்கிறது.
திரவத்தன்மை (liquidity) தான் இன்னும் பெரிய கேள்வி.
இன்னும் அதே இடத்தில். Bullish.
இந்த சுழற்சி தொடர முடியுமா என்பதல்ல இப்போது கேள்வி.
அடுத்த விரிவாக்கத்திற்கு முன், சந்தை எவ்வளவு macro அழுத்தத்தை உறிஞ்சிக்கொள்ள முடியும் என்பதே கேள்வி.
உங்கள் பார்வை என்ன?
Bullish சுழற்சியா அல்லது late-cycle trap-ஆ?
#NFP #macro $BTC
{future}(BTCUSDT)
NFP روایتத்தை மாற்றியது. என் تھیஸிஸ் அல்ல.
Binance Square-இல் இருந்து ஒரு மாதம் விடுப்பு எடுத்தேன்.
சந்தை நகர்ந்தது.
என் تھیஸிஸ் நகரவில்லை.
ஆகஸ்ட் ஊதியப் பட்டியல் +162K ஆக வந்தது. வேலையின்மை 4.1%ல் நிலைத்தது.
ஊதிய வளர்ச்சி YoY-க்கு 3.1% என கட்டுப்பாட்டில் இருந்தது.
ஆம், இந்த வெளியீடு Fed-க்கு எதிராக hawkish-ஆ இருக்கிறது.
இல்லை, உடைந்த பொருளாதாரம் ஒன்றைக் காணவில்லை.
ஊதிய அழுத்தம் இன்னும் கட்டுப்பாட்டில் இருக்கும்போது, வேலைவாய்ப்பு சந்தை இன்னும் நன்றாக தாங்கி நிற்கிறது என்பதைக் காண்கிறேன். அது முக்கியம்.
முந்தைய bull நிலைக்கு எல்லா macro எண்ணிக்கைகளும் dovish-ஆ வர வேண்டும் என்பதும் தேவையில்லை.
பொருளாதாரம் மந்தநிலைக்கு செல்லாமல் போதுமான வலுவாக இருக்க வேண்டும்; அதே சமயம் பணவீக்கம் இறுதியில் Fed-க்கு தளர்வு வழங்கும் அளவுக்கு குறைய வேண்டும்.
இப்போதைய நிலை:
வளர்ச்சி தாங்கி நிற்கிறது.
தொழில்/வேலை தாங்கி நிற்கிறது.
திரவத்தன்மை (liquidity) தான் இன்னும் பெரிய கேள்வி.
இன்னும் அதே இடத்தில். Bullish.
இந்த சுழற்சி தொடர முடியுமா என்பதல்ல இப்போது கேள்வி.
அடுத்த விரிவாக்கத்திற்கு முன், சந்தை எவ்வளவு macro அழுத்தத்தை உறிஞ்சிக்கொள்ள முடியும் என்பதே கேள்வி.
உங்கள் பார்வை என்ன?
Bullish சுழற்சியா அல்லது late-cycle trap-ஆ?
#NFP #macro $BTC
Binance Square-இல் இருந்து ஒரு மாதம் விடுப்பு எடுத்தேன்.
சந்தை நகர்ந்தது.
என் تھیஸிஸ் நகரவில்லை.
ஆகஸ்ட் ஊதியப் பட்டியல் +162K ஆக வந்தது. வேலையின்மை 4.1%ல் நிலைத்தது.
ஊதிய வளர்ச்சி YoY-க்கு 3.1% என கட்டுப்பாட்டில் இருந்தது.
ஆம், இந்த வெளியீடு Fed-க்கு எதிராக hawkish-ஆ இருக்கிறது.
இல்லை, உடைந்த பொருளாதாரம் ஒன்றைக் காணவில்லை.
ஊதிய அழுத்தம் இன்னும் கட்டுப்பாட்டில் இருக்கும்போது, வேலைவாய்ப்பு சந்தை இன்னும் நன்றாக தாங்கி நிற்கிறது என்பதைக் காண்கிறேன். அது முக்கியம்.
முந்தைய bull நிலைக்கு எல்லா macro எண்ணிக்கைகளும் dovish-ஆ வர வேண்டும் என்பதும் தேவையில்லை.
பொருளாதாரம் மந்தநிலைக்கு செல்லாமல் போதுமான வலுவாக இருக்க வேண்டும்; அதே சமயம் பணவீக்கம் இறுதியில் Fed-க்கு தளர்வு வழங்கும் அளவுக்கு குறைய வேண்டும்.
இப்போதைய நிலை:
வளர்ச்சி தாங்கி நிற்கிறது.
தொழில்/வேலை தாங்கி நிற்கிறது.
திரவத்தன்மை (liquidity) தான் இன்னும் பெரிய கேள்வி.
இன்னும் அதே இடத்தில். Bullish.
இந்த சுழற்சி தொடர முடியுமா என்பதல்ல இப்போது கேள்வி.
அடுத்த விரிவாக்கத்திற்கு முன், சந்தை எவ்வளவு macro அழுத்தத்தை உறிஞ்சிக்கொள்ள முடியும் என்பதே கேள்வி.
உங்கள் பார்வை என்ன?
Bullish சுழற்சியா அல்லது late-cycle trap-ஆ?
#NFP #macro $BTC
1
93
·
--
උසබ තත්ත්වය
ONDO அமைப்பில் இப்போது விஷயம் சுவாரஸ்யமாகிறது
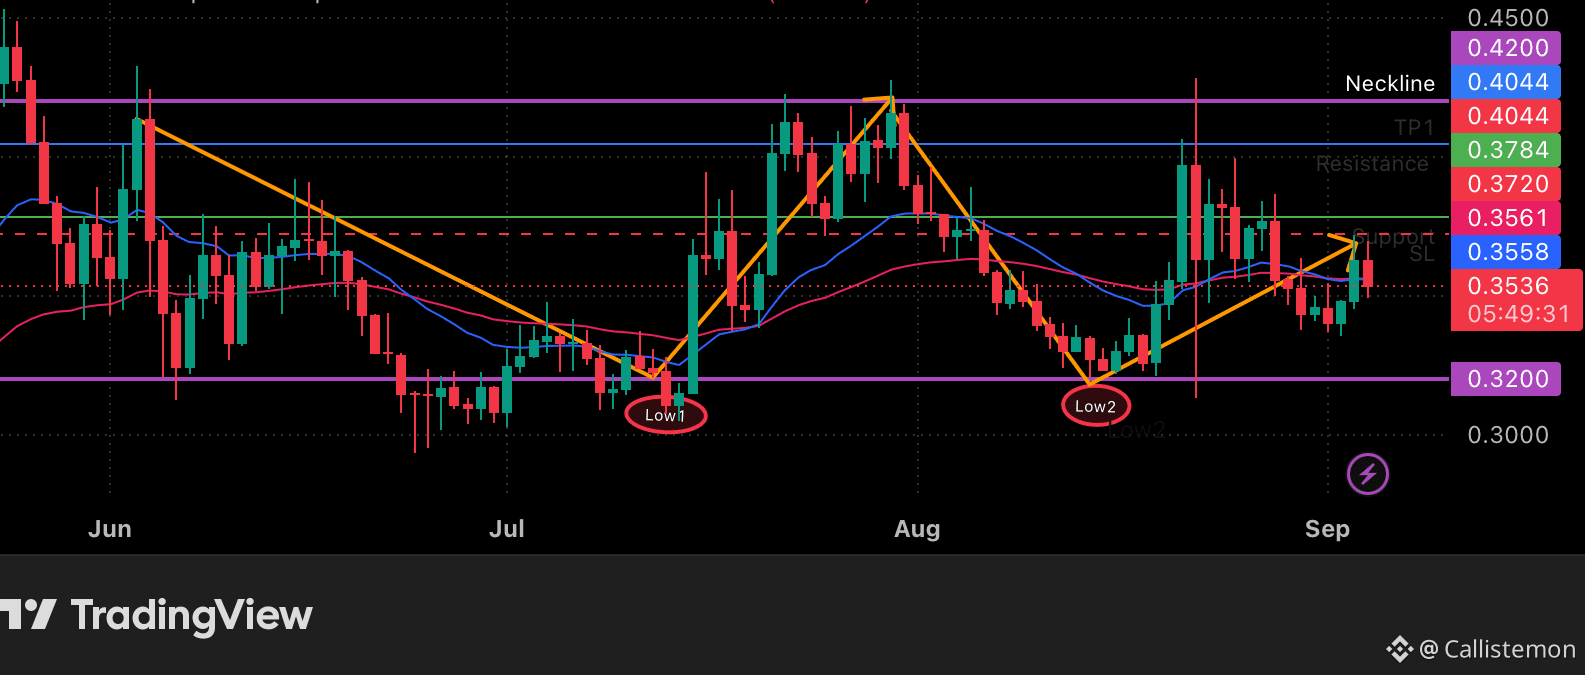
$ONDO தினசரி கட்டப்படத்தில் ஒரு சாத்தியமான டபுள்-பாட்டம் கட்டமைப்பை உருவாக்கி வருகிறது.
முதல் தாழ்வு சுமார் $0.32 அருகில் உருவானது.
இரண்டாவது தாழ்வு அதே பகுதியை பிடித்திருந்தது.
இப்போது விலை சுமார் $0.35-ல் உள்ளது; முக்கிய எதிர்ப்பு $0.3784 ஆகவும், நெக்லைன் $0.4044 ஆகவும் உள்ளது.
இந்த கட்டமைப்பு எளிமையானது:
$0.32: டபுள்-பாட்டம் ஆதரவு
$0.355–0.378: தற்போதைய ஒருங்கிணைவு / எதிர்ப்பு பகுதி
$0.4044: நெக்லைன்
$0.4200: முதல் மேலே செல்லும் இலக்கு
முக்கியமானது, அந்த பேட்டர்ன் தானா என்பதல்ல.
உறுதி (confirmation) தான்.
$0.4044 க்கு மேல் தினசரி முடிவு (daily close) வந்தால், அது அந்த கட்டமைப்பை நிறைவு செய்து, ONDO-வை accumulation-இலிருந்து expansion-க்கு நகர்த்தக்கூடும்.
அதுவரை, இது வெறும் ஒரு அமைப்பு (setup) மட்டுமே.
நீங்கள் breakout-ஐ வர்த்தகம் செய்வீர்களா — அல்லது நெக்லைன் மீள்சோதனைக்கு காத்திருப்பீர்களா?
#ONDO #crypto
{future}(ONDOUSDT)
ONDO அமைப்பில் இப்போது விஷயம் சுவாரஸ்யமாகிறது
$ONDO தினசரி கட்டப்படத்தில் ஒரு சாத்தியமான டபுள்-பாட்டம் கட்டமைப்பை உருவாக்கி வருகிறது.
முதல் தாழ்வு சுமார் $0.32 அருகில் உருவானது.
இரண்டாவது தாழ்வு அதே பகுதியை பிடித்திருந்தது.
இப்போது விலை சுமார் $0.35-ல் உள்ளது; முக்கிய எதிர்ப்பு $0.3784 ஆகவும், நெக்லைன் $0.4044 ஆகவும் உள்ளது.
இந்த கட்டமைப்பு எளிமையானது:
$0.32: டபுள்-பாட்டம் ஆதரவு
$0.355–0.378: தற்போதைய ஒருங்கிணைவு / எதிர்ப்பு பகுதி
$0.4044: நெக்லைன்
$0.4200: முதல் மேலே செல்லும் இலக்கு
முக்கியமானது, அந்த பேட்டர்ன் தானா என்பதல்ல.
உறுதி (confirmation) தான்.
$0.4044 க்கு மேல் தினசரி முடிவு (daily close) வந்தால், அது அந்த கட்டமைப்பை நிறைவு செய்து, ONDO-வை accumulation-இலிருந்து expansion-க்கு நகர்த்தக்கூடும்.
அதுவரை, இது வெறும் ஒரு அமைப்பு (setup) மட்டுமே.
நீங்கள் breakout-ஐ வர்த்தகம் செய்வீர்களா — அல்லது நெக்லைன் மீள்சோதனைக்கு காத்திருப்பீர்களா?
#ONDO #crypto
$ONDO தினசரி கட்டப்படத்தில் ஒரு சாத்தியமான டபுள்-பாட்டம் கட்டமைப்பை உருவாக்கி வருகிறது.
முதல் தாழ்வு சுமார் $0.32 அருகில் உருவானது.
இரண்டாவது தாழ்வு அதே பகுதியை பிடித்திருந்தது.
இப்போது விலை சுமார் $0.35-ல் உள்ளது; முக்கிய எதிர்ப்பு $0.3784 ஆகவும், நெக்லைன் $0.4044 ஆகவும் உள்ளது.
இந்த கட்டமைப்பு எளிமையானது:
$0.32: டபுள்-பாட்டம் ஆதரவு
$0.355–0.378: தற்போதைய ஒருங்கிணைவு / எதிர்ப்பு பகுதி
$0.4044: நெக்லைன்
$0.4200: முதல் மேலே செல்லும் இலக்கு
முக்கியமானது, அந்த பேட்டர்ன் தானா என்பதல்ல.
உறுதி (confirmation) தான்.
$0.4044 க்கு மேல் தினசரி முடிவு (daily close) வந்தால், அது அந்த கட்டமைப்பை நிறைவு செய்து, ONDO-வை accumulation-இலிருந்து expansion-க்கு நகர்த்தக்கூடும்.
அதுவரை, இது வெறும் ஒரு அமைப்பு (setup) மட்டுமே.
நீங்கள் breakout-ஐ வர்த்தகம் செய்வீர்களா — அல்லது நெக்லைன் மீள்சோதனைக்கு காத்திருப்பீர்களா?
#ONDO #crypto
1
206
·
--
උසබ තත්ත්වය
LDO/USDT တစ်ခုခု တည်ဆောက်နေသည်
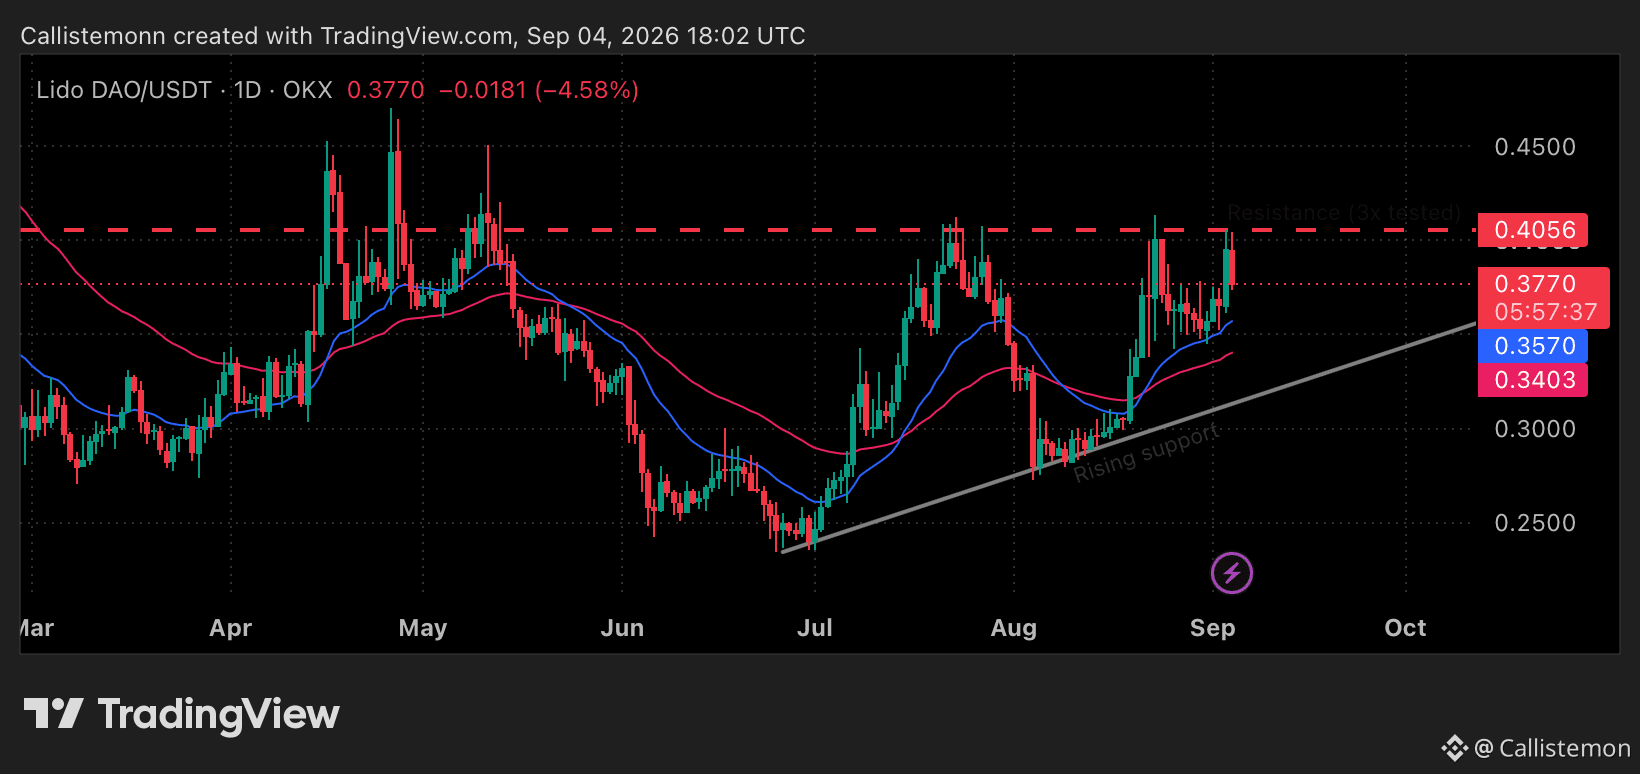
$LDO is $0.4056 မှာ ပြန်လည်ရောက်ရှိနေပြီ။
ဒီ ခုခံမှုက ဈေးနှုန်းကို သုံးကြိမ်တိုင်တိုင် ပြန်တားထားပြီးသားဖြစ်တယ်။
ဒါပေမယ့် ငါ သေချာကြည့်နေတဲ့ အချက်တစ်ခုရှိတယ်—
အဓိက ပြန်တားမှုတိုင်းနောက်မှာ ပိုမြင့်တဲ့ အနိမ့်အမှတ် (higher low) တစ်ခု ထွက်လာခဲ့တယ်။
အခုတော့ ဈေးနှုန်းက အောက်ပါအပေါ်မှာရှိနေပြီ—
20D MA: $0.3570
50D MA: $0.3403
တက်လာတဲ့ trendline
ဒါက စိတ်ဝင်စားစရာ ဖိနှိပ်မှု (compression) တစ်ခု ဖြစ်စေတယ်—
ခုခံမှုက တန်းတူအနေနဲ့ ရပ်တည်နေတယ်။
ထောက်ခံမှုက တက်လာနေတယ်။
အကယ်၍ $0.4056 ကို အားကောင်းတဲ့ နေ့စဉ်ပိတ် (strong daily close) တစ်ခုနဲ့ ချိုးဖျက်နိုင်ရင် ဖွဲ့စည်းပုံက ပြောင်းလဲသွားမယ်။
နောက်တစ်ကြိမ် ပြန်တားခဲ့ရင် $0.3570 → $0.3403 က ကြည့်ဖို့လိုတဲ့ နေရာ (area) ဖြစ်လာမယ်။
ဒါဆို ဘာအရင်ဖြစ်မလဲ?
4th rejection လား၊ breakout လား?
ငါက wick မဟုတ်ဘဲ ပိတ်စ (close) ကို ကြည့်နေတယ်။
#ldo #Crypto
{future}(LDOUSDT)
LDO/USDT တစ်ခုခု တည်ဆောက်နေသည်
$LDO is $0.4056 မှာ ပြန်လည်ရောက်ရှိနေပြီ။
ဒီ ခုခံမှုက ဈေးနှုန်းကို သုံးကြိမ်တိုင်တိုင် ပြန်တားထားပြီးသားဖြစ်တယ်။
ဒါပေမယ့် ငါ သေချာကြည့်နေတဲ့ အချက်တစ်ခုရှိတယ်—
အဓိက ပြန်တားမှုတိုင်းနောက်မှာ ပိုမြင့်တဲ့ အနိမ့်အမှတ် (higher low) တစ်ခု ထွက်လာခဲ့တယ်။
အခုတော့ ဈေးနှုန်းက အောက်ပါအပေါ်မှာရှိနေပြီ—
20D MA: $0.3570
50D MA: $0.3403
တက်လာတဲ့ trendline
ဒါက စိတ်ဝင်စားစရာ ဖိနှိပ်မှု (compression) တစ်ခု ဖြစ်စေတယ်—
ခုခံမှုက တန်းတူအနေနဲ့ ရပ်တည်နေတယ်။
ထောက်ခံမှုက တက်လာနေတယ်။
အကယ်၍ $0.4056 ကို အားကောင်းတဲ့ နေ့စဉ်ပိတ် (strong daily close) တစ်ခုနဲ့ ချိုးဖျက်နိုင်ရင် ဖွဲ့စည်းပုံက ပြောင်းလဲသွားမယ်။
နောက်တစ်ကြိမ် ပြန်တားခဲ့ရင် $0.3570 → $0.3403 က ကြည့်ဖို့လိုတဲ့ နေရာ (area) ဖြစ်လာမယ်။
ဒါဆို ဘာအရင်ဖြစ်မလဲ?
4th rejection လား၊ breakout လား?
ငါက wick မဟုတ်ဘဲ ပိတ်စ (close) ကို ကြည့်နေတယ်။
#ldo #Crypto
$LDO is $0.4056 မှာ ပြန်လည်ရောက်ရှိနေပြီ။
ဒီ ခုခံမှုက ဈေးနှုန်းကို သုံးကြိမ်တိုင်တိုင် ပြန်တားထားပြီးသားဖြစ်တယ်။
ဒါပေမယ့် ငါ သေချာကြည့်နေတဲ့ အချက်တစ်ခုရှိတယ်—
အဓိက ပြန်တားမှုတိုင်းနောက်မှာ ပိုမြင့်တဲ့ အနိမ့်အမှတ် (higher low) တစ်ခု ထွက်လာခဲ့တယ်။
အခုတော့ ဈေးနှုန်းက အောက်ပါအပေါ်မှာရှိနေပြီ—
20D MA: $0.3570
50D MA: $0.3403
တက်လာတဲ့ trendline
ဒါက စိတ်ဝင်စားစရာ ဖိနှိပ်မှု (compression) တစ်ခု ဖြစ်စေတယ်—
ခုခံမှုက တန်းတူအနေနဲ့ ရပ်တည်နေတယ်။
ထောက်ခံမှုက တက်လာနေတယ်။
အကယ်၍ $0.4056 ကို အားကောင်းတဲ့ နေ့စဉ်ပိတ် (strong daily close) တစ်ခုနဲ့ ချိုးဖျက်နိုင်ရင် ဖွဲ့စည်းပုံက ပြောင်းလဲသွားမယ်။
နောက်တစ်ကြိမ် ပြန်တားခဲ့ရင် $0.3570 → $0.3403 က ကြည့်ဖို့လိုတဲ့ နေရာ (area) ဖြစ်လာမယ်။
ဒါဆို ဘာအရင်ဖြစ်မလဲ?
4th rejection လား၊ breakout လား?
ငါက wick မဟုတ်ဘဲ ပိတ်စ (close) ကို ကြည့်နေတယ်။
#ldo #Crypto
240
·
--
උසබ තත්ත්වය
📊 $TAO Setup: AI ප්රවර්ග Flexing
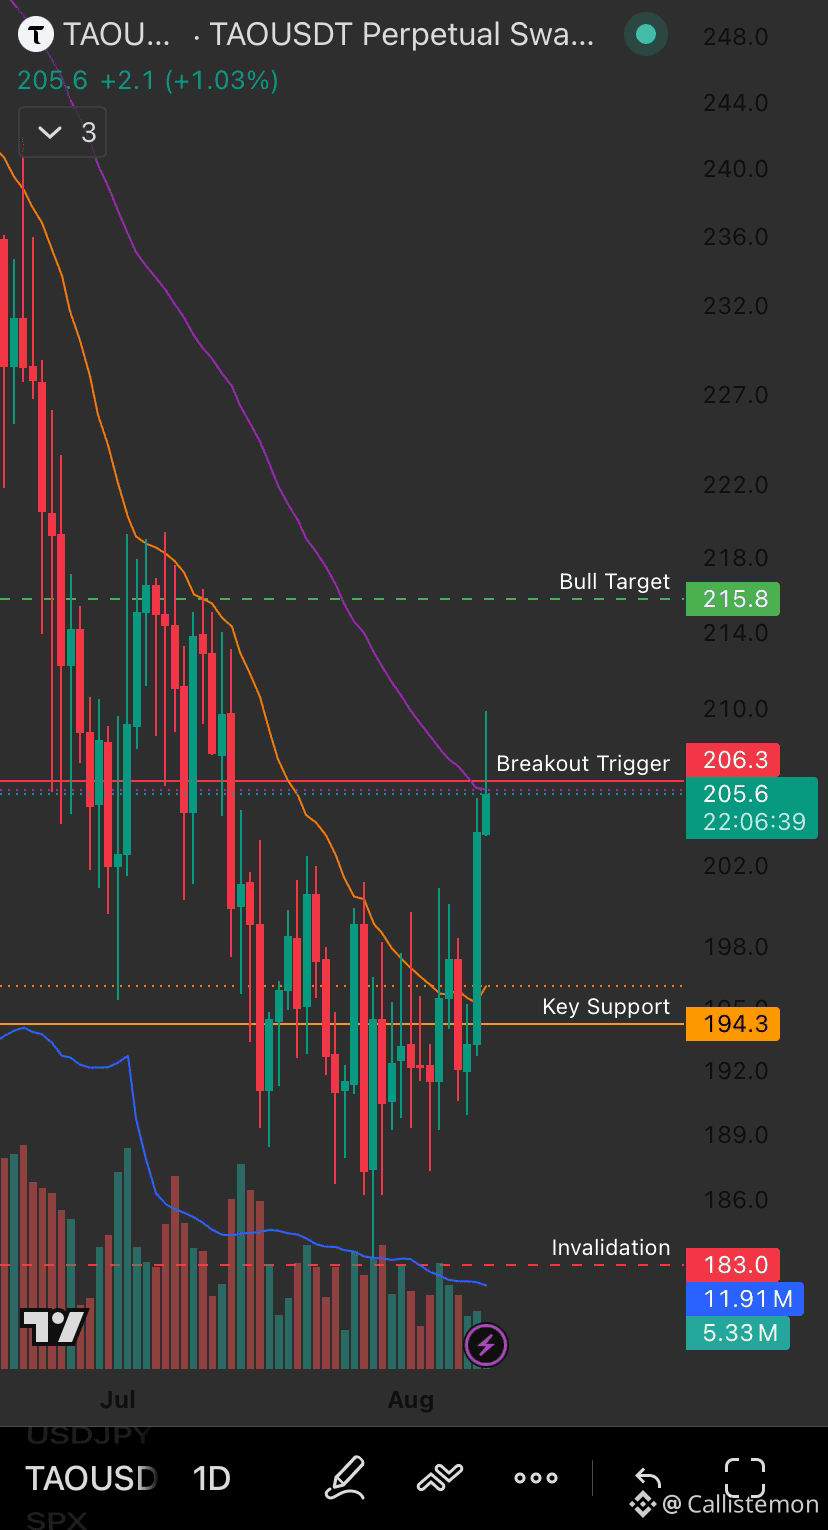
TAO මේ සතියේදී වඩාත් තියුණුම ගමනක් එකම மெහෙන් කට්ටකුඩු candle spike එකකින් $183 සිට $209.9 දක්වා ගොස් පසුව $205.7 හි consolidate වෙමින් තියෙනවා. ඒක තම 50-day EMA ($205.8) ට ඉතාමත් හරියටම මැදින් පිහිටලා වගේ සහ $206.3 හි Resistance එකට තරමක් පහළින් තියෙනවා.
මෙය බලාගෙන ඉන්න setup එකක් නෙවෙයි; සැබෑ තීරණ ලක්ෂ්යයක්:
🟢 Resistance: $206.3 හි volume-confirmed break එකක් මෙතැනින් සිදුවේ නම් continuation එකක් සංඥා කරයි; EMA50 දැනටම support ලෙස පහලින් ක්රියාත්මක වෙලා
🔴 Support: $194.3 නැති වුවහොත්, මේ මෑත breakout structure එක බිඳ දැමෙනවා
RSI 57.39 මට්ටමේ ස්ථිර momentum එකක් සමඟ ඉන්නවා—උස්සේ දිගු වීමක් (stretched) වගේද නැහැ. මිලදී ගන්නන් පාලනයේම ඉන්නවා නම් තව ඉඩක් තියෙනවා.
මේක සන්දර්භයට දාගෙන බලන්න වටිනවා: මේ සතියේ majors මිශ්ර වෙලා තිබුණත්, TAO වගේ AI-narrative tokens දැනටම සැබෑ relative strength පෙන්නුම් කරනවා. crypto හි ඊළඟ rotation story එක “AI infrastructure” නම්, ඒ නම් වලින් එකක් මෙය වගේම leading එකක්.
$206.3 හොඳින්ම clean ලෙස clear වෙනවද බලනවා. Nfa,Dyor තව කවුරු හරි මෙතැන position කරලාද? 👇
{future}(TAOUSDT)
📊 $TAO Setup: AI ප්රවර්ග Flexing
TAO මේ සතියේදී වඩාත් තියුණුම ගමනක් එකම மெහෙන් කට්ටකුඩු candle spike එකකින් $183 සිට $209.9 දක්වා ගොස් පසුව $205.7 හි consolidate වෙමින් තියෙනවා. ඒක තම 50-day EMA ($205.8) ට ඉතාමත් හරියටම මැදින් පිහිටලා වගේ සහ $206.3 හි Resistance එකට තරමක් පහළින් තියෙනවා.
මෙය බලාගෙන ඉන්න setup එකක් නෙවෙයි; සැබෑ තීරණ ලක්ෂ්යයක්:
🟢 Resistance: $206.3 හි volume-confirmed break එකක් මෙතැනින් සිදුවේ නම් continuation එකක් සංඥා කරයි; EMA50 දැනටම support ලෙස පහලින් ක්රියාත්මක වෙලා
🔴 Support: $194.3 නැති වුවහොත්, මේ මෑත breakout structure එක බිඳ දැමෙනවා
RSI 57.39 මට්ටමේ ස්ථිර momentum එකක් සමඟ ඉන්නවා—උස්සේ දිගු වීමක් (stretched) වගේද නැහැ. මිලදී ගන්නන් පාලනයේම ඉන්නවා නම් තව ඉඩක් තියෙනවා.
මේක සන්දර්භයට දාගෙන බලන්න වටිනවා: මේ සතියේ majors මිශ්ර වෙලා තිබුණත්, TAO වගේ AI-narrative tokens දැනටම සැබෑ relative strength පෙන්නුම් කරනවා. crypto හි ඊළඟ rotation story එක “AI infrastructure” නම්, ඒ නම් වලින් එකක් මෙය වගේම leading එකක්.
$206.3 හොඳින්ම clean ලෙස clear වෙනවද බලනවා. Nfa,Dyor තව කවුරු හරි මෙතැන position කරලාද? 👇
TAO මේ සතියේදී වඩාත් තියුණුම ගමනක් එකම மெහෙන් කට්ටකුඩු candle spike එකකින් $183 සිට $209.9 දක්වා ගොස් පසුව $205.7 හි consolidate වෙමින් තියෙනවා. ඒක තම 50-day EMA ($205.8) ට ඉතාමත් හරියටම මැදින් පිහිටලා වගේ සහ $206.3 හි Resistance එකට තරමක් පහළින් තියෙනවා.
මෙය බලාගෙන ඉන්න setup එකක් නෙවෙයි; සැබෑ තීරණ ලක්ෂ්යයක්:
🟢 Resistance: $206.3 හි volume-confirmed break එකක් මෙතැනින් සිදුවේ නම් continuation එකක් සංඥා කරයි; EMA50 දැනටම support ලෙස පහලින් ක්රියාත්මක වෙලා
🔴 Support: $194.3 නැති වුවහොත්, මේ මෑත breakout structure එක බිඳ දැමෙනවා
RSI 57.39 මට්ටමේ ස්ථිර momentum එකක් සමඟ ඉන්නවා—උස්සේ දිගු වීමක් (stretched) වගේද නැහැ. මිලදී ගන්නන් පාලනයේම ඉන්නවා නම් තව ඉඩක් තියෙනවා.
මේක සන්දර්භයට දාගෙන බලන්න වටිනවා: මේ සතියේ majors මිශ්ර වෙලා තිබුණත්, TAO වගේ AI-narrative tokens දැනටම සැබෑ relative strength පෙන්නුම් කරනවා. crypto හි ඊළඟ rotation story එක “AI infrastructure” නම්, ඒ නම් වලින් එකක් මෙය වගේම leading එකක්.
$206.3 හොඳින්ම clean ලෙස clear වෙනවද බලනවා. Nfa,Dyor තව කවුරු හරි මෙතැන position කරලාද? 👇
3
267
·
--
උසබ තත්ත්වය
📊 DXY හි ආපසු හැරීම තමයි ETH භ්රමණ කථාව පිටුපස සැබෑ කතාව
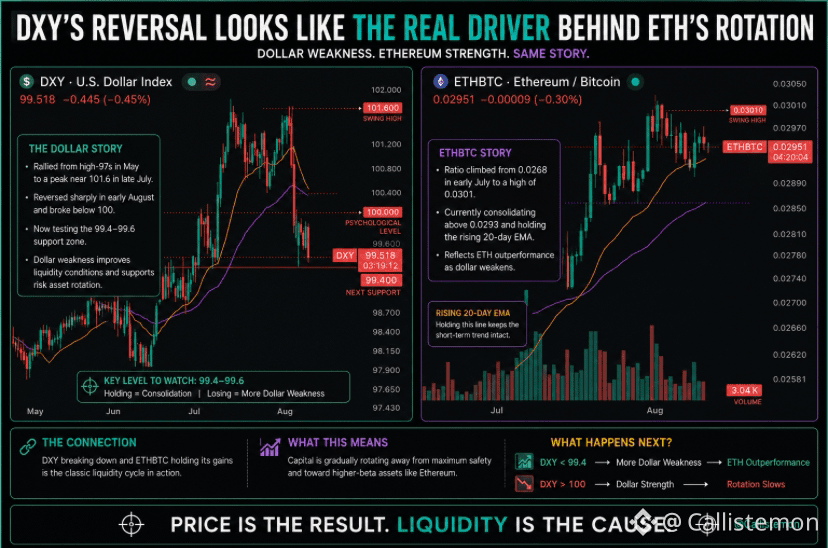
Crypto Twitter තව මැදිවියෙහි DXY ගැනම අවධානය යොමු කරගෙන ඉන්නවා, චාර්ට් එක බැලුවම ඒ අවධානය සාධාරණයි. මැයි මාසයේ සිට ජූලි මැද/අග දක්වා ඩොලර් දර්ශකය දැඩි ලෙස ඉහළ ගියා—$101.6ට ආසන්න උච්චයකට ගොස්—ඉන් පසුව අගෝස්තු මුලදී තියුණු ලෙස ආපසු හැරී 99.518 දක්වා පහළට වැටුණා. දැන් එය $100 මනෝවිද්යා මට්ටමට පහළින් තියෙන $99.4-99.6 සහාය කලාපය පරීක්ෂා කරන අතර. මේක සැබෑවටම වෙළඳාම් කළ හැකි චලනයක්—පසුබිම් ශබ්දයක් නොවෙයි.
ඒම කාල පරාසය තුළ ETHBTC සමඟ සමාන්තරව තබා බලන්න: එම අනුපාතය ජූලි මුලදී 0.0268 සිට ඉහළම අගයක් ලෙස 0.0301 දක්වා දිව්වා. දැන් එය 0.02951 වටා සිරවී (consolidating) තියෙන්නේ, එහි ඉහළ යන දින 20ක චලනය වන සාමාන්යය (20-day MA) ට ඉහළින් රැඳී සිටිමින්. ඒම කාල පරාසය තුළම ඩොලර් දුර්වල වීම සහ ETH ඉදිරියෙන් පෙනීම—ක්රිප්ටෝ වෙළඳුන් නිතරම නිරීක්ෂණය කරන සම්භාව්ය ප්රතිලෝම සහසම්බන්ධය—සජීවීව සිදුවෙමින් තිබෙනවා.
මෙය මම මේ සතියේ මුලින් පෙන්වා දුන් භ්රමණ කථාවට සෘජුව සම්බන්ධයි: Intesa ගේ Q2 13F මඟින් BTC නිරාවරණයෙන් (exposure) stake කර ඇති ETH වෙත මාරුවක් පෙන්වීම, සහ අද දවසේ BTC/ETH මිල ක්රියාමාර්ගය ඒම දිශාවටම යොමු වීම.
DXY මේ සහාය කලාපය රඳවාගනීද නැත්නම් පහළට බිඳ වැටේද යන්න දැන් බලන්න—එය ETH/BTC අනුපාතය සඳහා ඊළඟ පියවර (next leg) තීරණය කරන්නටත් බොහෝ දුරට ඉඩ තියෙනවා.#dxy #ETHBTC
📊 DXY හි ආපසු හැරීම තමයි ETH භ්රමණ කථාව පිටුපස සැබෑ කතාව
Crypto Twitter තව මැදිවියෙහි DXY ගැනම අවධානය යොමු කරගෙන ඉන්නවා, චාර්ට් එක බැලුවම ඒ අවධානය සාධාරණයි. මැයි මාසයේ සිට ජූලි මැද/අග දක්වා ඩොලර් දර්ශකය දැඩි ලෙස ඉහළ ගියා—$101.6ට ආසන්න උච්චයකට ගොස්—ඉන් පසුව අගෝස්තු මුලදී තියුණු ලෙස ආපසු හැරී 99.518 දක්වා පහළට වැටුණා. දැන් එය $100 මනෝවිද්යා මට්ටමට පහළින් තියෙන $99.4-99.6 සහාය කලාපය පරීක්ෂා කරන අතර. මේක සැබෑවටම වෙළඳාම් කළ හැකි චලනයක්—පසුබිම් ශබ්දයක් නොවෙයි.
ඒම කාල පරාසය තුළ ETHBTC සමඟ සමාන්තරව තබා බලන්න: එම අනුපාතය ජූලි මුලදී 0.0268 සිට ඉහළම අගයක් ලෙස 0.0301 දක්වා දිව්වා. දැන් එය 0.02951 වටා සිරවී (consolidating) තියෙන්නේ, එහි ඉහළ යන දින 20ක චලනය වන සාමාන්යය (20-day MA) ට ඉහළින් රැඳී සිටිමින්. ඒම කාල පරාසය තුළම ඩොලර් දුර්වල වීම සහ ETH ඉදිරියෙන් පෙනීම—ක්රිප්ටෝ වෙළඳුන් නිතරම නිරීක්ෂණය කරන සම්භාව්ය ප්රතිලෝම සහසම්බන්ධය—සජීවීව සිදුවෙමින් තිබෙනවා.
මෙය මම මේ සතියේ මුලින් පෙන්වා දුන් භ්රමණ කථාවට සෘජුව සම්බන්ධයි: Intesa ගේ Q2 13F මඟින් BTC නිරාවරණයෙන් (exposure) stake කර ඇති ETH වෙත මාරුවක් පෙන්වීම, සහ අද දවසේ BTC/ETH මිල ක්රියාමාර්ගය ඒම දිශාවටම යොමු වීම.
DXY මේ සහාය කලාපය රඳවාගනීද නැත්නම් පහළට බිඳ වැටේද යන්න දැන් බලන්න—එය ETH/BTC අනුපාතය සඳහා ඊළඟ පියවර (next leg) තීරණය කරන්නටත් බොහෝ දුරට ඉඩ තියෙනවා.#dxy #ETHBTC
Crypto Twitter තව මැදිවියෙහි DXY ගැනම අවධානය යොමු කරගෙන ඉන්නවා, චාර්ට් එක බැලුවම ඒ අවධානය සාධාරණයි. මැයි මාසයේ සිට ජූලි මැද/අග දක්වා ඩොලර් දර්ශකය දැඩි ලෙස ඉහළ ගියා—$101.6ට ආසන්න උච්චයකට ගොස්—ඉන් පසුව අගෝස්තු මුලදී තියුණු ලෙස ආපසු හැරී 99.518 දක්වා පහළට වැටුණා. දැන් එය $100 මනෝවිද්යා මට්ටමට පහළින් තියෙන $99.4-99.6 සහාය කලාපය පරීක්ෂා කරන අතර. මේක සැබෑවටම වෙළඳාම් කළ හැකි චලනයක්—පසුබිම් ශබ්දයක් නොවෙයි.
ඒම කාල පරාසය තුළ ETHBTC සමඟ සමාන්තරව තබා බලන්න: එම අනුපාතය ජූලි මුලදී 0.0268 සිට ඉහළම අගයක් ලෙස 0.0301 දක්වා දිව්වා. දැන් එය 0.02951 වටා සිරවී (consolidating) තියෙන්නේ, එහි ඉහළ යන දින 20ක චලනය වන සාමාන්යය (20-day MA) ට ඉහළින් රැඳී සිටිමින්. ඒම කාල පරාසය තුළම ඩොලර් දුර්වල වීම සහ ETH ඉදිරියෙන් පෙනීම—ක්රිප්ටෝ වෙළඳුන් නිතරම නිරීක්ෂණය කරන සම්භාව්ය ප්රතිලෝම සහසම්බන්ධය—සජීවීව සිදුවෙමින් තිබෙනවා.
මෙය මම මේ සතියේ මුලින් පෙන්වා දුන් භ්රමණ කථාවට සෘජුව සම්බන්ධයි: Intesa ගේ Q2 13F මඟින් BTC නිරාවරණයෙන් (exposure) stake කර ඇති ETH වෙත මාරුවක් පෙන්වීම, සහ අද දවසේ BTC/ETH මිල ක්රියාමාර්ගය ඒම දිශාවටම යොමු වීම.
DXY මේ සහාය කලාපය රඳවාගනීද නැත්නම් පහළට බිඳ වැටේද යන්න දැන් බලන්න—එය ETH/BTC අනුපාතය සඳහා ඊළඟ පියවර (next leg) තීරණය කරන්නටත් බොහෝ දුරට ඉඩ තියෙනවා.#dxy #ETHBTC
2
114
·
--
උසබ තත්ත්වය
📉 පැහැදිලි බව අතපසු වුණා: ඇත්තටම සිදු වූ දේ මෙන්න
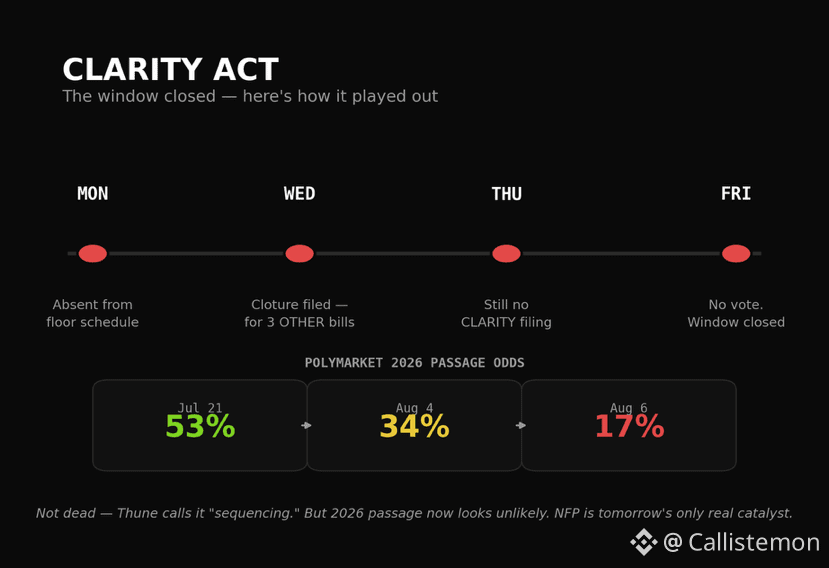
අපි මුළු සතිය පුරාම නිරීක්ෂණය කරමින් හිටපු කාලසීමාව අවසන් වුණා—නමුත් කිසිවෙකු බලාපොරොත්තු නොවුණ විදිහටයි. සෙනට් බහුතර නායක තූන් බදාදා දිනෙදී වෝටුවට පෙර අවසන් කිරීම (cloture) සඳහා යෝජනා ගොනු කළා—එහෙත් වෙනත් බිල් තුනක් සඳහා: Protect College Sports Act, එක් රජයේ අරමුදල් සපයන වාහනයක්, සහ නීතිපති (Attorney General) නාමයෝජනාවක්. CLARITY ඒ ලැයිස්තුවේ තිබුණේ නැහැ. බ්රහස්පතින්දා කාලසටහනේ ද එය ඇතුළත් නොවුණා.
වෙළඳපොළ දැනටමත් ඉක්මනින් නැවත මිල කරමින් සිටී. 2026 සම්මත වීම සඳහා Polymarket දත්ත 53% (ජූලි 21) සිට 34% දක්වා, පසුව දැන් 17% දක්වා පහත වැටී ඇත. Kalshi හි 2027 ජූලිට පෙර සම්මත වීමේ කොන්ත්රාත් නිරීක්ෂණය 41% වෙත වැටී ඇත.
තූන් කියන්නේ මෙය මිය ගිය දෙයක් නෙවෙයි—“අපි එය සකස් කරනවා (sequencing)”—ලූම්මිස් සෙනෙටර් ද විවේකයට පෙර වෝටුවක් සඳහා තවමත් තල්ලු කරනවා. නමුත් සෙනට් වෙනත් නීති සලකා බලන අතර, මූලික ආරවුල් (නීතිමය සීමා—ethics restrictions, stablecoin ත්යාග, illicit-finance නියම) තවමත් විසඳී නැති නිසා, 2026 වෝටුවක් අනාගතයේ අතිශය අඩු බව පෙනෙන්නට තිබේ.
හෙටට පිවිසෙන විට මෙයින් අදහස් කරන්නේ: CLARITY කෙටි කාලීන උත්ප්රේරකයක් ලෙස ඉවතට යනවා. NFP දැන් සතියේ එකම ප්රධාන සිදුවීම—එය දැනටත් තිබුණට වඩා වැඩි බරක් දරයි.
ඔබ මෙවැනි ප්රතිඵලයක් බලාපොරොත්තු වුණාද, නැත්නම් බ්රහස්පතින්දාට පෙර තවමත් බලාපොරොත්තුවෙන් හිටියද? 👇#CLARTYACT
📉 පැහැදිලි බව අතපසු වුණා: ඇත්තටම සිදු වූ දේ මෙන්න
අපි මුළු සතිය පුරාම නිරීක්ෂණය කරමින් හිටපු කාලසීමාව අවසන් වුණා—නමුත් කිසිවෙකු බලාපොරොත්තු නොවුණ විදිහටයි. සෙනට් බහුතර නායක තූන් බදාදා දිනෙදී වෝටුවට පෙර අවසන් කිරීම (cloture) සඳහා යෝජනා ගොනු කළා—එහෙත් වෙනත් බිල් තුනක් සඳහා: Protect College Sports Act, එක් රජයේ අරමුදල් සපයන වාහනයක්, සහ නීතිපති (Attorney General) නාමයෝජනාවක්. CLARITY ඒ ලැයිස්තුවේ තිබුණේ නැහැ. බ්රහස්පතින්දා කාලසටහනේ ද එය ඇතුළත් නොවුණා.
වෙළඳපොළ දැනටමත් ඉක්මනින් නැවත මිල කරමින් සිටී. 2026 සම්මත වීම සඳහා Polymarket දත්ත 53% (ජූලි 21) සිට 34% දක්වා, පසුව දැන් 17% දක්වා පහත වැටී ඇත. Kalshi හි 2027 ජූලිට පෙර සම්මත වීමේ කොන්ත්රාත් නිරීක්ෂණය 41% වෙත වැටී ඇත.
තූන් කියන්නේ මෙය මිය ගිය දෙයක් නෙවෙයි—“අපි එය සකස් කරනවා (sequencing)”—ලූම්මිස් සෙනෙටර් ද විවේකයට පෙර වෝටුවක් සඳහා තවමත් තල්ලු කරනවා. නමුත් සෙනට් වෙනත් නීති සලකා බලන අතර, මූලික ආරවුල් (නීතිමය සීමා—ethics restrictions, stablecoin ත්යාග, illicit-finance නියම) තවමත් විසඳී නැති නිසා, 2026 වෝටුවක් අනාගතයේ අතිශය අඩු බව පෙනෙන්නට තිබේ.
හෙටට පිවිසෙන විට මෙයින් අදහස් කරන්නේ: CLARITY කෙටි කාලීන උත්ප්රේරකයක් ලෙස ඉවතට යනවා. NFP දැන් සතියේ එකම ප්රධාන සිදුවීම—එය දැනටත් තිබුණට වඩා වැඩි බරක් දරයි.
ඔබ මෙවැනි ප්රතිඵලයක් බලාපොරොත්තු වුණාද, නැත්නම් බ්රහස්පතින්දාට පෙර තවමත් බලාපොරොත්තුවෙන් හිටියද? 👇#CLARTYACT
අපි මුළු සතිය පුරාම නිරීක්ෂණය කරමින් හිටපු කාලසීමාව අවසන් වුණා—නමුත් කිසිවෙකු බලාපොරොත්තු නොවුණ විදිහටයි. සෙනට් බහුතර නායක තූන් බදාදා දිනෙදී වෝටුවට පෙර අවසන් කිරීම (cloture) සඳහා යෝජනා ගොනු කළා—එහෙත් වෙනත් බිල් තුනක් සඳහා: Protect College Sports Act, එක් රජයේ අරමුදල් සපයන වාහනයක්, සහ නීතිපති (Attorney General) නාමයෝජනාවක්. CLARITY ඒ ලැයිස්තුවේ තිබුණේ නැහැ. බ්රහස්පතින්දා කාලසටහනේ ද එය ඇතුළත් නොවුණා.
වෙළඳපොළ දැනටමත් ඉක්මනින් නැවත මිල කරමින් සිටී. 2026 සම්මත වීම සඳහා Polymarket දත්ත 53% (ජූලි 21) සිට 34% දක්වා, පසුව දැන් 17% දක්වා පහත වැටී ඇත. Kalshi හි 2027 ජූලිට පෙර සම්මත වීමේ කොන්ත්රාත් නිරීක්ෂණය 41% වෙත වැටී ඇත.
තූන් කියන්නේ මෙය මිය ගිය දෙයක් නෙවෙයි—“අපි එය සකස් කරනවා (sequencing)”—ලූම්මිස් සෙනෙටර් ද විවේකයට පෙර වෝටුවක් සඳහා තවමත් තල්ලු කරනවා. නමුත් සෙනට් වෙනත් නීති සලකා බලන අතර, මූලික ආරවුල් (නීතිමය සීමා—ethics restrictions, stablecoin ත්යාග, illicit-finance නියම) තවමත් විසඳී නැති නිසා, 2026 වෝටුවක් අනාගතයේ අතිශය අඩු බව පෙනෙන්නට තිබේ.
හෙටට පිවිසෙන විට මෙයින් අදහස් කරන්නේ: CLARITY කෙටි කාලීන උත්ප්රේරකයක් ලෙස ඉවතට යනවා. NFP දැන් සතියේ එකම ප්රධාන සිදුවීම—එය දැනටත් තිබුණට වඩා වැඩි බරක් දරයි.
ඔබ මෙවැනි ප්රතිඵලයක් බලාපොරොත්තු වුණාද, නැත්නම් බ්රහස්පතින්දාට පෙර තවමත් බලාපොරොත්තුවෙන් හිටියද? 👇#CLARTYACT
1
217
·
--
උසබ තත්ත්වය
📊 $ROBO Setup: Trigger အပေါ်မှာ ထိုင်ပြီး
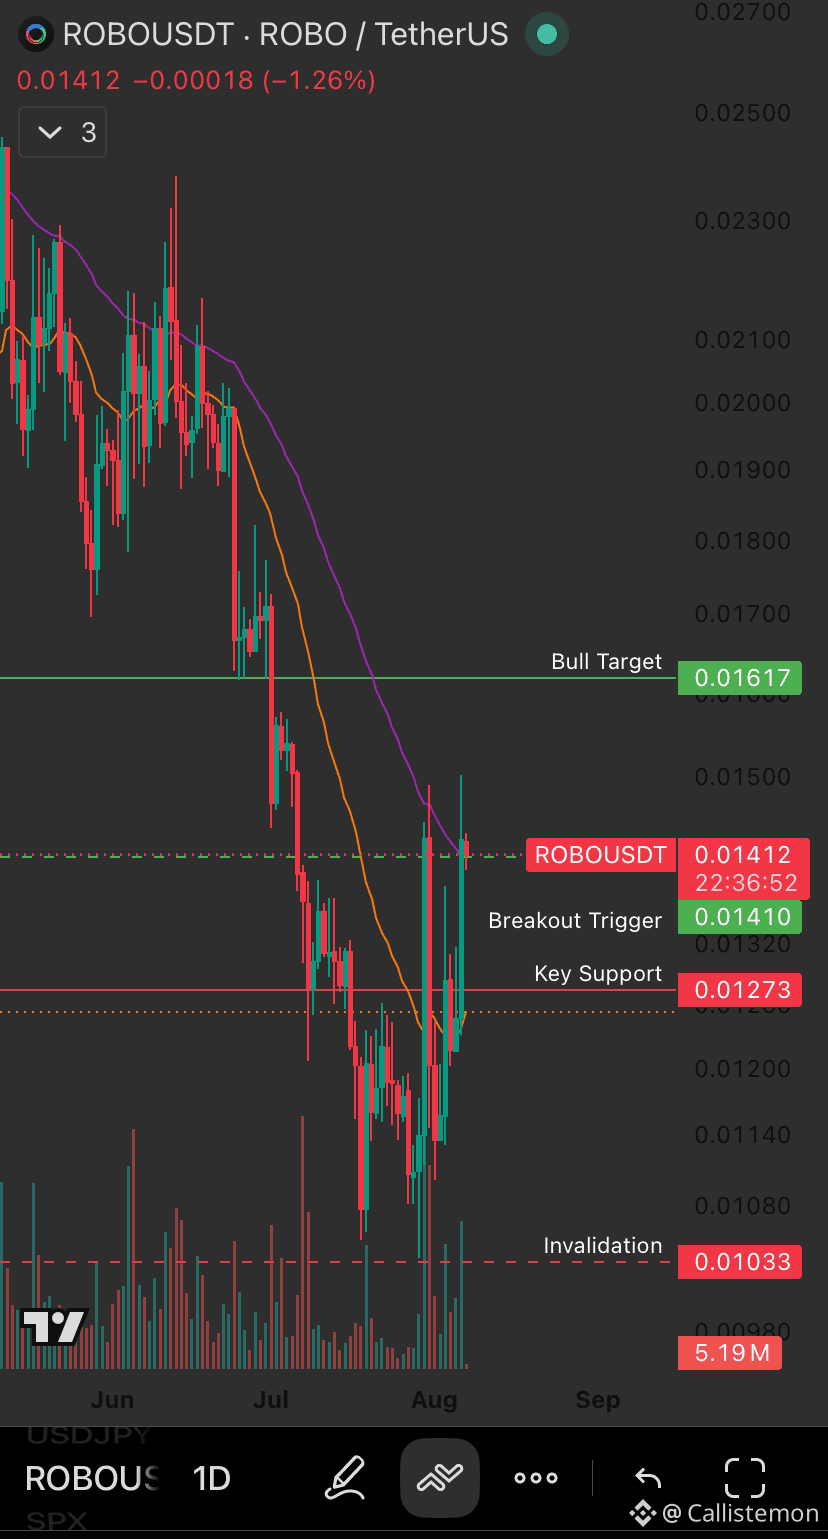
ROBO သည် $0.02372 ကနေ $0.01033 ထိ အပြင်းအထန် ကျသွားပြီး ခန့်မှန်းအားဖြင့် 56% ကျဆင်းခဲ့သည်။ ထို့နောက် အမြင့်လာတဲ့ volume နဲ့အတူ ပြန်လည်အားကောင်းလာတဲ့ sharp recovery ကို စတင်ခဲ့သည်။ လက်ရှိတွင် စျေးနှုန်း ($0.01412) သည် Breakout Trigger အဆင့် ($0.01410) နဲ့ တိတိကျကျ အနီးအနားမှာ နေရာယူနေပြီး 50-day EMA နဲ့လည်း ကိုက်ညီနေသည်။ ဒါက "စောင့်ကြည့်ရမယ့်" setup မဟုတ်ဘူး—ဒါက တကယ့်ဆုံးဖြတ်ချက်အမှတ်တစ်ခုပါ။
အဆင့်တွေကတော့:
🟢 Breakout Trigger: volume နဲ့အတူ ဒီအဆင့် ($0.01410) အထက်မှာ ဆက်ထိန်းနိုင်ရင် Bull Target $0.01617 ဆီသို့ လမ်းဖွင့်
🔴 Key Support: $0.01273 ကို ဆုံးရှုံးသွားရင် Invalidation zone $0.01033 သို့ ပြန်လည်စမ်းသပ်မှု ဖြစ်နိုင်
RSI က 56 ဖြစ်ပြီး neutral-to-firm — overbought warning မရှိဘူး၊ ဒါပေမယ့် oversold bounce signal လည်း မပေးသေးပါ။ အတိအကျ အလယ်မှာ ရှိနေတာကြောင့် နောက်လာမယ့် ဖယောင်းတိုင်အနည်းငယ်က တကယ်အရေးကြီးပါတယ်။
Small-cap, liquidity နည်းတဲ့ အမည်ဖြစ်တဲ့အတွက် position size ကိုလျှော့ပြီး သင့်တော်အောင်ထားပါ။ ဒါပေမယ့် setup ကတော့ အရမ်းမိုက်ပြီး သန့်ရှင်းပါတယ်—စျေးနှုန်းက အရေးကြီးတဲ့ level ကို real time မှာ စမ်းသပ်နေပြီး၊ အောက်ဘက်မှာ ရှင်းလင်းတဲ့ invalidation ရှိတယ်။Nfa,Dyor $ROBO
ဘယ်ဘက်ကို ဖောက်မလဲ? 👇
{future}(ROBOUSDT)
📊 $ROBO Setup: Trigger အပေါ်မှာ ထိုင်ပြီး
ROBO သည် $0.02372 ကနေ $0.01033 ထိ အပြင်းအထန် ကျသွားပြီး ခန့်မှန်းအားဖြင့် 56% ကျဆင်းခဲ့သည်။ ထို့နောက် အမြင့်လာတဲ့ volume နဲ့အတူ ပြန်လည်အားကောင်းလာတဲ့ sharp recovery ကို စတင်ခဲ့သည်။ လက်ရှိတွင် စျေးနှုန်း ($0.01412) သည် Breakout Trigger အဆင့် ($0.01410) နဲ့ တိတိကျကျ အနီးအနားမှာ နေရာယူနေပြီး 50-day EMA နဲ့လည်း ကိုက်ညီနေသည်။ ဒါက "စောင့်ကြည့်ရမယ့်" setup မဟုတ်ဘူး—ဒါက တကယ့်ဆုံးဖြတ်ချက်အမှတ်တစ်ခုပါ။
အဆင့်တွေကတော့:
🟢 Breakout Trigger: volume နဲ့အတူ ဒီအဆင့် ($0.01410) အထက်မှာ ဆက်ထိန်းနိုင်ရင် Bull Target $0.01617 ဆီသို့ လမ်းဖွင့်
🔴 Key Support: $0.01273 ကို ဆုံးရှုံးသွားရင် Invalidation zone $0.01033 သို့ ပြန်လည်စမ်းသပ်မှု ဖြစ်နိုင်
RSI က 56 ဖြစ်ပြီး neutral-to-firm — overbought warning မရှိဘူး၊ ဒါပေမယ့် oversold bounce signal လည်း မပေးသေးပါ။ အတိအကျ အလယ်မှာ ရှိနေတာကြောင့် နောက်လာမယ့် ဖယောင်းတိုင်အနည်းငယ်က တကယ်အရေးကြီးပါတယ်။
Small-cap, liquidity နည်းတဲ့ အမည်ဖြစ်တဲ့အတွက် position size ကိုလျှော့ပြီး သင့်တော်အောင်ထားပါ။ ဒါပေမယ့် setup ကတော့ အရမ်းမိုက်ပြီး သန့်ရှင်းပါတယ်—စျေးနှုန်းက အရေးကြီးတဲ့ level ကို real time မှာ စမ်းသပ်နေပြီး၊ အောက်ဘက်မှာ ရှင်းလင်းတဲ့ invalidation ရှိတယ်။Nfa,Dyor $ROBO
ဘယ်ဘက်ကို ဖောက်မလဲ? 👇
ROBO သည် $0.02372 ကနေ $0.01033 ထိ အပြင်းအထန် ကျသွားပြီး ခန့်မှန်းအားဖြင့် 56% ကျဆင်းခဲ့သည်။ ထို့နောက် အမြင့်လာတဲ့ volume နဲ့အတူ ပြန်လည်အားကောင်းလာတဲ့ sharp recovery ကို စတင်ခဲ့သည်။ လက်ရှိတွင် စျေးနှုန်း ($0.01412) သည် Breakout Trigger အဆင့် ($0.01410) နဲ့ တိတိကျကျ အနီးအနားမှာ နေရာယူနေပြီး 50-day EMA နဲ့လည်း ကိုက်ညီနေသည်။ ဒါက "စောင့်ကြည့်ရမယ့်" setup မဟုတ်ဘူး—ဒါက တကယ့်ဆုံးဖြတ်ချက်အမှတ်တစ်ခုပါ။
အဆင့်တွေကတော့:
🟢 Breakout Trigger: volume နဲ့အတူ ဒီအဆင့် ($0.01410) အထက်မှာ ဆက်ထိန်းနိုင်ရင် Bull Target $0.01617 ဆီသို့ လမ်းဖွင့်
🔴 Key Support: $0.01273 ကို ဆုံးရှုံးသွားရင် Invalidation zone $0.01033 သို့ ပြန်လည်စမ်းသပ်မှု ဖြစ်နိုင်
RSI က 56 ဖြစ်ပြီး neutral-to-firm — overbought warning မရှိဘူး၊ ဒါပေမယ့် oversold bounce signal လည်း မပေးသေးပါ။ အတိအကျ အလယ်မှာ ရှိနေတာကြောင့် နောက်လာမယ့် ဖယောင်းတိုင်အနည်းငယ်က တကယ်အရေးကြီးပါတယ်။
Small-cap, liquidity နည်းတဲ့ အမည်ဖြစ်တဲ့အတွက် position size ကိုလျှော့ပြီး သင့်တော်အောင်ထားပါ။ ဒါပေမယ့် setup ကတော့ အရမ်းမိုက်ပြီး သန့်ရှင်းပါတယ်—စျေးနှုန်းက အရေးကြီးတဲ့ level ကို real time မှာ စမ်းသပ်နေပြီး၊ အောက်ဘက်မှာ ရှင်းလင်းတဲ့ invalidation ရှိတယ်။Nfa,Dyor $ROBO
ဘယ်ဘက်ကို ဖောက်မလဲ? 👇
130
·
--
උසබ තත්ත්වය
සත්යායනය කළ
📊 අද වචන මාලාව වෙනස් වුණා: Cut → Hike
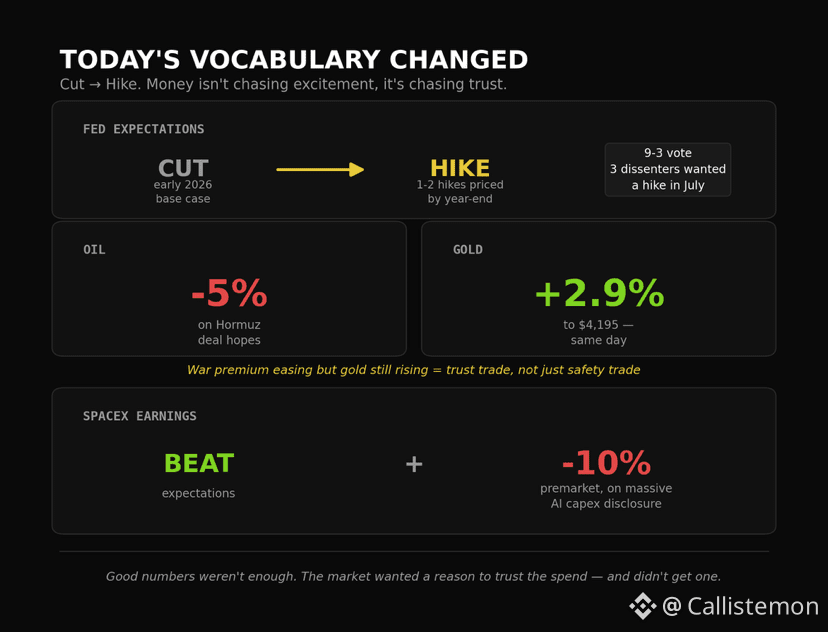
මාස හයකට පෙර, ෆෙඩ් ගැන හැම සංවාදයක්ම අවධානය දුන්නේ පොලී අනුපාතයන් අඩුවෙන්නේ කවදාද කියලා. අද එම සංවාදය පෙරළුණා. ජූලි FOMC රැස්වීම 3.50-3.75% මට්ටමේම රඳවාගත් නමුත්, Hammack, Kashkari, Logan යන සාමාජිකයන් තිදෙනාම තවමත්ම වහාම “hike” එකක් වෙනුවෙන් විරුද්ධ වුනා. වෙළඳපොල දැඩි ලෙස ප්රතිමිලනය කරලා: කප්පාදු වෙනුවට, වසර අවසානයට අනුමාන කරන “1-2 hikes” දැන් අපේක්ෂිතයි.
මෙම වෙනස අද Hormuz සහ SpaceX ගැන ඇති ප්රධාන පුවත් වලට වඩා වැදගත්. ඒත් ඒවාමට අවධානය යන්නේ:
තෙල්/රන්: Trump කිව්වා Hormuz යළි විවෘත කිරීම සම්බන්ධ ගිවිසුම අදම ක්රියාත්මක වෙන්න පුළුවන් කියලා. එය ගැන ප්රවෘත්තියත් එක්ක තෙල් පහළ ගියා, අපේක්ෂිත පරිදි. නමුත් රන් ඒ සමඟ පහළ ගියේ නැහැ—එය $4,195 ඉක්මවා ගියා, ආසන්න වශයෙන් 3% කින්. මෙහි තියෙන රසවත් කොටස. යුද්ධ “premium” ඇත්තටම සැහැල්ලු වෙනවා නම්, රන්ත් ඒ සමඟම සැහැල්ලු විය යුතුයි. ඒක සිදු වුණේ නැහැ. එයින් පෙන්වන්නේ මෙය දැන් සම්පූර්ණයෙන්ම ආරක්ෂක ගනුදෙනුවක් (safety trade) පමණක් නොවෙයි—මෙය දැන් විශ්වාසය (trust trade) පිළිබඳ එකක්. පොලී අනුපාතයන්, ඩොලරය, සහ සැබෑ ආදායම් (real yields) සම්බන්ධව ඊළඟට කුමක් වෙයිද කියන විශ්වාසය Hormuz ප්රධාන පුවත් පෙන්වන්නේ මෙන්ට තරම් ස්ථිර නැහැ.
SpaceX: ලාභ වාර්තා කරලා, එහෙත් දැවැන්ත AI capex හෙළිදරව්වක් නිසා premarket හිදී 10%කට වඩා පහළට වැටුණා. හොඳ සංඛ්යා පමණක් ප්රමාණවත් නොවෙයි—වියදම සාධාරණ කරලා දෙන කතාවක් වෙළඳපොළට අවශ්ය වුණා, ඒ කතාව එය ලැබුණේ නැහැ, එයට කැමති වුණේ නැහැ.
මෙන්න අර්ථය: මේ මොහොතේ මුදල් උද්වේගය සෙවන්නේ නැහැ. එය විශ්වාසය සෙවන්නේ. රන් ඒ “නිදිමට/එක්කෝ” වගේ boring, ආරක්ෂිත, ඉතිහාසිකවම විශ්වාසදායක වෙළඳාම දිනාගෙන, වෙනත් තැනකට යන්න තිබුණා වගේ මුදල් ද එහෙම තමන් වෙත ගන්නවා. කොටස් (equities)ත් ඒක දිනා ගැනීමට උත්සාහ කරනවා—කතාවක් කියලා (story-selling) වගේ. අද SpaceX ප්රතිචාරය පෙන්වන්නේ වරදකට ඇති ඉඩකඩ කොතරම් තුනී වෙලාද කියලා.
මේ වාතාවරණය තුළ, ක්රිප්ටෝවට සැබවින්ම අලුත් මුදල් ගලා එන්න—සමහර විට දැන් තරම් “flashy narrative” එකක් පමණක් නැහැ. එයට ආයතනික මට්ටමකින් විශ්වාසය ගොඩනගන දෙයක් අවශ්යයි—නියාමන පැහැදිලිකම, සැබෑ ආදායම, සැබෑ custody සහතික
නව උද්වේගයක් ඇති වෙන “තවත් හේතුවක්” පමණක් නොවෙයි.
ඔබ සිතන්නේ ක්රිප්ටෝවට එම විශ්වාස ගොඩනැගීමේ මොහොත එන්නේ කොහෙන්ද? 👇
📊 අද වචන මාලාව වෙනස් වුණා: Cut → Hike
මාස හයකට පෙර, ෆෙඩ් ගැන හැම සංවාදයක්ම අවධානය දුන්නේ පොලී අනුපාතයන් අඩුවෙන්නේ කවදාද කියලා. අද එම සංවාදය පෙරළුණා. ජූලි FOMC රැස්වීම 3.50-3.75% මට්ටමේම රඳවාගත් නමුත්, Hammack, Kashkari, Logan යන සාමාජිකයන් තිදෙනාම තවමත්ම වහාම “hike” එකක් වෙනුවෙන් විරුද්ධ වුනා. වෙළඳපොල දැඩි ලෙස ප්රතිමිලනය කරලා: කප්පාදු වෙනුවට, වසර අවසානයට අනුමාන කරන “1-2 hikes” දැන් අපේක්ෂිතයි.
මෙම වෙනස අද Hormuz සහ SpaceX ගැන ඇති ප්රධාන පුවත් වලට වඩා වැදගත්. ඒත් ඒවාමට අවධානය යන්නේ:
තෙල්/රන්: Trump කිව්වා Hormuz යළි විවෘත කිරීම සම්බන්ධ ගිවිසුම අදම ක්රියාත්මක වෙන්න පුළුවන් කියලා. එය ගැන ප්රවෘත්තියත් එක්ක තෙල් පහළ ගියා, අපේක්ෂිත පරිදි. නමුත් රන් ඒ සමඟ පහළ ගියේ නැහැ—එය $4,195 ඉක්මවා ගියා, ආසන්න වශයෙන් 3% කින්. මෙහි තියෙන රසවත් කොටස. යුද්ධ “premium” ඇත්තටම සැහැල්ලු වෙනවා නම්, රන්ත් ඒ සමඟම සැහැල්ලු විය යුතුයි. ඒක සිදු වුණේ නැහැ. එයින් පෙන්වන්නේ මෙය දැන් සම්පූර්ණයෙන්ම ආරක්ෂක ගනුදෙනුවක් (safety trade) පමණක් නොවෙයි—මෙය දැන් විශ්වාසය (trust trade) පිළිබඳ එකක්. පොලී අනුපාතයන්, ඩොලරය, සහ සැබෑ ආදායම් (real yields) සම්බන්ධව ඊළඟට කුමක් වෙයිද කියන විශ්වාසය Hormuz ප්රධාන පුවත් පෙන්වන්නේ මෙන්ට තරම් ස්ථිර නැහැ.
SpaceX: ලාභ වාර්තා කරලා, එහෙත් දැවැන්ත AI capex හෙළිදරව්වක් නිසා premarket හිදී 10%කට වඩා පහළට වැටුණා. හොඳ සංඛ්යා පමණක් ප්රමාණවත් නොවෙයි—වියදම සාධාරණ කරලා දෙන කතාවක් වෙළඳපොළට අවශ්ය වුණා, ඒ කතාව එය ලැබුණේ නැහැ, එයට කැමති වුණේ නැහැ.
මෙන්න අර්ථය: මේ මොහොතේ මුදල් උද්වේගය සෙවන්නේ නැහැ. එය විශ්වාසය සෙවන්නේ. රන් ඒ “නිදිමට/එක්කෝ” වගේ boring, ආරක්ෂිත, ඉතිහාසිකවම විශ්වාසදායක වෙළඳාම දිනාගෙන, වෙනත් තැනකට යන්න තිබුණා වගේ මුදල් ද එහෙම තමන් වෙත ගන්නවා. කොටස් (equities)ත් ඒක දිනා ගැනීමට උත්සාහ කරනවා—කතාවක් කියලා (story-selling) වගේ. අද SpaceX ප්රතිචාරය පෙන්වන්නේ වරදකට ඇති ඉඩකඩ කොතරම් තුනී වෙලාද කියලා.
මේ වාතාවරණය තුළ, ක්රිප්ටෝවට සැබවින්ම අලුත් මුදල් ගලා එන්න—සමහර විට දැන් තරම් “flashy narrative” එකක් පමණක් නැහැ. එයට ආයතනික මට්ටමකින් විශ්වාසය ගොඩනගන දෙයක් අවශ්යයි—නියාමන පැහැදිලිකම, සැබෑ ආදායම, සැබෑ custody සහතික
නව උද්වේගයක් ඇති වෙන “තවත් හේතුවක්” පමණක් නොවෙයි.
ඔබ සිතන්නේ ක්රිප්ටෝවට එම විශ්වාස ගොඩනැගීමේ මොහොත එන්නේ කොහෙන්ද? 👇
මාස හයකට පෙර, ෆෙඩ් ගැන හැම සංවාදයක්ම අවධානය දුන්නේ පොලී අනුපාතයන් අඩුවෙන්නේ කවදාද කියලා. අද එම සංවාදය පෙරළුණා. ජූලි FOMC රැස්වීම 3.50-3.75% මට්ටමේම රඳවාගත් නමුත්, Hammack, Kashkari, Logan යන සාමාජිකයන් තිදෙනාම තවමත්ම වහාම “hike” එකක් වෙනුවෙන් විරුද්ධ වුනා. වෙළඳපොල දැඩි ලෙස ප්රතිමිලනය කරලා: කප්පාදු වෙනුවට, වසර අවසානයට අනුමාන කරන “1-2 hikes” දැන් අපේක්ෂිතයි.
මෙම වෙනස අද Hormuz සහ SpaceX ගැන ඇති ප්රධාන පුවත් වලට වඩා වැදගත්. ඒත් ඒවාමට අවධානය යන්නේ:
තෙල්/රන්: Trump කිව්වා Hormuz යළි විවෘත කිරීම සම්බන්ධ ගිවිසුම අදම ක්රියාත්මක වෙන්න පුළුවන් කියලා. එය ගැන ප්රවෘත්තියත් එක්ක තෙල් පහළ ගියා, අපේක්ෂිත පරිදි. නමුත් රන් ඒ සමඟ පහළ ගියේ නැහැ—එය $4,195 ඉක්මවා ගියා, ආසන්න වශයෙන් 3% කින්. මෙහි තියෙන රසවත් කොටස. යුද්ධ “premium” ඇත්තටම සැහැල්ලු වෙනවා නම්, රන්ත් ඒ සමඟම සැහැල්ලු විය යුතුයි. ඒක සිදු වුණේ නැහැ. එයින් පෙන්වන්නේ මෙය දැන් සම්පූර්ණයෙන්ම ආරක්ෂක ගනුදෙනුවක් (safety trade) පමණක් නොවෙයි—මෙය දැන් විශ්වාසය (trust trade) පිළිබඳ එකක්. පොලී අනුපාතයන්, ඩොලරය, සහ සැබෑ ආදායම් (real yields) සම්බන්ධව ඊළඟට කුමක් වෙයිද කියන විශ්වාසය Hormuz ප්රධාන පුවත් පෙන්වන්නේ මෙන්ට තරම් ස්ථිර නැහැ.
SpaceX: ලාභ වාර්තා කරලා, එහෙත් දැවැන්ත AI capex හෙළිදරව්වක් නිසා premarket හිදී 10%කට වඩා පහළට වැටුණා. හොඳ සංඛ්යා පමණක් ප්රමාණවත් නොවෙයි—වියදම සාධාරණ කරලා දෙන කතාවක් වෙළඳපොළට අවශ්ය වුණා, ඒ කතාව එය ලැබුණේ නැහැ, එයට කැමති වුණේ නැහැ.
මෙන්න අර්ථය: මේ මොහොතේ මුදල් උද්වේගය සෙවන්නේ නැහැ. එය විශ්වාසය සෙවන්නේ. රන් ඒ “නිදිමට/එක්කෝ” වගේ boring, ආරක්ෂිත, ඉතිහාසිකවම විශ්වාසදායක වෙළඳාම දිනාගෙන, වෙනත් තැනකට යන්න තිබුණා වගේ මුදල් ද එහෙම තමන් වෙත ගන්නවා. කොටස් (equities)ත් ඒක දිනා ගැනීමට උත්සාහ කරනවා—කතාවක් කියලා (story-selling) වගේ. අද SpaceX ප්රතිචාරය පෙන්වන්නේ වරදකට ඇති ඉඩකඩ කොතරම් තුනී වෙලාද කියලා.
මේ වාතාවරණය තුළ, ක්රිප්ටෝවට සැබවින්ම අලුත් මුදල් ගලා එන්න—සමහර විට දැන් තරම් “flashy narrative” එකක් පමණක් නැහැ. එයට ආයතනික මට්ටමකින් විශ්වාසය ගොඩනගන දෙයක් අවශ්යයි—නියාමන පැහැදිලිකම, සැබෑ ආදායම, සැබෑ custody සහතික
නව උද්වේගයක් ඇති වෙන “තවත් හේතුවක්” පමණක් නොවෙයි.
ඔබ සිතන්නේ ක්රිප්ටෝවට එම විශ්වාස ගොඩනැගීමේ මොහොත එන්නේ කොහෙන්ද? 👇
640
·
--
උසබ තත්ත්වය
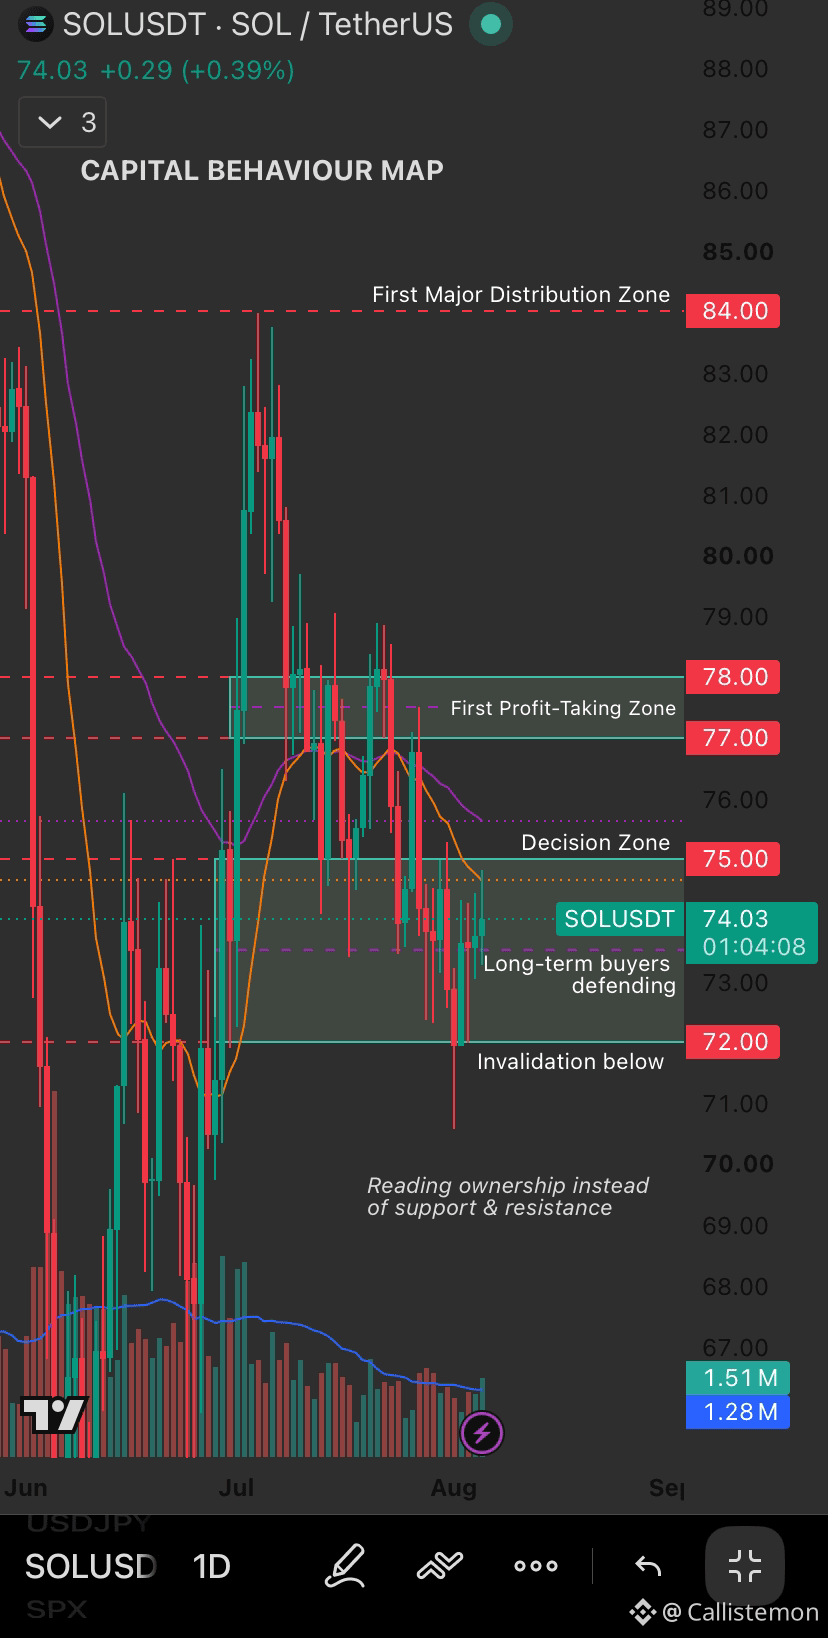
$SOL SOL Capital Behaviour Map
ඒ වෙනුවට අසන්නේ:
"ප්රතිරෝධය කොහෙද?"
මම අහන්නේ:
සෑම මිලකටම වෙළඳපොළේ හිමිකරු කවුද?
වත්මන් ව්යුහය:
• $72 → දිගු කාලීන ගැනුම්කරුවන් ආරක්ෂා කරනවා.
• $75 → තීරණ කලාපය.
• $77–78 → පළමු ලාභ ලබාගැනීමේ කලාපය.
• $84 → පළමු ප්රධාන බෙදාහැරීම් කලාපය.
බුලීෂ් මාර්ගය
$72 ඉහළින් තබාගත්තොත් වත්මන් ව්යුහය අඛණ්ඩව පවතිනවා.
$75 නැවත ලබාගැනීමෙන් $77–78 දක්වා මග විවර විය හැකිය; එහි පළමු වැදගත් විකුණුම් පීඩනය පෙනෙන්නට පුළුවන්.
ඉදිරියට යන බලය ශක්තිමත් ලෙස පවතී නම්, $84 ඊළඟ ප්රධාන බෙදාහැරීම් ප්රදේශය බවට පත්විය හැක.
බෙයරිෂ් මාර්ගය
$72 අභියෝගාත්මක ලෙස අහිමි වීමෙන් මෙම ව්යුහය අවලංගු වන අතර, ගැනුම්කරුවන්ගේ පාලනය අඩුවෙමින් පවතින බවට ඉඟියක් ලැබේ.
උපකාරක හා ප්රතිරෝධය ඔබට මිල ප්රතික්රියා කළ හැකි තැන් කියයි.
හිමිකාරීත්වය ඔබට හේතුව කියයි. NFA ,DYOR
{future}(SOLUSDT)
මිල චලනය වන්නේ හිමිකාරීත්වය වෙනස්වීම නිසායි.
$SOL SOL Capital Behaviour Map
ඒ වෙනුවට අසන්නේ:
"ප්රතිරෝධය කොහෙද?"
මම අහන්නේ:
සෑම මිලකටම වෙළඳපොළේ හිමිකරු කවුද?
වත්මන් ව්යුහය:
• $72 → දිගු කාලීන ගැනුම්කරුවන් ආරක්ෂා කරනවා.
• $75 → තීරණ කලාපය.
• $77–78 → පළමු ලාභ ලබාගැනීමේ කලාපය.
• $84 → පළමු ප්රධාන බෙදාහැරීම් කලාපය.
බුලීෂ් මාර්ගය
$72 ඉහළින් තබාගත්තොත් වත්මන් ව්යුහය අඛණ්ඩව පවතිනවා.
$75 නැවත ලබාගැනීමෙන් $77–78 දක්වා මග විවර විය හැකිය; එහි පළමු වැදගත් විකුණුම් පීඩනය පෙනෙන්නට පුළුවන්.
ඉදිරියට යන බලය ශක්තිමත් ලෙස පවතී නම්, $84 ඊළඟ ප්රධාන බෙදාහැරීම් ප්රදේශය බවට පත්විය හැක.
බෙයරිෂ් මාර්ගය
$72 අභියෝගාත්මක ලෙස අහිමි වීමෙන් මෙම ව්යුහය අවලංගු වන අතර, ගැනුම්කරුවන්ගේ පාලනය අඩුවෙමින් පවතින බවට ඉඟියක් ලැබේ.
උපකාරක හා ප්රතිරෝධය ඔබට මිල ප්රතික්රියා කළ හැකි තැන් කියයි.
හිමිකාරීත්වය ඔබට හේතුව කියයි. NFA ,DYOR
මිල චලනය වන්නේ හිමිකාරීත්වය වෙනස්වීම නිසායි.
ඒ වෙනුවට අසන්නේ:
"ප්රතිරෝධය කොහෙද?"
මම අහන්නේ:
සෑම මිලකටම වෙළඳපොළේ හිමිකරු කවුද?
වත්මන් ව්යුහය:
• $72 → දිගු කාලීන ගැනුම්කරුවන් ආරක්ෂා කරනවා.
• $75 → තීරණ කලාපය.
• $77–78 → පළමු ලාභ ලබාගැනීමේ කලාපය.
• $84 → පළමු ප්රධාන බෙදාහැරීම් කලාපය.
බුලීෂ් මාර්ගය
$72 ඉහළින් තබාගත්තොත් වත්මන් ව්යුහය අඛණ්ඩව පවතිනවා.
$75 නැවත ලබාගැනීමෙන් $77–78 දක්වා මග විවර විය හැකිය; එහි පළමු වැදගත් විකුණුම් පීඩනය පෙනෙන්නට පුළුවන්.
ඉදිරියට යන බලය ශක්තිමත් ලෙස පවතී නම්, $84 ඊළඟ ප්රධාන බෙදාහැරීම් ප්රදේශය බවට පත්විය හැක.
බෙයරිෂ් මාර්ගය
$72 අභියෝගාත්මක ලෙස අහිමි වීමෙන් මෙම ව්යුහය අවලංගු වන අතර, ගැනුම්කරුවන්ගේ පාලනය අඩුවෙමින් පවතින බවට ඉඟියක් ලැබේ.
උපකාරක හා ප්රතිරෝධය ඔබට මිල ප්රතික්රියා කළ හැකි තැන් කියයි.
හිමිකාරීත්වය ඔබට හේතුව කියයි. NFA ,DYOR
මිල චලනය වන්නේ හිමිකාරීත්වය වෙනස්වීම නිසායි.
79
·
--
උසබ තත්ත්වය
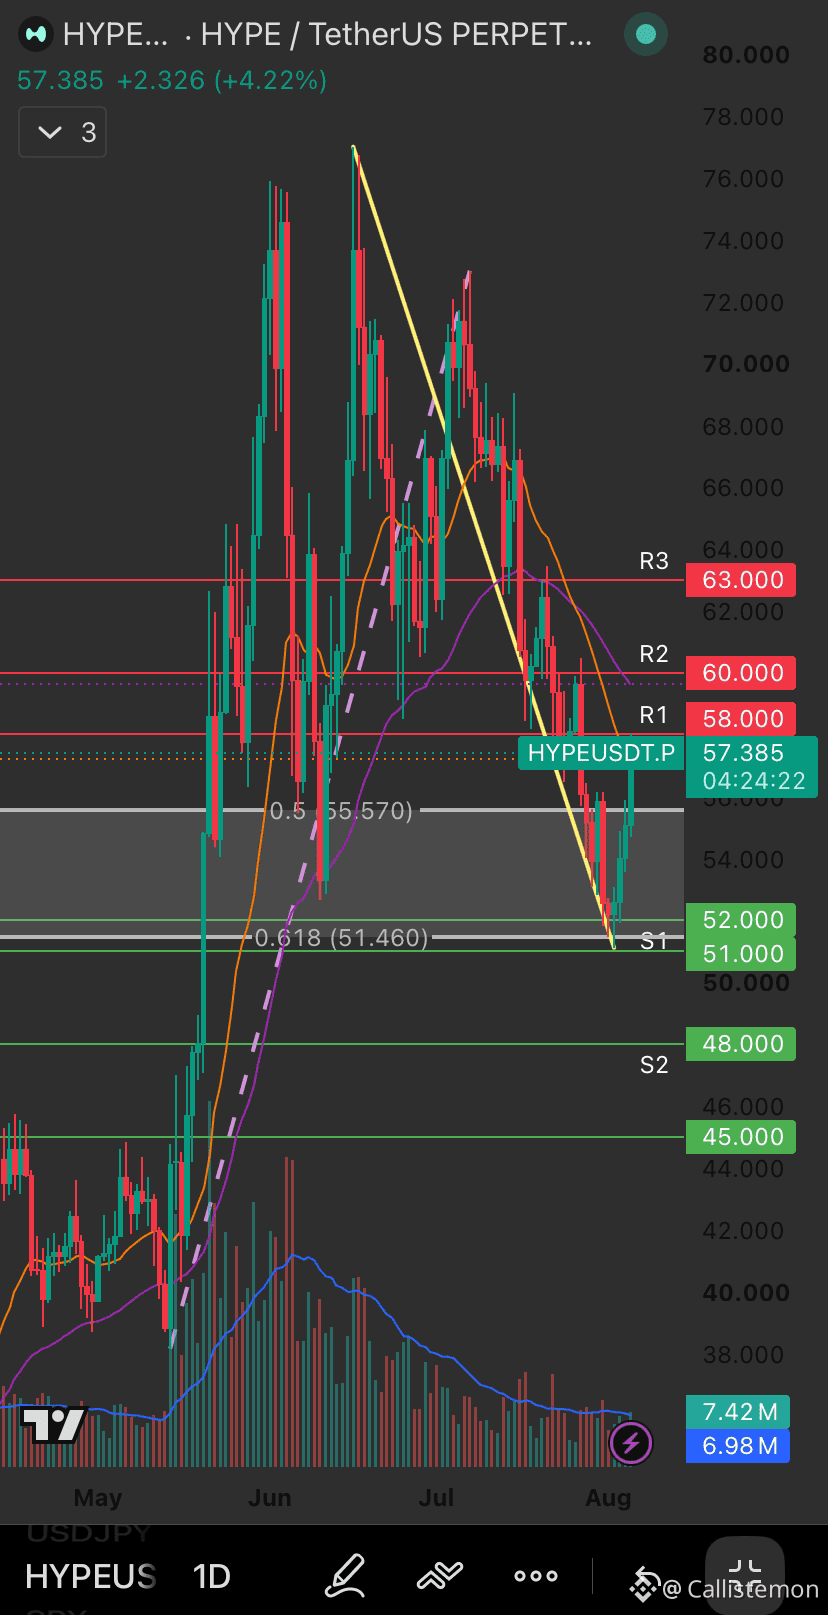
HYPE / USDT දෛනික තාක්ෂණික විශ්ලේෂණය
මිල වර්තමානයේ 0.5 ෆිබොනාචි මට්ටමට ඉහළින් ($55.57) රැඳීගෙන ඇති අතර තීරණාත්මක ප්රතිරෝධ කලාපයක් පරීක්ෂා කරමින් සිටී.
ප්රධාන මට්ටම්:
• ප්රතිරෝධය 1: $58
• ප්රතිරෝධය 2: $60
• ප්රතිරෝධය 3: $63
• ශක්තිමත් ආධාර (S1): $51 – $52 (0.618 Fib)
• ආධාර 2: $48
ව්යුහය:
• මිල පහළට නැමෙන ට්රෙන්ඩ්ලයින් එකට පහළින් පවතී.
• 20 EMA සහ 50 EMA ගතික ප්රතිරෝධයන් ලෙස ක්රියා කරයි.
• මෑත ප්රතිසාධන ඉටිපන්දම් වලදී වෙළඳ පරිමාව වැඩිවීමට ආරම්භ කර ඇත.
අවස්ථා: බුලිෂ් අවස්ථාව → පරිමාව සනාථ කිරීම සමඟ $58ට ඉහළින් දෛනික වසාදැමීම $60 සහ $63 වෙත යන මාර්ගය විවෘත කරයි.
බിയරිෂ් අවස්ථාව → $55.57 ආධාරය අහිමි වීම $51–52 කලාපය වෙත අවධානය යොමු කරයි.
ඊළඟ තීරණාත්මක පියවර බොහෝ විට $58 මට්ටමේ පිරිසිදු ප්රතික්රියාවෙන් පැමිණෙනු ඇත.
NFA, DYOR.
#hype #Hyperliquid #TechnicalAnalysis #crypto
HYPE / USDT දෛනික තාක්ෂණික විශ්ලේෂණය
මිල වර්තමානයේ 0.5 ෆිබොනාචි මට්ටමට ඉහළින් ($55.57) රැඳීගෙන ඇති අතර තීරණාත්මක ප්රතිරෝධ කලාපයක් පරීක්ෂා කරමින් සිටී.
ප්රධාන මට්ටම්:
• ප්රතිරෝධය 1: $58
• ප්රතිරෝධය 2: $60
• ප්රතිරෝධය 3: $63
• ශක්තිමත් ආධාර (S1): $51 – $52 (0.618 Fib)
• ආධාර 2: $48
ව්යුහය:
• මිල පහළට නැමෙන ට්රෙන්ඩ්ලයින් එකට පහළින් පවතී.
• 20 EMA සහ 50 EMA ගතික ප්රතිරෝධයන් ලෙස ක්රියා කරයි.
• මෑත ප්රතිසාධන ඉටිපන්දම් වලදී වෙළඳ පරිමාව වැඩිවීමට ආරම්භ කර ඇත.
අවස්ථා: බුලිෂ් අවස්ථාව → පරිමාව සනාථ කිරීම සමඟ $58ට ඉහළින් දෛනික වසාදැමීම $60 සහ $63 වෙත යන මාර්ගය විවෘත කරයි.
බിയරිෂ් අවස්ථාව → $55.57 ආධාරය අහිමි වීම $51–52 කලාපය වෙත අවධානය යොමු කරයි.
ඊළඟ තීරණාත්මක පියවර බොහෝ විට $58 මට්ටමේ පිරිසිදු ප්රතික්රියාවෙන් පැමිණෙනු ඇත.
NFA, DYOR.
#hype #Hyperliquid #TechnicalAnalysis #crypto
මිල වර්තමානයේ 0.5 ෆිබොනාචි මට්ටමට ඉහළින් ($55.57) රැඳීගෙන ඇති අතර තීරණාත්මක ප්රතිරෝධ කලාපයක් පරීක්ෂා කරමින් සිටී.
ප්රධාන මට්ටම්:
• ප්රතිරෝධය 1: $58
• ප්රතිරෝධය 2: $60
• ප්රතිරෝධය 3: $63
• ශක්තිමත් ආධාර (S1): $51 – $52 (0.618 Fib)
• ආධාර 2: $48
ව්යුහය:
• මිල පහළට නැමෙන ට්රෙන්ඩ්ලයින් එකට පහළින් පවතී.
• 20 EMA සහ 50 EMA ගතික ප්රතිරෝධයන් ලෙස ක්රියා කරයි.
• මෑත ප්රතිසාධන ඉටිපන්දම් වලදී වෙළඳ පරිමාව වැඩිවීමට ආරම්භ කර ඇත.
අවස්ථා: බුලිෂ් අවස්ථාව → පරිමාව සනාථ කිරීම සමඟ $58ට ඉහළින් දෛනික වසාදැමීම $60 සහ $63 වෙත යන මාර්ගය විවෘත කරයි.
බിയරිෂ් අවස්ථාව → $55.57 ආධාරය අහිමි වීම $51–52 කලාපය වෙත අවධානය යොමු කරයි.
ඊළඟ තීරණාත්මක පියවර බොහෝ විට $58 මට්ටමේ පිරිසිදු ප්රතික්රියාවෙන් පැමිණෙනු ඇත.
NFA, DYOR.
#hype #Hyperliquid #TechnicalAnalysis #crypto
127
·
--
උසබ තත්ත්වය
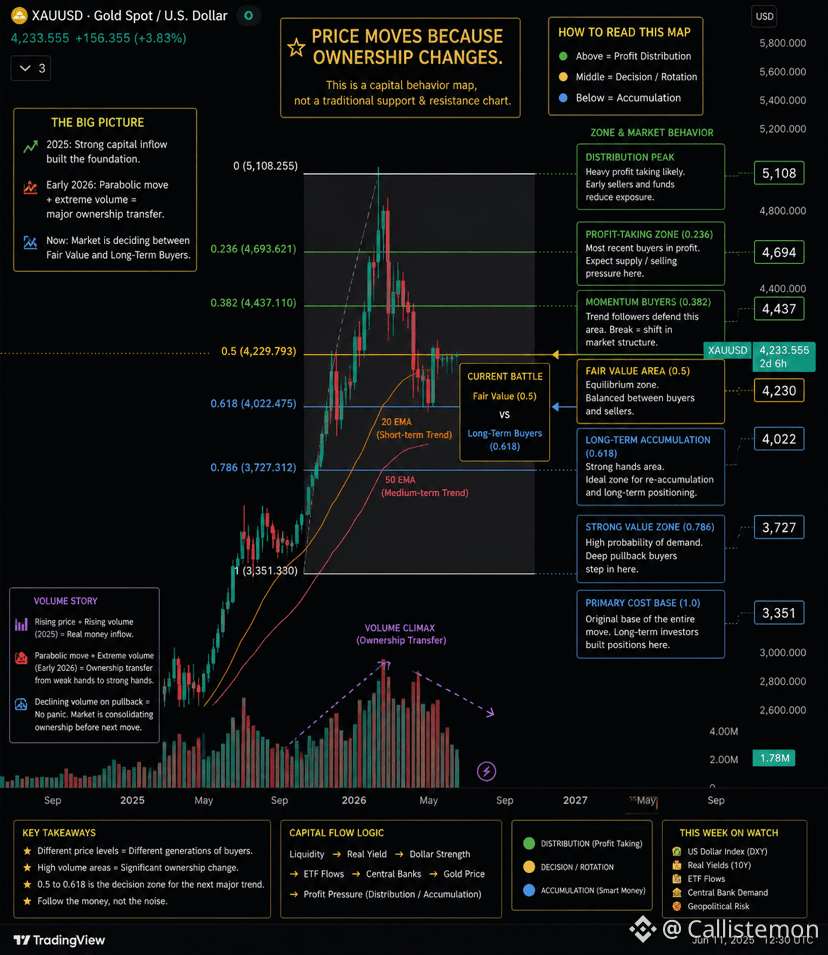
ධන සංචරණයේ කාචය හරහා රත්රන්
"ආධාරය කොහෙද?" කියලා ඇසීමේ වෙනුවට, මම කැමති මේ වගේ ඇසීමටයි:
"ආයෝජකයන්ගේ විවිධ කණ්ඩායම් කොහොමට ක්රියා කරාවිද?"
දිගුකාලීන ව්යුහය, ෆිබොනාචි ප්රතිවිකාශනය (retracement) සහ ප්රවණතා විශ්ලේෂණය භාවිතා කරමින්, මම වෙළඳපොළව සරල මිල මට්ටම්වලට වඩා හැසිරීම් කලාපයන් ලෙස බෙදා වෙන් කළෙමි.
වත්මන් වෙළඳපොළ ව්යුහය
$5,108 → ව්යාප්තියේ උච්චස්ථානය (Distribution Peak)
$4,694 → ලාභ ලබාගැනීමේ කලාපය (Profit-Taking Zone)
$4,437 → ගම්යතාවය ගන්නා මිලදීගන්නන් (Momentum Buyers)
$4,230 → සාධාරණ අගය (වත්මන් තීරණ කලාපය)
$4,022 → දිගුකාලීන මිලදීගන්නන් (Long-Term Buyers)
$3,727 → ශක්තිමත් වටිනාකම් කලාපය (Strong Value Zone)
$3,351 → මුල් පිරිවැය පදනම (Original Cost Base)
සිදුවීම් දෙක
බුලිෂ් (Bullish)
$4,230 ඉහළින් තබා ගන්න
$4,437 ඉහළින් බිඳ දමන්න
ගම්යතාවය කලින් ඉහළම අගය වන ආසන්න $5,108 වෙත ඉලක්ක කරයි.
බියරිෂ් (Bearish)
$4,022 අහිමි වීම
ධනය $3,727–$3,351 එකතු කිරීමේ කලාපය දෙසට සංචරණය වේ.
ඉලක්කය සෑම චලනයක්ම අනාවැකි කියන්නෙත් නැහැ.
එක පාර්ශ්වකරුවන් අතර ධනය කෙසේ සංචරණය වෙනවාද සහ අයිතිය (ownership) තුළ ඊළඟ වැදගත් වෙනස සිදු විය හැක්කේ කොතැනද කියලා තේරුම් ගැනීමයි.
මෙය සාකච්ඡාව සඳහා වූ රාමුවක් මිස ආයෝජන උපදෙස් නොවේ.$XAU
{future}(XAUUSDT)
ධන සංචරණයේ කාචය හරහා රත්රන්
"ආධාරය කොහෙද?" කියලා ඇසීමේ වෙනුවට, මම කැමති මේ වගේ ඇසීමටයි:
"ආයෝජකයන්ගේ විවිධ කණ්ඩායම් කොහොමට ක්රියා කරාවිද?"
දිගුකාලීන ව්යුහය, ෆිබොනාචි ප්රතිවිකාශනය (retracement) සහ ප්රවණතා විශ්ලේෂණය භාවිතා කරමින්, මම වෙළඳපොළව සරල මිල මට්ටම්වලට වඩා හැසිරීම් කලාපයන් ලෙස බෙදා වෙන් කළෙමි.
වත්මන් වෙළඳපොළ ව්යුහය
$5,108 → ව්යාප්තියේ උච්චස්ථානය (Distribution Peak)
$4,694 → ලාභ ලබාගැනීමේ කලාපය (Profit-Taking Zone)
$4,437 → ගම්යතාවය ගන්නා මිලදීගන්නන් (Momentum Buyers)
$4,230 → සාධාරණ අගය (වත්මන් තීරණ කලාපය)
$4,022 → දිගුකාලීන මිලදීගන්නන් (Long-Term Buyers)
$3,727 → ශක්තිමත් වටිනාකම් කලාපය (Strong Value Zone)
$3,351 → මුල් පිරිවැය පදනම (Original Cost Base)
සිදුවීම් දෙක
බුලිෂ් (Bullish)
$4,230 ඉහළින් තබා ගන්න
$4,437 ඉහළින් බිඳ දමන්න
ගම්යතාවය කලින් ඉහළම අගය වන ආසන්න $5,108 වෙත ඉලක්ක කරයි.
බියරිෂ් (Bearish)
$4,022 අහිමි වීම
ධනය $3,727–$3,351 එකතු කිරීමේ කලාපය දෙසට සංචරණය වේ.
ඉලක්කය සෑම චලනයක්ම අනාවැකි කියන්නෙත් නැහැ.
එක පාර්ශ්වකරුවන් අතර ධනය කෙසේ සංචරණය වෙනවාද සහ අයිතිය (ownership) තුළ ඊළඟ වැදගත් වෙනස සිදු විය හැක්කේ කොතැනද කියලා තේරුම් ගැනීමයි.
මෙය සාකච්ඡාව සඳහා වූ රාමුවක් මිස ආයෝජන උපදෙස් නොවේ.$XAU
"ආධාරය කොහෙද?" කියලා ඇසීමේ වෙනුවට, මම කැමති මේ වගේ ඇසීමටයි:
"ආයෝජකයන්ගේ විවිධ කණ්ඩායම් කොහොමට ක්රියා කරාවිද?"
දිගුකාලීන ව්යුහය, ෆිබොනාචි ප්රතිවිකාශනය (retracement) සහ ප්රවණතා විශ්ලේෂණය භාවිතා කරමින්, මම වෙළඳපොළව සරල මිල මට්ටම්වලට වඩා හැසිරීම් කලාපයන් ලෙස බෙදා වෙන් කළෙමි.
වත්මන් වෙළඳපොළ ව්යුහය
$5,108 → ව්යාප්තියේ උච්චස්ථානය (Distribution Peak)
$4,694 → ලාභ ලබාගැනීමේ කලාපය (Profit-Taking Zone)
$4,437 → ගම්යතාවය ගන්නා මිලදීගන්නන් (Momentum Buyers)
$4,230 → සාධාරණ අගය (වත්මන් තීරණ කලාපය)
$4,022 → දිගුකාලීන මිලදීගන්නන් (Long-Term Buyers)
$3,727 → ශක්තිමත් වටිනාකම් කලාපය (Strong Value Zone)
$3,351 → මුල් පිරිවැය පදනම (Original Cost Base)
සිදුවීම් දෙක
බුලිෂ් (Bullish)
$4,230 ඉහළින් තබා ගන්න
$4,437 ඉහළින් බිඳ දමන්න
ගම්යතාවය කලින් ඉහළම අගය වන ආසන්න $5,108 වෙත ඉලක්ක කරයි.
බියරිෂ් (Bearish)
$4,022 අහිමි වීම
ධනය $3,727–$3,351 එකතු කිරීමේ කලාපය දෙසට සංචරණය වේ.
ඉලක්කය සෑම චලනයක්ම අනාවැකි කියන්නෙත් නැහැ.
එක පාර්ශ්වකරුවන් අතර ධනය කෙසේ සංචරණය වෙනවාද සහ අයිතිය (ownership) තුළ ඊළඟ වැදගත් වෙනස සිදු විය හැක්කේ කොතැනද කියලා තේරුම් ගැනීමයි.
මෙය සාකච්ඡාව සඳහා වූ රාමුවක් මිස ආයෝජන උපදෙස් නොවේ.$XAU
1
178
·
--
උසබ තත්ත්වය
📊 තවත් ට්රම්ප් දිනයක්. නමුත් එය ඇත්තටම ක්රිප්ටෝවට බලපානවද?
"ආයෝජකයන්ට ඇමෙරිකාව ජයගන්නවා කියලා දැනගෙන ඉන්න නිසා කොටස් වෙළඳපොල වාර්තාවෙන් වාර්තාවට යනවා. ඇමෙරිකාවේ රන් යුගය මේක."
මේ වගේ ප්රකාශ සෑම සති කිහිපයකම වගේ පැතිරෙනවා, හැමවිටම ඒකට සාමාන්ය ප්රතික්රියාව එකම වගේ: ප්රතිචාරයක් වෙයිද කියලා බලාගෙන ඉන්න. ඒ “ආවේගය” ඇත්තටම හරිද කියලා අපි බැලුවා.
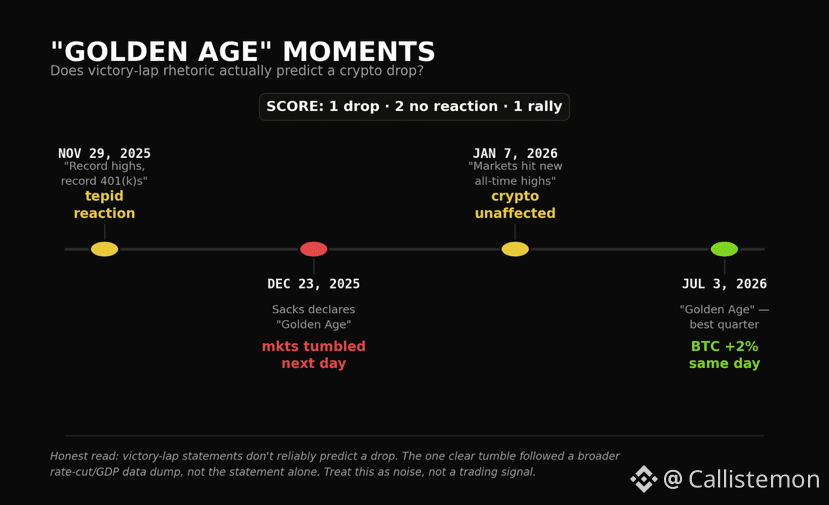
ට්රම්ප් විසින් වෙළඳපොල ගැන ඒ වගේ ජයග්රහණ-සංදේශයක් කියූ අවස්ථා හතරක්:
2025 නොවැම්බර් 29 — "වාර්තාගත ඉහළ අගයන්, වාර්තාගත 401(k)" → දුර්වල ප්රතිචාරයක්
2025 දෙසැම්බර් 23 — ශක්තිමත් GDP/පහළ පොලී අනුපාත දත්ත සමඟින් "රන් යුගය" කියලා → ඊළඟ දවසේ වෙළඳපොළ බිඳ වැටුණා
2026 ජනවාරි 7 — "වෙළඳපොළ නව වාර්තා උඩට" → ක්රිප්ටෝවට බලපෑමක් නැහැ
2026 ජූලි 3 — "රන් යුගය", හොඳම කාර්තුව → BTC ඒ දවසේම ඇත්තටම 2%ක් ඉහළට ගියා
ස්කෝරය: 1 බිඳ වැටීමක්, 2ක්ම ප්රතිචාර නැහැ, 1ක්ම ඉහළ යාමක්. ඒකෙන් වෙළඳාම කරන්න පුළුවන් “pattern” එකක් නෙවෙයි — එය ශබ්දයට වඩා වැඩියෙන්. ඇත්තටම බිඳ වැටුණ එක බොහෝවිට ආවේ statement එකෙන් නෙවෙයි; ඒ දවසේම GDP/පහළ පොලී අනුපාත දත්ත වැටුණ එකෙන්.
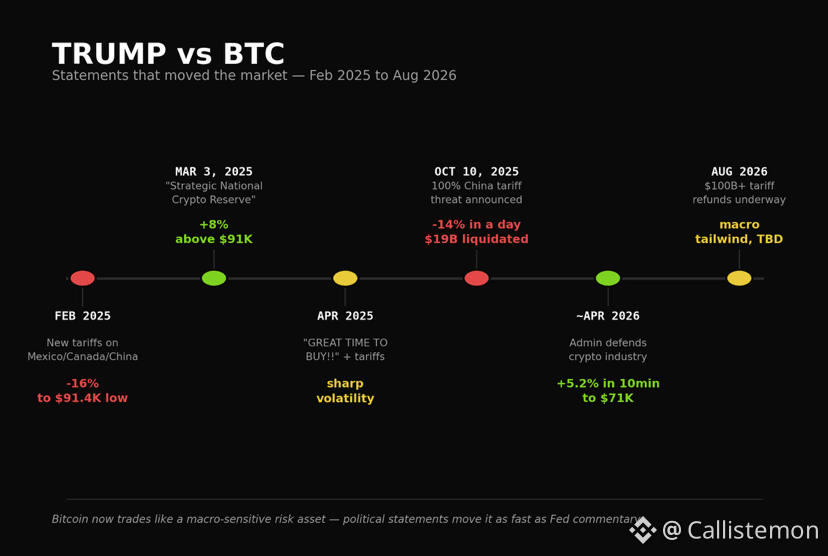
ඒක ට්රම්ප්ගේ ඇත්ත කාලයේ වෙළඳපොල වෙනස් කරන ප්රකාශ (tariff threats) සහ ප්රතිපත්ති වෙනස්වීම් එක්ක බලද්දී, ප්රතිචාර ඉතා පැහැදිලි හා සමන්විතයි: 2025 පෙබරවාරි වලදී tariff වලට -16%, "Strategic Reserve" නිවේදනයට +8%, ඔක්තෝබරයේ චීන tariff තර්ජනය එක් දවසක -14%, සහ පාලනය ක්රිප්ටෝ කර්මාන්තය ආරක්ෂා කළ විට මිනිත්තු 10ක් ඇතුළත +5.2%.
පාඩම: ට්රම්ප්ගේ නම සඳහන් හැම headline එකක්ම catalyst එකක් නොවෙයි. Tariffs, regulation, සහ policy moves තමයි. ජයග්රහණ-ලැප් එක (victory laps) බොහෝවිට එහෙම බලපෑමක් දෙන්න්නේ නැහැ.
මෙම සතියේ සැබෑ catalyst දෙක: සිකුරාදා නිකුත් වන jobs report එක සහ CLARITY Act deadline එක — ඒකෙන් තමයි ඇත්තටම සංඥාව ලැබෙන්නේ. #trump
📊 තවත් ට්රම්ප් දිනයක්. නමුත් එය ඇත්තටම ක්රිප්ටෝවට බලපානවද?
"ආයෝජකයන්ට ඇමෙරිකාව ජයගන්නවා කියලා දැනගෙන ඉන්න නිසා කොටස් වෙළඳපොල වාර්තාවෙන් වාර්තාවට යනවා. ඇමෙරිකාවේ රන් යුගය මේක."
මේ වගේ ප්රකාශ සෑම සති කිහිපයකම වගේ පැතිරෙනවා, හැමවිටම ඒකට සාමාන්ය ප්රතික්රියාව එකම වගේ: ප්රතිචාරයක් වෙයිද කියලා බලාගෙන ඉන්න. ඒ “ආවේගය” ඇත්තටම හරිද කියලා අපි බැලුවා.
ට්රම්ප් විසින් වෙළඳපොල ගැන ඒ වගේ ජයග්රහණ-සංදේශයක් කියූ අවස්ථා හතරක්:
2025 නොවැම්බර් 29 — "වාර්තාගත ඉහළ අගයන්, වාර්තාගත 401(k)" → දුර්වල ප්රතිචාරයක්
2025 දෙසැම්බර් 23 — ශක්තිමත් GDP/පහළ පොලී අනුපාත දත්ත සමඟින් "රන් යුගය" කියලා → ඊළඟ දවසේ වෙළඳපොළ බිඳ වැටුණා
2026 ජනවාරි 7 — "වෙළඳපොළ නව වාර්තා උඩට" → ක්රිප්ටෝවට බලපෑමක් නැහැ
2026 ජූලි 3 — "රන් යුගය", හොඳම කාර්තුව → BTC ඒ දවසේම ඇත්තටම 2%ක් ඉහළට ගියා
ස්කෝරය: 1 බිඳ වැටීමක්, 2ක්ම ප්රතිචාර නැහැ, 1ක්ම ඉහළ යාමක්. ඒකෙන් වෙළඳාම කරන්න පුළුවන් “pattern” එකක් නෙවෙයි — එය ශබ්දයට වඩා වැඩියෙන්. ඇත්තටම බිඳ වැටුණ එක බොහෝවිට ආවේ statement එකෙන් නෙවෙයි; ඒ දවසේම GDP/පහළ පොලී අනුපාත දත්ත වැටුණ එකෙන්.
ඒක ට්රම්ප්ගේ ඇත්ත කාලයේ වෙළඳපොල වෙනස් කරන ප්රකාශ (tariff threats) සහ ප්රතිපත්ති වෙනස්වීම් එක්ක බලද්දී, ප්රතිචාර ඉතා පැහැදිලි හා සමන්විතයි: 2025 පෙබරවාරි වලදී tariff වලට -16%, "Strategic Reserve" නිවේදනයට +8%, ඔක්තෝබරයේ චීන tariff තර්ජනය එක් දවසක -14%, සහ පාලනය ක්රිප්ටෝ කර්මාන්තය ආරක්ෂා කළ විට මිනිත්තු 10ක් ඇතුළත +5.2%.
පාඩම: ට්රම්ප්ගේ නම සඳහන් හැම headline එකක්ම catalyst එකක් නොවෙයි. Tariffs, regulation, සහ policy moves තමයි. ජයග්රහණ-ලැප් එක (victory laps) බොහෝවිට එහෙම බලපෑමක් දෙන්න්නේ නැහැ.
මෙම සතියේ සැබෑ catalyst දෙක: සිකුරාදා නිකුත් වන jobs report එක සහ CLARITY Act deadline එක — ඒකෙන් තමයි ඇත්තටම සංඥාව ලැබෙන්නේ. #trump
"ආයෝජකයන්ට ඇමෙරිකාව ජයගන්නවා කියලා දැනගෙන ඉන්න නිසා කොටස් වෙළඳපොල වාර්තාවෙන් වාර්තාවට යනවා. ඇමෙරිකාවේ රන් යුගය මේක."
මේ වගේ ප්රකාශ සෑම සති කිහිපයකම වගේ පැතිරෙනවා, හැමවිටම ඒකට සාමාන්ය ප්රතික්රියාව එකම වගේ: ප්රතිචාරයක් වෙයිද කියලා බලාගෙන ඉන්න. ඒ “ආවේගය” ඇත්තටම හරිද කියලා අපි බැලුවා.
ට්රම්ප් විසින් වෙළඳපොල ගැන ඒ වගේ ජයග්රහණ-සංදේශයක් කියූ අවස්ථා හතරක්:
2025 නොවැම්බර් 29 — "වාර්තාගත ඉහළ අගයන්, වාර්තාගත 401(k)" → දුර්වල ප්රතිචාරයක්
2025 දෙසැම්බර් 23 — ශක්තිමත් GDP/පහළ පොලී අනුපාත දත්ත සමඟින් "රන් යුගය" කියලා → ඊළඟ දවසේ වෙළඳපොළ බිඳ වැටුණා
2026 ජනවාරි 7 — "වෙළඳපොළ නව වාර්තා උඩට" → ක්රිප්ටෝවට බලපෑමක් නැහැ
2026 ජූලි 3 — "රන් යුගය", හොඳම කාර්තුව → BTC ඒ දවසේම ඇත්තටම 2%ක් ඉහළට ගියා
ස්කෝරය: 1 බිඳ වැටීමක්, 2ක්ම ප්රතිචාර නැහැ, 1ක්ම ඉහළ යාමක්. ඒකෙන් වෙළඳාම කරන්න පුළුවන් “pattern” එකක් නෙවෙයි — එය ශබ්දයට වඩා වැඩියෙන්. ඇත්තටම බිඳ වැටුණ එක බොහෝවිට ආවේ statement එකෙන් නෙවෙයි; ඒ දවසේම GDP/පහළ පොලී අනුපාත දත්ත වැටුණ එකෙන්.
ඒක ට්රම්ප්ගේ ඇත්ත කාලයේ වෙළඳපොල වෙනස් කරන ප්රකාශ (tariff threats) සහ ප්රතිපත්ති වෙනස්වීම් එක්ක බලද්දී, ප්රතිචාර ඉතා පැහැදිලි හා සමන්විතයි: 2025 පෙබරවාරි වලදී tariff වලට -16%, "Strategic Reserve" නිවේදනයට +8%, ඔක්තෝබරයේ චීන tariff තර්ජනය එක් දවසක -14%, සහ පාලනය ක්රිප්ටෝ කර්මාන්තය ආරක්ෂා කළ විට මිනිත්තු 10ක් ඇතුළත +5.2%.
පාඩම: ට්රම්ප්ගේ නම සඳහන් හැම headline එකක්ම catalyst එකක් නොවෙයි. Tariffs, regulation, සහ policy moves තමයි. ජයග්රහණ-ලැප් එක (victory laps) බොහෝවිට එහෙම බලපෑමක් දෙන්න්නේ නැහැ.
මෙම සතියේ සැබෑ catalyst දෙක: සිකුරාදා නිකුත් වන jobs report එක සහ CLARITY Act deadline එක — ඒකෙන් තමයි ඇත්තටම සංඥාව ලැබෙන්නේ. #trump
120
·
--
උසබ තත්ත්වය
📡 $ASTS සැකසුම: සහයෝගී රැලියක්ද, නැත්නම් සැබෑ බිඳුමක්ද?
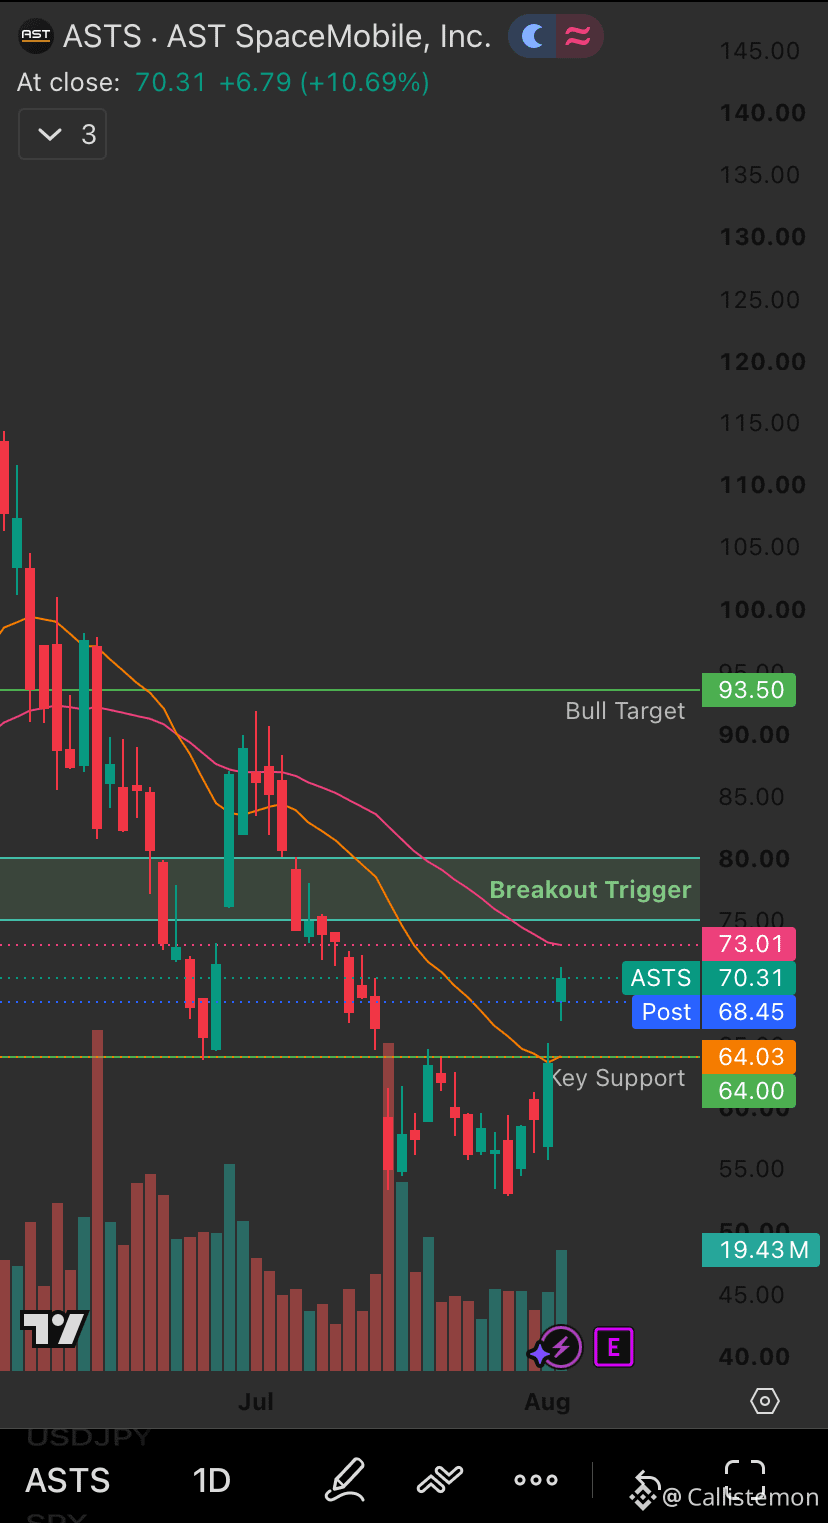
AST SpaceMobile අද 10.69%කින් ඉහළ ගියේ $70.31 ට. එහෙත් එය ගැන අධිකව අදහස් කරන්නට පෙර, සන්දර්භය වැදගත් වේ: මෙය SpaceX හි පළමු වරට මහජනතාවට දෙන ලද මූල්ය වාර්තා ප්රකාශයට පෙර, අංශ මට්ටමින් සිදු වූ චලනයක්. SpaceX 4%ක් ඉහළ ගියා, ASTS 9%, Rocket Lab 6%, සහ රැලිය උපഗ്രහ හා දියත් කිරීමේ නම් දෙකම අතර පුළුල්ව ව්යාප්ත විය. අභිප්රාය පුවත්/Reddit තුළ අවකාශ කොටස් පිළිබඳ හැඟීම් ජූලි මාසයේ දැඩි අස්ථාවර මාසයකින් පසු (අංශය 25-33%ක් පහළ ගිය) දැන් බුලිෂ් වෙලා.
තාක්ෂණික දර්ශනය: ASTS දැන් $73-80 Breakout Trigger කලාපය පරීක්ෂා කරමින් සිටී—$64 වටා ප්රධාන සහාය (Key Support) එක මත නැවත ඉහළට ආ පසු, එය දෙවරක්ම රැඳී තිබෙන නිසා (double bottom). එම කලාපයට ඉහළින්, මෑත ස්විං හයි ස්ට්රක්චරය අනුව සැබෑ ඊළඟ ඉලක්කය $93.50 වේ.
සත්ය ප්රේරකය අදගේ චලනය නොවන්නේ අගෝස්තු 10 යි—එදා ASTS තම ආදායම් වාර්තා කරයි. ආදායම් ඇස්තමේන්තු $34.54M ලෙස තියෙනවා; එය වසරකට පෙර $1.16M පමණ වූ තත්ත්වයෙන් විශාල ලෙස ඉහළ යාමක්. පාඩුද හැකිලෙනවා (EPS ඇස්තමේන්තුව -$0.29 එදිරිව YoY -$0.41). විශ්ලේෂක මතය දැන් සැබෑ ලෙස බෙදෙලා: Piper Sandler සතුව $100 ඉලක්කයක් (Overweight) තියෙනවා, B.Riley $85 (Buy) කියනවා, නමුත් Scotiabank ජූලි 29 දින තවදුරටත් $50.80 දක්වා කපා දැමුවා (Sector Perform)—ඒ ඇත්තටම අද මිලට වඩා අඩු ඉලක්කයක්.
දැනගැනීම වටින ව්යුහාත්මක අවදානමක්: ASTS අවකාශ අංශ ETF වල (Procure Space වැනි) සැලකිය යුතු බරක් දරනවා—ඒ නිසා සමාගම් පුවත්ට අමතරව, fund flows ඇතුළට හෝ පිටතට යන විට යාන්ත්රිකව මිලදී ගැනීම/විකිණීම බල කරගන්න පුළුවන්.
අවසාන වශයෙන්: අද ඇති වූ උඩුපුටුව, ASTS සඳහා විශේෂ සංඥාවකට වඩා අංශයට ඇති beta එකක් වගේ පේනවා. අගෝස්තු 10 earnings එකෙන් තමා මිල චලනයට පදනම මූල්ය මූලධර්මවල තිබෙනවද කියලා අපට දැනගන්න ලැබෙන්නේ.
මෙය අරගෙන තදින් බලනවාද? අදහස්? 👇
{future}(ASTSUSDT)
📡 $ASTS සැකසුම: සහයෝගී රැලියක්ද, නැත්නම් සැබෑ බිඳුමක්ද?
AST SpaceMobile අද 10.69%කින් ඉහළ ගියේ $70.31 ට. එහෙත් එය ගැන අධිකව අදහස් කරන්නට පෙර, සන්දර්භය වැදගත් වේ: මෙය SpaceX හි පළමු වරට මහජනතාවට දෙන ලද මූල්ය වාර්තා ප්රකාශයට පෙර, අංශ මට්ටමින් සිදු වූ චලනයක්. SpaceX 4%ක් ඉහළ ගියා, ASTS 9%, Rocket Lab 6%, සහ රැලිය උපഗ്രහ හා දියත් කිරීමේ නම් දෙකම අතර පුළුල්ව ව්යාප්ත විය. අභිප්රාය පුවත්/Reddit තුළ අවකාශ කොටස් පිළිබඳ හැඟීම් ජූලි මාසයේ දැඩි අස්ථාවර මාසයකින් පසු (අංශය 25-33%ක් පහළ ගිය) දැන් බුලිෂ් වෙලා.
තාක්ෂණික දර්ශනය: ASTS දැන් $73-80 Breakout Trigger කලාපය පරීක්ෂා කරමින් සිටී—$64 වටා ප්රධාන සහාය (Key Support) එක මත නැවත ඉහළට ආ පසු, එය දෙවරක්ම රැඳී තිබෙන නිසා (double bottom). එම කලාපයට ඉහළින්, මෑත ස්විං හයි ස්ට්රක්චරය අනුව සැබෑ ඊළඟ ඉලක්කය $93.50 වේ.
සත්ය ප්රේරකය අදගේ චලනය නොවන්නේ අගෝස්තු 10 යි—එදා ASTS තම ආදායම් වාර්තා කරයි. ආදායම් ඇස්තමේන්තු $34.54M ලෙස තියෙනවා; එය වසරකට පෙර $1.16M පමණ වූ තත්ත්වයෙන් විශාල ලෙස ඉහළ යාමක්. පාඩුද හැකිලෙනවා (EPS ඇස්තමේන්තුව -$0.29 එදිරිව YoY -$0.41). විශ්ලේෂක මතය දැන් සැබෑ ලෙස බෙදෙලා: Piper Sandler සතුව $100 ඉලක්කයක් (Overweight) තියෙනවා, B.Riley $85 (Buy) කියනවා, නමුත් Scotiabank ජූලි 29 දින තවදුරටත් $50.80 දක්වා කපා දැමුවා (Sector Perform)—ඒ ඇත්තටම අද මිලට වඩා අඩු ඉලක්කයක්.
දැනගැනීම වටින ව්යුහාත්මක අවදානමක්: ASTS අවකාශ අංශ ETF වල (Procure Space වැනි) සැලකිය යුතු බරක් දරනවා—ඒ නිසා සමාගම් පුවත්ට අමතරව, fund flows ඇතුළට හෝ පිටතට යන විට යාන්ත්රිකව මිලදී ගැනීම/විකිණීම බල කරගන්න පුළුවන්.
අවසාන වශයෙන්: අද ඇති වූ උඩුපුටුව, ASTS සඳහා විශේෂ සංඥාවකට වඩා අංශයට ඇති beta එකක් වගේ පේනවා. අගෝස්තු 10 earnings එකෙන් තමා මිල චලනයට පදනම මූල්ය මූලධර්මවල තිබෙනවද කියලා අපට දැනගන්න ලැබෙන්නේ.
මෙය අරගෙන තදින් බලනවාද? අදහස්? 👇
AST SpaceMobile අද 10.69%කින් ඉහළ ගියේ $70.31 ට. එහෙත් එය ගැන අධිකව අදහස් කරන්නට පෙර, සන්දර්භය වැදගත් වේ: මෙය SpaceX හි පළමු වරට මහජනතාවට දෙන ලද මූල්ය වාර්තා ප්රකාශයට පෙර, අංශ මට්ටමින් සිදු වූ චලනයක්. SpaceX 4%ක් ඉහළ ගියා, ASTS 9%, Rocket Lab 6%, සහ රැලිය උපഗ്രහ හා දියත් කිරීමේ නම් දෙකම අතර පුළුල්ව ව්යාප්ත විය. අභිප්රාය පුවත්/Reddit තුළ අවකාශ කොටස් පිළිබඳ හැඟීම් ජූලි මාසයේ දැඩි අස්ථාවර මාසයකින් පසු (අංශය 25-33%ක් පහළ ගිය) දැන් බුලිෂ් වෙලා.
තාක්ෂණික දර්ශනය: ASTS දැන් $73-80 Breakout Trigger කලාපය පරීක්ෂා කරමින් සිටී—$64 වටා ප්රධාන සහාය (Key Support) එක මත නැවත ඉහළට ආ පසු, එය දෙවරක්ම රැඳී තිබෙන නිසා (double bottom). එම කලාපයට ඉහළින්, මෑත ස්විං හයි ස්ට්රක්චරය අනුව සැබෑ ඊළඟ ඉලක්කය $93.50 වේ.
සත්ය ප්රේරකය අදගේ චලනය නොවන්නේ අගෝස්තු 10 යි—එදා ASTS තම ආදායම් වාර්තා කරයි. ආදායම් ඇස්තමේන්තු $34.54M ලෙස තියෙනවා; එය වසරකට පෙර $1.16M පමණ වූ තත්ත්වයෙන් විශාල ලෙස ඉහළ යාමක්. පාඩුද හැකිලෙනවා (EPS ඇස්තමේන්තුව -$0.29 එදිරිව YoY -$0.41). විශ්ලේෂක මතය දැන් සැබෑ ලෙස බෙදෙලා: Piper Sandler සතුව $100 ඉලක්කයක් (Overweight) තියෙනවා, B.Riley $85 (Buy) කියනවා, නමුත් Scotiabank ජූලි 29 දින තවදුරටත් $50.80 දක්වා කපා දැමුවා (Sector Perform)—ඒ ඇත්තටම අද මිලට වඩා අඩු ඉලක්කයක්.
දැනගැනීම වටින ව්යුහාත්මක අවදානමක්: ASTS අවකාශ අංශ ETF වල (Procure Space වැනි) සැලකිය යුතු බරක් දරනවා—ඒ නිසා සමාගම් පුවත්ට අමතරව, fund flows ඇතුළට හෝ පිටතට යන විට යාන්ත්රිකව මිලදී ගැනීම/විකිණීම බල කරගන්න පුළුවන්.
අවසාන වශයෙන්: අද ඇති වූ උඩුපුටුව, ASTS සඳහා විශේෂ සංඥාවකට වඩා අංශයට ඇති beta එකක් වගේ පේනවා. අගෝස්තු 10 earnings එකෙන් තමා මිල චලනයට පදනම මූල්ය මූලධර්මවල තිබෙනවද කියලා අපට දැනගන්න ලැබෙන්නේ.
මෙය අරගෙන තදින් බලනවාද? අදහස්? 👇
1
102
·
--
උසබ තත්ත්වය
සත්යායනය කළ
🔵 $SUI සැකසුම: ශක්තිමත් අත්තිවාරම්, පසුගාමී තාක්ෂණික දර්ශක
Sui විසින් අබුඩාබියේ Mubadala විසින් ජාලය මත $75M පෞද්ගලික වෙළඳපල අරමුදලක් ටෝකනයිස් කිරීම හරහා සැබෑ ආයතනික සන්ධිස්ථානයක් වෙත පැමිණ ඇත. මෙය කථා-පාදක අනුමාන වර්ගයක් නොව, දිගු කාලීනව වැදගත් වන සැබෑ මුල්ය වෙන් කිරීමකි.
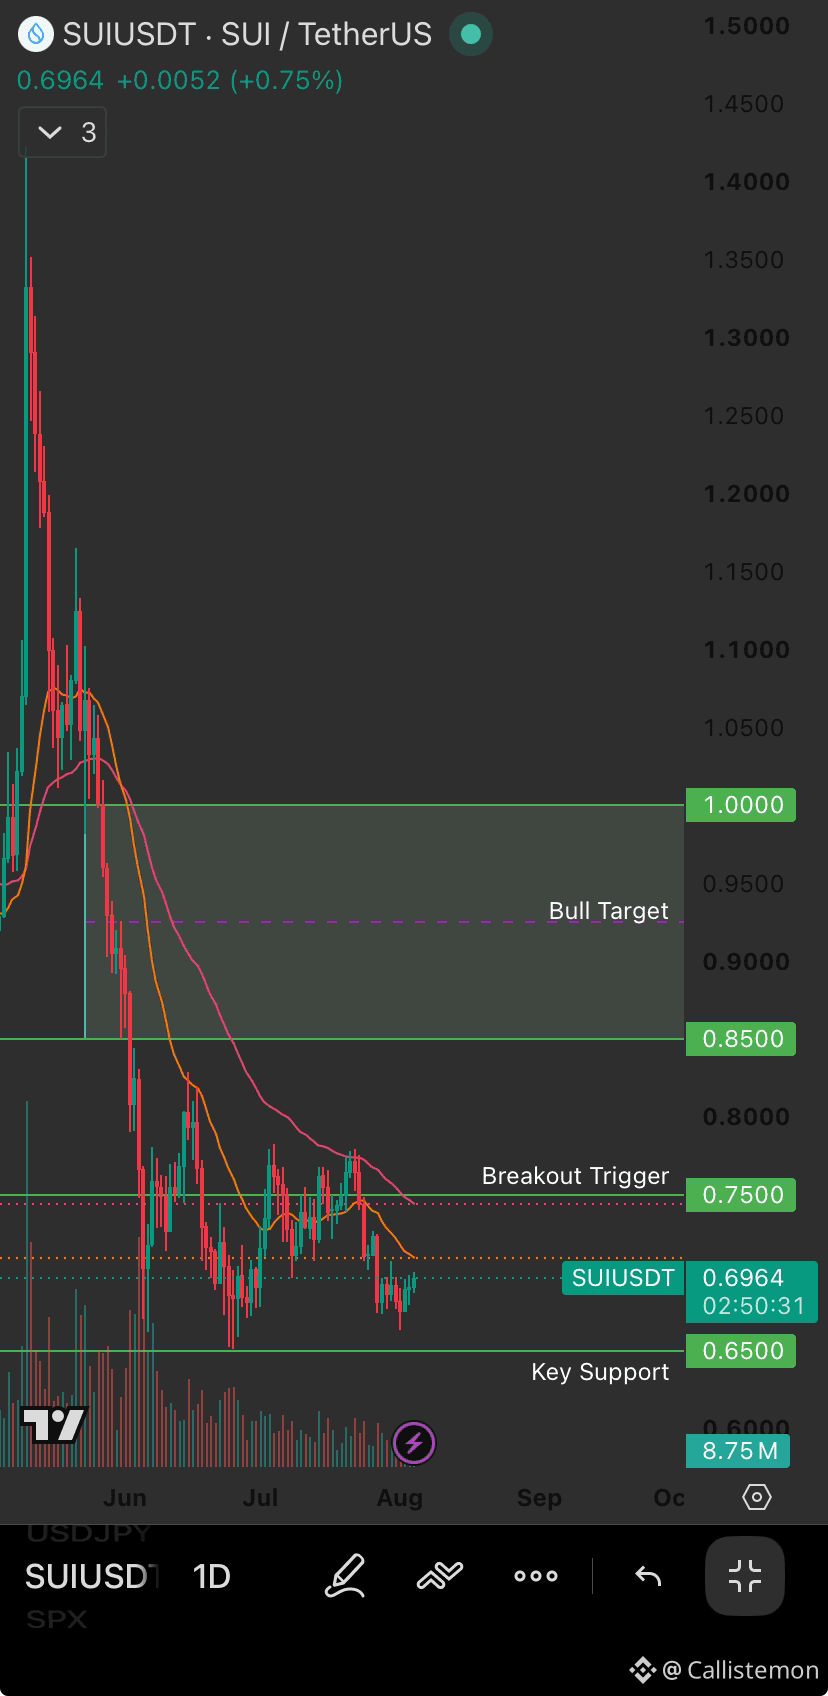
නමුත් තාක්ෂණික දර්ශනය තවම එය තහවුරු කර නැත. SUI $0.6967ට වෙළඳාම් කරමින් තිබේ; එය තම 50-දින හා 200-දින චලන සාමාන්ය දෙකටම පහළින්ය (200D වර්තමාන මිලට වඩා 35%කට වැඩි ඉහළින් පවතිනවා). සතිපතා චාර්ට් එකේ තවමත් මාස කිහිපයක් තිස්සේ පවතින පහළට යන චැනල්/මාර්ගයක් පෙන්වයි.
මට්ටම්:
🟢 බ්රේක්අවුට් ට්රිගර්: පරිමාව සමඟ $0.75 නැවත අත්පත් කරගැනීමෙන් $0.85-$1.00 දෙසට මාර්ගයක් විවෘත වෙයි
🔴 ප්රධාන සහාය: $0.65 පහතට වැටීමෙන් තවත් ගැඹුරු චලනයක් ඇතිවීමේ අවදානම වැඩි ය (පුළුල් චැනල් ව්යුහය අනුව)
දැනට මිල මේ දෙක අතර සිරවී ඇත; මූලික කතාව සහ තාක්ෂණික සැකසුම අතර ඇති එම පරතරය වචනයෙන්ම නරඹා බැලිය යුතු ආතතියයි. මේ මසදීම සුළු ටෝකන් අൺලොක් එකක් (~0.55% සැපයුම වැඩිවීම) ද පැමිණෙමින් තිබුණත්, එය විශාල බරපතල අධික දාමයක් නොව—දැනුවත් වීම වටිනවා.
ආයතනික අනුග්රහය සියවිටම මිල තුළ ඉක්මනින් පෙන්වෙන්නේ නැහැ. ප්රශ්නය වන්නේ SUIගේ චාර්ට් එක කතාවට අනුව ඉදිරියට පැමිණෙයිද, නැතහොත් ඒ කතාව ඒ වෙනකොටම අඩුවෙයිද යන්නයි.
මේකට ඔබ කොහොමද ස්ථානගත වෙලා ඉන්නේ? 👇
{future}(SUIUSDT)
🔵 $SUI සැකසුම: ශක්තිමත් අත්තිවාරම්, පසුගාමී තාක්ෂණික දර්ශක
Sui විසින් අබුඩාබියේ Mubadala විසින් ජාලය මත $75M පෞද්ගලික වෙළඳපල අරමුදලක් ටෝකනයිස් කිරීම හරහා සැබෑ ආයතනික සන්ධිස්ථානයක් වෙත පැමිණ ඇත. මෙය කථා-පාදක අනුමාන වර්ගයක් නොව, දිගු කාලීනව වැදගත් වන සැබෑ මුල්ය වෙන් කිරීමකි.
නමුත් තාක්ෂණික දර්ශනය තවම එය තහවුරු කර නැත. SUI $0.6967ට වෙළඳාම් කරමින් තිබේ; එය තම 50-දින හා 200-දින චලන සාමාන්ය දෙකටම පහළින්ය (200D වර්තමාන මිලට වඩා 35%කට වැඩි ඉහළින් පවතිනවා). සතිපතා චාර්ට් එකේ තවමත් මාස කිහිපයක් තිස්සේ පවතින පහළට යන චැනල්/මාර්ගයක් පෙන්වයි.
මට්ටම්:
🟢 බ්රේක්අවුට් ට්රිගර්: පරිමාව සමඟ $0.75 නැවත අත්පත් කරගැනීමෙන් $0.85-$1.00 දෙසට මාර්ගයක් විවෘත වෙයි
🔴 ප්රධාන සහාය: $0.65 පහතට වැටීමෙන් තවත් ගැඹුරු චලනයක් ඇතිවීමේ අවදානම වැඩි ය (පුළුල් චැනල් ව්යුහය අනුව)
දැනට මිල මේ දෙක අතර සිරවී ඇත; මූලික කතාව සහ තාක්ෂණික සැකසුම අතර ඇති එම පරතරය වචනයෙන්ම නරඹා බැලිය යුතු ආතතියයි. මේ මසදීම සුළු ටෝකන් අൺලොක් එකක් (~0.55% සැපයුම වැඩිවීම) ද පැමිණෙමින් තිබුණත්, එය විශාල බරපතල අධික දාමයක් නොව—දැනුවත් වීම වටිනවා.
ආයතනික අනුග්රහය සියවිටම මිල තුළ ඉක්මනින් පෙන්වෙන්නේ නැහැ. ප්රශ්නය වන්නේ SUIගේ චාර්ට් එක කතාවට අනුව ඉදිරියට පැමිණෙයිද, නැතහොත් ඒ කතාව ඒ වෙනකොටම අඩුවෙයිද යන්නයි.
මේකට ඔබ කොහොමද ස්ථානගත වෙලා ඉන්නේ? 👇
Sui විසින් අබුඩාබියේ Mubadala විසින් ජාලය මත $75M පෞද්ගලික වෙළඳපල අරමුදලක් ටෝකනයිස් කිරීම හරහා සැබෑ ආයතනික සන්ධිස්ථානයක් වෙත පැමිණ ඇත. මෙය කථා-පාදක අනුමාන වර්ගයක් නොව, දිගු කාලීනව වැදගත් වන සැබෑ මුල්ය වෙන් කිරීමකි.
නමුත් තාක්ෂණික දර්ශනය තවම එය තහවුරු කර නැත. SUI $0.6967ට වෙළඳාම් කරමින් තිබේ; එය තම 50-දින හා 200-දින චලන සාමාන්ය දෙකටම පහළින්ය (200D වර්තමාන මිලට වඩා 35%කට වැඩි ඉහළින් පවතිනවා). සතිපතා චාර්ට් එකේ තවමත් මාස කිහිපයක් තිස්සේ පවතින පහළට යන චැනල්/මාර්ගයක් පෙන්වයි.
මට්ටම්:
🟢 බ්රේක්අවුට් ට්රිගර්: පරිමාව සමඟ $0.75 නැවත අත්පත් කරගැනීමෙන් $0.85-$1.00 දෙසට මාර්ගයක් විවෘත වෙයි
🔴 ප්රධාන සහාය: $0.65 පහතට වැටීමෙන් තවත් ගැඹුරු චලනයක් ඇතිවීමේ අවදානම වැඩි ය (පුළුල් චැනල් ව්යුහය අනුව)
දැනට මිල මේ දෙක අතර සිරවී ඇත; මූලික කතාව සහ තාක්ෂණික සැකසුම අතර ඇති එම පරතරය වචනයෙන්ම නරඹා බැලිය යුතු ආතතියයි. මේ මසදීම සුළු ටෝකන් අൺලොක් එකක් (~0.55% සැපයුම වැඩිවීම) ද පැමිණෙමින් තිබුණත්, එය විශාල බරපතල අධික දාමයක් නොව—දැනුවත් වීම වටිනවා.
ආයතනික අනුග්රහය සියවිටම මිල තුළ ඉක්මනින් පෙන්වෙන්නේ නැහැ. ප්රශ්නය වන්නේ SUIගේ චාර්ට් එක කතාවට අනුව ඉදිරියට පැමිණෙයිද, නැතහොත් ඒ කතාව ඒ වෙනකොටම අඩුවෙයිද යන්නයි.
මේකට ඔබ කොහොමද ස්ථානගත වෙලා ඉන්නේ? 👇
1
141
·
--
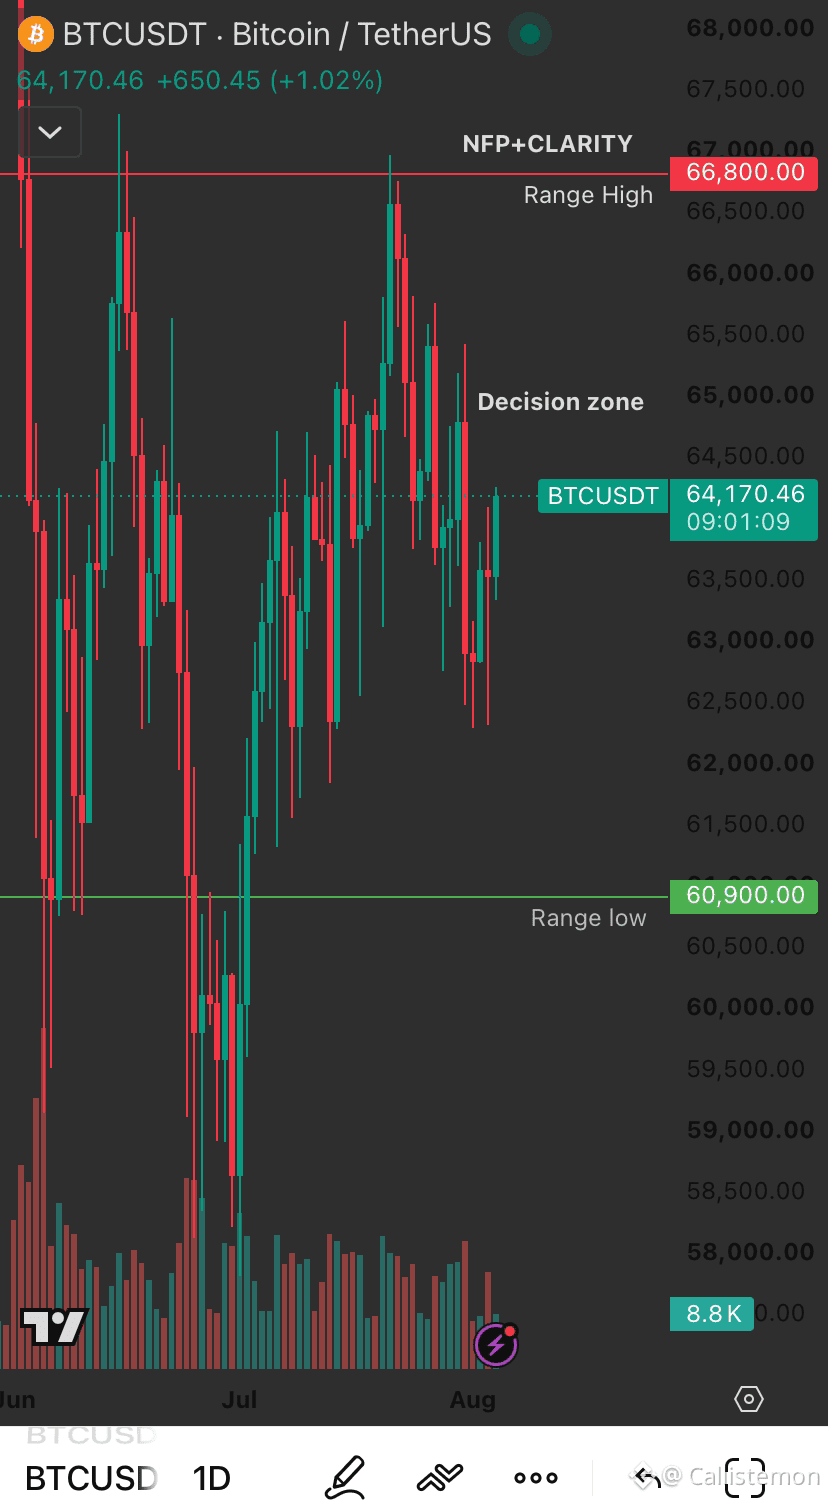
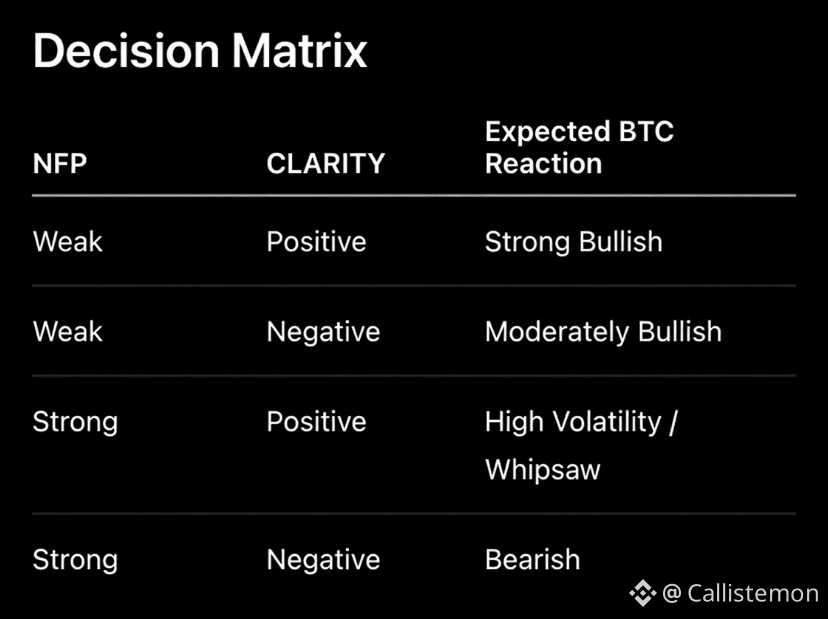
බිට්කොයින් තීරණ ගමන් කලාපයකට පැමිණ ඇත.
ඊළඟ පියවර තාක්ෂණික කරුණු වලින් පමණක් තීරණය නොවෙන්නට පුළුවන්.
බිට්කොයින් එක් උද්දීපකයක් සඳහා බලා සිටින්නේ නැත.
ඒ වෙනුවට එය බලා සිටින්නේ දෙකකටයි:
NFP + CLARITY
තීරණ මැට්රික්ස් එක සිකුරාදා දියත් වේ 👇
වෙළඳපොළ අගය කරන්නේ කුමන ප්රතිඵලය අඩුවෙන්ද කියලා ඔබ සිතන්නේ?
#Bitcoin #BTC #Macro #NFP
බිට්කොයින් තීරණ ගමන් කලාපයකට පැමිණ ඇත.
ඊළඟ පියවර තාක්ෂණික කරුණු වලින් පමණක් තීරණය නොවෙන්නට පුළුවන්.
බිට්කොයින් එක් උද්දීපකයක් සඳහා බලා සිටින්නේ නැත.
ඒ වෙනුවට එය බලා සිටින්නේ දෙකකටයි:
NFP + CLARITY
තීරණ මැට්රික්ස් එක සිකුරාදා දියත් වේ 👇
වෙළඳපොළ අගය කරන්නේ කුමන ප්රතිඵලය අඩුවෙන්ද කියලා ඔබ සිතන්නේ?
#Bitcoin #BTC #Macro #NFP
ඊළඟ පියවර තාක්ෂණික කරුණු වලින් පමණක් තීරණය නොවෙන්නට පුළුවන්.
බිට්කොයින් එක් උද්දීපකයක් සඳහා බලා සිටින්නේ නැත.
ඒ වෙනුවට එය බලා සිටින්නේ දෙකකටයි:
NFP + CLARITY
තීරණ මැට්රික්ස් එක සිකුරාදා දියත් වේ 👇
වෙළඳපොළ අගය කරන්නේ කුමන ප්රතිඵලය අඩුවෙන්ද කියලා ඔබ සිතන්නේ?
#Bitcoin #BTC #Macro #NFP
78
·
--
උසබ තත්ත්වය
📊 මෙම සතියේ සැකසුම: Strategy සටන් විකිණුම්, CLARITY නතරවීම්, BTC නැතිවම කොටස් ඉහළ යනවා
සතියේ ඉතිරි කොටස සඳහා නිරීක්ෂණය කළ යුතු කරුණු තුනක්:
1. Strategy සිය BTC කොටස් 1,638ක් කපා දැමුවා — $104.7Mකට විකුණලා (සාමාන්ය $63,957). ඒ මුදල් ප්රියතම කොටස් ලාභාංශ ගෙවීම සහ STRC ආපසු මිලදී ගැනීම් සඳහා යොදාගෙන තිබෙනවා. කඩදාසි මත accumulation උපාය වෙනස්වීමක් නොවේ: Strategy YTD තුළ විකුණලා තියෙන්නේ 3,620ක් පමණක් වන අතර, මිලදී ගෙන තියෙන්නේ 174,895 BTCක්. නමුත් සන්දර්භය වැදගත්: MSTR තම 200-දින චලනය වන සාමාන්යයට වඩා 41% පහළින් වෙළඳාම් කරමින් සිටින අතර, ඔක්තෝබර් සිට death-cross ව්යුහයකින් පවතිනවා; තවද, ඩිජිටල් වත්කම් සතුවම් සඳහා තම Q2 හි $8.3Bක පාඩුවක් වාර්තා කළා. ද්රවශීලතා කළමනාකරණය, ඔව් — නමුත් සැබෑ බැලන්ස් ෂීට් පීඩනයකින්.
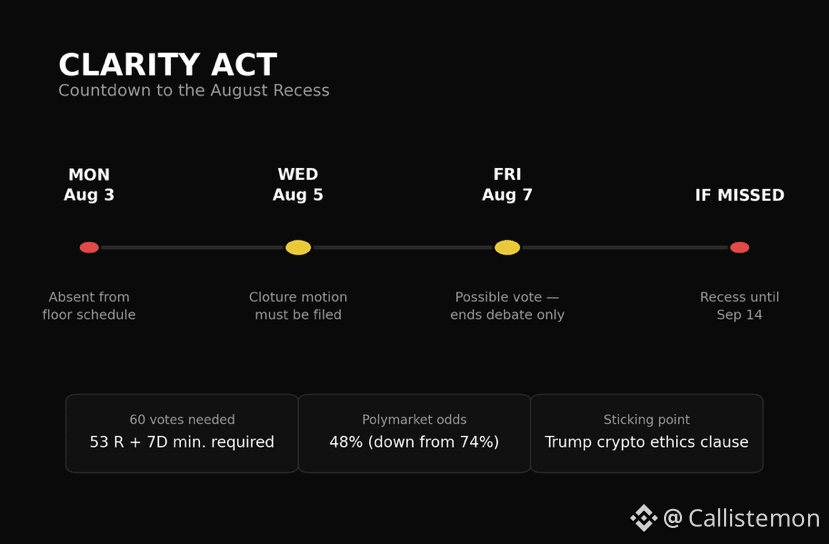
2. CLARITY පනතේ කවුළුව වසා දමමින් තිබෙනවා. සඳුදා සෙනෙට් මහලේ වේලාවන්හි එම පනත ඇතුළත් නොවුණා. නායකත්වය බදාදා (Aug 5)ට පෙර cloture motion එකක් ගොනු නොකළොත්, අගෝස්තු 7 විරාමයට පෙර සිකුරාදා ඡන්දයකට මාර්ගයක් නැහැ — ඒක මග හැරියොත් සැප්තැම්බර් 14 දක්වා බලා සිටීමට වෙනවා. “සාර්ථක” සිකුරාදා ඡන්දයක් වුණත් පනත සම්මත කරන එක නෙවෙයි; proceed කිරීමට ඇති motion එක පිළිබඳ විවාදය අවසන් කරනවා පමණයි. අවස්ථා අඩුවෙලා: Polymarket මාසයකට පෙර තිබුණ 74% සිට 48% දක්වා පහළට, Galaxy Research 2026 සම්මත වීමේ අවස්ථා 50% සිට 30% දක්වා කපා හැරලා. ඇත්තටම ගැටෙන තැනක් තියෙන්නේ නීති-ආචාර ප්රතිපාදනයක් — Trump වාර්තා කළ 2025 crypto ආදායම $1.4Bට සම්බන්ධ. රිපබ්ලිකන්වරුන්ට 7+ Democratic crossovers අවශ්ය වන අතර දැනට ඒවා 2ක් පමණයි; කොන්දේසි සහිතව.
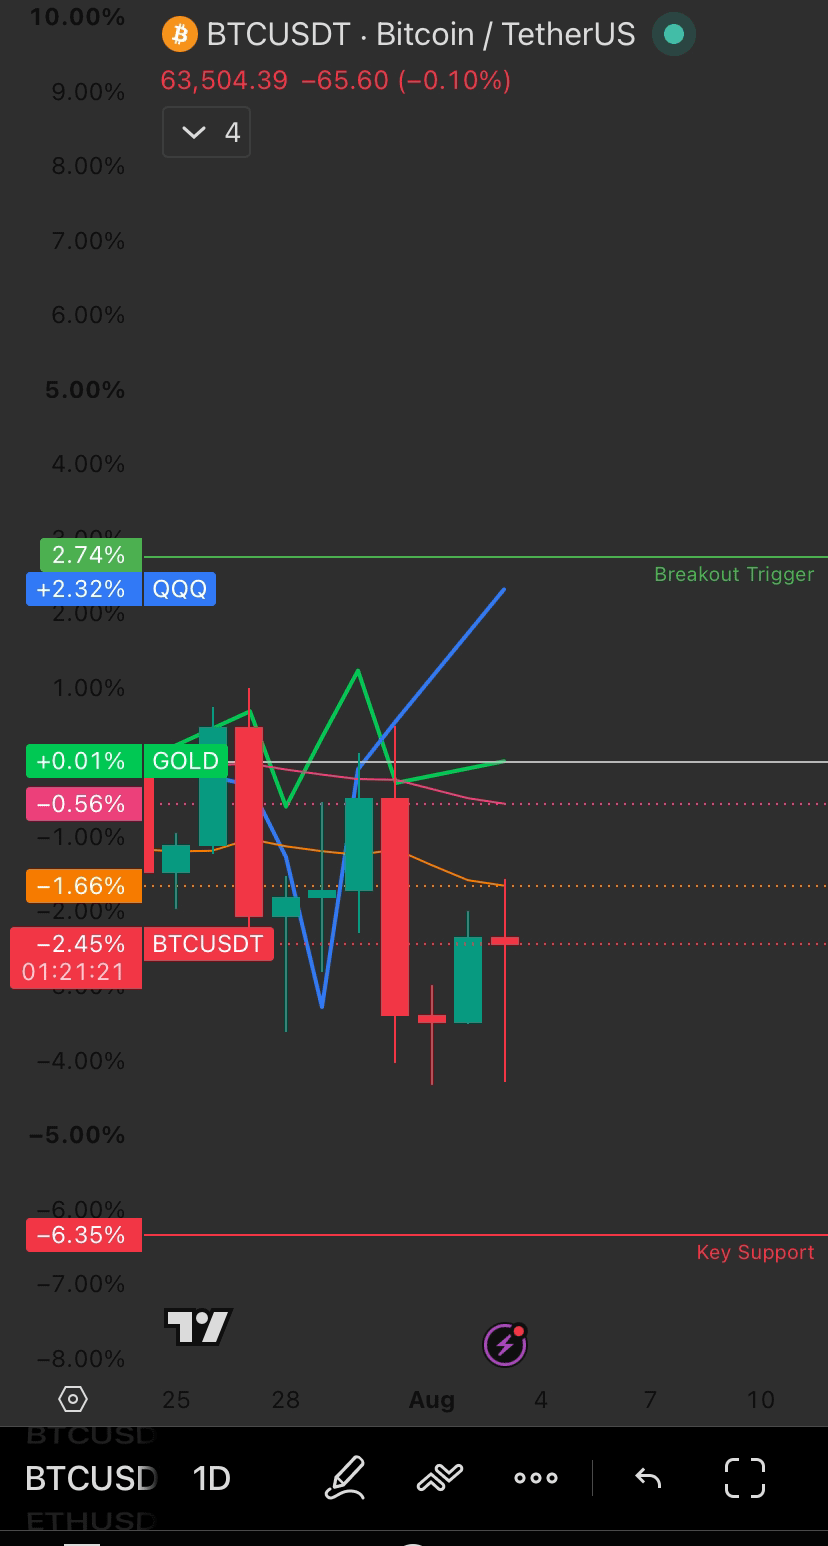
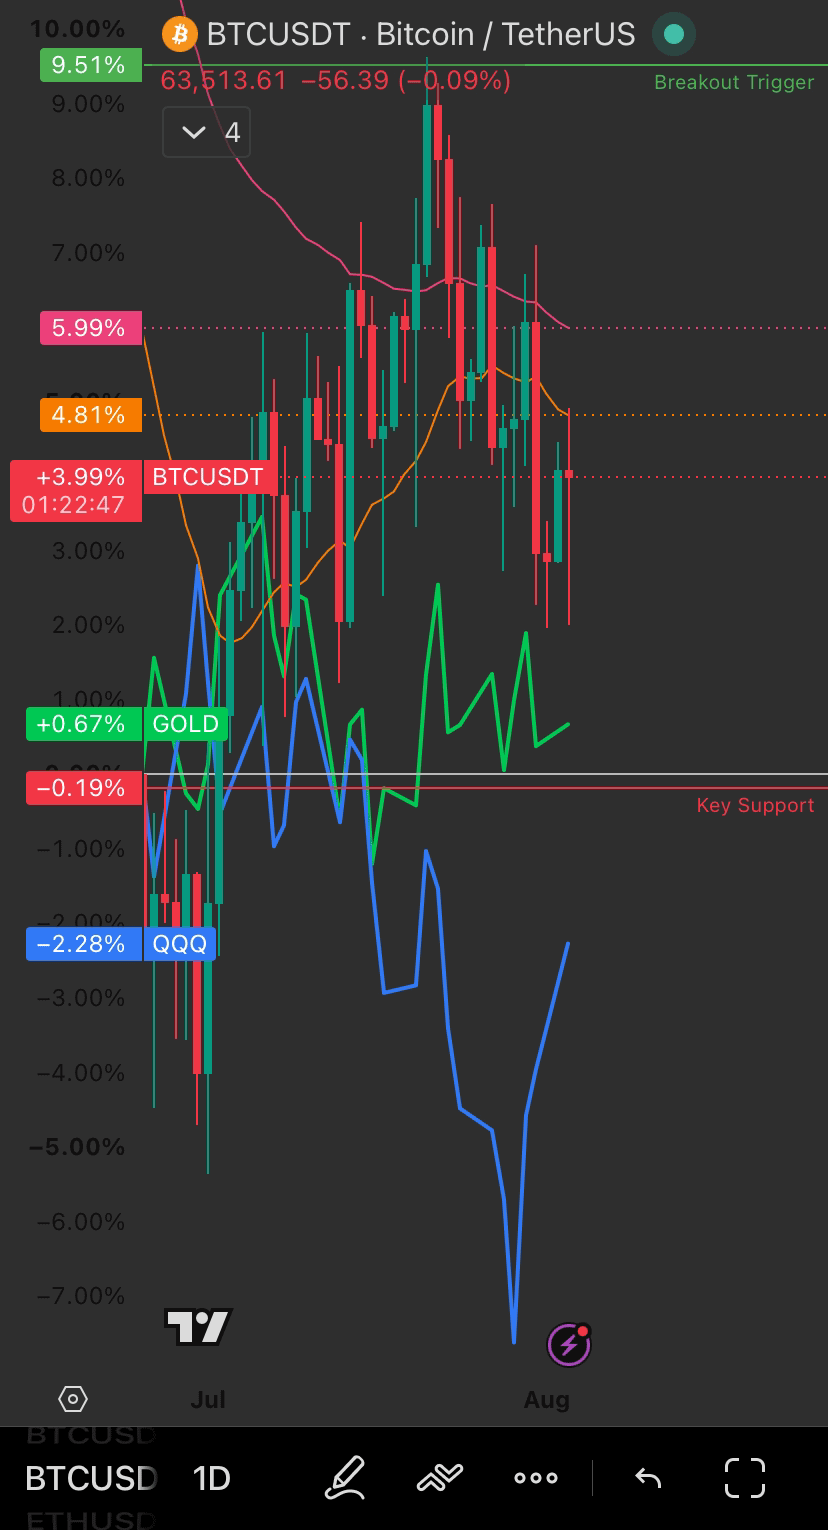
3. කොටස් හදිසියේ ඉහළ ගියා; ක්රිප්ටෝ එයට අනුගමනය කළේ නැහැ. Nasdaq +2.1%, S&P +1.5%, අද ඉරානයේ විරහත් නොගැටුම අඩුවීමේ ප්රබෝධය හේතුවෙන් Dow වාර්තාගත ඉහළ අගයකින් වසා දැමුවා. රන් කිට්ටුවේත් වෙනසක් නැති තරමයි. BTC? +0.25% පමණයි. මෙය නිරීක්ෂණය කළ යුතු සැබෑ වෙනස්කමක් — CLARITY අස්ථාවරත්වය නිසා ක්රිප්ටෝ පසුගාමීද, නැතිනම් සිකුරාදා ඇති ද්විත්ව උත්ප්රේරකයට පෙර (jobs report + CLARITY deadline) තියෙන්නේ පුළුල්ම පසුබෑමක්ද?
මූල්ය සමය පිළිබඳ පසුබිම: අවුරුදු 16කින් ඉතිහාසයේ අවස්ථා 11ක්ම BTC සඳහා අගෝස්තු මාසය රතු වසා තිබුණා — ඉතිහාසගතව ක්රිප්ටෝවට නරකම මාසය. මෙතැනින් ප්රධාන අවස්ථාව: දිගටම chop වෙමින්, සමහර විට නව දේශීය අවමය. නමුත් මෙම සතියේ CLARITY ඇත්තටම වාසි පැත්තට අසහනයකට වඩා පැරැණියක් (upside surprise) ලෙස ක්රියා කළොත්, දැනට සිටින positioning ඉතා තුනී තරම් බැවින්, මෑතකාලයේ තියෙන්නට ඇති තියුණුම short squeezes වලින් එකක් ඇති කරවන්න පුළුවන්.
ඔබ නැඹුරු වන්නේ කුමන දර්ශනයටද? 👇
📊 මෙම සතියේ සැකසුම: Strategy සටන් විකිණුම්, CLARITY නතරවීම්, BTC නැතිවම කොටස් ඉහළ යනවා
සතියේ ඉතිරි කොටස සඳහා නිරීක්ෂණය කළ යුතු කරුණු තුනක්:
1. Strategy සිය BTC කොටස් 1,638ක් කපා දැමුවා — $104.7Mකට විකුණලා (සාමාන්ය $63,957). ඒ මුදල් ප්රියතම කොටස් ලාභාංශ ගෙවීම සහ STRC ආපසු මිලදී ගැනීම් සඳහා යොදාගෙන තිබෙනවා. කඩදාසි මත accumulation උපාය වෙනස්වීමක් නොවේ: Strategy YTD තුළ විකුණලා තියෙන්නේ 3,620ක් පමණක් වන අතර, මිලදී ගෙන තියෙන්නේ 174,895 BTCක්. නමුත් සන්දර්භය වැදගත්: MSTR තම 200-දින චලනය වන සාමාන්යයට වඩා 41% පහළින් වෙළඳාම් කරමින් සිටින අතර, ඔක්තෝබර් සිට death-cross ව්යුහයකින් පවතිනවා; තවද, ඩිජිටල් වත්කම් සතුවම් සඳහා තම Q2 හි $8.3Bක පාඩුවක් වාර්තා කළා. ද්රවශීලතා කළමනාකරණය, ඔව් — නමුත් සැබෑ බැලන්ස් ෂීට් පීඩනයකින්.
2. CLARITY පනතේ කවුළුව වසා දමමින් තිබෙනවා. සඳුදා සෙනෙට් මහලේ වේලාවන්හි එම පනත ඇතුළත් නොවුණා. නායකත්වය බදාදා (Aug 5)ට පෙර cloture motion එකක් ගොනු නොකළොත්, අගෝස්තු 7 විරාමයට පෙර සිකුරාදා ඡන්දයකට මාර්ගයක් නැහැ — ඒක මග හැරියොත් සැප්තැම්බර් 14 දක්වා බලා සිටීමට වෙනවා. “සාර්ථක” සිකුරාදා ඡන්දයක් වුණත් පනත සම්මත කරන එක නෙවෙයි; proceed කිරීමට ඇති motion එක පිළිබඳ විවාදය අවසන් කරනවා පමණයි. අවස්ථා අඩුවෙලා: Polymarket මාසයකට පෙර තිබුණ 74% සිට 48% දක්වා පහළට, Galaxy Research 2026 සම්මත වීමේ අවස්ථා 50% සිට 30% දක්වා කපා හැරලා. ඇත්තටම ගැටෙන තැනක් තියෙන්නේ නීති-ආචාර ප්රතිපාදනයක් — Trump වාර්තා කළ 2025 crypto ආදායම $1.4Bට සම්බන්ධ. රිපබ්ලිකන්වරුන්ට 7+ Democratic crossovers අවශ්ය වන අතර දැනට ඒවා 2ක් පමණයි; කොන්දේසි සහිතව.
3. කොටස් හදිසියේ ඉහළ ගියා; ක්රිප්ටෝ එයට අනුගමනය කළේ නැහැ. Nasdaq +2.1%, S&P +1.5%, අද ඉරානයේ විරහත් නොගැටුම අඩුවීමේ ප්රබෝධය හේතුවෙන් Dow වාර්තාගත ඉහළ අගයකින් වසා දැමුවා. රන් කිට්ටුවේත් වෙනසක් නැති තරමයි. BTC? +0.25% පමණයි. මෙය නිරීක්ෂණය කළ යුතු සැබෑ වෙනස්කමක් — CLARITY අස්ථාවරත්වය නිසා ක්රිප්ටෝ පසුගාමීද, නැතිනම් සිකුරාදා ඇති ද්විත්ව උත්ප්රේරකයට පෙර (jobs report + CLARITY deadline) තියෙන්නේ පුළුල්ම පසුබෑමක්ද?
මූල්ය සමය පිළිබඳ පසුබිම: අවුරුදු 16කින් ඉතිහාසයේ අවස්ථා 11ක්ම BTC සඳහා අගෝස්තු මාසය රතු වසා තිබුණා — ඉතිහාසගතව ක්රිප්ටෝවට නරකම මාසය. මෙතැනින් ප්රධාන අවස්ථාව: දිගටම chop වෙමින්, සමහර විට නව දේශීය අවමය. නමුත් මෙම සතියේ CLARITY ඇත්තටම වාසි පැත්තට අසහනයකට වඩා පැරැණියක් (upside surprise) ලෙස ක්රියා කළොත්, දැනට සිටින positioning ඉතා තුනී තරම් බැවින්, මෑතකාලයේ තියෙන්නට ඇති තියුණුම short squeezes වලින් එකක් ඇති කරවන්න පුළුවන්.
ඔබ නැඹුරු වන්නේ කුමන දර්ශනයටද? 👇
සතියේ ඉතිරි කොටස සඳහා නිරීක්ෂණය කළ යුතු කරුණු තුනක්:
1. Strategy සිය BTC කොටස් 1,638ක් කපා දැමුවා — $104.7Mකට විකුණලා (සාමාන්ය $63,957). ඒ මුදල් ප්රියතම කොටස් ලාභාංශ ගෙවීම සහ STRC ආපසු මිලදී ගැනීම් සඳහා යොදාගෙන තිබෙනවා. කඩදාසි මත accumulation උපාය වෙනස්වීමක් නොවේ: Strategy YTD තුළ විකුණලා තියෙන්නේ 3,620ක් පමණක් වන අතර, මිලදී ගෙන තියෙන්නේ 174,895 BTCක්. නමුත් සන්දර්භය වැදගත්: MSTR තම 200-දින චලනය වන සාමාන්යයට වඩා 41% පහළින් වෙළඳාම් කරමින් සිටින අතර, ඔක්තෝබර් සිට death-cross ව්යුහයකින් පවතිනවා; තවද, ඩිජිටල් වත්කම් සතුවම් සඳහා තම Q2 හි $8.3Bක පාඩුවක් වාර්තා කළා. ද්රවශීලතා කළමනාකරණය, ඔව් — නමුත් සැබෑ බැලන්ස් ෂීට් පීඩනයකින්.
2. CLARITY පනතේ කවුළුව වසා දමමින් තිබෙනවා. සඳුදා සෙනෙට් මහලේ වේලාවන්හි එම පනත ඇතුළත් නොවුණා. නායකත්වය බදාදා (Aug 5)ට පෙර cloture motion එකක් ගොනු නොකළොත්, අගෝස්තු 7 විරාමයට පෙර සිකුරාදා ඡන්දයකට මාර්ගයක් නැහැ — ඒක මග හැරියොත් සැප්තැම්බර් 14 දක්වා බලා සිටීමට වෙනවා. “සාර්ථක” සිකුරාදා ඡන්දයක් වුණත් පනත සම්මත කරන එක නෙවෙයි; proceed කිරීමට ඇති motion එක පිළිබඳ විවාදය අවසන් කරනවා පමණයි. අවස්ථා අඩුවෙලා: Polymarket මාසයකට පෙර තිබුණ 74% සිට 48% දක්වා පහළට, Galaxy Research 2026 සම්මත වීමේ අවස්ථා 50% සිට 30% දක්වා කපා හැරලා. ඇත්තටම ගැටෙන තැනක් තියෙන්නේ නීති-ආචාර ප්රතිපාදනයක් — Trump වාර්තා කළ 2025 crypto ආදායම $1.4Bට සම්බන්ධ. රිපබ්ලිකන්වරුන්ට 7+ Democratic crossovers අවශ්ය වන අතර දැනට ඒවා 2ක් පමණයි; කොන්දේසි සහිතව.
3. කොටස් හදිසියේ ඉහළ ගියා; ක්රිප්ටෝ එයට අනුගමනය කළේ නැහැ. Nasdaq +2.1%, S&P +1.5%, අද ඉරානයේ විරහත් නොගැටුම අඩුවීමේ ප්රබෝධය හේතුවෙන් Dow වාර්තාගත ඉහළ අගයකින් වසා දැමුවා. රන් කිට්ටුවේත් වෙනසක් නැති තරමයි. BTC? +0.25% පමණයි. මෙය නිරීක්ෂණය කළ යුතු සැබෑ වෙනස්කමක් — CLARITY අස්ථාවරත්වය නිසා ක්රිප්ටෝ පසුගාමීද, නැතිනම් සිකුරාදා ඇති ද්විත්ව උත්ප්රේරකයට පෙර (jobs report + CLARITY deadline) තියෙන්නේ පුළුල්ම පසුබෑමක්ද?
මූල්ය සමය පිළිබඳ පසුබිම: අවුරුදු 16කින් ඉතිහාසයේ අවස්ථා 11ක්ම BTC සඳහා අගෝස්තු මාසය රතු වසා තිබුණා — ඉතිහාසගතව ක්රිප්ටෝවට නරකම මාසය. මෙතැනින් ප්රධාන අවස්ථාව: දිගටම chop වෙමින්, සමහර විට නව දේශීය අවමය. නමුත් මෙම සතියේ CLARITY ඇත්තටම වාසි පැත්තට අසහනයකට වඩා පැරැණියක් (upside surprise) ලෙස ක්රියා කළොත්, දැනට සිටින positioning ඉතා තුනී තරම් බැවින්, මෑතකාලයේ තියෙන්නට ඇති තියුණුම short squeezes වලින් එකක් ඇති කරවන්න පුළුවන්.
ඔබ නැඹුරු වන්නේ කුමන දර්ශනයටද? 👇
96
·
--
උසබ තත්ත්වය
🔄 BTC යාවත්කාලීනතාවය — ඉහළ පහළ (Higher Low) තහවුරු වුණා ද?
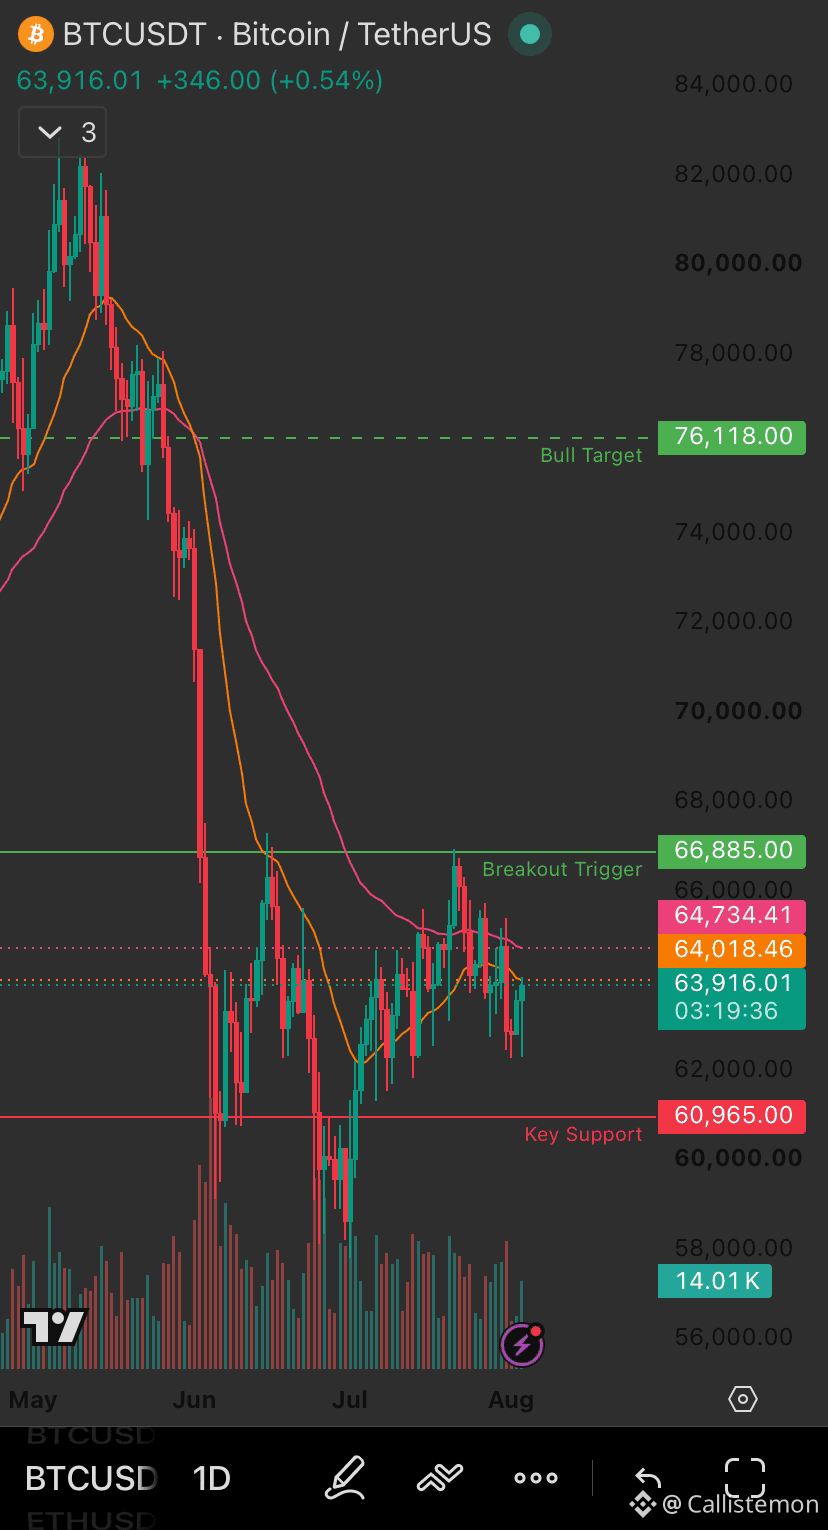
පසුගිය සඳුදාගේ රේන්ජ් ඇමතුමට ($60,965-$66,885) අනුසාරයෙන්: මිල පැහැදිලිවම ඉහළ පහළ ව්යුහයක් මුද්රණය කරලා තියෙනවා. ජූනි මාසයේ පහළ අගය දළ වශයෙන් $58,000 වුණා; ජූලිගේ පසුබැසීම $60,965 දක්වා පැවතුණේ එය ඉහළින්ම ස්ථිරව. ඒ වගේ ඉහළ පහළ එකක් බලාපොරොත්තුකාරී ව්යුහය intact ලෙස තබාගන්නවා.
දැනට BTC $63,942 වටා ගනුදෙනු වෙමින්, ඒ වැදගත් support zone එකට ඉහළින් සුව පහසුවෙන් රැඳී සිටිනවා.
සඳුදා දින සිට අදාළ මට්ටම් තවමත් මෙන්න:
🟢 $66,885 (Breakout Trigger) ඉහළින් close එකක් තිබ්බොත් $76,118 (Bull Target) වෙත යාමේ මාර්ගය විවෘත වෙනවා
🔴 $60,965 (Key Support) අහිමි වුණොත් ඉහළ-පහළ ව්යුහය බිඳ දමයිවි, නැවත $54,000 ක්රීඩා තලයට එයි
මේ දේවල් තවමත් තහවුරු කරලා නැහැ — අපි තවම range තුළයි, නමුත් සඳුදා දකින්න ලැබුණු තරම් නොව හොඳින් ව්යුහය රැඳීගෙන යනවා. ඊළඟ සැබෑ උත්ප්රේරකය ලෙස සිකුරාදා jobs report එක බලාගෙන ඉන්නවා.
මෙම range එකේ සෙල්ලම් කරන අය ඉන්නවද, නැත්නම් breakout confirmation එක බලාගෙනද? 👇 $BTC
{future}(BTCUSDT)
🔄 BTC යාවත්කාලීනතාවය — ඉහළ පහළ (Higher Low) තහවුරු වුණා ද?
පසුගිය සඳුදාගේ රේන්ජ් ඇමතුමට ($60,965-$66,885) අනුසාරයෙන්: මිල පැහැදිලිවම ඉහළ පහළ ව්යුහයක් මුද්රණය කරලා තියෙනවා. ජූනි මාසයේ පහළ අගය දළ වශයෙන් $58,000 වුණා; ජූලිගේ පසුබැසීම $60,965 දක්වා පැවතුණේ එය ඉහළින්ම ස්ථිරව. ඒ වගේ ඉහළ පහළ එකක් බලාපොරොත්තුකාරී ව්යුහය intact ලෙස තබාගන්නවා.
දැනට BTC $63,942 වටා ගනුදෙනු වෙමින්, ඒ වැදගත් support zone එකට ඉහළින් සුව පහසුවෙන් රැඳී සිටිනවා.
සඳුදා දින සිට අදාළ මට්ටම් තවමත් මෙන්න:
🟢 $66,885 (Breakout Trigger) ඉහළින් close එකක් තිබ්බොත් $76,118 (Bull Target) වෙත යාමේ මාර්ගය විවෘත වෙනවා
🔴 $60,965 (Key Support) අහිමි වුණොත් ඉහළ-පහළ ව්යුහය බිඳ දමයිවි, නැවත $54,000 ක්රීඩා තලයට එයි
මේ දේවල් තවමත් තහවුරු කරලා නැහැ — අපි තවම range තුළයි, නමුත් සඳුදා දකින්න ලැබුණු තරම් නොව හොඳින් ව්යුහය රැඳීගෙන යනවා. ඊළඟ සැබෑ උත්ප්රේරකය ලෙස සිකුරාදා jobs report එක බලාගෙන ඉන්නවා.
මෙම range එකේ සෙල්ලම් කරන අය ඉන්නවද, නැත්නම් breakout confirmation එක බලාගෙනද? 👇 $BTC
පසුගිය සඳුදාගේ රේන්ජ් ඇමතුමට ($60,965-$66,885) අනුසාරයෙන්: මිල පැහැදිලිවම ඉහළ පහළ ව්යුහයක් මුද්රණය කරලා තියෙනවා. ජූනි මාසයේ පහළ අගය දළ වශයෙන් $58,000 වුණා; ජූලිගේ පසුබැසීම $60,965 දක්වා පැවතුණේ එය ඉහළින්ම ස්ථිරව. ඒ වගේ ඉහළ පහළ එකක් බලාපොරොත්තුකාරී ව්යුහය intact ලෙස තබාගන්නවා.
දැනට BTC $63,942 වටා ගනුදෙනු වෙමින්, ඒ වැදගත් support zone එකට ඉහළින් සුව පහසුවෙන් රැඳී සිටිනවා.
සඳුදා දින සිට අදාළ මට්ටම් තවමත් මෙන්න:
🟢 $66,885 (Breakout Trigger) ඉහළින් close එකක් තිබ්බොත් $76,118 (Bull Target) වෙත යාමේ මාර්ගය විවෘත වෙනවා
🔴 $60,965 (Key Support) අහිමි වුණොත් ඉහළ-පහළ ව්යුහය බිඳ දමයිවි, නැවත $54,000 ක්රීඩා තලයට එයි
මේ දේවල් තවමත් තහවුරු කරලා නැහැ — අපි තවම range තුළයි, නමුත් සඳුදා දකින්න ලැබුණු තරම් නොව හොඳින් ව්යුහය රැඳීගෙන යනවා. ඊළඟ සැබෑ උත්ප්රේරකය ලෙස සිකුරාදා jobs report එක බලාගෙන ඉන්නවා.
මෙම range එකේ සෙල්ලම් කරන අය ඉන්නවද, නැත්නම් breakout confirmation එක බලාගෙනද? 👇 $BTC
2
1
129
·
--
උසබ තත්ත්වය
Market Filter #001
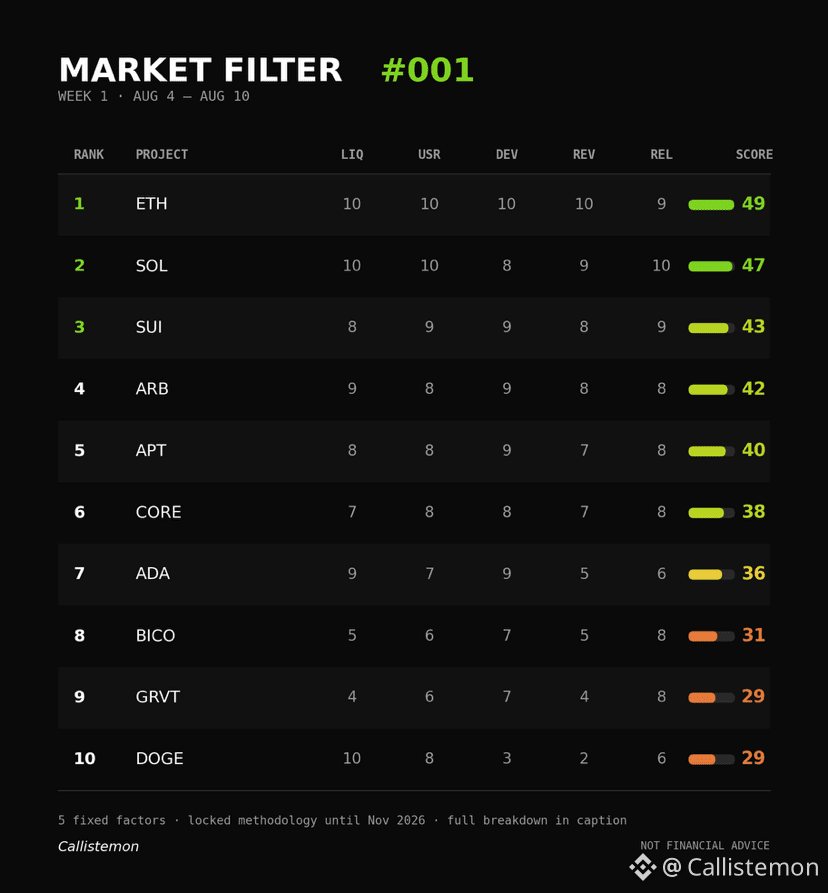
DOGE විසින් ද්රවශීලතාවය සඳහා 10/10 සහ ආදායම සඳහා 2/10 ලෙස ලකුණු ලබාගත්තා.
ඒ අට ලකුණු අතර පරතරය තමයි මා මෙය ආරම්භ කළේ ඇයි කියන සම්පූර්ණ තර්කය.
නොවැම්බර් 2026 දක්වා ඉදිරියට සෑම සතියකම, එකම ව්යාපෘති පහක් වූ ස්ථාවර සාධක—ද්රවශීලතාවය (liquidity), පරිශීලක වර්ධනය (user growth), සංවර්ධක ක්රියාකාරකම් (developer activity), ආදායම (revenue), සහ සාපේක්ෂ ශක්තිය (relative strength)—මත එකම ක්රමවේදය භාවිතා කර ලකුණු දෙනවා. අතරමැදි වෙනස්කම් කිසිවක් නැහැ.
ක්රමවේදය පරිපූර්ණ නිසා නොවේ; මන්දයත්, යම් දෙයක් හොඳින් ක්රියා කළ දේට තාත්විකවම සකස් වෙමින් නිහඬව පිරවෙන රාමුවක් “රාමුව” කියලා හැඳින්වීම ටිකක් අමාරුයි.
සතිය 1: ETH ලකුණු 49/50 සමඟ ලැයිස්තුවේ ඉහළින්. සෑම කාණ්ඩයක්ම අතිශය නියම මට්ටමක. SOL 47 සමඟ දෙවැනි; සාපේක්ෂ ශක්තිය මත පමණක් ETH ඉදිරියට යන්නට. ඉහළ තිදෙනා අතර තුන්වැන්න SUI—ලකුණු 43.
DOGE හි විශාල ද්රවශීලතාව, යටින් තියෙන්නේ ඇත්තේ ඉතාම අල්පය—මෙම අභ්යාසය මතු කරන්නට නිර්මාණය කර ඇති හරියටම එවැනි පරතරයක්. මෙහි ඉහළ ලකුණු “මෙය මිලදී ගන්න” කියන්නේ නැහැ. ඒක කියන්නේ මේ ව්යාපෘතියට දැනට මිලට පිටුපාන සැබෑ ක්රියාකාරකම, කතාන්දරය පෙන්වන දේට වඩා වැඩියි කියලා. අඩු ලකුණු—ඊට විරුද්ධ.
නොවැම්බරයේදී, මම සෑම සතියේම ඇති කාඩ්පත් සියල්ලම ගෙන වෙළඳපොලේ ඇත්තටම සිදු වූ දේ සමඟ ඒවා සමාලෝචනය කරන්නෙමි. මූලික කරුණු කතාන්දරය පරාජය කළේ නැත්නම්, ඒක කියන්නෙමි.
ඔබට ඔබ කැමති ලෙස නැවත තල්ලු කරන්න තිබෙන තැන් මොනවාද කියන්න. නොවැම්බරයේදී ඒවා හොයාගන්නට වඩා, දැන්ම මේකේ හිඩැස් හොයාගන්න එක මට වඩා හොඳයි.
Market Filter #001
DOGE විසින් ද්රවශීලතාවය සඳහා 10/10 සහ ආදායම සඳහා 2/10 ලෙස ලකුණු ලබාගත්තා.
ඒ අට ලකුණු අතර පරතරය තමයි මා මෙය ආරම්භ කළේ ඇයි කියන සම්පූර්ණ තර්කය.
නොවැම්බර් 2026 දක්වා ඉදිරියට සෑම සතියකම, එකම ව්යාපෘති පහක් වූ ස්ථාවර සාධක—ද්රවශීලතාවය (liquidity), පරිශීලක වර්ධනය (user growth), සංවර්ධක ක්රියාකාරකම් (developer activity), ආදායම (revenue), සහ සාපේක්ෂ ශක්තිය (relative strength)—මත එකම ක්රමවේදය භාවිතා කර ලකුණු දෙනවා. අතරමැදි වෙනස්කම් කිසිවක් නැහැ.
ක්රමවේදය පරිපූර්ණ නිසා නොවේ; මන්දයත්, යම් දෙයක් හොඳින් ක්රියා කළ දේට තාත්විකවම සකස් වෙමින් නිහඬව පිරවෙන රාමුවක් “රාමුව” කියලා හැඳින්වීම ටිකක් අමාරුයි.
සතිය 1: ETH ලකුණු 49/50 සමඟ ලැයිස්තුවේ ඉහළින්. සෑම කාණ්ඩයක්ම අතිශය නියම මට්ටමක. SOL 47 සමඟ දෙවැනි; සාපේක්ෂ ශක්තිය මත පමණක් ETH ඉදිරියට යන්නට. ඉහළ තිදෙනා අතර තුන්වැන්න SUI—ලකුණු 43.
DOGE හි විශාල ද්රවශීලතාව, යටින් තියෙන්නේ ඇත්තේ ඉතාම අල්පය—මෙම අභ්යාසය මතු කරන්නට නිර්මාණය කර ඇති හරියටම එවැනි පරතරයක්. මෙහි ඉහළ ලකුණු “මෙය මිලදී ගන්න” කියන්නේ නැහැ. ඒක කියන්නේ මේ ව්යාපෘතියට දැනට මිලට පිටුපාන සැබෑ ක්රියාකාරකම, කතාන්දරය පෙන්වන දේට වඩා වැඩියි කියලා. අඩු ලකුණු—ඊට විරුද්ධ.
නොවැම්බරයේදී, මම සෑම සතියේම ඇති කාඩ්පත් සියල්ලම ගෙන වෙළඳපොලේ ඇත්තටම සිදු වූ දේ සමඟ ඒවා සමාලෝචනය කරන්නෙමි. මූලික කරුණු කතාන්දරය පරාජය කළේ නැත්නම්, ඒක කියන්නෙමි.
ඔබට ඔබ කැමති ලෙස නැවත තල්ලු කරන්න තිබෙන තැන් මොනවාද කියන්න. නොවැම්බරයේදී ඒවා හොයාගන්නට වඩා, දැන්ම මේකේ හිඩැස් හොයාගන්න එක මට වඩා හොඳයි.
DOGE විසින් ද්රවශීලතාවය සඳහා 10/10 සහ ආදායම සඳහා 2/10 ලෙස ලකුණු ලබාගත්තා.
ඒ අට ලකුණු අතර පරතරය තමයි මා මෙය ආරම්භ කළේ ඇයි කියන සම්පූර්ණ තර්කය.
නොවැම්බර් 2026 දක්වා ඉදිරියට සෑම සතියකම, එකම ව්යාපෘති පහක් වූ ස්ථාවර සාධක—ද්රවශීලතාවය (liquidity), පරිශීලක වර්ධනය (user growth), සංවර්ධක ක්රියාකාරකම් (developer activity), ආදායම (revenue), සහ සාපේක්ෂ ශක්තිය (relative strength)—මත එකම ක්රමවේදය භාවිතා කර ලකුණු දෙනවා. අතරමැදි වෙනස්කම් කිසිවක් නැහැ.
ක්රමවේදය පරිපූර්ණ නිසා නොවේ; මන්දයත්, යම් දෙයක් හොඳින් ක්රියා කළ දේට තාත්විකවම සකස් වෙමින් නිහඬව පිරවෙන රාමුවක් “රාමුව” කියලා හැඳින්වීම ටිකක් අමාරුයි.
සතිය 1: ETH ලකුණු 49/50 සමඟ ලැයිස්තුවේ ඉහළින්. සෑම කාණ්ඩයක්ම අතිශය නියම මට්ටමක. SOL 47 සමඟ දෙවැනි; සාපේක්ෂ ශක්තිය මත පමණක් ETH ඉදිරියට යන්නට. ඉහළ තිදෙනා අතර තුන්වැන්න SUI—ලකුණු 43.
DOGE හි විශාල ද්රවශීලතාව, යටින් තියෙන්නේ ඇත්තේ ඉතාම අල්පය—මෙම අභ්යාසය මතු කරන්නට නිර්මාණය කර ඇති හරියටම එවැනි පරතරයක්. මෙහි ඉහළ ලකුණු “මෙය මිලදී ගන්න” කියන්නේ නැහැ. ඒක කියන්නේ මේ ව්යාපෘතියට දැනට මිලට පිටුපාන සැබෑ ක්රියාකාරකම, කතාන්දරය පෙන්වන දේට වඩා වැඩියි කියලා. අඩු ලකුණු—ඊට විරුද්ධ.
නොවැම්බරයේදී, මම සෑම සතියේම ඇති කාඩ්පත් සියල්ලම ගෙන වෙළඳපොලේ ඇත්තටම සිදු වූ දේ සමඟ ඒවා සමාලෝචනය කරන්නෙමි. මූලික කරුණු කතාන්දරය පරාජය කළේ නැත්නම්, ඒක කියන්නෙමි.
ඔබට ඔබ කැමති ලෙස නැවත තල්ලු කරන්න තිබෙන තැන් මොනවාද කියන්න. නොවැම්බරයේදී ඒවා හොයාගන්නට වඩා, දැන්ම මේකේ හිඩැස් හොයාගන්න එක මට වඩා හොඳයි.
313
·
--
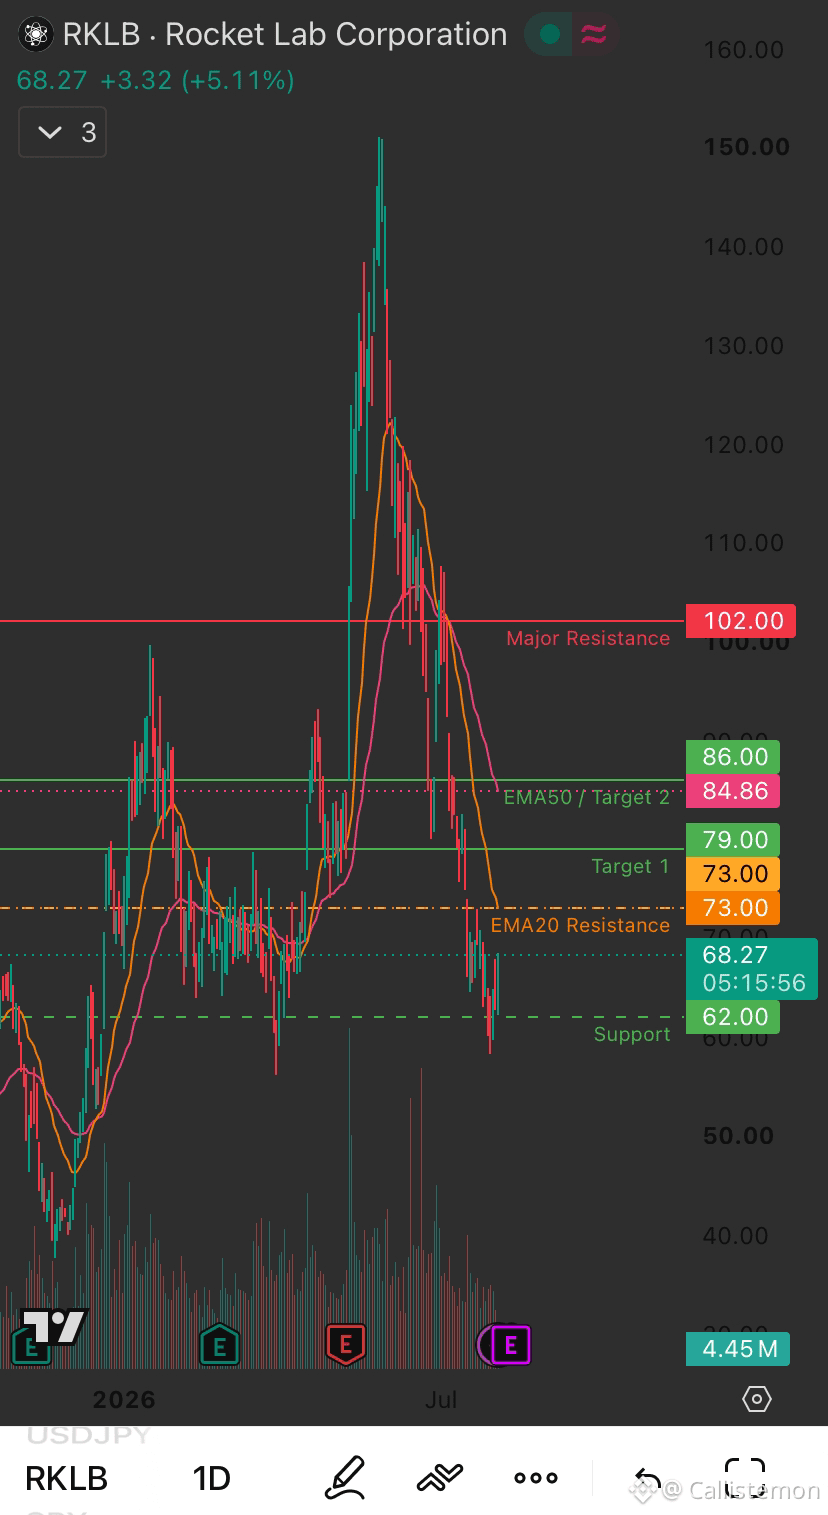
$RKLB i තියුණු திருத்தයකින් පසු ස්ථාවර වීමට උත්සාහ කරමින් සිටී.
මිල 20 EMA සහ 50 EMA දෙකටම පහළින්ම පවතින බැවින්, පුළුල් ප්රවණතාව තවමත් ප්රවේශම් සහිතයි.
$62 ආධාරකය රැඳී සිටින තාක් දුරට, නැවත ලැබීමේ (recovery) තත්ත්වය තවමත් සුරක්ෂිතයි.
$73 පමණ 20 EMA නැවත අත්කර ගැනීම පළමු බුලිෂ් තහවුරු කිරීම වන අතර, $79 සහ $86 ආසන්නයේ 50 EMA වෙත දොර විවර කරයි.
$102 ඉක්මවා තීරණාත්මක ලෙස බිඳීමක් සිදුවුවහොත්, එය ඉතා ශක්තිමත් ප්රවණතා ප්රතිවර්තනයක් සංඥා කරමින්, දිගුකාලීන දැක්ම නැවත බුලිෂ් වෙත හරවයි.
බලාගත මට්ටම්:
ආධාරකය: $62
EMA20 ප්රතිරෝධය: $73
ඉලක්කය 1: $79
EMA50 / ඉලක්කය 2: $86
ප්රධාන ප්රතිරෝධය: $102
{future}(RKLBUSDT)
$RKLB i තියුණු திருத்தයකින් පසු ස්ථාවර වීමට උත්සාහ කරමින් සිටී.
මිල 20 EMA සහ 50 EMA දෙකටම පහළින්ම පවතින බැවින්, පුළුල් ප්රවණතාව තවමත් ප්රවේශම් සහිතයි.
$62 ආධාරකය රැඳී සිටින තාක් දුරට, නැවත ලැබීමේ (recovery) තත්ත්වය තවමත් සුරක්ෂිතයි.
$73 පමණ 20 EMA නැවත අත්කර ගැනීම පළමු බුලිෂ් තහවුරු කිරීම වන අතර, $79 සහ $86 ආසන්නයේ 50 EMA වෙත දොර විවර කරයි.
$102 ඉක්මවා තීරණාත්මක ලෙස බිඳීමක් සිදුවුවහොත්, එය ඉතා ශක්තිමත් ප්රවණතා ප්රතිවර්තනයක් සංඥා කරමින්, දිගුකාලීන දැක්ම නැවත බුලිෂ් වෙත හරවයි.
බලාගත මට්ටම්:
ආධාරකය: $62
EMA20 ප්රතිරෝධය: $73
ඉලක්කය 1: $79
EMA50 / ඉලක්කය 2: $86
ප්රධාන ප්රතිරෝධය: $102
මිල 20 EMA සහ 50 EMA දෙකටම පහළින්ම පවතින බැවින්, පුළුල් ප්රවණතාව තවමත් ප්රවේශම් සහිතයි.
$62 ආධාරකය රැඳී සිටින තාක් දුරට, නැවත ලැබීමේ (recovery) තත්ත්වය තවමත් සුරක්ෂිතයි.
$73 පමණ 20 EMA නැවත අත්කර ගැනීම පළමු බුලිෂ් තහවුරු කිරීම වන අතර, $79 සහ $86 ආසන්නයේ 50 EMA වෙත දොර විවර කරයි.
$102 ඉක්මවා තීරණාත්මක ලෙස බිඳීමක් සිදුවුවහොත්, එය ඉතා ශක්තිමත් ප්රවණතා ප්රතිවර්තනයක් සංඥා කරමින්, දිගුකාලීන දැක්ම නැවත බුලිෂ් වෙත හරවයි.
බලාගත මට්ටම්:
ආධාරකය: $62
EMA20 ප්රතිරෝධය: $73
ඉලක්කය 1: $79
EMA50 / ඉලක්කය 2: $86
ප්රධාන ප්රතිරෝධය: $102
106
·
--
උසබ තත්ත්වය
📊 සඳුදා ආරම්භය.
මෙම සතියේ නිරීක්ෂණය කළ යුතු BTC මට්ටම්
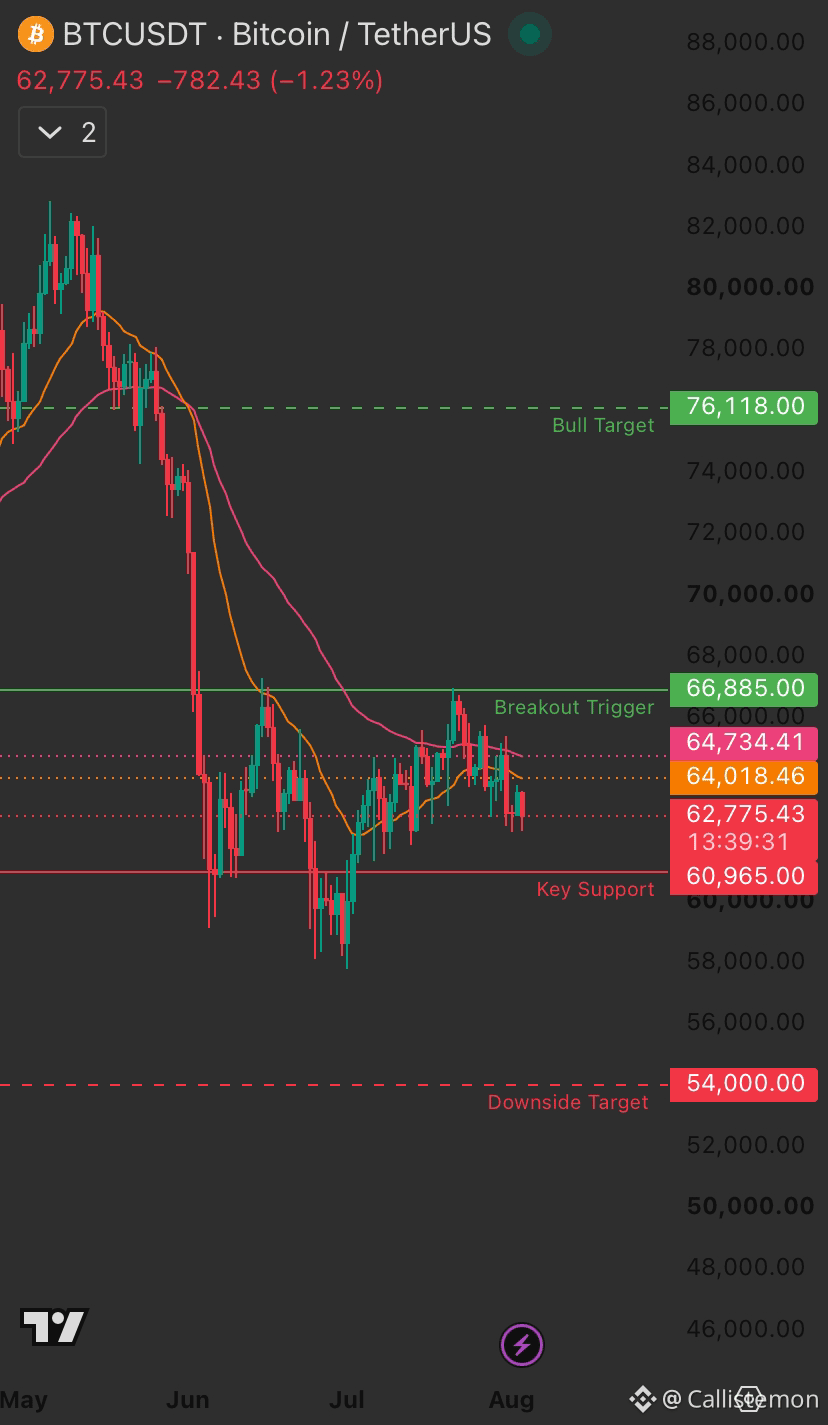
BTC සතිය ආරම්භ කළේ $62,775 කින් (-1.23%) වන අතර, $60,965 සිට $66,885 දක්වා වන “chop zone” එක මැදමයි; තවම පැහැදිලි දිශාවක් නැහැ. ඒ නිසාම බලන්න ඕනේ පරාසය මෙයයි.
සැකසුම:
🟢 $66,885 (Breakout Trigger) ඉහළින් දින 3ක් වසාගැනීමක් සිදුවුවහොත් බුලිෂ් ගම්යතාව නැවත ස්ථාපනය වෙයි, එවිට $76,118 (Bull Target) වෙත මාර්ගයක් විවෘත වේ
🔴 $60,965 (Key Support) පහළට බිඳවැටීමක් සිදුවුවහොත් $54,000 දක්වා පහත අඩු වීමේ අවදානම පෙන්නුම් කරයි
මෙය මෙම සතියේ වැදගත් වන්නේ ඇයි: සිකුරාදා දින US රැකියා වාර්තාව (jobs report) දින දර්ශනයේ ඇති ලොකුම මැක්රෝ උත්ප්රේරණයයි. මෘදු (soft) ප්රකාශයක් රිස්ක් ඇසෙට්ස් වැනි crypto සඳහා හොඳම අවස්ථාව විය හැකිය—පසුබෑමක් නැතිව රැකියා වර්ධනය සිසිල් වීම සාමාන්යයෙන් rate-cut පිළිබඳ බලාපොරොත්තු ශක්තිමත් කරයි.
තවද සලකා බැලිය යුතු දෙයක්: අගෝස්තු මාසය ඉතිහාස적으로 Bitcoin ට දුර්වලම මාසයයි, එනිසා මෙහි ටිකක් අමතර සැලකිල්ලක් දැරීම සාධාරණය. ඒක නැවත එසේම වෙනවා කියලා අදහස් නොකරනවා—ඒත් සන්දර්භය එහෙමයි.
ඔබ නැඹුරු වෙන්නේ breakout එකටද, breakdown එකටද? 👇$BTC
{future}(BTCUSDT)
📊 සඳුදා ආරම්භය.
මෙම සතියේ නිරීක්ෂණය කළ යුතු BTC මට්ටම්
BTC සතිය ආරම්භ කළේ $62,775 කින් (-1.23%) වන අතර, $60,965 සිට $66,885 දක්වා වන “chop zone” එක මැදමයි; තවම පැහැදිලි දිශාවක් නැහැ. ඒ නිසාම බලන්න ඕනේ පරාසය මෙයයි.
සැකසුම:
🟢 $66,885 (Breakout Trigger) ඉහළින් දින 3ක් වසාගැනීමක් සිදුවුවහොත් බුලිෂ් ගම්යතාව නැවත ස්ථාපනය වෙයි, එවිට $76,118 (Bull Target) වෙත මාර්ගයක් විවෘත වේ
🔴 $60,965 (Key Support) පහළට බිඳවැටීමක් සිදුවුවහොත් $54,000 දක්වා පහත අඩු වීමේ අවදානම පෙන්නුම් කරයි
මෙය මෙම සතියේ වැදගත් වන්නේ ඇයි: සිකුරාදා දින US රැකියා වාර්තාව (jobs report) දින දර්ශනයේ ඇති ලොකුම මැක්රෝ උත්ප්රේරණයයි. මෘදු (soft) ප්රකාශයක් රිස්ක් ඇසෙට්ස් වැනි crypto සඳහා හොඳම අවස්ථාව විය හැකිය—පසුබෑමක් නැතිව රැකියා වර්ධනය සිසිල් වීම සාමාන්යයෙන් rate-cut පිළිබඳ බලාපොරොත්තු ශක්තිමත් කරයි.
තවද සලකා බැලිය යුතු දෙයක්: අගෝස්තු මාසය ඉතිහාස적으로 Bitcoin ට දුර්වලම මාසයයි, එනිසා මෙහි ටිකක් අමතර සැලකිල්ලක් දැරීම සාධාරණය. ඒක නැවත එසේම වෙනවා කියලා අදහස් නොකරනවා—ඒත් සන්දර්භය එහෙමයි.
ඔබ නැඹුරු වෙන්නේ breakout එකටද, breakdown එකටද? 👇$BTC
මෙම සතියේ නිරීක්ෂණය කළ යුතු BTC මට්ටම්
BTC සතිය ආරම්භ කළේ $62,775 කින් (-1.23%) වන අතර, $60,965 සිට $66,885 දක්වා වන “chop zone” එක මැදමයි; තවම පැහැදිලි දිශාවක් නැහැ. ඒ නිසාම බලන්න ඕනේ පරාසය මෙයයි.
සැකසුම:
🟢 $66,885 (Breakout Trigger) ඉහළින් දින 3ක් වසාගැනීමක් සිදුවුවහොත් බුලිෂ් ගම්යතාව නැවත ස්ථාපනය වෙයි, එවිට $76,118 (Bull Target) වෙත මාර්ගයක් විවෘත වේ
🔴 $60,965 (Key Support) පහළට බිඳවැටීමක් සිදුවුවහොත් $54,000 දක්වා පහත අඩු වීමේ අවදානම පෙන්නුම් කරයි
මෙය මෙම සතියේ වැදගත් වන්නේ ඇයි: සිකුරාදා දින US රැකියා වාර්තාව (jobs report) දින දර්ශනයේ ඇති ලොකුම මැක්රෝ උත්ප්රේරණයයි. මෘදු (soft) ප්රකාශයක් රිස්ක් ඇසෙට්ස් වැනි crypto සඳහා හොඳම අවස්ථාව විය හැකිය—පසුබෑමක් නැතිව රැකියා වර්ධනය සිසිල් වීම සාමාන්යයෙන් rate-cut පිළිබඳ බලාපොරොත්තු ශක්තිමත් කරයි.
තවද සලකා බැලිය යුතු දෙයක්: අගෝස්තු මාසය ඉතිහාස적으로 Bitcoin ට දුර්වලම මාසයයි, එනිසා මෙහි ටිකක් අමතර සැලකිල්ලක් දැරීම සාධාරණය. ඒක නැවත එසේම වෙනවා කියලා අදහස් නොකරනවා—ඒත් සන්දර්භය එහෙමයි.
ඔබ නැඹුරු වෙන්නේ breakout එකටද, breakdown එකටද? 👇$BTC
91
තවත් අන්තර්ගතයන් ගවේෂණය කිරීමට ඇතුල් වන්න
Binance චතුරශ්රය හි ගෝලීය ක්රිප්ටෝ පරිශීලකයින් හා එක්වන්න
⚡️ ක්රිප්ටෝ පිළිබඳ නවතම සහ ප්රයෝජනවත් තොරතුරු ලබා ගන්න.
💬 ලොව විශාලතම ක්රිප්ටෝ හුවමාරුව මගින් විශ්වාස කෙරේ.
👍 සත්යායනය කරන ලද නිර්මාණකරුවන්ගෙන් සැබෑ විදසුන් සොයා ගන්න.
විද්යුත් තැපෑල / දුරකථන අංකය
නැගී එන මාතෘකා
CPIWatch
86.4M views
500,740 සාකච්ඡා කරමින්
අපගේ වර්තමාන ට්රෙන්ඩින් හෑෂ්ටැග් ව්යාපාරයේ “Share & Win” ගමනාගමන ත්යාගය ලබා ගන්න
✨තේමාව: CPI Trigger Rate Hike වෙයිද?
👉ඇතුළත් වන්නේ කෙසේද:
හෑෂ්ටැගය #CPIWatch සමඟ කෙටි පෝස්ට් එකක් හෝ ලිපියක් ප්රකාශ කරන්න
පහත කෝණ දෙක මත අන්තර්ගතය සකස් කරන්න:
- Nonfarm payrolls අපේක්ෂාවන් ඉක්මවා යන අතර CPI ළඟදීම එනවා. ෆෙඩ් එක rate එක ඉහළ දමයිද නැත්නම් නතර කරයිද කියලා ඔබ සිතන්නේ කුමක්ද?
- Bullish ද නැතිනම් bearish ද? ඔබේ අදහස බෙදා ගන්න සහ අපගේ trade sharing widget එක සමඟ ඔබේ stocks හෝ gold trade/holdings පෙන්වන්න.
🚀ව්යාපාර කාලය:
- 2026-09-11 3:00 - 2026-09-12 9:00 UTC
🎁ත්යාගය:
- ඉහත මාර්ගෝපදේශ වලට අනුකූල වන අතර වචන 100කට වඩා අඩංගු සුදුසුකම් ලැබූ පෝස්ට් පරීක්ෂා කරනු ලැබේ; 500 සිට 3,000 දක්වා යාකාරයෙන් ගමනාගමන වර්ධනයක් ලැබීමටද ඉඩ ඇත. ඔබේ පෝස්ට් එක තෝරාගත්තේ නම් ඔබට feed secretary වෙතින් දැනුම්දීමක් ලැබේ.
- Binance Square Official හි ඔබේ ලිපිය ප්රදර්ශනය කර ගැනීමට අවස්ථාවක් ලබා ගන්න
ඔබේ පෝස්ට් එකට අදහස් අවශ්යද? topic page #CPIWatch or Square Guide on How to Post for Better Reach වෙත පිවිසෙන්න.
Binance Square Official
·365 කැමත්ත දැක්වීම්
·772.9k views
BitcoinFallsTo$77KAfterGoldenCross
730 views
36 සාකච්ඡා කරමින්
OracleJumpsOver6%OnEarningsBeat
3,402 views
184 සාකච්ඡා කරමින්