
#marscoin
marscoin
1.6M නැරඹීම්
9,842 සාකච්ඡා කරමින්
උණුසුම්
නවතම

·
--
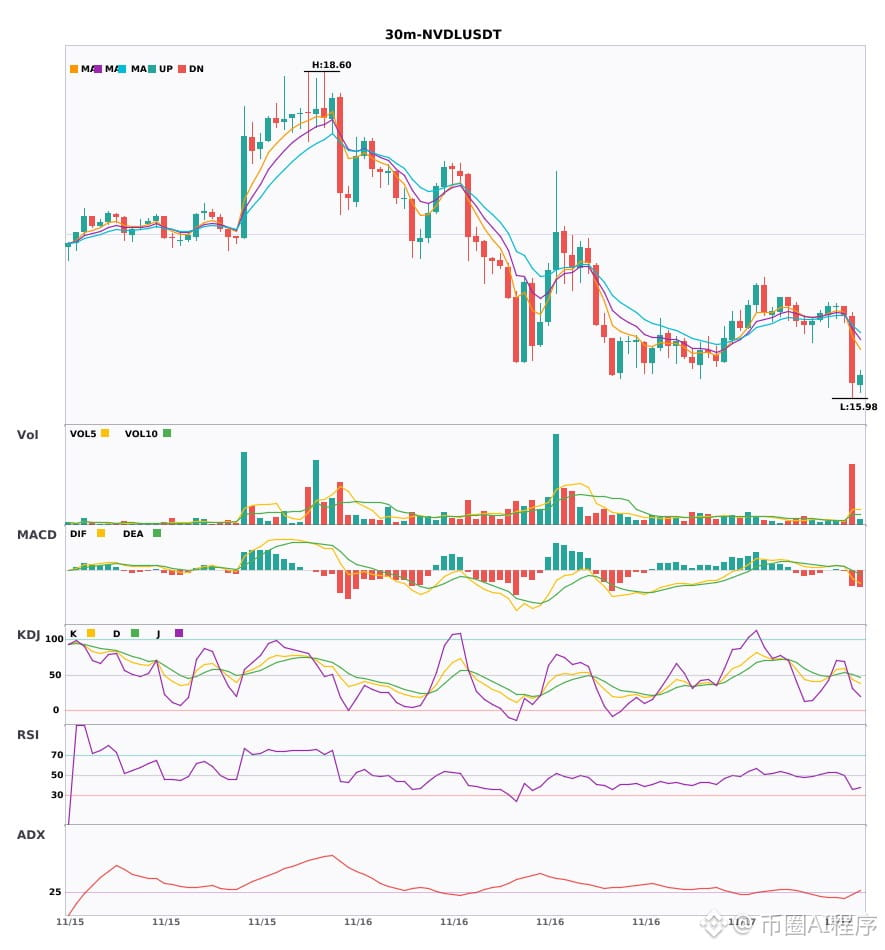
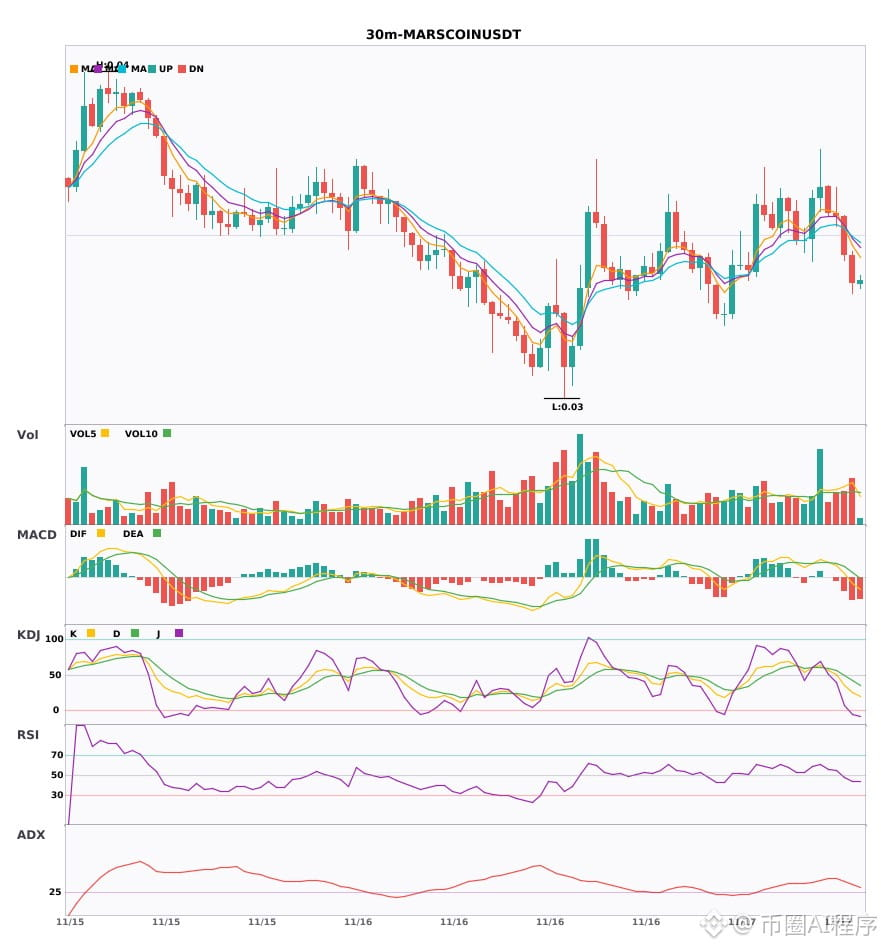
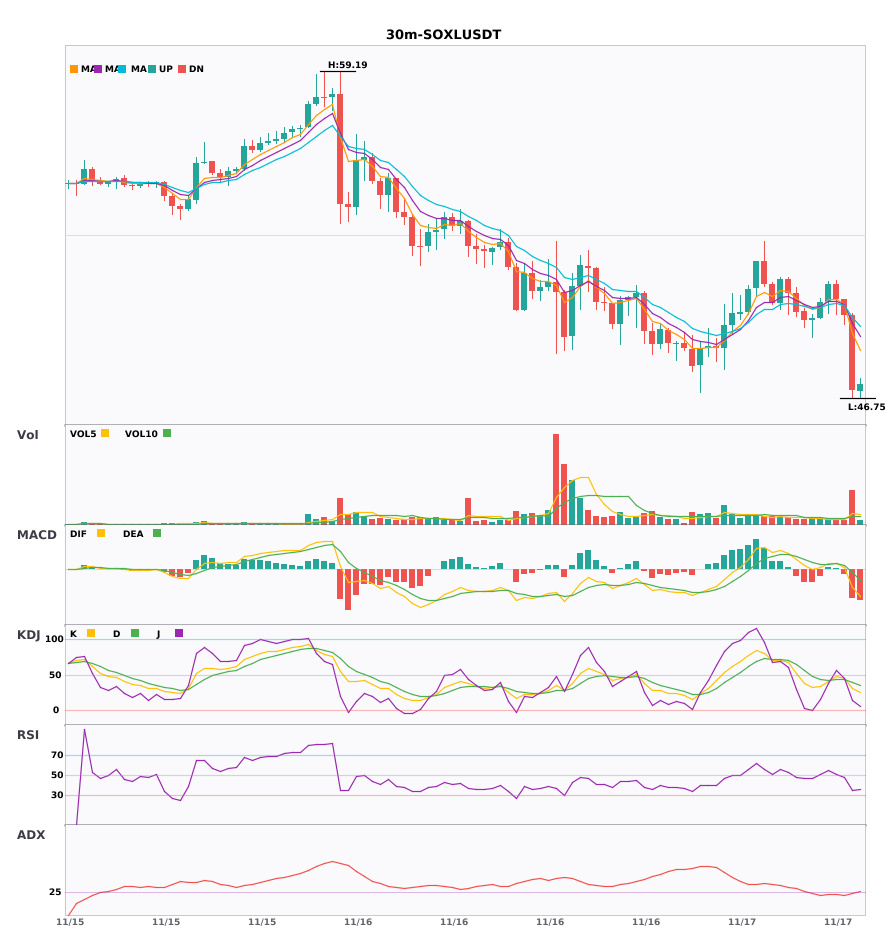
$NVDL / $MARSCOIN / $SOXL 30分钟空头冒头 4小时空头坐实🔥
════════════════════
🟢 $NVDL 30分钟 空头信号
⚠️技术面:4小时空头+30分钟共振看空:MACD跌破零轴转空,均线刚空头排列,KDJ死叉且未超卖,成交量放大6倍
════════════════════
🟢 $MARSCOIN 30分钟 空头信号
⚠️技术面:30分钟+4小时空头共振确认:MACD跌破零轴放量,均线空头排列发散,KDJ弱势运行,空头占优。
════════════════════
🟢 $SOXL 30分钟 空头信号
⚠️技术面:多周期共振:4小时空头+30分钟入场信号确认。MACD死叉跌破零轴转空,均线空头排列发散向下,KDJ死叉未超卖,放量3.9倍顺势看空。
════════════════════
🔔 关注获取第一手行情异动 🔔
#多周期共振 #NVDL #MARSCOIN #SOXL
📌 交易时注意k线形态是否符合
$NVDL / $MARSCOIN / $SOXL 30分钟空头冒头 4小时空头坐实🔥
════════════════════
🟢 $NVDL 30分钟 空头信号
⚠️技术面:4小时空头+30分钟共振看空:MACD跌破零轴转空,均线刚空头排列,KDJ死叉且未超卖,成交量放大6倍
════════════════════
🟢 $MARSCOIN 30分钟 空头信号
⚠️技术面:30分钟+4小时空头共振确认:MACD跌破零轴放量,均线空头排列发散,KDJ弱势运行,空头占优。
════════════════════
🟢 $SOXL 30分钟 空头信号
⚠️技术面:多周期共振:4小时空头+30分钟入场信号确认。MACD死叉跌破零轴转空,均线空头排列发散向下,KDJ死叉未超卖,放量3.9倍顺势看空。
════════════════════
🔔 关注获取第一手行情异动 🔔
#多周期共振 #NVDL #MARSCOIN #SOXL
📌 交易时注意k线形态是否符合
════════════════════
🟢 $NVDL 30分钟 空头信号
⚠️技术面:4小时空头+30分钟共振看空:MACD跌破零轴转空,均线刚空头排列,KDJ死叉且未超卖,成交量放大6倍
════════════════════
🟢 $MARSCOIN 30分钟 空头信号
⚠️技术面:30分钟+4小时空头共振确认:MACD跌破零轴放量,均线空头排列发散,KDJ弱势运行,空头占优。
════════════════════
🟢 $SOXL 30分钟 空头信号
⚠️技术面:多周期共振:4小时空头+30分钟入场信号确认。MACD死叉跌破零轴转空,均线空头排列发散向下,KDJ死叉未超卖,放量3.9倍顺势看空。
════════════════════
🔔 关注获取第一手行情异动 🔔
#多周期共振 #NVDL #MARSCOIN #SOXL
📌 交易时注意k线形态是否符合
47

·
--
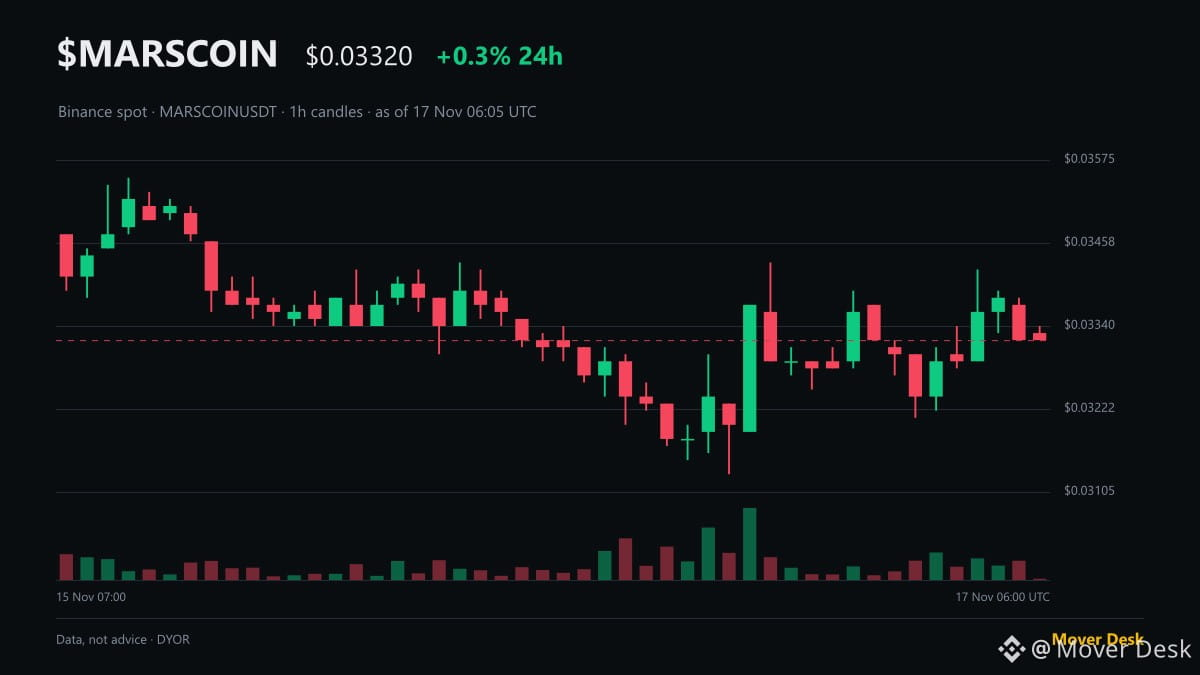
$MARSCOIN open interest grew +6% to $6.0M while spot price held at $0.03330 (+0.3%) as of 06:04 UTC: what open interest actually tells you.
Open interest is the total number of active futures contracts that have not been settled or closed.
When open interest rises, new capital is entering the market through fresh positions. When it falls, traders are closing contracts and de-risking. It does not reveal which side is winning, because every single open contract requires both a buyer and a seller.
On MARSCOIN, open interest increased +6% to $6.0M over 24 hours while price traded between $0.03130 and $0.03430, dipping -1.2% in the last hour. Longs pay shorts a modest +0.0050% funding rate, with 52% of accounts holding long positions (a 1.07 long/short ratio). The rising open interest confirms traders were actively establishing new commitments into this range rather than exiting.
Risk check: 24h spot volume is thin at $3.0M compared to $6.0M in futures open interest, leaving the order book vulnerable to fast moves if leverage unwinds.
When open interest expands while spot price stays flat, do you see that as deliberate positioning or a leverage trap?
Mover Desk · numbers, not hype
#MARSCOIN #OpenInterest #CryptoEducation #Futures
Not financial advice. DYOR.
$MARSCOIN open interest grew +6% to $6.0M while spot price held at $0.03330 (+0.3%) as of 06:04 UTC: what open interest actually tells you.
Open interest is the total number of active futures contracts that have not been settled or closed.
When open interest rises, new capital is entering the market through fresh positions. When it falls, traders are closing contracts and de-risking. It does not reveal which side is winning, because every single open contract requires both a buyer and a seller.
On MARSCOIN, open interest increased +6% to $6.0M over 24 hours while price traded between $0.03130 and $0.03430, dipping -1.2% in the last hour. Longs pay shorts a modest +0.0050% funding rate, with 52% of accounts holding long positions (a 1.07 long/short ratio). The rising open interest confirms traders were actively establishing new commitments into this range rather than exiting.
Risk check: 24h spot volume is thin at $3.0M compared to $6.0M in futures open interest, leaving the order book vulnerable to fast moves if leverage unwinds.
When open interest expands while spot price stays flat, do you see that as deliberate positioning or a leverage trap?
Mover Desk · numbers, not hype
#MARSCOIN #OpenInterest #CryptoEducation #Futures
Not financial advice. DYOR.
Open interest is the total number of active futures contracts that have not been settled or closed.
When open interest rises, new capital is entering the market through fresh positions. When it falls, traders are closing contracts and de-risking. It does not reveal which side is winning, because every single open contract requires both a buyer and a seller.
On MARSCOIN, open interest increased +6% to $6.0M over 24 hours while price traded between $0.03130 and $0.03430, dipping -1.2% in the last hour. Longs pay shorts a modest +0.0050% funding rate, with 52% of accounts holding long positions (a 1.07 long/short ratio). The rising open interest confirms traders were actively establishing new commitments into this range rather than exiting.
Risk check: 24h spot volume is thin at $3.0M compared to $6.0M in futures open interest, leaving the order book vulnerable to fast moves if leverage unwinds.
When open interest expands while spot price stays flat, do you see that as deliberate positioning or a leverage trap?
Mover Desk · numbers, not hype
#MARSCOIN #OpenInterest #CryptoEducation #Futures
Not financial advice. DYOR.
15

·
--
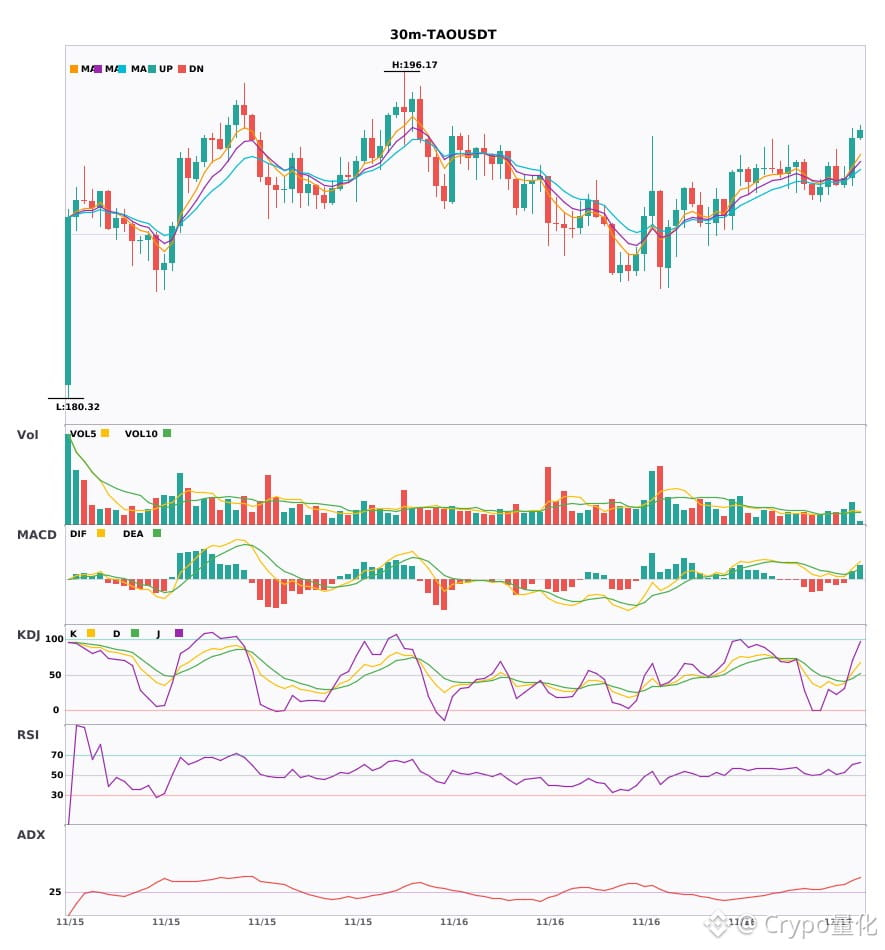
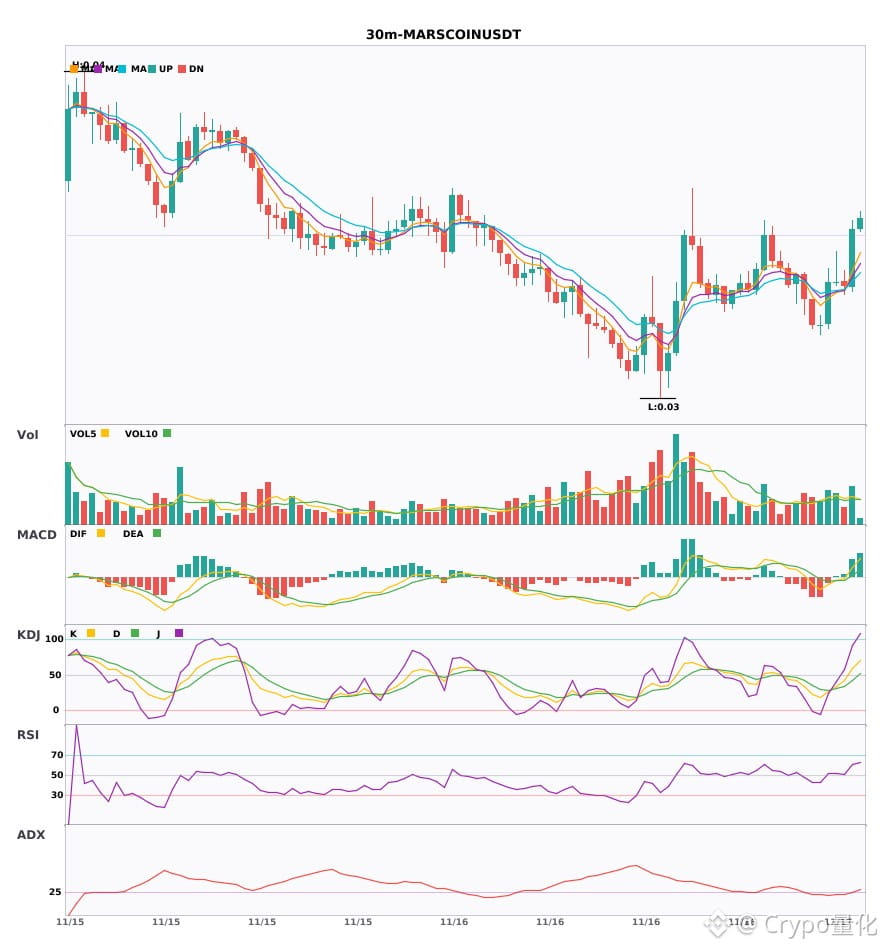
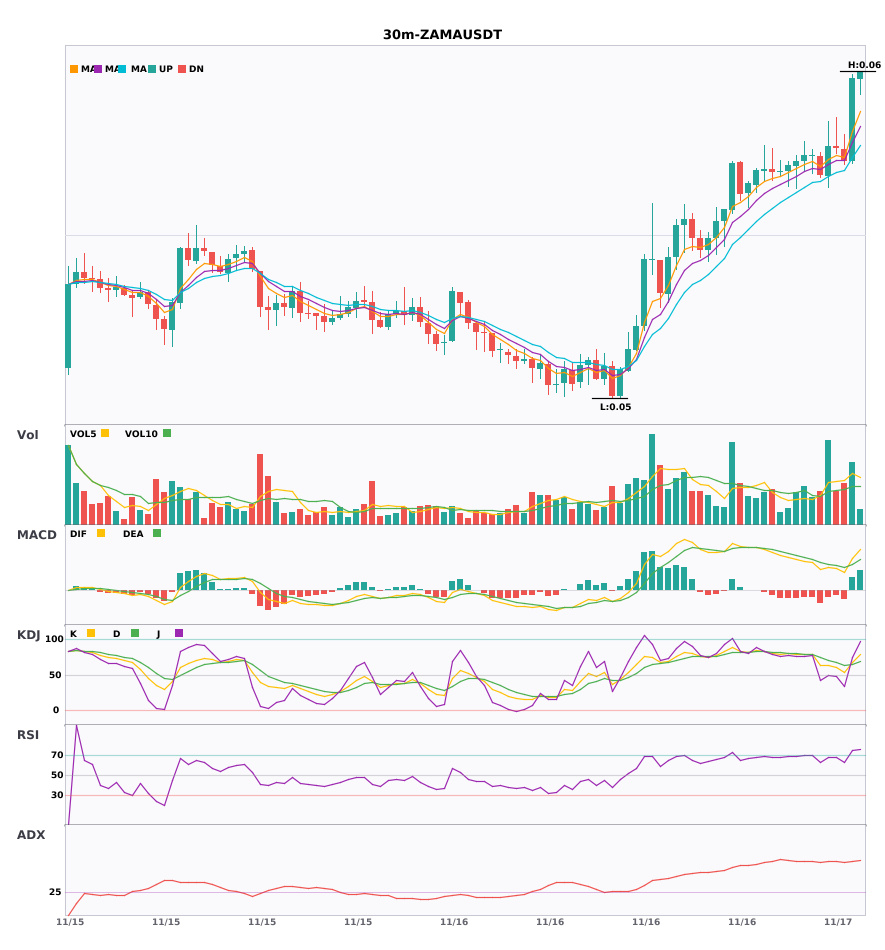
$TAO $MARSCOIN $ZAMA 30分钟多头信号齐发🔥
════════════════════
🔴 $TAO 30分钟 多头信号
⚠️技术面:ADX显示趋势挺明显,MACD金叉放量红柱持续放大,均线多头排列发散向上,K上穿D还没到超买,成交量也放大了,短期看多。
════════════════════
🔴 $MARSCOIN 30分钟 多头信号
⚠️技术面:ADX(28)趋势刚冒头能上 | MACD金叉放量上零轴转多 | EMA5上穿EMA8短期走多 | 量放1.5倍
════════════════════
🔴 $ZAMA 30分钟 多头信号
⚠️技术面:趋势特别猛但小心过热回调,MACD零上金叉放量,均线多头排列发散向上,KDJ金叉还没到超买区,成交量放大了1.6倍。
════════════════════
🔔 关注获取第一手行情异动 🔔
#技术分析 #TAO #MARSCOIN #ZAMA
📌 交易时注意k线形态是否符合
$TAO $MARSCOIN $ZAMA 30分钟多头信号齐发🔥
════════════════════
🔴 $TAO 30分钟 多头信号
⚠️技术面:ADX显示趋势挺明显,MACD金叉放量红柱持续放大,均线多头排列发散向上,K上穿D还没到超买,成交量也放大了,短期看多。
════════════════════
🔴 $MARSCOIN 30分钟 多头信号
⚠️技术面:ADX(28)趋势刚冒头能上 | MACD金叉放量上零轴转多 | EMA5上穿EMA8短期走多 | 量放1.5倍
════════════════════
🔴 $ZAMA 30分钟 多头信号
⚠️技术面:趋势特别猛但小心过热回调,MACD零上金叉放量,均线多头排列发散向上,KDJ金叉还没到超买区,成交量放大了1.6倍。
════════════════════
🔔 关注获取第一手行情异动 🔔
#技术分析 #TAO #MARSCOIN #ZAMA
📌 交易时注意k线形态是否符合
════════════════════
🔴 $TAO 30分钟 多头信号
⚠️技术面:ADX显示趋势挺明显,MACD金叉放量红柱持续放大,均线多头排列发散向上,K上穿D还没到超买,成交量也放大了,短期看多。
════════════════════
🔴 $MARSCOIN 30分钟 多头信号
⚠️技术面:ADX(28)趋势刚冒头能上 | MACD金叉放量上零轴转多 | EMA5上穿EMA8短期走多 | 量放1.5倍
════════════════════
🔴 $ZAMA 30分钟 多头信号
⚠️技术面:趋势特别猛但小心过热回调,MACD零上金叉放量,均线多头排列发散向上,KDJ金叉还没到超买区,成交量放大了1.6倍。
════════════════════
🔔 关注获取第一手行情异动 🔔
#技术分析 #TAO #MARSCOIN #ZAMA
📌 交易时注意k线形态是否符合
47

MARSCOIN, ONE and MEGA: Three Different Market Signals in a Selective Crypto EnvironmentThe latest spot market activity across MARSCOIN, ONE, and MEGA shows a market where attention is moving selectively rather than broadly. All three assets are active, but their price structures tell very different stories. MARSCOIN is showing modest upward momentum with solid price retention near the daily high. ONE has experienced the widest relative volatility but is currently back at its opening level. MEGA is trading with a measured positive bias and a comparatively controlled intraday range.
This distinction matters because the headline percentage move is only one part of the story. Traders are also watching how each asset behaves after testing highs and lows, whether volume supports the move, and whether buyers can retain control when short term profit taking appears. In a fast moving market, price retention and liquidity often reveal more than a single green candle.
MARSCOIN is trading around $0.0337, up +0.60% from its 24 hour open of $0.0335. The asset reached a high of $0.0343 and a low of $0.0313, creating a 9.58% trading range. MARSCOIN is currently only 1.75% below its session high, which suggests that buyers have retained most of the recovery after price explored lower levels earlier in the session.
The market has generated approximately $2.81M in quoted 24 hour volume, showing that current price action is supported by active participation. MARSCOIN’s ability to remain above the daily open and close to the session high is the strongest short term feature of its structure. It does not guarantee continuation, but it indicates that the upside move has not been immediately rejected.
At the same time, the nearly 10% daily range confirms that the market remains volatile. This is a setting where sudden expansions can attract momentum traders, but it can also produce rapid reversals if liquidity slows. The most relevant observation is whether MARSCOIN can keep holding above its opening price while volume remains consistent. Stable consolidation near the upper range would show a more orderly market than a sharp move followed by immediate selling pressure.
Harmony, trading under the ticker ONE, is currently priced around $0.001307, unchanged from its 24 hour open of $0.001307. ONE reached a high of $0.001438 and a low of $0.001274, producing the widest relative range among the three assets at 12.87%. Although the price is flat over the session, the path has been far from quiet.
ONE is currently 9.11% below its daily high, showing that sellers became active after the earlier upside test. The market traded through a meaningful intraday range and then returned to the opening level, which reflects a balance between buyers and sellers rather than a decisive directional trend. With roughly $2.70M in quoted 24 hour volume, the price movement is occurring within an active market.
ONE remains tied to the broader Layer 1 narrative, where investor attention often depends on ecosystem development, network usage, and wider appetite for higher beta assets. The current price behavior highlights caution. Buyers have shown interest near the session low, but they have not yet been able to maintain control near the high. The next phase will depend on whether price can establish a tighter, more stable structure or whether the broad range continues to dominate short term trading.
MEGA is trading near $0.04981, up +0.59% from its 24 hour open of $0.04952. It traded between $0.04845 and $0.05101, resulting in a 5.28% range. MEGA is currently 2.35% below the session high, which places it near the upper portion of its daily structure.
This is a comparatively controlled setup. MEGA has moved above the opening price, retained that gain, and stayed closer to the daily high than the low. Its quoted 24 hour volume is around $2.64M, confirming ongoing market participation. While the percentage move is modest, the quality of the structure is more important than the headline number. A measured rise with contained volatility can show a steadier balance of demand than a sharp spike that quickly fades.
MEGA’s market position is connected to blockchain infrastructure and Layer 1 themes, areas that can receive increased attention when traders begin focusing on network scalability and ecosystem growth. For now, the asset is showing a cautious positive tone. The key question is whether buyers can maintain the current range position if the broader crypto market becomes more volatile.
Across the three assets, the live structure is clear. MARSCOIN is displaying the strongest short term price retention. ONE is showing the highest intraday volatility but lacks a clear net directional move. MEGA is presenting the most orderly positive structure, with price holding above its opening level and close to the daily high.
The market is rewarding selectivity. Momentum may bring attention, but sustainable moves depend on liquidity, volume consistency, and the ability to retain gains after volatility increases. These current readings are a snapshot of active market conditions, not a guarantee of what comes next. Responsible traders will continue watching volume, range behavior, and broader market sentiment before reacting to short term price movement.
#MarsCoin #HarmonyONE #MEGA #CryptoMarket #Altcoins
$MARSCOIN
{spot}(MARSCOINUSDT)
$ONE
{spot}(ONEUSDT)
$MEGA
{spot}(MEGAUSDT)
MARSCOIN, ONE and MEGA: Three Different Market Signals in a Selective Crypto Environment
The latest spot market activity across MARSCOIN, ONE, and MEGA shows a market where attention is moving selectively rather than broadly. All three assets are active, but their price structures tell very different stories. MARSCOIN is showing modest upward momentum with solid price retention near the daily high. ONE has experienced the widest relative volatility but is currently back at its opening level. MEGA is trading with a measured positive bias and a comparatively controlled intraday range.
This distinction matters because the headline percentage move is only one part of the story. Traders are also watching how each asset behaves after testing highs and lows, whether volume supports the move, and whether buyers can retain control when short term profit taking appears. In a fast moving market, price retention and liquidity often reveal more than a single green candle.
MARSCOIN is trading around $0.0337, up +0.60% from its 24 hour open of $0.0335. The asset reached a high of $0.0343 and a low of $0.0313, creating a 9.58% trading range. MARSCOIN is currently only 1.75% below its session high, which suggests that buyers have retained most of the recovery after price explored lower levels earlier in the session.
The market has generated approximately $2.81M in quoted 24 hour volume, showing that current price action is supported by active participation. MARSCOIN’s ability to remain above the daily open and close to the session high is the strongest short term feature of its structure. It does not guarantee continuation, but it indicates that the upside move has not been immediately rejected.
At the same time, the nearly 10% daily range confirms that the market remains volatile. This is a setting where sudden expansions can attract momentum traders, but it can also produce rapid reversals if liquidity slows. The most relevant observation is whether MARSCOIN can keep holding above its opening price while volume remains consistent. Stable consolidation near the upper range would show a more orderly market than a sharp move followed by immediate selling pressure.
Harmony, trading under the ticker ONE, is currently priced around $0.001307, unchanged from its 24 hour open of $0.001307. ONE reached a high of $0.001438 and a low of $0.001274, producing the widest relative range among the three assets at 12.87%. Although the price is flat over the session, the path has been far from quiet.
ONE is currently 9.11% below its daily high, showing that sellers became active after the earlier upside test. The market traded through a meaningful intraday range and then returned to the opening level, which reflects a balance between buyers and sellers rather than a decisive directional trend. With roughly $2.70M in quoted 24 hour volume, the price movement is occurring within an active market.
ONE remains tied to the broader Layer 1 narrative, where investor attention often depends on ecosystem development, network usage, and wider appetite for higher beta assets. The current price behavior highlights caution. Buyers have shown interest near the session low, but they have not yet been able to maintain control near the high. The next phase will depend on whether price can establish a tighter, more stable structure or whether the broad range continues to dominate short term trading.
MEGA is trading near $0.04981, up +0.59% from its 24 hour open of $0.04952. It traded between $0.04845 and $0.05101, resulting in a 5.28% range. MEGA is currently 2.35% below the session high, which places it near the upper portion of its daily structure.
This is a comparatively controlled setup. MEGA has moved above the opening price, retained that gain, and stayed closer to the daily high than the low. Its quoted 24 hour volume is around $2.64M, confirming ongoing market participation. While the percentage move is modest, the quality of the structure is more important than the headline number. A measured rise with contained volatility can show a steadier balance of demand than a sharp spike that quickly fades.
MEGA’s market position is connected to blockchain infrastructure and Layer 1 themes, areas that can receive increased attention when traders begin focusing on network scalability and ecosystem growth. For now, the asset is showing a cautious positive tone. The key question is whether buyers can maintain the current range position if the broader crypto market becomes more volatile.
Across the three assets, the live structure is clear. MARSCOIN is displaying the strongest short term price retention. ONE is showing the highest intraday volatility but lacks a clear net directional move. MEGA is presenting the most orderly positive structure, with price holding above its opening level and close to the daily high.
The market is rewarding selectivity. Momentum may bring attention, but sustainable moves depend on liquidity, volume consistency, and the ability to retain gains after volatility increases. These current readings are a snapshot of active market conditions, not a guarantee of what comes next. Responsible traders will continue watching volume, range behavior, and broader market sentiment before reacting to short term price movement.
#MarsCoin #HarmonyONE #MEGA #CryptoMarket #Altcoins
$MARSCOIN
$ONE
$MEGA
This distinction matters because the headline percentage move is only one part of the story. Traders are also watching how each asset behaves after testing highs and lows, whether volume supports the move, and whether buyers can retain control when short term profit taking appears. In a fast moving market, price retention and liquidity often reveal more than a single green candle.
MARSCOIN is trading around $0.0337, up +0.60% from its 24 hour open of $0.0335. The asset reached a high of $0.0343 and a low of $0.0313, creating a 9.58% trading range. MARSCOIN is currently only 1.75% below its session high, which suggests that buyers have retained most of the recovery after price explored lower levels earlier in the session.
The market has generated approximately $2.81M in quoted 24 hour volume, showing that current price action is supported by active participation. MARSCOIN’s ability to remain above the daily open and close to the session high is the strongest short term feature of its structure. It does not guarantee continuation, but it indicates that the upside move has not been immediately rejected.
At the same time, the nearly 10% daily range confirms that the market remains volatile. This is a setting where sudden expansions can attract momentum traders, but it can also produce rapid reversals if liquidity slows. The most relevant observation is whether MARSCOIN can keep holding above its opening price while volume remains consistent. Stable consolidation near the upper range would show a more orderly market than a sharp move followed by immediate selling pressure.
Harmony, trading under the ticker ONE, is currently priced around $0.001307, unchanged from its 24 hour open of $0.001307. ONE reached a high of $0.001438 and a low of $0.001274, producing the widest relative range among the three assets at 12.87%. Although the price is flat over the session, the path has been far from quiet.
ONE is currently 9.11% below its daily high, showing that sellers became active after the earlier upside test. The market traded through a meaningful intraday range and then returned to the opening level, which reflects a balance between buyers and sellers rather than a decisive directional trend. With roughly $2.70M in quoted 24 hour volume, the price movement is occurring within an active market.
ONE remains tied to the broader Layer 1 narrative, where investor attention often depends on ecosystem development, network usage, and wider appetite for higher beta assets. The current price behavior highlights caution. Buyers have shown interest near the session low, but they have not yet been able to maintain control near the high. The next phase will depend on whether price can establish a tighter, more stable structure or whether the broad range continues to dominate short term trading.
MEGA is trading near $0.04981, up +0.59% from its 24 hour open of $0.04952. It traded between $0.04845 and $0.05101, resulting in a 5.28% range. MEGA is currently 2.35% below the session high, which places it near the upper portion of its daily structure.
This is a comparatively controlled setup. MEGA has moved above the opening price, retained that gain, and stayed closer to the daily high than the low. Its quoted 24 hour volume is around $2.64M, confirming ongoing market participation. While the percentage move is modest, the quality of the structure is more important than the headline number. A measured rise with contained volatility can show a steadier balance of demand than a sharp spike that quickly fades.
MEGA’s market position is connected to blockchain infrastructure and Layer 1 themes, areas that can receive increased attention when traders begin focusing on network scalability and ecosystem growth. For now, the asset is showing a cautious positive tone. The key question is whether buyers can maintain the current range position if the broader crypto market becomes more volatile.
Across the three assets, the live structure is clear. MARSCOIN is displaying the strongest short term price retention. ONE is showing the highest intraday volatility but lacks a clear net directional move. MEGA is presenting the most orderly positive structure, with price holding above its opening level and close to the daily high.
The market is rewarding selectivity. Momentum may bring attention, but sustainable moves depend on liquidity, volume consistency, and the ability to retain gains after volatility increases. These current readings are a snapshot of active market conditions, not a guarantee of what comes next. Responsible traders will continue watching volume, range behavior, and broader market sentiment before reacting to short term price movement.
#MarsCoin #HarmonyONE #MEGA #CryptoMarket #Altcoins
$MARSCOIN
$ONE
$MEGA
1
52

·
--
Could $MARSCOIN follow the same path as $TUT and $TST? 👀
I'm wondering if we could see another major drop, possibly pushing $MARSCOIN towards the $0.01 range before finding a stable bottom.
Is a deeper correction coming, or will buyers step in before that happens?
What's your prediction, guys? Share your thoughts! 🔥
#MARSCOIN #Crypto #Altcoins #Trading #BinanceSquare
Could $MARSCOIN follow the same path as $TUT and $TST? 👀
I'm wondering if we could see another major drop, possibly pushing $MARSCOIN towards the $0.01 range before finding a stable bottom.
Is a deeper correction coming, or will buyers step in before that happens?
What's your prediction, guys? Share your thoughts! 🔥
#MARSCOIN #Crypto #Altcoins #Trading #BinanceSquare
I'm wondering if we could see another major drop, possibly pushing $MARSCOIN towards the $0.01 range before finding a stable bottom.
Is a deeper correction coming, or will buyers step in before that happens?
What's your prediction, guys? Share your thoughts! 🔥
#MARSCOIN #Crypto #Altcoins #Trading #BinanceSquare
Life is Race
·
--
$RARE Claim A Big Gift here 🎁🎁🎁🎁🎁🧧🧧🧧🧧🧧✅✅✅✅✅✅✅
2
2k

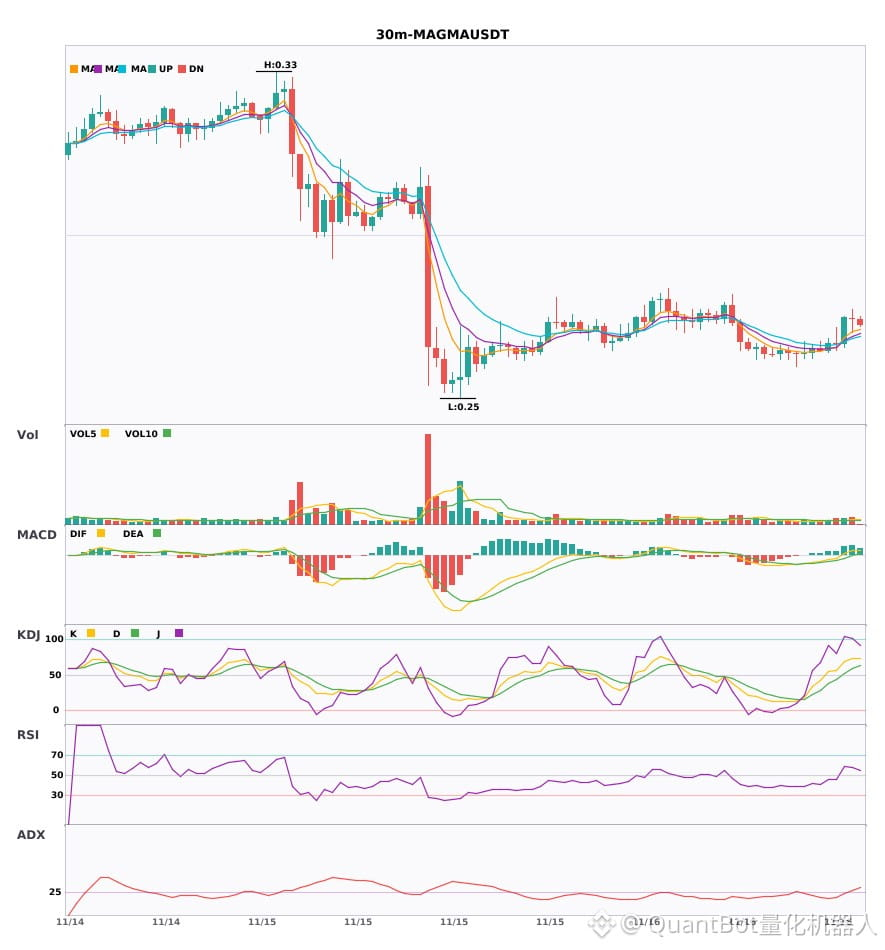
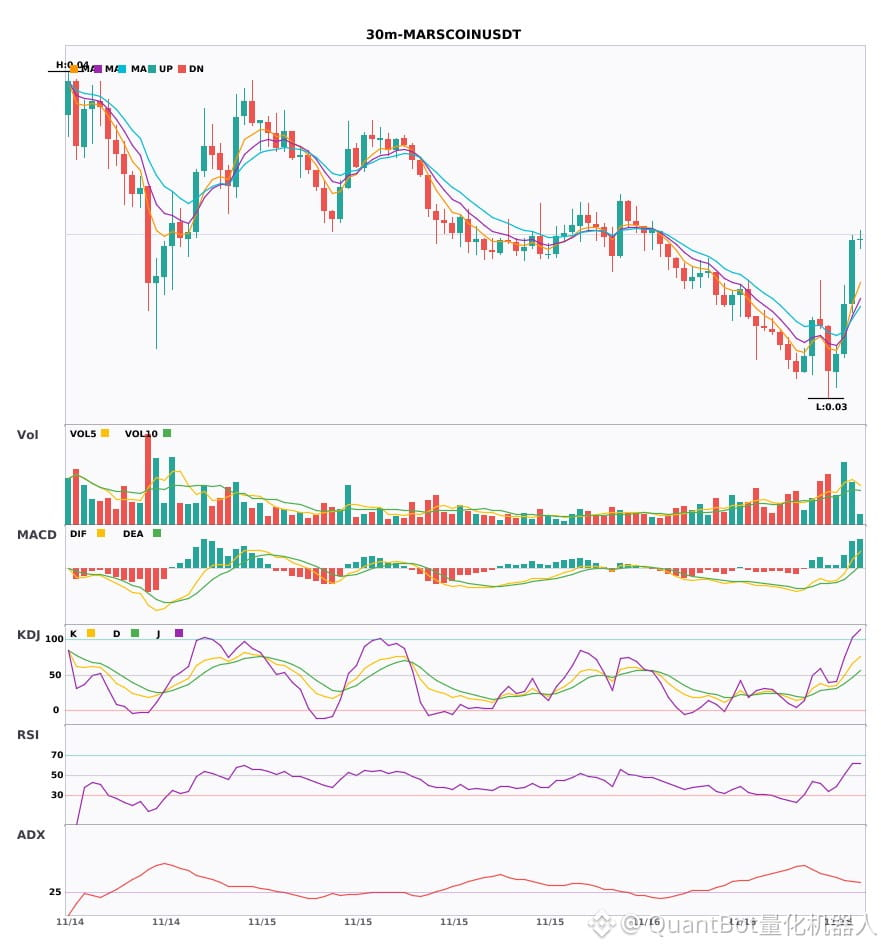
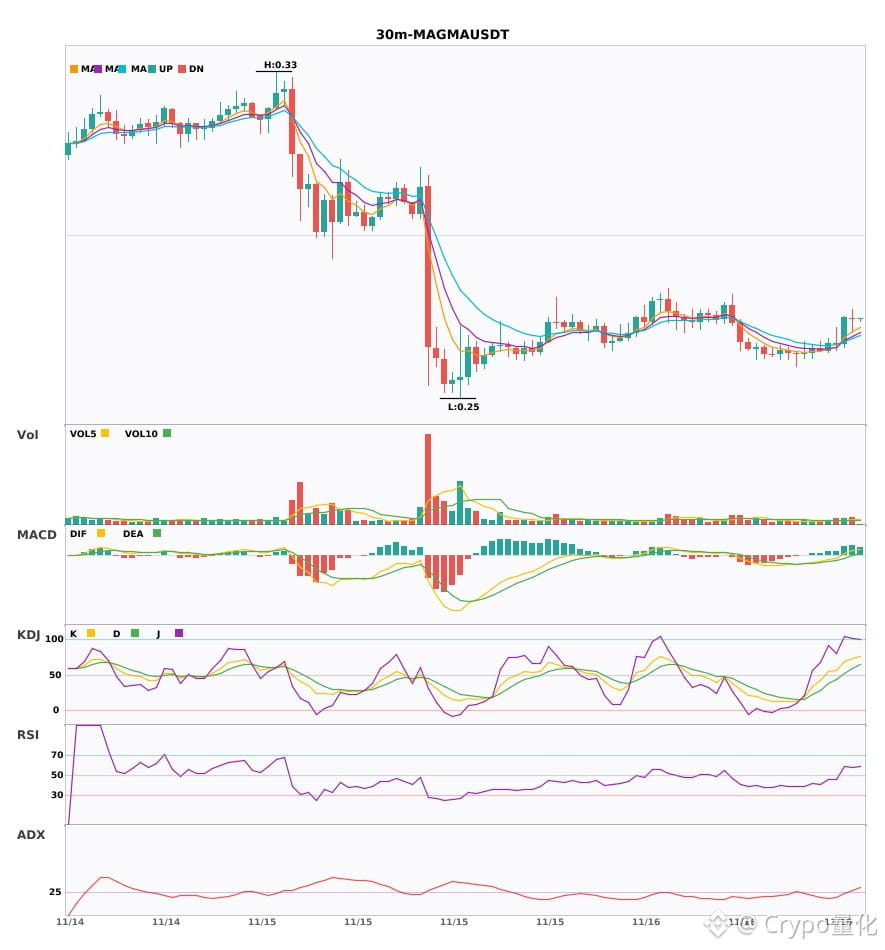
$MAGMA/$MARSCOIN 30分钟级别多头双信号共振
📈 $MAGMA | 30分钟 多头信号
━━━━━━━━━━━━━━━━━━
技术分析:ADX(27)趋势成形,可参与;MACD DIF上破零轴转多;EMA5>8>13多头排列;KDJ强势(K69.2/D52.1);成交量放大1.6倍。
价格变动:2.4800%
📈 $MARSCOIN | 30分钟 多头信号
━━━━━━━━━━━━━━━━━━
技术分析:ADX(38)显示趋势明确;MACD DIF上穿零轴,动能转多;EMA5>EMA8>EMA13呈多头排列;成交量放大1.9倍。
价格变动:2.9400%
━━━━━━━━━━━━━━━━━━
#技术分析 #MAGMA #MARSCOIN
📌 以上内容仅供参考,不构成投资建议
$MAGMA /$MARSCOIN 30分钟级别多头双信号共振
📈 $MAGMA | 30分钟 多头信号
━━━━━━━━━━━━━━━━━━
技术分析:ADX(27)趋势成形,可参与;MACD DIF上破零轴转多;EMA5>8>13多头排列;KDJ强势(K69.2/D52.1);成交量放大1.6倍。
价格变动:2.4800%
📈 $MARSCOIN | 30分钟 多头信号
━━━━━━━━━━━━━━━━━━
技术分析:ADX(38)显示趋势明确;MACD DIF上穿零轴,动能转多;EMA5>EMA8>EMA13呈多头排列;成交量放大1.9倍。
价格变动:2.9400%
━━━━━━━━━━━━━━━━━━
#技术分析 #MAGMA #MARSCOIN
📌 以上内容仅供参考,不构成投资建议
📈 $MAGMA | 30分钟 多头信号
━━━━━━━━━━━━━━━━━━
技术分析:ADX(27)趋势成形,可参与;MACD DIF上破零轴转多;EMA5>8>13多头排列;KDJ强势(K69.2/D52.1);成交量放大1.6倍。
价格变动:2.4800%
📈 $MARSCOIN | 30分钟 多头信号
━━━━━━━━━━━━━━━━━━
技术分析:ADX(38)显示趋势明确;MACD DIF上穿零轴,动能转多;EMA5>EMA8>EMA13呈多头排列;成交量放大1.9倍。
价格变动:2.9400%
━━━━━━━━━━━━━━━━━━
#技术分析 #MAGMA #MARSCOIN
📌 以上内容仅供参考,不构成投资建议
52
·
--
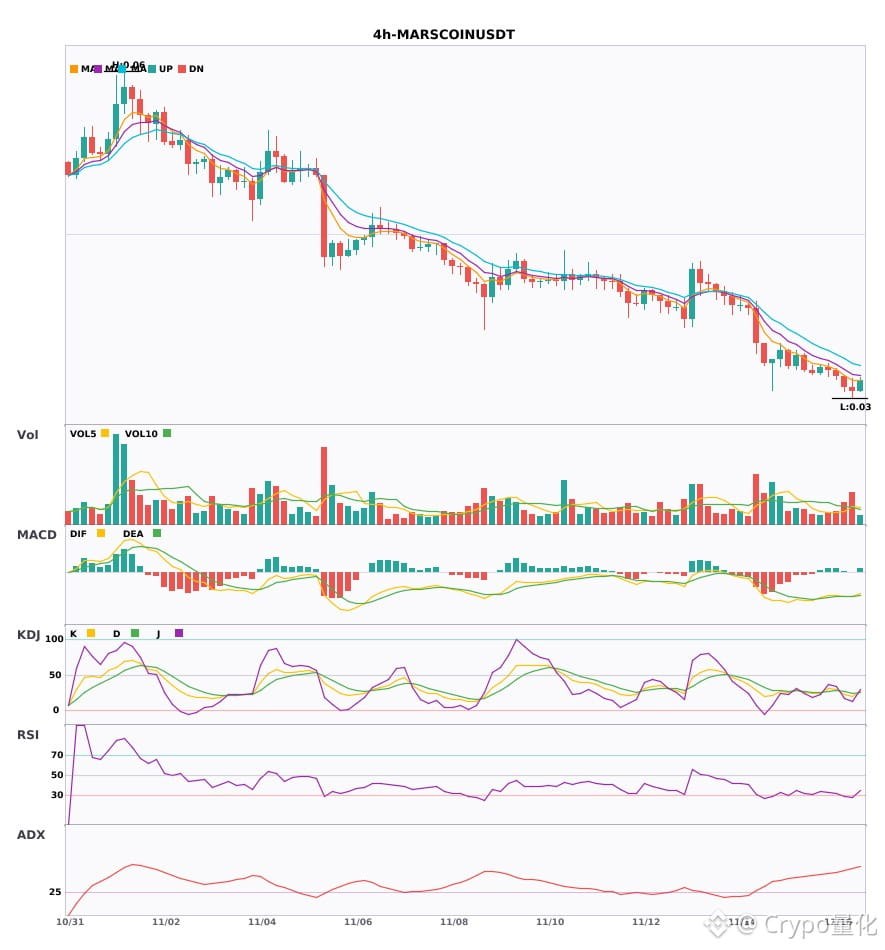
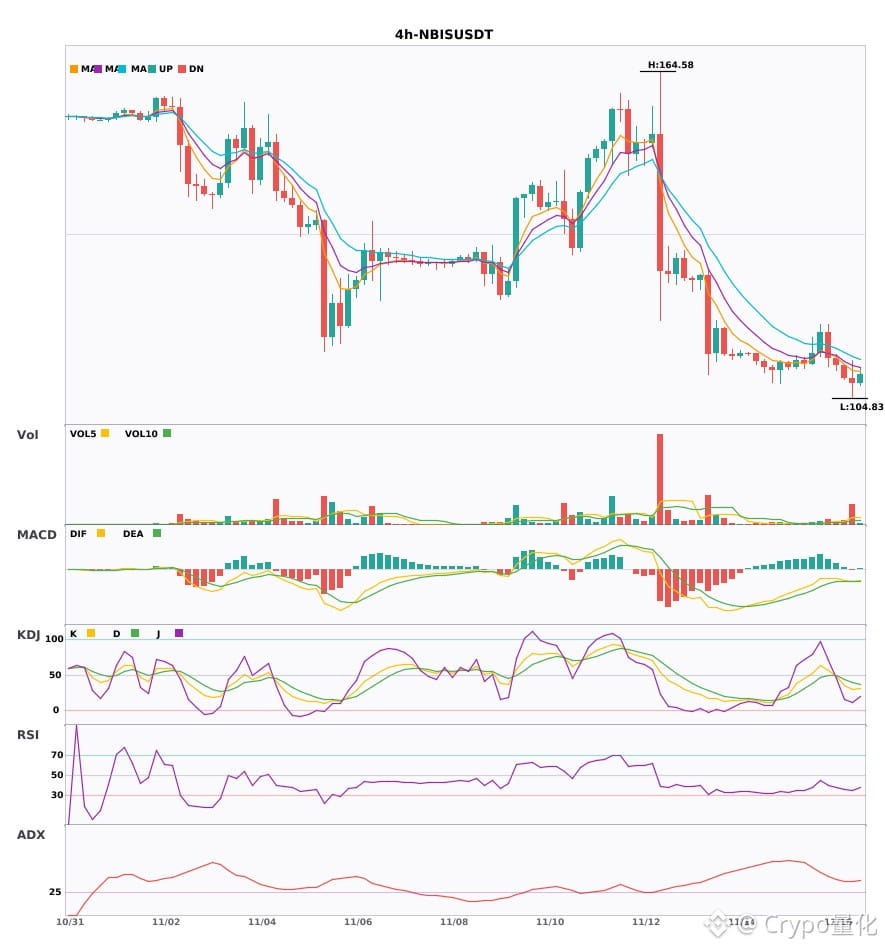
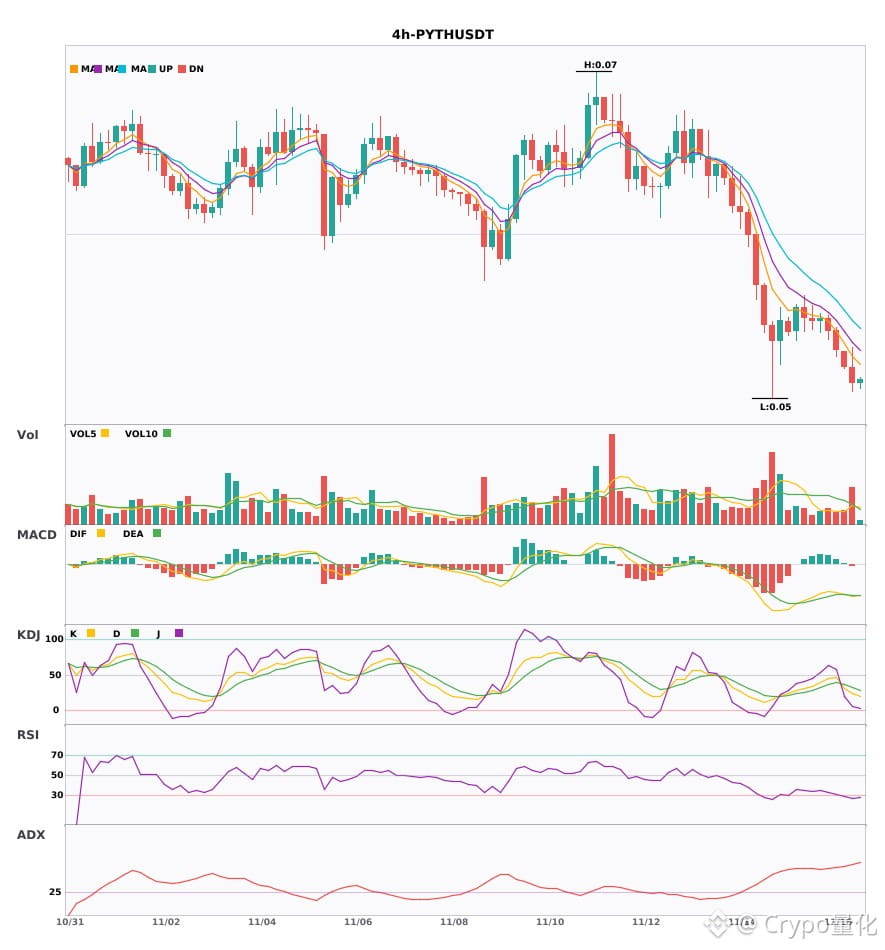
$MARSCOIN/$NBIS/$PYTH 4小时偏空短线承压🔥
════════════════════
🟢 $MARSCOIN 4小时 空头信号
⚠️技术面:ADX趋势很猛但小心过热回调,MACD死叉空头加速,均线空头排列向下,KDJ弱势K没上穿D,量放大1.8倍
════════════════════
🟢 $NBIS 4小时 空头信号
⚠️技术面:ADX36趋势明显,MACD零下死叉空头加速,均线空头排列发散向下,KDJ弱K没上穿D(K30.1 D39.6),量能爆4.7倍
════════════════════
🟢 $PYTH 4小时 空头信号
⚠️技术面:ADX很强的趋势但小心过热回调,MACD零下死叉空头加速,均线空头排列,KDJ弱势K下穿D,成交量放大1.8倍。
════════════════════
🔔 关注获取第一手行情异动 🔔
#技术分析 #MARSCOIN #NBIS #PYTH
📌 交易时注意k线形态是否符合
$MARSCOIN /$NBIS /$PYTH 4小时偏空短线承压🔥
════════════════════
🟢 $MARSCOIN 4小时 空头信号
⚠️技术面:ADX趋势很猛但小心过热回调,MACD死叉空头加速,均线空头排列向下,KDJ弱势K没上穿D,量放大1.8倍
════════════════════
🟢 $NBIS 4小时 空头信号
⚠️技术面:ADX36趋势明显,MACD零下死叉空头加速,均线空头排列发散向下,KDJ弱K没上穿D(K30.1 D39.6),量能爆4.7倍
════════════════════
🟢 $PYTH 4小时 空头信号
⚠️技术面:ADX很强的趋势但小心过热回调,MACD零下死叉空头加速,均线空头排列,KDJ弱势K下穿D,成交量放大1.8倍。
════════════════════
🔔 关注获取第一手行情异动 🔔
#技术分析 #MARSCOIN #NBIS #PYTH
📌 交易时注意k线形态是否符合
════════════════════
🟢 $MARSCOIN 4小时 空头信号
⚠️技术面:ADX趋势很猛但小心过热回调,MACD死叉空头加速,均线空头排列向下,KDJ弱势K没上穿D,量放大1.8倍
════════════════════
🟢 $NBIS 4小时 空头信号
⚠️技术面:ADX36趋势明显,MACD零下死叉空头加速,均线空头排列发散向下,KDJ弱K没上穿D(K30.1 D39.6),量能爆4.7倍
════════════════════
🟢 $PYTH 4小时 空头信号
⚠️技术面:ADX很强的趋势但小心过热回调,MACD零下死叉空头加速,均线空头排列,KDJ弱势K下穿D,成交量放大1.8倍。
════════════════════
🔔 关注获取第一手行情异动 🔔
#技术分析 #MARSCOIN #NBIS #PYTH
📌 交易时注意k线形态是否符合
19
·
--
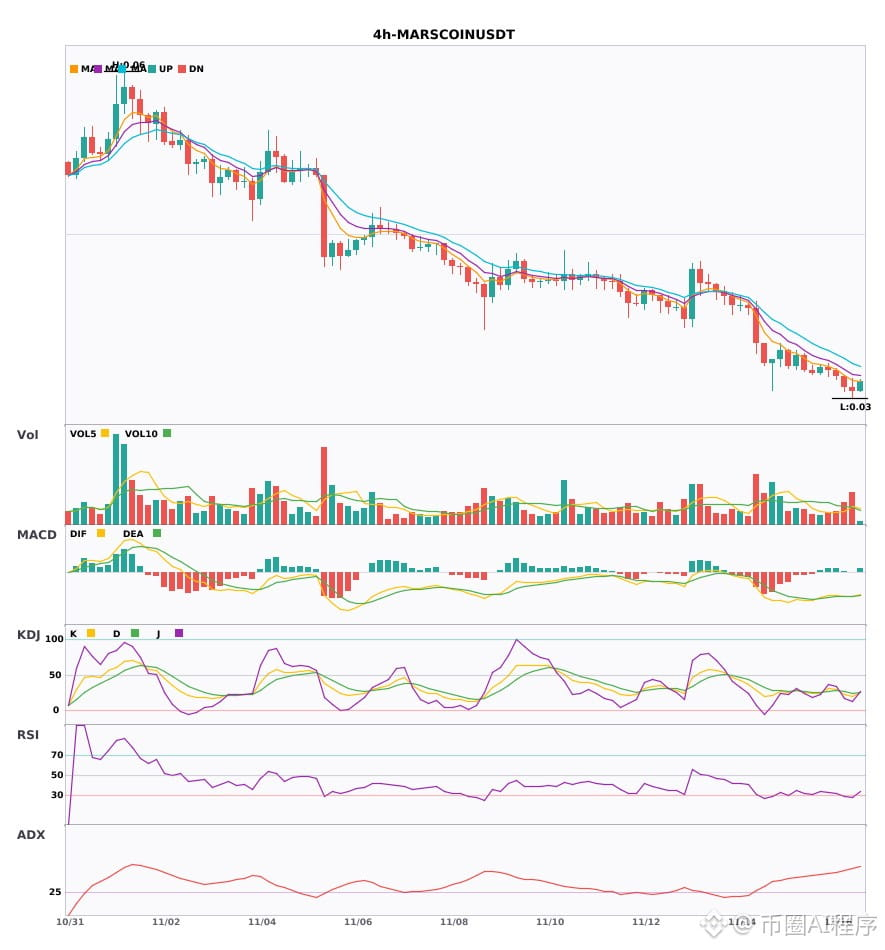
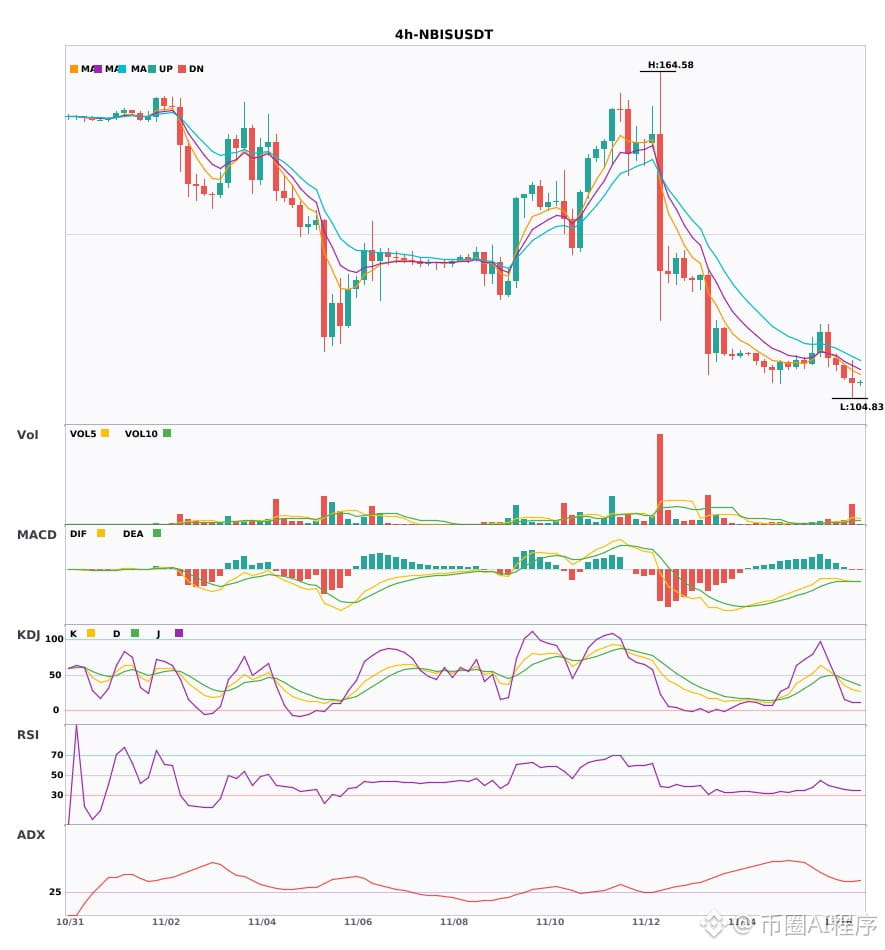
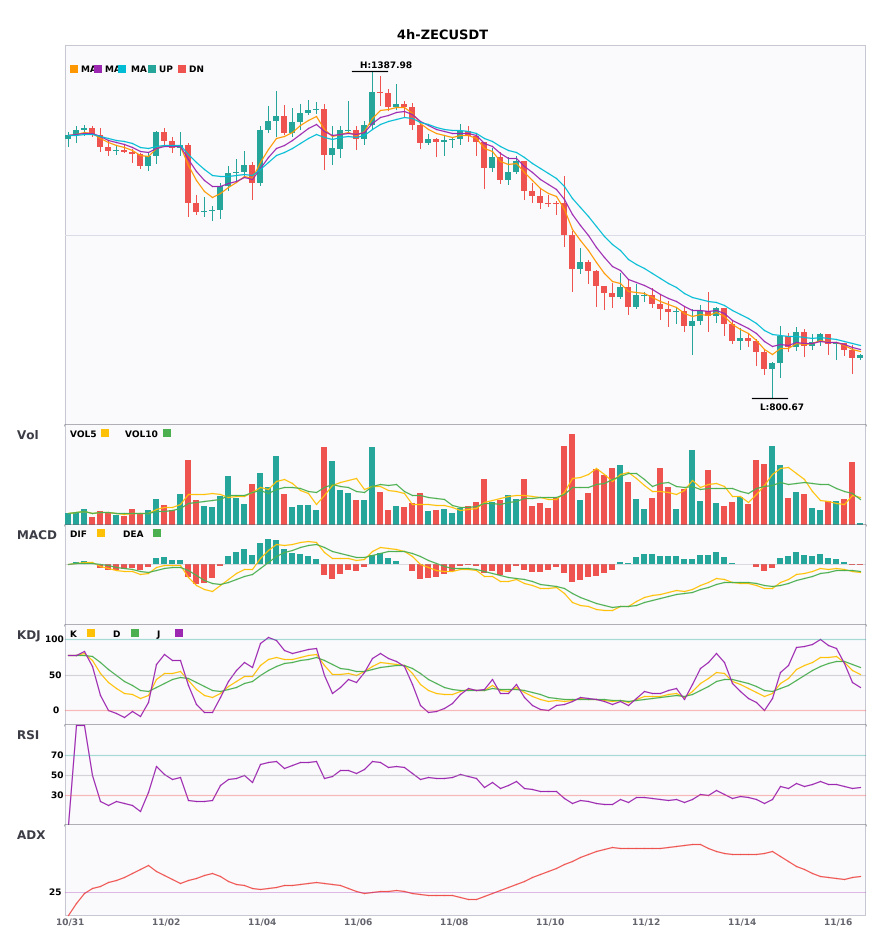
$MARSCOIN/$NBIS/$ZEC 4小时日线共振空🔥
════════════════════
🟢 $MARSCOIN 4小时 空头信号
⚠️技术面:4小时+日线空头共振确认!MACD零下死叉,绿柱放大,均线空头发散向下,KDJ弱势运行空头占优,成交量放大1.8倍。
════════════════════
🟢 $NBIS 4小时 空头信号
⚠️技术面:日线空头+4小时空头共振确认:MACD零下死叉放量,均线空头排列发散向下,KDJ弱势K下穿D,成交量爆发4.7倍,空头加速。
════════════════════
🟢 $ZEC 4小时 空头信号
⚠️技术面:日线空头+4小时共振确认!MACD零下死叉加速,EMA5/8/13空头排列向下,成交放大2倍,KDJ中位区偏强。
════════════════════
🔔 关注获取第一手行情异动 🔔
#多周期共振 #MARSCOIN #NBIS #ZEC
📌 交易时注意k线形态是否符合
$MARSCOIN /$NBIS /$ZEC 4小时日线共振空🔥
════════════════════
🟢 $MARSCOIN 4小时 空头信号
⚠️技术面:4小时+日线空头共振确认!MACD零下死叉,绿柱放大,均线空头发散向下,KDJ弱势运行空头占优,成交量放大1.8倍。
════════════════════
🟢 $NBIS 4小时 空头信号
⚠️技术面:日线空头+4小时空头共振确认:MACD零下死叉放量,均线空头排列发散向下,KDJ弱势K下穿D,成交量爆发4.7倍,空头加速。
════════════════════
🟢 $ZEC 4小时 空头信号
⚠️技术面:日线空头+4小时共振确认!MACD零下死叉加速,EMA5/8/13空头排列向下,成交放大2倍,KDJ中位区偏强。
════════════════════
🔔 关注获取第一手行情异动 🔔
#多周期共振 #MARSCOIN #NBIS #ZEC
📌 交易时注意k线形态是否符合
════════════════════
🟢 $MARSCOIN 4小时 空头信号
⚠️技术面:4小时+日线空头共振确认!MACD零下死叉,绿柱放大,均线空头发散向下,KDJ弱势运行空头占优,成交量放大1.8倍。
════════════════════
🟢 $NBIS 4小时 空头信号
⚠️技术面:日线空头+4小时空头共振确认:MACD零下死叉放量,均线空头排列发散向下,KDJ弱势K下穿D,成交量爆发4.7倍,空头加速。
════════════════════
🟢 $ZEC 4小时 空头信号
⚠️技术面:日线空头+4小时共振确认!MACD零下死叉加速,EMA5/8/13空头排列向下,成交放大2倍,KDJ中位区偏强。
════════════════════
🔔 关注获取第一手行情异动 🔔
#多周期共振 #MARSCOIN #NBIS #ZEC
📌 交易时注意k线形态是否符合
18
·
--
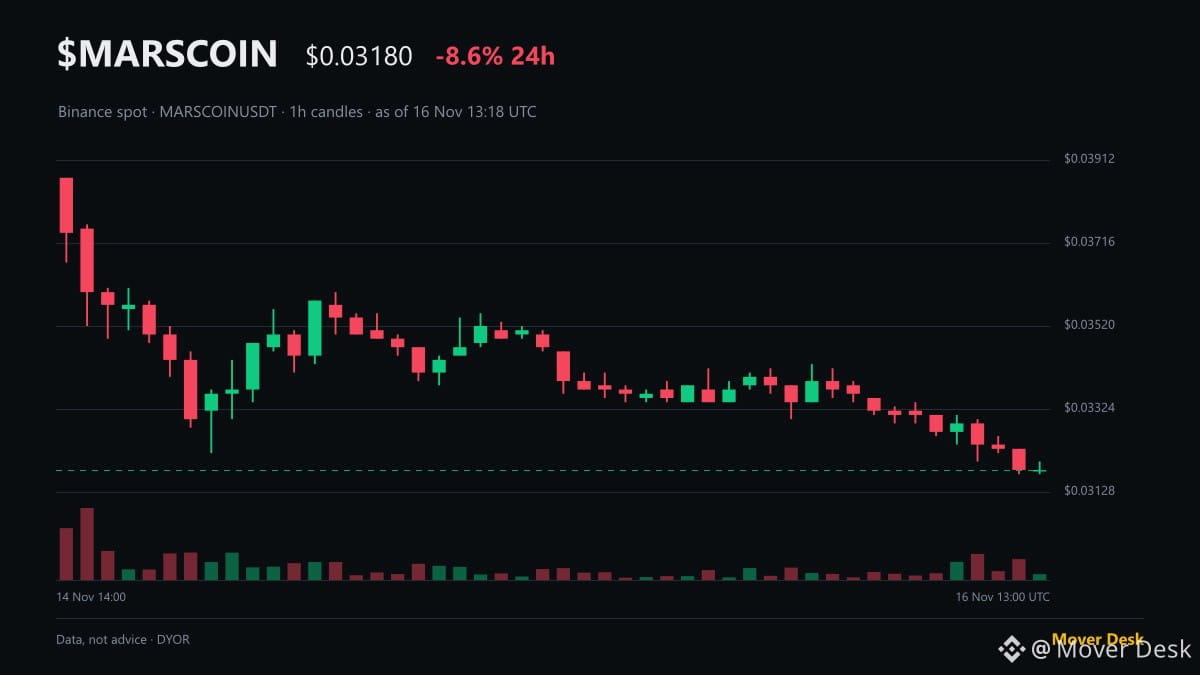
$MARSCOIN drops -8.6% to $0.03190 as of 13:16 UTC, but derivative traders are leaning in.
While price trades near the $0.03170 daily low, open interest expanded +6% to $5.6M with 53% of accounts holding long.
Spot volume sits at $2.0M against a 24h high of $0.03500, with price down another -0.9% in the last hour. There is no major headline behind the slide.
Perpetual funding holds positive at +0.0050% with a 1.12 long/short ratio, showing longs are actively paying to carry positions into weakness.
Risk factor: Open interest of $5.6M dwarfs the $2.0M spot turnover, leaving late longs exposed to liquidation if the $0.03170 floor breaks.
Are you siding with the 53% of accounts adding longs into this slide, or waiting for open interest to flush first?
Mover Desk · numbers, not hype
#MARSCOIN #Binance #Futures #CryptoTrading
Not financial advice. DYOR.
$MARSCOIN drops -8.6% to $0.03190 as of 13:16 UTC, but derivative traders are leaning in.
While price trades near the $0.03170 daily low, open interest expanded +6% to $5.6M with 53% of accounts holding long.
Spot volume sits at $2.0M against a 24h high of $0.03500, with price down another -0.9% in the last hour. There is no major headline behind the slide.
Perpetual funding holds positive at +0.0050% with a 1.12 long/short ratio, showing longs are actively paying to carry positions into weakness.
Risk factor: Open interest of $5.6M dwarfs the $2.0M spot turnover, leaving late longs exposed to liquidation if the $0.03170 floor breaks.
Are you siding with the 53% of accounts adding longs into this slide, or waiting for open interest to flush first?
Mover Desk · numbers, not hype
#MARSCOIN #Binance #Futures #CryptoTrading
Not financial advice. DYOR.
While price trades near the $0.03170 daily low, open interest expanded +6% to $5.6M with 53% of accounts holding long.
Spot volume sits at $2.0M against a 24h high of $0.03500, with price down another -0.9% in the last hour. There is no major headline behind the slide.
Perpetual funding holds positive at +0.0050% with a 1.12 long/short ratio, showing longs are actively paying to carry positions into weakness.
Risk factor: Open interest of $5.6M dwarfs the $2.0M spot turnover, leaving late longs exposed to liquidation if the $0.03170 floor breaks.
Are you siding with the 53% of accounts adding longs into this slide, or waiting for open interest to flush first?
Mover Desk · numbers, not hype
#MARSCOIN #Binance #Futures #CryptoTrading
Not financial advice. DYOR.
23
·
--
3个币多周期共振空头,30分钟和4小时同时发出信号🔥
════════════════════
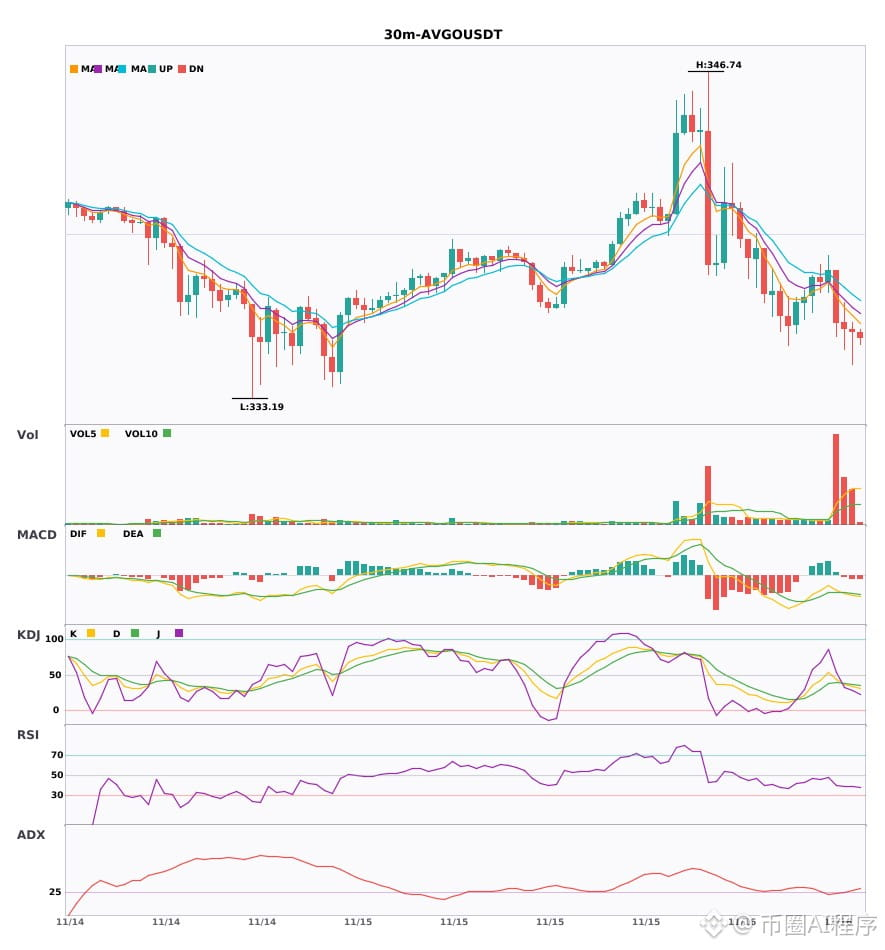
🟢 $AVGO 30分钟 空头信号
⚠️技术面:4小时+30分钟空头共振!30分钟MACD零下死叉,均线空头排列,KDJ死叉未超卖,成交放量6.7倍,短期看空
════════════════════
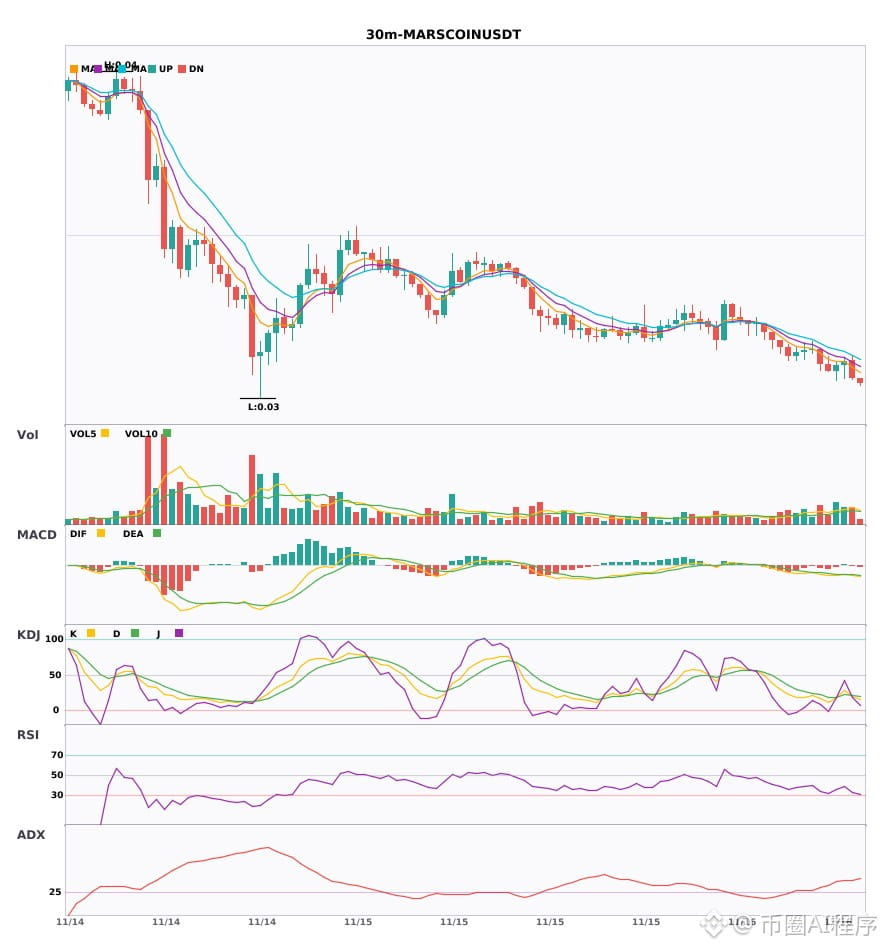
🟢 $MARSCOIN 30分钟 空头信号
⚠️技术面:4小时空头共振+30分钟入场:MACD死叉绿柱放大,均线空头排列向下,KDJ死叉未超卖,做空
════════════════════
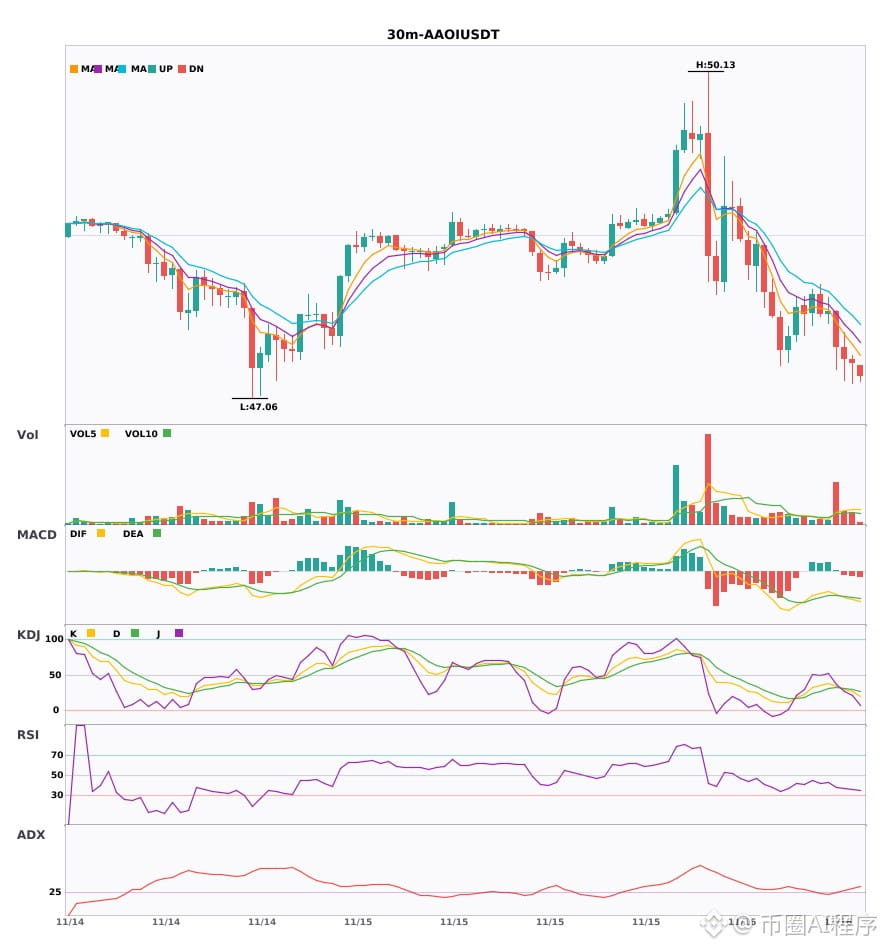
🟢 $AAOI 30分钟 空头信号
⚠️技术面:30分钟入场:MACD零下死叉、绿柱放大;均线空头排列发散向下;KDJ死叉未超卖。4小时空头共振确认,多周期共振看空,成交量放量3.8倍。
════════════════════
🔔 关注获取第一手行情异动 🔔
#多周期共振 #AVGO #MARSCOIN #AAOI
📌 交易时注意k线形态是否符合
3个币多周期共振空头,30分钟和4小时同时发出信号🔥
════════════════════
🟢 $AVGO 30分钟 空头信号
⚠️技术面:4小时+30分钟空头共振!30分钟MACD零下死叉,均线空头排列,KDJ死叉未超卖,成交放量6.7倍,短期看空
════════════════════
🟢 $MARSCOIN 30分钟 空头信号
⚠️技术面:4小时空头共振+30分钟入场:MACD死叉绿柱放大,均线空头排列向下,KDJ死叉未超卖,做空
════════════════════
🟢 $AAOI 30分钟 空头信号
⚠️技术面:30分钟入场:MACD零下死叉、绿柱放大;均线空头排列发散向下;KDJ死叉未超卖。4小时空头共振确认,多周期共振看空,成交量放量3.8倍。
════════════════════
🔔 关注获取第一手行情异动 🔔
#多周期共振 #AVGO #MARSCOIN #AAOI
📌 交易时注意k线形态是否符合
════════════════════
🟢 $AVGO 30分钟 空头信号
⚠️技术面:4小时+30分钟空头共振!30分钟MACD零下死叉,均线空头排列,KDJ死叉未超卖,成交放量6.7倍,短期看空
════════════════════
🟢 $MARSCOIN 30分钟 空头信号
⚠️技术面:4小时空头共振+30分钟入场:MACD死叉绿柱放大,均线空头排列向下,KDJ死叉未超卖,做空
════════════════════
🟢 $AAOI 30分钟 空头信号
⚠️技术面:30分钟入场:MACD零下死叉、绿柱放大;均线空头排列发散向下;KDJ死叉未超卖。4小时空头共振确认,多周期共振看空,成交量放量3.8倍。
════════════════════
🔔 关注获取第一手行情异动 🔔
#多周期共振 #AVGO #MARSCOIN #AAOI
📌 交易时注意k线形态是否符合
5

·
--
一条笑不太出来的真相:$MARSCOIN 24小时新低,现价 0.0327,前低 0.0329。
每到新低,评论区总有人说“最后一跌”,然后市场礼貌地又往下探了一层。
抄底不急于一时,确认止跌再稳妥。
#MARSCOIN
一条笑不太出来的真相:$MARSCOIN 24小时新低,现价 0.0327,前低 0.0329。
每到新低,评论区总有人说“最后一跌”,然后市场礼貌地又往下探了一层。
抄底不急于一时,确认止跌再稳妥。
#MARSCOIN
每到新低,评论区总有人说“最后一跌”,然后市场礼貌地又往下探了一层。
抄底不急于一时,确认止跌再稳妥。
#MARSCOIN
16

·
--
MARSCOIN & SOPH | Heavy Correction, Recovery Still Uncertain
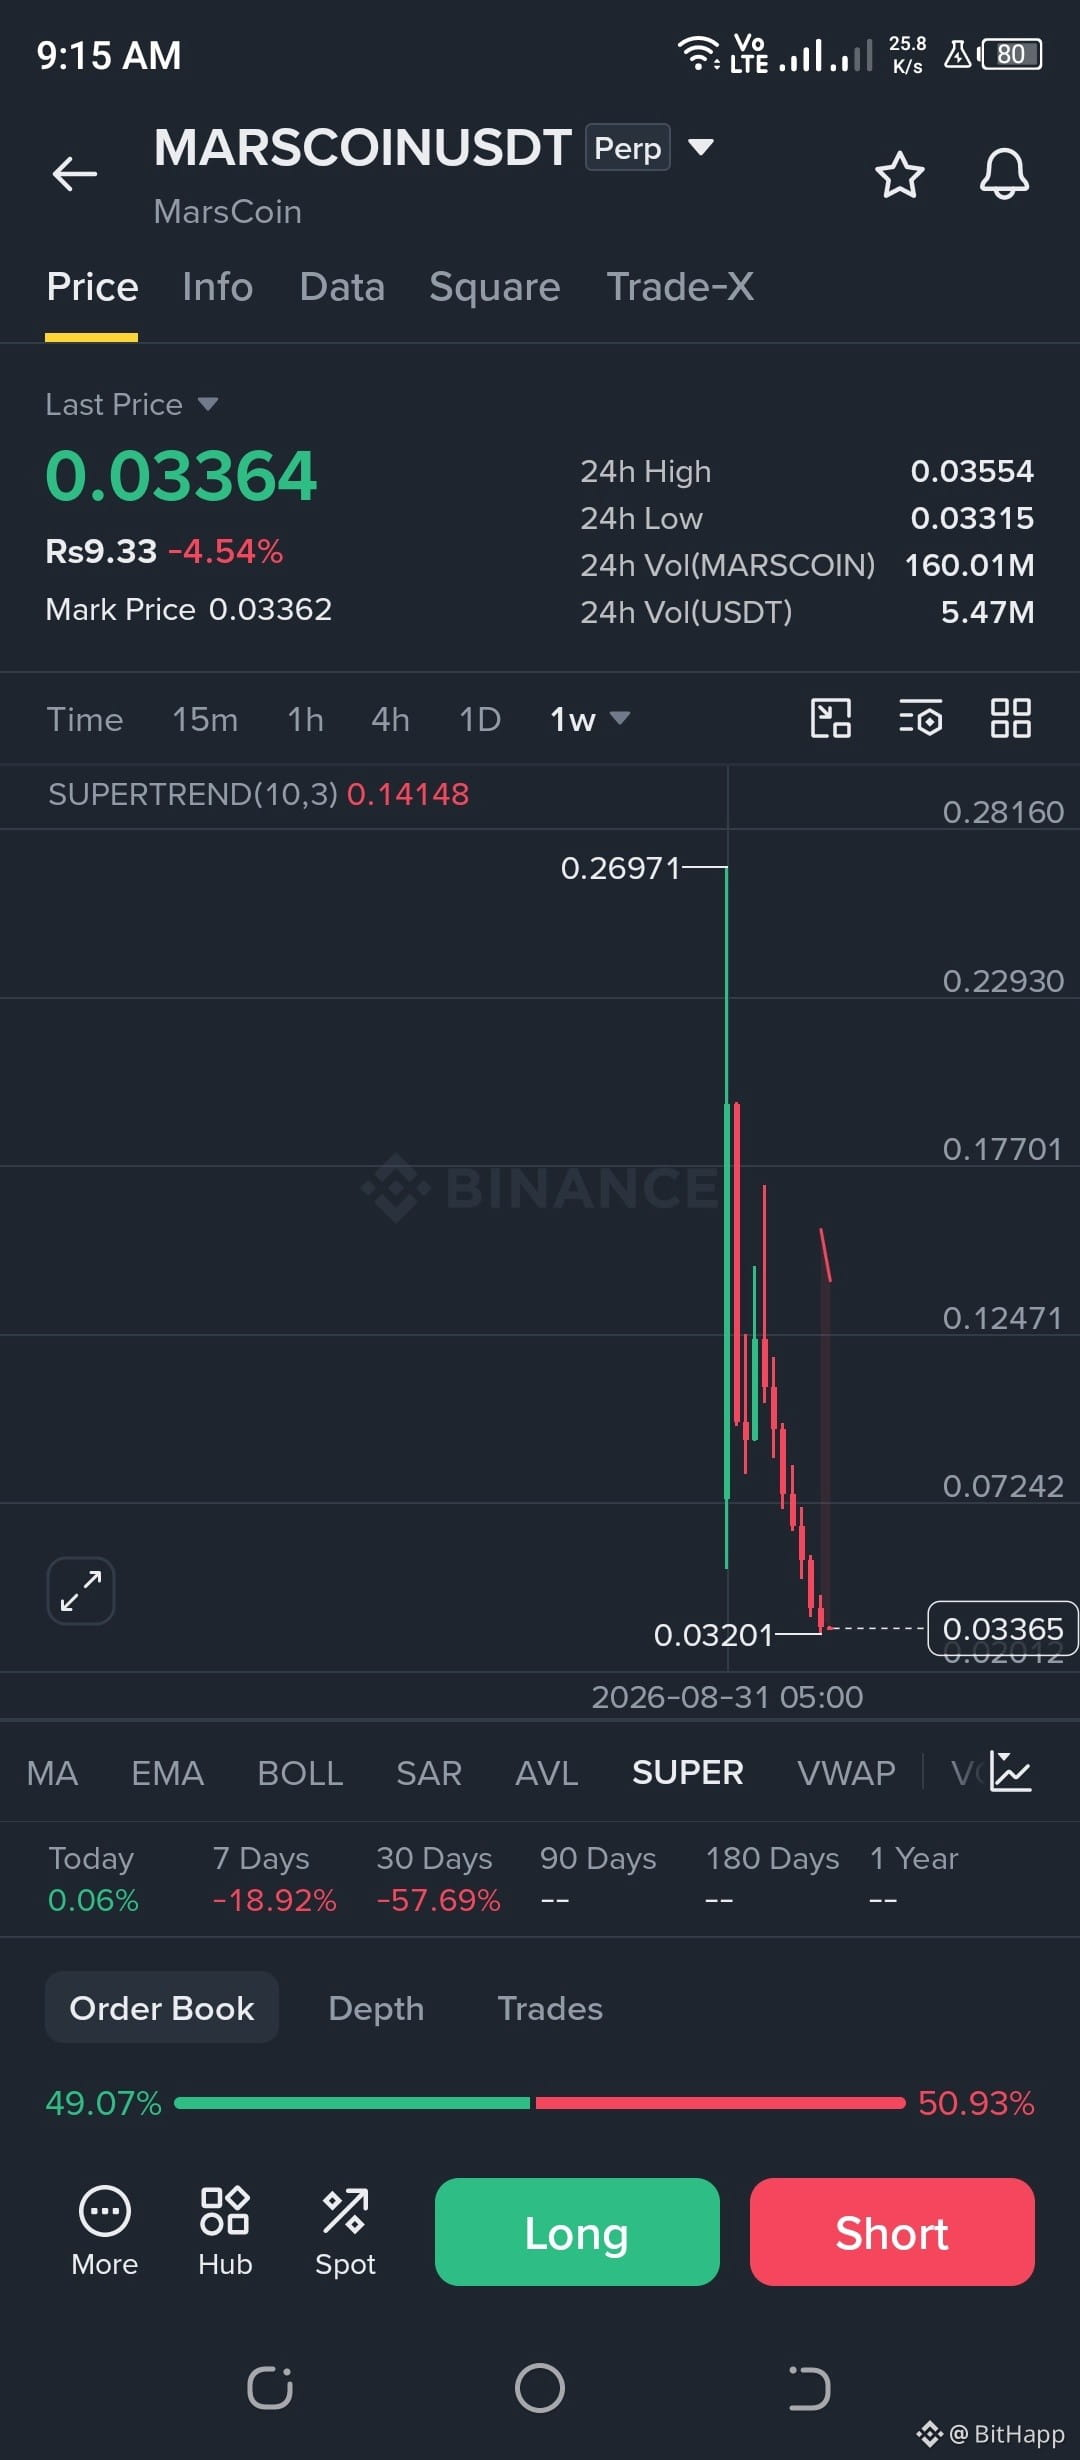
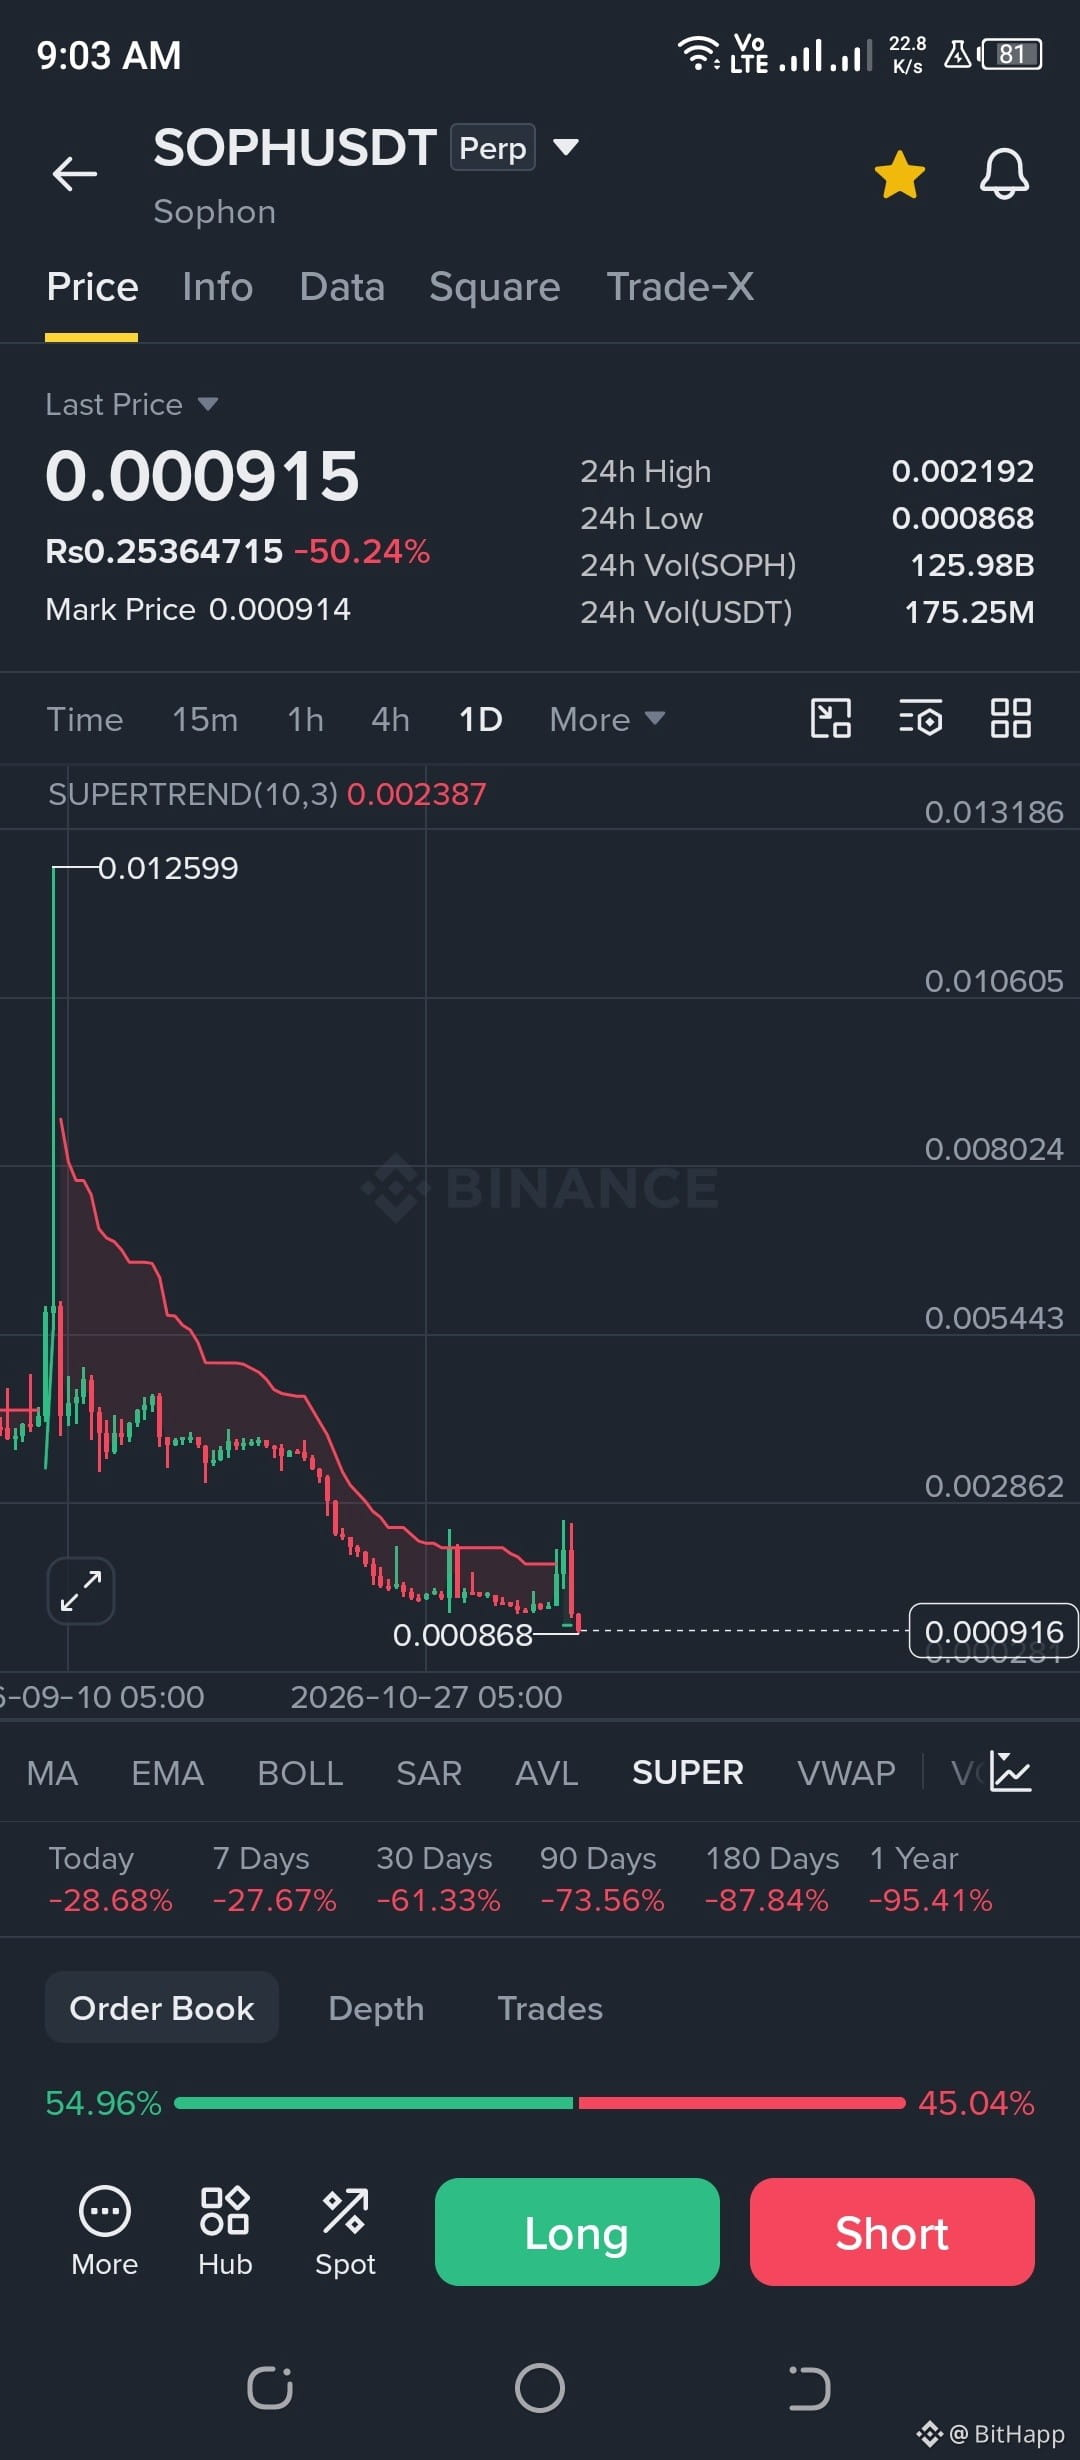
Both MARSCOIN and SOPH have experienced massive declines after their previous rallies.
$MARSCOIN : Down sharply from $0.26971.
$SOPH : Facing extreme selling pressure after falling from $0.012599.
Market Insight:
A massive price drop does not automatically mean a bullish reversal. Buyers need to demonstrate real strength before recovery can be confirmed.
My Strategy:
No blind buying. No emotional trading. Wait for confirmation and protect your capital.
Sometimes, patience is more profitable than trading.
What do you think? Recovery or further downside?
#MARSCOIN #SOPH #CryptoAnalysis #MarketUpdate
MARSCOIN & SOPH | Heavy Correction, Recovery Still Uncertain
Both MARSCOIN and SOPH have experienced massive declines after their previous rallies.
$MARSCOIN : Down sharply from $0.26971.
$SOPH : Facing extreme selling pressure after falling from $0.012599.
Market Insight:
A massive price drop does not automatically mean a bullish reversal. Buyers need to demonstrate real strength before recovery can be confirmed.
My Strategy:
No blind buying. No emotional trading. Wait for confirmation and protect your capital.
Sometimes, patience is more profitable than trading.
What do you think? Recovery or further downside?
#MARSCOIN #SOPH #CryptoAnalysis #MarketUpdate
Both MARSCOIN and SOPH have experienced massive declines after their previous rallies.
$MARSCOIN : Down sharply from $0.26971.
$SOPH : Facing extreme selling pressure after falling from $0.012599.
Market Insight:
A massive price drop does not automatically mean a bullish reversal. Buyers need to demonstrate real strength before recovery can be confirmed.
My Strategy:
No blind buying. No emotional trading. Wait for confirmation and protect your capital.
Sometimes, patience is more profitable than trading.
What do you think? Recovery or further downside?
#MARSCOIN #SOPH #CryptoAnalysis #MarketUpdate
Zeus_666:
do you still have a hope it gonna rise again man ?!!
3
4
1.6k

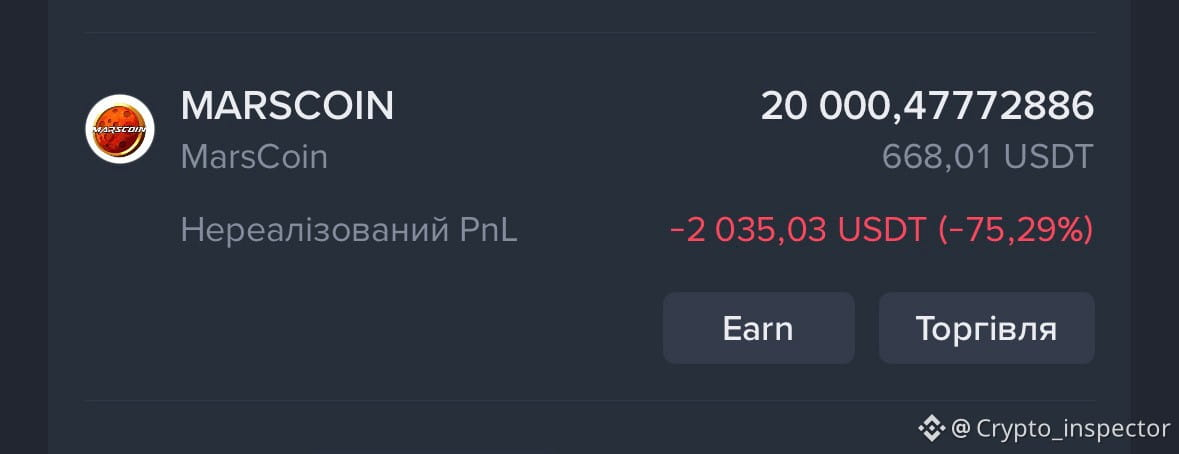
Друзі потрібна Ваша допомога . Я купив 20000 marscoin і весь жовтень тримав на споті. Є інформація що за це мав би бути дроп на початку листопада в #spcxb !!! Але чомусь нічого немає ! Що робити ??? Підскажіть #marscoin
{spot}(MARSCOINUSDT)
#helpmeplease
Друзі потрібна Ваша допомога . Я купив 20000 marscoin і весь жовтень тримав на споті. Є інформація що за це мав би бути дроп на початку листопада в #spcxb !!! Але чомусь нічого немає ! Що робити ??? Підскажіть #marscoin
#helpmeplease
#helpmeplease
500
·
--
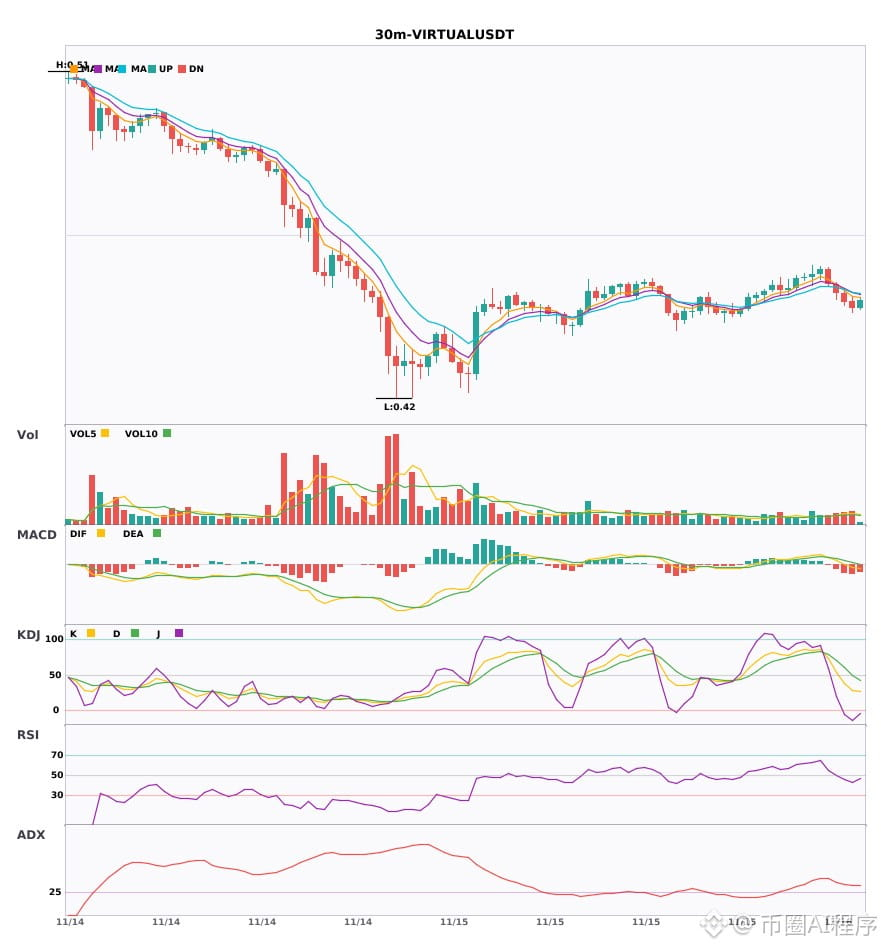
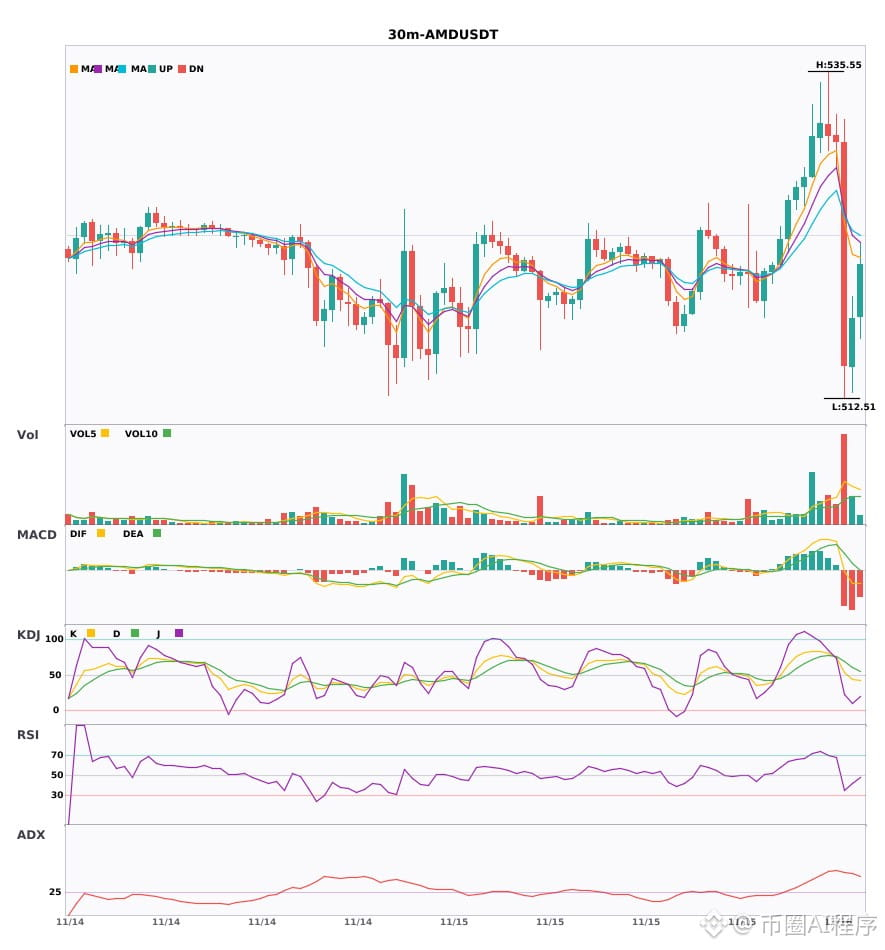
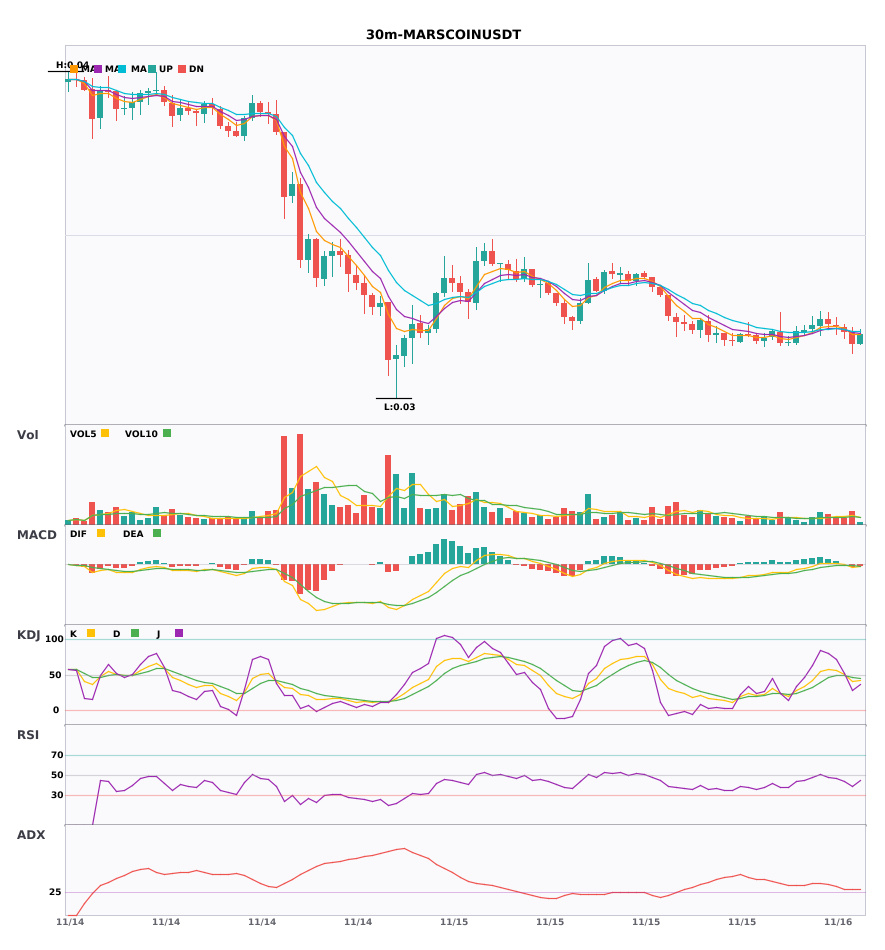
$VIRTUAL/$AMD/$MARSCOIN 30分走弱4时空头确立🔥
════════════════════
🟢 $VIRTUAL 30分钟 空头信号
⚠️技术面:多周期共振做空:4小时空头+30分钟入场共振确认,MACD DIF跌破零轴趋势转空,均线空头排列向下发散,KDJ K下穿D未超卖,量能正常。
════════════════════
🟢 $AMD 30分钟 空头信号
⚠️技术面:4小时空头+30分钟空头共振确认,MACD绿柱持续放大,均线空头排列发散向下,放量3.5倍,动能增强
📢市场动态:AMD获谷歌新一代TPU 8tx AI系统关键合作,其机密计算安全特性或为云厂商树立标杆,有望扩大市场影响力。
════════════════════
🟢 $MARSCOIN 30分钟 空头信号
⚠️技术面:4小时空头+30分钟入场共振确认!30分钟MACD零轴下死叉放量,EMA5下穿EMA8转空排列,KDJ死叉未进超卖(K40.9 D46.9),成交量放大1.6倍。
════════════════════
🔔 关注获取第一手行情异动 🔔
#多周期共振 #VIRTUAL #AMD #MARSCOIN
📌 交易时注意k线形态是否符合
$VIRTUAL /$AMD /$MARSCOIN 30分走弱4时空头确立🔥
════════════════════
🟢 $VIRTUAL 30分钟 空头信号
⚠️技术面:多周期共振做空:4小时空头+30分钟入场共振确认,MACD DIF跌破零轴趋势转空,均线空头排列向下发散,KDJ K下穿D未超卖,量能正常。
════════════════════
🟢 $AMD 30分钟 空头信号
⚠️技术面:4小时空头+30分钟空头共振确认,MACD绿柱持续放大,均线空头排列发散向下,放量3.5倍,动能增强
📢市场动态:AMD获谷歌新一代TPU 8tx AI系统关键合作,其机密计算安全特性或为云厂商树立标杆,有望扩大市场影响力。
════════════════════
🟢 $MARSCOIN 30分钟 空头信号
⚠️技术面:4小时空头+30分钟入场共振确认!30分钟MACD零轴下死叉放量,EMA5下穿EMA8转空排列,KDJ死叉未进超卖(K40.9 D46.9),成交量放大1.6倍。
════════════════════
🔔 关注获取第一手行情异动 🔔
#多周期共振 #VIRTUAL #AMD #MARSCOIN
📌 交易时注意k线形态是否符合
════════════════════
🟢 $VIRTUAL 30分钟 空头信号
⚠️技术面:多周期共振做空:4小时空头+30分钟入场共振确认,MACD DIF跌破零轴趋势转空,均线空头排列向下发散,KDJ K下穿D未超卖,量能正常。
════════════════════
🟢 $AMD 30分钟 空头信号
⚠️技术面:4小时空头+30分钟空头共振确认,MACD绿柱持续放大,均线空头排列发散向下,放量3.5倍,动能增强
📢市场动态:AMD获谷歌新一代TPU 8tx AI系统关键合作,其机密计算安全特性或为云厂商树立标杆,有望扩大市场影响力。
════════════════════
🟢 $MARSCOIN 30分钟 空头信号
⚠️技术面:4小时空头+30分钟入场共振确认!30分钟MACD零轴下死叉放量,EMA5下穿EMA8转空排列,KDJ死叉未进超卖(K40.9 D46.9),成交量放大1.6倍。
════════════════════
🔔 关注获取第一手行情异动 🔔
#多周期共振 #VIRTUAL #AMD #MARSCOIN
📌 交易时注意k线形态是否符合
36
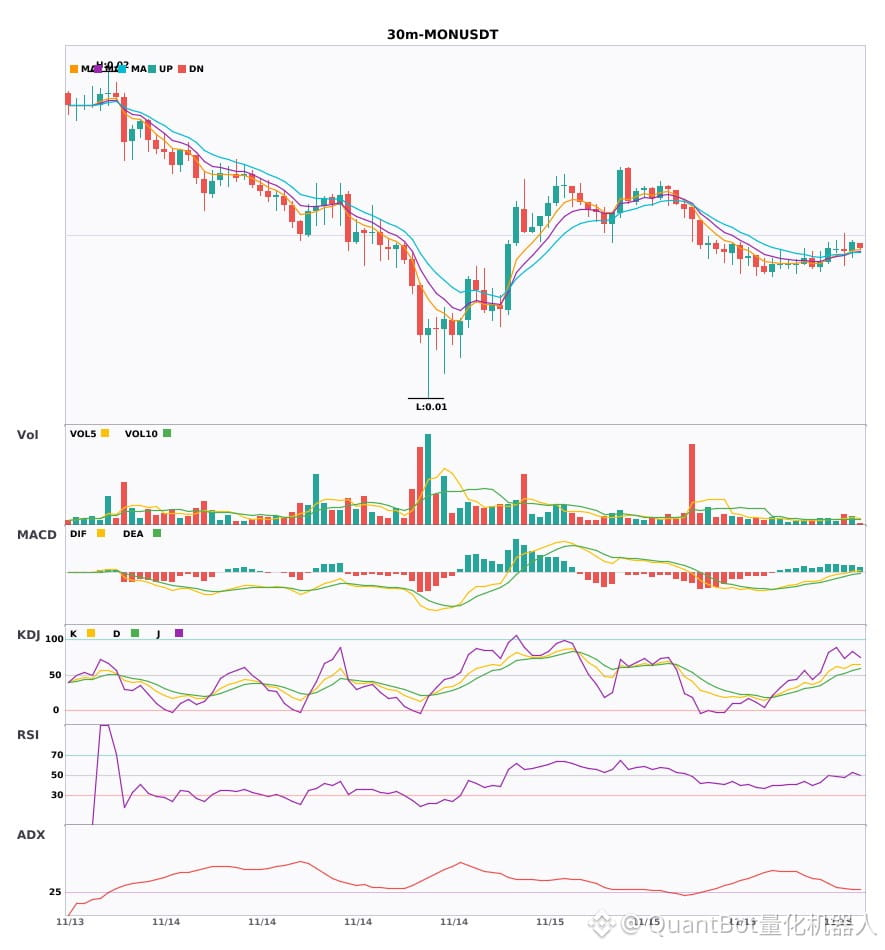
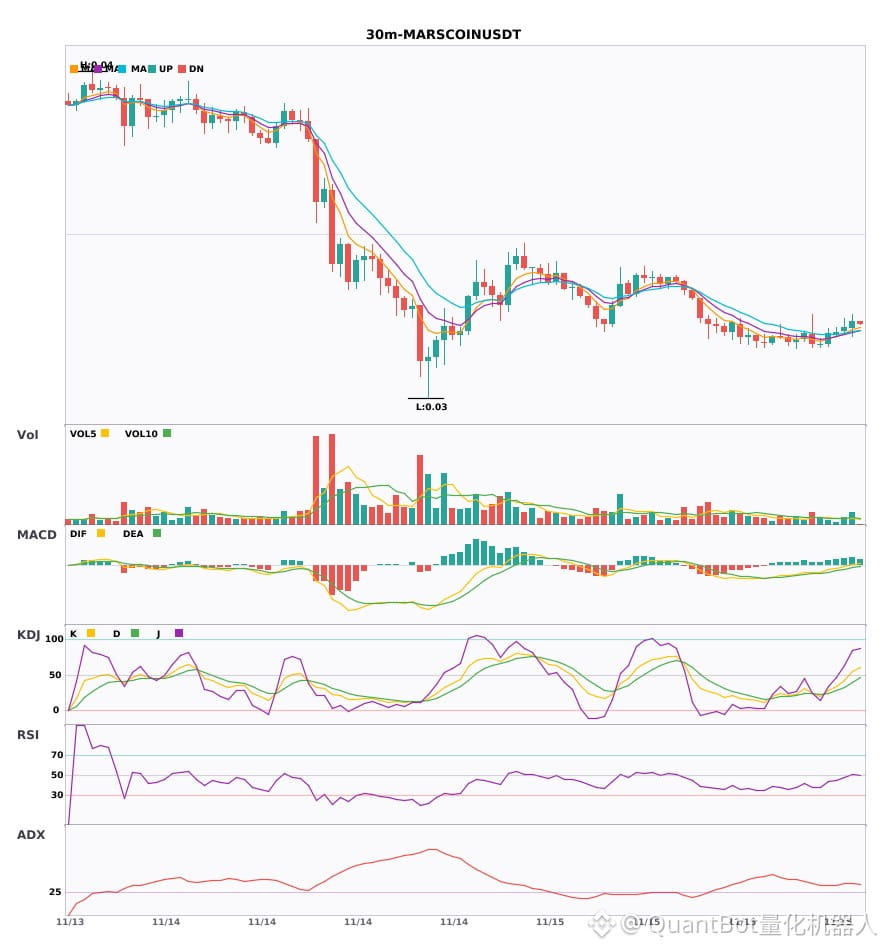
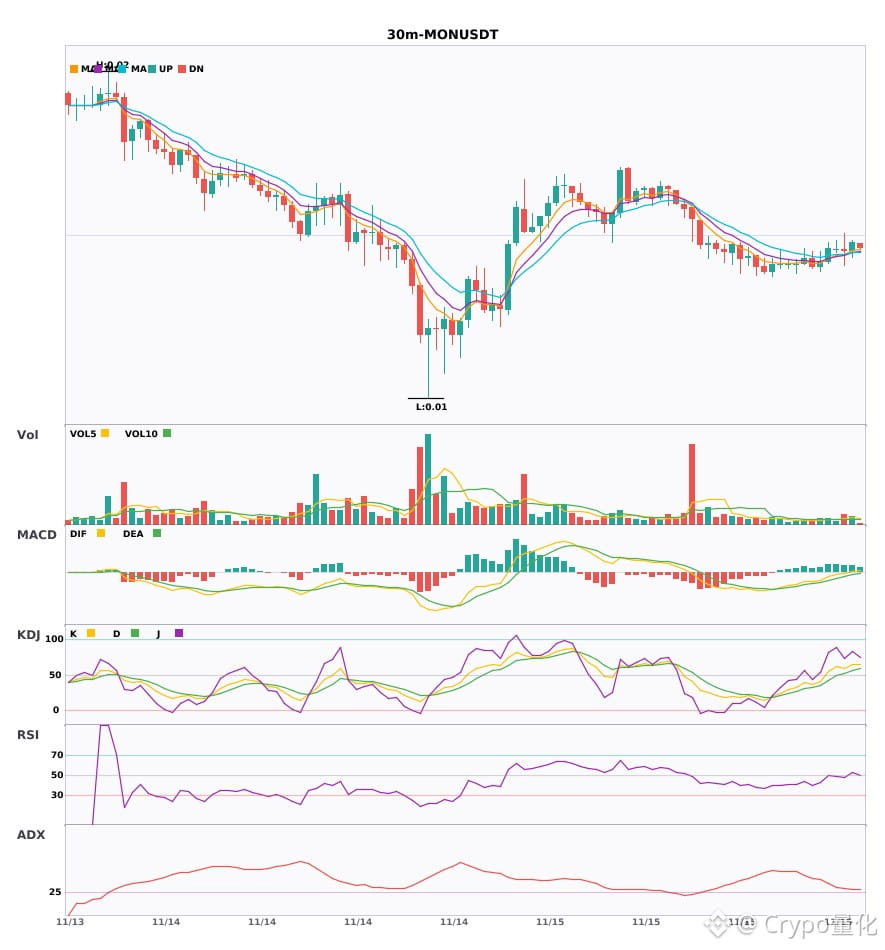
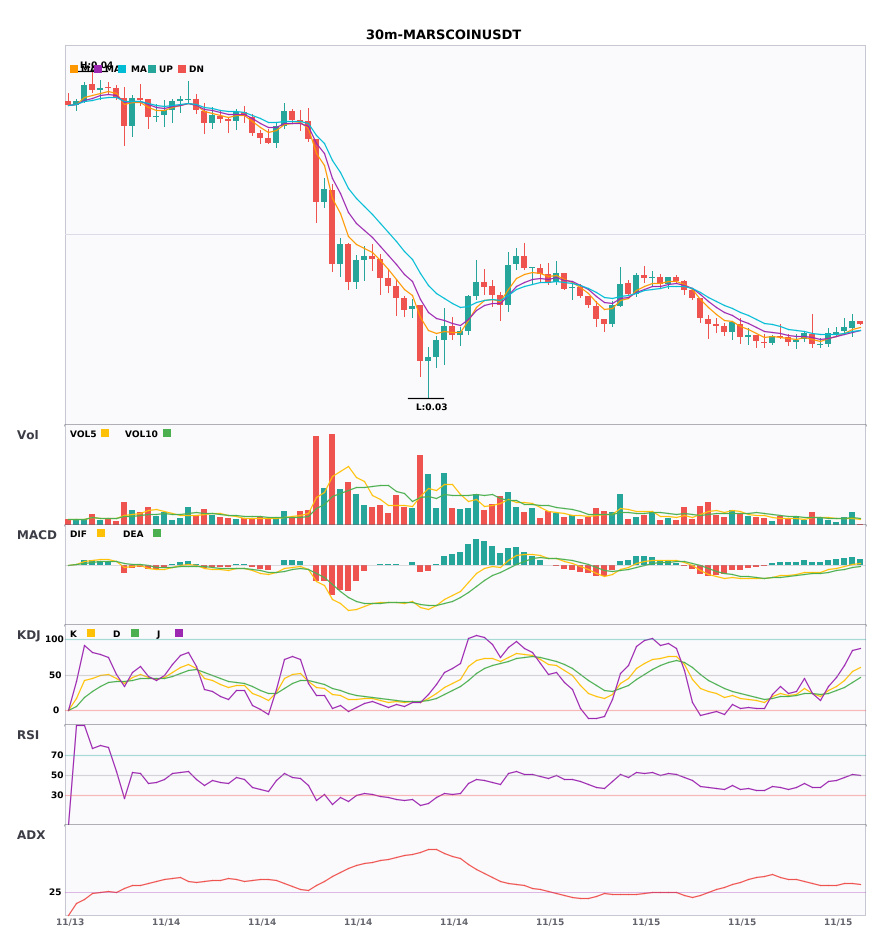
$MON/$牛来/$MARSCOIN 30分钟多头共振信号
📈 $MON | 30分钟 多头信号
━━━━━━━━━━━━━━━━━━
技术分析:ADX(28)趋势成型;MACD DIF上破零轴;EMA5>8>13多头排列;KDJ强势(K65.3/D56.7);成交量放大1.8倍。
价格变动:0.5200%
📈 $牛来 | 30分钟 多头信号
━━━━━━━━━━━━━━━━━━
技术分析:ADX(35)指示强趋势,MACD DIF上破零轴转多,均线高度收敛待定向,成交量放大至2.0倍。
价格变动:-0.5100%
📈 $MARSCOIN | 30分钟 多头信号
━━━━━━━━━━━━━━━━━━
技术分析:ADX(39)显示强趋势;MACDDIF上穿零轴,趋势转多;均线高度收敛,方向选择临近;成交量放大1.7倍。
价格变动:0.4700%
━━━━━━━━━━━━━━━━━━
#技术分析 #MON #牛来 #MARSCOIN
📌 以上内容仅供参考,不构成投资建议
$MON /$牛来/$MARSCOIN 30分钟多头共振信号
📈 $MON | 30分钟 多头信号
━━━━━━━━━━━━━━━━━━
技术分析:ADX(28)趋势成型;MACD DIF上破零轴;EMA5>8>13多头排列;KDJ强势(K65.3/D56.7);成交量放大1.8倍。
价格变动:0.5200%
📈 $牛来 | 30分钟 多头信号
━━━━━━━━━━━━━━━━━━
技术分析:ADX(35)指示强趋势,MACD DIF上破零轴转多,均线高度收敛待定向,成交量放大至2.0倍。
价格变动:-0.5100%
📈 $MARSCOIN | 30分钟 多头信号
━━━━━━━━━━━━━━━━━━
技术分析:ADX(39)显示强趋势;MACDDIF上穿零轴,趋势转多;均线高度收敛,方向选择临近;成交量放大1.7倍。
价格变动:0.4700%
━━━━━━━━━━━━━━━━━━
#技术分析 #MON #牛来 #MARSCOIN
📌 以上内容仅供参考,不构成投资建议
📈 $MON | 30分钟 多头信号
━━━━━━━━━━━━━━━━━━
技术分析:ADX(28)趋势成型;MACD DIF上破零轴;EMA5>8>13多头排列;KDJ强势(K65.3/D56.7);成交量放大1.8倍。
价格变动:0.5200%
📈 $牛来 | 30分钟 多头信号
━━━━━━━━━━━━━━━━━━
技术分析:ADX(35)指示强趋势,MACD DIF上破零轴转多,均线高度收敛待定向,成交量放大至2.0倍。
价格变动:-0.5100%
📈 $MARSCOIN | 30分钟 多头信号
━━━━━━━━━━━━━━━━━━
技术分析:ADX(39)显示强趋势;MACDDIF上穿零轴,趋势转多;均线高度收敛,方向选择临近;成交量放大1.7倍。
价格变动:0.4700%
━━━━━━━━━━━━━━━━━━
#技术分析 #MON #牛来 #MARSCOIN
📌 以上内容仅供参考,不构成投资建议
305
·
--
$MON $牛来 $MARSCOIN 30分钟多头信号齐发🔥
════════════════════
🔴 $MON 30分钟 多头信号
⚠️技术面:ADX显示趋势刚启动可以进场了,MACD金叉后红柱持续放大突破零轴转多,均线多头排列发散向上,KDJ的K上穿D还没到超买区,成交量也放了1.8倍。
════════════════════
🔴 $牛来 30分钟 多头信号
⚠️技术面:ADX35说明趋势行情刚启动,MACD金叉放量突破零轴,多头信号明确。均线刚形成排列发散向上,成交量放大2倍,方向大概率向上。
════════════════════
🔴 $MARSCOIN 30分钟 多头信号
⚠️技术面:ADX39趋势很强,MACD金叉后放量突破零轴转多,均线刚聚拢待发散,量能放大1.7倍。
════════════════════
🔔 关注获取第一手行情异动 🔔
#技术分析 #MON #牛来 #MARSCOIN
📌 交易时注意k线形态是否符合
$MON $牛来 $MARSCOIN 30分钟多头信号齐发🔥
════════════════════
🔴 $MON 30分钟 多头信号
⚠️技术面:ADX显示趋势刚启动可以进场了,MACD金叉后红柱持续放大突破零轴转多,均线多头排列发散向上,KDJ的K上穿D还没到超买区,成交量也放了1.8倍。
════════════════════
🔴 $牛来 30分钟 多头信号
⚠️技术面:ADX35说明趋势行情刚启动,MACD金叉放量突破零轴,多头信号明确。均线刚形成排列发散向上,成交量放大2倍,方向大概率向上。
════════════════════
🔴 $MARSCOIN 30分钟 多头信号
⚠️技术面:ADX39趋势很强,MACD金叉后放量突破零轴转多,均线刚聚拢待发散,量能放大1.7倍。
════════════════════
🔔 关注获取第一手行情异动 🔔
#技术分析 #MON #牛来 #MARSCOIN
📌 交易时注意k线形态是否符合
════════════════════
🔴 $MON 30分钟 多头信号
⚠️技术面:ADX显示趋势刚启动可以进场了,MACD金叉后红柱持续放大突破零轴转多,均线多头排列发散向上,KDJ的K上穿D还没到超买区,成交量也放了1.8倍。
════════════════════
🔴 $牛来 30分钟 多头信号
⚠️技术面:ADX35说明趋势行情刚启动,MACD金叉放量突破零轴,多头信号明确。均线刚形成排列发散向上,成交量放大2倍,方向大概率向上。
════════════════════
🔴 $MARSCOIN 30分钟 多头信号
⚠️技术面:ADX39趋势很强,MACD金叉后放量突破零轴转多,均线刚聚拢待发散,量能放大1.7倍。
════════════════════
🔔 关注获取第一手行情异动 🔔
#技术分析 #MON #牛来 #MARSCOIN
📌 交易时注意k线形态是否符合
247

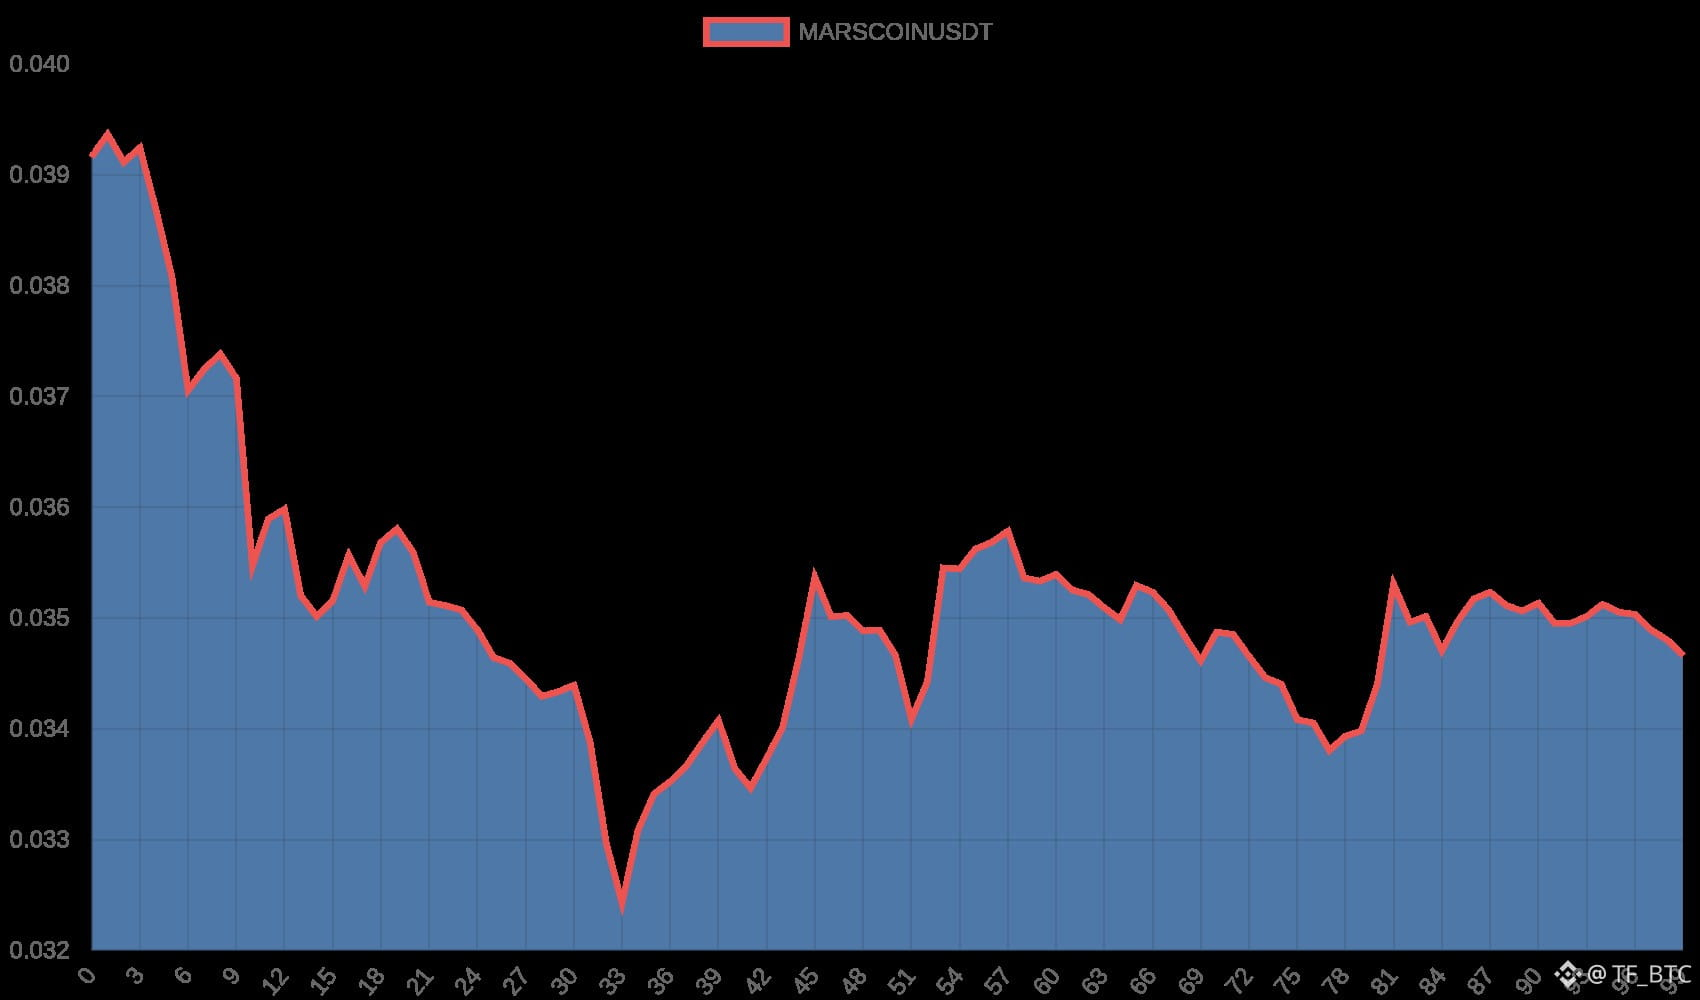


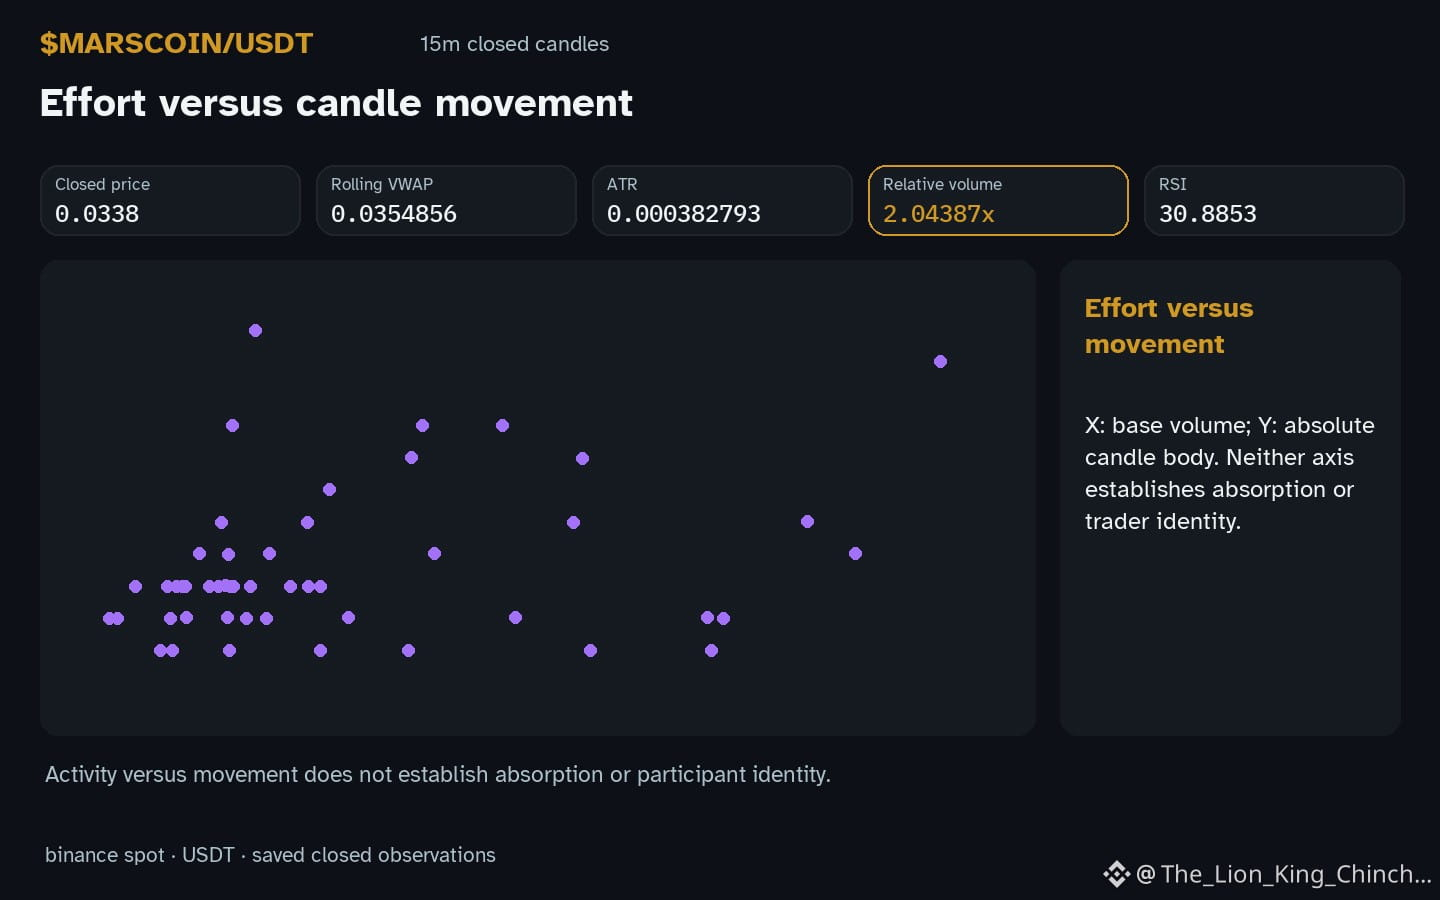
$MARSCOIN: MARSCOIN: The Quiet Library Test
$MARSCOIN price is below 0.0339 with hourly direction down.
Think of a quiet library. A loud argument changes the room. A whisper does not, yet a librarian may hear it. In markets, volume that is 2.04x baseline can feel loud. But if price stays rangebound, the move may be absorbed. This is a hypothetical mechanism, not a claim that specific traders are hiding orders. Candles show outcomes, not intentions.
The analogy breaks here. High relative volume is a ratio, not a measurement of who is buying. It does not confirm hidden accumulation or stop hunts. Imagine two scenarios. First, a large limit order absorbs selling. The range contracts. Second, market sell orders overwhelm buyers, and price drops further. Candles alone cannot distinguish these paths. Do not infer motives from the shape of the bar.
RSI at 30.9 provides context. It is an indicator reading, not a price bound. If RSI makes a new low while price holds range, that is a divergence in the indicator, not proof of reversal. Such patterns can fail. A counterexample is a slow bleed. Price stops falling, but RSI drifts lower. No breakout occurs. The "absorption" was just exhaustion. This shows why we must test the idea, not assume it.
To reassess this interpretation, watch for a closed candle. If the next candle closes back inside the prior range with volume returning to normal, the absorption idea weakens. If it breaks below 0.0339, the quiet phase may have been a pause. Keep it simple. Do not guess the end of the story before the candles close. The limit of candles is that they remove the why. Use them to state what happened, not to predict what will happen. Treat the current setup as a single data point in a larger test.
Probabilistic market research, not a recommendation or guaranteed return.
Where does this analogy help, and where does it break?
#MARSCOIN #CryptoEducation #CryptoLearning
$MARSCOIN : MARSCOIN: The Quiet Library Test
$MARSCOIN price is below 0.0339 with hourly direction down.
Think of a quiet library. A loud argument changes the room. A whisper does not, yet a librarian may hear it. In markets, volume that is 2.04x baseline can feel loud. But if price stays rangebound, the move may be absorbed. This is a hypothetical mechanism, not a claim that specific traders are hiding orders. Candles show outcomes, not intentions.
The analogy breaks here. High relative volume is a ratio, not a measurement of who is buying. It does not confirm hidden accumulation or stop hunts. Imagine two scenarios. First, a large limit order absorbs selling. The range contracts. Second, market sell orders overwhelm buyers, and price drops further. Candles alone cannot distinguish these paths. Do not infer motives from the shape of the bar.
RSI at 30.9 provides context. It is an indicator reading, not a price bound. If RSI makes a new low while price holds range, that is a divergence in the indicator, not proof of reversal. Such patterns can fail. A counterexample is a slow bleed. Price stops falling, but RSI drifts lower. No breakout occurs. The "absorption" was just exhaustion. This shows why we must test the idea, not assume it.
To reassess this interpretation, watch for a closed candle. If the next candle closes back inside the prior range with volume returning to normal, the absorption idea weakens. If it breaks below 0.0339, the quiet phase may have been a pause. Keep it simple. Do not guess the end of the story before the candles close. The limit of candles is that they remove the why. Use them to state what happened, not to predict what will happen. Treat the current setup as a single data point in a larger test.
Probabilistic market research, not a recommendation or guaranteed return.
Where does this analogy help, and where does it break?
#MARSCOIN #CryptoEducation #CryptoLearning
$MARSCOIN price is below 0.0339 with hourly direction down.
Think of a quiet library. A loud argument changes the room. A whisper does not, yet a librarian may hear it. In markets, volume that is 2.04x baseline can feel loud. But if price stays rangebound, the move may be absorbed. This is a hypothetical mechanism, not a claim that specific traders are hiding orders. Candles show outcomes, not intentions.
The analogy breaks here. High relative volume is a ratio, not a measurement of who is buying. It does not confirm hidden accumulation or stop hunts. Imagine two scenarios. First, a large limit order absorbs selling. The range contracts. Second, market sell orders overwhelm buyers, and price drops further. Candles alone cannot distinguish these paths. Do not infer motives from the shape of the bar.
RSI at 30.9 provides context. It is an indicator reading, not a price bound. If RSI makes a new low while price holds range, that is a divergence in the indicator, not proof of reversal. Such patterns can fail. A counterexample is a slow bleed. Price stops falling, but RSI drifts lower. No breakout occurs. The "absorption" was just exhaustion. This shows why we must test the idea, not assume it.
To reassess this interpretation, watch for a closed candle. If the next candle closes back inside the prior range with volume returning to normal, the absorption idea weakens. If it breaks below 0.0339, the quiet phase may have been a pause. Keep it simple. Do not guess the end of the story before the candles close. The limit of candles is that they remove the why. Use them to state what happened, not to predict what will happen. Treat the current setup as a single data point in a larger test.
Probabilistic market research, not a recommendation or guaranteed return.
Where does this analogy help, and where does it break?
#MARSCOIN #CryptoEducation #CryptoLearning
60
·
--
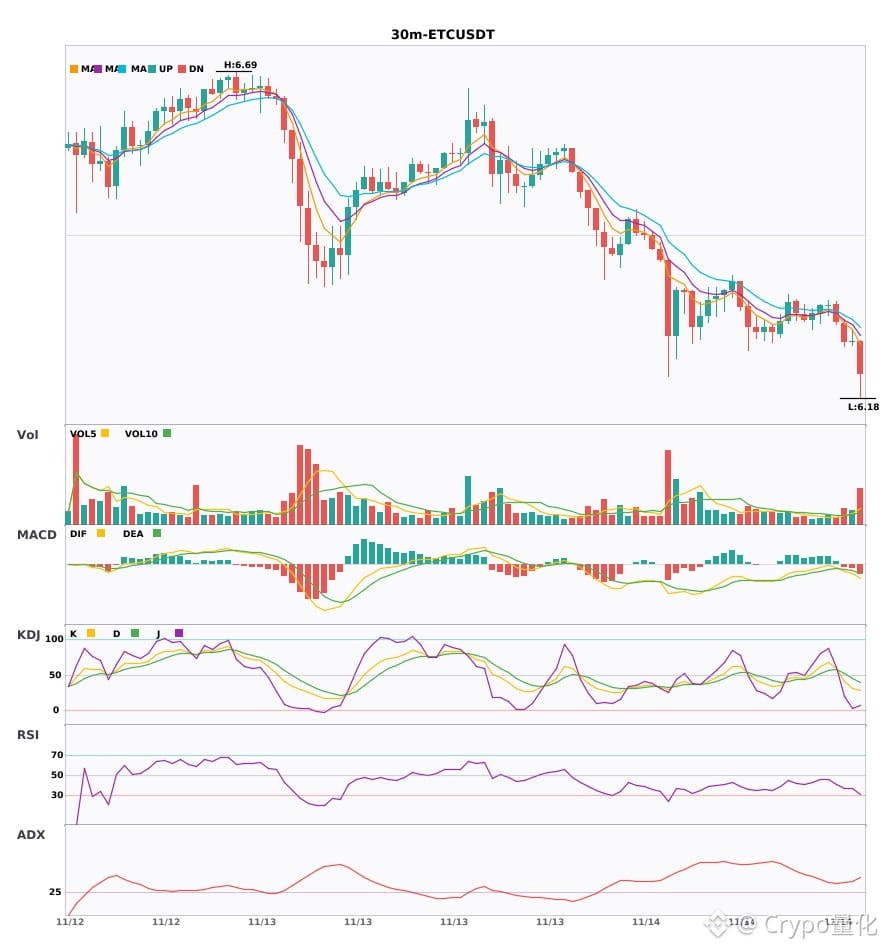
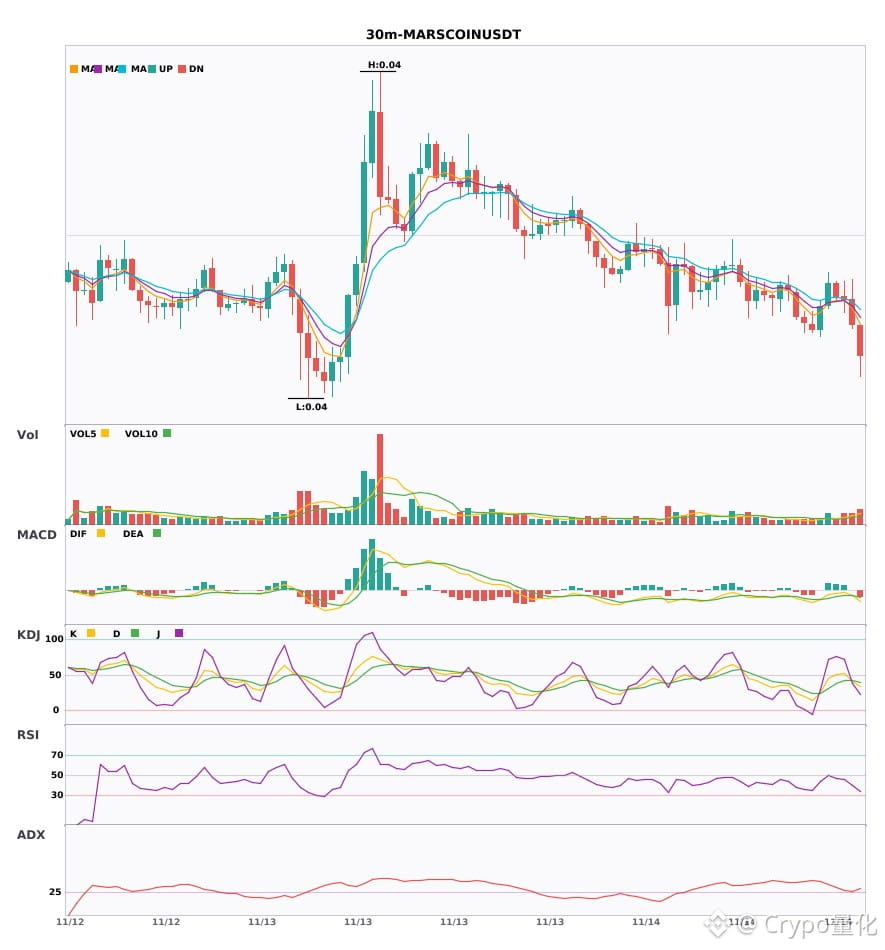
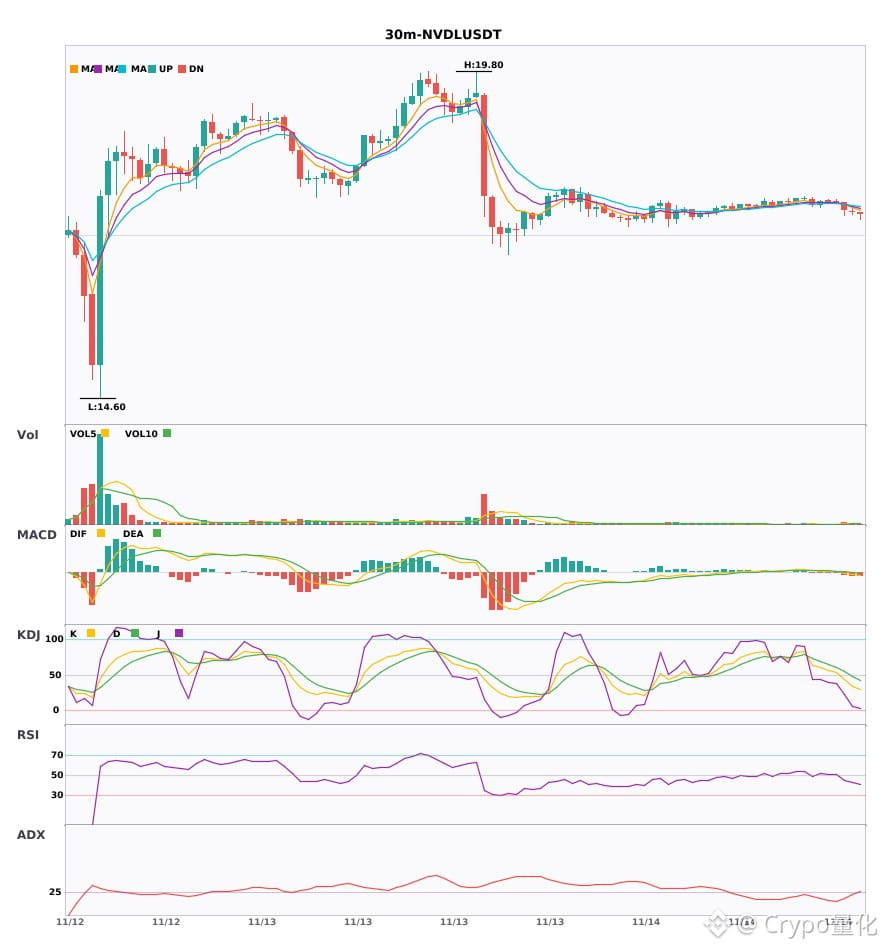
$ETC $MARSCOIN $NVDL 30分钟齐齐走弱,小心回调🔥
════════════════════
🟢 $ETC 30分钟 空头信号
⚠️技术面:ADX 32趋势挺强,MACD零下死叉放量,均线空头发散,KDJ死叉K41.6 D52.1,成交量放大1.7倍,短期看空。
════════════════════
🟢 $MARSCOIN 30分钟 空头信号
⚠️技术面:ADX26趋势刚形成,MACD死叉空头加速,EMA5下穿8短期转空,KDJ死叉看空,量放大1.7倍
════════════════════
🟢 $NVDL 30分钟 空头信号
⚠️技术面:ADX趋势刚起可参与 | MACD空头动能增强 | 均线空头排列 | KDJ弱势K34低于D48 | 量爆2.9倍
════════════════════
🔔 关注获取第一手行情异动 🔔
#技术分析 #ETC #MARSCOIN #NVDL
📌 交易时注意k线形态是否符合
$ETC $MARSCOIN $NVDL 30分钟齐齐走弱,小心回调🔥
════════════════════
🟢 $ETC 30分钟 空头信号
⚠️技术面:ADX 32趋势挺强,MACD零下死叉放量,均线空头发散,KDJ死叉K41.6 D52.1,成交量放大1.7倍,短期看空。
════════════════════
🟢 $MARSCOIN 30分钟 空头信号
⚠️技术面:ADX26趋势刚形成,MACD死叉空头加速,EMA5下穿8短期转空,KDJ死叉看空,量放大1.7倍
════════════════════
🟢 $NVDL 30分钟 空头信号
⚠️技术面:ADX趋势刚起可参与 | MACD空头动能增强 | 均线空头排列 | KDJ弱势K34低于D48 | 量爆2.9倍
════════════════════
🔔 关注获取第一手行情异动 🔔
#技术分析 #ETC #MARSCOIN #NVDL
📌 交易时注意k线形态是否符合
════════════════════
🟢 $ETC 30分钟 空头信号
⚠️技术面:ADX 32趋势挺强,MACD零下死叉放量,均线空头发散,KDJ死叉K41.6 D52.1,成交量放大1.7倍,短期看空。
════════════════════
🟢 $MARSCOIN 30分钟 空头信号
⚠️技术面:ADX26趋势刚形成,MACD死叉空头加速,EMA5下穿8短期转空,KDJ死叉看空,量放大1.7倍
════════════════════
🟢 $NVDL 30分钟 空头信号
⚠️技术面:ADX趋势刚起可参与 | MACD空头动能增强 | 均线空头排列 | KDJ弱势K34低于D48 | 量爆2.9倍
════════════════════
🔔 关注获取第一手行情异动 🔔
#技术分析 #ETC #MARSCOIN #NVDL
📌 交易时注意k线形态是否符合
48
තවත් අන්තර්ගතයන් ගවේෂණය කිරීමට ඇතුල් වන්න
Binance චතුරශ්රය හි ගෝලීය ක්රිප්ටෝ පරිශීලකයින් හා එක්වන්න
⚡️ ක්රිප්ටෝ පිළිබඳ නවතම සහ ප්රයෝජනවත් තොරතුරු ලබා ගන්න.
💬 ලොව විශාලතම ක්රිප්ටෝ හුවමාරුව මගින් විශ්වාස කෙරේ.
👍 සත්යායනය කරන ලද නිර්මාණකරුවන්ගෙන් සැබෑ විදසුන් සොයා ගන්න.
විද්යුත් තැපෑල / දුරකථන අංකය
නැගී එන මාතෘකා
1
#NvidiaEarningsTonight:AIStocks’NextMove?
64,710 නැරඹීම්
928 සාකච්ඡා කරමින්
2
#A Packed Week of Earnings and Data Tests Markets
122,720 නැරඹීම්
616 සාකච්ඡා කරමින්
3
#AnthropicIPOTestsInvestorAppetiteForAI
270,943 නැරඹීම්
2,633 සාකච්ඡා කරමින්
4
#NvidiaBoardNotConsideringHuang’sReturnasCEO
79,330 නැරඹීම්
785 සාකච්ඡා කරමින්
5
#KOSPIFalls2.59%ToLowestCloseSinceFebruary
14,513 නැරඹීම්
194 සාකච්ඡා කරමින්
6
#AnthropicClearedToListOnNasdaqAsANT
15,667 නැරඹීම්
176 සාකච්ඡා කරමින්
7
#WhatInvestmentSignalsDo13FFilingsReveal?
43,551 නැරඹීම්
561 සාකච්ඡා කරමින්
8
#TetherCapitalMakesStrategicInvestmentInStables
5,439 නැරඹීම්
60 සාකච්ඡා කරමින්
9
#EvernorthRecords$505MImpairmentOnPreListingXRP
1,235 නැරඹීම්
19 සාකච්ඡා කරමින්
10
#GoldmanSachsReports$1.22BInEtherETFHoldings
965 නැරඹීම්
15 සාකච්ඡා කරමින්