

#marscoin
marscoin
1.5M views
9,578 Discussing
Hot
Latest

·
--
Bullish
🚀 $MARSCOIN Technical Setup | Recovery Attempt After Deep Correction
📊 Market Structure Summary
Weekly (1W) — Macro View
- Current Price: ~$0.05825
- Previous High: $0.26971 → strong correction phase
- Major Support Zone: $0.04888
- RSI(7): 15.55 (Extreme Oversold)
➡️ Selling pressure appears exhausted, but a full trend reversal still needs confirmation.
Daily (1D) — Trend Check
- Current trend remains bearish with price below key EMAs:
- EMA 9: $0.06122
- EMA 21: $0.07182
- EMA 50: $0.09327
- Bounce from $0.04888 support shows buyers defending the bottom.
- Daily confirmation requires reclaiming EMA 9 first.
1H — Short-Term Momentum
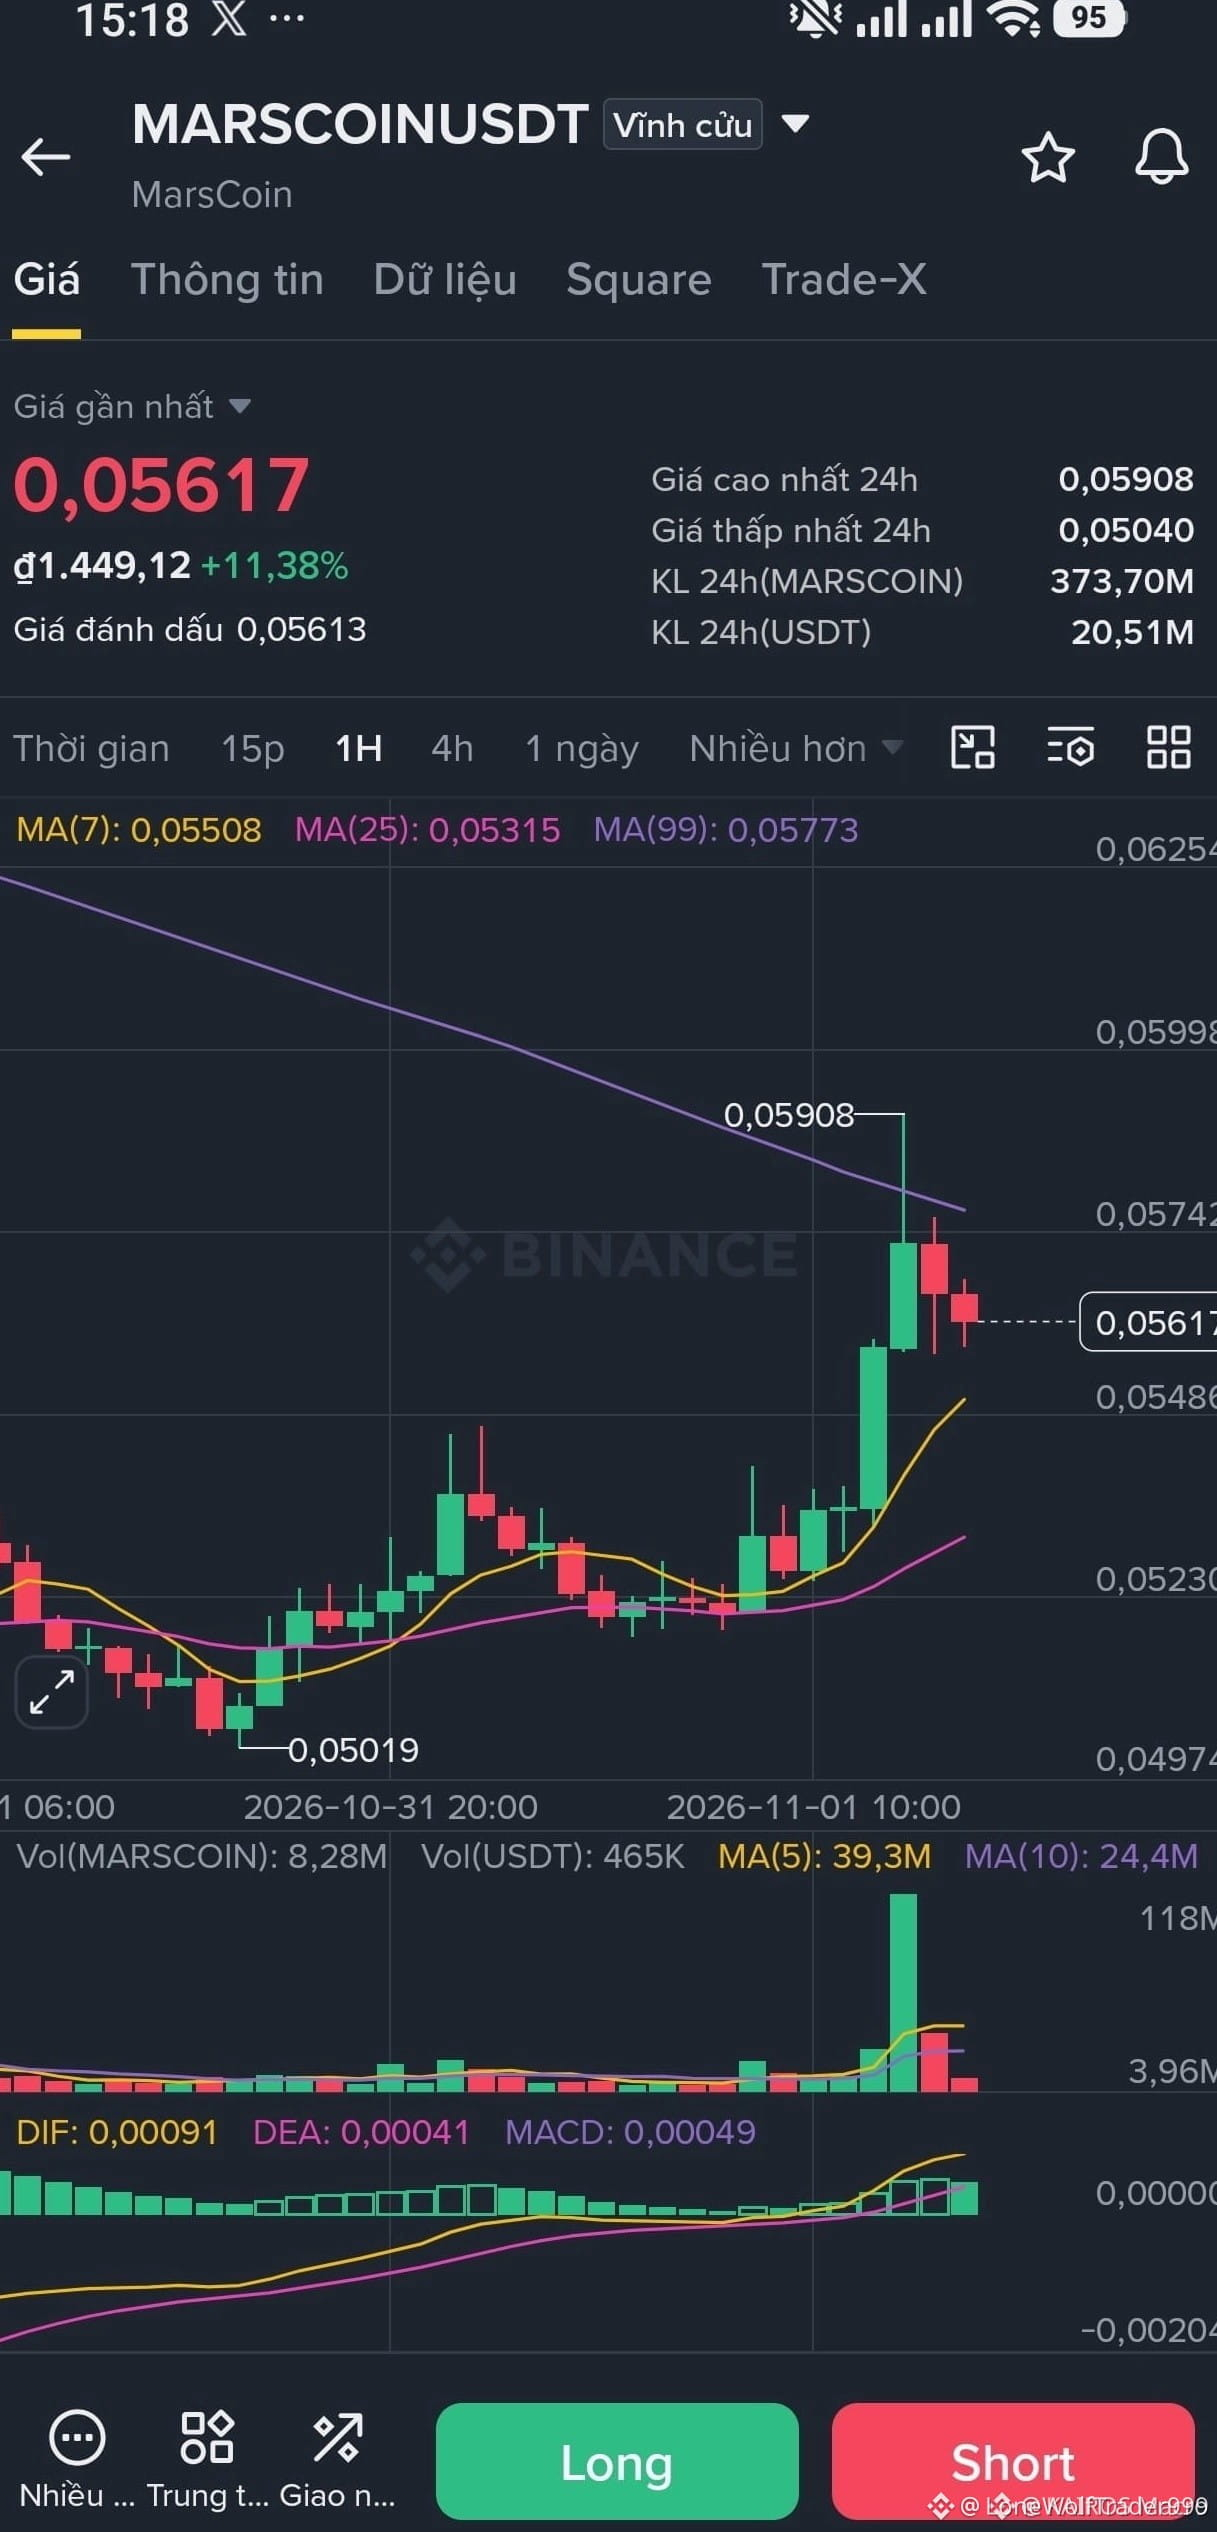
- Strong impulse move: $0.05019 → $0.05908
- Price consolidating near $0.0585
- EMA 9/21/50 flipped bullish on lower timeframe.
- RSI(7): 89.30 (Overbought)
➡️ Possible short-term pullback before another attempt higher.
📈 Trading Levels
🟢 Bullish Scenario
- Hold support: $0.0540–$0.0545
- Break resistance: $0.05908
- Next targets:
- TP1: $0.0612 (Daily EMA 9)
- TP2: $0.0718 (Daily EMA 21)
- TP3: $0.0930 (Major recovery zone)
🔴 Bearish Scenario
- Lose $0.0540 → momentum weakens
- Break below $0.04888 → bottom structure invalidated
🎯 Potential Long Setup (Risk Managed)
Entry Zone: $0.0540 – $0.0550
Stop Loss: Below $0.0488
Targets: $0.0612 → $0.0718 → $0.0930
⚠️ Risk Note: MARSCOIN is still in a larger downtrend. The current move looks like a relief rally unless price reclaims daily EMA zones.
🔥 Key Level to Watch:
$0.05908 breakout = bullish continuation signal
$0.04888 loss = new downside risk
{future}(ASTERUSDT)
{future}(GIGGLEUSDT)
#MARSCOIN #CryptoTrading #Altcoins #BinanceSquare #TechnicalAnalysis
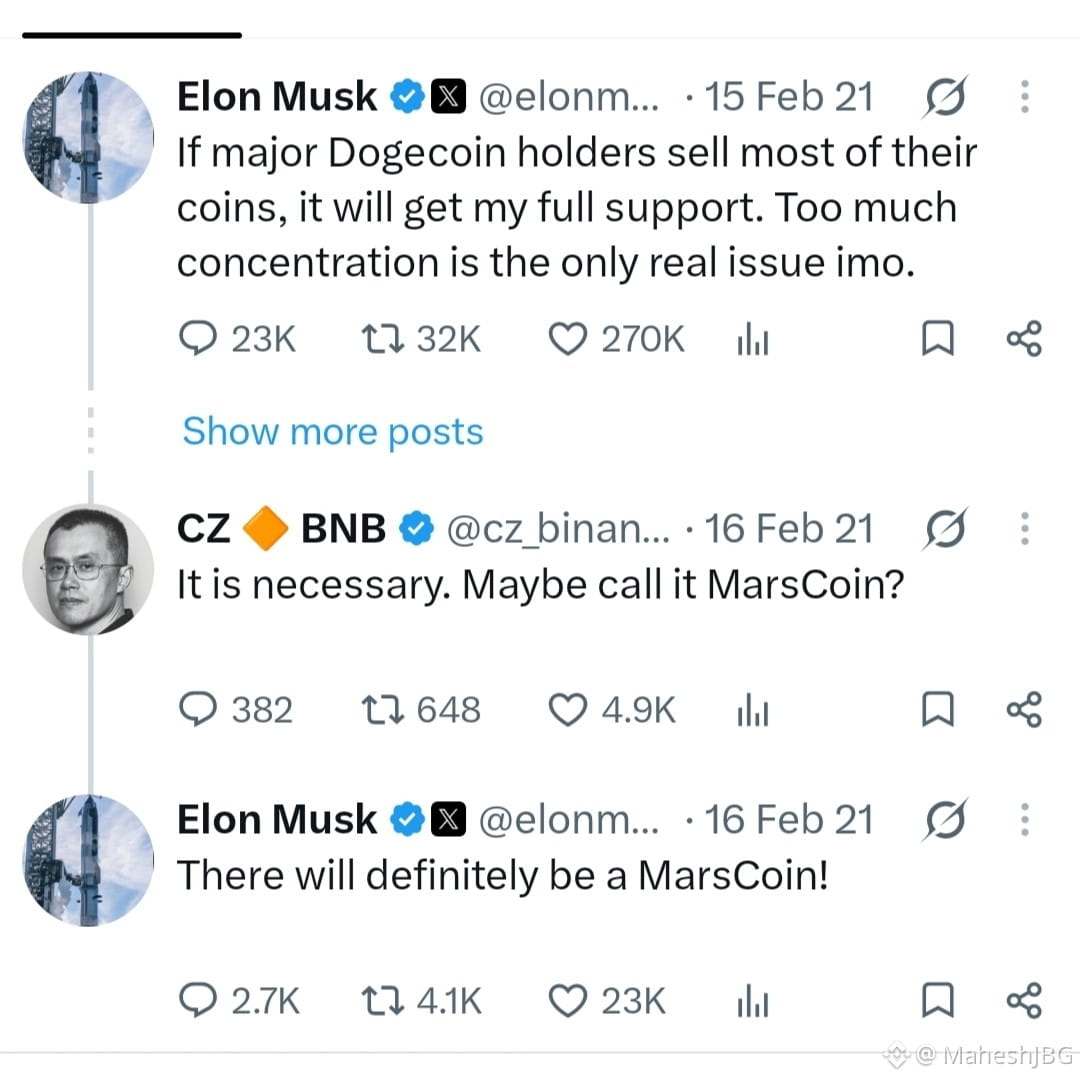
🚀 $MARSCOIN Technical Setup | Recovery Attempt After Deep Correction
📊 Market Structure Summary
Weekly (1W) — Macro View
- Current Price: ~$0.05825
- Previous High: $0.26971 → strong correction phase
- Major Support Zone: $0.04888
- RSI(7): 15.55 (Extreme Oversold)
➡️ Selling pressure appears exhausted, but a full trend reversal still needs confirmation.
Daily (1D) — Trend Check
- Current trend remains bearish with price below key EMAs:
- EMA 9: $0.06122
- EMA 21: $0.07182
- EMA 50: $0.09327
- Bounce from $0.04888 support shows buyers defending the bottom.
- Daily confirmation requires reclaiming EMA 9 first.
1H — Short-Term Momentum
- Strong impulse move: $0.05019 → $0.05908
- Price consolidating near $0.0585
- EMA 9/21/50 flipped bullish on lower timeframe.
- RSI(7): 89.30 (Overbought)
➡️ Possible short-term pullback before another attempt higher.
📈 Trading Levels
🟢 Bullish Scenario
- Hold support: $0.0540–$0.0545
- Break resistance: $0.05908
- Next targets:
- TP1: $0.0612 (Daily EMA 9)
- TP2: $0.0718 (Daily EMA 21)
- TP3: $0.0930 (Major recovery zone)
🔴 Bearish Scenario
- Lose $0.0540 → momentum weakens
- Break below $0.04888 → bottom structure invalidated
🎯 Potential Long Setup (Risk Managed)
Entry Zone: $0.0540 – $0.0550
Stop Loss: Below $0.0488
Targets: $0.0612 → $0.0718 → $0.0930
⚠️ Risk Note: MARSCOIN is still in a larger downtrend. The current move looks like a relief rally unless price reclaims daily EMA zones.
🔥 Key Level to Watch:
$0.05908 breakout = bullish continuation signal
$0.04888 loss = new downside risk
#MARSCOIN #CryptoTrading #Altcoins #BinanceSquare #TechnicalAnalysis

MaheshJBG
·
--
BullishTHIS IS THE NEXT 1000x coin
THIS WILL HIT MILLIONS $TSLA
DO NOT FADE ME $DOGE
ALL YOU HAVE TO DO RN IS TO BUY AND HOLD $MARSCOIN
THIS WILL HIT MILLIONS $TSLA
DO NOT FADE ME $DOGE
ALL YOU HAVE TO DO RN IS TO BUY AND HOLD $MARSCOIN
889

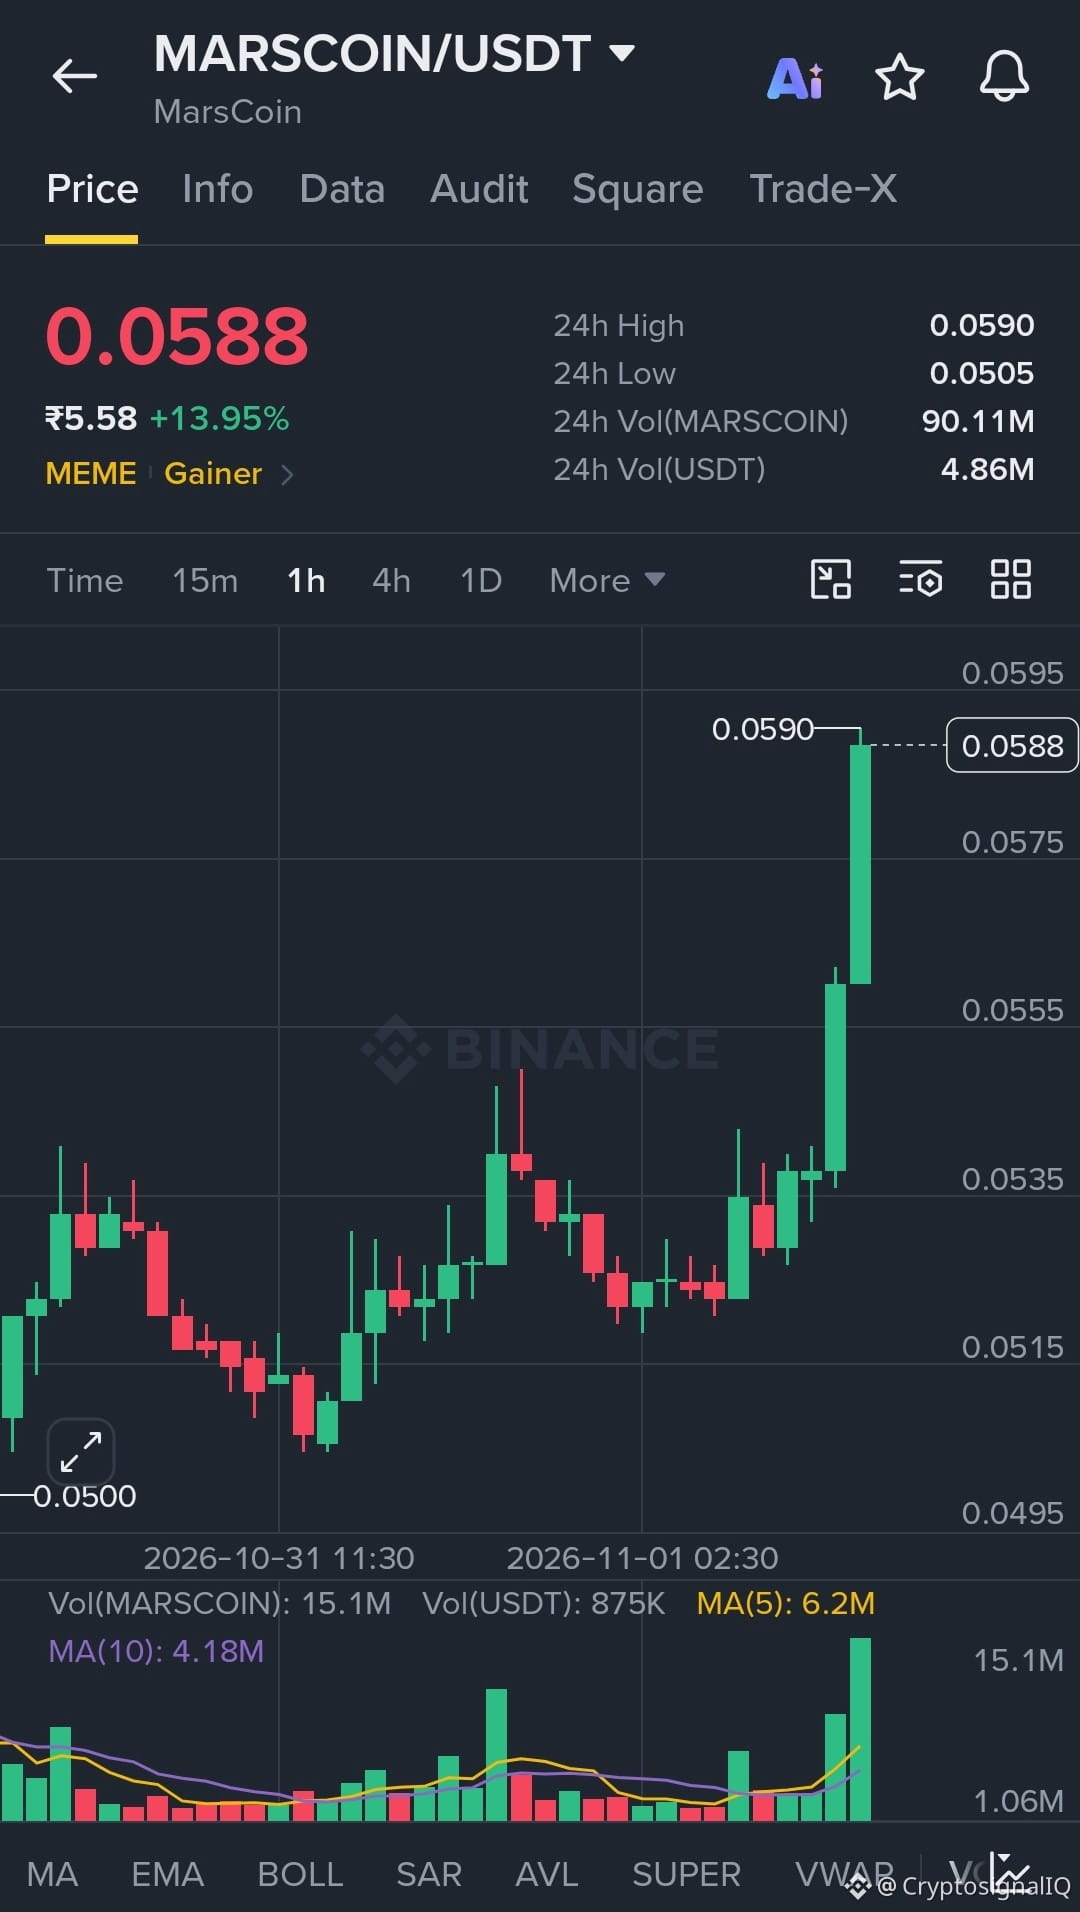
$MARSCOIN — Price has broken above the $0.0535 range with a massive volume spike and is now testing $0.0590 resistance.
Entry: $0.0560–$0.0570
🎯 TP1: $0.0605
🎯 TP2: $0.0620
🎯 TP3: $0.0640
🛑 SL: $0.0545
The 1H chart shows a strong range breakout, backed by expanding volume. A sustained move above $0.0590 could trigger another upside leg, while rejection may bring a retest of the breakout zone. Wait for confirmation instead of chasing the pump.
Trade #marscoin here
{future}(MARSCOINUSDT)
$ESPORTS
{alpha}(560xf39e4b21c84e737df08e2c3b32541d856f508e48)
$LSK
{future}(LSKUSDT)
$MARSCOIN — Price has broken above the $0.0535 range with a massive volume spike and is now testing $0.0590 resistance.
Entry: $0.0560–$0.0570
🎯 TP1: $0.0605
🎯 TP2: $0.0620
🎯 TP3: $0.0640
🛑 SL: $0.0545
The 1H chart shows a strong range breakout, backed by expanding volume. A sustained move above $0.0590 could trigger another upside leg, while rejection may bring a retest of the breakout zone. Wait for confirmation instead of chasing the pump.
Trade #marscoin here
$ESPORTS
$LSK
1
794

·
--
Bullish
🚀 MARSCOIN: Is This the Beginning of a Comeback?
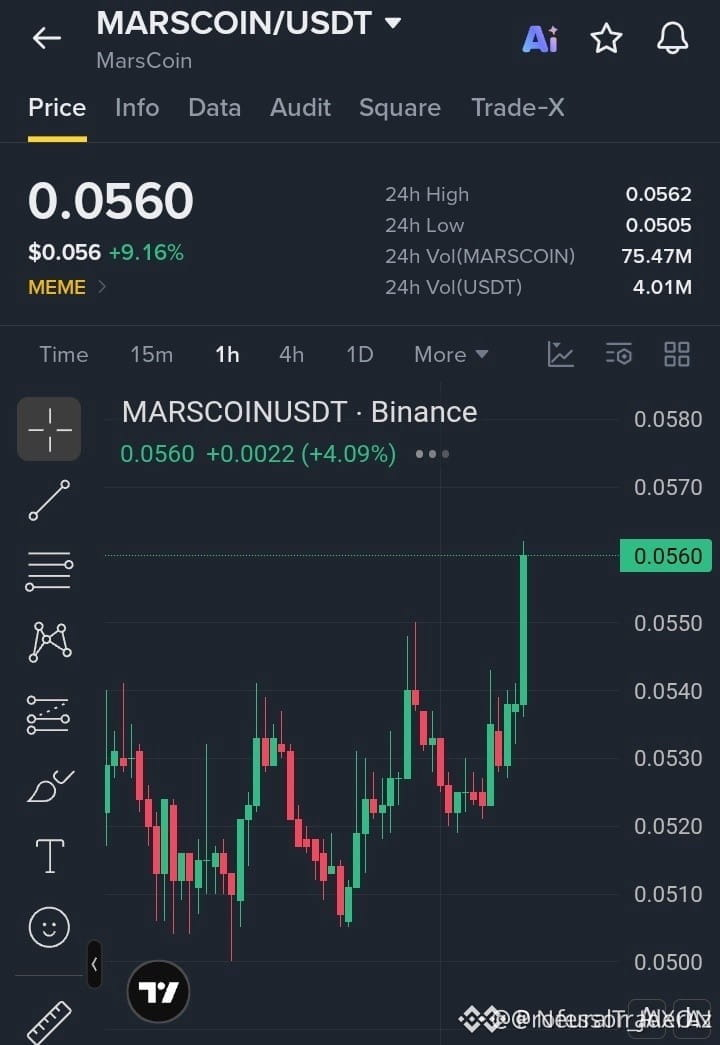
$MARSCOIN is showing signs of renewed market activity, with a 13.40% daily gain and trading volume reaching 4.77M USDT.
After a significant correction, the price is approaching an important resistance zone. The recent momentum is worth watching closely.
🔥 What makes it interesting?
Strong daily price movement.
Increased trading activity.
Potential recovery opportunity if bullish momentum continues.
Key resistance to watch around $0.0590.
$MARSCOIN could attract more attention if buyers maintain momentum.
I'm keeping this coin on my watchlist. Smart traders watch the levels.
Is a bigger recovery ahead? What do you think? 👀
#MARSCOIN #Crypto #BinanceSquare #Altcoins #CryptoTrading
{spot}(MARSCOINUSDT)
🚀 MARSCOIN: Is This the Beginning of a Comeback?
$MARSCOIN is showing signs of renewed market activity, with a 13.40% daily gain and trading volume reaching 4.77M USDT.
After a significant correction, the price is approaching an important resistance zone. The recent momentum is worth watching closely.
🔥 What makes it interesting?
Strong daily price movement.
Increased trading activity.
Potential recovery opportunity if bullish momentum continues.
Key resistance to watch around $0.0590.
$MARSCOIN could attract more attention if buyers maintain momentum.
I'm keeping this coin on my watchlist. Smart traders watch the levels.
Is a bigger recovery ahead? What do you think? 👀
#MARSCOIN #Crypto #BinanceSquare #Altcoins #CryptoTrading
357

🚨 $MARSCOIN BREAKS STRUCTURAL RESISTANCE WITH MASSIVE MOMENTUM EXPANSION TOWARD HIGHER LIQUIDITY 📈
Entry: 0.0550 - 0.0560 ⚡
Target: 0.0570 - 0.0590 🎯
Stop Loss: 0.0538 ⚠️
$MARSCOIN has executed a decisive market structure break above the key 0.0540 resistance zone, flipping prior overhead supply into fresh structural demand. 🌊 Institutional order flow shows clear volume expansion as buyers absorb liquidity with authority.
A controlled retest into the 0.0550 to 0.0560 demand block offers an asymmetric risk-to-reward entry before expanding toward the next overhead targets at 0.0570 through 0.0590. 📌 Holding firmly above the 0.0538 invalidation level keeps the bullish expansion thesis fully intact.
💬 Are you bidding the retest at 0.0550 or waiting for further structural confirmation?
⚠️ Not financial advice. Always manage your risk. 🛡️
🏷️ #MARSCOIN #PriceAction #Breakout #CryptoTrading #MarketStructure
🎯 🦈
9

·
--
$MARSCOIN looks ready to go higher right now
Volume is 1.6x normal so big buyers are active
Buying $MARSCOIN between 0.05617 and 0.05746
Invalid below 0.05274
Taking profit at 0.06389 0.06834 0.07503
RSI is 59 so it has room to run
Up 9.4% today and holding strong 🚀
Tap $MARSCOIN to buy it here
Last 7 days of my calls, 43 hit target and 73 hit stop
Who else is in
#MARSCOIN #TradingSignals

·
--
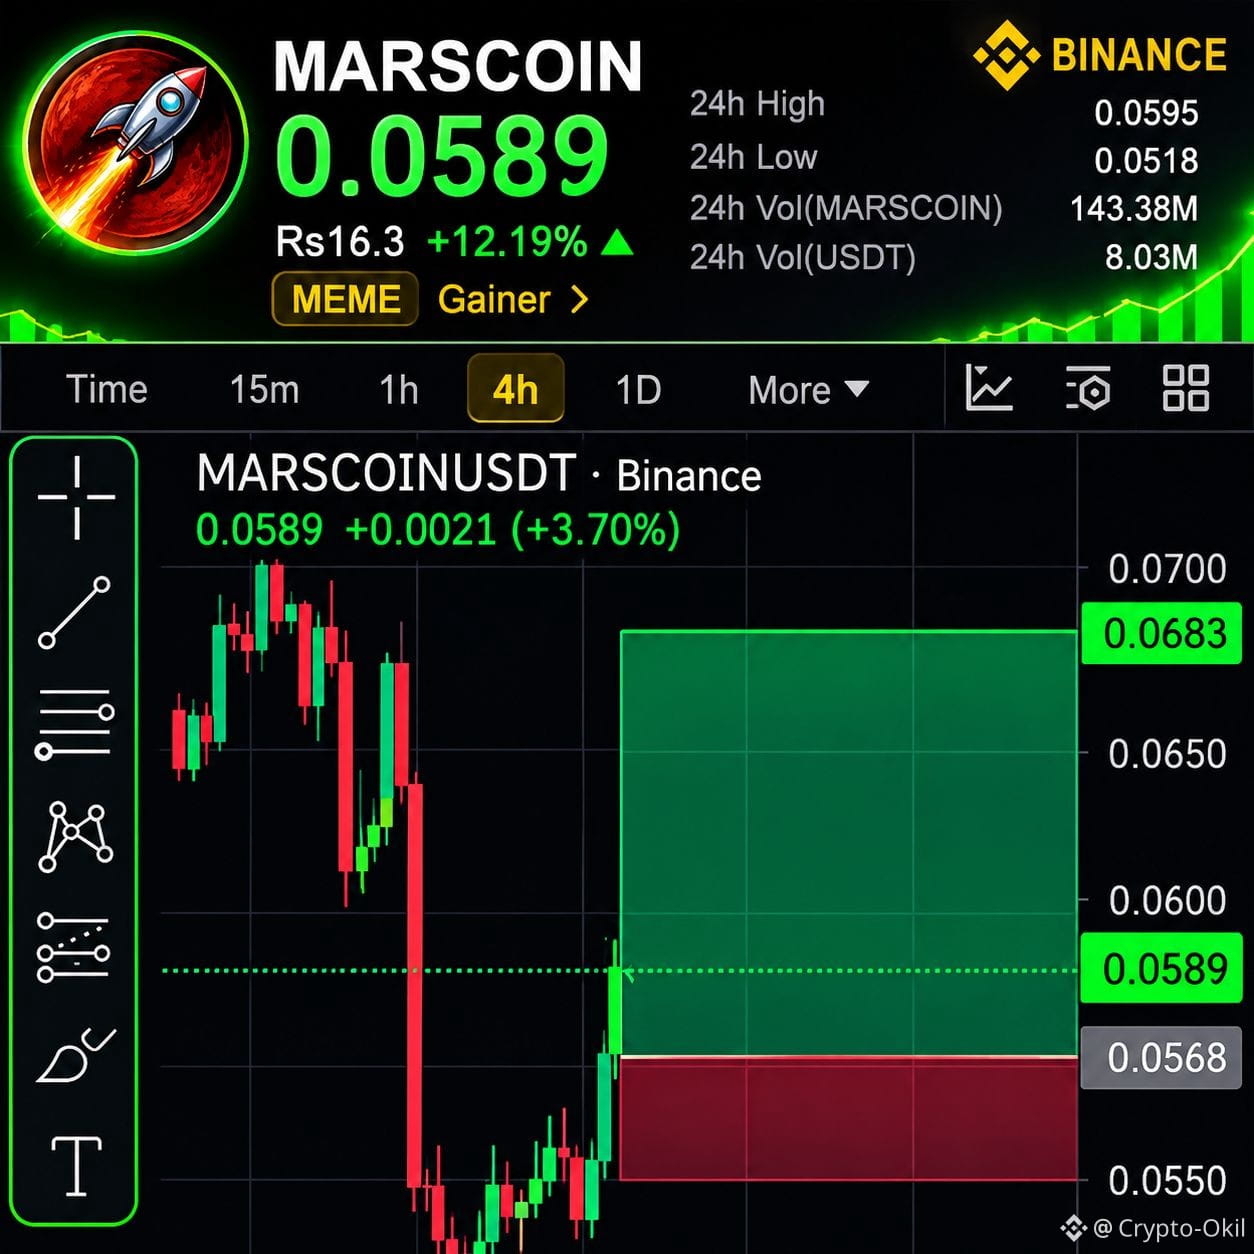
🚀 $MARSCOIN LONG SETUP – Bulls Are Regaining Control! 🔥
Buyers are stepping back in, and bullish momentum is starting to build. A strong move toward higher resistance levels could be next!
🟢 Entry Zone: $0.0570 – $0.0590
🎯 TP1: $0.0615
🎯 TP2: $0.0650
🚀 Final Target: $0.0683
🛑 Stop Loss: $0.0524
⚠️ If $MARSCOIN falls below $0.0568, the bullish structure could weaken.
Keep an eye on the momentum and manage your risk wisely!
#MARSCOIN #LONG #CryptoTrading #BinanceSquare
4

·
--
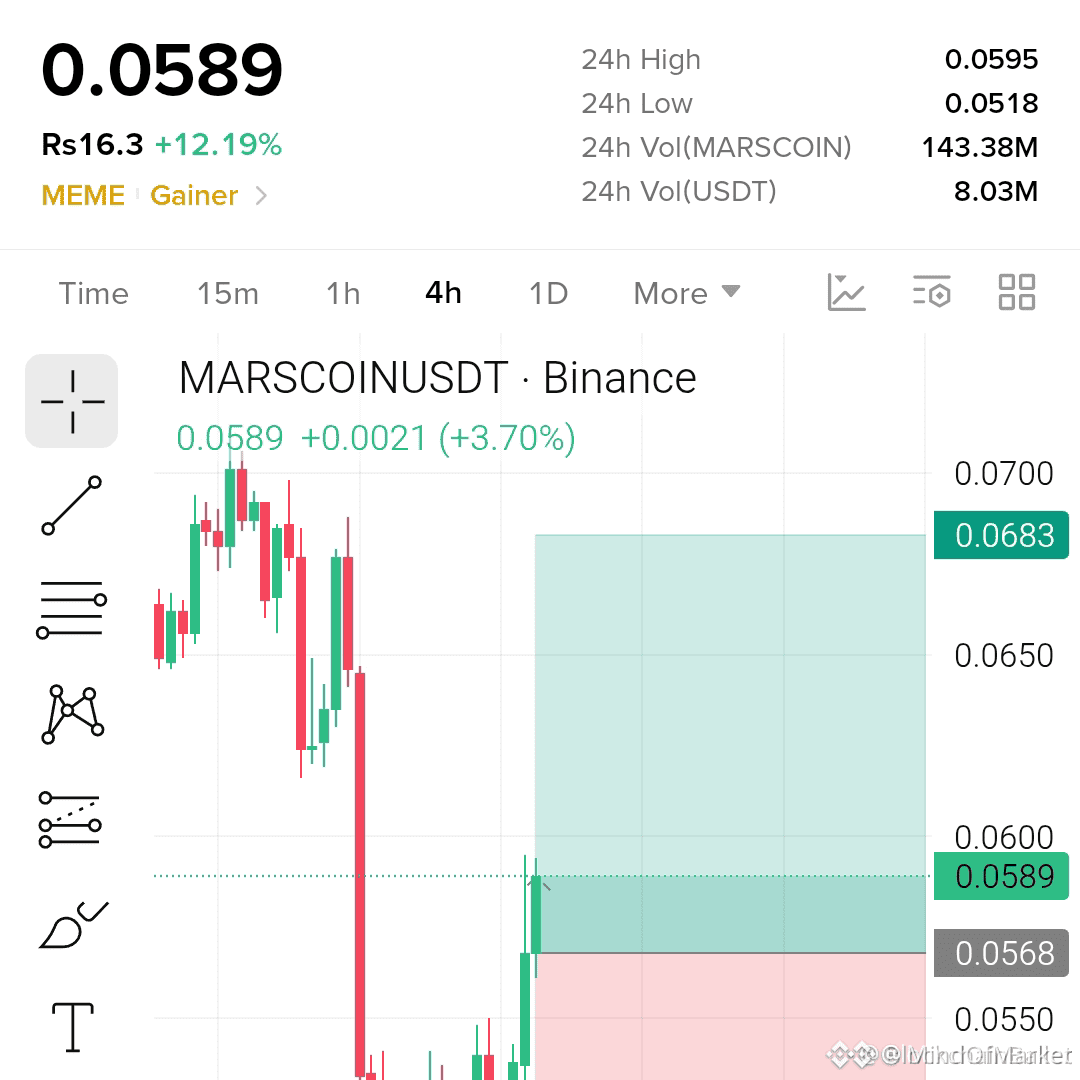
⚡ $MARSCOIN DEMAND RECLAIM SIGNALS AGGRESSIVE EXPANSION TOWARD HIGHER LIQUIDITY TARGETS 🎯
Entry: $0.0570 - $0.0590 ⚡
Target: $0.0615 - $0.0683 🎯
Stop Loss: $0.0524 🛑
📌 Price action is establishing an accumulation base within the $0.0570 - $0.0590 zone as institutional absorption takes control of local structure. Maintaining acceptance above the $0.0568 pivot is critical, as a loss of this level directly signals structural weakening.
🌊 If buyers defend this inefficiency fill, the pathway opens cleanly for an expansion toward untapped liquidity pools sitting at $0.0615 and the final target of $0.0683. 💬 Are you securing entry within this order block or waiting for structural confirmation? 👇
⚠️ Not financial advice. Always manage your risk. 🛡️
🏷️ #MARSCOIN #PriceAction #MarketStructure #Crypto
🎯 🦈
1

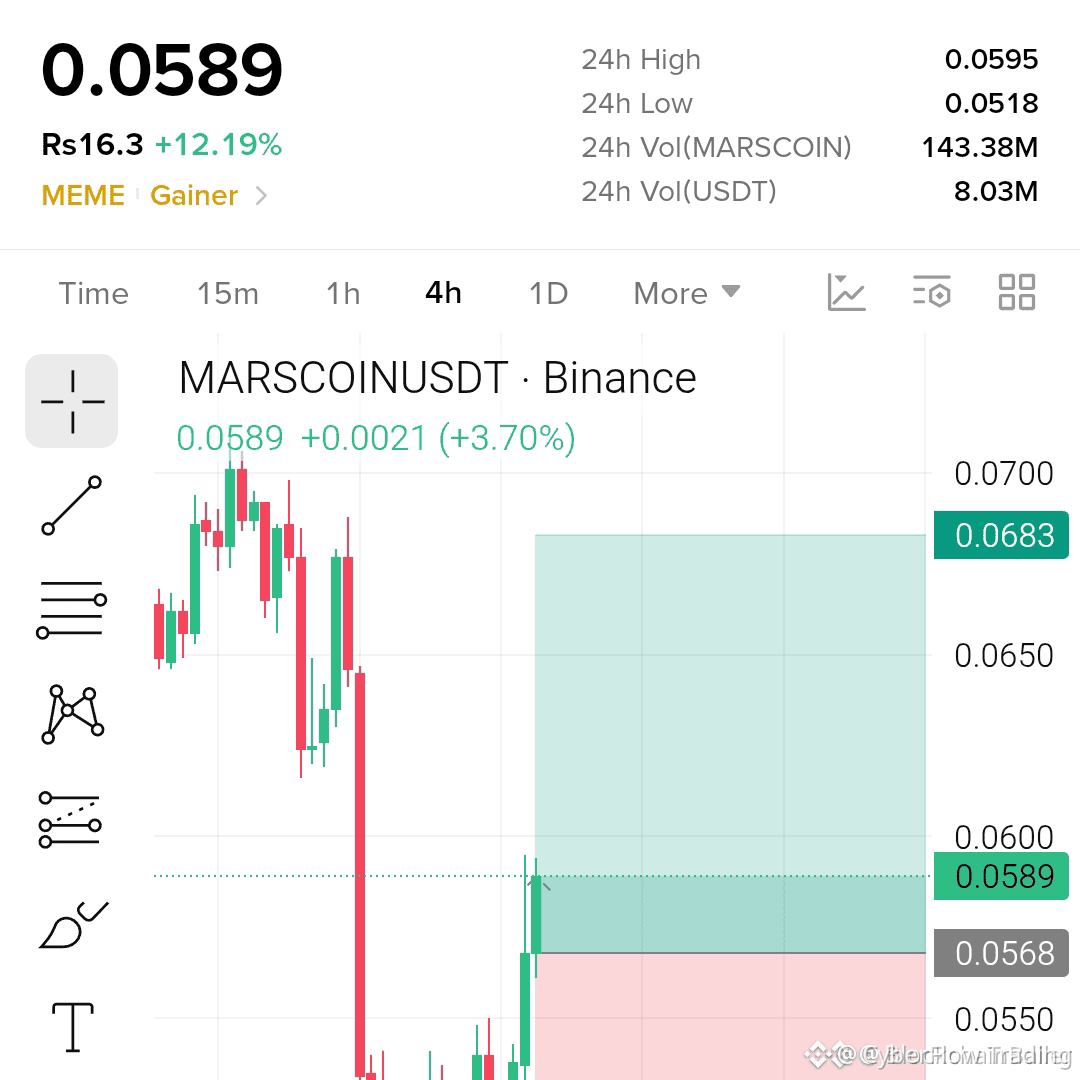
💥 $MARSCOIN RECLAIMS MOMENTUM AS BULLS STEP IN TO DEFEND THE ACCUMULATION ZONE! ⚡
Entry: $0.0570 – $0.0590 ⚡
Target: $0.0615, $0.0650, $0.0683 🚀
Stop Loss: $0.0524 ⚠️
📌 Buyers are stepping up with clear aggressive intent across the order books, establishing a firm bid right inside the $0.0570 pocket. The tape shows sellers getting absorbed quickly, setting up an explosive continuation if this shelf holds.
💡 As long as the market structure stays anchored above $0.0568, the path of least resistance tilts straight into overhead liquidity. 💬 Are you securing bids in this pocket or waiting for the clean breakout above the range highs? 👇
⚠️ Not financial advice. Always manage your risk. 🛡️
🏷️ #MARSCOIN #LongSetup #Breakout #CryptoTrading
🎯 ⚡
9

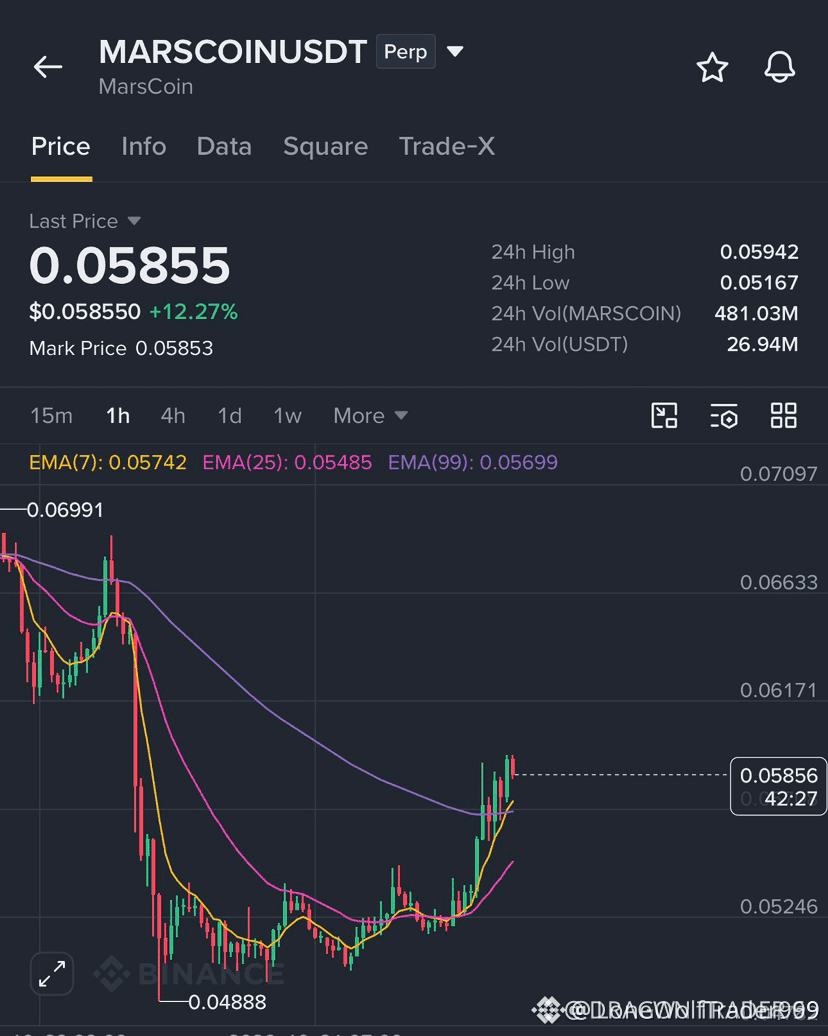
💥 $MARSCOIN RECLAIMS MOMENTUM AS BULLS ABSORB THE DIP FOR A MASSIVE EXTENSION ⚡
Entry: 0.05850 - 0.05900 ⚡
Target: 0.06810 🎯
Stop Loss: 0.05200 🛑
📌 Buyers defended the 0.04888 structural floor with fierce intent, aggressively absorbing sell-side inventory before stepping up to flip short-term momentum. ⚡ Order flow is tightening right into the 0.060 pivot, where a decisive push clears the path toward overhead targets.
💡 Rather than chasing green candles mid-flight, letting the market come to the 0.05850 bid pocket keeps the risk profile clean while 0.05200 invalidates the setup. 💬 Are you front-running this breakout flip or waiting for 0.060 to clear first? 👇
⚠️ Not financial advice. Always manage your risk. 🛡️
🏷️ #MARSCOIN #Altcoins #Breakout #CryptoTrading
🔥 💎

·
--
$MARSCOIN
{future}(MARSCOINUSDT)
CAN THIS GREEN MOVE OPEN THE DOOR TO MORE GAINS?
MarsCoin has entered the spotlight with an 11.09% daily increase.
The next few price movements will be important. If buyers continue to defend the current area, another upward attempt could become possible. However, profit-taking remains a risk after a fast move.
THE NUMBERS
Price: $0.0581
24H Gain: +11.09%
LEVELS TO WATCH
• First Entry: $0.0575–$0.0582
• Better Buy Area: $0.0550–$0.0565
• First Resistance Target: $0.0605
• Second Target: $0.0630
• Final Target: $0.0660
• Stop Loss: $0.0528
My view: Let the price show its strength first. A successful support retest would make the setup more attractive.
#MARSCOIN #CryptoMarket #TradingSignals #Altcoin
$MARSCOIN
CAN THIS GREEN MOVE OPEN THE DOOR TO MORE GAINS?
MarsCoin has entered the spotlight with an 11.09% daily increase.
The next few price movements will be important. If buyers continue to defend the current area, another upward attempt could become possible. However, profit-taking remains a risk after a fast move.
THE NUMBERS
Price: $0.0581
24H Gain: +11.09%
LEVELS TO WATCH
• First Entry: $0.0575–$0.0582
• Better Buy Area: $0.0550–$0.0565
• First Resistance Target: $0.0605
• Second Target: $0.0630
• Final Target: $0.0660
• Stop Loss: $0.0528
My view: Let the price show its strength first. A successful support retest would make the setup more attractive.
#MARSCOIN #CryptoMarket #TradingSignals #Altcoin
64

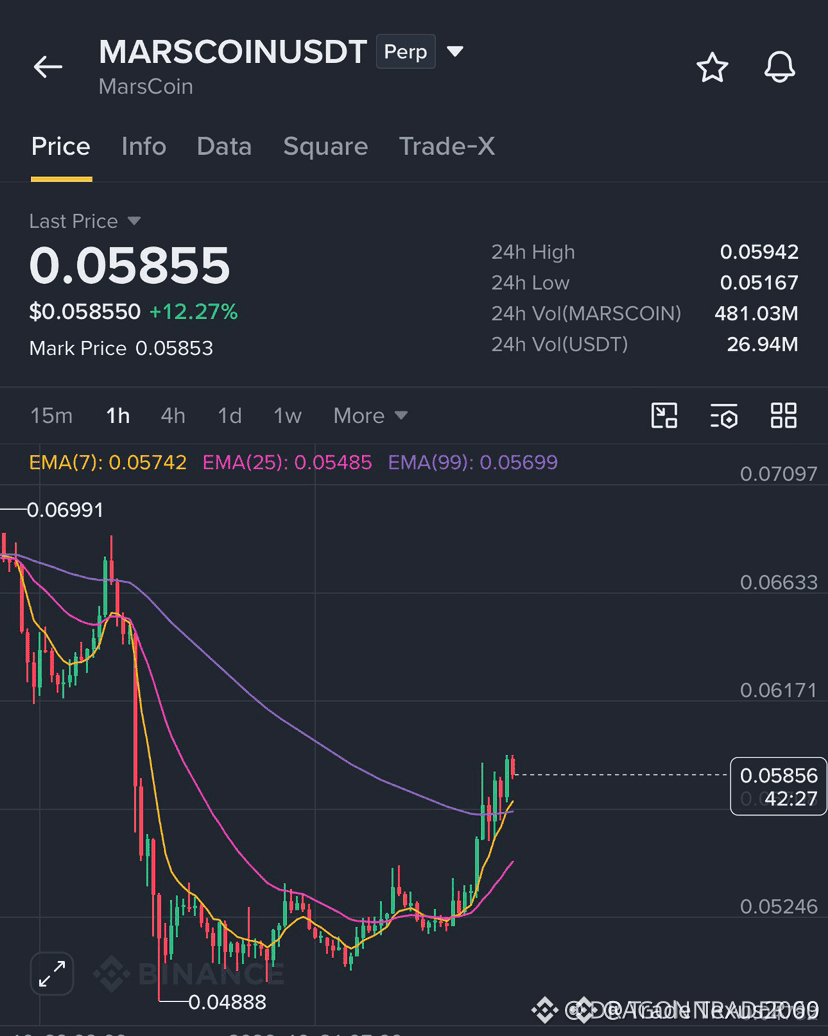
⚡ $MARSCOIN RECLAIMS BASE SUPPORT AS ACCUMULATION TARGETS LIQUIDITY EXPANSION! 🎯
Entry: 0.05850 - 0.05900 ⚡
Target: 0.06250 - 0.06810 🎯
Stop Loss: 0.05200 ⚠️
📌 Following a decisive liquidity sweep off the 0.04888 structural base, buyers are actively defending higher lows as volume begins to rotate back into the order book.
🌊 A clean structural reclaim above the 0.060 level signals continuation toward the overhead liquidity pool at 0.06810, while 0.05200 anchors the structural invalidation.
💬 Are you positioning on this range reclaim, or waiting for a confirmed closure above 0.060? 👇
⚠️ Not financial advice. Always manage your risk. 🛡️
🏷️ #MARSCOIN #Altcoins #MarketStructure #Breakout #Crypto
🎯 🦈
5
·
--
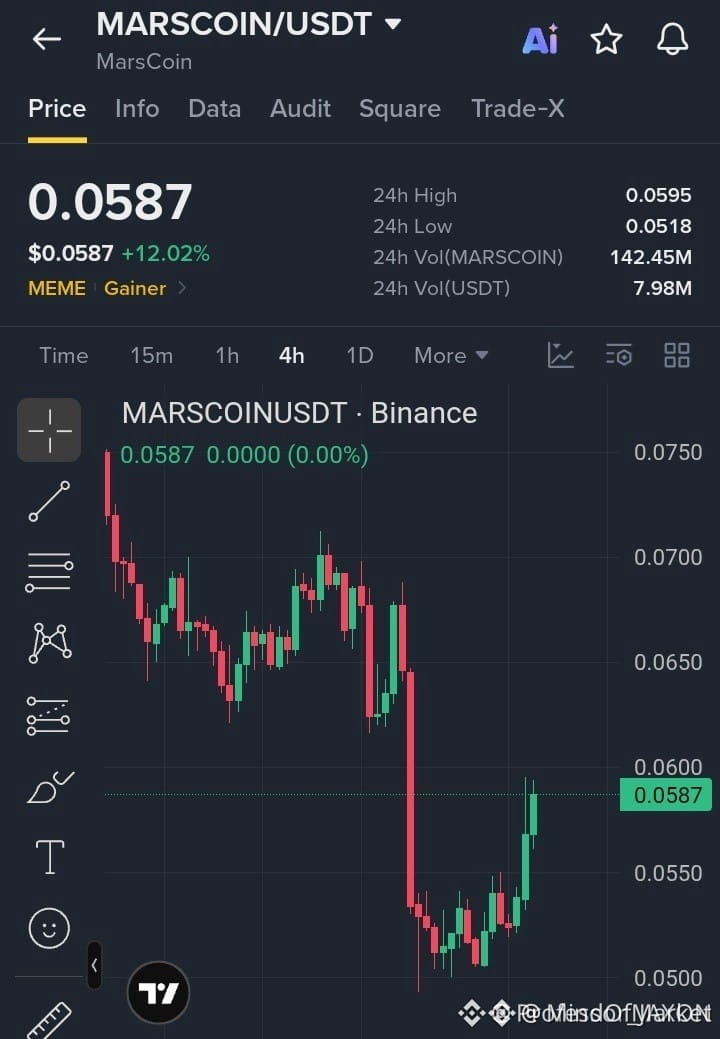
⚡ $MARSCOIN ABSORBS RECOVERY LIQUIDITY WITH ACCUMULATION EXPANDING TOWARD RANGE HIGHS 📈
Entry: 0.0575–0.0587 ⚡
Target: 0.0605 / 0.0625 / 0.0645 🎯
Stop Loss: 0.0550 ⚠️
📌 Following an aggressive corrective phase, institutional bids built a solid accumulation floor between 0.0510 and 0.0530, systematically absorbing floating supply. The structural shift is now funneling active order flow straight into the 0.0575–0.0587 retest zone.
📊 Clean acceptance above the 0.0600 pivot clears overhead resistance and exposes resting liquidity pools up toward 0.0645. 💬 Do you expect bulls to defend this demand block, or will we see one more sweep into the lower range?
⚠️ Not financial advice. Always manage your risk. 🛡️
🏷️ #MARSCOIN #PriceAction #Breakout #CryptoTrading
🎯 🦈
2
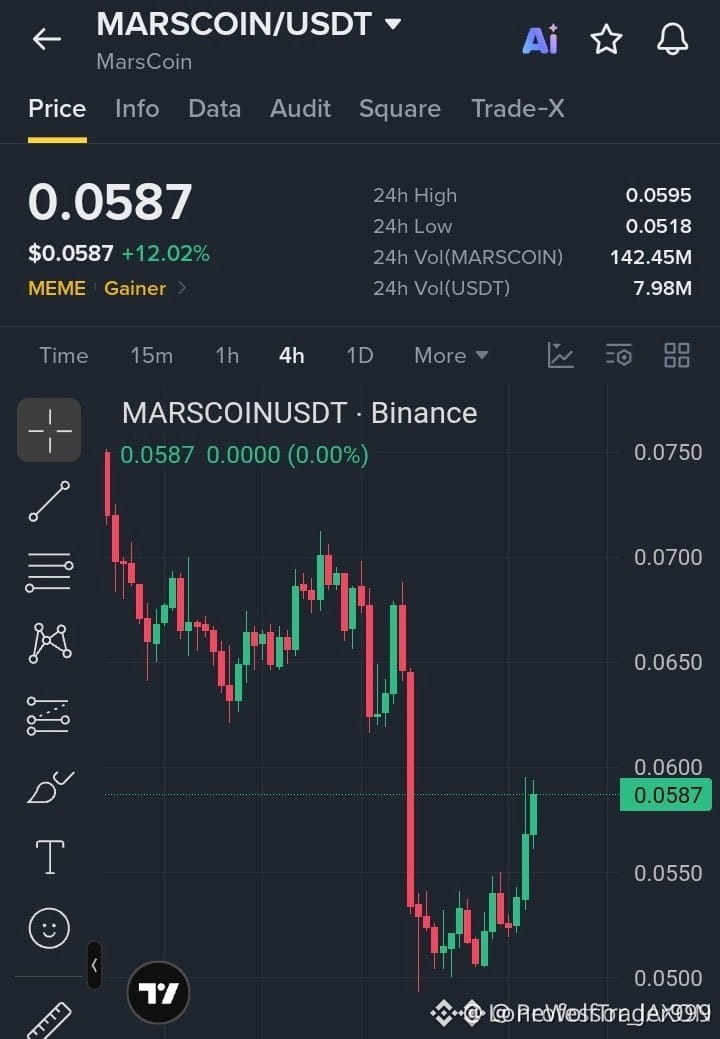
⚡ $MARSCOIN CARVES OUT CLEAN RECOVERY BASE WITH AGGRESSIVE BID MOMENTUM RETURNING! 💥
Entry: 0.0575 - 0.0587 ⚡
Target: 0.0605, 0.0625, 0.0645 🚀
Stop Loss: 0.0550 🛑
📌 Sellers completely exhausted their drive after pushing into the 0.0510–0.0530 demand pocket, where buyers absorbed the flush and built a rock-solid structural floor. 📊 We are now seeing energetic bid depth step in to reclaim upward momentum toward the pivotal 0.0600 inflection level.
⚡ A decisive expansion through local resistance clears the runway straight into our upper expansion targets. 💬 Are you loading bids inside this accumulation range or waiting for the 0.0600 breakout confirmation? 👇
⚠️ Not financial advice. Always manage your risk. 🛡️
🏷️ #MARSCOIN #LongSetup #Breakout #Altcoins #Crypto
🐂 ⚡
9

·
--
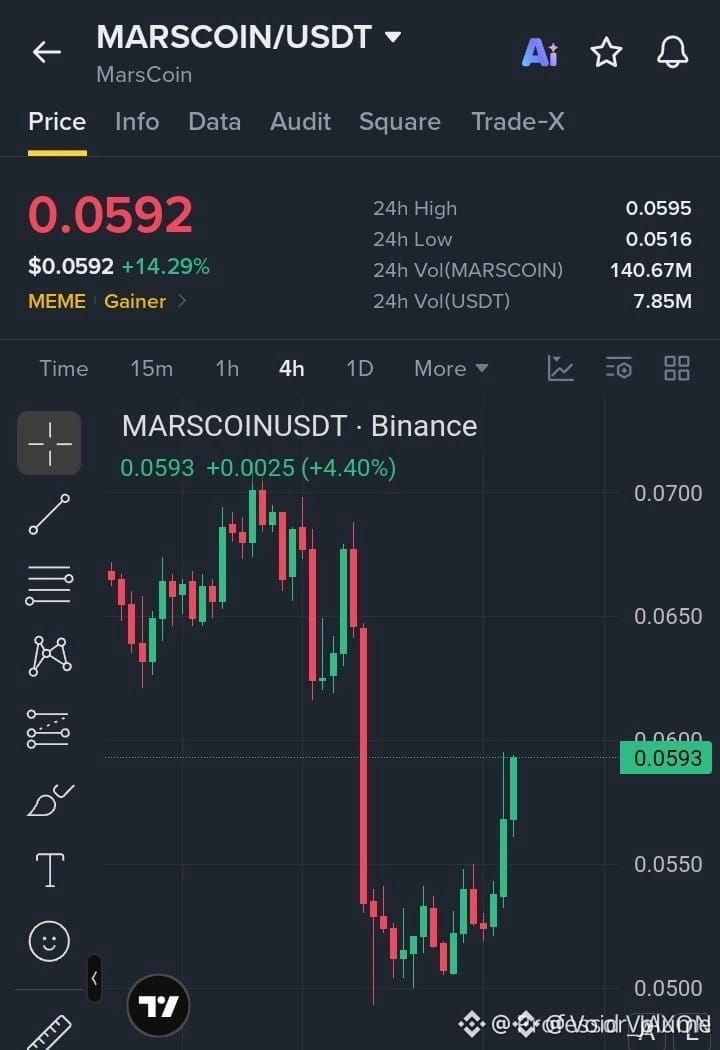
⚡ $MARSCOIN ABSORBS SELLER SUPPLY WITH ORDER FLOW POSITIONED FOR A 0.0600 BREAKOUT! 📈
Entry: 0.0570 - 0.0590 ⚡
Target: 0.0620 - 0.0670 🎯
Stop Loss: 0.0545 ⚠️
📌 The aggressive liquidity absorption off the 0.0500 structural floor confirmed strong bid presence, establishing a decisive shift in short-term market structure. Price is now coiling tightly within the 0.0570–0.0590 accumulation band as overhead supply gets absorbed.
📊 Clearing the key 0.0600 liquidity pivot opens a direct path toward the upper imbalance zones at 0.0645 and 0.0670. Patience remains critical here; letting the reclaim confirm avoids front-running liquidity traps before directional expansion takes over.
💬 Are you bidding this accumulation retest, or waiting for structural acceptance above 0.0600? 👇
⚠️ Not financial advice. Always manage your risk. 🛡️
🏷️ #MARSCOIN #Breakout #MarketStructure #CryptoTrading
🎯 🦈
4

·
--
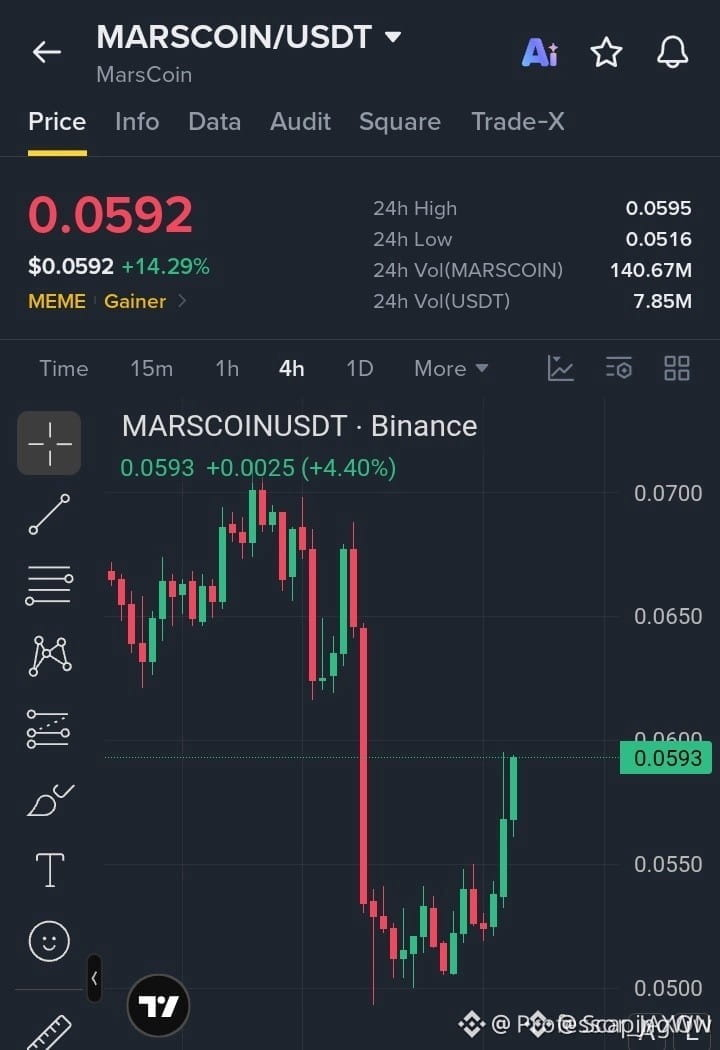
💥 $MARSCOIN RECLAIMS MOMENTUM AS BUYERS EYE A DECISIVE BREAKOUT OVER RESISTANCE! ⚡
Entry: 0.0570 - 0.0590 ⚡
Target: 0.0620, 0.0645, 0.0670 🚀
Stop Loss: 0.0545 ⚠️
Buyers fiercely defended the 0.0500 floor, absorbing sell-side pressure and flipping short-term market structure back into bullish territory. 📊 The tape is coiling tight right beneath the 0.0600 ceiling as bid depth builds up quietly.
Smart execution here means letting order flow confirm rather than blindly chasing green candles. 💡 If momentum holds above our entry zone, the path toward overhead targets clears up fast. 💬 Are you front-running this push or waiting for a confirmed reclaim above 0.0600? 👇
⚠️ Not financial advice. Always manage your risk. 🛡️
🏷️ #MARSCOIN #Altcoins #CryptoTrading #Breakout
⚡ 🎯
3
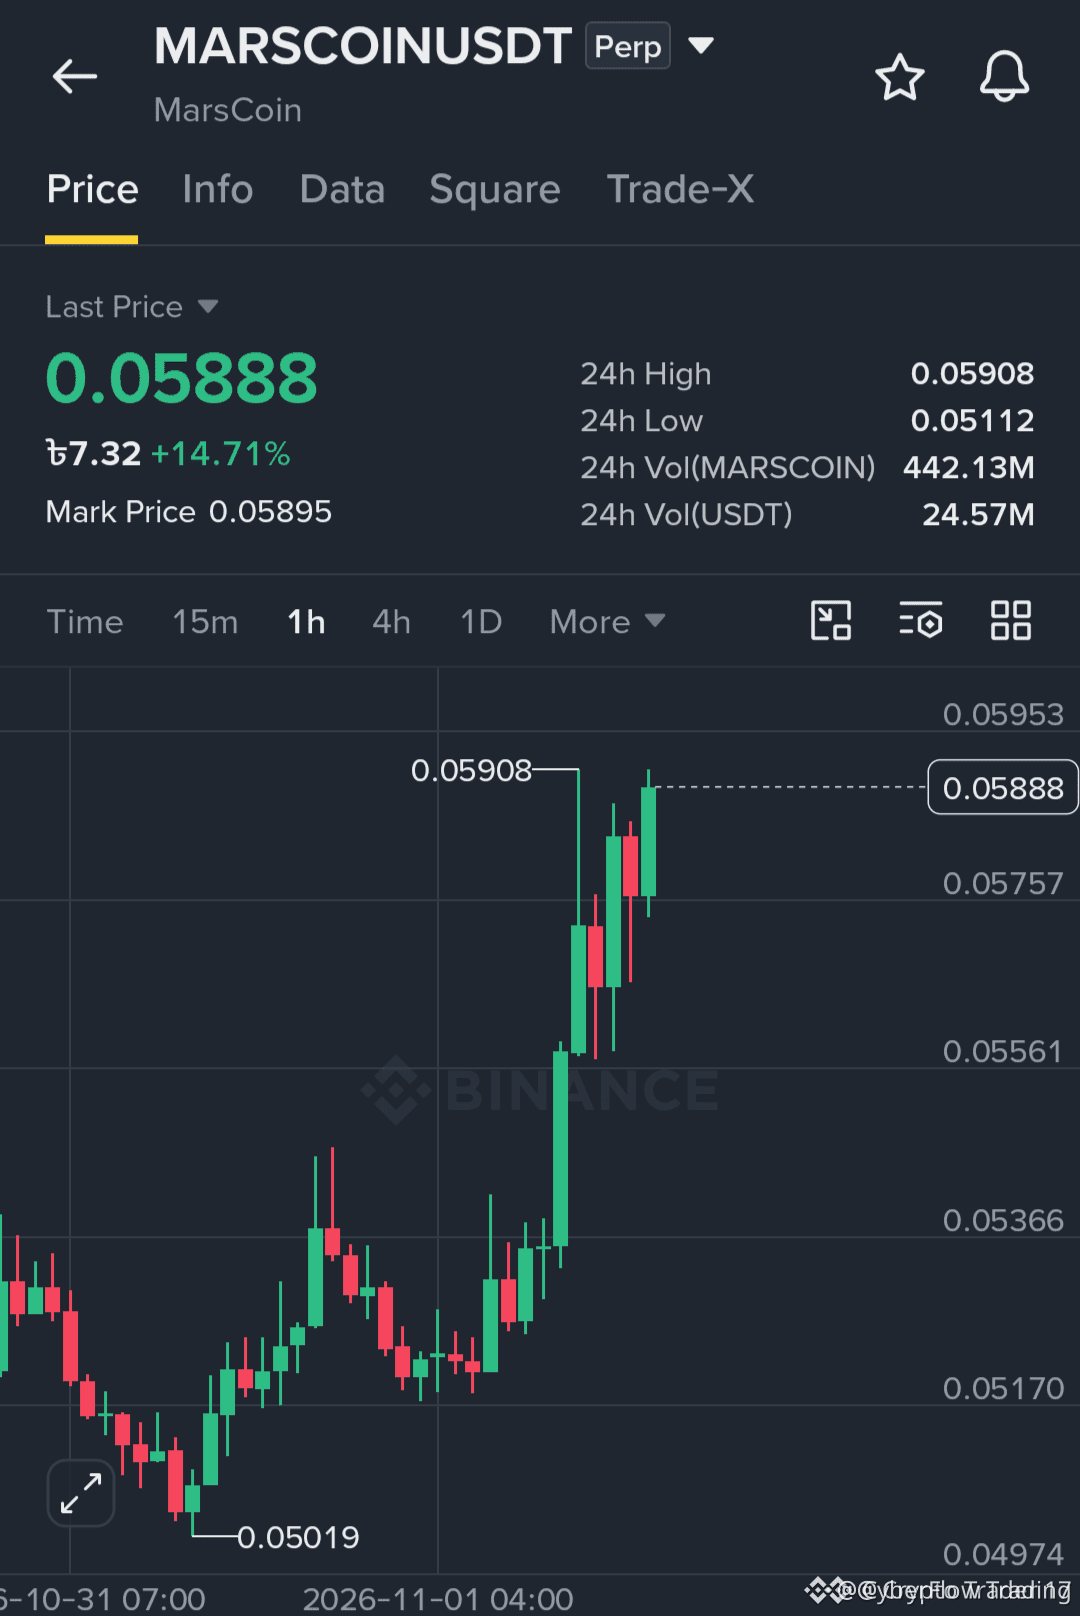
💥 $MARSCOIN UNLOCKING EXPLOSIVE MOMENTUM RIGHT ON SCHEDULE AS PREDICTED! 🚀
The order flow on $MARSCOIN is unfolding with textbook precision, validating our early read as spot bids absorb overhead supply effortlessly. ⚡ Aggressive buyers are dictating the pace across the board.
When price action mirrors the script so cleanly, it signals smart positioning taking over while sympathetic volume begins stirring in $BULLA and $BIRB . 📊 The tape shows zero hesitation from market participants defending this expansion.
💡 💬 Are you already riding this momentum or waiting for a brief retest before stepping in? 👇
⚠️ Not financial advice. Always manage your risk. 🛡️
🏷️ #MARSCOIN #BULLA #BIRB #CryptoMomentum #Breakout
🔥 💎
6
·
--
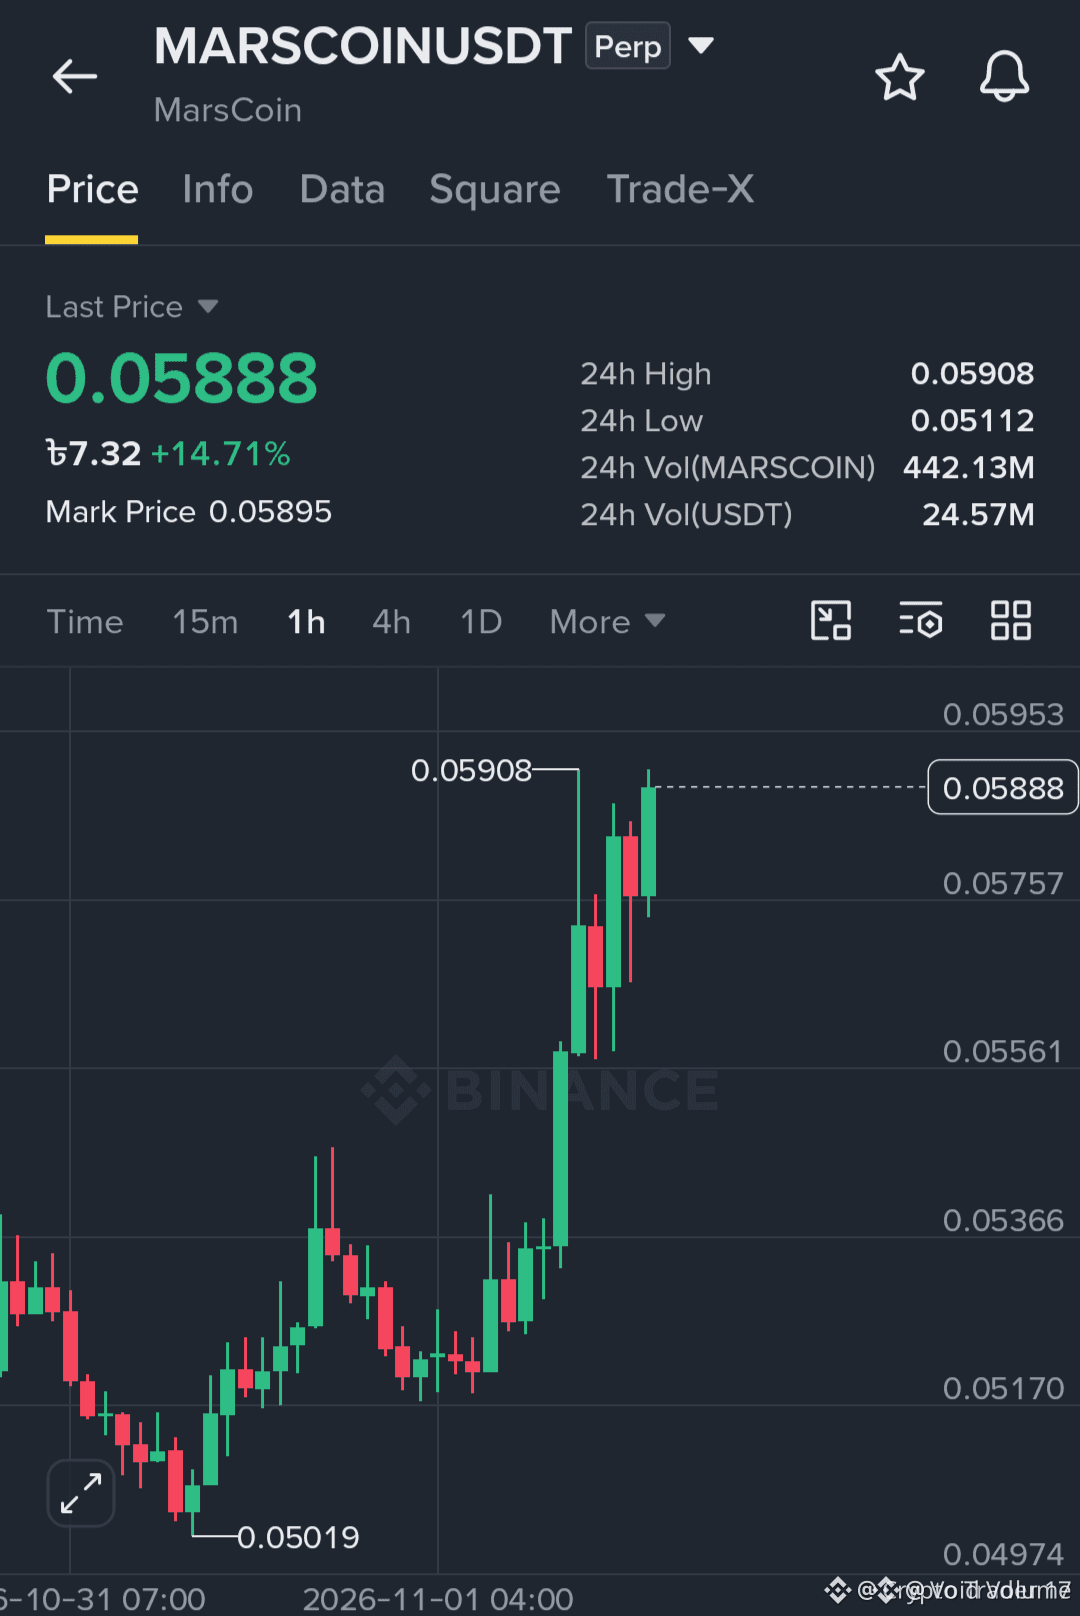
🦈 $MARSCOIN FOLLOWS INSTITUTIONAL PLAYBOOK AS MARKET STRUCTURE VALIDATES ACCUMULATION 📈
The structural expansion on $MARSCOIN is unfolding with surgical precision following that initial demand absorption. 📊 Price action respected key discount imbalances cleanly, showing zero intent from sellers to disrupt the established order flow.
As capital rotates across sympathetic setups like $BULLA and $BIRB , institutional volume indicates smart money is managing this leg with controlled velocity. 🌊 The sweep of internal range liquidity has cleared the path for a sustained run toward untapped premium zones.
💬 Are you riding the momentum from the order block retest or waiting for an inefficiency fill? 👇
⚠️ Not financial advice. Always manage your risk. 🛡️
🏷️ #MARSCOIN #PriceAction #Altcoins #SmartMoney #Crypto
🎯 🦈
4

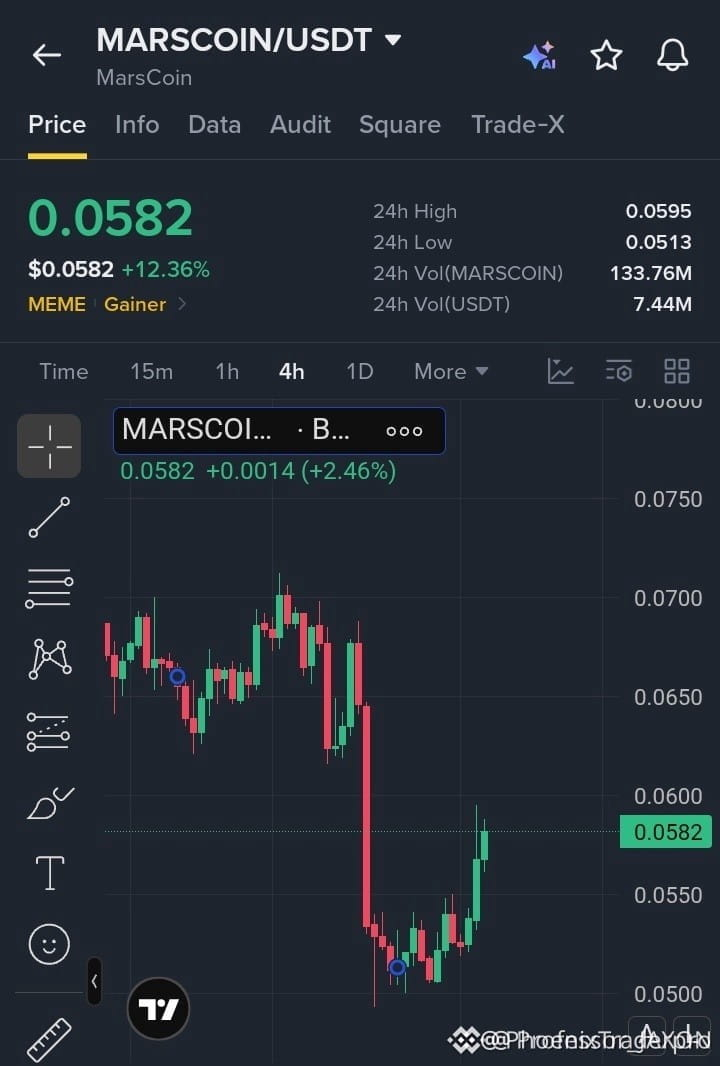
⚡ $MARSCOIN RECLAIMS MOMENTUM OFF DEMAND AS 4H BUYERS MOUNT AN AGGRESSIVE EXPANSION! 📈
Entry: 0.05700 - 0.05820 ⚡
Target: 0.06000 - 0.06250 - 0.06500 🎯
Stop Loss: 0.05450 ⚠️
Buyers stepped in with force after defending the 0.05100 floor, systematically absorbing sell orders to ignite a textbook recovery. 📊 The 4H structure is printing higher lows with steady volume accumulation signaling real momentum behind this bid.
⚡ Flipping the 0.06000 pivot will be the ignition point to clear overhead resistance and unlock higher liquidity pockets. 💡 Waiting for entry confirmation inside the execution pocket keeps your risk-to-reward skewed heavily in your favor. 💬 Are you bidding this reclaim early or waiting for the clean breakout over 0.06000? 👇
⚠️ Not financial advice. Always manage your risk. 🛡️
🏷️ #MARSCOIN #CryptoTrading #Altcoins #Breakout #Bullish
🎯 🐂
6
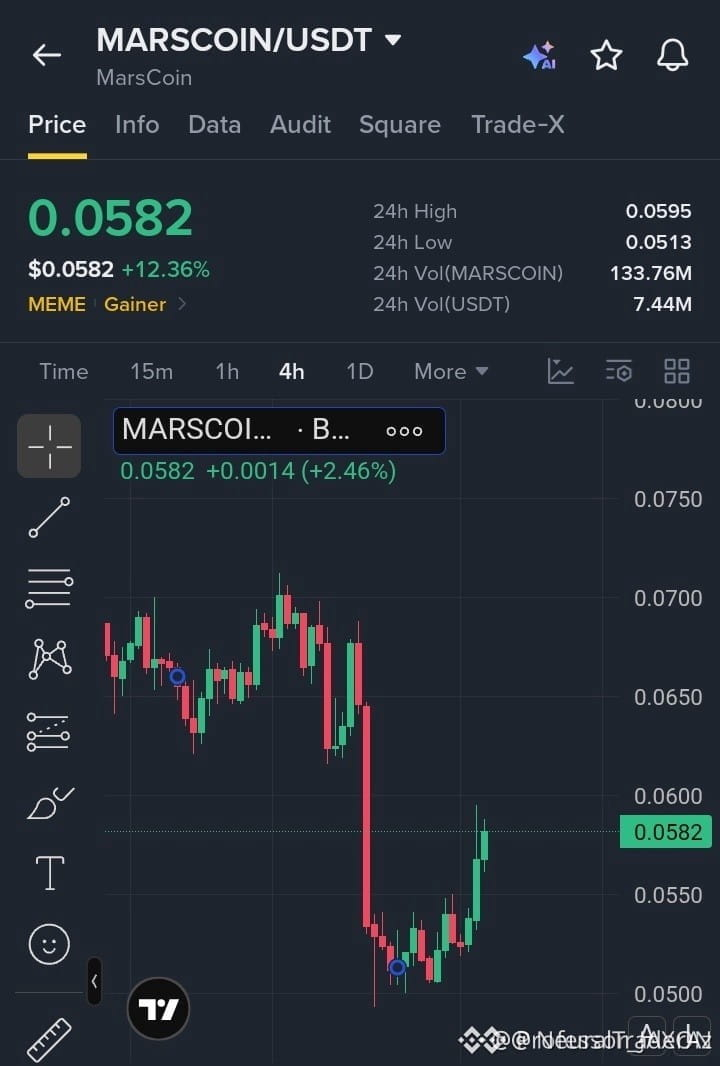
🦈 $MARSCOIN DEFENDS KEY DEMAND WITH IMPULSIVE 4H MOMENTUM BUILDING! ⚡
Entry: 0.05700 - 0.05820 ⚡
Target: 0.06000 - 0.06500 🎯
Stop Loss: 0.05450 ⚠️
After sweeping local sell-side liquidity at the 0.05100 base, $MARSCOIN is printing an aggressive structural rebound on the 4H timeframe. 📊 Smart money absorbed the downside expansion cleanly, setting up an impulsive rotation back toward local fair value.
A clean structural acceptance above 0.06000 will confirm the change of character, unlocking an inefficiency fill toward the 0.06500 liquidity pool. 🔍 Retesting this newly formed demand block offers a strictly defined asymmetric risk-to-reward profile before the expansion unfolds.
💬 Are you entering the mitigation zone now, or waiting for a confirmed candle close above 0.06000? 👇
⚠️ Not financial advice. Always manage your risk. 🛡️
🏷️ #MARSCOIN #PriceAction #MarketStructure #CryptoTrading
🎯 🦈
2
⚡ $MARSCOIN EXPLODES 3.6% ON SURGING VOLUME AS OPEN INTEREST SIGNALS SHORT SQUEEZE! 🦈
Entry: 0.0546 - 0.0555 ⚡
Target: 0.0616 - 0.0674 🎯
Stop Loss: 0.0519 ⚠️
Midnight volume just ripped through $MARSCOIN with a 3.6% burst, and the aggressive surge in open interest points to an impending short squeeze. 📊 With $BTC holding structural support steady, buyers are quietly stepping in to absorb aggressive sell pressure.
The broader trend still demands patience, so front-running without confirmation is off the table. 💡 I am eyeing a clean reaction inside the retest pocket before committing to ride the relief wave higher. 💬 Are you bidding this retest zone or waiting for the breakout to confirm?
⚠️ Not financial advice. Always manage your risk. 🛡️
🏷️ #MARSCOIN #BTC #ShortSqueeze #Altcoins #CryptoTrading
🎯 🦈
2
Log in to explore more content
Join global crypto users on Binance Square
⚡️ Get latest and useful information about crypto.
💬 Trusted by the world’s largest crypto exchange.
👍 Discover real insights from verified creators.
Email / Phone number
Trending Topics
1
#BinanceRestoresWithdrawalsForMultipleNetworksAndAssets
633 views
35 Discussing
2
#BinanceRestoresWithdrawalsForEthereumNetwork&BNBSmartChain
3,607 views
65 Discussing
3
#BinanceUpdatesProofofReservesAddresses
20,865 views
515 Discussing
4
#BinanceToResumePhaseOneOfWithdrawals
49,962 views
812 Discussing
5
#BinanceHadAlreadyCovered$6BofHackLoss
3,309 views
86 Discussing
6
#FBIConfirmsNorthKoreaIsResponsibleForBinanceCryptoHack
25,619 views
98 Discussing
7
#BinanceSAFUFundTransferCompleted7499BTC
122,212 views
1,699 Discussing
8
#CZDismissesClaimsBinanceHackWasPredicted
17,076 views
331 Discussing
9
#BinanceRecovery90% of stolen assets
258,040 views
252 Discussing
10
#YiHe:ProofOfReserves:10TokensAt100%Backing
233,150 views
1,391 Discussing