

The Cryptonomist
18.9k Публикации

The Cryptonomist
 Square Verified+
Отправить жалобу
Заблокировать пользователя
0 подписок(и/а)
38.1K+ подписчиков(а)
22.7K+ понравилось
Посты
Статья
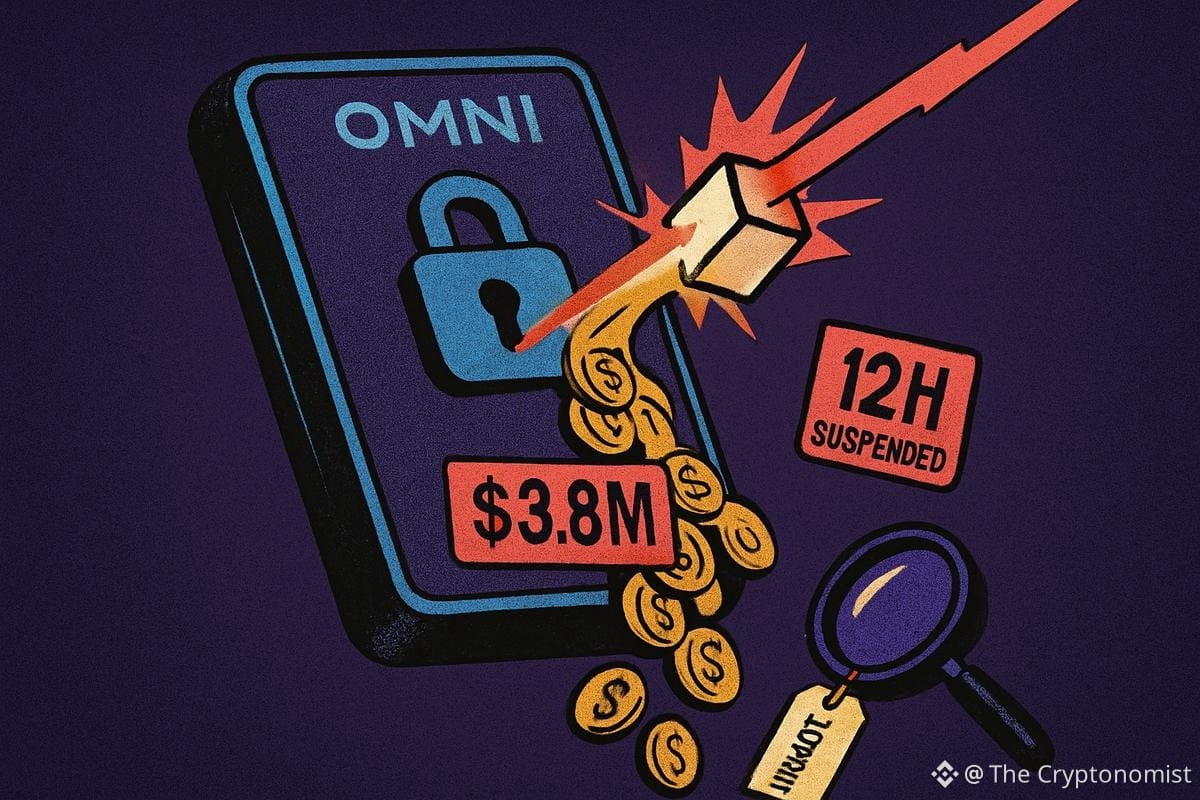
Нарушение безопасности NEAR Intents: утечка $3,8 млн из горячего кошелькаСервис межсетевых кросс-чейн-свопов под названием NEAR Intents сообщил 1 октября 2026 года, что пострадал от нарушения безопасности после того, как злоумышленники использовали ошибку, связавшую его инфраструктуру Omni с смарт-контрактами платформы. В результате нарушения безопасности NEAR Intents из BSC-горячего кошелька было выведено более $3,8 млн, прежде чем команда перешла к сдерживанию последствий, исправила уязвимость и пообещала полное возмещение пострадавшим пользователям.
Ключевые выводы
NEAR Intents подтвердил инцидент безопасности, вызванный ошибкой во взаимодействии инфраструктуры Omni для пополнения и вывода средств со своими смарт-контрактами.
Нарушение безопасности NEAR Intents: утечка $3,8 млн из горячего кошелька
Сервис межсетевых кросс-чейн-свопов под названием NEAR Intents сообщил 1 октября 2026 года, что пострадал от нарушения безопасности после того, как злоумышленники использовали ошибку, связавшую его инфраструктуру Omni с смарт-контрактами платформы. В результате нарушения безопасности NEAR Intents из BSC-горячего кошелька было выведено более $3,8 млн, прежде чем команда перешла к сдерживанию последствий, исправила уязвимость и пообещала полное возмещение пострадавшим пользователям.
Ключевые выводы
NEAR Intents подтвердил инцидент безопасности, вызванный ошибкой во взаимодействии инфраструктуры Omni для пополнения и вывода средств со своими смарт-контрактами.
Ключевые выводы
NEAR Intents подтвердил инцидент безопасности, вызванный ошибкой во взаимодействии инфраструктуры Omni для пополнения и вывода средств со своими смарт-контрактами.
171
Статья
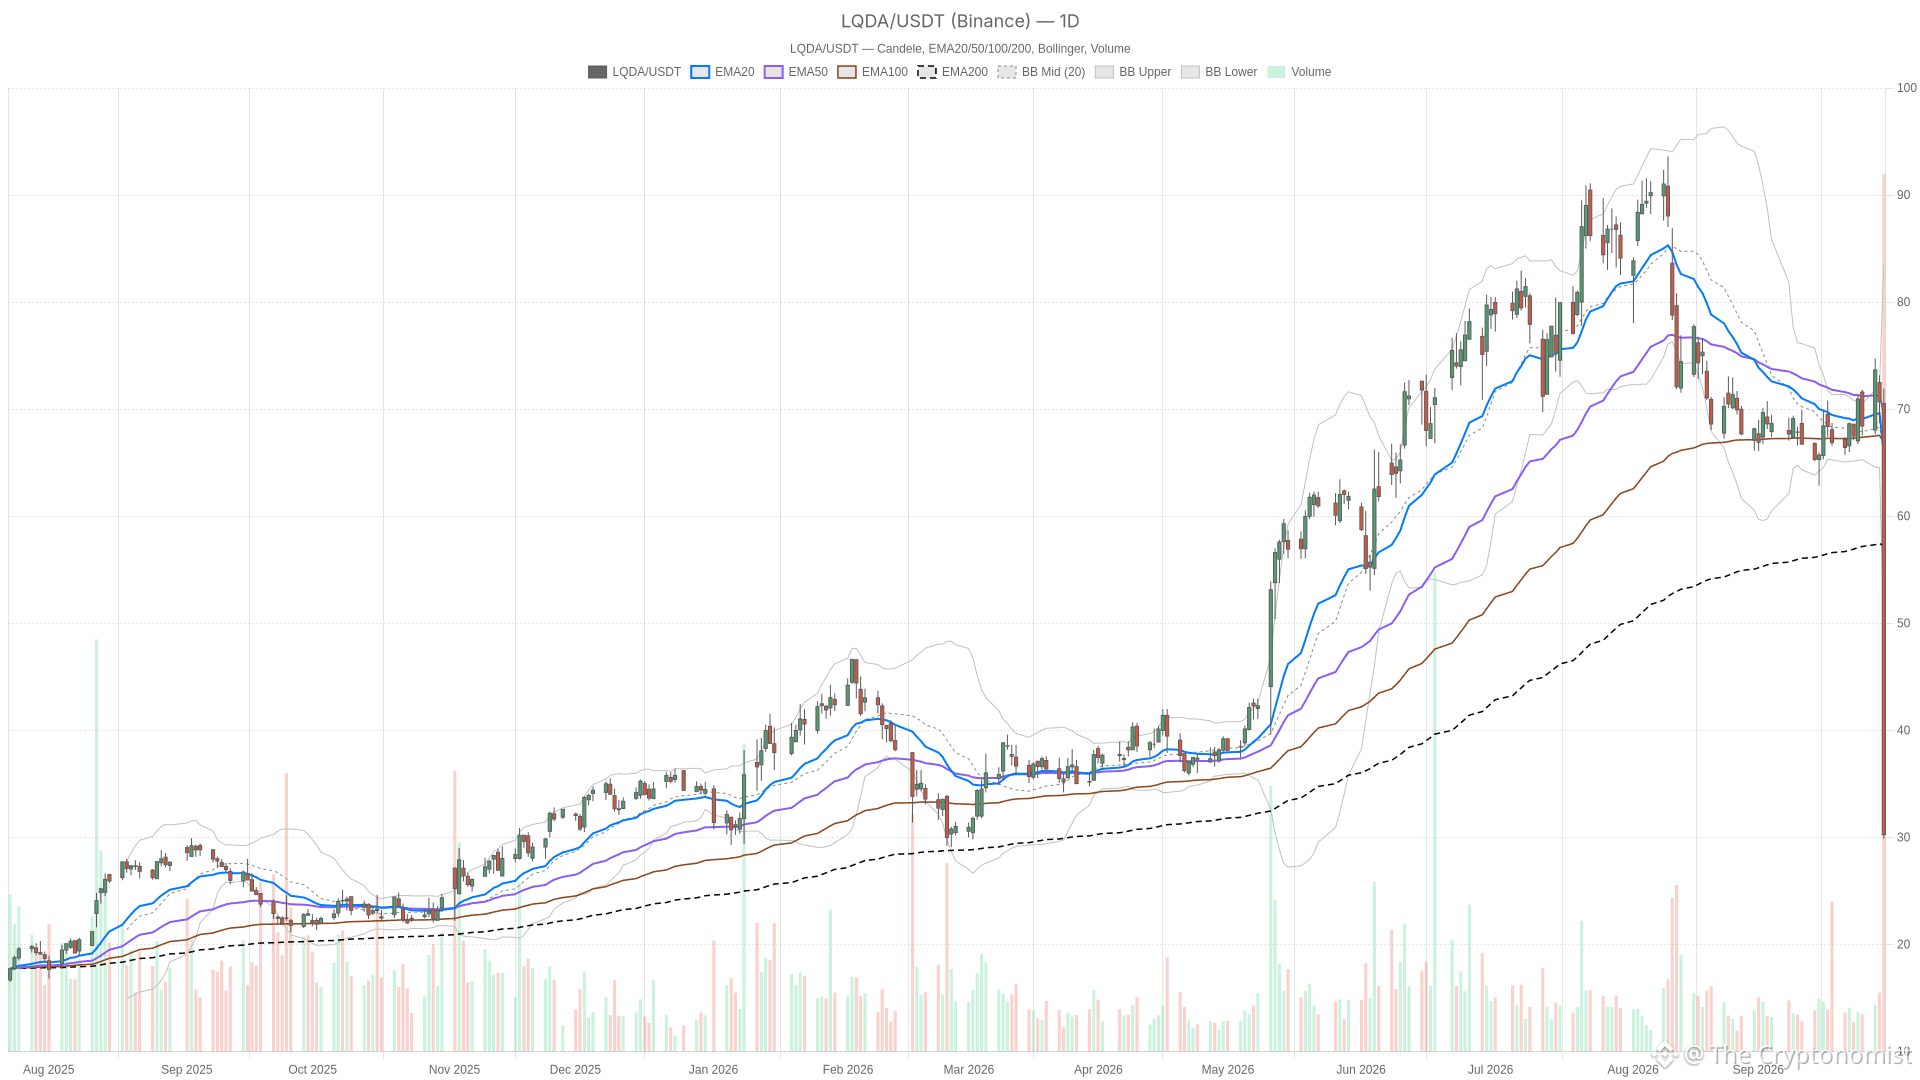
Акции Liquidia падают на 57% до $30,26 после решения суда по патенту в пользу United TherapeuticsАкции Liquidia рухнули на 57,19% в среду: закрытие — на $30,26 против $70,69 на 2026-09-29. Падение произошло после решения федерального суда в патентном споре с United Therapeutics по препарату YUTREPIA для лечения заболеваний легких. Объем торгов резко вырос до 22 770 901 акции, что изменило техническую картину на всех временных горизонтах.
LQDA — дневной график со свечами, EMA20/EMA50 и объемом.
Ключевые выводы
Акции Liquidia обвалились на 57,19% в среду: закрытие — $30,26 по сравнению с предыдущим закрытием $70,69, при этом объем достиг 22 770 901 акции.
Дневной RSI14 обвалился до 20,23 — глубоко на территории перепроданности, при этом цена закрылась далеко ниже нижней полосы Боллинджера на уровне $49,45.
Акции Liquidia падают на 57% до $30,26 после решения суда по патенту в пользу United Therapeutics
Акции Liquidia рухнули на 57,19% в среду: закрытие — на $30,26 против $70,69 на 2026-09-29. Падение произошло после решения федерального суда в патентном споре с United Therapeutics по препарату YUTREPIA для лечения заболеваний легких. Объем торгов резко вырос до 22 770 901 акции, что изменило техническую картину на всех временных горизонтах.
LQDA — дневной график со свечами, EMA20/EMA50 и объемом.
Ключевые выводы
Акции Liquidia обвалились на 57,19% в среду: закрытие — $30,26 по сравнению с предыдущим закрытием $70,69, при этом объем достиг 22 770 901 акции.
Дневной RSI14 обвалился до 20,23 — глубоко на территории перепроданности, при этом цена закрылась далеко ниже нижней полосы Боллинджера на уровне $49,45.
LQDA — дневной график со свечами, EMA20/EMA50 и объемом.
Ключевые выводы
Акции Liquidia обвалились на 57,19% в среду: закрытие — $30,26 по сравнению с предыдущим закрытием $70,69, при этом объем достиг 22 770 901 акции.
Дневной RSI14 обвалился до 20,23 — глубоко на территории перепроданности, при этом цена закрылась далеко ниже нижней полосы Боллинджера на уровне $49,45.
19
Статья
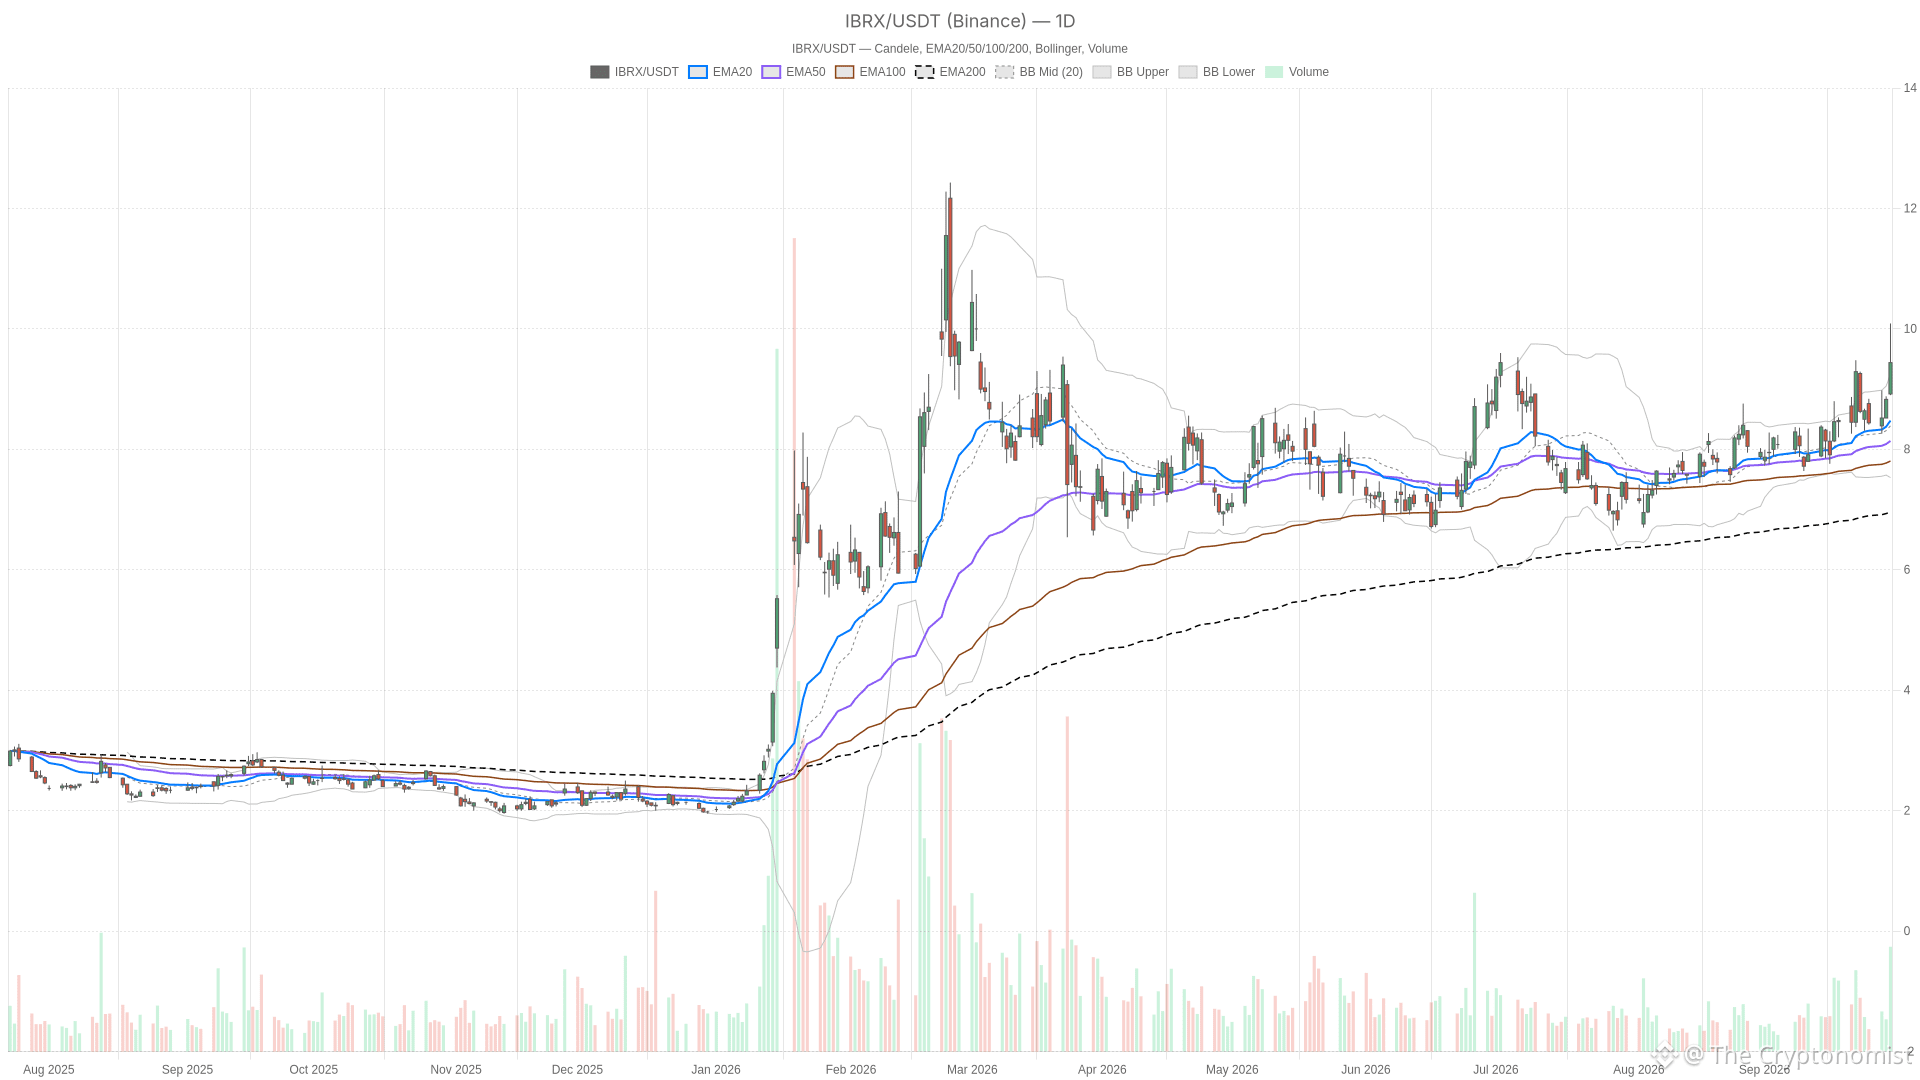
Акции ImmunityBio подскакивают на 6,91% до $9.44 на закрытии, касаются $10 внутри дня впервые с мартаАкции ImmunityBio взлетели на 6,91% и закрылись на отметке $9.44 в среду, впервые с марта преодолев $10 внутри дня. Этот прорыв уровня, который не трогали месяцами, укрепляет бычий сценарий, формирующийся по дневному графику.
IBRX — дневной график с японскими свечами, EMA20/EMA50 и объёмом.
Ключевые выводы
В среду акции ImmunityBio закрылись на $9.44, прибавив 6,91%, после того как внутри дня коснулись $10.09 — это первый прорыв уровня $10 с марта.
На дневном графике показано полностью выстроенное бычье выравнивание EMA: 20-периодная — $8.48, 50-периодная — $8.14 и 200-периодная — $6.63.
Акции ImmunityBio подскакивают на 6,91% до $9.44 на закрытии, касаются $10 внутри дня впервые с марта
Акции ImmunityBio взлетели на 6,91% и закрылись на отметке $9.44 в среду, впервые с марта преодолев $10 внутри дня. Этот прорыв уровня, который не трогали месяцами, укрепляет бычий сценарий, формирующийся по дневному графику.
IBRX — дневной график с японскими свечами, EMA20/EMA50 и объёмом.
Ключевые выводы
В среду акции ImmunityBio закрылись на $9.44, прибавив 6,91%, после того как внутри дня коснулись $10.09 — это первый прорыв уровня $10 с марта.
На дневном графике показано полностью выстроенное бычье выравнивание EMA: 20-периодная — $8.48, 50-периодная — $8.14 и 200-периодная — $6.63.
IBRX — дневной график с японскими свечами, EMA20/EMA50 и объёмом.
Ключевые выводы
В среду акции ImmunityBio закрылись на $9.44, прибавив 6,91%, после того как внутри дня коснулись $10.09 — это первый прорыв уровня $10 с марта.
На дневном графике показано полностью выстроенное бычье выравнивание EMA: 20-периодная — $8.48, 50-периодная — $8.14 и 200-периодная — $6.63.
7

Статья
Разъяснения Банка Франции по стейблкоинам нацелены на защиту денежного суверенитета ЕвропыБанк Франции выпустил новые разъяснения 1 октября 2026 года, направленные на устранение давнего недопонимания между стейблкоинами и цифровыми валютами центральных банков. В этих разъяснениях Банк Франции подробно описывает, что отличает токены, выпущенные частными структурами, от государственных цифровых денег; по словам французского центробанка, эта разница важна для защиты денежного суверенитета в масштабах Еврозоны.
Основные выводы
Банк Франции опубликовал разъяснения 1 октября 2026 года, уточнив определяющие характеристики стейблкоинов.
Разъяснения Банка Франции по стейблкоинам нацелены на защиту денежного суверенитета Европы
Банк Франции выпустил новые разъяснения 1 октября 2026 года, направленные на устранение давнего недопонимания между стейблкоинами и цифровыми валютами центральных банков. В этих разъяснениях Банк Франции подробно описывает, что отличает токены, выпущенные частными структурами, от государственных цифровых денег; по словам французского центробанка, эта разница важна для защиты денежного суверенитета в масштабах Еврозоны.
Основные выводы
Банк Франции опубликовал разъяснения 1 октября 2026 года, уточнив определяющие характеристики стейблкоинов.
Основные выводы
Банк Франции опубликовал разъяснения 1 октября 2026 года, уточнив определяющие характеристики стейблкоинов.
16
Статья
Криптовзломы в сентябре 2026 года обошлись в $766 млн — худший месяц годаКриптографические взломы привели к убыткам более $766 миллионов в сентябре 2026 года, сделав это худшим месяцем в году для краж цифровых активов на данный момент. Две отдельные компании по кибербезопасности блокчейна отслеживали ущерб, и хотя число инцидентов у них различалось, обе стороны пришли к поразительно близким оценкам потерь — признак того, насколько масштабными и однозначными были нарушения в течение этого месяца.
Ключевые выводы
Сентябрь 2026 года стал самым затратным месяцем этого года для взломов и эксплойтов в криптоиндустрии: потери превысили $766 миллионов.
По данным PeckShield, произошло 55 значимых инцидентов на общую сумму $766,5 млн, тогда как CertiK зафиксировала 97 инцидентов на сумму $768,4 млн.
Криптовзломы в сентябре 2026 года обошлись в $766 млн — худший месяц года
Криптографические взломы привели к убыткам более $766 миллионов в сентябре 2026 года, сделав это худшим месяцем в году для краж цифровых активов на данный момент. Две отдельные компании по кибербезопасности блокчейна отслеживали ущерб, и хотя число инцидентов у них различалось, обе стороны пришли к поразительно близким оценкам потерь — признак того, насколько масштабными и однозначными были нарушения в течение этого месяца.
Ключевые выводы
Сентябрь 2026 года стал самым затратным месяцем этого года для взломов и эксплойтов в криптоиндустрии: потери превысили $766 миллионов.
По данным PeckShield, произошло 55 значимых инцидентов на общую сумму $766,5 млн, тогда как CertiK зафиксировала 97 инцидентов на сумму $768,4 млн.
Ключевые выводы
Сентябрь 2026 года стал самым затратным месяцем этого года для взломов и эксплойтов в криптоиндустрии: потери превысили $766 миллионов.
По данным PeckShield, произошло 55 значимых инцидентов на общую сумму $766,5 млн, тогда как CertiK зафиксировала 97 инцидентов на сумму $768,4 млн.
30
Статья
См. перевод
SBI completes $294.9 million Bitbank acquisition, merging Japan’s crypto marketsSBI Holdings has officially absorbed one of Japan’s most prominent cryptocurrency exchanges, closing a deal that reshapes the competitive map for digital asset trading in the country. The SBI acquisition Bitbank transaction was completed on October 1, turning Bitbank, operator of the crypto exchange platform “bitbank,” into a wholly owned subsidiary of the financial conglomerate. The deal, worth ¥46.7 billion (roughly $294.9 million), closes a chapter that began with a June announcement and wraps up almost exactly on the timeline SBI originally projected.
Key takeaways
SBI Holdings completed its full acquisition of Bitbank on October 1 for ¥46.7 billion (about $294.9 million).
Bitbank is now a 100% subsidiary of SBI Holdings, following a deal first announced on June 25.
The transaction combined share purchases from existing shareholders with a subscription to a third-party allotment of new shares.
Tomohiko Kondo, president of SBI VC Trade, joined Bitbank’s board, while Bitbank CEO Noriyuki Hirosue is set to become an outside director at SBI VC Trade.
Bitbank says its existing exchange services will continue unchanged for current users.
SBI Holdings Finalizes Acquisition of Bitbank for ¥46.7 Billion
The deal brings one of Japan’s largest retail-focused crypto exchanges fully under SBI’s corporate umbrella, marking a clear strategic bet on the country’s expanding digital asset market. SBI Holdings confirmed the completion of the acquisition on October 1, roughly three months after first revealing its intentions.
Acquisition Announcement and Timeline
On June 25, SBI Holdings disclosed that it had finalized a basic agreement together with a share transfer agreement designed to turn Bitbank into a fully owned subsidiary. From the outset, the company projected a completion date around October, and the SBI Holdings crypto expansion plan landed almost exactly on that schedule. That kind of precision matters in M&A circles, where crypto-related deals have sometimes dragged out over regulatory or valuation disputes.
Transaction Structure and Share Transfers
The ¥46.7 billion price tag didn’t come from a single transaction. Instead, SBI structured the deal in three distinct steps. First, SBICAH LLC, a wholly owned subsidiary of SBI, purchased shares from existing Bitbank shareholders, including Noriyuki Hirosue. Second, SBICAH subscribed to a third-party allotment of newly issued Bitbank shares. Third, Bitbank itself repurchased shares held by MIXI and Ceres, converting them into treasury stock. Together, these moves consolidated full ownership of Bitbank under SBI Holdings.
Management Restructuring Following Acquisition
Ownership changes typically bring boardroom changes too, and this deal is no exception. SBI has woven leadership from both companies together rather than simply replacing Bitbank’s existing management.
New Board Appointments and Cross-Company Governance
Bitbank’s board of directors now includes Tomohiko Kondo, who serves as president of SBI VC Trade. Mirroring that appointment, SBI VC Trade is set to welcome Bitbank CEO Noriyuki Hirosue as one of its outside directors. This cross-appointment arrangement effectively links the governance of SBI’s existing crypto arm with its newly acquired exchange, a structure that signals an intent toward coordination rather than a clean separation between the two businesses.
Bitbank’s Exchange Services and Strategic Impact
What matters most to ordinary users is whether the platform experience itself will shift, and for now nothing is changing. Bitbank has indicated that it will keep running its current exchange services unaltered following its entry into the SBI Group, so existing users should notice no difference from the setup they’re already familiar with.
Continuity of Exchange Services Post-Acquisition
Keeping Bitbank’s operations intact likely matters for retention. Bitbank has built its reputation as one of Japan’s leading exchanges by trading volume, with a customer base centered heavily on retail investors — a different crowd than the institutional clients SBI VC Trade has historically served.
Expansion of SBI Group’s Retail-Focused Crypto Business
That difference is precisely the point. SBI VC Trade has expanded its operations primarily around institutional investors and tight integration with the group’s broader financial services, while Bitbank brings deep Bitbank retail investors relationships to the table. Opting for full integration instead of a partnership or minority stake lets SBI Group instantly expand its consumer-oriented exchange operations at scale, bypassing the years it would otherwise take to grow that user base organically.
Context of the Acquisition in Japan’s Growing Crypto Market
This deal doesn’t exist in isolation — it reflects a broader pattern of established financial institutions moving deeper into digital assets. Involvement by major financial groups in Japan’s crypto asset exchange sector has been intensifying, driven by the expansion of the crypto market since 2024 and the clarification of domestic regulations.
Market Expansion and Regulatory Clarity Since 2024
Clearer rules tend to lower the perceived risk for large, regulated financial players entering a market that was once seen as speculative or legally murky. That shift has encouraged established institutions to treat Japan crypto exchange operations as a legitimate growth area rather than a side experiment, and SBI’s full acquisition of Bitbank can be read as one of the deals symbolizing that change.
Increasing Involvement of Major Financial Groups
SBI Group, under Chairman and President Yoshitaka Kitao, has pursued a strategy fusing finance and technology for years, and its crypto footprint already includes mining operations and token issuance support. Strengthening its exchange business through Bitbank appears aimed at broadening customer touchpoints across both retail and institutional segments. Whether rivals respond with similar consolidation moves of their own may become the next storyline to watch in Japan’s crypto exchange sector.
Article produced with the assistance of artificial intelligence and reviewed by the editorial team.
SBI completes $294.9 million Bitbank acquisition, merging Japan’s crypto markets
SBI Holdings has officially absorbed one of Japan’s most prominent cryptocurrency exchanges, closing a deal that reshapes the competitive map for digital asset trading in the country. The SBI acquisition Bitbank transaction was completed on October 1, turning Bitbank, operator of the crypto exchange platform “bitbank,” into a wholly owned subsidiary of the financial conglomerate. The deal, worth ¥46.7 billion (roughly $294.9 million), closes a chapter that began with a June announcement and wraps up almost exactly on the timeline SBI originally projected.
Key takeaways
SBI Holdings completed its full acquisition of Bitbank on October 1 for ¥46.7 billion (about $294.9 million).
Bitbank is now a 100% subsidiary of SBI Holdings, following a deal first announced on June 25.
The transaction combined share purchases from existing shareholders with a subscription to a third-party allotment of new shares.
Tomohiko Kondo, president of SBI VC Trade, joined Bitbank’s board, while Bitbank CEO Noriyuki Hirosue is set to become an outside director at SBI VC Trade.
Bitbank says its existing exchange services will continue unchanged for current users.
SBI Holdings Finalizes Acquisition of Bitbank for ¥46.7 Billion
The deal brings one of Japan’s largest retail-focused crypto exchanges fully under SBI’s corporate umbrella, marking a clear strategic bet on the country’s expanding digital asset market. SBI Holdings confirmed the completion of the acquisition on October 1, roughly three months after first revealing its intentions.
Acquisition Announcement and Timeline
On June 25, SBI Holdings disclosed that it had finalized a basic agreement together with a share transfer agreement designed to turn Bitbank into a fully owned subsidiary. From the outset, the company projected a completion date around October, and the SBI Holdings crypto expansion plan landed almost exactly on that schedule. That kind of precision matters in M&A circles, where crypto-related deals have sometimes dragged out over regulatory or valuation disputes.
Transaction Structure and Share Transfers
The ¥46.7 billion price tag didn’t come from a single transaction. Instead, SBI structured the deal in three distinct steps. First, SBICAH LLC, a wholly owned subsidiary of SBI, purchased shares from existing Bitbank shareholders, including Noriyuki Hirosue. Second, SBICAH subscribed to a third-party allotment of newly issued Bitbank shares. Third, Bitbank itself repurchased shares held by MIXI and Ceres, converting them into treasury stock. Together, these moves consolidated full ownership of Bitbank under SBI Holdings.
Management Restructuring Following Acquisition
Ownership changes typically bring boardroom changes too, and this deal is no exception. SBI has woven leadership from both companies together rather than simply replacing Bitbank’s existing management.
New Board Appointments and Cross-Company Governance
Bitbank’s board of directors now includes Tomohiko Kondo, who serves as president of SBI VC Trade. Mirroring that appointment, SBI VC Trade is set to welcome Bitbank CEO Noriyuki Hirosue as one of its outside directors. This cross-appointment arrangement effectively links the governance of SBI’s existing crypto arm with its newly acquired exchange, a structure that signals an intent toward coordination rather than a clean separation between the two businesses.
Bitbank’s Exchange Services and Strategic Impact
What matters most to ordinary users is whether the platform experience itself will shift, and for now nothing is changing. Bitbank has indicated that it will keep running its current exchange services unaltered following its entry into the SBI Group, so existing users should notice no difference from the setup they’re already familiar with.
Continuity of Exchange Services Post-Acquisition
Keeping Bitbank’s operations intact likely matters for retention. Bitbank has built its reputation as one of Japan’s leading exchanges by trading volume, with a customer base centered heavily on retail investors — a different crowd than the institutional clients SBI VC Trade has historically served.
Expansion of SBI Group’s Retail-Focused Crypto Business
That difference is precisely the point. SBI VC Trade has expanded its operations primarily around institutional investors and tight integration with the group’s broader financial services, while Bitbank brings deep Bitbank retail investors relationships to the table. Opting for full integration instead of a partnership or minority stake lets SBI Group instantly expand its consumer-oriented exchange operations at scale, bypassing the years it would otherwise take to grow that user base organically.
Context of the Acquisition in Japan’s Growing Crypto Market
This deal doesn’t exist in isolation — it reflects a broader pattern of established financial institutions moving deeper into digital assets. Involvement by major financial groups in Japan’s crypto asset exchange sector has been intensifying, driven by the expansion of the crypto market since 2024 and the clarification of domestic regulations.
Market Expansion and Regulatory Clarity Since 2024
Clearer rules tend to lower the perceived risk for large, regulated financial players entering a market that was once seen as speculative or legally murky. That shift has encouraged established institutions to treat Japan crypto exchange operations as a legitimate growth area rather than a side experiment, and SBI’s full acquisition of Bitbank can be read as one of the deals symbolizing that change.
Increasing Involvement of Major Financial Groups
SBI Group, under Chairman and President Yoshitaka Kitao, has pursued a strategy fusing finance and technology for years, and its crypto footprint already includes mining operations and token issuance support. Strengthening its exchange business through Bitbank appears aimed at broadening customer touchpoints across both retail and institutional segments. Whether rivals respond with similar consolidation moves of their own may become the next storyline to watch in Japan’s crypto exchange sector.
Article produced with the assistance of artificial intelligence and reviewed by the editorial team.
Key takeaways
SBI Holdings completed its full acquisition of Bitbank on October 1 for ¥46.7 billion (about $294.9 million).
Bitbank is now a 100% subsidiary of SBI Holdings, following a deal first announced on June 25.
The transaction combined share purchases from existing shareholders with a subscription to a third-party allotment of new shares.
Tomohiko Kondo, president of SBI VC Trade, joined Bitbank’s board, while Bitbank CEO Noriyuki Hirosue is set to become an outside director at SBI VC Trade.
Bitbank says its existing exchange services will continue unchanged for current users.
SBI Holdings Finalizes Acquisition of Bitbank for ¥46.7 Billion
The deal brings one of Japan’s largest retail-focused crypto exchanges fully under SBI’s corporate umbrella, marking a clear strategic bet on the country’s expanding digital asset market. SBI Holdings confirmed the completion of the acquisition on October 1, roughly three months after first revealing its intentions.
Acquisition Announcement and Timeline
On June 25, SBI Holdings disclosed that it had finalized a basic agreement together with a share transfer agreement designed to turn Bitbank into a fully owned subsidiary. From the outset, the company projected a completion date around October, and the SBI Holdings crypto expansion plan landed almost exactly on that schedule. That kind of precision matters in M&A circles, where crypto-related deals have sometimes dragged out over regulatory or valuation disputes.
Transaction Structure and Share Transfers
The ¥46.7 billion price tag didn’t come from a single transaction. Instead, SBI structured the deal in three distinct steps. First, SBICAH LLC, a wholly owned subsidiary of SBI, purchased shares from existing Bitbank shareholders, including Noriyuki Hirosue. Second, SBICAH subscribed to a third-party allotment of newly issued Bitbank shares. Third, Bitbank itself repurchased shares held by MIXI and Ceres, converting them into treasury stock. Together, these moves consolidated full ownership of Bitbank under SBI Holdings.
Management Restructuring Following Acquisition
Ownership changes typically bring boardroom changes too, and this deal is no exception. SBI has woven leadership from both companies together rather than simply replacing Bitbank’s existing management.
New Board Appointments and Cross-Company Governance
Bitbank’s board of directors now includes Tomohiko Kondo, who serves as president of SBI VC Trade. Mirroring that appointment, SBI VC Trade is set to welcome Bitbank CEO Noriyuki Hirosue as one of its outside directors. This cross-appointment arrangement effectively links the governance of SBI’s existing crypto arm with its newly acquired exchange, a structure that signals an intent toward coordination rather than a clean separation between the two businesses.
Bitbank’s Exchange Services and Strategic Impact
What matters most to ordinary users is whether the platform experience itself will shift, and for now nothing is changing. Bitbank has indicated that it will keep running its current exchange services unaltered following its entry into the SBI Group, so existing users should notice no difference from the setup they’re already familiar with.
Continuity of Exchange Services Post-Acquisition
Keeping Bitbank’s operations intact likely matters for retention. Bitbank has built its reputation as one of Japan’s leading exchanges by trading volume, with a customer base centered heavily on retail investors — a different crowd than the institutional clients SBI VC Trade has historically served.
Expansion of SBI Group’s Retail-Focused Crypto Business
That difference is precisely the point. SBI VC Trade has expanded its operations primarily around institutional investors and tight integration with the group’s broader financial services, while Bitbank brings deep Bitbank retail investors relationships to the table. Opting for full integration instead of a partnership or minority stake lets SBI Group instantly expand its consumer-oriented exchange operations at scale, bypassing the years it would otherwise take to grow that user base organically.
Context of the Acquisition in Japan’s Growing Crypto Market
This deal doesn’t exist in isolation — it reflects a broader pattern of established financial institutions moving deeper into digital assets. Involvement by major financial groups in Japan’s crypto asset exchange sector has been intensifying, driven by the expansion of the crypto market since 2024 and the clarification of domestic regulations.
Market Expansion and Regulatory Clarity Since 2024
Clearer rules tend to lower the perceived risk for large, regulated financial players entering a market that was once seen as speculative or legally murky. That shift has encouraged established institutions to treat Japan crypto exchange operations as a legitimate growth area rather than a side experiment, and SBI’s full acquisition of Bitbank can be read as one of the deals symbolizing that change.
Increasing Involvement of Major Financial Groups
SBI Group, under Chairman and President Yoshitaka Kitao, has pursued a strategy fusing finance and technology for years, and its crypto footprint already includes mining operations and token issuance support. Strengthening its exchange business through Bitbank appears aimed at broadening customer touchpoints across both retail and institutional segments. Whether rivals respond with similar consolidation moves of their own may become the next storyline to watch in Japan’s crypto exchange sector.
Article produced with the assistance of artificial intelligence and reviewed by the editorial team.
27
Статья
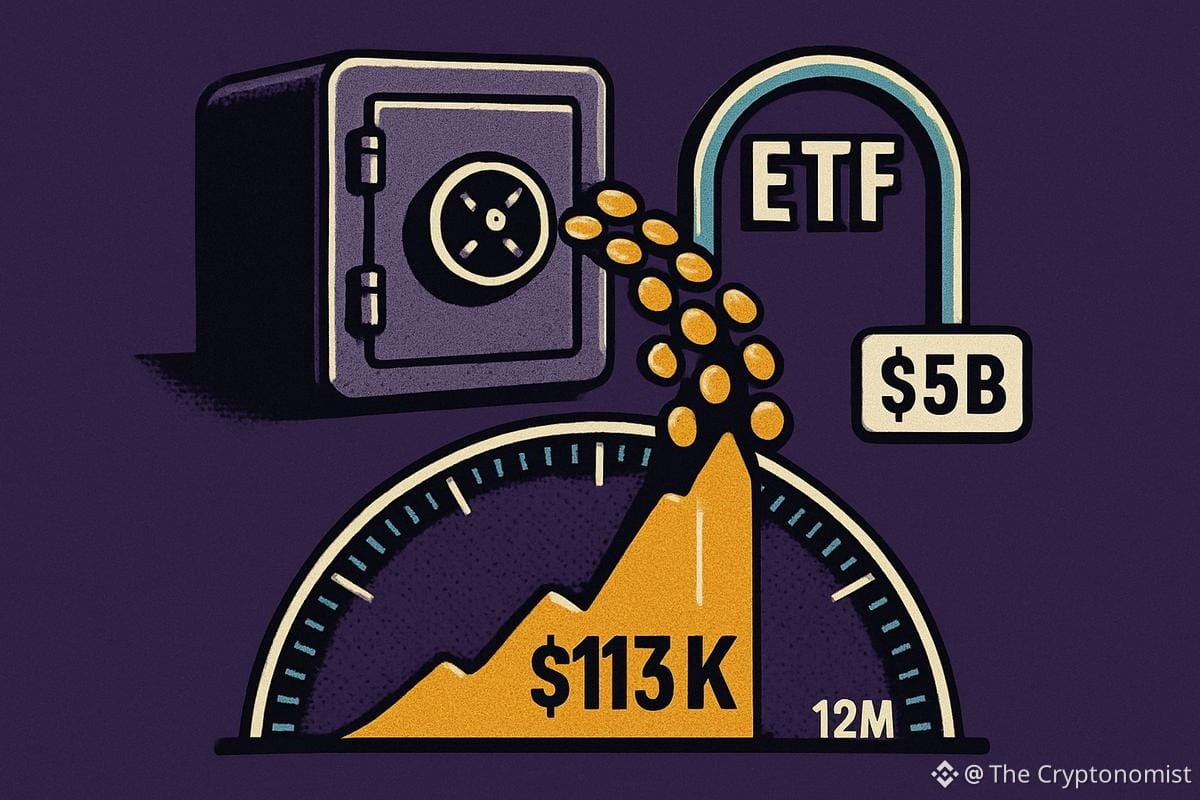
Прогноз Citi по биткоину растет на 38% на фоне ожидаемых притоков на $5 млрдCiti повысила свой 12-месячный ценовой ориентир по биткоину до $113 000 с $82 000. Обновление от 1 октября стало одним из наиболее заметных повышений в крипто-прогнозе банка в этом году. Обновленный прогноз Citi по биткоину отражает более активную работу криптовалютного рынка, более благоприятный макроэкономический фон и ожидание, что институциональные деньги продолжат постепенно возвращаться в цифровые активы, хотя и не одним внезапным всплеском.
Ключевые выводы
1 октября Citi повысила свой 12-месячный ценовой ориентир по биткоину с $82 000 до $113 000, что означает рост примерно на 37,8%.
Прогноз Citi по биткоину растет на 38% на фоне ожидаемых притоков на $5 млрд
Citi повысила свой 12-месячный ценовой ориентир по биткоину до $113 000 с $82 000. Обновление от 1 октября стало одним из наиболее заметных повышений в крипто-прогнозе банка в этом году. Обновленный прогноз Citi по биткоину отражает более активную работу криптовалютного рынка, более благоприятный макроэкономический фон и ожидание, что институциональные деньги продолжат постепенно возвращаться в цифровые активы, хотя и не одним внезапным всплеском.
Ключевые выводы
1 октября Citi повысила свой 12-месячный ценовой ориентир по биткоину с $82 000 до $113 000, что означает рост примерно на 37,8%.
Ключевые выводы
1 октября Citi повысила свой 12-месячный ценовой ориентир по биткоину с $82 000 до $113 000, что означает рост примерно на 37,8%.
32
Статья
Расследование Binance по MiCA в ЕС сосредоточено на обходном пути с лицензированиемЕвропейские регуляторы открыли официальную линию проверки того, как Binance продолжала обслуживать клиентов по всему блоку, не имея лицензии в соответствии с регулированием Markets in Crypto-Assets (MiCA). Расследование Binance по MiCA в ЕС сосредоточено на использовании биржей правовой оговорки под названием «обратное обращение» (reverse solicitation), которая в теории позволяет зарубежным компаниям работать с клиентами из ЕС только тогда, когда эти клиенты обращаются в компанию первыми — без рекламы или активного продвижения. Теперь европейские регуляторы выясняют, не слишком ли сильно Binance расширила действие этого исключения сверх его изначально предусмотренных рамок после того, как не уложилась в дедлайн, чтобы надлежащим образом получить лицензию.
Расследование Binance по MiCA в ЕС сосредоточено на обходном пути с лицензированием
Европейские регуляторы открыли официальную линию проверки того, как Binance продолжала обслуживать клиентов по всему блоку, не имея лицензии в соответствии с регулированием Markets in Crypto-Assets (MiCA). Расследование Binance по MiCA в ЕС сосредоточено на использовании биржей правовой оговорки под названием «обратное обращение» (reverse solicitation), которая в теории позволяет зарубежным компаниям работать с клиентами из ЕС только тогда, когда эти клиенты обращаются в компанию первыми — без рекламы или активного продвижения. Теперь европейские регуляторы выясняют, не слишком ли сильно Binance расширила действие этого исключения сверх его изначально предусмотренных рамок после того, как не уложилась в дедлайн, чтобы надлежащим образом получить лицензию.
13
Статья
Разработка цифрового евро в ЕЦБ нацелена на долю Visa и Mastercard в 47%Visa и Mastercard уже обрабатывают почти половину каждого евро, потраченного по картам в рамках еврозоны, и это доминирование подтолкнуло европейских чиновников к созданию публичной альтернативы: к новой цифровой валюте Европейского центрального банка, известной как цифровое евро. «Платежные системы не нейтральны; это инструменты власти», — заявил Жиль Бойе, французский депутат Европейского парламента, в июне, в тот же день, когда экономический комитет Европейского парламента проголосовал 43 против 14 в поддержку проекта. «У европейцев было много сигналов о том, как мы зависим от США. Сейчас мы полностью проснулись».
Разработка цифрового евро в ЕЦБ нацелена на долю Visa и Mastercard в 47%
Visa и Mastercard уже обрабатывают почти половину каждого евро, потраченного по картам в рамках еврозоны, и это доминирование подтолкнуло европейских чиновников к созданию публичной альтернативы: к новой цифровой валюте Европейского центрального банка, известной как цифровое евро. «Платежные системы не нейтральны; это инструменты власти», — заявил Жиль Бойе, французский депутат Европейского парламента, в июне, в тот же день, когда экономический комитет Европейского парламента проголосовал 43 против 14 в поддержку проекта. «У европейцев было много сигналов о том, как мы зависим от США. Сейчас мы полностью проснулись».
18
Статья
Near Crypto взлетает до $5.46: сигнал предупреждения о перекупленности RSIПо состоянию на 1 октября 2026 года NEAR торгуется примерно по $5.46 по отношению к USDT, что делает этот криптоактив Near заметным движущимся игроком на фоне охлаждения более широкого рынка. Общая капитализация крипторынка снизилась на 1.83% за 24 часа до примерно $2.89 трлн, однако NEAR продвигается выше за счёт собственного импульса.
NEAR/USDT — дневной график с японскими свечами, EMA20/EMA50 и объёмом.
Ключевые выводы
NEAR торгуется по $5.46, а дневной RSI составляет 76.9 — уверенно в зоне перекупленности.
EMA20, EMA50 и EMA200 остаются выстроенными бычьим образом, подтверждая устойчивый восходящий тренд.
Near Crypto взлетает до $5.46: сигнал предупреждения о перекупленности RSI
По состоянию на 1 октября 2026 года NEAR торгуется примерно по $5.46 по отношению к USDT, что делает этот криптоактив Near заметным движущимся игроком на фоне охлаждения более широкого рынка. Общая капитализация крипторынка снизилась на 1.83% за 24 часа до примерно $2.89 трлн, однако NEAR продвигается выше за счёт собственного импульса.
NEAR/USDT — дневной график с японскими свечами, EMA20/EMA50 и объёмом.
Ключевые выводы
NEAR торгуется по $5.46, а дневной RSI составляет 76.9 — уверенно в зоне перекупленности.
EMA20, EMA50 и EMA200 остаются выстроенными бычьим образом, подтверждая устойчивый восходящий тренд.
NEAR/USDT — дневной график с японскими свечами, EMA20/EMA50 и объёмом.
Ключевые выводы
NEAR торгуется по $5.46, а дневной RSI составляет 76.9 — уверенно в зоне перекупленности.
EMA20, EMA50 и EMA200 остаются выстроенными бычьим образом, подтверждая устойчивый восходящий тренд.
43
Статья
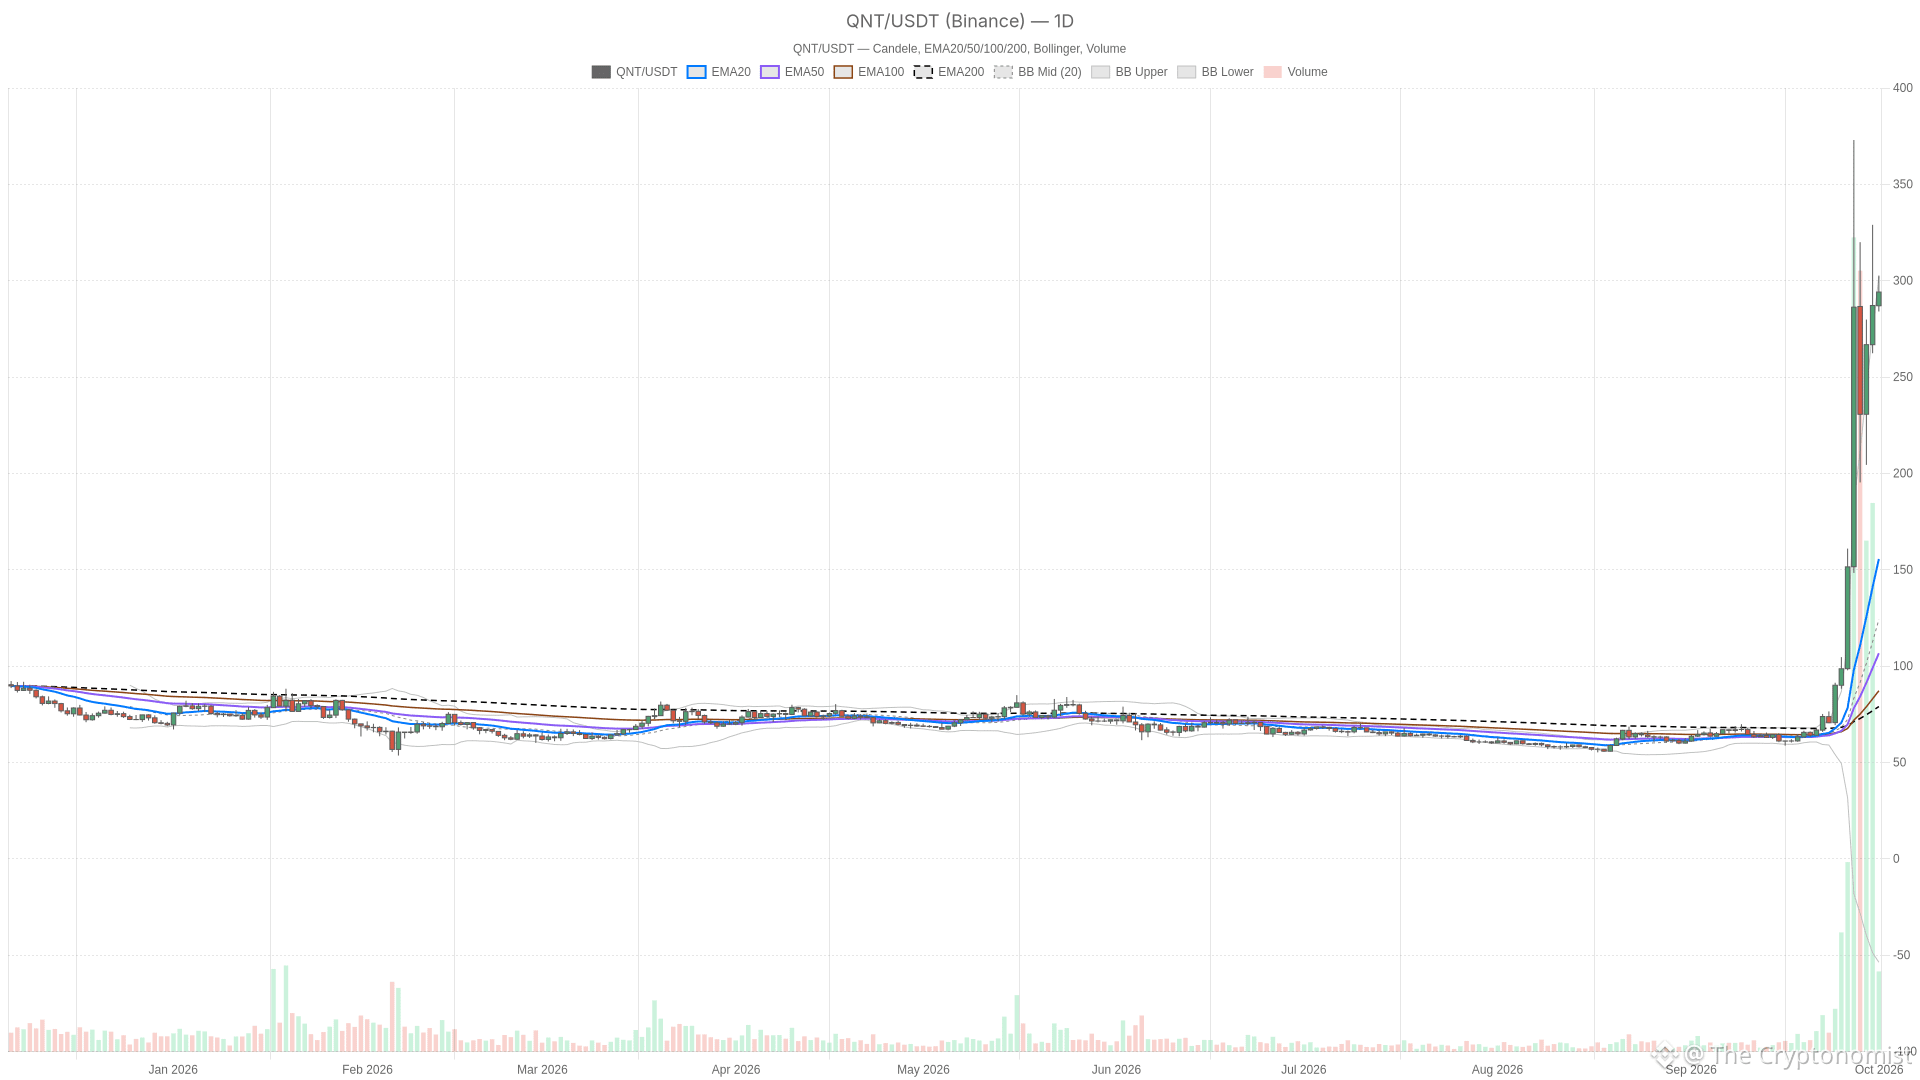
Крипто Quant QNT достигает $294: RSI 81 подает сигнал о перекупленностиКрипторынок редко бывает сдержанным в вопросах экстремумов, и ралли Quant QNT не исключение. По состоянию на 1 октября 2026 года QNT торгуется около $294 на Binance, а дневной RSI составляет 81,43 — уровень, который обычно предшествует либо пику на выбросе (blow-off top), либо резкой коррекции.
QNT/USDT — дневной график со свечами, EMA20/EMA50 и объемом.
Ключевые выводы
Сделки QNT/USDT идут рядом с $294,12 на дневном графике, значительно выше EMA20, EMA50 и EMA200.
Дневной RSI14 находится на уровне 81,43 — глубоко в зоне перекупленности, тогда как часовой RSI остыл до 55.
Крипто Quant QNT достигает $294: RSI 81 подает сигнал о перекупленности
Крипторынок редко бывает сдержанным в вопросах экстремумов, и ралли Quant QNT не исключение. По состоянию на 1 октября 2026 года QNT торгуется около $294 на Binance, а дневной RSI составляет 81,43 — уровень, который обычно предшествует либо пику на выбросе (blow-off top), либо резкой коррекции.
QNT/USDT — дневной график со свечами, EMA20/EMA50 и объемом.
Ключевые выводы
Сделки QNT/USDT идут рядом с $294,12 на дневном графике, значительно выше EMA20, EMA50 и EMA200.
Дневной RSI14 находится на уровне 81,43 — глубоко в зоне перекупленности, тогда как часовой RSI остыл до 55.
QNT/USDT — дневной график со свечами, EMA20/EMA50 и объемом.
Ключевые выводы
Сделки QNT/USDT идут рядом с $294,12 на дневном графике, значительно выше EMA20, EMA50 и EMA200.
Дневной RSI14 находится на уровне 81,43 — глубоко в зоне перекупленности, тогда как часовой RSI остыл до 55.
373
Статья
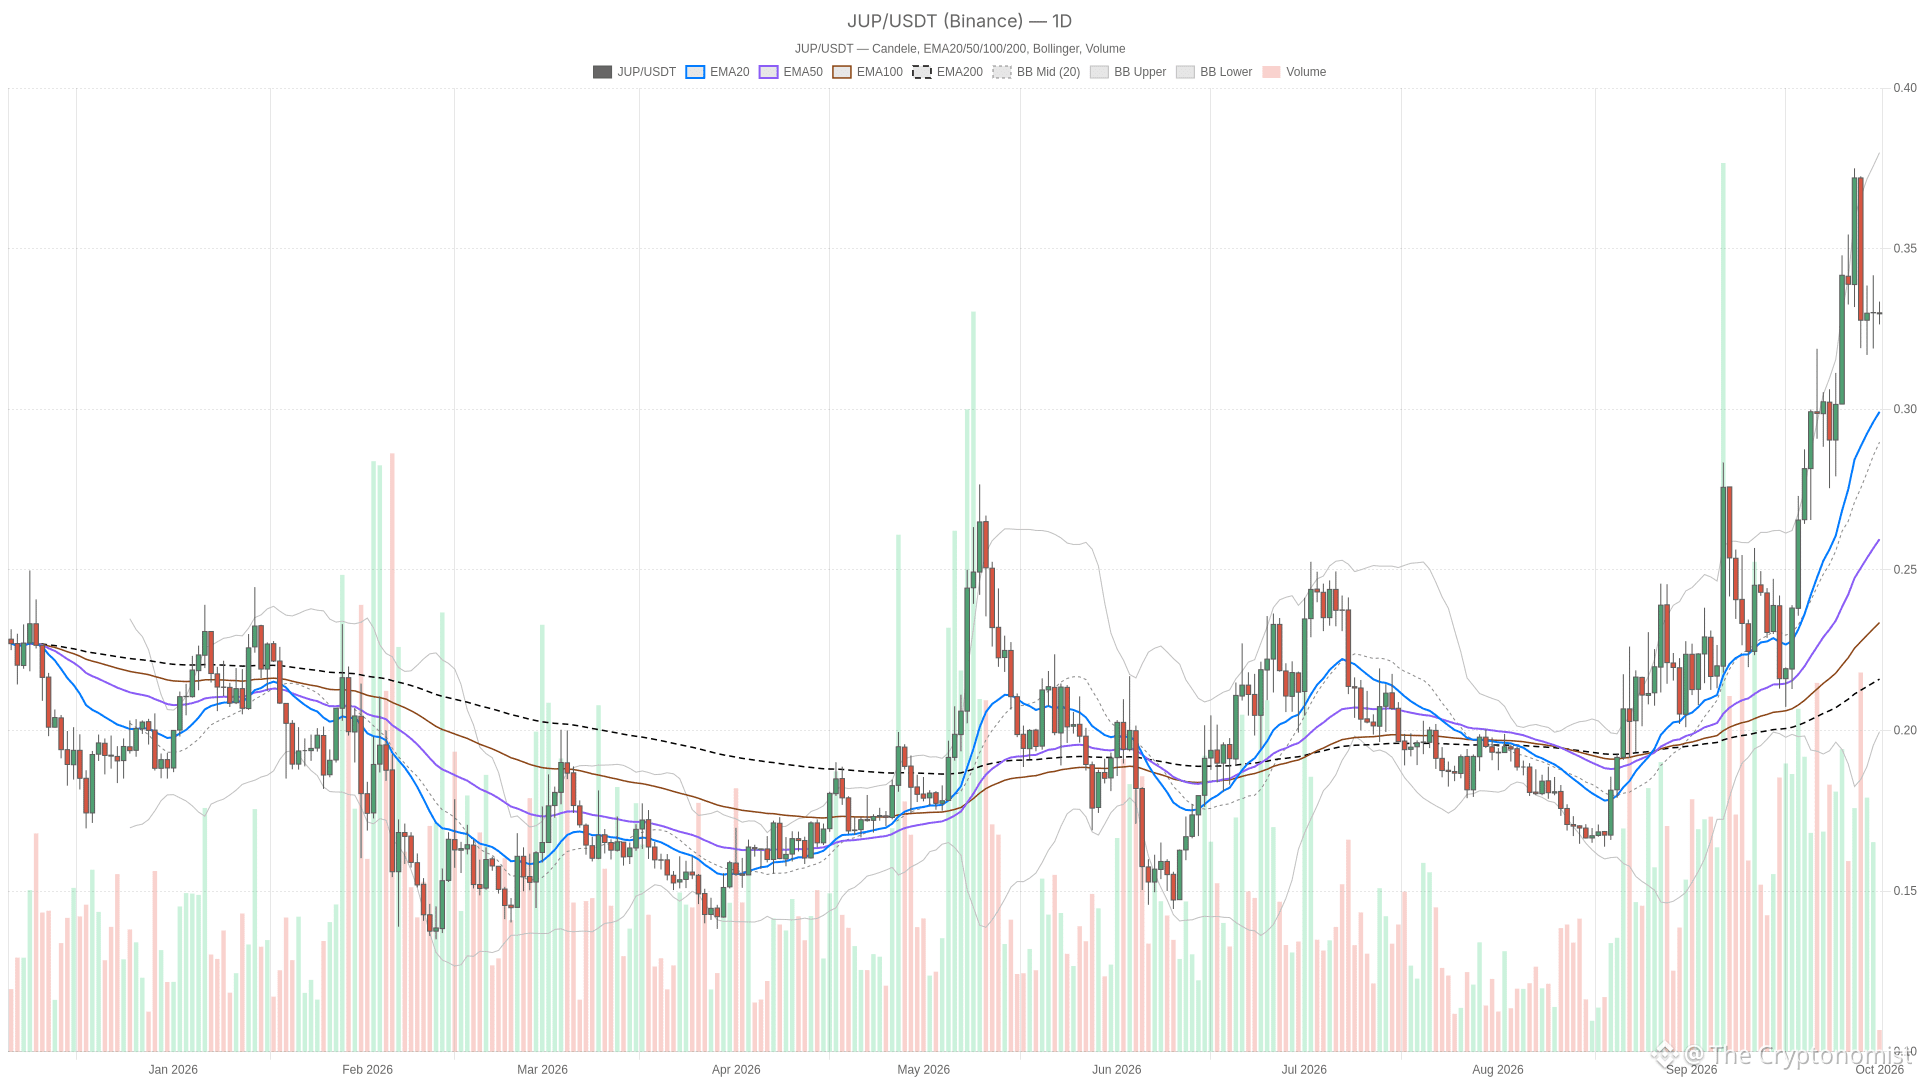
Криптовалюта Jupiter притормаживает у ключевого пивота: бычий тренд ждёт пробояПо состоянию на 1 октября 2026 года криптовалюта Jupiter торгуется по $0.3297, практически точно находясь на своей дневной точке пивот после многонедельного роста выше каждой ключевой скользящей средней. Такое положение указывает на момент принятия решения: долгосрочный тренд уже понятен, но краткосрочные графики рассказывают более спокойную и осторожную историю.
JUP/USDT — дневной график с японскими свечами, EMA20/EMA50 и объёмом.
Ключевые выводы
JUP торгуется по $0.3297, находясь точно на своей дневной точке пивот по состоянию на 1 октября 2026 года
Дневной тренд уверенно бычий: цена находится выше всех основных скользящих средних
Криптовалюта Jupiter притормаживает у ключевого пивота: бычий тренд ждёт пробоя
По состоянию на 1 октября 2026 года криптовалюта Jupiter торгуется по $0.3297, практически точно находясь на своей дневной точке пивот после многонедельного роста выше каждой ключевой скользящей средней. Такое положение указывает на момент принятия решения: долгосрочный тренд уже понятен, но краткосрочные графики рассказывают более спокойную и осторожную историю.
JUP/USDT — дневной график с японскими свечами, EMA20/EMA50 и объёмом.
Ключевые выводы
JUP торгуется по $0.3297, находясь точно на своей дневной точке пивот по состоянию на 1 октября 2026 года
Дневной тренд уверенно бычий: цена находится выше всех основных скользящих средних
JUP/USDT — дневной график с японскими свечами, EMA20/EMA50 и объёмом.
Ключевые выводы
JUP торгуется по $0.3297, находясь точно на своей дневной точке пивот по состоянию на 1 октября 2026 года
Дневной тренд уверенно бычий: цена находится выше всех основных скользящих средних
89

Статья
Выход валидаторов Ethereum MetaMask завершится к 7 октября после инцидента безопасностиMetaMask начал выводить валидаторов Ethereum из обслуживания 30 сентября 2026 года после того, как отметил инцидент безопасности внутри части своей инфраструктуры. Выход валидаторов Ethereum MetaMask теперь идет по сжатому графику: Lido — протокол стейкинга, на котором размещены затронутые валидаторы, — ожидает, что последние из них завершат выход к 7 октября 2026 года. Компания утверждает, что признаков того, что сами кошельки MetaMask находятся под угрозой, нет, однако этот эпизод служит напоминанием о том, насколько быстро проблема на одном из уровней инфраструктуры может распространиться по стейкинг-экосистеме.
Выход валидаторов Ethereum MetaMask завершится к 7 октября после инцидента безопасности
MetaMask начал выводить валидаторов Ethereum из обслуживания 30 сентября 2026 года после того, как отметил инцидент безопасности внутри части своей инфраструктуры. Выход валидаторов Ethereum MetaMask теперь идет по сжатому графику: Lido — протокол стейкинга, на котором размещены затронутые валидаторы, — ожидает, что последние из них завершат выход к 7 октября 2026 года. Компания утверждает, что признаков того, что сами кошельки MetaMask находятся под угрозой, нет, однако этот эпизод служит напоминанием о том, насколько быстро проблема на одном из уровней инфраструктуры может распространиться по стейкинг-экосистеме.
105
Статья
Сообщество Zcash одобрило $8.39M ретроактивных грантов на исправление уязвимостиСообщество Zcash одобрило примерно $8.39 миллиона в ретроактивных грантах — решение, направленное на компенсацию разработчиков и исследователей безопасности, которые в спешном порядке пытались устранить критическую уязвимость в протоколе Orchard сети. Сооснователь Zcash Зукo Вилкокс подтвердил результаты голосования, в ходе которого были рассмотрены 17 отдельных предложений о финансировании, связанных с исправлением этой уязвимости и более масштабными усилиями по обновлению Ironwood.
Ключевые выводы
Сообщество Zcash одобрило примерно $8.39 миллиона в ретроактивных грантах по 17 предложениям.
Сообщество Zcash одобрило $8.39M ретроактивных грантов на исправление уязвимости
Сообщество Zcash одобрило примерно $8.39 миллиона в ретроактивных грантах — решение, направленное на компенсацию разработчиков и исследователей безопасности, которые в спешном порядке пытались устранить критическую уязвимость в протоколе Orchard сети. Сооснователь Zcash Зукo Вилкокс подтвердил результаты голосования, в ходе которого были рассмотрены 17 отдельных предложений о финансировании, связанных с исправлением этой уязвимости и более масштабными усилиями по обновлению Ironwood.
Ключевые выводы
Сообщество Zcash одобрило примерно $8.39 миллиона в ретроактивных грантах по 17 предложениям.
Ключевые выводы
Сообщество Zcash одобрило примерно $8.39 миллиона в ретроактивных грантах по 17 предложениям.
100
Статья
ИИ Gemini 4 Argon от Google нашёл уязвимость в больничном ПО, которую пропустили другие моделиGoogle приоткрыл завесу над Gemini 4 Argon — новым флагманским ИИ-моделем, который, по словам компании, превосходит своих предшественников в разработке программного обеспечения, корпоративной работе с знаниями и киберзащите. Alphabet представила систему в среду, 30 сентября 2026 года, начав с ограниченной группы проверенных киберпартнёров, а не с полноценного публичного запуска. Этот шаг стал самым значительным со стороны компании продвижением к тому, что она называет интеллектом уровня frontier (передовой рубеж). Он сделан в момент, когда Google испытывает давление, чтобы доказать, что её модели могут соответствовать конкурентам в реальных задачах повышенной важности.
ИИ Gemini 4 Argon от Google нашёл уязвимость в больничном ПО, которую пропустили другие модели
Google приоткрыл завесу над Gemini 4 Argon — новым флагманским ИИ-моделем, который, по словам компании, превосходит своих предшественников в разработке программного обеспечения, корпоративной работе с знаниями и киберзащите. Alphabet представила систему в среду, 30 сентября 2026 года, начав с ограниченной группы проверенных киберпартнёров, а не с полноценного публичного запуска. Этот шаг стал самым значительным со стороны компании продвижением к тому, что она называет интеллектом уровня frontier (передовой рубеж). Он сделан в момент, когда Google испытывает давление, чтобы доказать, что её модели могут соответствовать конкурентам в реальных задачах повышенной важности.
77

Статья
Акции United Therapeutics подскакивают более чем на 12% в течение дня: RSI сигнализирует о перекупленностиАкции United Therapeutics переживают бурную сессию. На 14:20 по восточному времени в среду, 30 сентября, акции торговались на уровне $540.54, что на 12.27% выше, чем цена закрытия $481.47 29 сентября. Это необычно сильный ценовой размах для биотеха, который Уолл-стрит обычно рассматривает как стабильную историю денежного потока, и к этому стоит присмотреться внимательнее, прежде чем кто-то решит, что тренд просто продолжается.
UTHR — дневной график со свечами, EMA20/EMA50 и объёмом.
Ключевые выводы
Акции United Therapeutics подскочили на 12.27% в течение дня, торгуясь на уровне $540.54 на 14:20 по восточному времени в среду, 30 сентября, при объёме 148,921 акций.
Акции United Therapeutics подскакивают более чем на 12% в течение дня: RSI сигнализирует о перекупленности
Акции United Therapeutics переживают бурную сессию. На 14:20 по восточному времени в среду, 30 сентября, акции торговались на уровне $540.54, что на 12.27% выше, чем цена закрытия $481.47 29 сентября. Это необычно сильный ценовой размах для биотеха, который Уолл-стрит обычно рассматривает как стабильную историю денежного потока, и к этому стоит присмотреться внимательнее, прежде чем кто-то решит, что тренд просто продолжается.
UTHR — дневной график со свечами, EMA20/EMA50 и объёмом.
Ключевые выводы
Акции United Therapeutics подскочили на 12.27% в течение дня, торгуясь на уровне $540.54 на 14:20 по восточному времени в среду, 30 сентября, при объёме 148,921 акций.
UTHR — дневной график со свечами, EMA20/EMA50 и объёмом.
Ключевые выводы
Акции United Therapeutics подскочили на 12.27% в течение дня, торгуясь на уровне $540.54 на 14:20 по восточному времени в среду, 30 сентября, при объёме 148,921 акций.
12
Статья
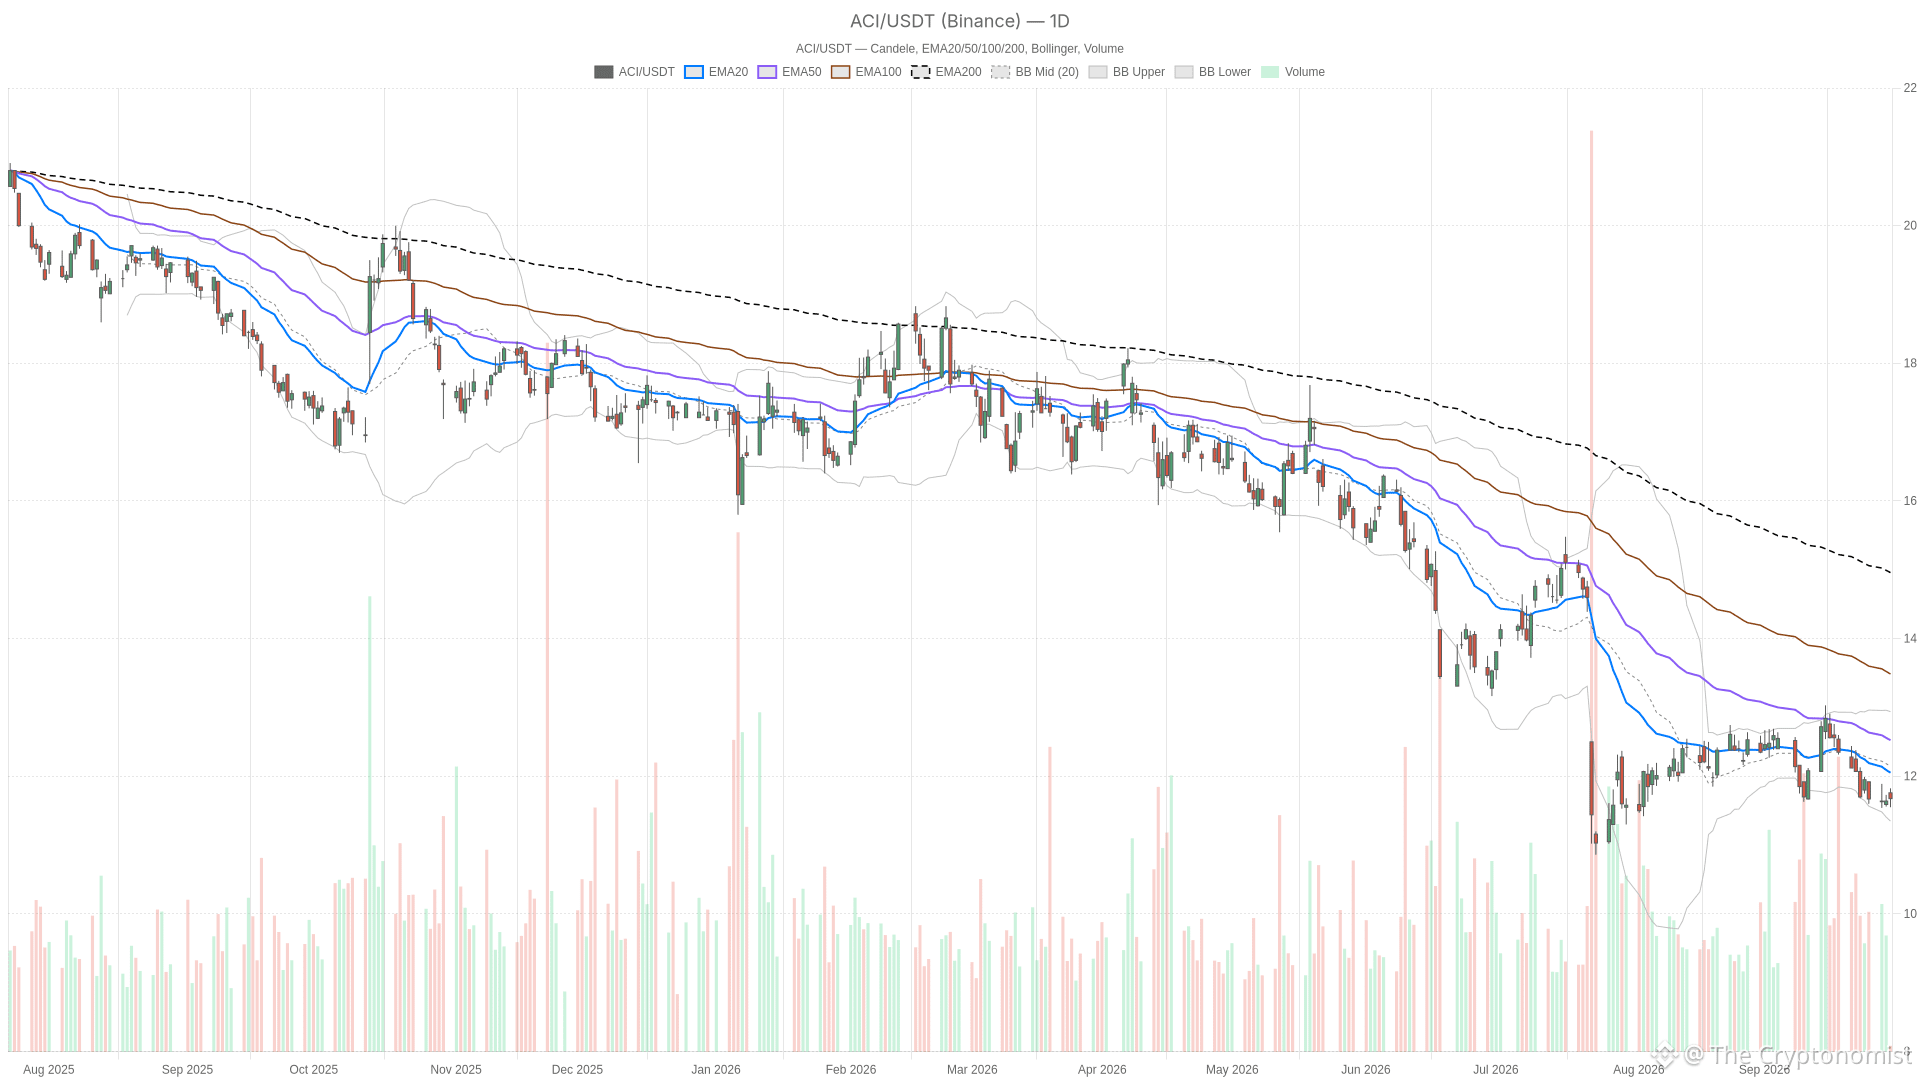
Акции Albertsons Companies подрастают на 0.3%, но медвежий тренд удерживает контрольАкции Albertsons Companies (ACI) торговались на уровне $11.675 по состоянию на 14:21 по восточному времени в среду, 30 сентября 2026 года, прибавив 0.3% по сравнению с предыдущим закрытием $11.64. Небольшой рост не меняет более широкую медвежью структуру: цена по-прежнему находится значительно ниже каждой ключевой скользящей средней.
ACI — дневной график со свечами, EMA20/EMA50 и объемом.
Ключевые выводы
Акции Albertsons Companies торгуются на уровне $11.675, сохраняя медвежью структуру ниже всех ключевых скользящих средних.
Дневной RSI на уровне 40.43 и отрицательный MACD подтверждают, что нисходящий импульс сохраняется.
Акции Albertsons Companies подрастают на 0.3%, но медвежий тренд удерживает контроль
Акции Albertsons Companies (ACI) торговались на уровне $11.675 по состоянию на 14:21 по восточному времени в среду, 30 сентября 2026 года, прибавив 0.3% по сравнению с предыдущим закрытием $11.64. Небольшой рост не меняет более широкую медвежью структуру: цена по-прежнему находится значительно ниже каждой ключевой скользящей средней.
ACI — дневной график со свечами, EMA20/EMA50 и объемом.
Ключевые выводы
Акции Albertsons Companies торгуются на уровне $11.675, сохраняя медвежью структуру ниже всех ключевых скользящих средних.
Дневной RSI на уровне 40.43 и отрицательный MACD подтверждают, что нисходящий импульс сохраняется.
ACI — дневной график со свечами, EMA20/EMA50 и объемом.
Ключевые выводы
Акции Albertsons Companies торгуются на уровне $11.675, сохраняя медвежью структуру ниже всех ключевых скользящих средних.
Дневной RSI на уровне 40.43 и отрицательный MACD подтверждают, что нисходящий импульс сохраняется.
13
Статья
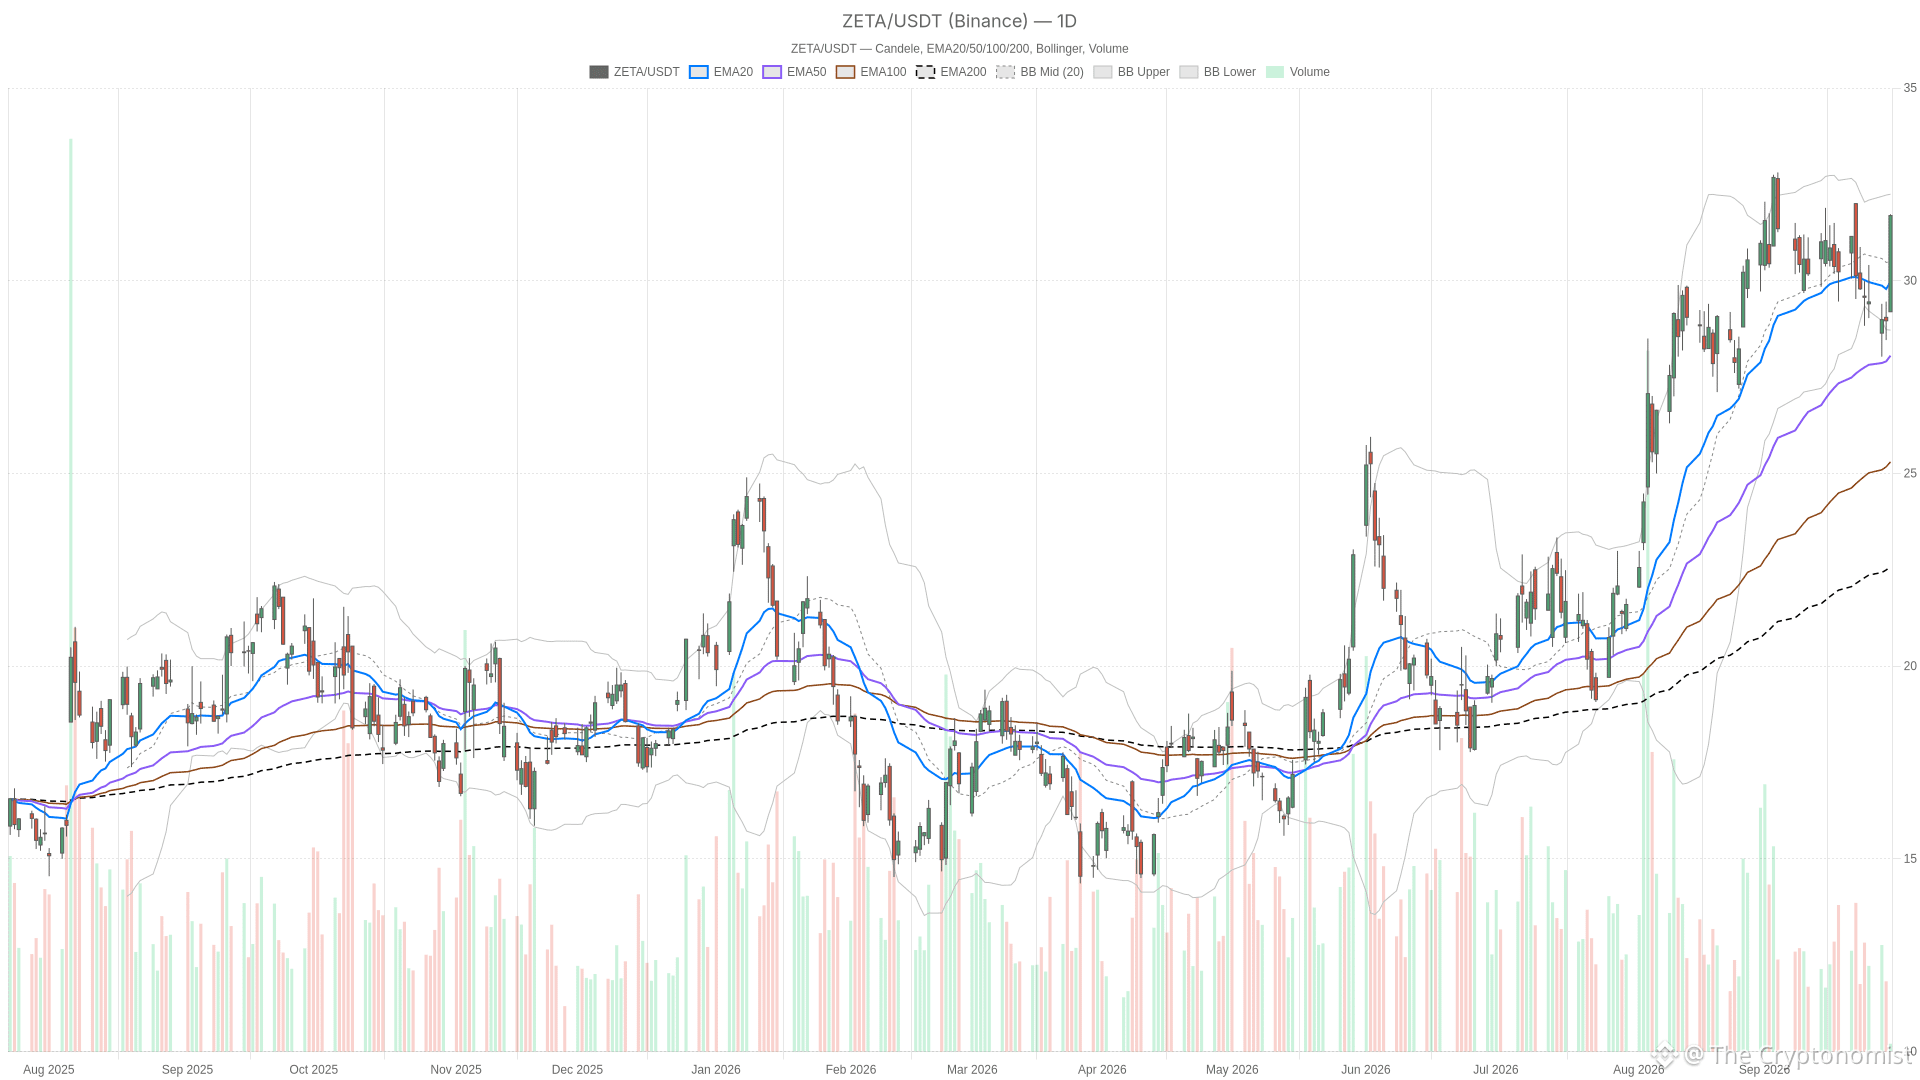
Акции Zeta Global подскакивают на 9.43% в течение дня, демонстрируют сигналы перекупленностиАкции Zeta Global торговались на уровне $31.69 по состоянию на 14:19 по восточному времени в среду, 30 сентября 2026 года, что на 9.43% выше по сравнению с предыдущим закрытием — $28.96. Ралли поднимает цену выше всех основных дневных скользящих средних и подтверждает бычью структуру, формирующуюся на протяжении нескольких недель. Тем не менее сигналы импульса на разных временных интервалах сейчас указывают на состояние перекупленности.
ZETA — дневной график с свечами, EMA20/EMA50 и объемом.
Ключевые выводы
Акции Zeta Global взлетели на 9.43% в течение дня до $31.69, поднявшись выше всех основных дневных скользящих средних.
Дневная укладка EMA — цена выше 20-дневной EMA на уровне $29.97, выше 50-дневной EMA на уровне $28.06 и выше 200-дневной EMA на уровне $22.79 — подтверждает классический бычий тренд.
Акции Zeta Global подскакивают на 9.43% в течение дня, демонстрируют сигналы перекупленности
Акции Zeta Global торговались на уровне $31.69 по состоянию на 14:19 по восточному времени в среду, 30 сентября 2026 года, что на 9.43% выше по сравнению с предыдущим закрытием — $28.96. Ралли поднимает цену выше всех основных дневных скользящих средних и подтверждает бычью структуру, формирующуюся на протяжении нескольких недель. Тем не менее сигналы импульса на разных временных интервалах сейчас указывают на состояние перекупленности.
ZETA — дневной график с свечами, EMA20/EMA50 и объемом.
Ключевые выводы
Акции Zeta Global взлетели на 9.43% в течение дня до $31.69, поднявшись выше всех основных дневных скользящих средних.
Дневная укладка EMA — цена выше 20-дневной EMA на уровне $29.97, выше 50-дневной EMA на уровне $28.06 и выше 200-дневной EMA на уровне $22.79 — подтверждает классический бычий тренд.
ZETA — дневной график с свечами, EMA20/EMA50 и объемом.
Ключевые выводы
Акции Zeta Global взлетели на 9.43% в течение дня до $31.69, поднявшись выше всех основных дневных скользящих средних.
Дневная укладка EMA — цена выше 20-дневной EMA на уровне $29.97, выше 50-дневной EMA на уровне $28.06 и выше 200-дневной EMA на уровне $22.79 — подтверждает классический бычий тренд.
88
Статья
Акции The Generation Essentials Group выросли на 80% за день: RSI сигнализирует о перекупленностиАкции The Generation Essentials Group (TGE) резко взлетели в ходе драматичного события высокой волатильности в среду. По состоянию на 14:17 по восточному времени (ET) 30 сентября 2026 года акции торговались по $1.495, что на 80,12% выше цены закрытия накануне — $0.83. Объем торгов превысил 168 389 984 акций.
TGE — дневной график с японскими свечами, EMA20/EMA50 и объемом.
Ключевые выводы
Акции TGE выросли на 80,12% в течение дня: к 14:17 по ET 30 сентября 2026 года они торговались на уровне $1.495 при объеме 168,39 млн акций.
Дневной RSI14 достиг 85,95, глубоко на территории перекупленности, при этом цена торговалась значительно выше верхней полосы Боллинджера на уровне $1.18.
Акции The Generation Essentials Group выросли на 80% за день: RSI сигнализирует о перекупленности
Акции The Generation Essentials Group (TGE) резко взлетели в ходе драматичного события высокой волатильности в среду. По состоянию на 14:17 по восточному времени (ET) 30 сентября 2026 года акции торговались по $1.495, что на 80,12% выше цены закрытия накануне — $0.83. Объем торгов превысил 168 389 984 акций.
TGE — дневной график с японскими свечами, EMA20/EMA50 и объемом.
Ключевые выводы
Акции TGE выросли на 80,12% в течение дня: к 14:17 по ET 30 сентября 2026 года они торговались на уровне $1.495 при объеме 168,39 млн акций.
Дневной RSI14 достиг 85,95, глубоко на территории перекупленности, при этом цена торговалась значительно выше верхней полосы Боллинджера на уровне $1.18.
TGE — дневной график с японскими свечами, EMA20/EMA50 и объемом.
Ключевые выводы
Акции TGE выросли на 80,12% в течение дня: к 14:17 по ET 30 сентября 2026 года они торговались на уровне $1.495 при объеме 168,39 млн акций.
Дневной RSI14 достиг 85,95, глубоко на территории перекупленности, при этом цена торговалась значительно выше верхней полосы Боллинджера на уровне $1.18.
10
Статья
Акции ImmunityBio взлетели более чем на 10% до $9,735: дневной тренд стал бычьимАкции ImmunityBio подскочили на 10,25% в среду, торгуясь на уровне $9,735 по состоянию на 14:04 по восточному времени (ET). Объем достиг 1 030 971 акции. Ралли вывело акции к недавним внутридневным максимумам без сопутствующего новостного триггера. Дневной график подтверждает бычий фон.
IBRX — дневной график с японскими свечами, EMA20/EMA50 и объемом.
Ключевые выводы
Акции ImmunityBio выросли на 10,25% до $9,735, достигнув максимальных внутридневных уровней за последние сессии.
Ежедневный кластер EMA полностью бычий: цена находится выше EMA за 20, 50 и 200 торговых сессий.
Акции ImmunityBio взлетели более чем на 10% до $9,735: дневной тренд стал бычьим
Акции ImmunityBio подскочили на 10,25% в среду, торгуясь на уровне $9,735 по состоянию на 14:04 по восточному времени (ET). Объем достиг 1 030 971 акции. Ралли вывело акции к недавним внутридневным максимумам без сопутствующего новостного триггера. Дневной график подтверждает бычий фон.
IBRX — дневной график с японскими свечами, EMA20/EMA50 и объемом.
Ключевые выводы
Акции ImmunityBio выросли на 10,25% до $9,735, достигнув максимальных внутридневных уровней за последние сессии.
Ежедневный кластер EMA полностью бычий: цена находится выше EMA за 20, 50 и 200 торговых сессий.
IBRX — дневной график с японскими свечами, EMA20/EMA50 и объемом.
Ключевые выводы
Акции ImmunityBio выросли на 10,25% до $9,735, достигнув максимальных внутридневных уровней за последние сессии.
Ежедневный кластер EMA полностью бычий: цена находится выше EMA за 20, 50 и 200 торговых сессий.
IBRXUS-2,68%
16
Войдите, чтобы посмотреть больше материала
Присоединяйтесь к пользователям криптовалют по всему миру на Binance Square
⚡️ Получайте новейшую и полезную информацию о криптоактивах.
💬 Нам доверяет крупнейшая в мире криптобиржа.
👍 Получите достоверные аналитические данные от верифицированных создателей контента.
Эл. почта/номер телефона
В тренде
fomcотслеживание
Просмотров: 45,109
383 обсуждают
Когда все ждут FOMC я просто соблюдаю правило 2%
Сегодня все вокруг сходят с ума. ФРС, ставки, волатильность. Толпа гадает, куда полетит BTC. Кто-то заходит на всю котлету с плечом x50, чтобы «поймать движение».
А я в такие дни просто наблюдаю. Потому что знаю: в моменты новостей рынок убивает не только тех, кто угадал не то направление. Он убивает тех, кто рискует слишком много.
Если ты поставил на кон больше 2% от депозита, ты не трейдер. Ты игрок в казино, который надеется на удачу.
Мой совет на сегодня простой, не торгуй на новостях. Если уже в позиции проверь свои стопы. Если нет сиди в стороне. Рынок никуда не убежит.
А вы как переживаете FOMC? Сидите в стороне или ловите волатильность? Пишите в комментариях.
$BTC $ETH #fomcотслеживание #рискменеджмент #крипта #психология
KeylessMind
·Лайков: 1
·Просмотров: 685
ПротоколFOMC
Просмотров: 34,812
157 обсуждают
EtherGains70.9%InQ3
Просмотров: 11,971
259 обсуждают