

minamium
11.8k Публикации

minamium
Отправить жалобу
Заблокировать пользователя
1 подписок(и/а)
99 подписчиков(а)
375 понравилось
Посты
·
--
См. перевод
everyone thinks $BTC printing its strongest weekly close in eight months confirms a real breakout, but actually this looks like another trap ready to wreck late longs.
getting wrecked fomoing into these strong closes then watching it reverse is too common. you buy the pump and have no idea when to exit as it dumps back into the range.
$BTC just printed that strongest weekly close in eight months. ngl ser the numbers look decent on paper but this case study of the current chart shows mixed signals with $ETH not confirming the move and $SOL lagging hard.
we've seen this exact liquidity grab setup before. volume isn't backing a clean continuation either.
where do you think this goes from here?
#Bitcoin #Crypto #Trading
everyone thinks $BTC printing its strongest weekly close in eight months confirms a real breakout, but actually this looks like another trap ready to wreck late longs.
getting wrecked fomoing into these strong closes then watching it reverse is too common. you buy the pump and have no idea when to exit as it dumps back into the range.
$BTC just printed that strongest weekly close in eight months. ngl ser the numbers look decent on paper but this case study of the current chart shows mixed signals with $ETH not confirming the move and $SOL lagging hard.
we've seen this exact liquidity grab setup before. volume isn't backing a clean continuation either.
where do you think this goes from here?
#Bitcoin #Crypto #Trading
getting wrecked fomoing into these strong closes then watching it reverse is too common. you buy the pump and have no idea when to exit as it dumps back into the range.
$BTC just printed that strongest weekly close in eight months. ngl ser the numbers look decent on paper but this case study of the current chart shows mixed signals with $ETH not confirming the move and $SOL lagging hard.
we've seen this exact liquidity grab setup before. volume isn't backing a clean continuation either.
where do you think this goes from here?
#Bitcoin #Crypto #Trading

41
·
--
См. перевод
If you're still waiting for $BTC to crash harder before you buy, stop now.
Traders who hesitate like this often miss the real opportunity and end up chasing after the move starts, locking in worse prices.
The Power Law Oscillator shows $BTC trading well below its long term regression trend. With readings near +34.5K, Bitcoin looks significantly undervalued versus the model's path.
Some will say power law models are too simplistic for current conditions and $BTC could stay undervalued longer. I lean the other way because historically these extreme deviations have preceded stronger upside, which could lift $ETH as well.
Where do you think this goes from here?
#Bitcoin #BTC #Crypto
If you're still waiting for $BTC to crash harder before you buy, stop now.
Traders who hesitate like this often miss the real opportunity and end up chasing after the move starts, locking in worse prices.
The Power Law Oscillator shows $BTC trading well below its long term regression trend. With readings near +34.5K, Bitcoin looks significantly undervalued versus the model's path.
Some will say power law models are too simplistic for current conditions and $BTC could stay undervalued longer. I lean the other way because historically these extreme deviations have preceded stronger upside, which could lift $ETH as well.
Where do you think this goes from here?
#Bitcoin #BTC #Crypto
Traders who hesitate like this often miss the real opportunity and end up chasing after the move starts, locking in worse prices.
The Power Law Oscillator shows $BTC trading well below its long term regression trend. With readings near +34.5K, Bitcoin looks significantly undervalued versus the model's path.
Some will say power law models are too simplistic for current conditions and $BTC could stay undervalued longer. I lean the other way because historically these extreme deviations have preceded stronger upside, which could lift $ETH as well.
Where do you think this goes from here?
#Bitcoin #BTC #Crypto
79
·
--
все думают, что настоящий ход — искать микрокапы с потенциалом x50 до конца цикла, но на деле ты просто сливаешь свой стек, пока институционалы тихо прибирают к рукам реальные запасы.
большинство розничных трейдеров попадает под раздачу, гоняясь за зелёными свечами и переключаясь на пустышки, потому что холдить кажется слишком скучным. в итоге они остаются с пустыми портфелями прямо перед макропробоем.
Сэйлор только что назвал следующие 10 лет настоящей золотой лихорадкой для $BTC, и, если честно, цифры это подтверждают, сэр. пока все отвлекаются на азартные ставки на краткосрочные пампы, корпоративные казначейства и эмитенты ETF рассматривают это десятилетие как период активного накопления. они скупают каждый пролив и блокируют ликвидное предложение быстрее, чем майнеры успевают его добывать.
если посмотреть, как MicroStrategy наращивала свой стек, её стратегия никогда не заключалась в том, чтобы угадывать локальные пики или ловить быстрые отскоки в $ETH или $SOL. всё сводилось к тому, чтобы заранее распознать захват рынка институционалами и не дать волатильности выбить себя из позиции. розничные трейдеры всё пытаются переиграть рынок, вместо того чтобы просто опередить самый очевидный макротрейд в нашей жизни.
как ты собираешься позиционировать свой спотовый портфель на эти 10 лет?
#Bitcoin #Crypto #Binance
все думают, что настоящий ход — искать микрокапы с потенциалом x50 до конца цикла, но на деле ты просто сливаешь свой стек, пока институционалы тихо прибирают к рукам реальные запасы.
большинство розничных трейдеров попадает под раздачу, гоняясь за зелёными свечами и переключаясь на пустышки, потому что холдить кажется слишком скучным. в итоге они остаются с пустыми портфелями прямо перед макропробоем.
Сэйлор только что назвал следующие 10 лет настоящей золотой лихорадкой для $BTC , и, если честно, цифры это подтверждают, сэр. пока все отвлекаются на азартные ставки на краткосрочные пампы, корпоративные казначейства и эмитенты ETF рассматривают это десятилетие как период активного накопления. они скупают каждый пролив и блокируют ликвидное предложение быстрее, чем майнеры успевают его добывать.
если посмотреть, как MicroStrategy наращивала свой стек, её стратегия никогда не заключалась в том, чтобы угадывать локальные пики или ловить быстрые отскоки в $ETH или $SOL . всё сводилось к тому, чтобы заранее распознать захват рынка институционалами и не дать волатильности выбить себя из позиции. розничные трейдеры всё пытаются переиграть рынок, вместо того чтобы просто опередить самый очевидный макротрейд в нашей жизни.
как ты собираешься позиционировать свой спотовый портфель на эти 10 лет?
#Bitcoin #Crypto #Binance
большинство розничных трейдеров попадает под раздачу, гоняясь за зелёными свечами и переключаясь на пустышки, потому что холдить кажется слишком скучным. в итоге они остаются с пустыми портфелями прямо перед макропробоем.
Сэйлор только что назвал следующие 10 лет настоящей золотой лихорадкой для $BTC , и, если честно, цифры это подтверждают, сэр. пока все отвлекаются на азартные ставки на краткосрочные пампы, корпоративные казначейства и эмитенты ETF рассматривают это десятилетие как период активного накопления. они скупают каждый пролив и блокируют ликвидное предложение быстрее, чем майнеры успевают его добывать.
если посмотреть, как MicroStrategy наращивала свой стек, её стратегия никогда не заключалась в том, чтобы угадывать локальные пики или ловить быстрые отскоки в $ETH или $SOL . всё сводилось к тому, чтобы заранее распознать захват рынка институционалами и не дать волатильности выбить себя из позиции. розничные трейдеры всё пытаются переиграть рынок, вместо того чтобы просто опередить самый очевидный макротрейд в нашей жизни.
как ты собираешься позиционировать свой спотовый портфель на эти 10 лет?
#Bitcoin #Crypto #Binance

·
--
См. перевод
Have you noticed how protocols flashing 18,000% TVL growth get all the attention while more realistic moves get ignored?
Traders keep FOMO buying these stories and end up losing money when the tiny starting base becomes obvious. It is a reliable way to get caught in dumps after the hype fades.
AllLayer $ALL saw its TVL climb 18,851% in seven days. Question that number first. Extreme jumps like this almost always start from almost nothing, not a genuine inflection.
Shibarium $SHIB grew 165% from a much stronger base, which actually signals traction. When these headlines appear, check the absolute TVL before anything else. A massive percent from a few thousand dollars is still small money.
Then confirm if it is real demand or just incentives flowing through $ETH. The difference between hype and signal is in those details.
What's your take on these TVL explosions?
#DeFi #TVL #Crypto
Have you noticed how protocols flashing 18,000% TVL growth get all the attention while more realistic moves get ignored?
Traders keep FOMO buying these stories and end up losing money when the tiny starting base becomes obvious. It is a reliable way to get caught in dumps after the hype fades.
AllLayer $ALL saw its TVL climb 18,851% in seven days. Question that number first. Extreme jumps like this almost always start from almost nothing, not a genuine inflection.
Shibarium $SHIB grew 165% from a much stronger base, which actually signals traction. When these headlines appear, check the absolute TVL before anything else. A massive percent from a few thousand dollars is still small money.
Then confirm if it is real demand or just incentives flowing through $ETH . The difference between hype and signal is in those details.
What's your take on these TVL explosions?
#DeFi #TVL #Crypto
Traders keep FOMO buying these stories and end up losing money when the tiny starting base becomes obvious. It is a reliable way to get caught in dumps after the hype fades.
AllLayer $ALL saw its TVL climb 18,851% in seven days. Question that number first. Extreme jumps like this almost always start from almost nothing, not a genuine inflection.
Shibarium $SHIB grew 165% from a much stronger base, which actually signals traction. When these headlines appear, check the absolute TVL before anything else. A massive percent from a few thousand dollars is still small money.
Then confirm if it is real demand or just incentives flowing through $ETH . The difference between hype and signal is in those details.
What's your take on these TVL explosions?
#DeFi #TVL #Crypto

·
--
Почему никто не говорит о том, что просадки спотовых ETF на биткоин на самом деле выявляют неуверенность частных инвесторов, а не уход институциональных игроков?
Большинство трейдеров в панике продают при первых признаках оттока средств, а через несколько дней наблюдают, как институциональные покупатели незаметно скупают активы со скидкой. Вы теряете деньги, пытаясь уловить краткосрочный шум и одновременно управлять рисками по таким активам, как $BTC , и высоковолатильным инструментам вроде $NEAR.
Мейнстримный нарратив предполагает, что отток средств из ETF означает разворот макротренда. Посмотрите на недавние потоки: институциональные игроки воспринимают такие откаты как возможность получить ликвидность и незаметно ребалансируют портфели, пока настроения прочно остаются в зоне «жадности». Розничные инвесторы вливают ликвидность в книгу заявок, а пассивные распределения средств с балансов поглощают объёмы в парах с $USDT без малейшей спешки.
Когда институциональные продукты проседают, это проверяет, действительно ли держатели спотовых активов понимают структуру рынка или просто следят за заголовками о ежедневном чистом притоке средств.
Вы используете эти просадки ETF, чтобы накапливать активы, или ждёте подтверждения на более высоких уровнях?
#BitcoinSpotETFsDraw #FedOctoberHoldOdds82 #Nikkei225Jumps2
Почему никто не говорит о том, что просадки спотовых ETF на биткоин на самом деле выявляют неуверенность частных инвесторов, а не уход институциональных игроков?
Большинство трейдеров в панике продают при первых признаках оттока средств, а через несколько дней наблюдают, как институциональные покупатели незаметно скупают активы со скидкой. Вы теряете деньги, пытаясь уловить краткосрочный шум и одновременно управлять рисками по таким активам, как $BTC , и высоковолатильным инструментам вроде $NEAR .
Мейнстримный нарратив предполагает, что отток средств из ETF означает разворот макротренда. Посмотрите на недавние потоки: институциональные игроки воспринимают такие откаты как возможность получить ликвидность и незаметно ребалансируют портфели, пока настроения прочно остаются в зоне «жадности». Розничные инвесторы вливают ликвидность в книгу заявок, а пассивные распределения средств с балансов поглощают объёмы в парах с $USDT без малейшей спешки.
Когда институциональные продукты проседают, это проверяет, действительно ли держатели спотовых активов понимают структуру рынка или просто следят за заголовками о ежедневном чистом притоке средств.
Вы используете эти просадки ETF, чтобы накапливать активы, или ждёте подтверждения на более высоких уровнях?
#BitcoinSpotETFsDraw #FedOctoberHoldOdds82 #Nikkei225Jumps2
Большинство трейдеров в панике продают при первых признаках оттока средств, а через несколько дней наблюдают, как институциональные покупатели незаметно скупают активы со скидкой. Вы теряете деньги, пытаясь уловить краткосрочный шум и одновременно управлять рисками по таким активам, как $BTC , и высоковолатильным инструментам вроде $NEAR .
Мейнстримный нарратив предполагает, что отток средств из ETF означает разворот макротренда. Посмотрите на недавние потоки: институциональные игроки воспринимают такие откаты как возможность получить ликвидность и незаметно ребалансируют портфели, пока настроения прочно остаются в зоне «жадности». Розничные инвесторы вливают ликвидность в книгу заявок, а пассивные распределения средств с балансов поглощают объёмы в парах с $USDT без малейшей спешки.
Когда институциональные продукты проседают, это проверяет, действительно ли держатели спотовых активов понимают структуру рынка или просто следят за заголовками о ежедневном чистом притоке средств.
Вы используете эти просадки ETF, чтобы накапливать активы, или ждёте подтверждения на более высоких уровнях?
#BitcoinSpotETFsDraw #FedOctoberHoldOdds82 #Nikkei225Jumps2
1
·
--
См. перевод
Everyone thinks an 82 percent chance the Fed holds rates in October is a green light for crypto, but actually that is when a lot of traders get quietly wrecked.
You have seen this movie. The odds climb, people load the boat on $BTC and $ETH expecting a relief bounce, then the actual print or the press conference does the opposite and weeks of gains vanish in one session.
A hold is not a cut. Think of it like your landlord deciding not to raise the rent this month. Your payment stays high. You do not suddenly have extra cash to throw at every alt. High rates still make sitting in $USDT look more rational than chasing the next bounce, especially while greed is already at 67.
The second trap is treating 82 percent like fresh news. By the time the number is that high, positioning is already done. Buying the headline is like showing up to dinner after everyone else has eaten. The third mistake is ignoring the words around the decision. They can hold rates and still sound hawkish, and that tone often hits $BTC harder than the hold itself.
What's your plan if they hold but the language stays tight?
#FedOctoberHoldOdds82 #BitcoinSpotETFsDraw #CircleMints
Everyone thinks an 82 percent chance the Fed holds rates in October is a green light for crypto, but actually that is when a lot of traders get quietly wrecked.
You have seen this movie. The odds climb, people load the boat on $BTC and $ETH expecting a relief bounce, then the actual print or the press conference does the opposite and weeks of gains vanish in one session.
A hold is not a cut. Think of it like your landlord deciding not to raise the rent this month. Your payment stays high. You do not suddenly have extra cash to throw at every alt. High rates still make sitting in $USDT look more rational than chasing the next bounce, especially while greed is already at 67.
The second trap is treating 82 percent like fresh news. By the time the number is that high, positioning is already done. Buying the headline is like showing up to dinner after everyone else has eaten. The third mistake is ignoring the words around the decision. They can hold rates and still sound hawkish, and that tone often hits $BTC harder than the hold itself.
What's your plan if they hold but the language stays tight?
#FedOctoberHoldOdds82 #BitcoinSpotETFsDraw #CircleMints
You have seen this movie. The odds climb, people load the boat on $BTC and $ETH expecting a relief bounce, then the actual print or the press conference does the opposite and weeks of gains vanish in one session.
A hold is not a cut. Think of it like your landlord deciding not to raise the rent this month. Your payment stays high. You do not suddenly have extra cash to throw at every alt. High rates still make sitting in $USDT look more rational than chasing the next bounce, especially while greed is already at 67.
The second trap is treating 82 percent like fresh news. By the time the number is that high, positioning is already done. Buying the headline is like showing up to dinner after everyone else has eaten. The third mistake is ignoring the words around the decision. They can hold rates and still sound hawkish, and that tone often hits $BTC harder than the hold itself.
What's your plan if they hold but the language stays tight?
#FedOctoberHoldOdds82 #BitcoinSpotETFsDraw #CircleMints
2
·
--
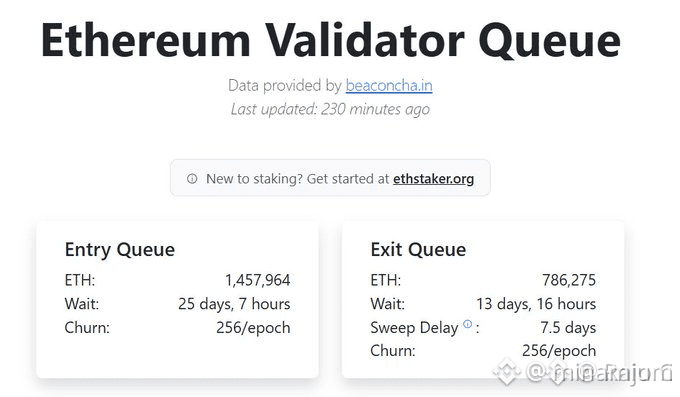
Почему все паникуют из-за растущей очереди на выход валидаторов, если это может быть самой здоровой перезагрузкой, которую $ETH видел за последние месяцы?
Розничные инвесторы снова и снова попадают в одну и ту же ловушку: паникуют и продают при каждом скачке ончейн-показателей валидаторов, принимая обычное перераспределение капитала за катастрофический крах.
Вместо того чтобы распродавать свои спотовые активы из-за громких заголовков, посмотрите, что на самом деле происходит за кулисами. Валидаторы выходят из сети по десяткам операционных причин: от перевода средств в альтернативные варианты ликвидного стейкинга до направления капитала в активные проекты экосистемы, такие как $NEAR и $ETC , в то время как настроения на рынке остаются уверенно жадными. Здесь разумный подход прост: следите за соотношением входящих и выходящих валидаторов, а не только за общим числом выходов; проверяйте, поступает ли высвободившаяся ликвидность напрямую в биржевые книги ордеров или остаётся в сети; и используйте временные просадки на фоне FUD, чтобы постепенно наращивать ключевые позиции.
Очередь на выход — естественная особенность устройства Ethereum, а не признак системного сбоя. Как думаете, куда дальше направится эта ликвидность, освободившаяся после выхода из стейкинга?
#EthStakingExitQueueHits2026High #EthereumValidatorExitQueueJumps392
Почему все паникуют из-за растущей очереди на выход валидаторов, если это может быть самой здоровой перезагрузкой, которую $ETH видел за последние месяцы?
Розничные инвесторы снова и снова попадают в одну и ту же ловушку: паникуют и продают при каждом скачке ончейн-показателей валидаторов, принимая обычное перераспределение капитала за катастрофический крах.
Вместо того чтобы распродавать свои спотовые активы из-за громких заголовков, посмотрите, что на самом деле происходит за кулисами. Валидаторы выходят из сети по десяткам операционных причин: от перевода средств в альтернативные варианты ликвидного стейкинга до направления капитала в активные проекты экосистемы, такие как $NEAR и $ETC , в то время как настроения на рынке остаются уверенно жадными. Здесь разумный подход прост: следите за соотношением входящих и выходящих валидаторов, а не только за общим числом выходов; проверяйте, поступает ли высвободившаяся ликвидность напрямую в биржевые книги ордеров или остаётся в сети; и используйте временные просадки на фоне FUD, чтобы постепенно наращивать ключевые позиции.
Очередь на выход — естественная особенность устройства Ethereum, а не признак системного сбоя. Как думаете, куда дальше направится эта ликвидность, освободившаяся после выхода из стейкинга?
#EthStakingExitQueueHits2026High #EthereumValidatorExitQueueJumps392
Розничные инвесторы снова и снова попадают в одну и ту же ловушку: паникуют и продают при каждом скачке ончейн-показателей валидаторов, принимая обычное перераспределение капитала за катастрофический крах.
Вместо того чтобы распродавать свои спотовые активы из-за громких заголовков, посмотрите, что на самом деле происходит за кулисами. Валидаторы выходят из сети по десяткам операционных причин: от перевода средств в альтернативные варианты ликвидного стейкинга до направления капитала в активные проекты экосистемы, такие как $NEAR и $ETC , в то время как настроения на рынке остаются уверенно жадными. Здесь разумный подход прост: следите за соотношением входящих и выходящих валидаторов, а не только за общим числом выходов; проверяйте, поступает ли высвободившаяся ликвидность напрямую в биржевые книги ордеров или остаётся в сети; и используйте временные просадки на фоне FUD, чтобы постепенно наращивать ключевые позиции.
Очередь на выход — естественная особенность устройства Ethereum, а не признак системного сбоя. Как думаете, куда дальше направится эта ликвидность, освободившаяся после выхода из стейкинга?
#EthStakingExitQueueHits2026High #EthereumValidatorExitQueueJumps392
6
·
--
См. перевод
Most profitable traders survive not by winning massive bets, but by refusing to size up even when a setup looks completely free.
We all know that sinking feeling of watching a runner like $BTW pump, scaling in way too heavy at the 0.8 level out of pure greed, and getting wiped out by a single wick.
Looking through 30-day top trader PnL data, you notice a recurring habit among consistent winners. One closed position locked in +7,629.47 USDT shorting $BTW on the perp side, yet the trader explicitly noted they refused to size up despite the tempting 0.8 mark. When price action barely budged with a -0.01% shift, tight risk management was the only thing protecting the downside.
When volatility picks up across momentum plays like $BTC and high-beta alts, oversized leverage turns a routine pullback into total liquidation. Protecting your principal always matters more than squeezing every last dollar out of a single move.
How do you manage position sizing when a setup looks too easy to pass up?
#CryptoTrading #RiskManagement #FuturesTrading
Most profitable traders survive not by winning massive bets, but by refusing to size up even when a setup looks completely free.
We all know that sinking feeling of watching a runner like $BTW pump, scaling in way too heavy at the 0.8 level out of pure greed, and getting wiped out by a single wick.
Looking through 30-day top trader PnL data, you notice a recurring habit among consistent winners. One closed position locked in +7,629.47 USDT shorting $BTW on the perp side, yet the trader explicitly noted they refused to size up despite the tempting 0.8 mark. When price action barely budged with a -0.01% shift, tight risk management was the only thing protecting the downside.
When volatility picks up across momentum plays like $BTC and high-beta alts, oversized leverage turns a routine pullback into total liquidation. Protecting your principal always matters more than squeezing every last dollar out of a single move.
How do you manage position sizing when a setup looks too easy to pass up?
#CryptoTrading #RiskManagement #FuturesTrading
We all know that sinking feeling of watching a runner like $BTW pump, scaling in way too heavy at the 0.8 level out of pure greed, and getting wiped out by a single wick.
Looking through 30-day top trader PnL data, you notice a recurring habit among consistent winners. One closed position locked in +7,629.47 USDT shorting $BTW on the perp side, yet the trader explicitly noted they refused to size up despite the tempting 0.8 mark. When price action barely budged with a -0.01% shift, tight risk management was the only thing protecting the downside.
When volatility picks up across momentum plays like $BTC and high-beta alts, oversized leverage turns a routine pullback into total liquidation. Protecting your principal always matters more than squeezing every last dollar out of a single move.
How do you manage position sizing when a setup looks too easy to pass up?
#CryptoTrading #RiskManagement #FuturesTrading

9
·
--
Представьте: вы просыпаетесь, проверяете свой портфель и видите, что индекс страха и жадности крипторынка застыл на отметке 69.
Большинство трейдеров видят это зелёное число и сразу чувствуют желание запрыгнуть в растущие свечи, но в итоге покупают прямо на локальном максимуме — незадолго до болезненной коррекции. Мы все через это проходили: разрывались между страхом упустить прибыль и ужасом стать теми, за чей счёт другие выходят из позиции.
В начале 2024 года, когда индекс впервые завис в этой зоне — от 69 до 75, — участники рынка воспринимали жадность как автоматический сигнал к открытию длинных позиций с плечом. На деле последовали недели рваной консолидации: $BTC торговался в боковике, ликвидируя чрезмерно самоуверенные позиции, в то время как $ETH пытался набрать импульс. Показатель 69 не означает, что бычий забег закончится завтра, но исторически он сигнализирует о том, что поздние покупатели начинают чувствовать себя увереннее, пока крупный капитал незаметно выставляет лимитные ордера ниже.
Если оглянуться на прошлые циклы, когда настроения переходили в зону выраженной жадности, стратегия редко меняется. Вместо того чтобы гнаться за ростом крупных монет вроде $SOL, опытные инвесторы обычно ждут неизбежного охлаждения настроений, прежде чем открывать позиции с высокой уверенностью.
Как вы корректируете свои текущие позиции на фоне усиления таких настроений?
#CryptoTrading #Bitcoin #MarketAnalysis
Представьте: вы просыпаетесь, проверяете свой портфель и видите, что индекс страха и жадности крипторынка застыл на отметке 69.
Большинство трейдеров видят это зелёное число и сразу чувствуют желание запрыгнуть в растущие свечи, но в итоге покупают прямо на локальном максимуме — незадолго до болезненной коррекции. Мы все через это проходили: разрывались между страхом упустить прибыль и ужасом стать теми, за чей счёт другие выходят из позиции.
В начале 2024 года, когда индекс впервые завис в этой зоне — от 69 до 75, — участники рынка воспринимали жадность как автоматический сигнал к открытию длинных позиций с плечом. На деле последовали недели рваной консолидации: $BTC торговался в боковике, ликвидируя чрезмерно самоуверенные позиции, в то время как $ETH пытался набрать импульс. Показатель 69 не означает, что бычий забег закончится завтра, но исторически он сигнализирует о том, что поздние покупатели начинают чувствовать себя увереннее, пока крупный капитал незаметно выставляет лимитные ордера ниже.
Если оглянуться на прошлые циклы, когда настроения переходили в зону выраженной жадности, стратегия редко меняется. Вместо того чтобы гнаться за ростом крупных монет вроде $SOL , опытные инвесторы обычно ждут неизбежного охлаждения настроений, прежде чем открывать позиции с высокой уверенностью.
Как вы корректируете свои текущие позиции на фоне усиления таких настроений?
#CryptoTrading #Bitcoin #MarketAnalysis
Большинство трейдеров видят это зелёное число и сразу чувствуют желание запрыгнуть в растущие свечи, но в итоге покупают прямо на локальном максимуме — незадолго до болезненной коррекции. Мы все через это проходили: разрывались между страхом упустить прибыль и ужасом стать теми, за чей счёт другие выходят из позиции.
В начале 2024 года, когда индекс впервые завис в этой зоне — от 69 до 75, — участники рынка воспринимали жадность как автоматический сигнал к открытию длинных позиций с плечом. На деле последовали недели рваной консолидации: $BTC торговался в боковике, ликвидируя чрезмерно самоуверенные позиции, в то время как $ETH пытался набрать импульс. Показатель 69 не означает, что бычий забег закончится завтра, но исторически он сигнализирует о том, что поздние покупатели начинают чувствовать себя увереннее, пока крупный капитал незаметно выставляет лимитные ордера ниже.
Если оглянуться на прошлые циклы, когда настроения переходили в зону выраженной жадности, стратегия редко меняется. Вместо того чтобы гнаться за ростом крупных монет вроде $SOL , опытные инвесторы обычно ждут неизбежного охлаждения настроений, прежде чем открывать позиции с высокой уверенностью.
Как вы корректируете свои текущие позиции на фоне усиления таких настроений?
#CryptoTrading #Bitcoin #MarketAnalysis
·
--
См. перевод
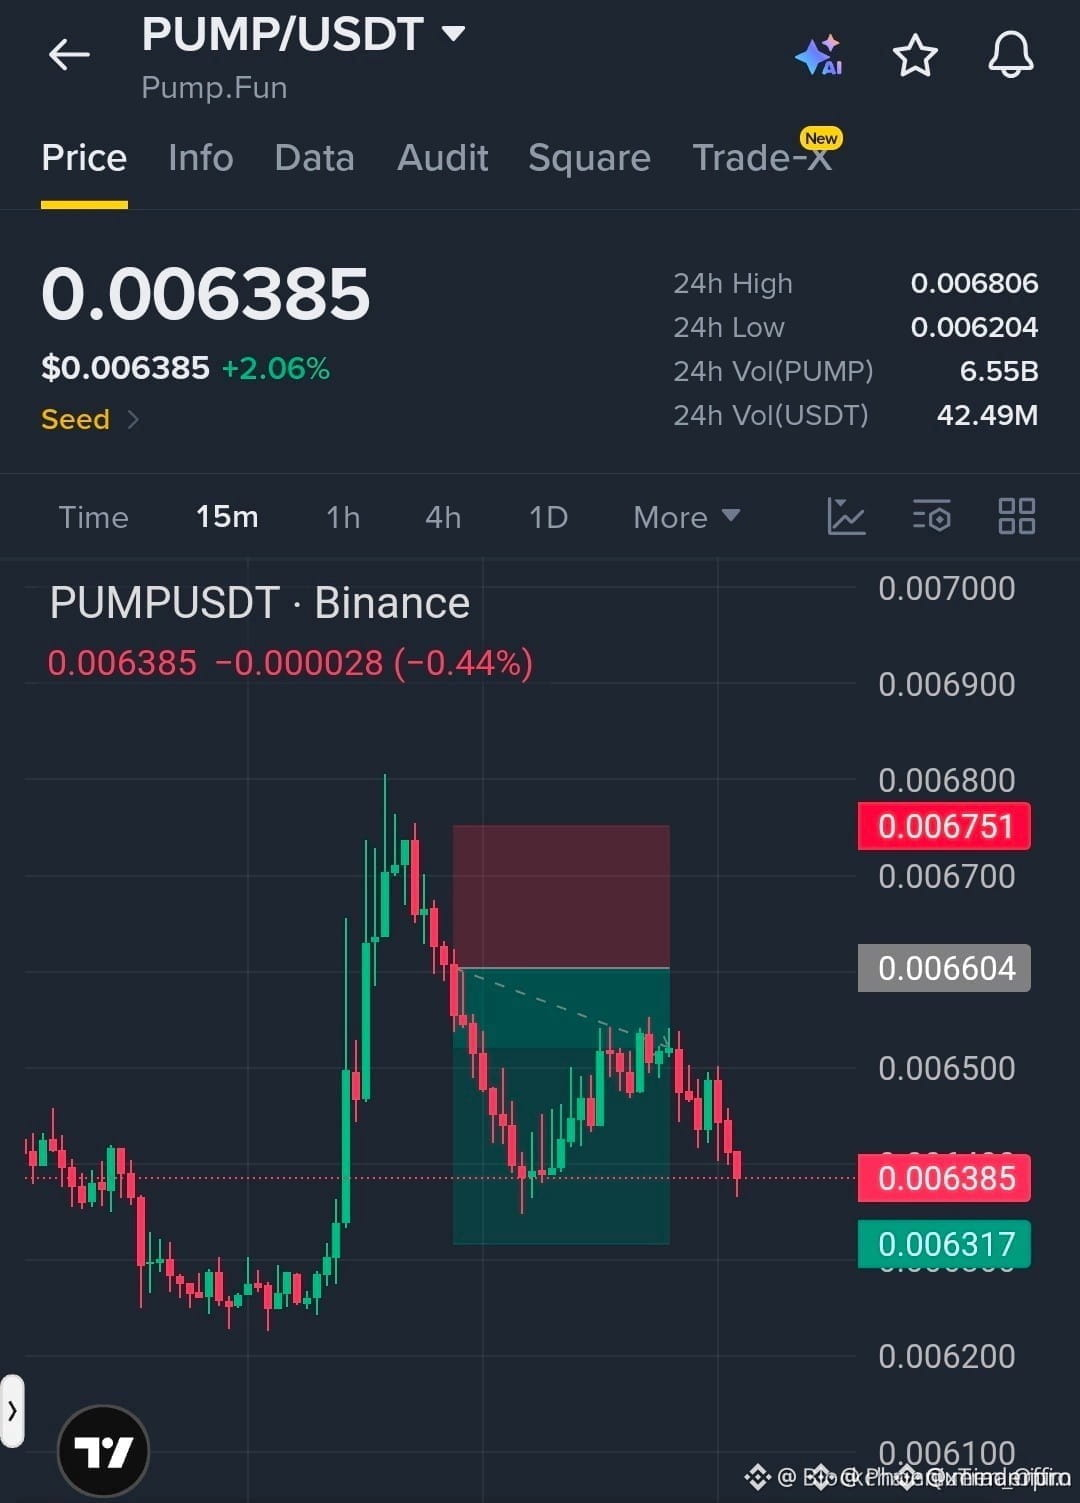
Picture this: a leaderboard showcases top 30-day trader profits, while the underlying token quietly slips into the red.
Most traders get trapped chasing leaderboards and paper gains, jumping into high-momentum plays right when smart money is preparing an exit. By the time retail spots the green PnL screenshots, the liquidity profile has usually shifted against them.
Looking closely at the recent 30-day top trader metrics, there was heavy volume and strong realized profits around $PUMP, even as the spot price pulled back -2.55%. That divergence between top-tier realized profit and downward spot pressure often signals aggressive distribution into strength rather than genuine accumulation.
When large players print massive 30-day returns on high-beta tokens like $PUMP or speculative rotations into $SOL and $PEPE, they need exit liquidity to lock in those gains. If you are entering solely because the leaderboard looks impressive, you might just be funding someone else's winning month.
Are you treating trader leaderboards as a confirmation signal, or as a potential warning sign?
#CryptoTrading #RiskManagement #BinanceSquare
Picture this: a leaderboard showcases top 30-day trader profits, while the underlying token quietly slips into the red.
Most traders get trapped chasing leaderboards and paper gains, jumping into high-momentum plays right when smart money is preparing an exit. By the time retail spots the green PnL screenshots, the liquidity profile has usually shifted against them.
Looking closely at the recent 30-day top trader metrics, there was heavy volume and strong realized profits around $PUMP , even as the spot price pulled back -2.55%. That divergence between top-tier realized profit and downward spot pressure often signals aggressive distribution into strength rather than genuine accumulation.
When large players print massive 30-day returns on high-beta tokens like $PUMP or speculative rotations into $SOL and $PEPE , they need exit liquidity to lock in those gains. If you are entering solely because the leaderboard looks impressive, you might just be funding someone else's winning month.
Are you treating trader leaderboards as a confirmation signal, or as a potential warning sign?
#CryptoTrading #RiskManagement #BinanceSquare
Most traders get trapped chasing leaderboards and paper gains, jumping into high-momentum plays right when smart money is preparing an exit. By the time retail spots the green PnL screenshots, the liquidity profile has usually shifted against them.
Looking closely at the recent 30-day top trader metrics, there was heavy volume and strong realized profits around $PUMP , even as the spot price pulled back -2.55%. That divergence between top-tier realized profit and downward spot pressure often signals aggressive distribution into strength rather than genuine accumulation.
When large players print massive 30-day returns on high-beta tokens like $PUMP or speculative rotations into $SOL and $PEPE , they need exit liquidity to lock in those gains. If you are entering solely because the leaderboard looks impressive, you might just be funding someone else's winning month.
Are you treating trader leaderboards as a confirmation signal, or as a potential warning sign?
#CryptoTrading #RiskManagement #BinanceSquare
1
·
--
См. перевод
If you're still buying $ADA without setting stops, stop now.
The pain of missing exits or getting wrecked on a reversal hits hard when you don't have a plan. FOMO after a 7.3 percent pump usually ends badly.
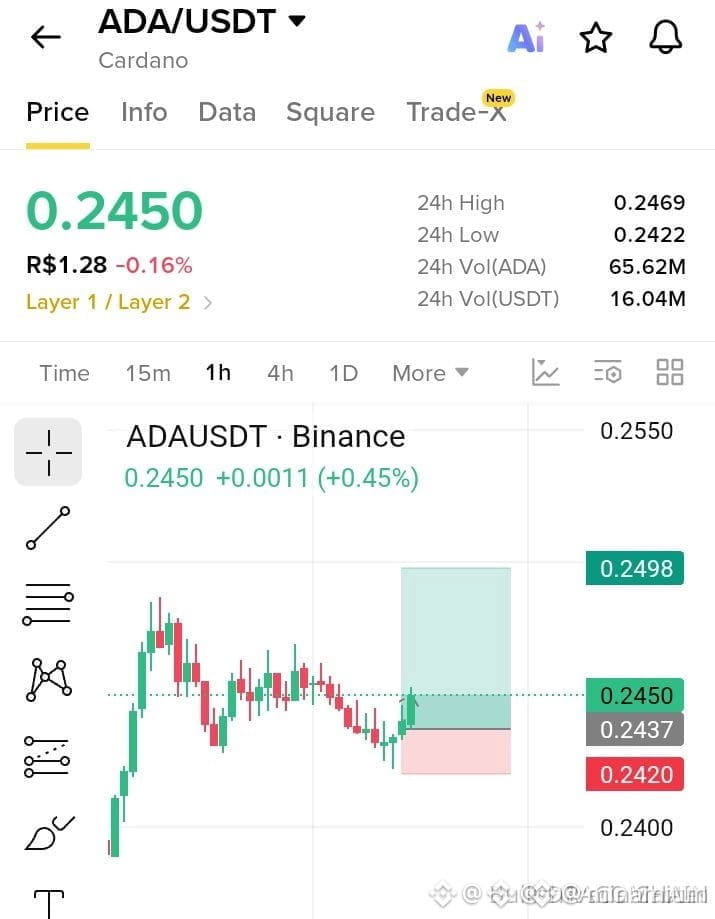
The debate around $ADA is clear. Skeptics say it lacks catalysts and $BTC will keep alts suppressed. Supporters highlight the bounce from 0.27 as a buying opportunity targeting 0.33.
I argue for taking the long. Entries at 0.27 to 0.28 with targets at 0.30 and 0.33 and a stop at 0.22 keep the risk in check. $ETH's recent move often leads these recoveries.
Where do you think $ADA goes from here?
#ADA #Cardano #CryptoTrading
If you're still buying $ADA without setting stops, stop now.
The pain of missing exits or getting wrecked on a reversal hits hard when you don't have a plan. FOMO after a 7.3 percent pump usually ends badly.
The debate around $ADA is clear. Skeptics say it lacks catalysts and $BTC will keep alts suppressed. Supporters highlight the bounce from 0.27 as a buying opportunity targeting 0.33.
I argue for taking the long. Entries at 0.27 to 0.28 with targets at 0.30 and 0.33 and a stop at 0.22 keep the risk in check. $ETH 's recent move often leads these recoveries.
Where do you think $ADA goes from here?
#ADA #Cardano #CryptoTrading
The pain of missing exits or getting wrecked on a reversal hits hard when you don't have a plan. FOMO after a 7.3 percent pump usually ends badly.
The debate around $ADA is clear. Skeptics say it lacks catalysts and $BTC will keep alts suppressed. Supporters highlight the bounce from 0.27 as a buying opportunity targeting 0.33.
I argue for taking the long. Entries at 0.27 to 0.28 with targets at 0.30 and 0.33 and a stop at 0.22 keep the risk in check. $ETH 's recent move often leads these recoveries.
Where do you think $ADA goes from here?
#ADA #Cardano #CryptoTrading
·
--
См. перевод
Everyone thinks chasing volume spikes guarantees a clean breakout, but actually most degens just end up funding exit liquidity for early callers.
We see it constantly with traders blindly longing green impulses right after a modest +1.32% tick, only to end up holding bags when the momentum abruptly dies. FOMO buying into heavily hyped volume leaders is usually the fastest route to getting chopped up.
Take this textbook setup with $4 that pushed heavy 30d trader volume across binance feeds. A caller hyped an imminent god candle within a couple hours while tracking over 111k impressions, betting that sheer volume alone would carry the move. But ngl ser, when a token barely sits up 1% and everyone starts front-running the same obvious breakout, late retail usually ends up taking the hit.
High volume without confirmed structural strength is just noise, especially when broader majors like $BTC are chopping. Smart money uses that liquidity to de-risk while latecomers stare at their screens wondering why the print stalled.
Are you bidding breakouts based on volume spikes right now, or waiting for structural retests?
#CryptoTrading #BinanceSquare #Altcoins
Everyone thinks chasing volume spikes guarantees a clean breakout, but actually most degens just end up funding exit liquidity for early callers.
We see it constantly with traders blindly longing green impulses right after a modest +1.32% tick, only to end up holding bags when the momentum abruptly dies. FOMO buying into heavily hyped volume leaders is usually the fastest route to getting chopped up.
Take this textbook setup with $4 that pushed heavy 30d trader volume across binance feeds. A caller hyped an imminent god candle within a couple hours while tracking over 111k impressions, betting that sheer volume alone would carry the move. But ngl ser, when a token barely sits up 1% and everyone starts front-running the same obvious breakout, late retail usually ends up taking the hit.
High volume without confirmed structural strength is just noise, especially when broader majors like $BTC are chopping. Smart money uses that liquidity to de-risk while latecomers stare at their screens wondering why the print stalled.
Are you bidding breakouts based on volume spikes right now, or waiting for structural retests?
#CryptoTrading #BinanceSquare #Altcoins
We see it constantly with traders blindly longing green impulses right after a modest +1.32% tick, only to end up holding bags when the momentum abruptly dies. FOMO buying into heavily hyped volume leaders is usually the fastest route to getting chopped up.
Take this textbook setup with $4 that pushed heavy 30d trader volume across binance feeds. A caller hyped an imminent god candle within a couple hours while tracking over 111k impressions, betting that sheer volume alone would carry the move. But ngl ser, when a token barely sits up 1% and everyone starts front-running the same obvious breakout, late retail usually ends up taking the hit.
High volume without confirmed structural strength is just noise, especially when broader majors like $BTC are chopping. Smart money uses that liquidity to de-risk while latecomers stare at their screens wondering why the print stalled.
Are you bidding breakouts based on volume spikes right now, or waiting for structural retests?
#CryptoTrading #BinanceSquare #Altcoins

·
--
Почему никто не говорит о настоящей причине, по которой большинство розничных трейдеров сливают свои счета, пока крупные игроки тихо зарабатывают? Большинство открывает позиции без какого-либо плана выхода, рискует половиной портфеля, полагаясь лишь на хайп, а потом удивляется, почему остаётся с пустыми руками.
Посмотрите, как на самом деле происходит накопление крупными игроками в таких сетапах, как $BTW , прежде чем об этом узнают остальные. Когда крупные кошельки днями поглощают предложение на ключевых уровнях, дело не в попытках угадать вершину или дно. Важна исключительно асимметричная доходность — именно так недавняя сделка на $BTW принесла +2,504.94 USDT при контролируемом риске.
Математика проста, но её постоянно игнорируют. Ограничив риск жёстким стоп-лоссом в 20%, вы сможете охотиться за движениями с потенциалом роста от 200% до 1000% на волатильных активах вроде $BTC или высокобетовых инструментах вроде $SOL. Даже при низком проценте прибыльных сделок соотношение риска к прибыли 1:10 сохранит ваш капитал и позволит поймать настоящее импульсное движение.
Насколько строго вы соблюдаете стоп-лосс, открывая позиции в сетапах с накоплением крупными игроками?
#CryptoTrading #RiskManagement #Альткоины
Почему никто не говорит о настоящей причине, по которой большинство розничных трейдеров сливают свои счета, пока крупные игроки тихо зарабатывают? Большинство открывает позиции без какого-либо плана выхода, рискует половиной портфеля, полагаясь лишь на хайп, а потом удивляется, почему остаётся с пустыми руками.
Посмотрите, как на самом деле происходит накопление крупными игроками в таких сетапах, как $BTW , прежде чем об этом узнают остальные. Когда крупные кошельки днями поглощают предложение на ключевых уровнях, дело не в попытках угадать вершину или дно. Важна исключительно асимметричная доходность — именно так недавняя сделка на $BTW принесла +2,504.94 USDT при контролируемом риске.
Математика проста, но её постоянно игнорируют. Ограничив риск жёстким стоп-лоссом в 20%, вы сможете охотиться за движениями с потенциалом роста от 200% до 1000% на волатильных активах вроде $BTC или высокобетовых инструментах вроде $SOL . Даже при низком проценте прибыльных сделок соотношение риска к прибыли 1:10 сохранит ваш капитал и позволит поймать настоящее импульсное движение.
Насколько строго вы соблюдаете стоп-лосс, открывая позиции в сетапах с накоплением крупными игроками?
#CryptoTrading #RiskManagement #Альткоины
Посмотрите, как на самом деле происходит накопление крупными игроками в таких сетапах, как $BTW , прежде чем об этом узнают остальные. Когда крупные кошельки днями поглощают предложение на ключевых уровнях, дело не в попытках угадать вершину или дно. Важна исключительно асимметричная доходность — именно так недавняя сделка на $BTW принесла +2,504.94 USDT при контролируемом риске.
Математика проста, но её постоянно игнорируют. Ограничив риск жёстким стоп-лоссом в 20%, вы сможете охотиться за движениями с потенциалом роста от 200% до 1000% на волатильных активах вроде $BTC или высокобетовых инструментах вроде $SOL . Даже при низком проценте прибыльных сделок соотношение риска к прибыли 1:10 сохранит ваш капитал и позволит поймать настоящее импульсное движение.
Насколько строго вы соблюдаете стоп-лосс, открывая позиции в сетапах с накоплением крупными игроками?
#CryptoTrading #RiskManagement #Альткоины

7
·
--
Рынок только что оценил вероятность повышения ставки ФРС в октябре в 17 процентов — обвал, который в 2019 году предшествовал самому резкому в истории росту биткоина на фоне притока ликвидности, пока большинство трейдеров всё ещё спорили, что ставки никак не связаны с криптовалютами.
Слишком многие из нас поддались FOMO и купили первые зелёные свечи в $SOL после похожих заголовков, а потом неделями наблюдали за боковым движением, когда реальные действия регулятора отставали от рыночных ожиданий.
Эта цифра в 17 процентов означает, что рынок признаёт: цикл ужесточения, вероятно, завершён. Исторически это ослабляет давление на доллар и направляет капитал в активы с высокой бетой — та же закономерность подтолкнула вверх $FIL и $ARB после пауз ФРС в предыдущих циклах. Я наблюдал, как разворачивалась версия 2020 года, а за ней наступил пик жадности в 2021-м. При индексе настроений на уровне 68 ситуация повторяется, но уважаемые мной ветераны не воспринимают падение вероятности как сигнал к покупке. Они ждут, чтобы увидеть, подтвердят ли приток ликвидности потоки средств в ETF и активность в блокчейне, а не просто будут ли они учтены в ценах.
Настоящее преимущество всегда заключалось в том, чтобы пережить разрыв между громким заголовком и тем, что последует за ним.
Как думаете, где появится первый реальный спрос, если эта тенденция сохранится? Или нас ждёт очередной ложный рывок, уже заложенный в цены, перед октябрём?
#FedOctoberRateHikeOddsFallTo17 #BitcoinSpotETFsDraw #SolanaTokenizedStockVolumeTops
Рынок только что оценил вероятность повышения ставки ФРС в октябре в 17 процентов — обвал, который в 2019 году предшествовал самому резкому в истории росту биткоина на фоне притока ликвидности, пока большинство трейдеров всё ещё спорили, что ставки никак не связаны с криптовалютами.
Слишком многие из нас поддались FOMO и купили первые зелёные свечи в $SOL после похожих заголовков, а потом неделями наблюдали за боковым движением, когда реальные действия регулятора отставали от рыночных ожиданий.
Эта цифра в 17 процентов означает, что рынок признаёт: цикл ужесточения, вероятно, завершён. Исторически это ослабляет давление на доллар и направляет капитал в активы с высокой бетой — та же закономерность подтолкнула вверх $FIL и $ARB после пауз ФРС в предыдущих циклах. Я наблюдал, как разворачивалась версия 2020 года, а за ней наступил пик жадности в 2021-м. При индексе настроений на уровне 68 ситуация повторяется, но уважаемые мной ветераны не воспринимают падение вероятности как сигнал к покупке. Они ждут, чтобы увидеть, подтвердят ли приток ликвидности потоки средств в ETF и активность в блокчейне, а не просто будут ли они учтены в ценах.
Настоящее преимущество всегда заключалось в том, чтобы пережить разрыв между громким заголовком и тем, что последует за ним.
Как думаете, где появится первый реальный спрос, если эта тенденция сохранится? Или нас ждёт очередной ложный рывок, уже заложенный в цены, перед октябрём?
#FedOctoberRateHikeOddsFallTo17 #BitcoinSpotETFsDraw #SolanaTokenizedStockVolumeTops
Слишком многие из нас поддались FOMO и купили первые зелёные свечи в $SOL после похожих заголовков, а потом неделями наблюдали за боковым движением, когда реальные действия регулятора отставали от рыночных ожиданий.
Эта цифра в 17 процентов означает, что рынок признаёт: цикл ужесточения, вероятно, завершён. Исторически это ослабляет давление на доллар и направляет капитал в активы с высокой бетой — та же закономерность подтолкнула вверх $FIL и $ARB после пауз ФРС в предыдущих циклах. Я наблюдал, как разворачивалась версия 2020 года, а за ней наступил пик жадности в 2021-м. При индексе настроений на уровне 68 ситуация повторяется, но уважаемые мной ветераны не воспринимают падение вероятности как сигнал к покупке. Они ждут, чтобы увидеть, подтвердят ли приток ликвидности потоки средств в ETF и активность в блокчейне, а не просто будут ли они учтены в ценах.
Настоящее преимущество всегда заключалось в том, чтобы пережить разрыв между громким заголовком и тем, что последует за ним.
Как думаете, где появится первый реальный спрос, если эта тенденция сохранится? Или нас ждёт очередной ложный рывок, уже заложенный в цены, перед октябрём?
#FedOctoberRateHikeOddsFallTo17 #BitcoinSpotETFsDraw #SolanaTokenizedStockVolumeTops

14
·
--
См. перевод
Picture this: you wake up to green candles smashing into heavy resistance, order books heating up, and retail aggressively market-buying the top of the range. Most traders end up trapped because they confuse sudden momentum with genuine structural confirmation, only to watch their positions get wiped the moment price snaps back down.
We have seen this playbook unfold multiple times across previous cycles. Back during the mid-2021 range expansions and again during recent ETF absorption phases, $BTC repeatedly swept overhead liquidity before cooling off to reset funding rates. When Bitcoin stalls at these heavy overhead supply zones, capital rarely leaves the ecosystem entirely; instead, liquidity often rotates into high-beta plays like $SOL or layer-2 networks like $ARB while traders wait for the dust to settle.
The takeaway from every major rejection is that spot order books dictate the real ceiling far more than derivative excitement. When spot volume fails to back up the push, a clean rejection is just the market clearing out late leverage before building a healthier foundation for the next leg.
Where do you think we consolidate before the next real attempt?
#BitcoinRejectedAt #BitcoinSpotETFsDraw
Picture this: you wake up to green candles smashing into heavy resistance, order books heating up, and retail aggressively market-buying the top of the range. Most traders end up trapped because they confuse sudden momentum with genuine structural confirmation, only to watch their positions get wiped the moment price snaps back down.
We have seen this playbook unfold multiple times across previous cycles. Back during the mid-2021 range expansions and again during recent ETF absorption phases, $BTC repeatedly swept overhead liquidity before cooling off to reset funding rates. When Bitcoin stalls at these heavy overhead supply zones, capital rarely leaves the ecosystem entirely; instead, liquidity often rotates into high-beta plays like $SOL or layer-2 networks like $ARB while traders wait for the dust to settle.
The takeaway from every major rejection is that spot order books dictate the real ceiling far more than derivative excitement. When spot volume fails to back up the push, a clean rejection is just the market clearing out late leverage before building a healthier foundation for the next leg.
Where do you think we consolidate before the next real attempt?
#BitcoinRejectedAt #BitcoinSpotETFsDraw
We have seen this playbook unfold multiple times across previous cycles. Back during the mid-2021 range expansions and again during recent ETF absorption phases, $BTC repeatedly swept overhead liquidity before cooling off to reset funding rates. When Bitcoin stalls at these heavy overhead supply zones, capital rarely leaves the ecosystem entirely; instead, liquidity often rotates into high-beta plays like $SOL or layer-2 networks like $ARB while traders wait for the dust to settle.
The takeaway from every major rejection is that spot order books dictate the real ceiling far more than derivative excitement. When spot volume fails to back up the push, a clean rejection is just the market clearing out late leverage before building a healthier foundation for the next leg.
Where do you think we consolidate before the next real attempt?
#BitcoinRejectedAt #BitcoinSpotETFsDraw

2
·
--
См. перевод
If you are still parking your $USDT into glossy high-yield investment schemes promising guaranteed daily returns, stop now.
Watching your hard-earned portfolio vanish into an unregulated black hole is the single worst feeling in web3, especially when greed clouds basic risk management. We keep chasing alpha in every corner, only to hand over our capital to sophisticated syndicates running fake trading dashboards and vanity metrics.
Greek authorities just dismantled a massive international fraud network, arresting 17 operators behind coordinated fake investment platforms. It feels eerily similar to the classic boiler-room operations we saw during the early ICO days and recent offshore wash-trading schemes, where sleek interfaces masked complete liquidity traps. While real utility flows across chains like $SOL and ecosystems like $ARB, bad actors continue exploiting the retail appetite for passive yields with textbook Ponzi mechanics.
The playbook never really changes, yet thousands still fall for the exact same traps every market cycle.
Why do you think smart traders still get caught in these high-yield traps despite all the warnings?
#GreekPoliceBustCryptoScamRingArrest17 #DriftHackVictimsBeginClaims
If you are still parking your $USDT into glossy high-yield investment schemes promising guaranteed daily returns, stop now.
Watching your hard-earned portfolio vanish into an unregulated black hole is the single worst feeling in web3, especially when greed clouds basic risk management. We keep chasing alpha in every corner, only to hand over our capital to sophisticated syndicates running fake trading dashboards and vanity metrics.
Greek authorities just dismantled a massive international fraud network, arresting 17 operators behind coordinated fake investment platforms. It feels eerily similar to the classic boiler-room operations we saw during the early ICO days and recent offshore wash-trading schemes, where sleek interfaces masked complete liquidity traps. While real utility flows across chains like $SOL and ecosystems like $ARB , bad actors continue exploiting the retail appetite for passive yields with textbook Ponzi mechanics.
The playbook never really changes, yet thousands still fall for the exact same traps every market cycle.
Why do you think smart traders still get caught in these high-yield traps despite all the warnings?
#GreekPoliceBustCryptoScamRingArrest17 #DriftHackVictimsBeginClaims
Watching your hard-earned portfolio vanish into an unregulated black hole is the single worst feeling in web3, especially when greed clouds basic risk management. We keep chasing alpha in every corner, only to hand over our capital to sophisticated syndicates running fake trading dashboards and vanity metrics.
Greek authorities just dismantled a massive international fraud network, arresting 17 operators behind coordinated fake investment platforms. It feels eerily similar to the classic boiler-room operations we saw during the early ICO days and recent offshore wash-trading schemes, where sleek interfaces masked complete liquidity traps. While real utility flows across chains like $SOL and ecosystems like $ARB , bad actors continue exploiting the retail appetite for passive yields with textbook Ponzi mechanics.
The playbook never really changes, yet thousands still fall for the exact same traps every market cycle.
Why do you think smart traders still get caught in these high-yield traps despite all the warnings?
#GreekPoliceBustCryptoScamRingArrest17 #DriftHackVictimsBeginClaims

·
--
Вот что произошло: в третьем квартале они продали 10 000 $BTC , а затем скупили ещё 11 000, завершив квартал с чистым приростом в 1 000 монет.
Слишком многие трейдеры продают в панике, а откупаются на пиках, фиксируя убытки вместо того, чтобы накапливать активы. Этот случай показывает, как, упустив точки для повторного входа, можно остаться с меньшим количеством монет, чем было изначально.
Они не просто всё сбросили и ушли. Продав 10 000 $BTC, они выкупили обратно 11 000, получив к концу квартала чистый прирост в 1 000. Судя по срокам, они использовали продажи, чтобы изменить позиции во время волатильности третьего квартала — такого поведения мы не всегда наблюдали у других крупных держателей.
Сравните это с прошлыми циклами, когда институциональные инвесторы продавали $ETH или даже $SOL во время спадов и оставались в стороне, упуская восстановление рынка. В прошлом году несколько майнеров поступили именно так и пожалели об этом, когда цены отскочили. Конкурирующим проектам часто не хватает такой гибкости: они либо удерживают активы, либо сбрасывают их, не откупая обратно.
Главный вывод: чистое накопление после продаж говорит о настоящей уверенности. Это свидетельствует об активном управлении казначейством, а не о панике. В предыдущих бычьих ралли $BTC такая стратегия вознаграждала тех, кто следил за происходящим.
Как думаете, к чему приведут такие чистые покупки?
#Bitcoin #CryptoStrategy #ИнституциональныеПотоки
Вот что произошло: в третьем квартале они продали 10 000 $BTC , а затем скупили ещё 11 000, завершив квартал с чистым приростом в 1 000 монет.
Слишком многие трейдеры продают в панике, а откупаются на пиках, фиксируя убытки вместо того, чтобы накапливать активы. Этот случай показывает, как, упустив точки для повторного входа, можно остаться с меньшим количеством монет, чем было изначально.
Они не просто всё сбросили и ушли. Продав 10 000 $BTC , они выкупили обратно 11 000, получив к концу квартала чистый прирост в 1 000. Судя по срокам, они использовали продажи, чтобы изменить позиции во время волатильности третьего квартала — такого поведения мы не всегда наблюдали у других крупных держателей.
Сравните это с прошлыми циклами, когда институциональные инвесторы продавали $ETH или даже $SOL во время спадов и оставались в стороне, упуская восстановление рынка. В прошлом году несколько майнеров поступили именно так и пожалели об этом, когда цены отскочили. Конкурирующим проектам часто не хватает такой гибкости: они либо удерживают активы, либо сбрасывают их, не откупая обратно.
Главный вывод: чистое накопление после продаж говорит о настоящей уверенности. Это свидетельствует об активном управлении казначейством, а не о панике. В предыдущих бычьих ралли $BTC такая стратегия вознаграждала тех, кто следил за происходящим.
Как думаете, к чему приведут такие чистые покупки?
#Bitcoin #CryptoStrategy #ИнституциональныеПотоки
Слишком многие трейдеры продают в панике, а откупаются на пиках, фиксируя убытки вместо того, чтобы накапливать активы. Этот случай показывает, как, упустив точки для повторного входа, можно остаться с меньшим количеством монет, чем было изначально.
Они не просто всё сбросили и ушли. Продав 10 000 $BTC , они выкупили обратно 11 000, получив к концу квартала чистый прирост в 1 000. Судя по срокам, они использовали продажи, чтобы изменить позиции во время волатильности третьего квартала — такого поведения мы не всегда наблюдали у других крупных держателей.
Сравните это с прошлыми циклами, когда институциональные инвесторы продавали $ETH или даже $SOL во время спадов и оставались в стороне, упуская восстановление рынка. В прошлом году несколько майнеров поступили именно так и пожалели об этом, когда цены отскочили. Конкурирующим проектам часто не хватает такой гибкости: они либо удерживают активы, либо сбрасывают их, не откупая обратно.
Главный вывод: чистое накопление после продаж говорит о настоящей уверенности. Это свидетельствует об активном управлении казначейством, а не о панике. В предыдущих бычьих ралли $BTC такая стратегия вознаграждала тех, кто следил за происходящим.
Как думаете, к чему приведут такие чистые покупки?
#Bitcoin #CryptoStrategy #ИнституциональныеПотоки

·
--
См. перевод
Most retail traders treat major institutional sell-offs as the start of a bear market, but on-chain history shows that panic is usually just someone else's liquidity.
Most people panic-sell into those massive red candles, only to buy back higher when the market suddenly rebounds. It is the easiest way to bleed your portfolio dry without ever realizing you were just trading the chop.
Looking at recent quarterly flows, a major player offloaded roughly 10,000 $BTC into weakness, sparking a chain reaction of de-risking across $ETH and altcoins. While retail was busy hedging and expecting lower lows, the exact same entity quietly scooped 11,000 $BTC back onto their balance sheet before the quarter wrapped up.
That left them sitting on a net increase of 1,000 $BTC while late sellers effectively funded the entire round-trip. Trying to trade headline dumps without checking actual wallet balances usually ends with you providing cheap entries for players with much deeper pockets.
How do you usually manage risk when you see sudden large-scale treasury rotations like this?
#Bitcoin #CryptoTrading #OnChainAnalysis
Most retail traders treat major institutional sell-offs as the start of a bear market, but on-chain history shows that panic is usually just someone else's liquidity.
Most people panic-sell into those massive red candles, only to buy back higher when the market suddenly rebounds. It is the easiest way to bleed your portfolio dry without ever realizing you were just trading the chop.
Looking at recent quarterly flows, a major player offloaded roughly 10,000 $BTC into weakness, sparking a chain reaction of de-risking across $ETH and altcoins. While retail was busy hedging and expecting lower lows, the exact same entity quietly scooped 11,000 $BTC back onto their balance sheet before the quarter wrapped up.
That left them sitting on a net increase of 1,000 $BTC while late sellers effectively funded the entire round-trip. Trying to trade headline dumps without checking actual wallet balances usually ends with you providing cheap entries for players with much deeper pockets.
How do you usually manage risk when you see sudden large-scale treasury rotations like this?
#Bitcoin #CryptoTrading #OnChainAnalysis
Most people panic-sell into those massive red candles, only to buy back higher when the market suddenly rebounds. It is the easiest way to bleed your portfolio dry without ever realizing you were just trading the chop.
Looking at recent quarterly flows, a major player offloaded roughly 10,000 $BTC into weakness, sparking a chain reaction of de-risking across $ETH and altcoins. While retail was busy hedging and expecting lower lows, the exact same entity quietly scooped 11,000 $BTC back onto their balance sheet before the quarter wrapped up.
That left them sitting on a net increase of 1,000 $BTC while late sellers effectively funded the entire round-trip. Trying to trade headline dumps without checking actual wallet balances usually ends with you providing cheap entries for players with much deeper pockets.
How do you usually manage risk when you see sudden large-scale treasury rotations like this?
#Bitcoin #CryptoTrading #OnChainAnalysis

1
·
--
См. перевод
Have you noticed nobody is talking about how the Drift claims process could leave victims shortchanged again?
Too many traders already lost funds in the hack. They're now rushing into the claims window without verifying the numbers, which is how you miss the real recovery.
The official story is that it's straightforward and you'll get your money. I see it differently. These Solana protocols like Drift frequently have incomplete snapshots that ignore certain $SOL perpetual trades.
You have to independently audit your on-chain activity and push back on any mismatches immediately. With the Fear and Greed Index at 68, most are too busy scanning $USDT and $ARB to bother with the details.
Keep records of submissions and avoid new positions until the claim clears.
Where do you think this goes from here?
#DriftHackVictimsBeginClaims #SolanaTokenizedStockVolumeTops
Have you noticed nobody is talking about how the Drift claims process could leave victims shortchanged again?
Too many traders already lost funds in the hack. They're now rushing into the claims window without verifying the numbers, which is how you miss the real recovery.
The official story is that it's straightforward and you'll get your money. I see it differently. These Solana protocols like Drift frequently have incomplete snapshots that ignore certain $SOL perpetual trades.
You have to independently audit your on-chain activity and push back on any mismatches immediately. With the Fear and Greed Index at 68, most are too busy scanning $USDT and $ARB to bother with the details.
Keep records of submissions and avoid new positions until the claim clears.
Where do you think this goes from here?
#DriftHackVictimsBeginClaims #SolanaTokenizedStockVolumeTops
Too many traders already lost funds in the hack. They're now rushing into the claims window without verifying the numbers, which is how you miss the real recovery.
The official story is that it's straightforward and you'll get your money. I see it differently. These Solana protocols like Drift frequently have incomplete snapshots that ignore certain $SOL perpetual trades.
You have to independently audit your on-chain activity and push back on any mismatches immediately. With the Fear and Greed Index at 68, most are too busy scanning $USDT and $ARB to bother with the details.
Keep records of submissions and avoid new positions until the claim clears.
Where do you think this goes from here?
#DriftHackVictimsBeginClaims #SolanaTokenizedStockVolumeTops

1
·
--
См. перевод
Holding key support is actually when most retail traders get completely wiped out, not when price breaks down.
Most people see a line on a chart defend itself twice and immediately rush in with heavy leverage, completely ignoring that liquidity is usually thinning out beneath it. When you get chopped up by false bounces only to get stopped out right before the real move happens, this is usually why.
Everyone looks at $BTC defending its macro floor and assumes the structure is bulletproof. But order book depth tells a much messier story. When spot volume starts drying up on every retest while open interest climbs on $ETH, that support level is no longer acting as a springboard. It is becoming a liquidation magnet.
Once market makers see enough clustered stops sitting just below that floor, they rarely let it hold without sweeping it first. We saw the exact same pattern play out across $SOL before its last major flush.
Are you bidding the current support retest here, or waiting for the sweep below first?
#CryptoTrading #TechnicalAnalysis #OnChainAnalysis
Holding key support is actually when most retail traders get completely wiped out, not when price breaks down.
Most people see a line on a chart defend itself twice and immediately rush in with heavy leverage, completely ignoring that liquidity is usually thinning out beneath it. When you get chopped up by false bounces only to get stopped out right before the real move happens, this is usually why.
Everyone looks at $BTC defending its macro floor and assumes the structure is bulletproof. But order book depth tells a much messier story. When spot volume starts drying up on every retest while open interest climbs on $ETH , that support level is no longer acting as a springboard. It is becoming a liquidation magnet.
Once market makers see enough clustered stops sitting just below that floor, they rarely let it hold without sweeping it first. We saw the exact same pattern play out across $SOL before its last major flush.
Are you bidding the current support retest here, or waiting for the sweep below first?
#CryptoTrading #TechnicalAnalysis #OnChainAnalysis
Most people see a line on a chart defend itself twice and immediately rush in with heavy leverage, completely ignoring that liquidity is usually thinning out beneath it. When you get chopped up by false bounces only to get stopped out right before the real move happens, this is usually why.
Everyone looks at $BTC defending its macro floor and assumes the structure is bulletproof. But order book depth tells a much messier story. When spot volume starts drying up on every retest while open interest climbs on $ETH , that support level is no longer acting as a springboard. It is becoming a liquidation magnet.
Once market makers see enough clustered stops sitting just below that floor, they rarely let it hold without sweeping it first. We saw the exact same pattern play out across $SOL before its last major flush.
Are you bidding the current support retest here, or waiting for the sweep below first?
#CryptoTrading #TechnicalAnalysis #OnChainAnalysis

1
Войдите, чтобы посмотреть больше материала
Присоединяйтесь к пользователям криптовалют по всему миру на Binance Square
⚡️ Получайте новейшую и полезную информацию о криптоактивах.
💬 Нам доверяет крупнейшая в мире криптобиржа.
👍 Получите достоверные аналитические данные от верифицированных создателей контента.
Эл. почта/номер телефона