

TEKT0NIC 1
1.3k Публикации

TEKT0NIC 1
Отправить жалобу
Заблокировать пользователя
Passionate about crypto and blockchain | Crypto Enthusiastic | Technical Analysis | Fundamental News
0 подписок(и/а)
9 подписчиков(а)
39 понравилось
Посты
·
--
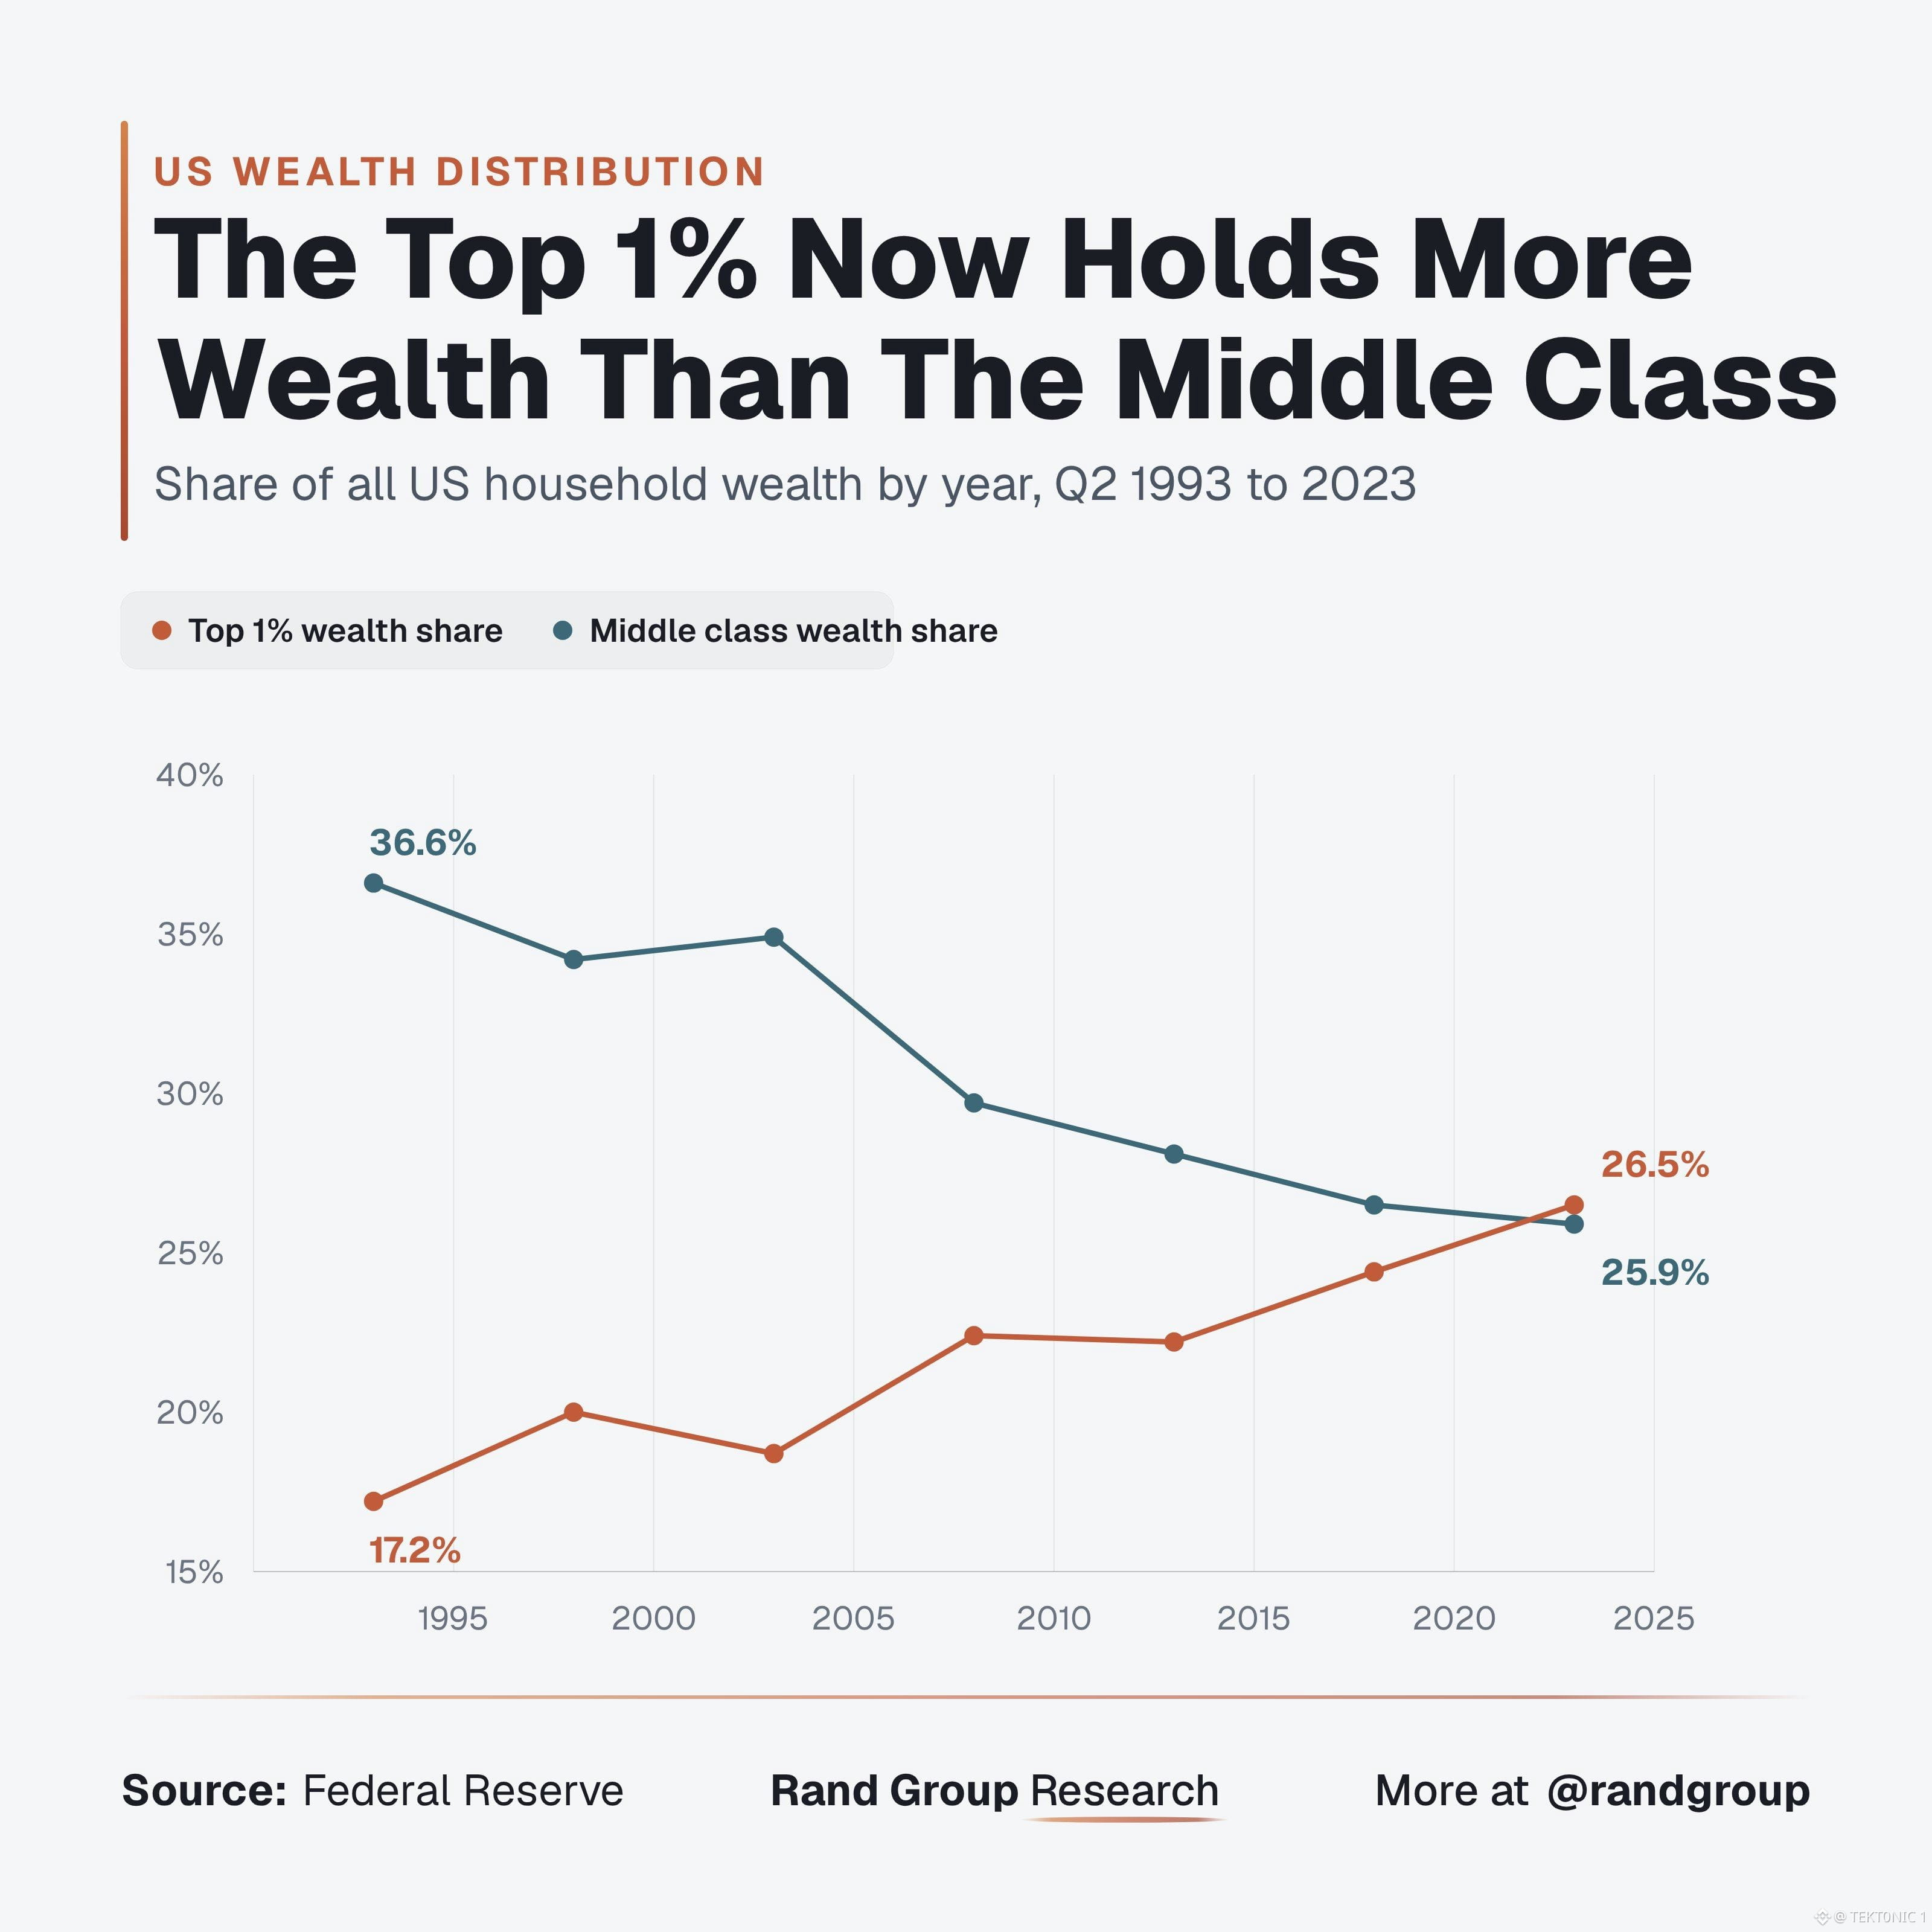
эта диаграмма объясняет, почему владение так важно. с 1993 года: > доля богатства у 1% самых обеспеченных: 17,2% → 26,5% > доля богатства среднего класса: 36,6% → 25,9% разница больше, чем просто доход. состоятельные семьи, как правило, имеют гораздо большее влияние на акции, бизнес и недвижимость, поэтому когда эти активы растут в цене, вместе с ними увеличивается и их чистое состояние. средний класс может получать хорошую зарплату, но всё равно упускать большую часть этого роста, не имея в собственности производительных активов. зарплата может покрывать счета. именно владение даёт вам долю в росте. поэтому важно наращивать активы со временем. #BTC Price Analysis# #Bitcoin Price Prediction: What is Bitcoins next move?# #Macro Insights# $BTC $ZEC
эта диаграмма объясняет, почему владение так важно. с 1993 года: > доля богатства у 1% самых обеспеченных: 17,2% → 26,5% > доля богатства среднего класса: 36,6% → 25,9% разница больше, чем просто доход. состоятельные семьи, как правило, имеют гораздо большее влияние на акции, бизнес и недвижимость, поэтому когда эти активы растут в цене, вместе с ними увеличивается и их чистое состояние. средний класс может получать хорошую зарплату, но всё равно упускать большую часть этого роста, не имея в собственности производительных активов. зарплата может покрывать счета. именно владение даёт вам долю в росте. поэтому важно наращивать активы со временем. #BTC Price Analysis# #Bitcoin Price Prediction: What is Bitcoins next move?# #Macro Insights# $BTC $ZEC
2
·
--
См. перевод
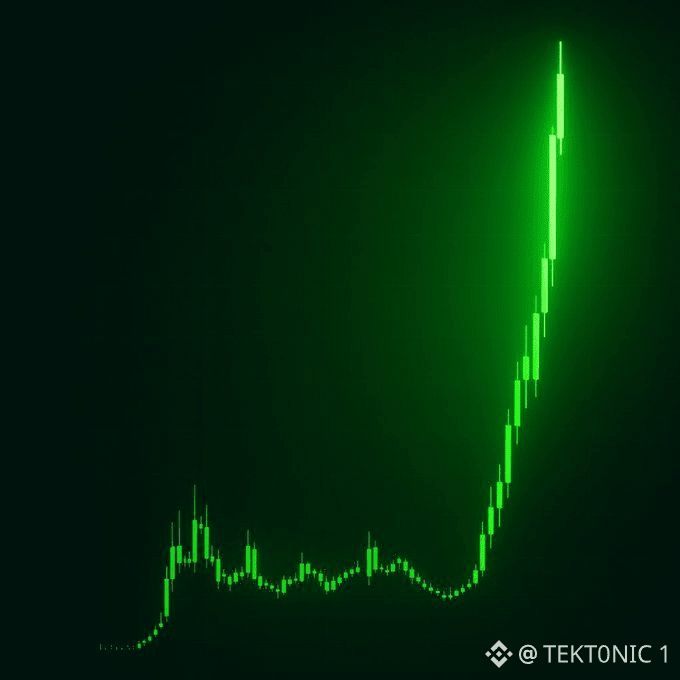
memes might finally be getting their turn. for months, capital has been rotating into tech, defi and other altcoin narratives while most meme coins kept bleeding. the gap is now hard to ignore. WIF is still about 95% below its ATH, while POPCAT is roughly 97% below its peak. but liquidity hasn’t disappeared. Solana memecoins recorded $5.2b in weekly spot volume in august, the highest weekly figure of 2026. if capital starts rotating back into memes, this is a sector people could potentially watch closely. the risk is high, but the upside can be very asymmetric when liquidity returns. #BTC Price Analysis# #Bitcoin Price Prediction: What is Bitcoins next move?# #Altcoin Season# $BTC $ZEC
memes might finally be getting their turn. for months, capital has been rotating into tech, defi and other altcoin narratives while most meme coins kept bleeding. the gap is now hard to ignore. WIF is still about 95% below its ATH, while POPCAT is roughly 97% below its peak. but liquidity hasn’t disappeared. Solana memecoins recorded $5.2b in weekly spot volume in august, the highest weekly figure of 2026. if capital starts rotating back into memes, this is a sector people could potentially watch closely. the risk is high, but the upside can be very asymmetric when liquidity returns. #BTC Price Analysis# #Bitcoin Price Prediction: What is Bitcoins next move?# #Altcoin Season# $BTC $ZEC
·
--
См. перевод
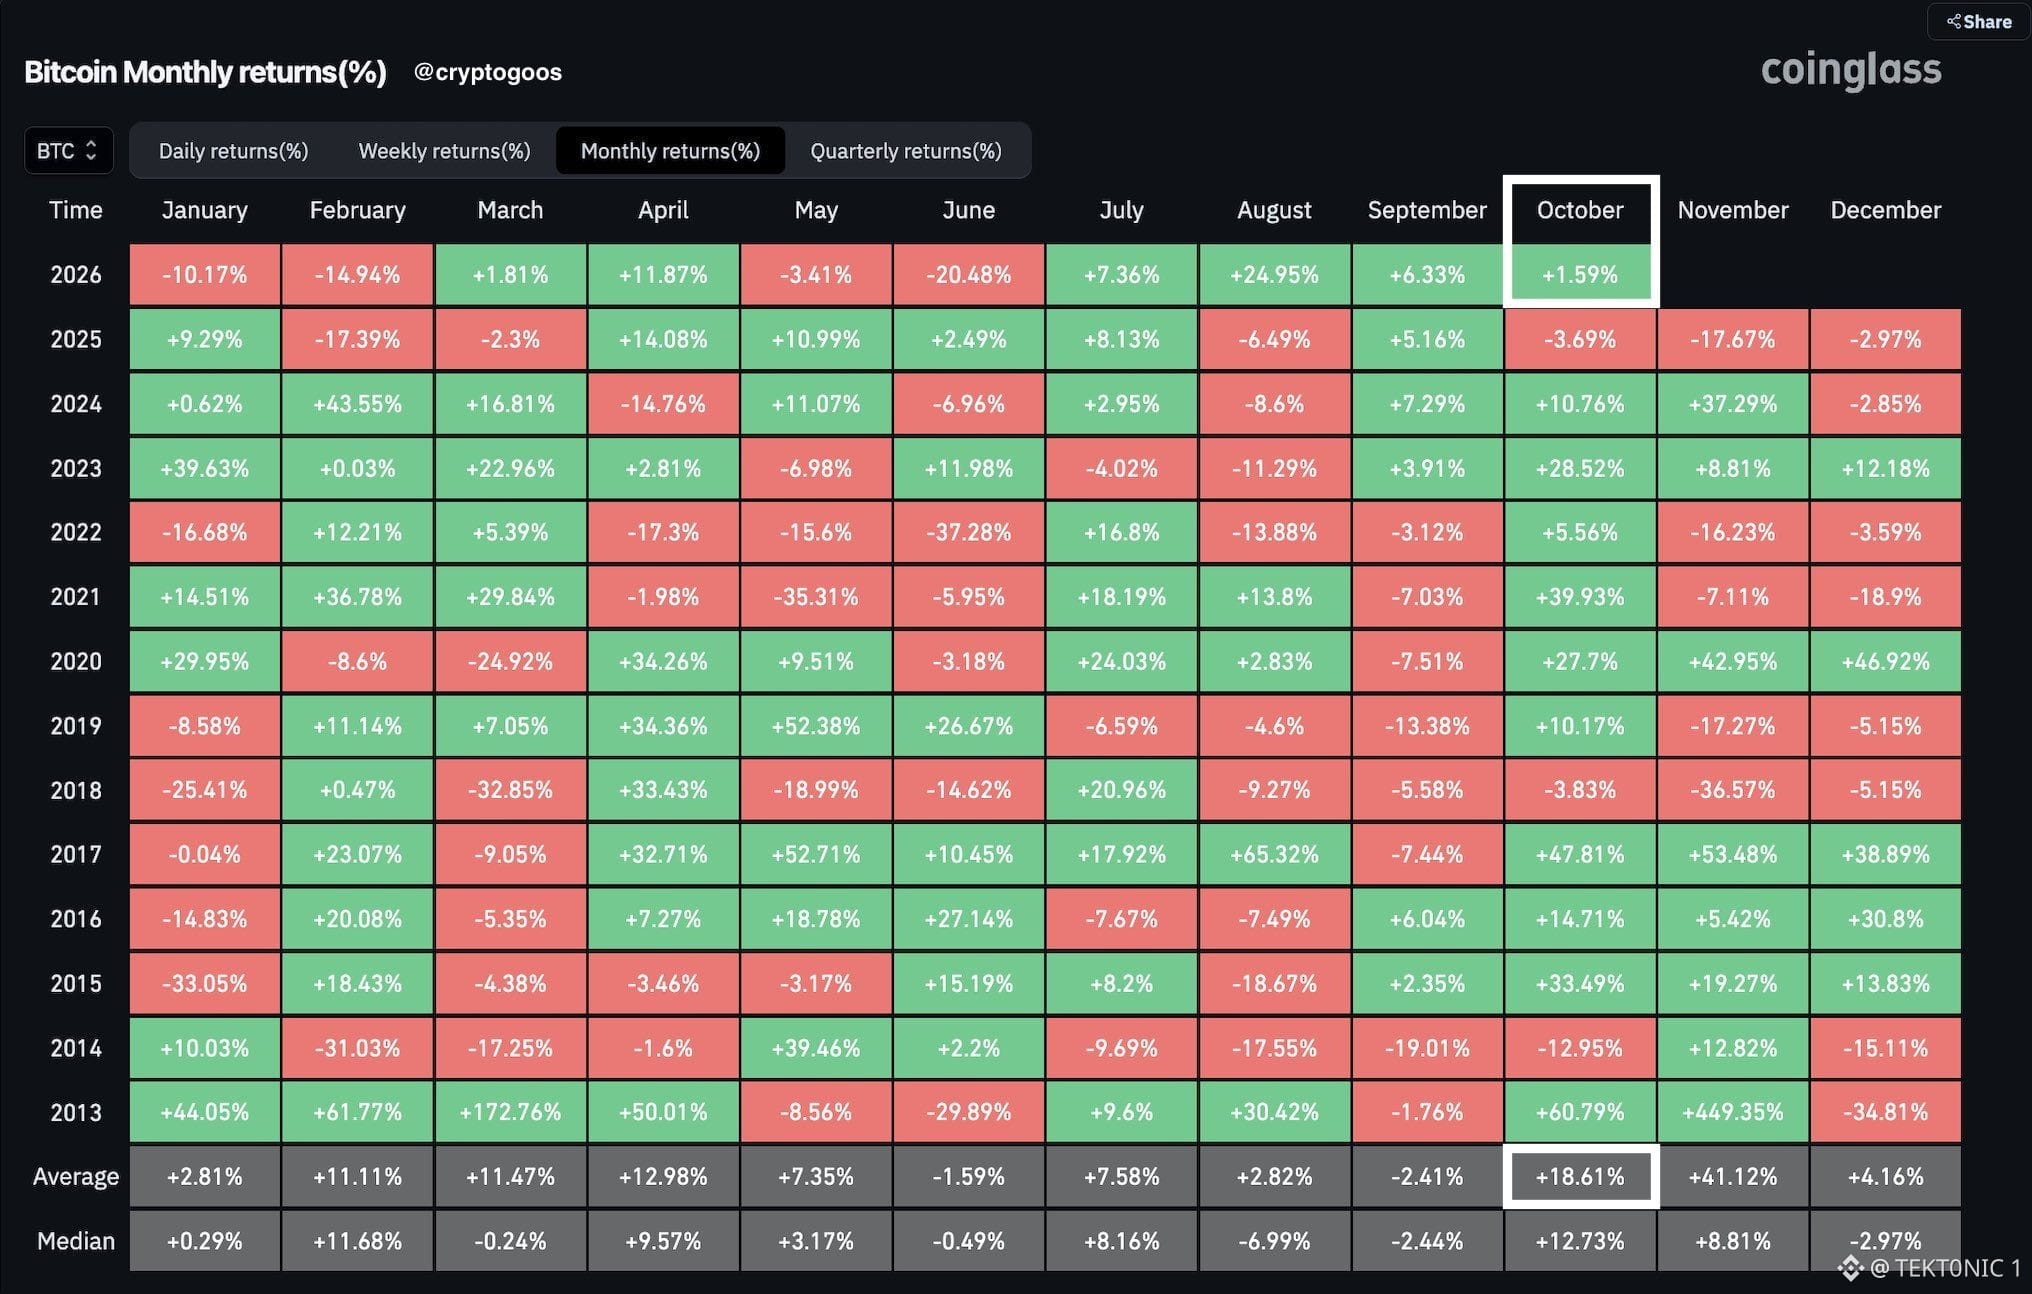
$BTC is up 1.59% so far in October, according to Coinglass. The average October on this table is +18.61%. The median is +12.73%. the average is the outlier years. 2013 was +60.8%. 2017 was +47.8%. 2021 was +39.9%. Strip those out and the middle of the set sits nearer +13%. Two Octobers finished red: 2018 at −3.8%, and 2025 at −3.7%. Last October is the recent one, and it was red. this month has four days on the board. A 1.59% start does not price an 18% month. From about $84,750, the average would land near $100,500. The median would land nearer $95,500. Kalshi still prices a trade through $100,000 by year-end around 40%. September closed +6.33%, the fourth green month in a row. Q3 was +42.6%. The seasonal average did not save October 2025. the month is still early for $BTC . Hold $84,750 and the average is still in reach. Lose it and last October is the closer comparison. we go again >>> #BTC Price Analysis# #Bitcoin Price Prediction: What is Bitcoins next move?# #Bullish $ZEC
$BTC is up 1.59% so far in October, according to Coinglass. The average October on this table is +18.61%. The median is +12.73%. the average is the outlier years. 2013 was +60.8%. 2017 was +47.8%. 2021 was +39.9%. Strip those out and the middle of the set sits nearer +13%. Two Octobers finished red: 2018 at −3.8%, and 2025 at −3.7%. Last October is the recent one, and it was red. this month has four days on the board. A 1.59% start does not price an 18% month. From about $84,750, the average would land near $100,500. The median would land nearer $95,500. Kalshi still prices a trade through $100,000 by year-end around 40%. September closed +6.33%, the fourth green month in a row. Q3 was +42.6%. The seasonal average did not save October 2025. the month is still early for $BTC . Hold $84,750 and the average is still in reach. Lose it and last October is the closer comparison. we go again >>> #BTC Price Analysis# #Bitcoin Price Prediction: What is Bitcoins next move?# #Bullish $ZEC
·
--
См. перевод
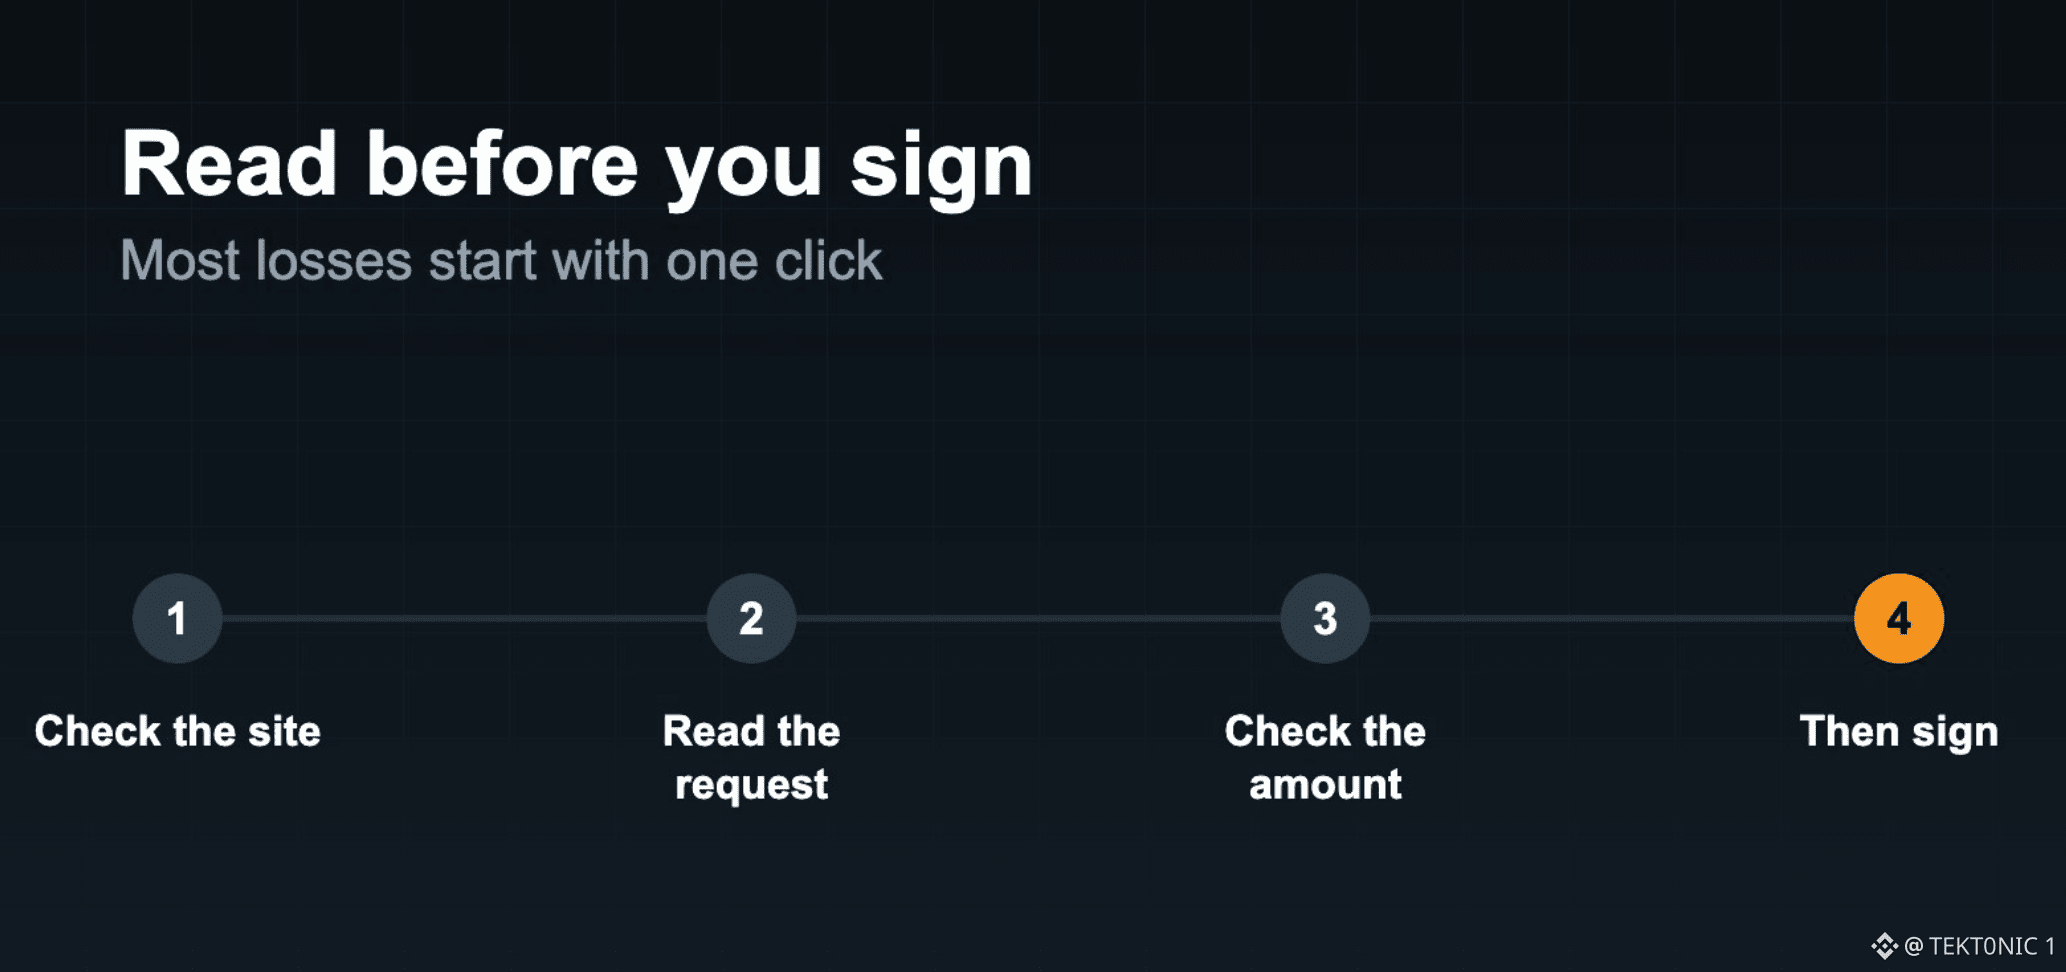
Most Crypto Losses Start With One Signature, Not a Price Drop. The graphic is four checks. Sign is the last step, not the first. According to the checklist, the site comes before the request, and the request comes before the amount. A wallet prompt can move tokens, grant a spend allowance, or drain a balance. The click is the trade. Price volatility is a separate risk. Key Details: > Check the site before you connect. > Read the request before you approve it. > Check the amount before you confirm. > Sign only after those three. A bad signature does not need a bear market. It needs one unread approval. The sequence is the control. Read Before You Sign: Site, Request, Amount, Then Confirm. Do you read the request every time, or only when the amount looks large? #BTC Price Analysis# #Bitcoin Price Prediction: What is Bitcoins next move?# $BTC $ZEC #Macro Insights#
Most Crypto Losses Start With One Signature, Not a Price Drop. The graphic is four checks. Sign is the last step, not the first. According to the checklist, the site comes before the request, and the request comes before the amount. A wallet prompt can move tokens, grant a spend allowance, or drain a balance. The click is the trade. Price volatility is a separate risk. Key Details: > Check the site before you connect. > Read the request before you approve it. > Check the amount before you confirm. > Sign only after those three. A bad signature does not need a bear market. It needs one unread approval. The sequence is the control. Read Before You Sign: Site, Request, Amount, Then Confirm. Do you read the request every time, or only when the amount looks large? #BTC Price Analysis# #Bitcoin Price Prediction: What is Bitcoins next move?# $BTC $ZEC #Macro Insights#
·
--
См. перевод
Binance’s SAFU fund finished converting $1 billion into Bitcoin in February. The stack is 15,000 $BTC , bought at an average near $66,667. At about $84,750, that holding is worth about $1.27 billion. Unrealized gain is about $270 million. SAFU is the user protection fund, started in 2018. The $1 billion had been in stablecoins. Binance moved it into Bitcoin over 30 days and published the wallet. The last tranche was 4,545 $BTC , which took the fund to 15,000. the gain is a mark, not cash. Binance said it will rebalance if the fund’s market value falls under $800 million, and top it back to $1 billion. That floor is about $53,300 a coin. The profit only stays if price holds above the cost. a protection fund in Bitcoin rises and falls with the asset it is meant to insure. At $84,750 the cushion is $270 million. At the $800 million trigger, the cushion is gone and Binance has to add. The stack is 15,000. The rule is the part that matters. #BTC Price Analysis# #Bitcoin Price Prediction: What is Bitcoins next move?# #Bullish $ZEC
Binance’s SAFU fund finished converting $1 billion into Bitcoin in February. The stack is 15,000 $BTC , bought at an average near $66,667. At about $84,750, that holding is worth about $1.27 billion. Unrealized gain is about $270 million. SAFU is the user protection fund, started in 2018. The $1 billion had been in stablecoins. Binance moved it into Bitcoin over 30 days and published the wallet. The last tranche was 4,545 $BTC , which took the fund to 15,000. the gain is a mark, not cash. Binance said it will rebalance if the fund’s market value falls under $800 million, and top it back to $1 billion. That floor is about $53,300 a coin. The profit only stays if price holds above the cost. a protection fund in Bitcoin rises and falls with the asset it is meant to insure. At $84,750 the cushion is $270 million. At the $800 million trigger, the cushion is gone and Binance has to add. The stack is 15,000. The rule is the part that matters. #BTC Price Analysis# #Bitcoin Price Prediction: What is Bitcoins next move?# #Bullish $ZEC

·
--
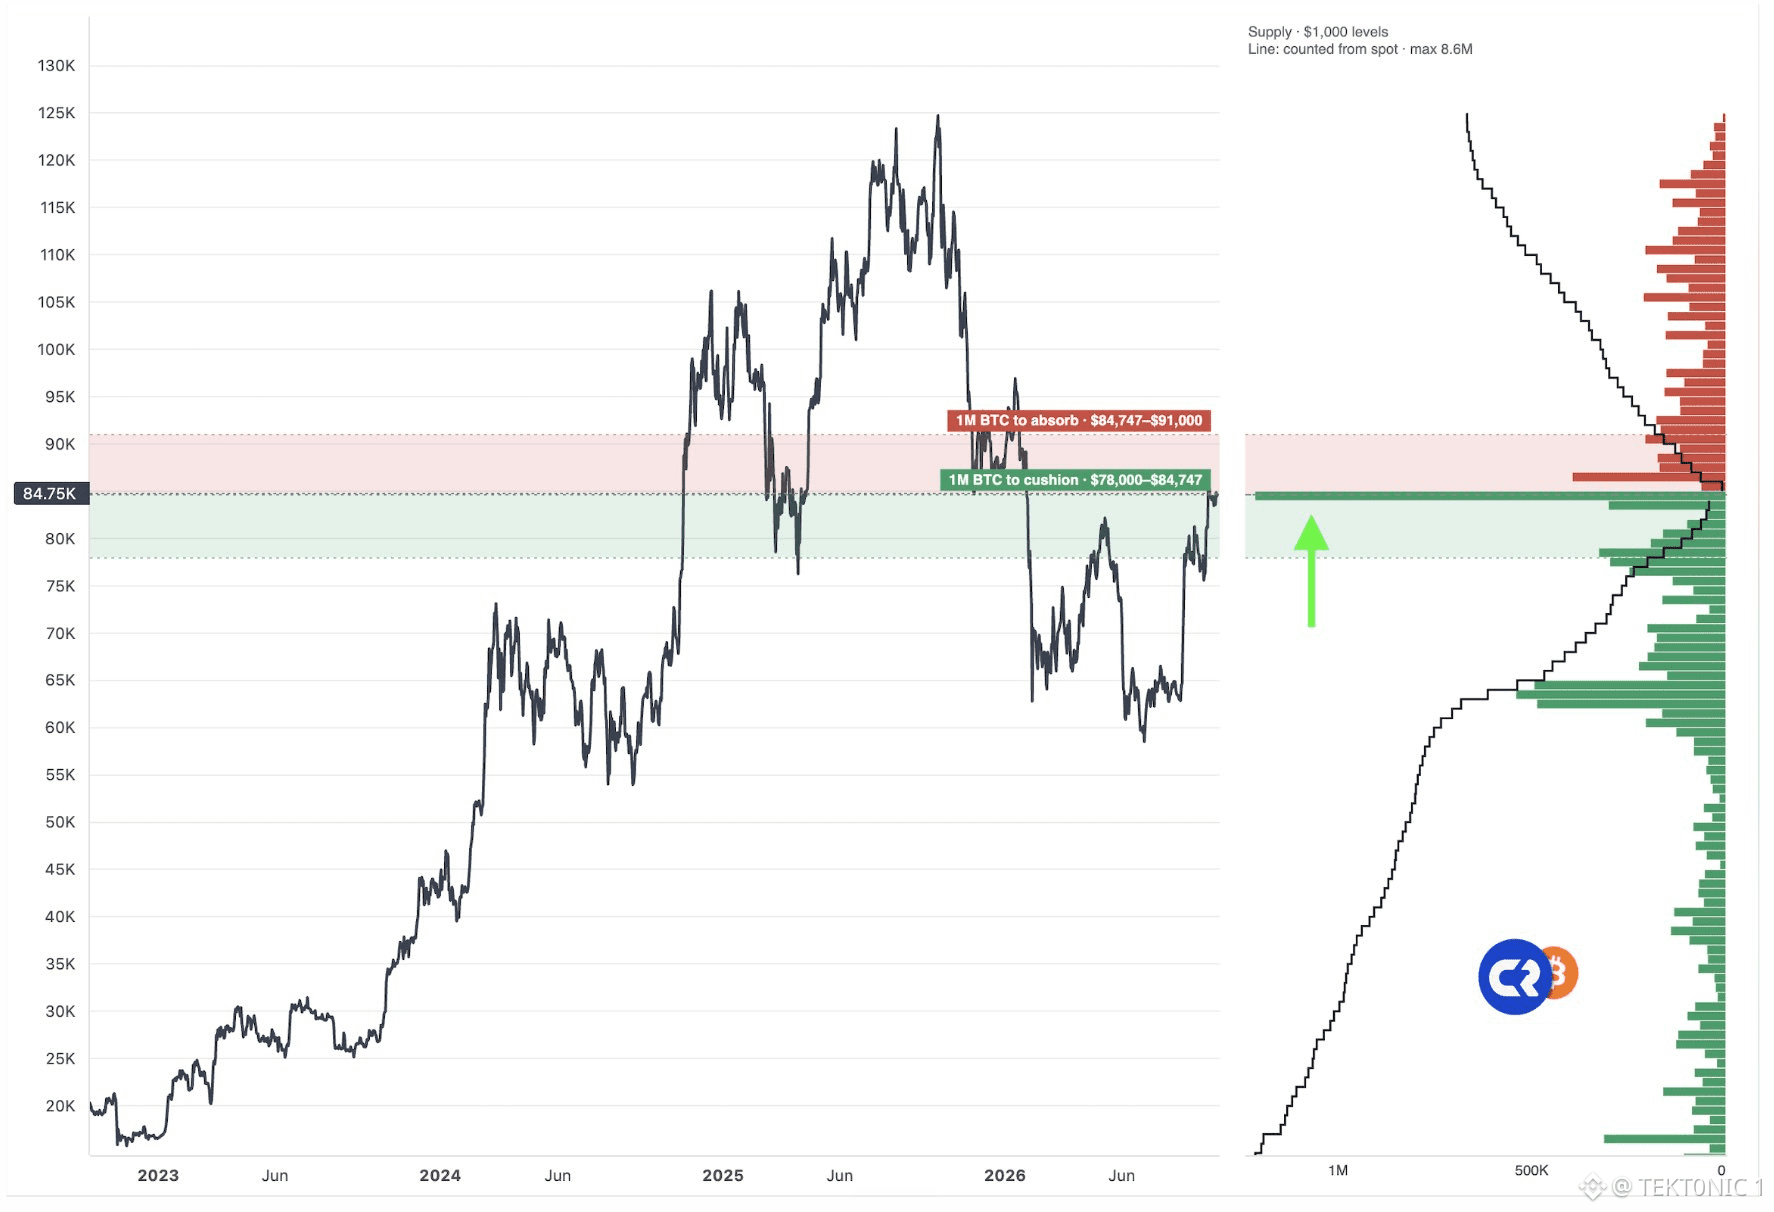
Биткоин находится на границе, которую график отмечает на $84,747. Цена примерно $84,750. Зеленая зона снизу подписана как 1 миллион $BTC запаса — от $78,000 до $84,747. Это предшествующий спотовый объем, который профиль рассматривает как поддержку. Красная зона сверху подписана как 1 миллион BTC для поглощения — от $84,747 до $91,000. Это предложение, которое профиль говорит, что еще нужно проторговать. Покупатели, заходящие в интервал между $84,000 и $85,000 — это заявка на этой границе, а не очищенная зона. Профиль считается от спота по уровням $1,000, с максимумом 8.6 миллионов BTC по шкале. Это исторический объем по цене, а не живые ордера, ожидающие там. В последний раз, когда цена торговалась в красной зоне, это происходило на пути вниз с $126,000. Вернуться выше $91,000 — значит поглотить этот миллион монет. Потеря $84,747 означает, что запас будет следующей проверкой — вниз, к $78,000. Уровень — ключевой уровень по #BTC . Удерживайте $84,747, и работает бид. Потеряйте его — и миллион снизу будет поддержкой только после того, как его протестируют. #BTC Price Analysis# #Bitcoin Price Prediction: What is Bitcoins next move?# $ETH
Биткоин находится на границе, которую график отмечает на $84,747. Цена примерно $84,750. Зеленая зона снизу подписана как 1 миллион $BTC запаса — от $78,000 до $84,747. Это предшествующий спотовый объем, который профиль рассматривает как поддержку. Красная зона сверху подписана как 1 миллион BTC для поглощения — от $84,747 до $91,000. Это предложение, которое профиль говорит, что еще нужно проторговать. Покупатели, заходящие в интервал между $84,000 и $85,000 — это заявка на этой границе, а не очищенная зона. Профиль считается от спота по уровням $1,000, с максимумом 8.6 миллионов BTC по шкале. Это исторический объем по цене, а не живые ордера, ожидающие там. В последний раз, когда цена торговалась в красной зоне, это происходило на пути вниз с $126,000. Вернуться выше $91,000 — значит поглотить этот миллион монет. Потеря $84,747 означает, что запас будет следующей проверкой — вниз, к $78,000. Уровень — ключевой уровень по #BTC . Удерживайте $84,747, и работает бид. Потеряйте его — и миллион снизу будет поддержкой только после того, как его протестируют. #BTC Price Analysis# #Bitcoin Price Prediction: What is Bitcoins next move?# $ETH
8
·
--
См. перевод
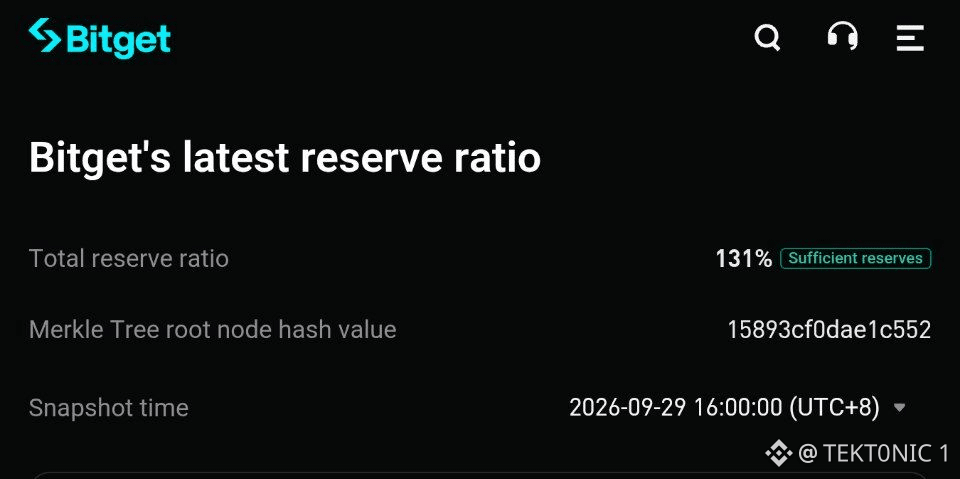
Bitget’s latest proof of reserves puts the total reserve ratio at 131%, snapshot September 29. That is issue 47, across 19 assets, and the exchange tags it as sufficient reserves. A 100% ratio is 1:1 coverage of the assets in the report. 131% is a buffer on that set. the snapshot came five days after the September 24 incident, about $387.5 million moved out of hot and warm wallets. Bitget said cold wallets and user balances were not hit, and that the user protection fund would cover it. $BTC in the report is at 142%. USDT is at 107%. BNB is at 104%. The prior snapshot was 135%. the protection fund is the other number. Bitget says it has been topped back up to 3,705 BTC, about $316 million. That fund is a reserve for incidents. It is not the same as the 131% ratio, which is a Merkle-tree snapshot of covered user assets. a ratio above 100% is coverage on the 19 assets in the file. It is not a full audit of every liability. Watch the next snapshot, and whether the fund stays at 3,705 $BTC after claims. The buffer is there. The incident is why the snapshot matters. #BTC Price Analysis# #Bitcoin Price Prediction: What is Bitcoins next move?# $ZEC #Bullish
Bitget’s latest proof of reserves puts the total reserve ratio at 131%, snapshot September 29. That is issue 47, across 19 assets, and the exchange tags it as sufficient reserves. A 100% ratio is 1:1 coverage of the assets in the report. 131% is a buffer on that set. the snapshot came five days after the September 24 incident, about $387.5 million moved out of hot and warm wallets. Bitget said cold wallets and user balances were not hit, and that the user protection fund would cover it. $BTC in the report is at 142%. USDT is at 107%. BNB is at 104%. The prior snapshot was 135%. the protection fund is the other number. Bitget says it has been topped back up to 3,705 BTC, about $316 million. That fund is a reserve for incidents. It is not the same as the 131% ratio, which is a Merkle-tree snapshot of covered user assets. a ratio above 100% is coverage on the 19 assets in the file. It is not a full audit of every liability. Watch the next snapshot, and whether the fund stays at 3,705 $BTC after claims. The buffer is there. The incident is why the snapshot matters. #BTC Price Analysis# #Bitcoin Price Prediction: What is Bitcoins next move?# $ZEC #Bullish
·
--
См. перевод
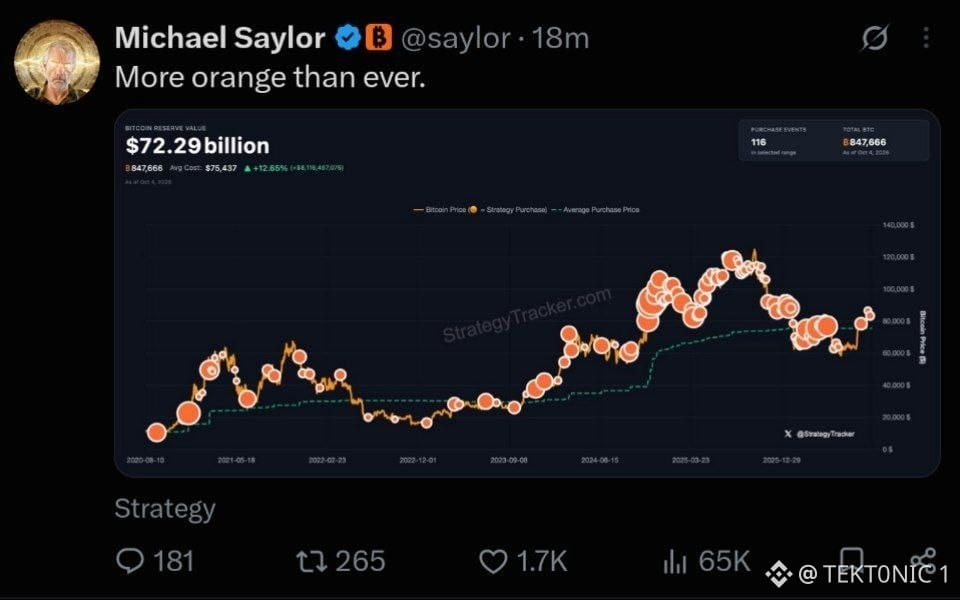
Saylor posted “More orange than ever,” with Strategy’s stack at 847,666 $BTC . Reserve value is $72.29 billion. Average cost is $75,437. The position is about 12.9% in the green, or $8.1 billion. that total is not a new buy. The last disclosed purchase was 1,665 BTC between September 21 and September 27, at $85,681, funded with MSTR stock. That filing is what took the stack to 847,666. The October 4 chart is the same number, across 116 purchases since August 2020. the company is still the largest corporate holder of $BTC . It is also trading below the bitcoin on the balance sheet, with mNAV near 0.76. Equity issuance funded the last clip. A post with the old total is a mark. A new 8-K is a buy. watch the next filing, not the caption. If the stack is still 847,666, nothing was added. If it moves, they bought again. #BTC Price Analysis# #Bitcoin Price Prediction: What is Bitcoins next move?# #MichaelSaylor $XRP
Saylor posted “More orange than ever,” with Strategy’s stack at 847,666 $BTC . Reserve value is $72.29 billion. Average cost is $75,437. The position is about 12.9% in the green, or $8.1 billion. that total is not a new buy. The last disclosed purchase was 1,665 BTC between September 21 and September 27, at $85,681, funded with MSTR stock. That filing is what took the stack to 847,666. The October 4 chart is the same number, across 116 purchases since August 2020. the company is still the largest corporate holder of $BTC . It is also trading below the bitcoin on the balance sheet, with mNAV near 0.76. Equity issuance funded the last clip. A post with the old total is a mark. A new 8-K is a buy. watch the next filing, not the caption. If the stack is still 847,666, nothing was added. If it moves, they bought again. #BTC Price Analysis# #Bitcoin Price Prediction: What is Bitcoins next move?# #MichaelSaylor $XRP
·
--
См. перевод
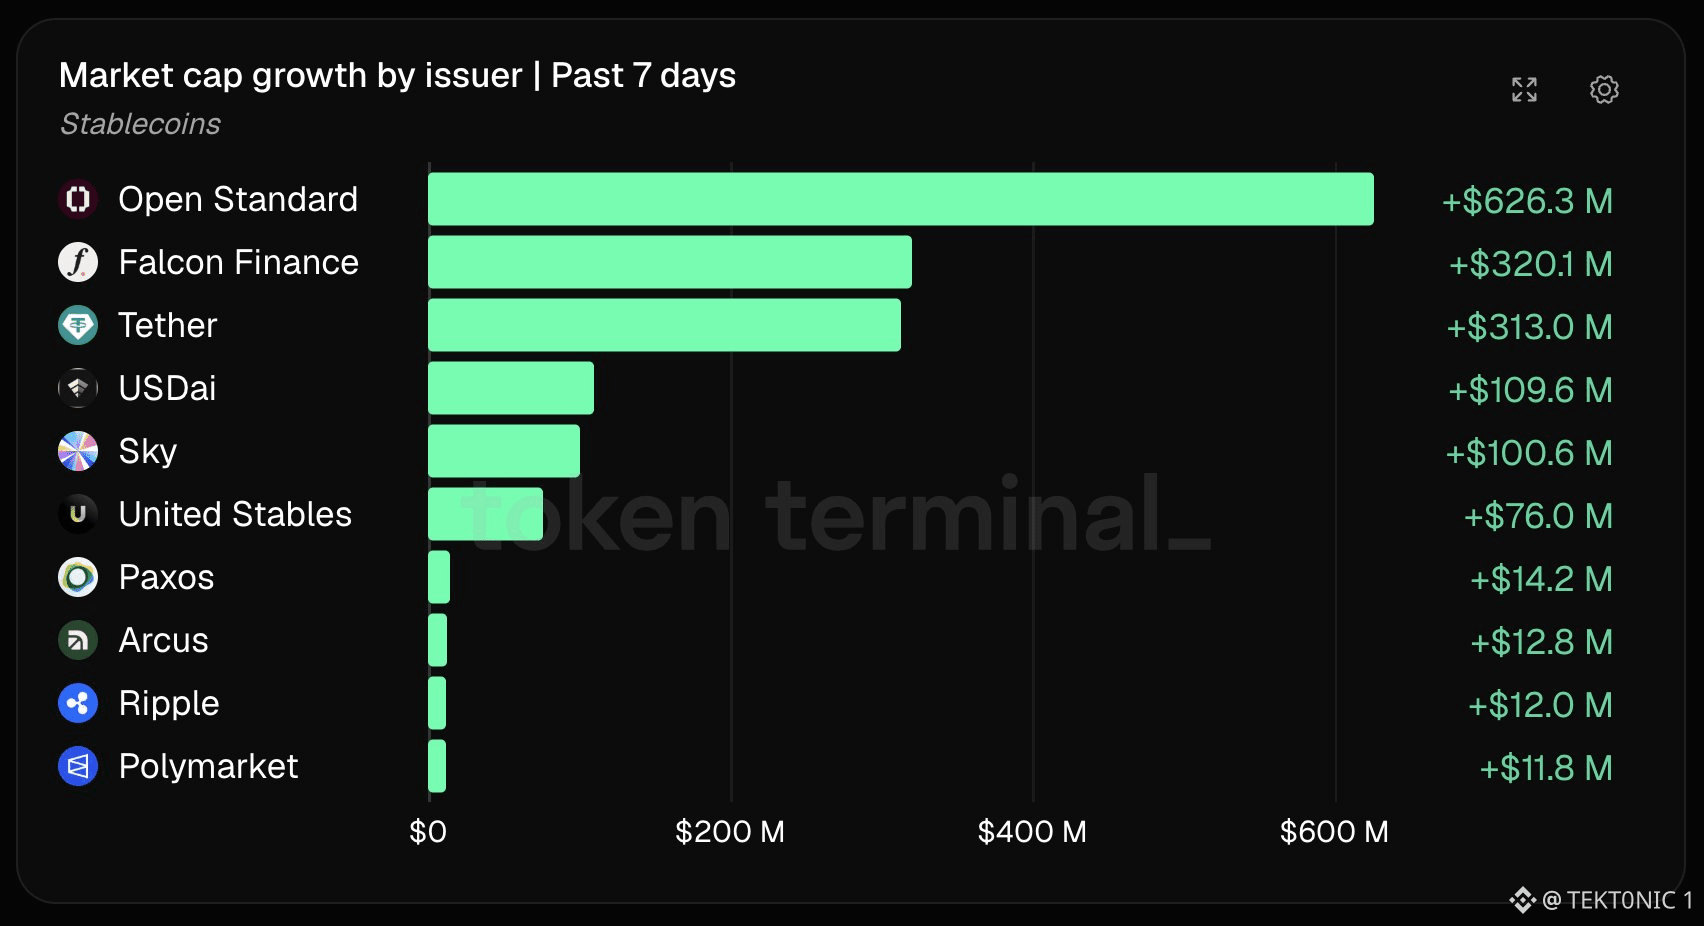
stablecoin supply is still expanding, but some projects are growing much faster than others. over the past 7 days, Open Standard recorded the largest increase in stablecoin market cap at +$626.3m. > Open Standard — +$626.3m > Falcon Finance — +$320.1m > Tether — +$313.0m the move from Open Standard is almost double Falcon’s increase and shows how quickly smaller stablecoin issuers can add supply. for context, the total stablecoin market is now around $307b, with roughly $1.8b added over the last 7 days. stablecoin supply is still moving higher, and the growth isn’t coming from just USDT and USDC. #BTC Price Analysis# #Bitcoin Price Prediction: What is Bitcoins next move?# #Stablecoins $BTC $XRP
stablecoin supply is still expanding, but some projects are growing much faster than others. over the past 7 days, Open Standard recorded the largest increase in stablecoin market cap at +$626.3m. > Open Standard — +$626.3m > Falcon Finance — +$320.1m > Tether — +$313.0m the move from Open Standard is almost double Falcon’s increase and shows how quickly smaller stablecoin issuers can add supply. for context, the total stablecoin market is now around $307b, with roughly $1.8b added over the last 7 days. stablecoin supply is still moving higher, and the growth isn’t coming from just USDT and USDC. #BTC Price Analysis# #Bitcoin Price Prediction: What is Bitcoins next move?# #Stablecoins $BTC $XRP
26
·
--
См. перевод
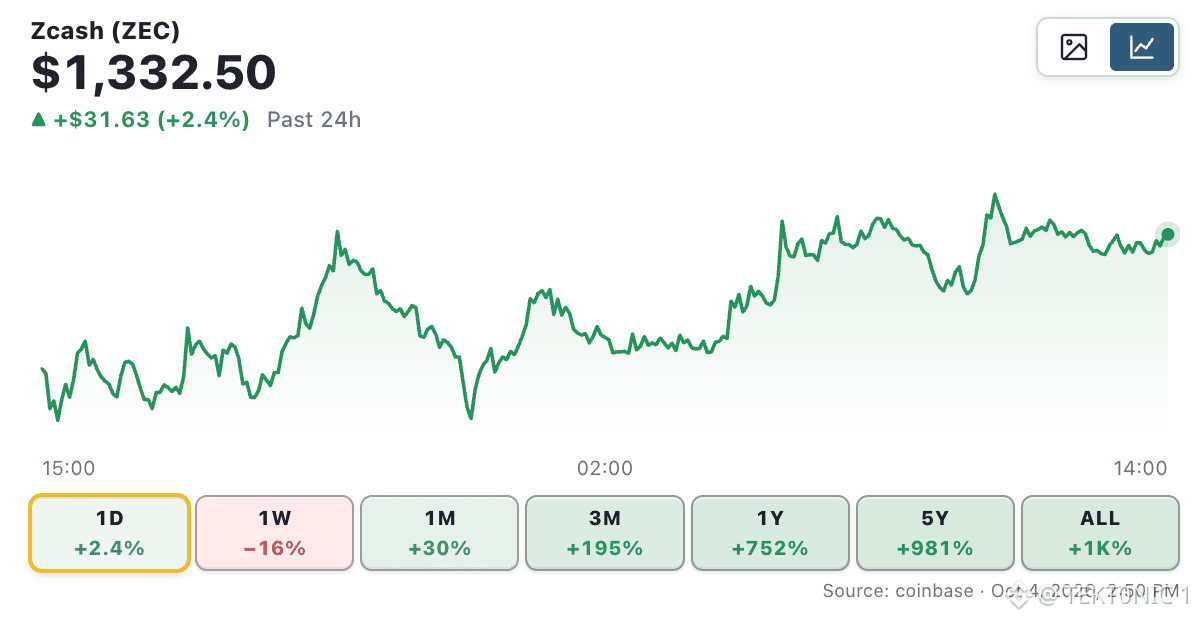
Spot $ZEC ETFs just had their first red week. Grayscale’s ZCSH lost $93.56 million in the week ended October 2, according to SoSoValue. That is the first net outflow since late August. September 30 was −$30.25 million. October 2 was −$26.93 million. Assets fell to about $751 million, from a September peak near $979 million. the fund had been taking coins in. September alone was about +$246 million. Cumulative inflows are still positive, near $213 million, after a launch on August 25. $ZEC closed near $1,304 on October 3, about 21% under the September 26 close above $1,650. flows are creations and redemptions, not Grayscale selling from its own book. They do pull spot demand the next day. Grayscale still says #Zcash can grow its share of the privacy market. The week did not. one red week after a $246 million month. Watch whether next week stays red. The launch bid just got its first test. #BTC Price Analysis# #Bitcoin Price Prediction: What is Bitcoins next move?# $BTC
Spot $ZEC ETFs just had their first red week. Grayscale’s ZCSH lost $93.56 million in the week ended October 2, according to SoSoValue. That is the first net outflow since late August. September 30 was −$30.25 million. October 2 was −$26.93 million. Assets fell to about $751 million, from a September peak near $979 million. the fund had been taking coins in. September alone was about +$246 million. Cumulative inflows are still positive, near $213 million, after a launch on August 25. $ZEC closed near $1,304 on October 3, about 21% under the September 26 close above $1,650. flows are creations and redemptions, not Grayscale selling from its own book. They do pull spot demand the next day. Grayscale still says #Zcash can grow its share of the privacy market. The week did not. one red week after a $246 million month. Watch whether next week stays red. The launch bid just got its first test. #BTC Price Analysis# #Bitcoin Price Prediction: What is Bitcoins next move?# $BTC
26
·
--
См. перевод
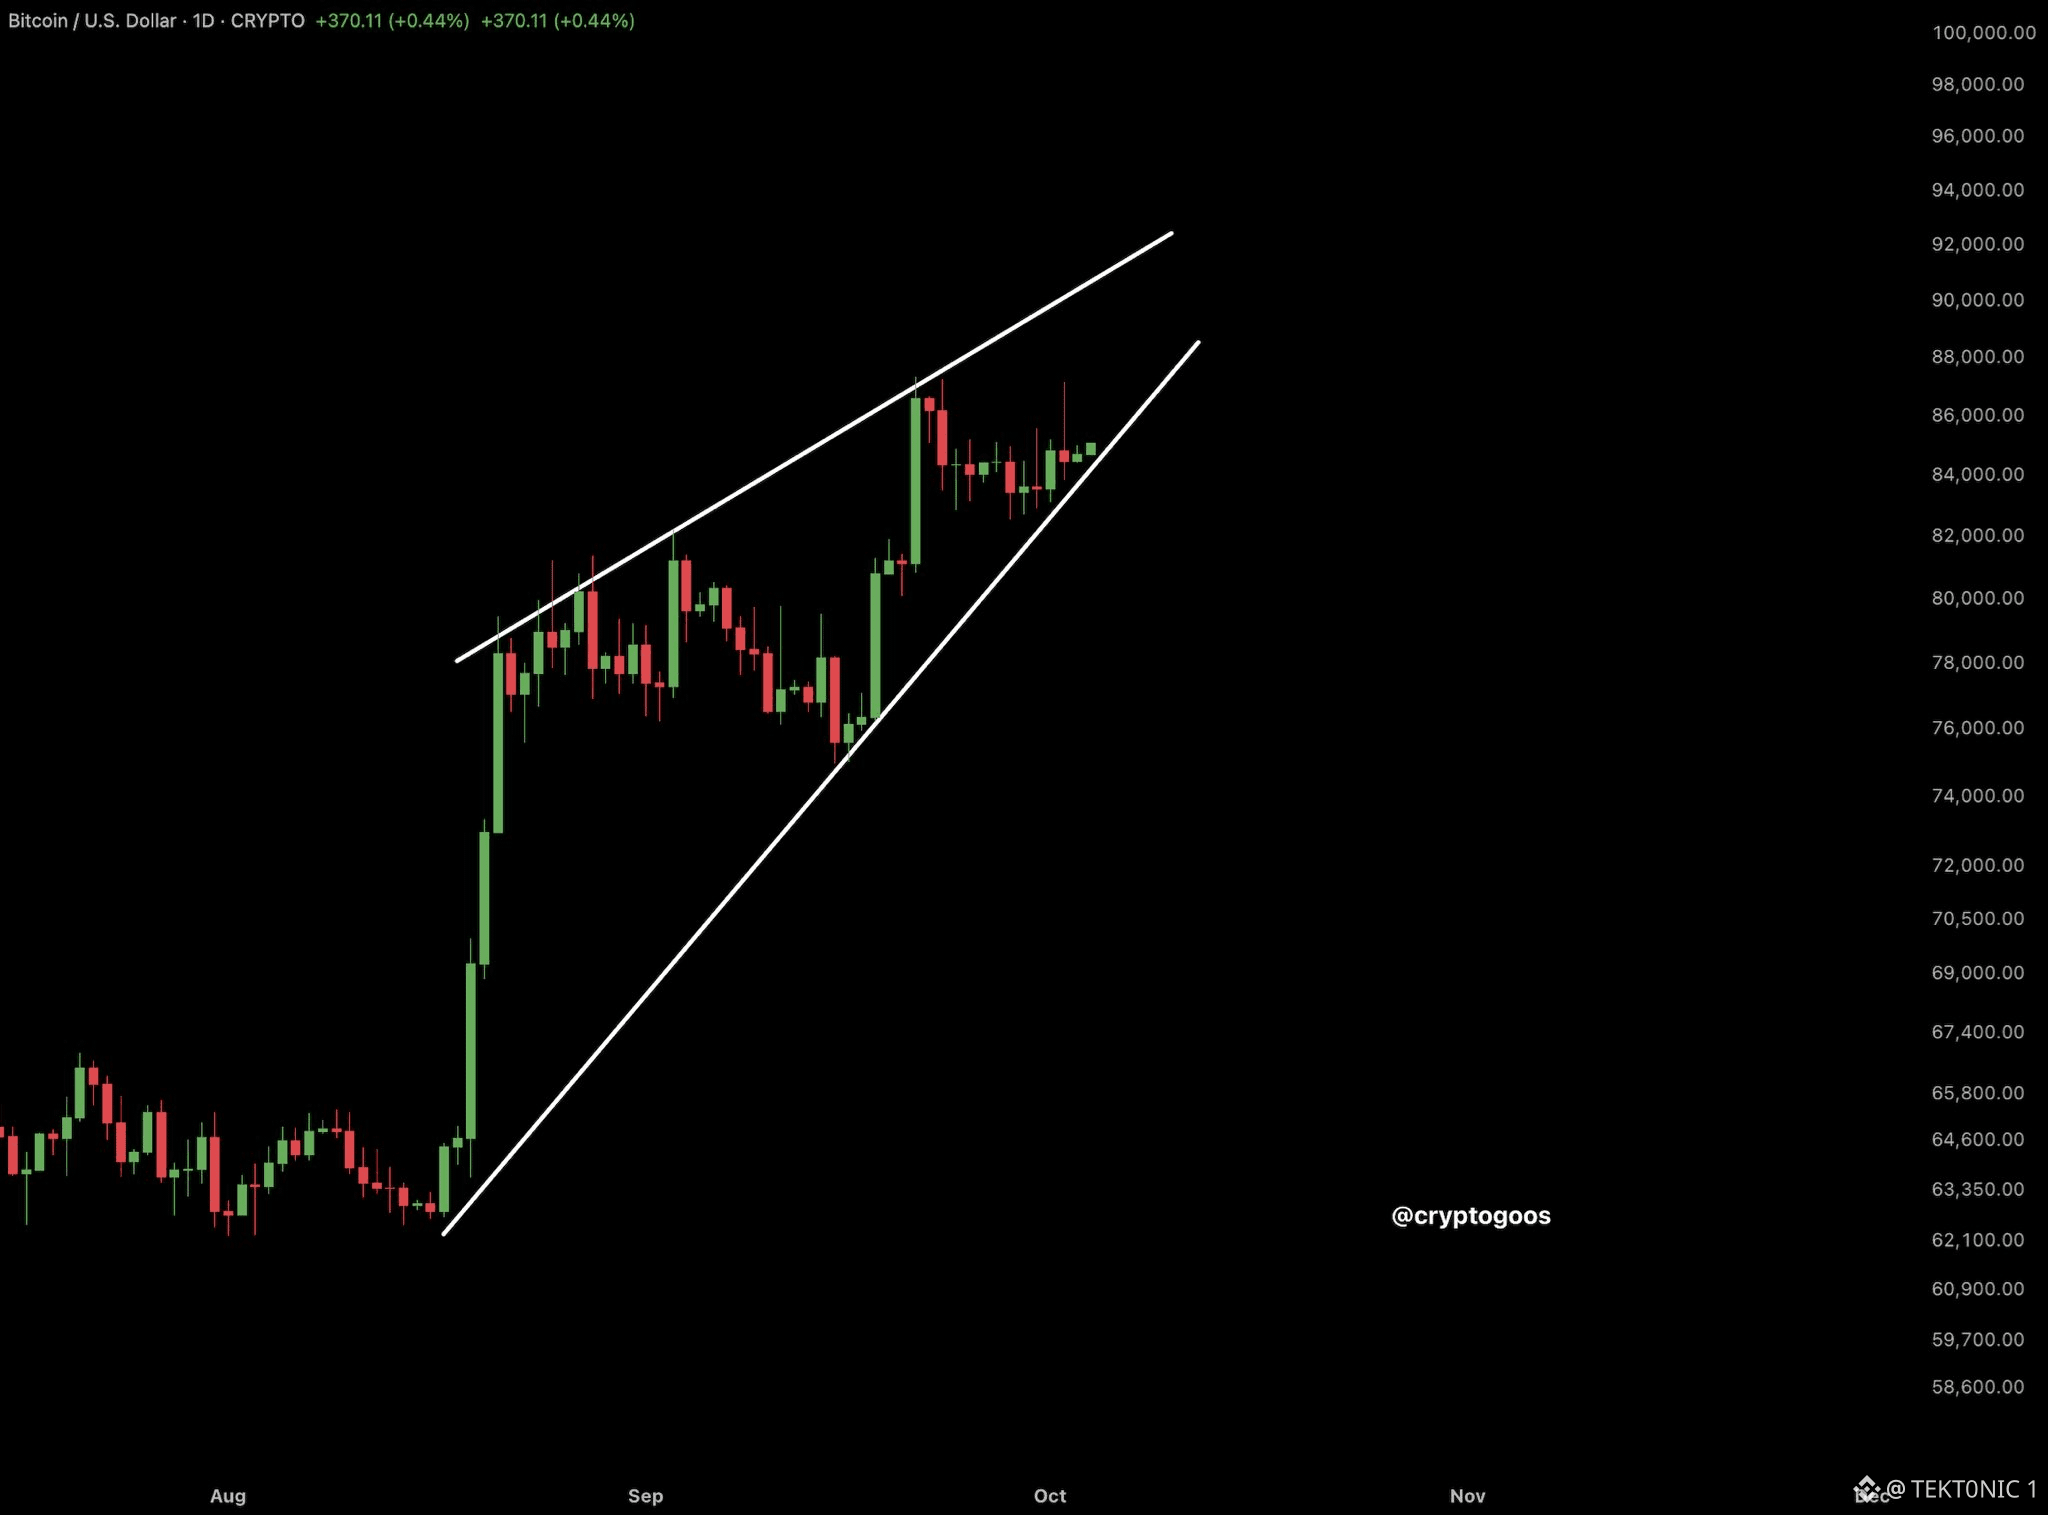
$BTC is trading inside a rising wedge on the daily chart. price is near $84,500 after the October push through $86,000 failed to hold. The lower trendline rises from the late-August low near $62,000 and now sits under the market, around the low $80,000s. The upper trendline caps the September high near $87,000 and points toward $92,000. a rising wedge is a narrowing advance. Higher lows, higher highs, less room between them. It holds as long as price stays above that rising support. A daily close back under it puts the August-to-October advance in doubt. A close through the upper trendline, above the September high, is the break the other way. the level that matters on the $BTC chart is the support. Hold it and the wedge is intact. Lose it and the pattern fails. #BTC Price Analysis# #Bitcoin Price Prediction: What is Bitcoins next move?# $ZEC #Bullish
$BTC is trading inside a rising wedge on the daily chart. price is near $84,500 after the October push through $86,000 failed to hold. The lower trendline rises from the late-August low near $62,000 and now sits under the market, around the low $80,000s. The upper trendline caps the September high near $87,000 and points toward $92,000. a rising wedge is a narrowing advance. Higher lows, higher highs, less room between them. It holds as long as price stays above that rising support. A daily close back under it puts the August-to-October advance in doubt. A close through the upper trendline, above the September high, is the break the other way. the level that matters on the $BTC chart is the support. Hold it and the wedge is intact. Lose it and the pattern fails. #BTC Price Analysis# #Bitcoin Price Prediction: What is Bitcoins next move?# $ZEC #Bullish
40
·
--
См. перевод
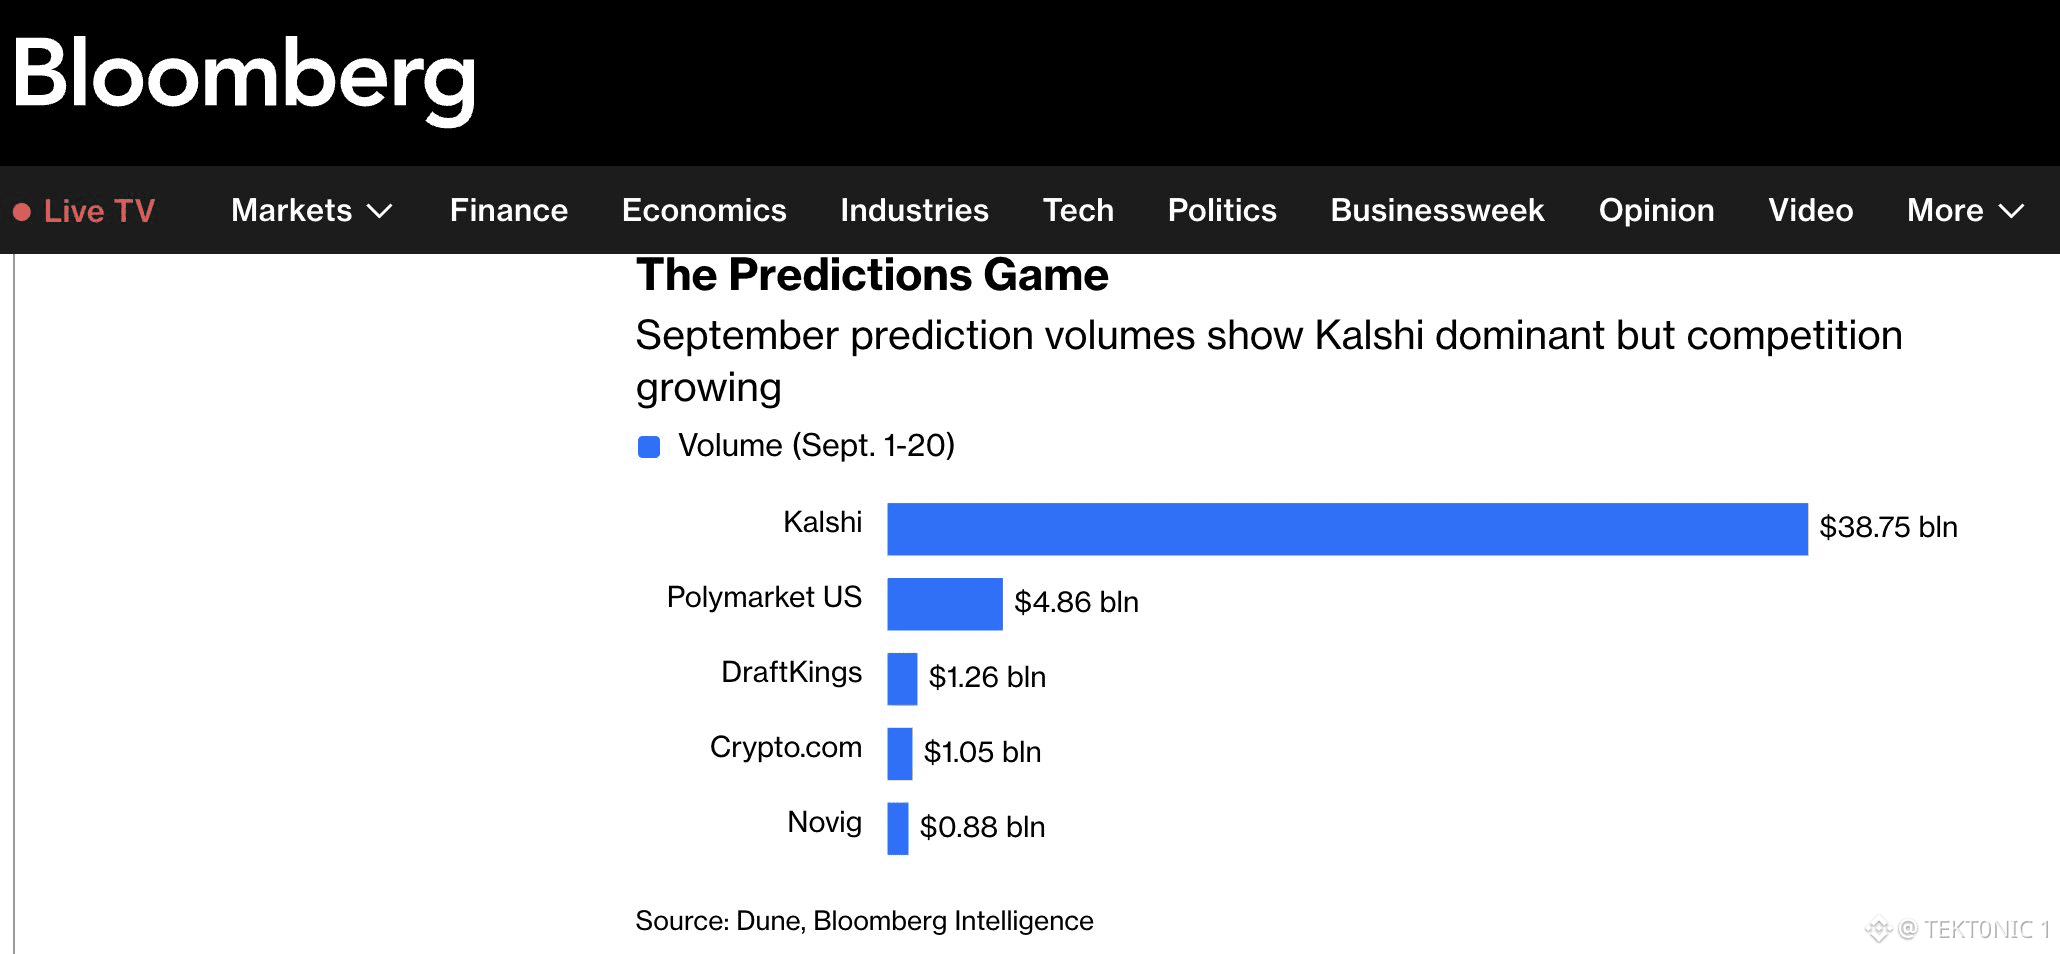
trading volume is useful, but I think prediction markets are showing why volume alone isn’t enough. the recent Kalshi debate is a good example. CoinDesk found that recurring fixed-dollar trades accounted for 57% of sampled $ETH perpetual volume and 54% of sampled $BTC volume. That raised questions about what was actually driving the reported activity. CoinDesk Kalshi pushed back, saying the trades came from a market maker providing liquidity and that hundreds of distinct traders were taking the other side. It also said it blocks self-trading and monitors for coordinated activity. Kalshi News so this doesn’t prove the volume was fake. but it does highlight the issue. $500M in volume can look very different depending on who generated it. when evaluating prediction markets, I’d look beyond volume: → unique traders → open interest → trade-size distribution → liquidity → repeat activity → incentives behind the volume volume tells you how much traded. it doesn’t always tell you how real the demand is. #BTC Price Analysis# #Bitcoin Price Prediction: What is Bitcoins next move?# $BTC $ETH #Macro Insights#
trading volume is useful, but I think prediction markets are showing why volume alone isn’t enough. the recent Kalshi debate is a good example. CoinDesk found that recurring fixed-dollar trades accounted for 57% of sampled $ETH perpetual volume and 54% of sampled $BTC volume. That raised questions about what was actually driving the reported activity. CoinDesk Kalshi pushed back, saying the trades came from a market maker providing liquidity and that hundreds of distinct traders were taking the other side. It also said it blocks self-trading and monitors for coordinated activity. Kalshi News so this doesn’t prove the volume was fake. but it does highlight the issue. $500M in volume can look very different depending on who generated it. when evaluating prediction markets, I’d look beyond volume: → unique traders → open interest → trade-size distribution → liquidity → repeat activity → incentives behind the volume volume tells you how much traded. it doesn’t always tell you how real the demand is. #BTC Price Analysis# #Bitcoin Price Prediction: What is Bitcoins next move?# $BTC $ETH #Macro Insights#
49
·
--
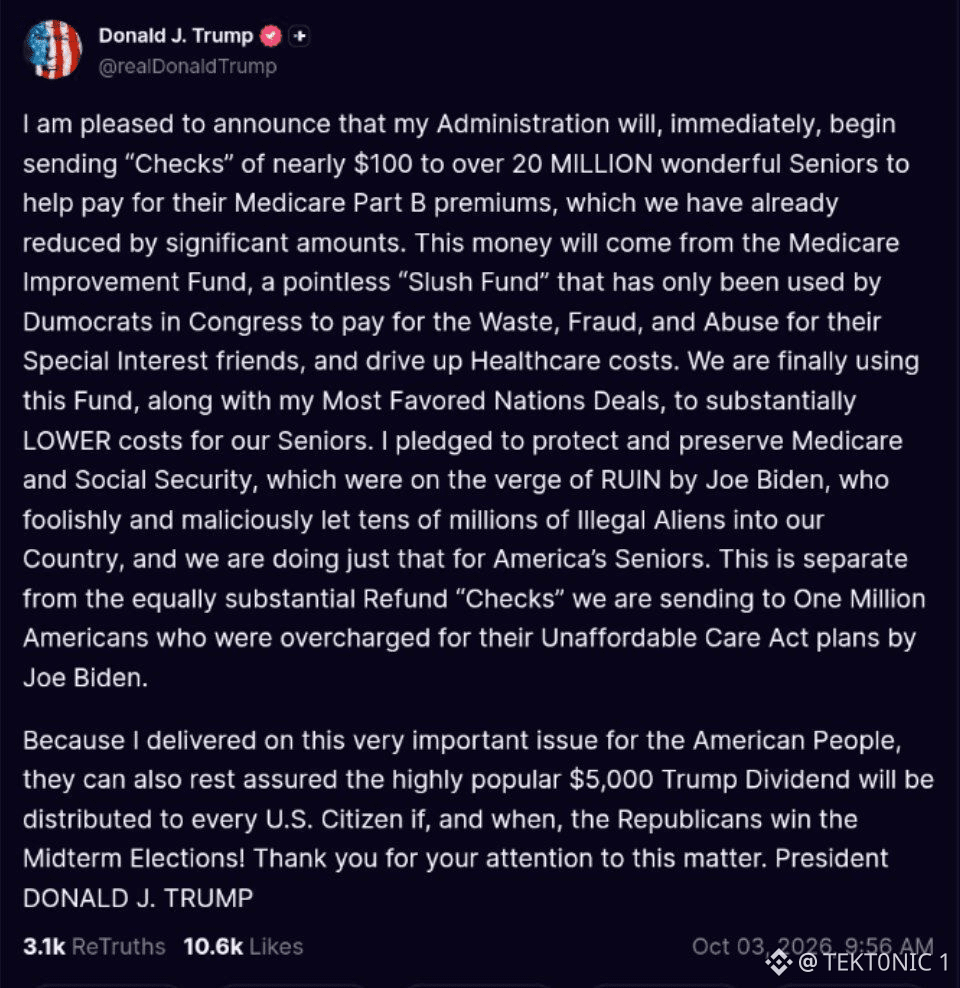
Трамп возвращает прямые выплаты в центр экономических дебатов. Администрация заявляет, что более 20 млн получателей Medicare Part B получат разовую выплату в $90 в октябре, чтобы помочь покрыть взносы. Затем есть гораздо более масштабное предложение. Трамп пообещал выплату «Trump Dividend» в размере $5,000 каждому взрослому гражданину США, если республиканцы сохранят контроль над Конгрессом после ноябрьских промежуточных выборов. Приблизительно 240 млн подходящих взрослых это будет означать потенциальную стоимость около $1,2 трлн. Но выплата в $5,000 по-прежнему является предложением и потребует одобрения Конгресса. Две совершенно разные выплаты, но обе указывают на одну и ту же проблему: прямые денежные выплаты становятся важной частью экономической и политической дискуссии в США. #BTC Price Analysis# #Bitcoin Price Prediction: Что будет следующим шагом Биткоина?# $BTC $ZEC #Макро идеи#
Трамп возвращает прямые выплаты в центр экономических дебатов. Администрация заявляет, что более 20 млн получателей Medicare Part B получат разовую выплату в $90 в октябре, чтобы помочь покрыть взносы. Затем есть гораздо более масштабное предложение. Трамп пообещал выплату «Trump Dividend» в размере $5,000 каждому взрослому гражданину США, если республиканцы сохранят контроль над Конгрессом после ноябрьских промежуточных выборов. Приблизительно 240 млн подходящих взрослых это будет означать потенциальную стоимость около $1,2 трлн. Но выплата в $5,000 по-прежнему является предложением и потребует одобрения Конгресса. Две совершенно разные выплаты, но обе указывают на одну и ту же проблему: прямые денежные выплаты становятся важной частью экономической и политической дискуссии в США. #BTC Price Analysis# #Bitcoin Price Prediction: Что будет следующим шагом Биткоина?# $BTC $ZEC #Макро идеи#
74
·
--
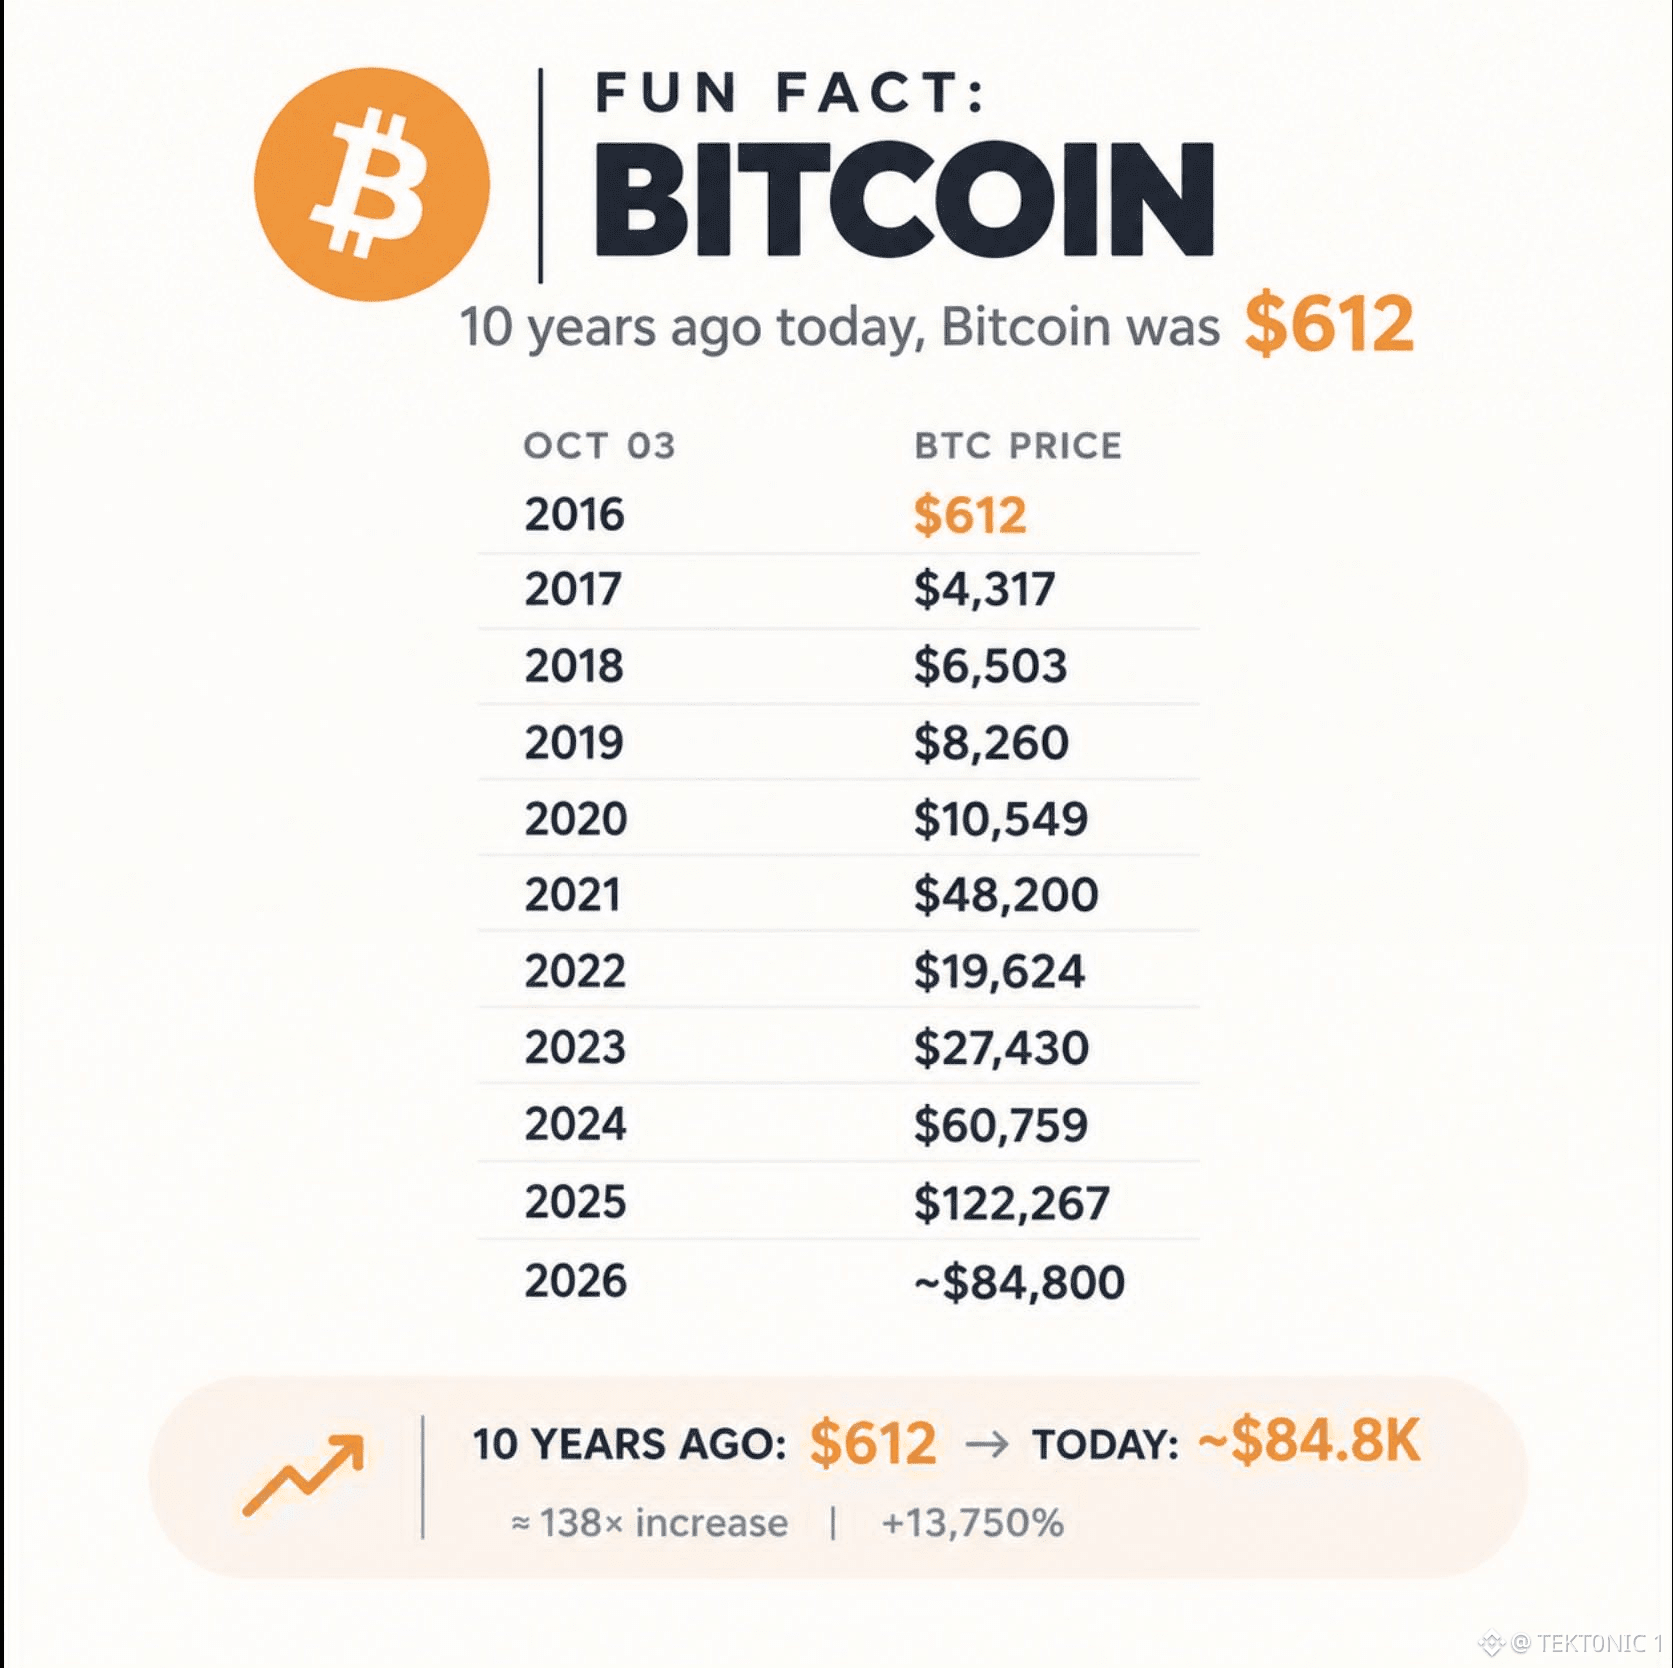
$BTC в этот день в 2016 году стоил $612. Примерно за $83,400 — это около 136 раз по цене, до рывка 2 октября, когда цена пробила $86,000. Монета, купленная за $612, сейчас стоит примерно $136,000. $10,000, вложенные в тот день, составили около 16.3 bitcoin и сегодня стоят примерно $1.36 миллиона. Те же $10,000, оставленные на 20-летних гособлигациях Казначейства с 2016 года, сейчас отмечаются примерно в $7,830 — убыток с учётом инфляции. У одних нет купона. Другие должны были быть безопасным активом. Путь между этими двумя ценами не был прямой линией вверх. В 2018 году $BTC торговался ниже $3,200, в 2022 — ниже $16,000, а в начале этого года после максимума около $126,000 — примерно в середине $60,000. Любой, кто держал полное десятилетие, пережил просадки более 80%. Десять лет — это выборка. Это не следующая запись. Новая покупка по $83,400 требует другого десятилетия, чтобы повторить 136-кратный рост. Показание $612 — рекорд. Именно удержание и дало результат. #BTC Price Analysis# #Bitcoin Price Prediction: What is Bitcoins next move?# $XRP
$BTC в этот день в 2016 году стоил $612. Примерно за $83,400 — это около 136 раз по цене, до рывка 2 октября, когда цена пробила $86,000. Монета, купленная за $612, сейчас стоит примерно $136,000. $10,000, вложенные в тот день, составили около 16.3 bitcoin и сегодня стоят примерно $1.36 миллиона. Те же $10,000, оставленные на 20-летних гособлигациях Казначейства с 2016 года, сейчас отмечаются примерно в $7,830 — убыток с учётом инфляции. У одних нет купона. Другие должны были быть безопасным активом. Путь между этими двумя ценами не был прямой линией вверх. В 2018 году $BTC торговался ниже $3,200, в 2022 — ниже $16,000, а в начале этого года после максимума около $126,000 — примерно в середине $60,000. Любой, кто держал полное десятилетие, пережил просадки более 80%. Десять лет — это выборка. Это не следующая запись. Новая покупка по $83,400 требует другого десятилетия, чтобы повторить 136-кратный рост. Показание $612 — рекорд. Именно удержание и дало результат. #BTC Price Analysis# #Bitcoin Price Prediction: What is Bitcoins next move?# $XRP
·
--
См. перевод
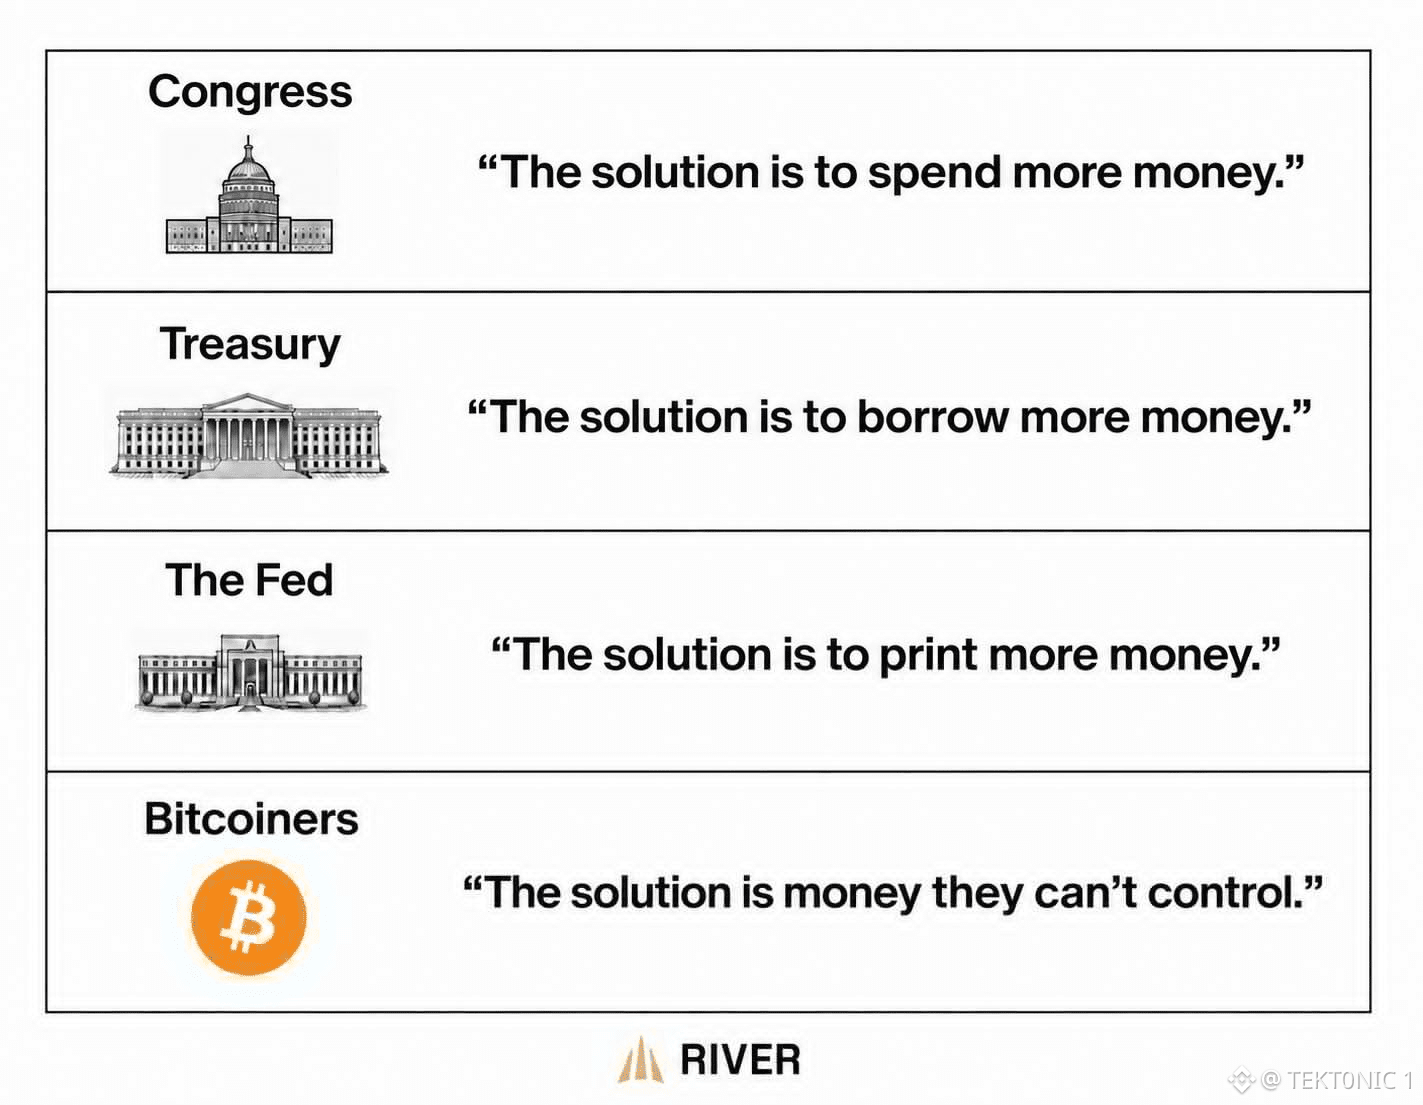
Congress spends, the Treasury borrows, and the Fed has been the buyer of last resort when the long end breaks. That is the loop in the River graphic. The numbers behind it are already on the tape this month. the 10-year yield hit 5.34%, the highest since 2002, even after the Treasury more than doubled its long-end buybacks. The 30-year mortgage rate is 7.28%, up from 2.65% in 2021. Inflation has sat above 2% for more than five years. A $4 billion to $6 billion buyback does not retire the debt. Issuance continues, and the Treasury market turns over more than $1 trillion a day. Bitcoin is the asset outside that loop. Supply is capped. No agency can expand it to fund a deficit. Exchange reserves are near 2.7 million $BTC , down from about 3.15 million in mid-2024. That is tighter inventory, not a claim that price only goes one way. It still fell from about $126,000 to the low $60,000s in this cycle. the way out is the supply rule, not the slogan. It holds if issuance keeps rising and the 10-year stays above 5%. It does not pay a mortgage at 7.28%. That spread is the cost of the system the graphic is describing. #BTC Price Analysis# #Bitcoin Price Prediction: What is Bitcoins next move?# $BTC $XRP #Macro Insights#
Congress spends, the Treasury borrows, and the Fed has been the buyer of last resort when the long end breaks. That is the loop in the River graphic. The numbers behind it are already on the tape this month. the 10-year yield hit 5.34%, the highest since 2002, even after the Treasury more than doubled its long-end buybacks. The 30-year mortgage rate is 7.28%, up from 2.65% in 2021. Inflation has sat above 2% for more than five years. A $4 billion to $6 billion buyback does not retire the debt. Issuance continues, and the Treasury market turns over more than $1 trillion a day. Bitcoin is the asset outside that loop. Supply is capped. No agency can expand it to fund a deficit. Exchange reserves are near 2.7 million $BTC , down from about 3.15 million in mid-2024. That is tighter inventory, not a claim that price only goes one way. It still fell from about $126,000 to the low $60,000s in this cycle. the way out is the supply rule, not the slogan. It holds if issuance keeps rising and the 10-year stays above 5%. It does not pay a mortgage at 7.28%. That spread is the cost of the system the graphic is describing. #BTC Price Analysis# #Bitcoin Price Prediction: What is Bitcoins next move?# $BTC $XRP #Macro Insights#
·
--
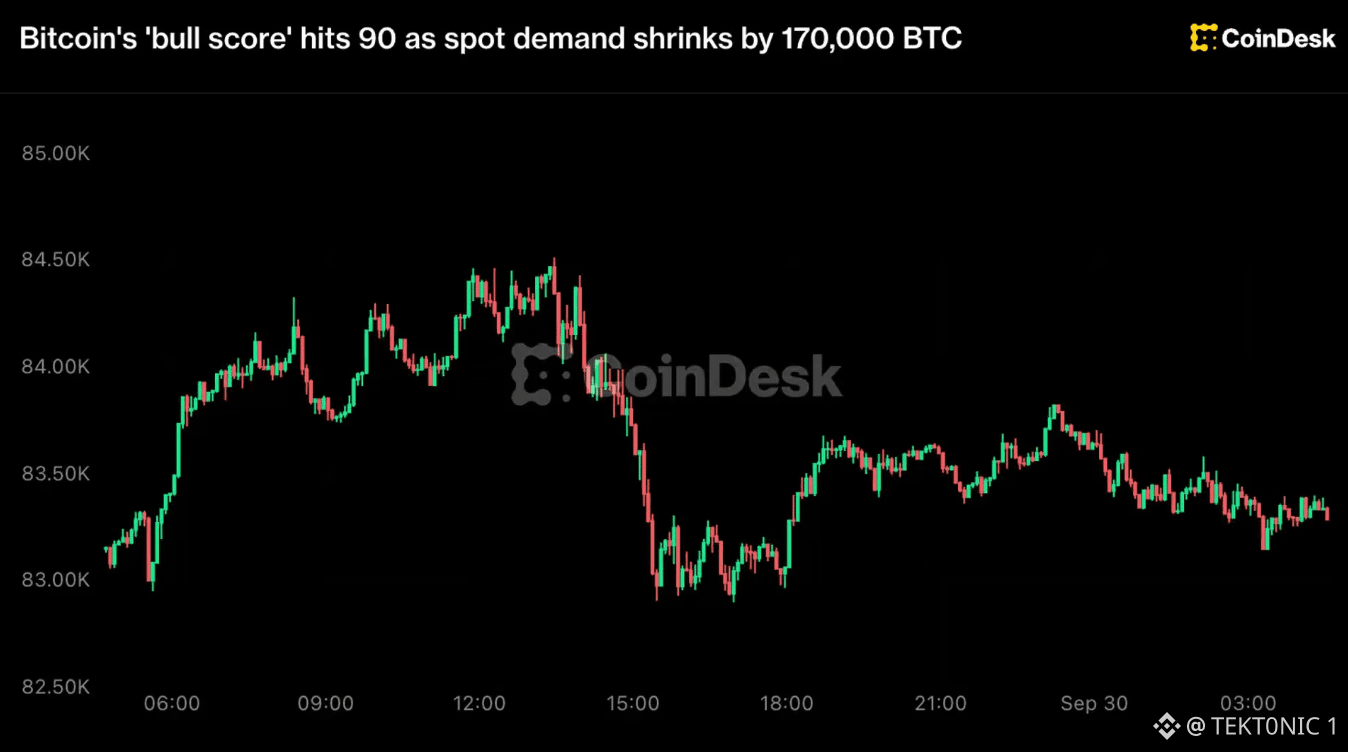
Структура рынка Bitcoin начинает выглядеть более конструктивно. CryptoQuant недавно подтвердила новый сигнал бычьего рынка после того, как $BTC вернул свою 365-дневную скользящую среднюю. Также $BTC только что завершил Q3 с ростом более чем на 40% — это его самый сильный квартал почти за два года. The Wall Street Journal, но это не значит, что любая коррекция автоматически является покупкой. Похоже, спрос на споте остыл, фиксация прибыли усилилась, и $BTC по-прежнему с трудом держится в районе сопротивления $87K. Бычий сценарий улучшается. Следующее испытание — сможет ли $BTC удержать диапазон $82K–$84K и в конечном итоге уверенно пробить $87K. Бычий рынок или нет — цена всё равно должна это подтвердить. #BTC Price Analysis# #Bitcoin Price Prediction: What is Bitcoins next move?# $ETH
Структура рынка Bitcoin начинает выглядеть более конструктивно. CryptoQuant недавно подтвердила новый сигнал бычьего рынка после того, как $BTC вернул свою 365-дневную скользящую среднюю. Также $BTC только что завершил Q3 с ростом более чем на 40% — это его самый сильный квартал почти за два года. The Wall Street Journal, но это не значит, что любая коррекция автоматически является покупкой. Похоже, спрос на споте остыл, фиксация прибыли усилилась, и $BTC по-прежнему с трудом держится в районе сопротивления $87K. Бычий сценарий улучшается. Следующее испытание — сможет ли $BTC удержать диапазон $82K–$84K и в конечном итоге уверенно пробить $87K. Бычий рынок или нет — цена всё равно должна это подтвердить. #BTC Price Analysis# #Bitcoin Price Prediction: What is Bitcoins next move?# $ETH
·
--
Самая смешная вещь в циклах #Bitcoin в том, что все ожидают медвежий рынок… пока он не начнётся на самом деле — и тогда они начинают паниковать. Мы уже видели это раньше. $BTC упал на 83,6% в 2018 и на 76,7% в 2022. Даже текущий цикл уже пережил просадку более чем на 50% по сравнению со своим ATH в 2025. И самое сложное обычно не в том, чтобы знать, что просадка произойдёт. Самое сложное — наблюдать, как падает твой портфель, пока все начинают спрашивать, не закончился ли биткоин. Смешно то, что каждый цикл заставляет людей думать: «На этот раз всё по‑другому». А потом приходит очередной цикл. И мы делаем всё заново. #BTC Price Analysis# #Bitcoin Price Prediction: What is Bitcoins next move?# $XRP
Самая смешная вещь в циклах #Bitcoin в том, что все ожидают медвежий рынок… пока он не начнётся на самом деле — и тогда они начинают паниковать. Мы уже видели это раньше. $BTC упал на 83,6% в 2018 и на 76,7% в 2022. Даже текущий цикл уже пережил просадку более чем на 50% по сравнению со своим ATH в 2025. И самое сложное обычно не в том, чтобы знать, что просадка произойдёт. Самое сложное — наблюдать, как падает твой портфель, пока все начинают спрашивать, не закончился ли биткоин. Смешно то, что каждый цикл заставляет людей думать: «На этот раз всё по‑другому». А потом приходит очередной цикл. И мы делаем всё заново. #BTC Price Analysis# #Bitcoin Price Prediction: What is Bitcoins next move?# $XRP

·
--
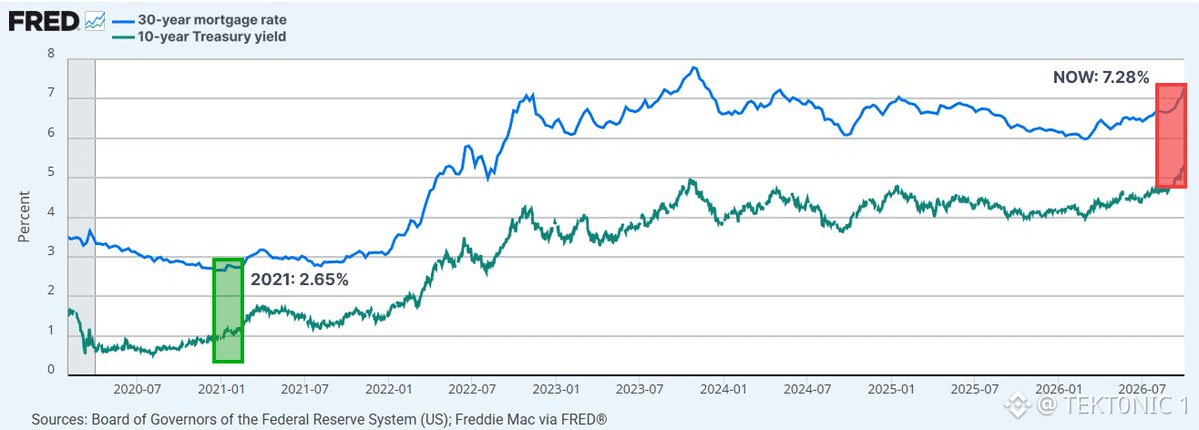
Казначейство более чем удвоило объем выкупа долгосрочных облигаций, а распродажа на рынке бондов все еще продолжается. Доходность 10-летних облигаций достигла 5,34% — максимума с 2002 года. Ставка по 30-летней ипотеке только что поднялась до 7,28% — максимума с 2023 года, что выше уровня 2,65% в 2021-м. выкуп — это поддержка ликвидности, а не ограничение доходностей. Казначейство покупает более старые выпуски, чтобы дилеры могли расчистить запасы: операция в сегменте 10–20 лет рассчитана минимум на $4 млрд, а недавняя — до $6 млрд. Рынок казначейских облигаций оборачивается более чем на $1 трлн в день. Несколько миллиардов долларов не устанавливают «дно» на длинном конце. Операция 10 сентября не помешала доходностям расти в течение той недели. инфляция — это вторая половина графика. Она держится выше целевого уровня ФРС 2% уже более пяти лет. Нефть и долгосрочные облигации натворили дел в этом месяце, а ипотечная ставка 7,28% — это «бытовая» версия той же доходности. для #Bitcoin ссылка — это ставка дисконтирования, а не заголовок про выкуп. 10-летняя доходность 5,34% — это более тяжелое препятствие для актива, который не приносит доходность, даже после роста на 42,6% в третьем квартале. Спотовые ETF по-прежнему могут покупать. Но им нужно делать это с учетом этой доходности, а не вместо нее. следите за 10-летней доходностью после следующего выкупа. Если она останется выше 5%, операция будет поддержкой для дилеров. Это не разворот на рынке облигаций. #BTC Price Analysis# #Bitcoin Price Prediction: What is Bitcoins next move?# $BTC
Казначейство более чем удвоило объем выкупа долгосрочных облигаций, а распродажа на рынке бондов все еще продолжается. Доходность 10-летних облигаций достигла 5,34% — максимума с 2002 года. Ставка по 30-летней ипотеке только что поднялась до 7,28% — максимума с 2023 года, что выше уровня 2,65% в 2021-м. выкуп — это поддержка ликвидности, а не ограничение доходностей. Казначейство покупает более старые выпуски, чтобы дилеры могли расчистить запасы: операция в сегменте 10–20 лет рассчитана минимум на $4 млрд, а недавняя — до $6 млрд. Рынок казначейских облигаций оборачивается более чем на $1 трлн в день. Несколько миллиардов долларов не устанавливают «дно» на длинном конце. Операция 10 сентября не помешала доходностям расти в течение той недели. инфляция — это вторая половина графика. Она держится выше целевого уровня ФРС 2% уже более пяти лет. Нефть и долгосрочные облигации натворили дел в этом месяце, а ипотечная ставка 7,28% — это «бытовая» версия той же доходности. для #Bitcoin ссылка — это ставка дисконтирования, а не заголовок про выкуп. 10-летняя доходность 5,34% — это более тяжелое препятствие для актива, который не приносит доходность, даже после роста на 42,6% в третьем квартале. Спотовые ETF по-прежнему могут покупать. Но им нужно делать это с учетом этой доходности, а не вместо нее. следите за 10-летней доходностью после следующего выкупа. Если она останется выше 5%, операция будет поддержкой для дилеров. Это не разворот на рынке облигаций. #BTC Price Analysis# #Bitcoin Price Prediction: What is Bitcoins next move?# $BTC
·
--
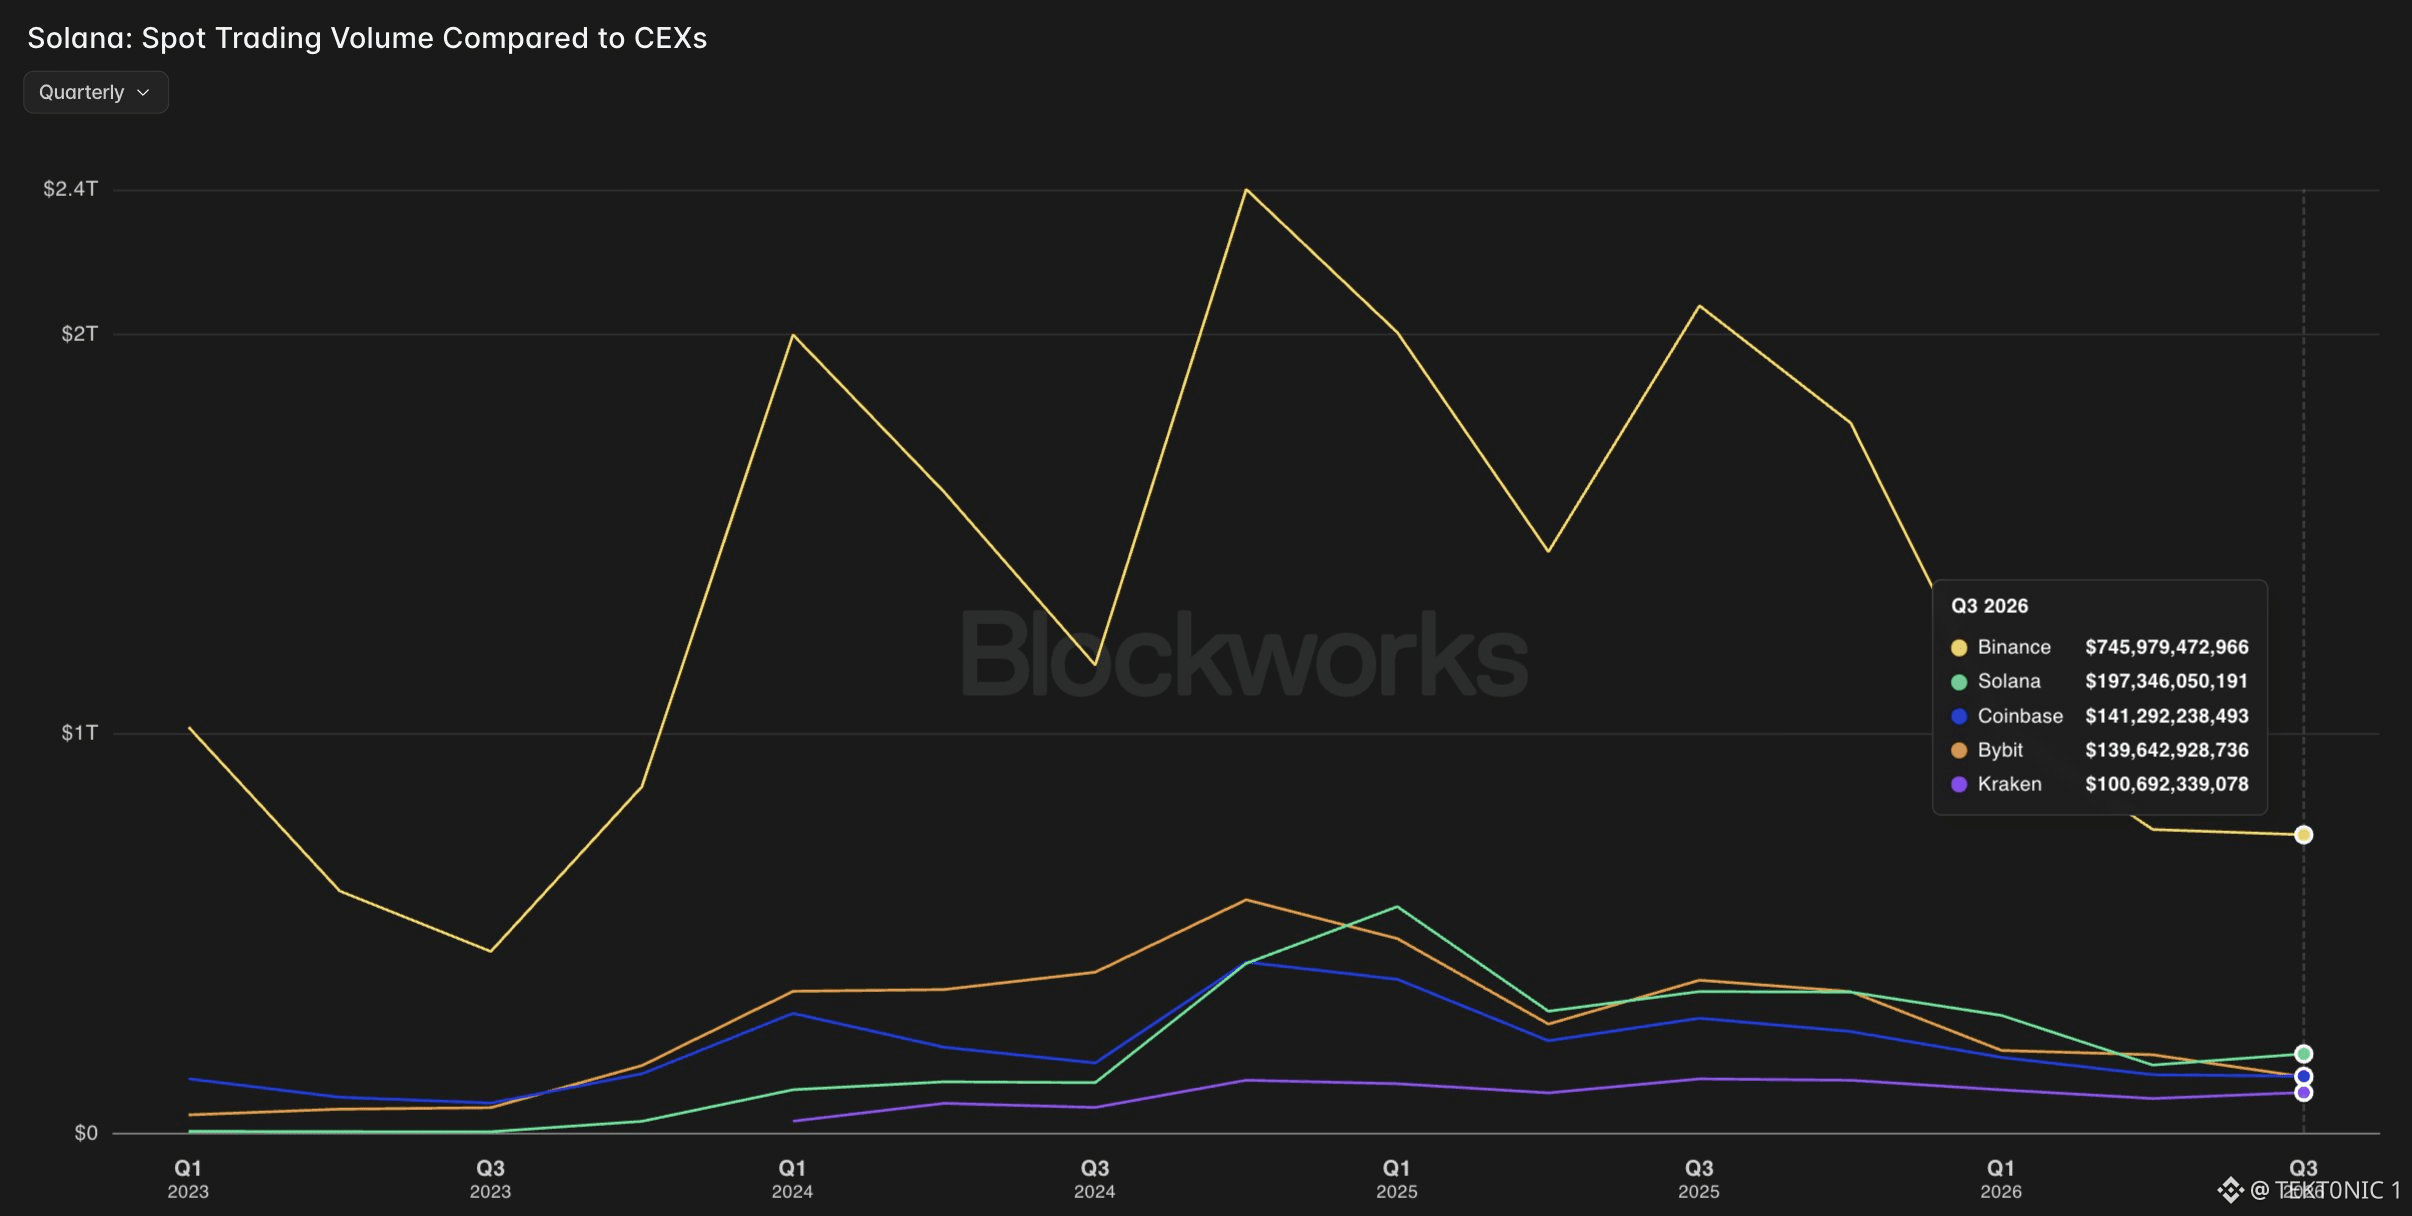
Solana вернулась на 2-е место по объёму спотовых торгов. последние данные Blockworks показывают, что Solana обработала $197.35B в спотовом объёме в Q3 — на CEX и DEX. это ставит Solana выше Bybit, у которой $139.64B, и Coinbase, где $141.29B. #Solana в Q2 уступила 2-ю позицию Bybit, но вернула её в Q3. разрыв заметный. объём Solana в Q3 был примерно на 41% выше, чем у Bybit, и лишь уступал Binance с $745.98B. это также происходит после периода, когда DEX-активность Solana неоднократно оказывалась выше, чем у крупных централизованных бирж. Solana всё активнее конкурирует с CEX по объёму торгов, а не только по активности on-chain. #BTC Анализ цены# #Солана переворачивает Ethereum?# $SOL $BTC
Solana вернулась на 2-е место по объёму спотовых торгов. последние данные Blockworks показывают, что Solana обработала $197.35B в спотовом объёме в Q3 — на CEX и DEX. это ставит Solana выше Bybit, у которой $139.64B, и Coinbase, где $141.29B. #Solana в Q2 уступила 2-ю позицию Bybit, но вернула её в Q3. разрыв заметный. объём Solana в Q3 был примерно на 41% выше, чем у Bybit, и лишь уступал Binance с $745.98B. это также происходит после периода, когда DEX-активность Solana неоднократно оказывалась выше, чем у крупных централизованных бирж. Solana всё активнее конкурирует с CEX по объёму торгов, а не только по активности on-chain. #BTC Анализ цены# #Солана переворачивает Ethereum?# $SOL $BTC
29
·
--
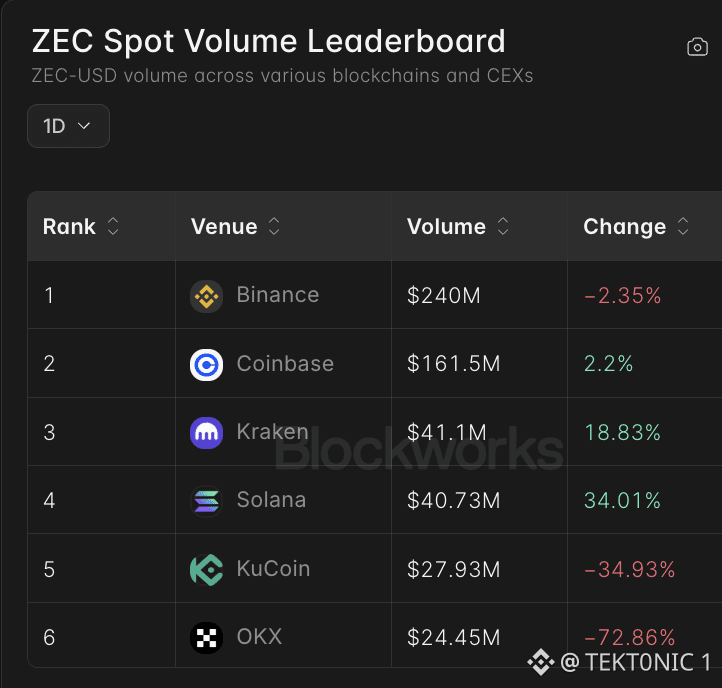
Solana наблюдает рост активности в спотовой торговле $ZEC. последние данные Blockworks показывают объем спотовой торговли $40.73M в ZEC на Solana за последние сутки. это выводит Solana на первое место впереди KuCoin с $27.93M и OKX с $24.45M, делая ее 4-й по величине площадкой для спотовой торговли ZEC. объем ZEC на Solana также вырос на 34.01%, тогда как у KuCoin и OKX зафиксированы снижения на 34.93% и 72.86% соответственно. Binance по-прежнему лидирует с $240M, за ней следуют Coinbase с $161.5M и Kraken с $41.1M. произошедший сдвиг заметен. торговля $ZEC все чаще выходит за рамки централизованных бирж: Solana становится значимой площадкой для onchain ликвидности ZEC. #BTC Price Analysis# #Altcoin Season# #ZEC $BTC #Bullish
Solana наблюдает рост активности в спотовой торговле $ZEC. последние данные Blockworks показывают объем спотовой торговли $40.73M в ZEC на Solana за последние сутки. это выводит Solana на первое место впереди KuCoin с $27.93M и OKX с $24.45M, делая ее 4-й по величине площадкой для спотовой торговли ZEC. объем ZEC на Solana также вырос на 34.01%, тогда как у KuCoin и OKX зафиксированы снижения на 34.93% и 72.86% соответственно. Binance по-прежнему лидирует с $240M, за ней следуют Coinbase с $161.5M и Kraken с $41.1M. произошедший сдвиг заметен. торговля $ZEC все чаще выходит за рамки централизованных бирж: Solana становится значимой площадкой для onchain ликвидности ZEC. #BTC Price Analysis# #Altcoin Season# #ZEC $BTC #Bullish
31
Войдите, чтобы посмотреть больше материала
Присоединяйтесь к пользователям криптовалют по всему миру на Binance Square
⚡️ Получайте новейшую и полезную информацию о криптоактивах.
💬 Нам доверяет крупнейшая в мире криптобиржа.
👍 Получите достоверные аналитические данные от верифицированных создателей контента.
Эл. почта/номер телефона
В тренде
fomcотслеживание
Просмотров: 47,136
400 обсуждают
Когда все ждут FOMC я просто соблюдаю правило 2%
Сегодня все вокруг сходят с ума. ФРС, ставки, волатильность. Толпа гадает, куда полетит BTC. Кто-то заходит на всю котлету с плечом x50, чтобы «поймать движение».
А я в такие дни просто наблюдаю. Потому что знаю: в моменты новостей рынок убивает не только тех, кто угадал не то направление. Он убивает тех, кто рискует слишком много.
Если ты поставил на кон больше 2% от депозита, ты не трейдер. Ты игрок в казино, который надеется на удачу.
Мой совет на сегодня простой, не торгуй на новостях. Если уже в позиции проверь свои стопы. Если нет сиди в стороне. Рынок никуда не убежит.
А вы как переживаете FOMC? Сидите в стороне или ловите волатильность? Пишите в комментариях.
$BTC $ETH #fomcотслеживание #рискменеджмент #крипта #психология
KeylessMind
·Лайков: 1
·Просмотров: 697
ПротоколFOMC
Просмотров: 35,773
167 обсуждают
BNBSurpasses$790
Просмотров: 14,219
120 обсуждают