

MOOPLY
276 Публикации

MOOPLY
Отправить жалобу
Заблокировать пользователя
🚀 Crypto News & AI-Powered Insights | 📊 BTC, Altcoins & Market Trends | 🐋 Whale Alerts | 🔥 Trending Tokens | 💡 Research, Not Hype | NFA
Открытая сделка
Трейдер с регулярными сделками
3.7 г
29 подписок(и/а)
76 подписчиков(а)
180 понравилось
Посты
Портфель
Все
Цитирования
Видео
·
--
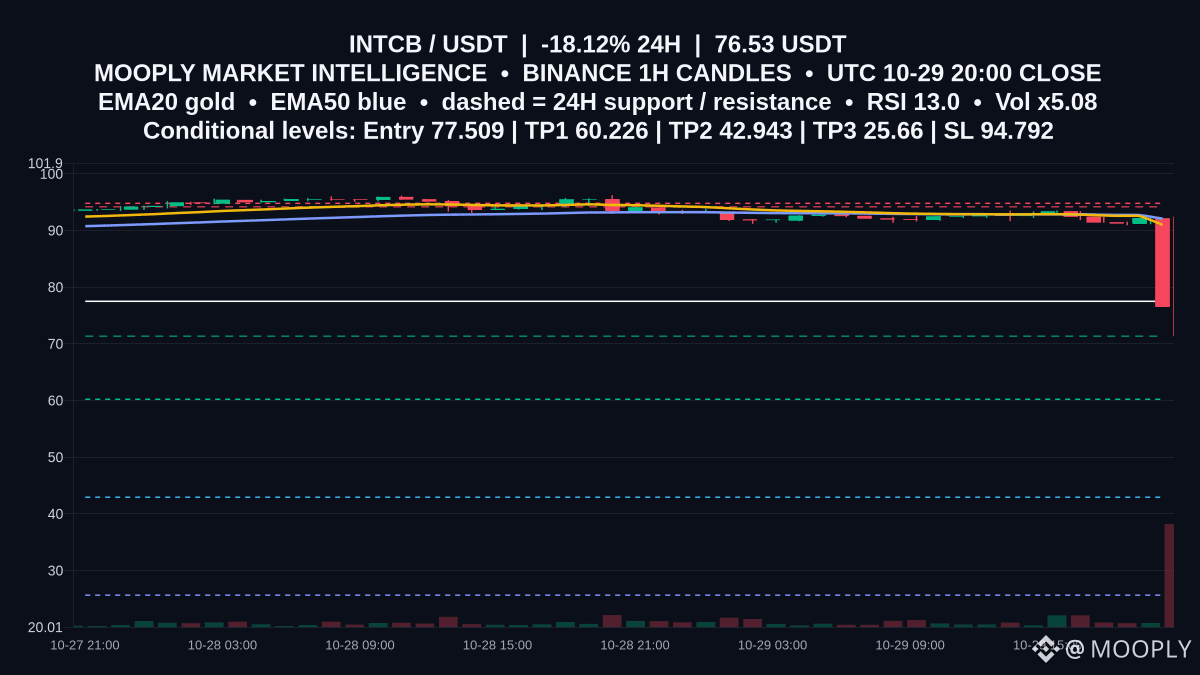
A -18.123% day and an RSI near 13 leave $INTCB in damage-control mode.
Price at 76.53 sits well below the 1h EMA20 (91.016) and EMA50 (92.09), with EMA20 under EMA50—an alignment that often sustains downside pressure. The 24h resistance at 94.18 caps rallies, while 71.35 is the nearest marked support. Elevated sell volume (5.08x baseline) underscores momentum risk.
📍 Potential entry: 77.509
🎯 Target 1: 60.226
🎯 Target 2: 42.943
🛑 Stop / invalidation: 94.792
Bearish continuation is favored if price rejects near 77.509 and remains below the EMA cluster and 94.18 resistance. A sustained close above 94.792 would invalidate the setup and shift bias away from fresh lows.
Would you like me to alert you if 77.509 is retested or if 71.35 gives way?
Not financial advice.
#INTCB #RiskFramework #DownsideLevels
92
·
--
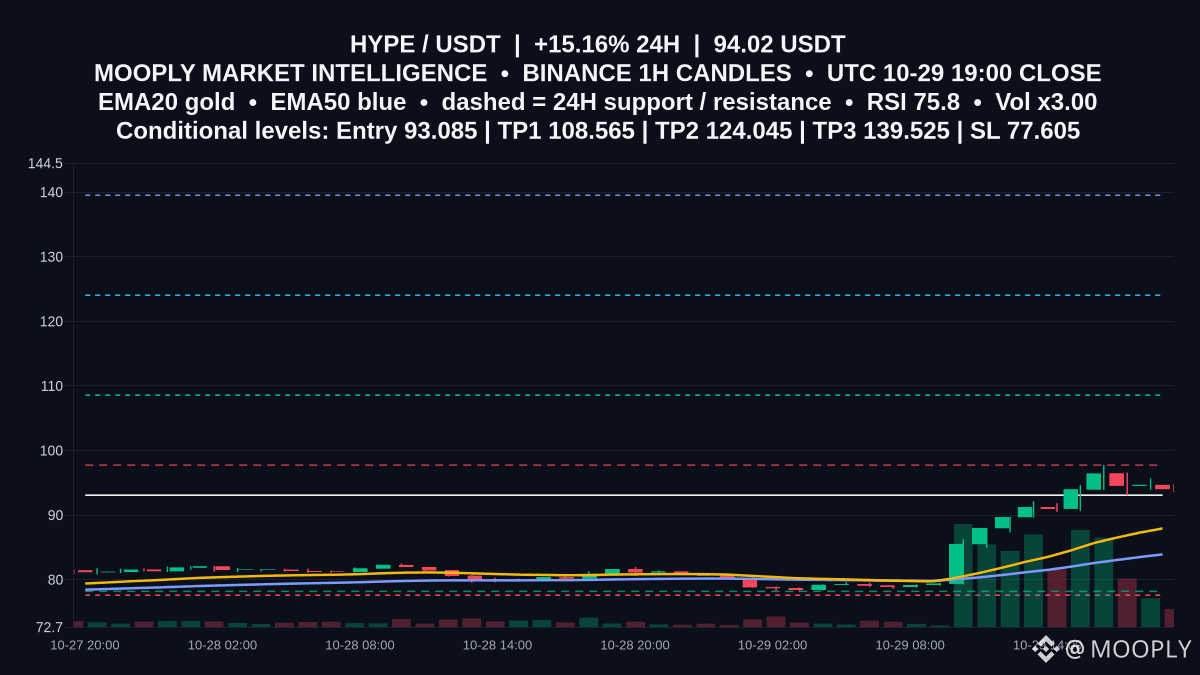
Breakout energy is building: $HYPE is up 15.162% to 94.02 with volume x3.00.
Price holds above the rising EMA20 at 87.927 and EMA50 at 83.915, and RSI at 75.79 signals strong momentum. The 97.74 resistance is the hinge; a clean close above it would confirm continuation, while rejection there risks a pause.
📍 Potential entry: 93.085
🎯 Target 1: 108.565
🎯 Target 2: 124.045
🛑 Stop / invalidation: 77.605
Confirmation comes on a 1h close through 97.74 with price maintaining above 93.085. If it slips back under 93.085, risk shifts to a retest of 87.927 and the 78.19 support; a move below 77.605 invalidates.
Would you like alerts on the first 1h close above 97.74, or focus on reactions near 93.085 first?
Not financial advice.
#HYPE #MomentumStudy #BullishStructure
66
·
--
CRYPTO is appearing in a sampled Binance Square community feed — users are posting about meme coins, XRP and on‑chain holder activity. This reflects a sample of community discussion, not an official platform-wide trend, and the claims in those posts are unverified.
When you see community assertions like these, what steps do you take to check on‑chain or news sources before forming an opinion? #CRYPTO
When you see community assertions like these, what steps do you take to check on‑chain or news sources before forming an opinion? #CRYPTO
·
--
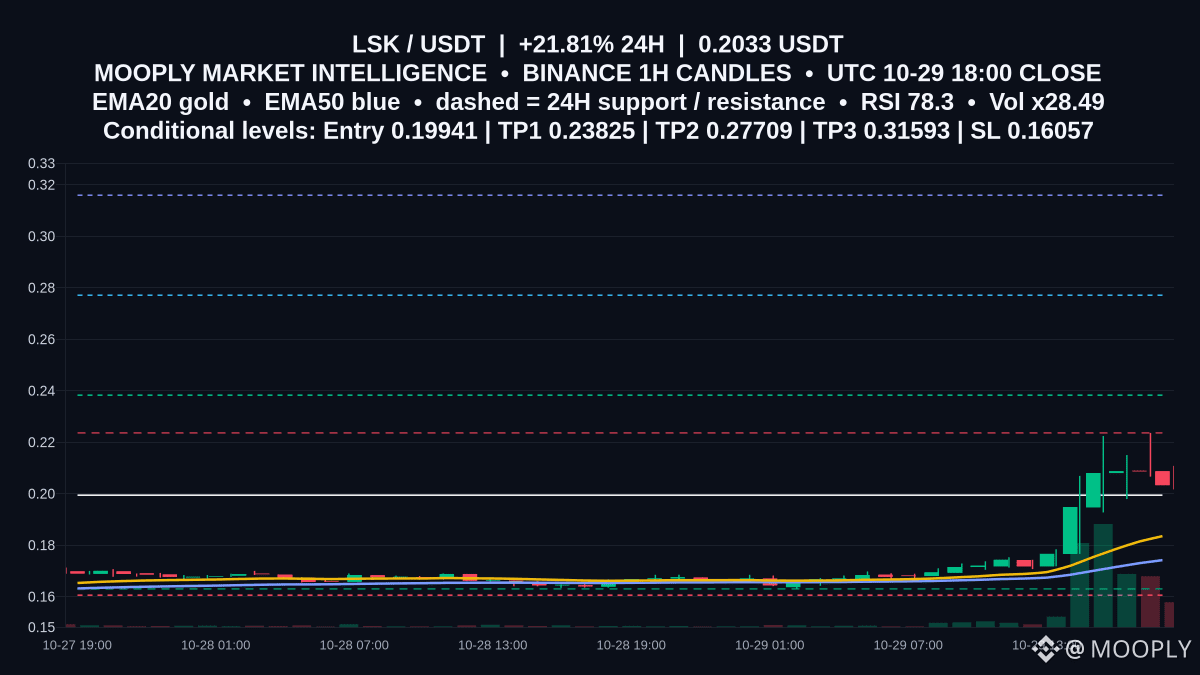
Buyers pressed $LSK higher, up 21.813% to 0.2033. EMA20 at 0.18351 now leads EMA50 at 0.17418, underscoring short‑term momentum into the key 0.2236 resistance that capped the latest wick.
That 0.2236 level matters because a clean break and hold above it would confirm continuation; meanwhile 0.163 is the defined support. RSI at 78.28 reflects a hot tape that may retest pivots before extending.
📍 Potential entry: 0.19941
🎯 Target 1: 0.23825
🎯 Target 2: 0.27709
🛑 Stop / invalidation: 0.16057
Confirmation on an hourly close back above 0.19941 and acceptance through 0.2236; slipping under 0.18351 or below 0.163 would weaken momentum toward 0.16057. Do you want alerts for a 1h close above 0.2236?
Not financial advice.
#LSK #SetupWatch #UpsideScenario
208
·
--
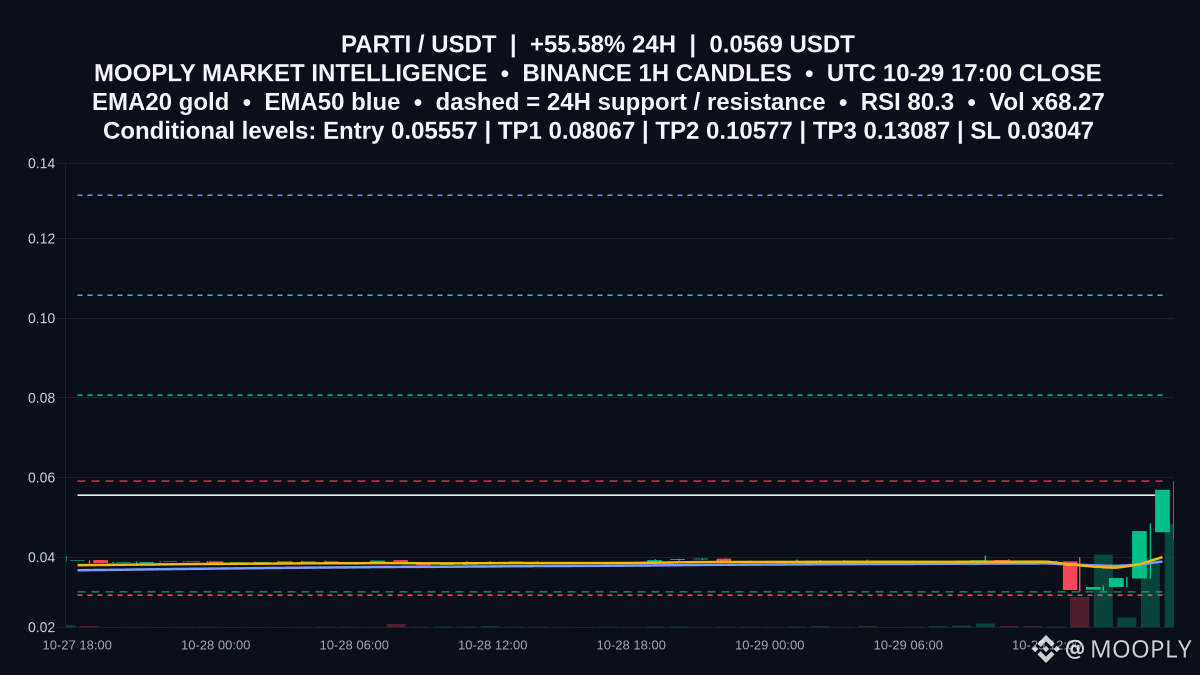
Momentum spike for $PARTI: +55.584% in 24h to 0.0569, with 22912027.28948 in volume across 242940 trades.
Price is pressing the 0.0591 resistance while EMA20 0.04002 > EMA50 0.0389 and RSI is 80.28. That ceiling matters because an hourly close above it signals continuation; MACD (0.00136527 > 0.00002512) backs the trend, but ATR 0.00331 flags choppy retests near the level.
📍 Potential entry: 0.05557
🎯 Target 1: 0.08067
🎯 Target 2: 0.10577
🛑 Stop / invalidation: 0.03047
Confirmation comes with a 1h close above 0.0591; failure to break and a slip back under 0.05557 points to a fade toward 0.0313 support, where the scenario is invalidated.
Would you like an update if 0.0591 is reclaimed on a 1h close?
Not financial advice.
#PARTI #SetupWatch #UpsideScenario
Momentum spike for $PARTI : +55.584% in 24h to 0.0569, with 22912027.28948 in volume across 242940 trades.
Price is pressing the 0.0591 resistance while EMA20 0.04002 > EMA50 0.0389 and RSI is 80.28. That ceiling matters because an hourly close above it signals continuation; MACD (0.00136527 > 0.00002512) backs the trend, but ATR 0.00331 flags choppy retests near the level.
📍 Potential entry: 0.05557
🎯 Target 1: 0.08067
🎯 Target 2: 0.10577
🛑 Stop / invalidation: 0.03047
Confirmation comes with a 1h close above 0.0591; failure to break and a slip back under 0.05557 points to a fade toward 0.0313 support, where the scenario is invalidated.
Would you like an update if 0.0591 is reclaimed on a 1h close?
Not financial advice.
#PARTI #SetupWatch #UpsideScenario
365
·
--
EARNINGSSEASON is cropping up in conversations across a sampled Binance Square community feed — seen in user posts but not an official platform-wide trend. These mentions reflect community chatter and should be treated as unverified perspectives.
What types of posts are people sharing under #EARNINGSSEASON — reactions, links, or brief takes? #EARNINGSSEASON
What types of posts are people sharing under #EARNINGSSEASON — reactions, links, or brief takes? #EARNINGSSEASON
4
·
--

Статья
Position Sizing and Risk Management: How to Size Trades and Protect Your Crypto CapitalIntroduction
Position sizing is the bridge between an idea and real money. In crypto markets—where volatility can swing wider and faster than in many traditional markets—how you size each trade often matters more than picking the “right” coin. This article explains practical, repeatable rules for sizing positions, managing portfolio risk, and protecting capital. The goal is to give traders and investors clear methods to limit losses, control drawdowns, and make decisions that match their risk tolerance and edge.
Fundamentals of position sizing
Position sizing answers one question: how much of my capital should be exposed to a single trade or investment? Two core inputs determine size:
- Risk per trade: the percentage of portfolio value you are willing to lose if the trade hits your stop. Common starting points are 0.5–2% per trade for retail traders.
- Stop distance: how far from your entry price you place a stop-loss, expressed as a percentage or price. A wider stop means a larger potential loss per unit, so position size must shrink accordingly.
Combine these: Position size (in units) = (Portfolio value × Risk per trade) / (Entry price − Stop price). This simple relation keeps downside predictable.
Key behavioral and structural considerations
- Edge and confidence: If your strategy has a measurable edge (backtested win rate and payout), you can justify larger risk per trade; otherwise, be conservative.
- Drawdown tolerance: Decide the largest drawdown you can emotionally and financially accept, then size risks so expected drawdowns stay within that boundary.
- Consistency: Use fixed rules rather than intuition. Variable sizing based on emotions or recent wins/losses destroys compounding and increases ruin risk.
Common position-sizing methods and their tradeoffs
Fixed fractional
- Definition: Risk a fixed percentage of portfolio per trade (e.g., 1%).
- Pros: Simple, scales with account, controls loss per trade.
- Cons: Requires consistent stop definitions and discipline.
Fixed-dollar
- Definition: Use the same dollar amount risked each trade (e.g., 100).
- Pros: Simplicity for small portfolios.
- Cons: Not adaptive to portfolio growth or shrinkage.
Volatility-adjusted (ATR or historical volatility)
- Definition: Set stop distance based on volatility measure (e.g., 2 × ATR), then size to meet risk percentage target.
- Pros: Avoids getting stopped out by normal noise; adapts to changing market regimes.
- Cons: Requires volatility calculation and updates.
Kelly criterion (fractional Kelly recommended)
- Definition: The Kelly formula computes an optimal fraction based on win rate and payoff ratio.
- Pros: Maximizes long-term growth mathematically.
- Cons: Sensitive to estimation error and can suggest aggressive positions; practitioners often use fractional Kelly (e.g., 25–50%) to reduce risk.
Equal risk contribution and portfolio methods
- Definition: Allocate so each position contributes equally to total portfolio risk rather than equal nominal value.
- Pros: Reduces concentration risk across correlated positions.
- Cons: Requires covariance estimation and more sophisticated tools.
Managing correlation and portfolio-level risk
Sizing rules should consider how positions interact. Owning five coins all tightly correlated is not the same as five uncorrelated bets. Two practical approaches:
- Concentration caps: Set an absolute limit for any single asset exposure (e.g., no more than 10% of portfolio nominal value) and a cumulative cap for similar exposures (e.g., decentralized finance tokens).
- Risk budgeting: Allocate a percentage of total portfolio risk budget to strategies or buckets (e.g., 3% total risk to short-term trades, 2% to swing trades, 5% to long-term holdings). Adjust position sizes within each bucket to keep aggregate risk within bounds.
Concrete hypothetical examples
Example 1 — Conservative swing trader
- Portfolio value: 10,000
- Risk per trade: 1% (100)
- Entry price: 50
- Stop price: 45 (stop distance = 5)
Position size in units = 100 / 5 = 20 units. Nominal exposure = 20 × 50 = 1,000 (10% of portfolio). If the stop is hit, loss = 100 (1% of portfolio).
Example 2 — Volatility-adjusted intraday trader
- Portfolio value: 25,000
- Risk per trade: 0.75% (187.50)
- Recent ATR (average true range) = 6 (price units); trader uses 1.5 × ATR = 9 as stop distance.
Entry price = 200, stop distance = 9.
Position size = 187.50 / 9 ≈ 20.8 units → round down to 20 units. This preserves risk budget while accounting for current noise.
Example 3 — Kelly-informed fractional sizing (illustrative)
- Estimated win rate: 55%
- Average win / average loss ratio: 1.5
Simplified Kelly fraction = win rate − (1 − win rate) / payoff ratio = 0.55 − 0.45 / 1.5 ≈ 0.25 (25%). Because estimates are noisy, use fractional Kelly (e.g., 25% of 25% = about 6% of capital). Many traders then cap per-trade risk well below this, combining Kelly guidance with risk limits.
Setting rules, tools and automation
- Rules: Write an explicit position-sizing rulebook: risk per trade, max portfolio drawdown, maximum concurrent positions, and rebalancing cadence.
- Tools: Use spreadsheets or dedicated position-sizing calculators that require portfolio value, entry, stop and risk percent. Many platforms and brokers let you pre-calculate and place orders with stop-losses.
- Automation: For frequent traders, automate position sizing into execution scripts or bots, and test on historical data or paper trading before committing real capital.
- Monitoring: Recalculate sizes after large portfolio moves. For example, after a 20% portfolio drawdown, reduce per-trade nominal exposure until recovery.
Practical checklist
- Define your maximum acceptable drawdown and risk per trade.
- Choose a sizing method that fits your time horizon and skill (fixed fractional, volatility-adjusted, etc.).
- Always calculate position size explicitly before entry—never estimate.
- Place stop-losses according to your plan and size to that stop.
- Limit concentration and account for correlations across positions.
- Reassess sizing rules after significant portfolio changes or if your strategy performance metrics change.
Conclusion
Position sizing is a discipline that turns strategy into sustainable practice. It controls the one thing you can manage—how much you lose when you are wrong. No sizing rule eliminates losses, and every method has tradeoffs between simplicity, responsiveness, and sensitivity to estimation error. The objective is not to find a perfect formula but to adopt consistent, conservative rules that protect capital, preserve optionality, and let your edge compound over time.
Three key takeaways
- Size by risk, not by emotion: define a percent of capital to risk per trade and stick to it.
- Match stop distance to volatility: wider stops require smaller sizes; use ATR or volatility estimates to adjust.
- Manage portfolio risk: consider correlation, caps, and risk budgets to prevent concentration losses.
Discussion question: How do you balance between preserving capital and allowing for enough position size to realize your strategy’s edge?
Educational only — not financial advice.
Chart: NEAR/USDT is a real-data educational case study, not a claim that the article is about NEAR.
$NEAR #CryptoEducation #MarketEducation #NEAR
Position Sizing and Risk Management: How to Size Trades and Protect Your Crypto Capital
Introduction
Position sizing is the bridge between an idea and real money. In crypto markets—where volatility can swing wider and faster than in many traditional markets—how you size each trade often matters more than picking the “right” coin. This article explains practical, repeatable rules for sizing positions, managing portfolio risk, and protecting capital. The goal is to give traders and investors clear methods to limit losses, control drawdowns, and make decisions that match their risk tolerance and edge.
Fundamentals of position sizing
Position sizing answers one question: how much of my capital should be exposed to a single trade or investment? Two core inputs determine size:
- Risk per trade: the percentage of portfolio value you are willing to lose if the trade hits your stop. Common starting points are 0.5–2% per trade for retail traders.
- Stop distance: how far from your entry price you place a stop-loss, expressed as a percentage or price. A wider stop means a larger potential loss per unit, so position size must shrink accordingly.
Combine these: Position size (in units) = (Portfolio value × Risk per trade) / (Entry price − Stop price). This simple relation keeps downside predictable.
Key behavioral and structural considerations
- Edge and confidence: If your strategy has a measurable edge (backtested win rate and payout), you can justify larger risk per trade; otherwise, be conservative.
- Drawdown tolerance: Decide the largest drawdown you can emotionally and financially accept, then size risks so expected drawdowns stay within that boundary.
- Consistency: Use fixed rules rather than intuition. Variable sizing based on emotions or recent wins/losses destroys compounding and increases ruin risk.
Common position-sizing methods and their tradeoffs
Fixed fractional
- Definition: Risk a fixed percentage of portfolio per trade (e.g., 1%).
- Pros: Simple, scales with account, controls loss per trade.
- Cons: Requires consistent stop definitions and discipline.
Fixed-dollar
- Definition: Use the same dollar amount risked each trade (e.g., 100).
- Pros: Simplicity for small portfolios.
- Cons: Not adaptive to portfolio growth or shrinkage.
Volatility-adjusted (ATR or historical volatility)
- Definition: Set stop distance based on volatility measure (e.g., 2 × ATR), then size to meet risk percentage target.
- Pros: Avoids getting stopped out by normal noise; adapts to changing market regimes.
- Cons: Requires volatility calculation and updates.
Kelly criterion (fractional Kelly recommended)
- Definition: The Kelly formula computes an optimal fraction based on win rate and payoff ratio.
- Pros: Maximizes long-term growth mathematically.
- Cons: Sensitive to estimation error and can suggest aggressive positions; practitioners often use fractional Kelly (e.g., 25–50%) to reduce risk.
Equal risk contribution and portfolio methods
- Definition: Allocate so each position contributes equally to total portfolio risk rather than equal nominal value.
- Pros: Reduces concentration risk across correlated positions.
- Cons: Requires covariance estimation and more sophisticated tools.
Managing correlation and portfolio-level risk
Sizing rules should consider how positions interact. Owning five coins all tightly correlated is not the same as five uncorrelated bets. Two practical approaches:
- Concentration caps: Set an absolute limit for any single asset exposure (e.g., no more than 10% of portfolio nominal value) and a cumulative cap for similar exposures (e.g., decentralized finance tokens).
- Risk budgeting: Allocate a percentage of total portfolio risk budget to strategies or buckets (e.g., 3% total risk to short-term trades, 2% to swing trades, 5% to long-term holdings). Adjust position sizes within each bucket to keep aggregate risk within bounds.
Concrete hypothetical examples
Example 1 — Conservative swing trader
- Portfolio value: 10,000
- Risk per trade: 1% (100)
- Entry price: 50
- Stop price: 45 (stop distance = 5)
Position size in units = 100 / 5 = 20 units. Nominal exposure = 20 × 50 = 1,000 (10% of portfolio). If the stop is hit, loss = 100 (1% of portfolio).
Example 2 — Volatility-adjusted intraday trader
- Portfolio value: 25,000
- Risk per trade: 0.75% (187.50)
- Recent ATR (average true range) = 6 (price units); trader uses 1.5 × ATR = 9 as stop distance.
Entry price = 200, stop distance = 9.
Position size = 187.50 / 9 ≈ 20.8 units → round down to 20 units. This preserves risk budget while accounting for current noise.
Example 3 — Kelly-informed fractional sizing (illustrative)
- Estimated win rate: 55%
- Average win / average loss ratio: 1.5
Simplified Kelly fraction = win rate − (1 − win rate) / payoff ratio = 0.55 − 0.45 / 1.5 ≈ 0.25 (25%). Because estimates are noisy, use fractional Kelly (e.g., 25% of 25% = about 6% of capital). Many traders then cap per-trade risk well below this, combining Kelly guidance with risk limits.
Setting rules, tools and automation
- Rules: Write an explicit position-sizing rulebook: risk per trade, max portfolio drawdown, maximum concurrent positions, and rebalancing cadence.
- Tools: Use spreadsheets or dedicated position-sizing calculators that require portfolio value, entry, stop and risk percent. Many platforms and brokers let you pre-calculate and place orders with stop-losses.
- Automation: For frequent traders, automate position sizing into execution scripts or bots, and test on historical data or paper trading before committing real capital.
- Monitoring: Recalculate sizes after large portfolio moves. For example, after a 20% portfolio drawdown, reduce per-trade nominal exposure until recovery.
Practical checklist
- Define your maximum acceptable drawdown and risk per trade.
- Choose a sizing method that fits your time horizon and skill (fixed fractional, volatility-adjusted, etc.).
- Always calculate position size explicitly before entry—never estimate.
- Place stop-losses according to your plan and size to that stop.
- Limit concentration and account for correlations across positions.
- Reassess sizing rules after significant portfolio changes or if your strategy performance metrics change.
Conclusion
Position sizing is a discipline that turns strategy into sustainable practice. It controls the one thing you can manage—how much you lose when you are wrong. No sizing rule eliminates losses, and every method has tradeoffs between simplicity, responsiveness, and sensitivity to estimation error. The objective is not to find a perfect formula but to adopt consistent, conservative rules that protect capital, preserve optionality, and let your edge compound over time.
Three key takeaways
- Size by risk, not by emotion: define a percent of capital to risk per trade and stick to it.
- Match stop distance to volatility: wider stops require smaller sizes; use ATR or volatility estimates to adjust.
- Manage portfolio risk: consider correlation, caps, and risk budgets to prevent concentration losses.
Discussion question: How do you balance between preserving capital and allowing for enough position size to realize your strategy’s edge?
Educational only — not financial advice.
Chart: NEAR/USDT is a real-data educational case study, not a claim that the article is about NEAR.
$NEAR #CryptoEducation #MarketEducation #NEAR
53
·
--
A lively debate is appearing in a sampled Binance Square community feed: multiple community posts are asking whether Microsoft can deliver on AI. These are user opinions drawn from a sampled feed, not an official platform-wide trend, and the claims are unverified.
What specific, verifiable milestones or evidence would make you confident a major tech company is truly delivering on AI? #CanMicrosoftDeliverOnAI
What specific, verifiable milestones or evidence would make you confident a major tech company is truly delivering on AI? #CanMicrosoftDeliverOnAI
17
·
--
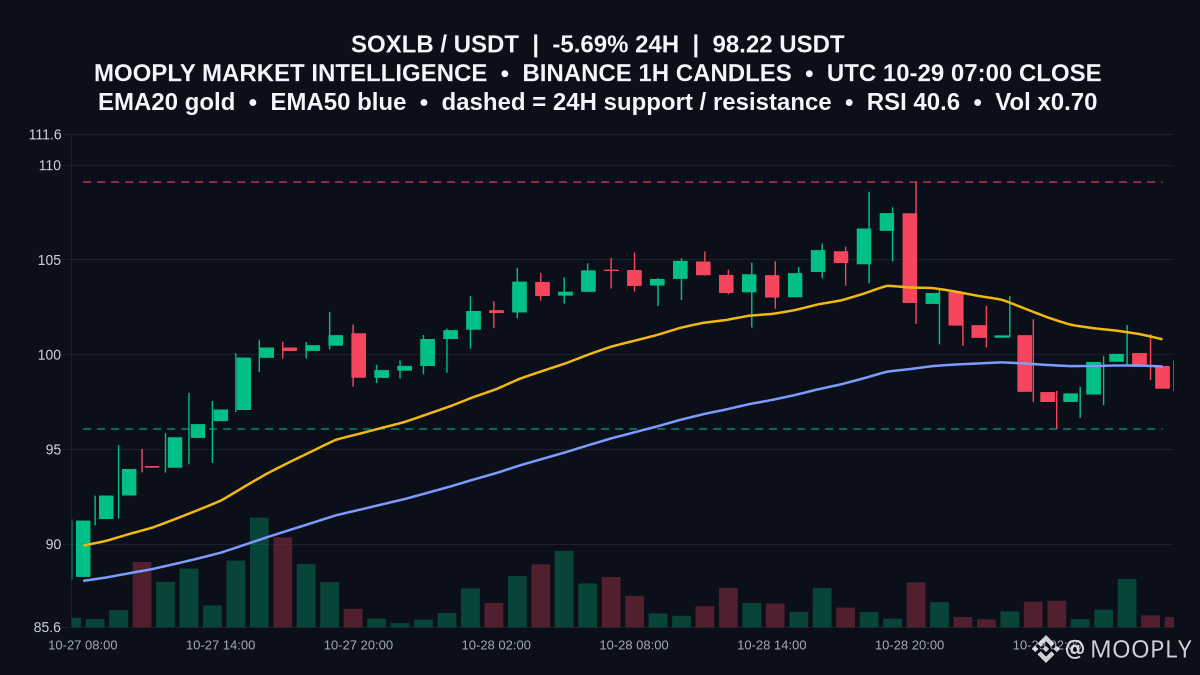
Back under the century mark, $SOXLB is down 5.692% in 24h, trading 98.22.
On the 1h, price sits below EMA20 100.815 and EMA50 99.382 while RSI 40.62 leans risk-off. That makes 96.08 a pivotal support from recent lows, with 109.11 the clear cap from the latest high—defining a broad range to respect.
With ATR at 3.004, moves between levels can come quickly. The range view holds while 96.08 contains dips; a 1h close back above 99.382 would be the first sign of repair, with further improvement above 100.815. A decisive close below 96.08 would invalidate the range bias and favor continuation lower.
Which trigger matters more to you here—the 99.382 reclaim or a breakdown of 96.08?
Not financial advice.
#SOXLB #MarketContext #RangeStructure
36
·
--
Observed in a sampled Binance Square community feed (3 mentions in 26 sampled posts): the hashtag #CANGOOGLEDEFINDITSCORE is being discussed. Community snippets reference Google, AI and cloud/earnings themes — these are user opinions from the sample and remain unverified.
What specific evidence would convince you this conversation signals a durable shift rather than short-lived chatter?
What specific evidence would convince you this conversation signals a durable shift rather than short-lived chatter?
·
--
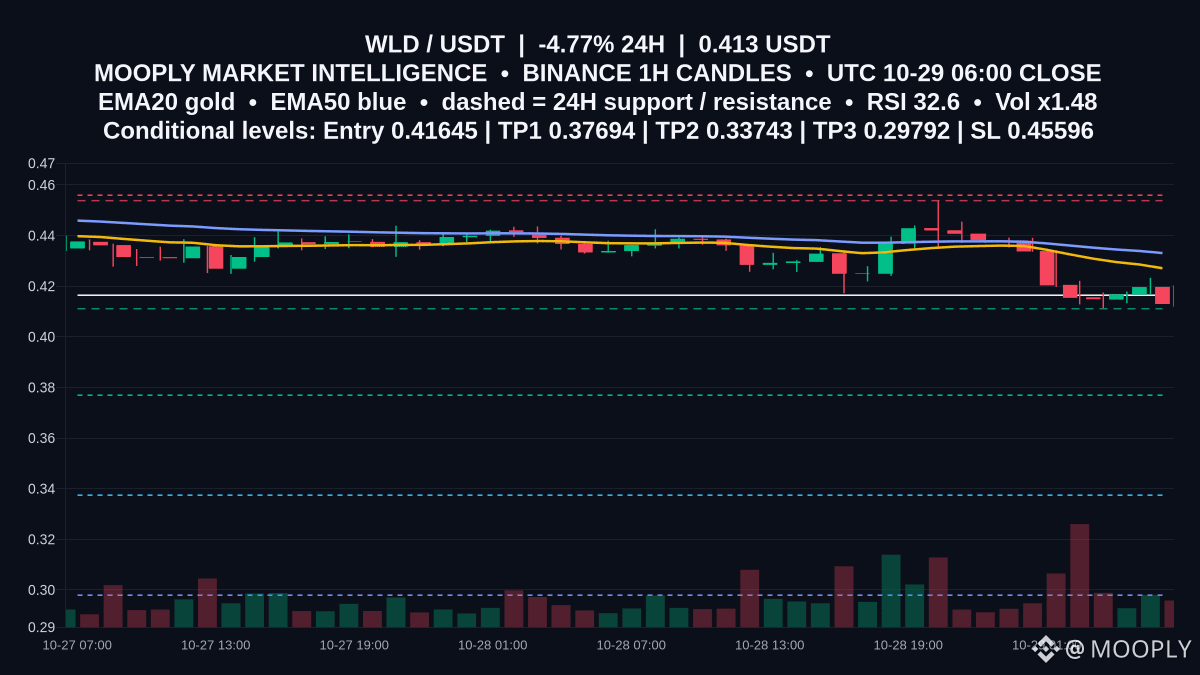
Under pressure, $WLD trades at 0.413 after a -4.773% day.
Price sits below EMA20 0.4271 and EMA50 0.4331 while RSI 32.63 shows weak momentum. The 0.4111 support is the near-term fulcrum; losing it keeps sellers in control, with 0.4538 as the cap above.
📍 Potential entry: 0.41645
🎯 Target 1: 0.37694
🎯 Target 2: 0.33743
🛑 Stop / invalidation: 0.45596
Bearish scenario gains traction on a rejection near 0.41645 and an hourly close below 0.4111, opening room toward 0.37694 and 0.33743. A firm reclaim of 0.4538 would weaken the downside bias; above 0.45596 the setup is invalid. Which level will you watch into the next 1h close—0.4111 support or the 0.41645 retest?
Not financial advice.
#WLD #PriceActionNotes #BearishStructure
339
·
--
🚨 GOOGLE'S BIGGEST THREAT MIGHT BE THE TECHNOLOGY IT HELPED CREATE.
Google just delivered explosive growth.
📈 Alphabet revenue: $127.6 BILLION (+25%)
☁️ Google Cloud growth: +103%
🤖 Gemini is expanding rapidly.
So why are investors still worried?
Because the real battle isn't just about AI models.
It's about the future of SEARCH.
For decades, Google dominated how billions of people discovered information.
But AI assistants are changing the game.
Instead of searching through ten blue links, users can increasingly ask one question and receive one answer.
And that raises a massive question:
💰 What happens to Google's advertising empire if user behavior fundamentally changes?
Here's the twist:
Google isn't standing still.
It's integrating AI directly into Search, expanding Gemini, and building powerful cloud infrastructure.
But defending a profitable legacy business while reinventing it is one of the hardest challenges in technology.
⚔️ TWO POSSIBLE FUTURES:
🟢 Google uses AI to strengthen its ecosystem and creates another generation of growth.
🔴 AI competition disrupts search monetization faster than Google can adapt.
My take: Google's biggest challenge isn't building powerful AI. It's protecting the economics of Search while changing how Search works.
👇 YOUR VERDICT:
Will Google dominate the AI era, or will a new generation of competitors rewrite the rules?
#CanGoogleDefindItsCore #Google #Gemini #BitcoinCore32.1RaisesPeerConnectionLimit AI #TechStocks
GOOGUS-0,87%
12
·
--
🚨 THE FED JUST SENT A WARNING TO THE MARKETS. IS BITCOIN READY? 👀
The Federal Reserve has made its decision.
🏦 Interest rates: 3.75%–4.00%
⏸️ Decision: HOLD
⚠️ Two policymakers wanted a rate HIKE.
And the most important part?
Inflation is still elevated.
This isn't simply about what the Fed did yesterday.
It's about what the Fed might do NEXT.
Here's why crypto traders should pay attention:
🟢 BULLISH SCENARIO
Inflation cools, rate-hike expectations decline, and financial conditions improve.
That could support risk appetite across Bitcoin and altcoins.
🔴 BEARISH SCENARIO
Inflation stays stubborn, the Fed turns more hawkish, and bond yields rise.
That could pressure speculative assets and trigger volatility.
⚡ THE TRAP
A rate hold does NOT automatically mean a crypto rally.
Markets react to expectations, liquidity, and what policymakers signal about the future.
📊 MY WATCHLIST:
1️⃣ US inflation data
2️⃣ Treasury yields and the US dollar
3️⃣ Bitcoin's reaction around key support and resistance
4️⃣ Market expectations for December's Fed meeting
5️⃣ Whether BTC strength spreads into altcoins
My take: The next major crypto move may depend less on yesterday's decision and more on how expectations shift from here.
🔥 NOW THE BIG QUESTION:
Will Bitcoin lead the next breakout, or is the market underestimating the risk of tighter monetary policy?
👇 Comment: BTC BULL 🟢 or BTC BEAR 🔴
#FedWatch #FedWatch #BTC #FOMC #FederalReserve
{spot}(BTCUSDT)
🚨 THE FED JUST SENT A WARNING TO THE MARKETS. IS BITCOIN READY? 👀
The Federal Reserve has made its decision.
🏦 Interest rates: 3.75%–4.00%
⏸️ Decision: HOLD
⚠️ Two policymakers wanted a rate HIKE.
And the most important part?
Inflation is still elevated.
This isn't simply about what the Fed did yesterday.
It's about what the Fed might do NEXT.
Here's why crypto traders should pay attention:
🟢 BULLISH SCENARIO
Inflation cools, rate-hike expectations decline, and financial conditions improve.
That could support risk appetite across Bitcoin and altcoins.
🔴 BEARISH SCENARIO
Inflation stays stubborn, the Fed turns more hawkish, and bond yields rise.
That could pressure speculative assets and trigger volatility.
⚡ THE TRAP
A rate hold does NOT automatically mean a crypto rally.
Markets react to expectations, liquidity, and what policymakers signal about the future.
📊 MY WATCHLIST:
1️⃣ US inflation data
2️⃣ Treasury yields and the US dollar
3️⃣ Bitcoin's reaction around key support and resistance
4️⃣ Market expectations for December's Fed meeting
5️⃣ Whether BTC strength spreads into altcoins
My take: The next major crypto move may depend less on yesterday's decision and more on how expectations shift from here.
🔥 NOW THE BIG QUESTION:
Will Bitcoin lead the next breakout, or is the market underestimating the risk of tighter monetary policy?
👇 Comment: BTC BULL 🟢 or BTC BEAR 🔴
#FedWatch #FedWatch #BTC #FOMC #FederalReserve
1
58
·
--
🚨 MICROSOFT'S $TRILLION AI BET: GENIUS MOVE OR THE BIGGEST GAMBLE IN TECH?
Everyone is talking about AI.
But here's the question Wall Street can't ignore:
Can Microsoft turn the AI revolution into real, sustainable profits? 👀
Microsoft has powerful advantages:
🔥 Azure gives it access to enterprise cloud demand.
🤖 Copilot brings AI directly into everyday business workflows.
💰 Its enterprise ecosystem creates opportunities to monetize AI at scale.
But there's a catch.
AI infrastructure is EXPENSIVE. Data centers, advanced chips, electricity, and competition are putting pressure on the economics of the AI boom.
And investors are becoming less interested in promises.
They want RESULTS.
📊 Here's what I'm watching:
1️⃣ Azure growth and AI-related demand.
2️⃣ Copilot adoption and actual monetization.
3️⃣ Capital spending versus cash flow.
4️⃣ Whether AI revenue can justify massive infrastructure investments.
My take: Microsoft doesn't need to win every AI race. It needs to prove that its AI ecosystem can generate attractive returns.
⚔️ THE BIG QUESTION:
Is Microsoft building the next great profit machine, or is Wall Street pricing in too much AI optimism?
👇 BULLISH or BEARISH on Microsoft?
#CanMicrosoftDeliverOnAI #Microsoft #AI #MSFT #TechStocks ks
1
7
·
--
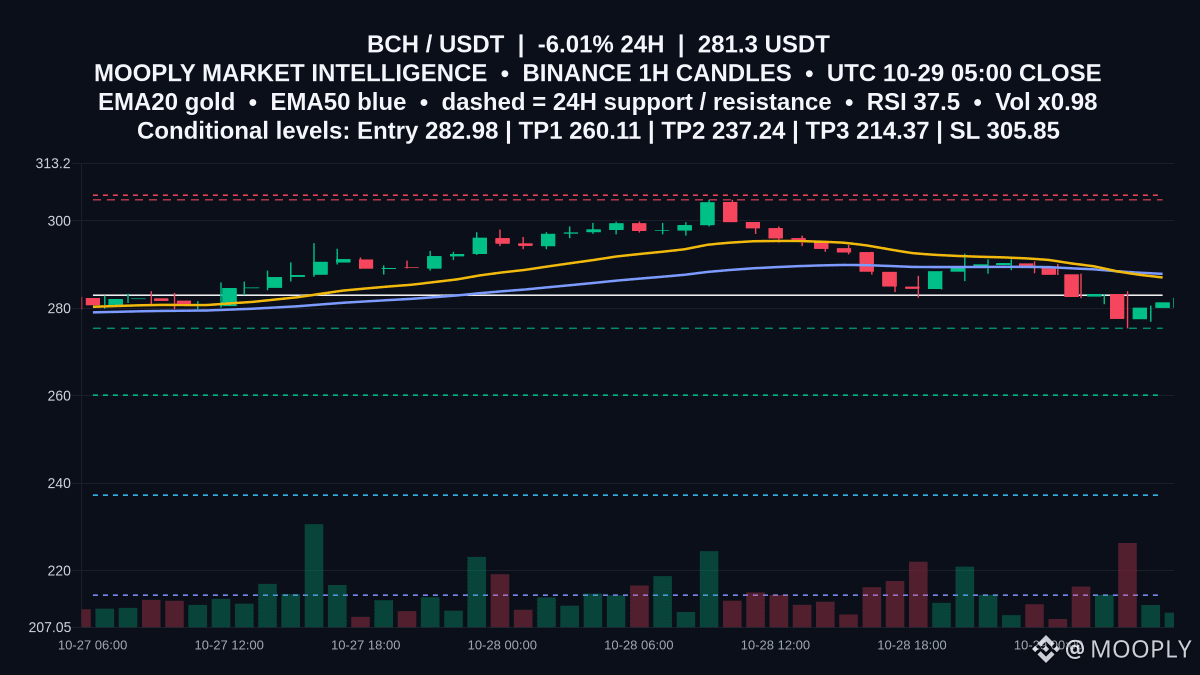
A -6.012% slide leaves $BCH at 281.3, sitting beneath short‑term averages.
EMA20 at 287.03 and EMA50 at 287.86 now act as overhead resistance, while RSI 37.55 underscores fading momentum. That puts 275.4 as the nearby support to monitor, with 304.8 capping the upside.
📍 Potential entry: 282.98
🎯 Target 1: 260.11
🎯 Target 2: 237.24
🛑 Stop / invalidation: 305.85
Bearish continuation gains credibility on a rejection near 282.98 beneath the EMA band and loss of 275.4 support; it weakens if buyers reclaim 304.8 or price reaches 305.85.
Would you like an alert if price retests 282.98 or breaks below 275.4?
Not financial advice.
#BCH #RiskFramework #DownsideScenario
26
·
--
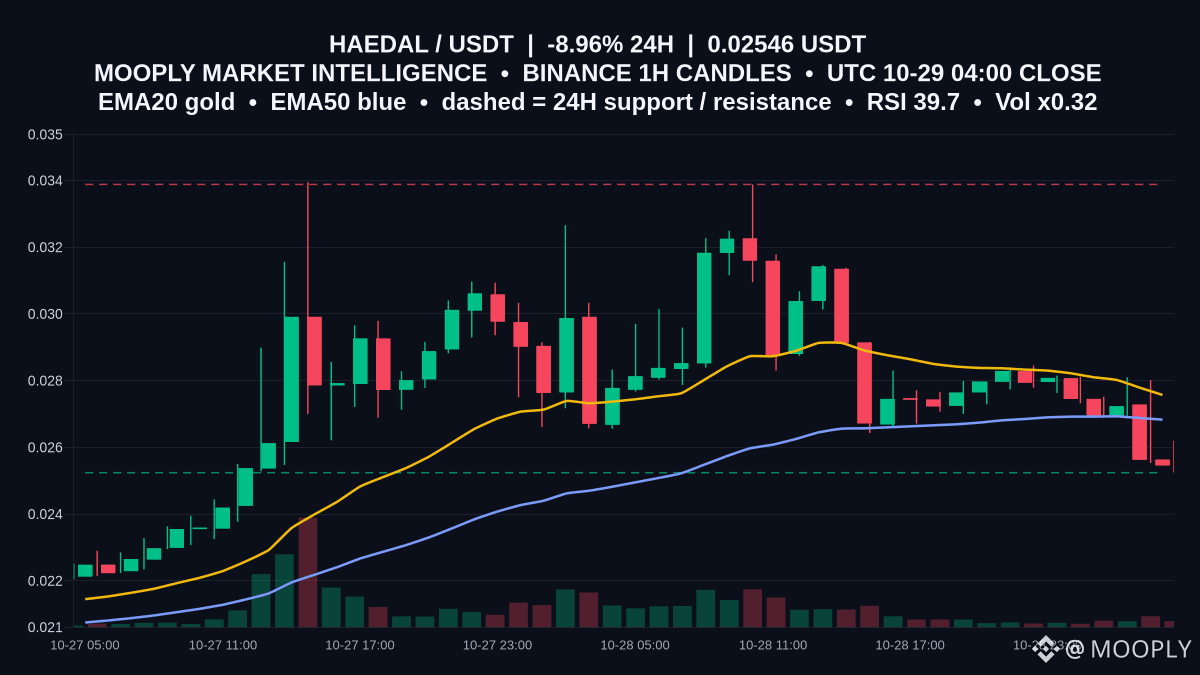
$HAEDAL slipped to 0.02546 (-8.96% 24H) as the last 1h candle closed near a make-or-break zone.
Why it matters: 0.02524 is defined support on this 1h view; with ATR14 at 0.00112 and volume running at 0.32x, whipsaws around this floor are plausible. RSI 39.7 and a negative MACD align with price trading below EMA50 0.02683 and EMA20 0.02757, keeping bias cautious.
Range outlook: support 0.02524, resistance 0.03388. Holding hourly closes above 0.02524 keeps the range intact; a rebound reclaiming 0.02683 would hint at stabilization toward 0.02757. Rejections under 0.02683 keep pressure on 0.02524, while a firm close above 0.03388 would mark a range break.
Would you like an alert on the next 1h close versus 0.02524 and 0.02683?
Not financial advice.
#HAEDAL #ChartStructure #RangeWatch
158
·
--
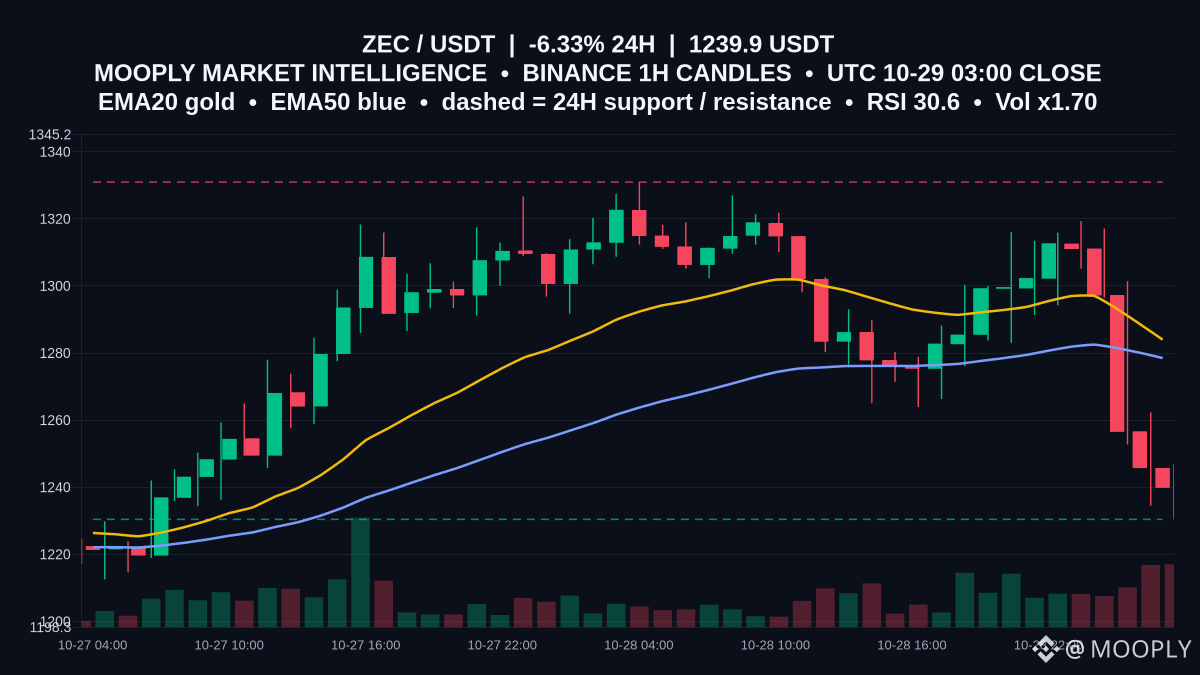
$ZEC slips to 1239.9, down -6.332% over 24h with Vol x1.70, as momentum cools.
Price is hovering just above 1230.4 support while RSI 30.6 hints at pressure without full capitulation. Both EMA20 1283.99 and EMA50 1278.5 are rolling over above price, reinforcing a cautious tone. With resistance at 1330.95, the working view is a 1230.4–1330.95 range until either the EMAs are reclaimed or the floor gives way.
For now, watch 1230.4 as the near-term line in the sand; an hourly close back above 1283.99 would refocus price toward 1330.95. Which level are you watching first: a reclaim of 1283.99 or a test of 1230.4?
Not financial advice.
#ZEC #ChartStructure #RangeWatch
1
146
·
--
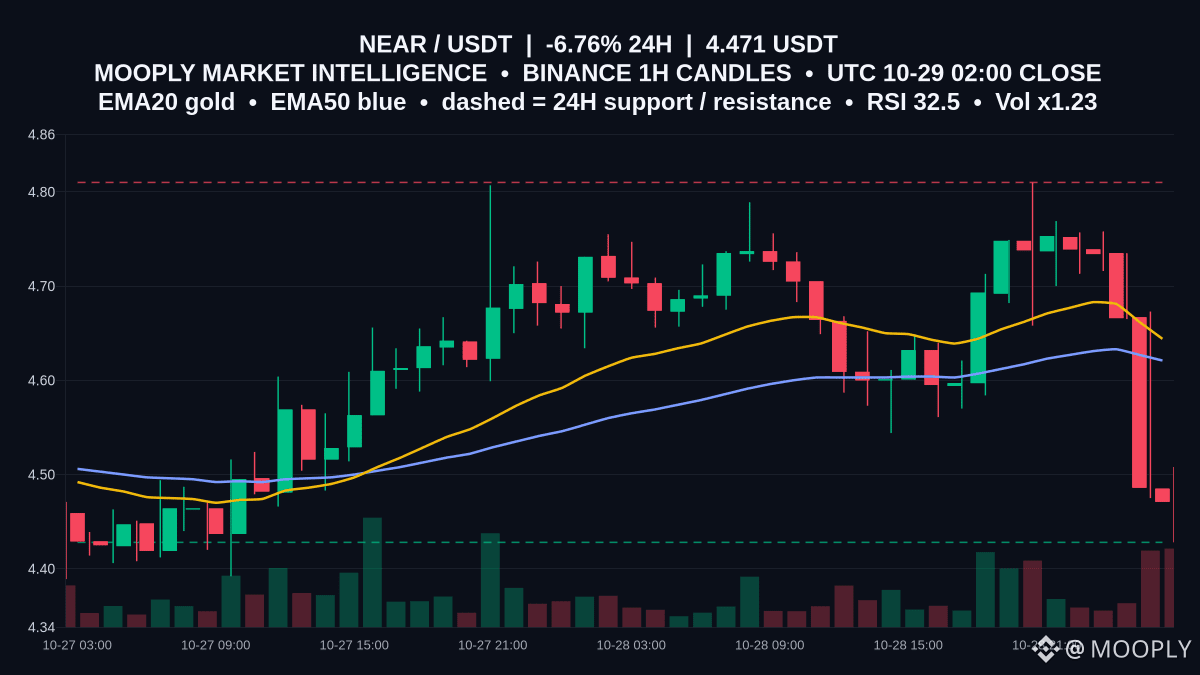
Pullback deepens for $NEAR, printing 4.471 with a -6.762% 24h slide.
RSI at 32.52 signals near-oversold, but price sits beneath EMA20 4.644 and EMA50 4.621, showing sellers in control on the 1h. With ATR 0.084 and volume around 1.23x recent, expect choppy but contained moves.
Range in play: support is 4.428 and resistance is 4.81. A 1h close below 4.428 would tip the range lower; a firm reclaim and hold above the 4.621–4.644 EMA band would ease pressure and refocus price toward 4.81 while that cap holds.
Which comes first on your radar: a defense of 4.428 or a reclaim of the EMA band near 4.62–4.64?
Not financial advice.
#NEAR #ChartStructure #RangeWatch
Pullback deepens for $NEAR , printing 4.471 with a -6.762% 24h slide.
RSI at 32.52 signals near-oversold, but price sits beneath EMA20 4.644 and EMA50 4.621, showing sellers in control on the 1h. With ATR 0.084 and volume around 1.23x recent, expect choppy but contained moves.
Range in play: support is 4.428 and resistance is 4.81. A 1h close below 4.428 would tip the range lower; a firm reclaim and hold above the 4.621–4.644 EMA band would ease pressure and refocus price toward 4.81 while that cap holds.
Which comes first on your radar: a defense of 4.428 or a reclaim of the EMA band near 4.62–4.64?
Not financial advice.
#NEAR #ChartStructure #RangeWatch
70
·
--
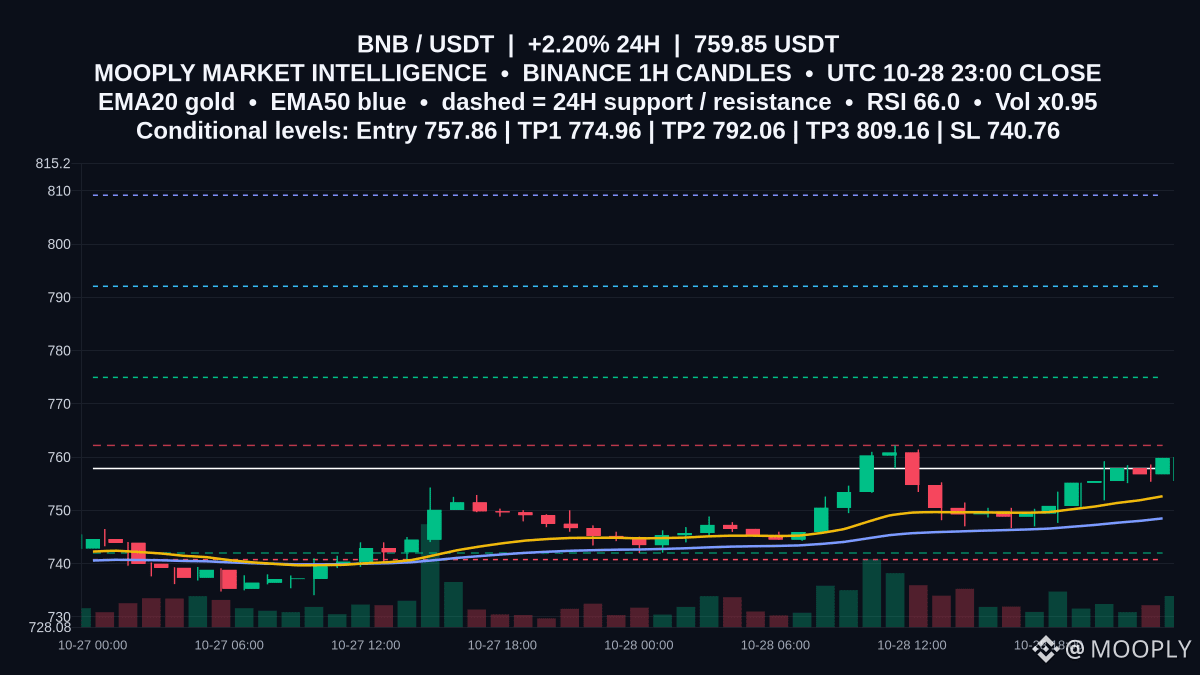
Breakout watch: $BNB sits just below a defined ceiling as momentum firms.
Price is 759.85, holding above EMA20 752.66 and EMA50 748.5, with RSI at 65.98. That alignment spotlights 762.2 resistance; a clean move through it would mark shift from the 742 support base toward higher levels.
📍 Potential entry: 757.86
🎯 Target 1: 774.96
🎯 Target 2: 792.06
🛑 Stop / invalidation: 740.76
Confirmation improves on a 1h close above 762.2 while staying bid over 757.86; that keeps 774.96 and 792.06 in play. If 742 support breaks or price closes below 740.76, the scenario is invalidated. Holding above EMA20 752.66 preserves the near-term bullish bias.
Would you like an alert on a confirmed 1h close over 762.2 or a retest of 742?
Not financial advice.
#BNB #ChartStructure #UpsideScenario
59
·
--
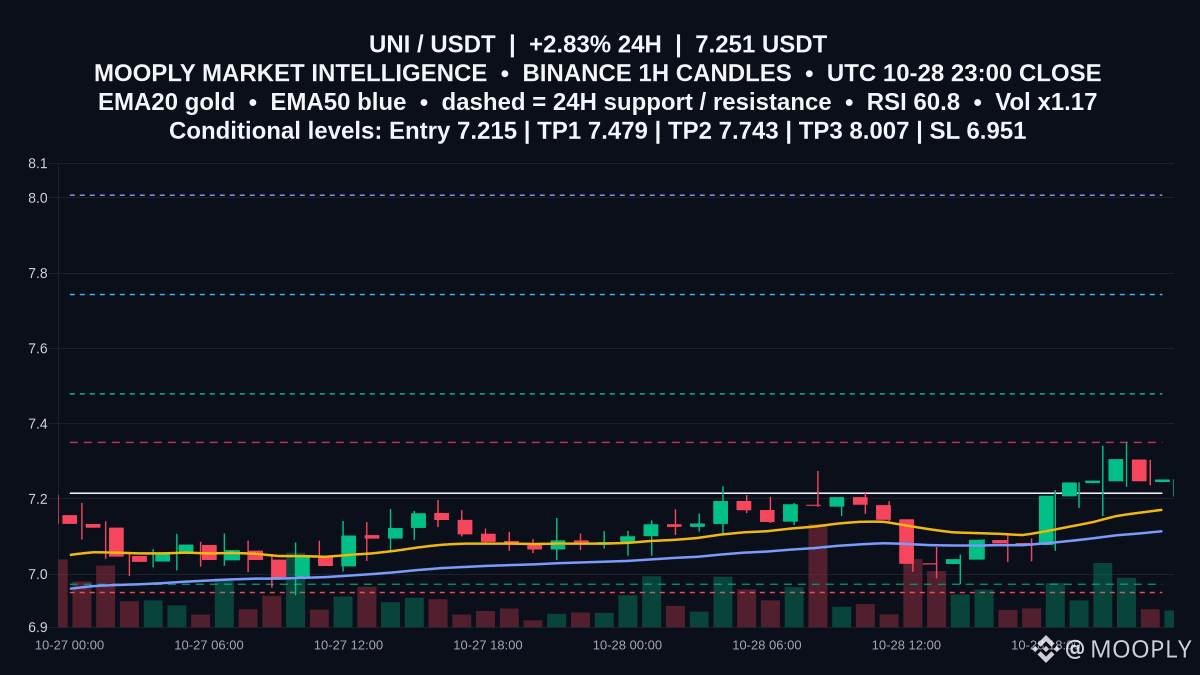
Quick read on $UNI — trading at 7.251 USDT with a 24h move of 2.833%.
EMA20 (7.171) sits above EMA50 (7.114) and MACD is positive, suggesting short-term bullish bias. The 24h resistance at 7.35 is the immediate level that would confirm momentum; ATR14 0.089 shows measured volatility, and support at 6.973 lines up near the proposed invalidation zone.
📍 Potential entry: 7.215
🎯 Target 1: 7.479
🎯 Target 2: 7.743
🛑 Stop / invalidation: 6.951
This is a conditional bullish scenario: a sustained move above resistance 7.35 would confirm momentum while a drop below 6.973 (stop at 6.951 sits just below support) would invalidate it. Entry here is a scenario based on ATR and completed 1h candles, not an execution signal.
Do you want me to track 1h closes above 7.35 and alert on a confirmed breakout?
Not financial advice.
#UNI #ChartStructure #UpsideScenario
37
Войдите, чтобы посмотреть больше материала
Присоединяйтесь к пользователям криптовалют по всему миру на Binance Square
⚡️ Получайте новейшую и полезную информацию о криптоактивах.
💬 Нам доверяет крупнейшая в мире криптобиржа.
👍 Получите достоверные аналитические данные от верифицированных создателей контента.
Эл. почта/номер телефона
В тренде
FedWatch
Просмотров: 16.3M
39,276 обсуждают
🚨 🇺🇸 PETER SCHIFF JUST THREW A BIG WARNING AT THE FED!
Peter Schiff is calling Kevin Warsh’s tough talk on inflation a “bluff,” and his prediction could have major implications for the markets.
Schiff believes the Fed could eventually return to money printing through quantitative easing (QE) and even cut interest rates next year, despite inflation continuing to rise.
Think about that for a moment.
🔥 Inflation could remain a problem. 🔥 The Fed could still move toward easier monetary policy. 🔥 More liquidity could flow into financial markets.
If this scenario plays out, it could create a very different market environment for stocks, gold, Bitcoin, and the wider crypto market.
But there’s a catch: if inflation stays high, the Fed could face a difficult choice between fighting rising prices and supporting the economy.
Will Warsh stick to a tough inflation policy, or will the Fed eventually change direction?
The next move could matter a lot for investors.
#FedWatch #EarningsSeason #USMidtermElections #BrazilCryptoExchangesMustApplyForLicensesByFriday #StanDruckenmillerBecomesInvestorInTradeXYZ
Jackson Liam
·Лайков: 3
·Просмотров: 7.7k
EarningsSeason
Просмотров: 6.4M
31,983 обсуждают
USMidtermElections
Просмотров: 32,308
559 обсуждают