

Mr_Ethan
33.2k Публикации

Mr_Ethan
 Square Verified
Отправить жалобу
Заблокировать пользователя
Crypto Lover || Crypto influencer || BNB || Content Creator || Crypto influencer
Открытая сделка
Трейдер с регулярными сделками
1.1 г
19 подписок(и/а)
33.0K+ подписчиков(а)
20.0K+ понравилось
Посты
Портфель
Все
Цитирования
Активно
·
--
Small Bounce, But Sellers Still Have Control! 📉
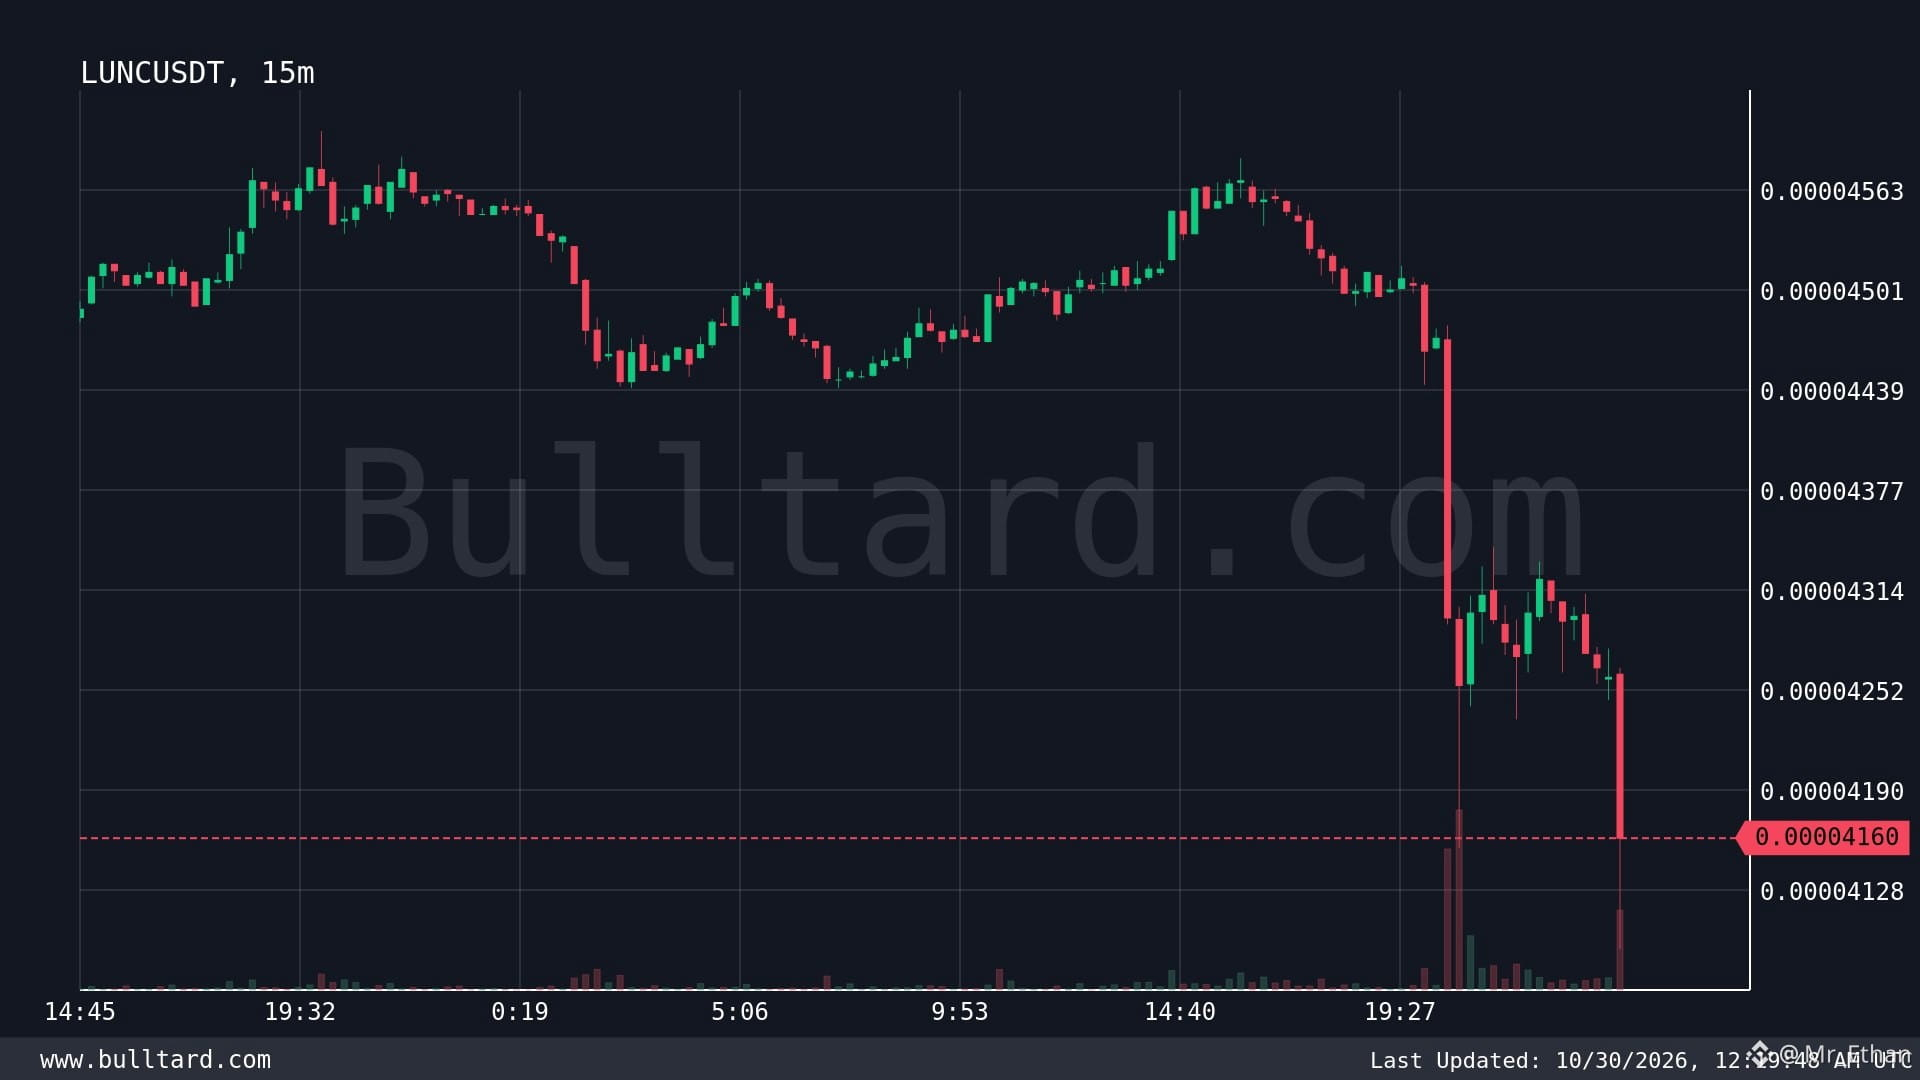
I’m keeping an eye on LUNC because the latest trading activity shows some interesting signals.
LUNC is trading around $0.00004160, down 8.7% over the last 24 hours. The 1-minute chart shows a 0.6% bounce, but I’m not taking that as a recovery signal yet.
What concerns me is the selling pressure. Around 66.3K USDT traded in one minute, with sellers responsible for 72% of the volume. That suggests bears are still more active than buyers.
I’ve followed LUNC's journey since the Terra ecosystem collapse. Its community remains one of its biggest strengths, and ongoing community-driven development and burn efforts keep the project relevant.
But there are serious challenges. Restoring trust, building real utility, and competing with stronger blockchain ecosystems won't happen overnight.
My experience has taught me one thing: a green candle means very little when selling volume remains dominant.
I'm watching whether buyers can absorb this pressure before considering a bullish move.
Do you still believe in LUNC's long-term recovery, or has its momentum faded?
$LUNC
{spot}(LUNCUSDT)
Small Bounce, But Sellers Still Have Control! 📉
I’m keeping an eye on LUNC because the latest trading activity shows some interesting signals.
LUNC is trading around $0.00004160, down 8.7% over the last 24 hours. The 1-minute chart shows a 0.6% bounce, but I’m not taking that as a recovery signal yet.
What concerns me is the selling pressure. Around 66.3K USDT traded in one minute, with sellers responsible for 72% of the volume. That suggests bears are still more active than buyers.
I’ve followed LUNC's journey since the Terra ecosystem collapse. Its community remains one of its biggest strengths, and ongoing community-driven development and burn efforts keep the project relevant.
But there are serious challenges. Restoring trust, building real utility, and competing with stronger blockchain ecosystems won't happen overnight.
My experience has taught me one thing: a green candle means very little when selling volume remains dominant.
I'm watching whether buyers can absorb this pressure before considering a bullish move.
Do you still believe in LUNC's long-term recovery, or has its momentum faded?
$LUNC
1
314
·
--
Падение
: Interesting Buying Activity Despite Selling Pressure! 📊
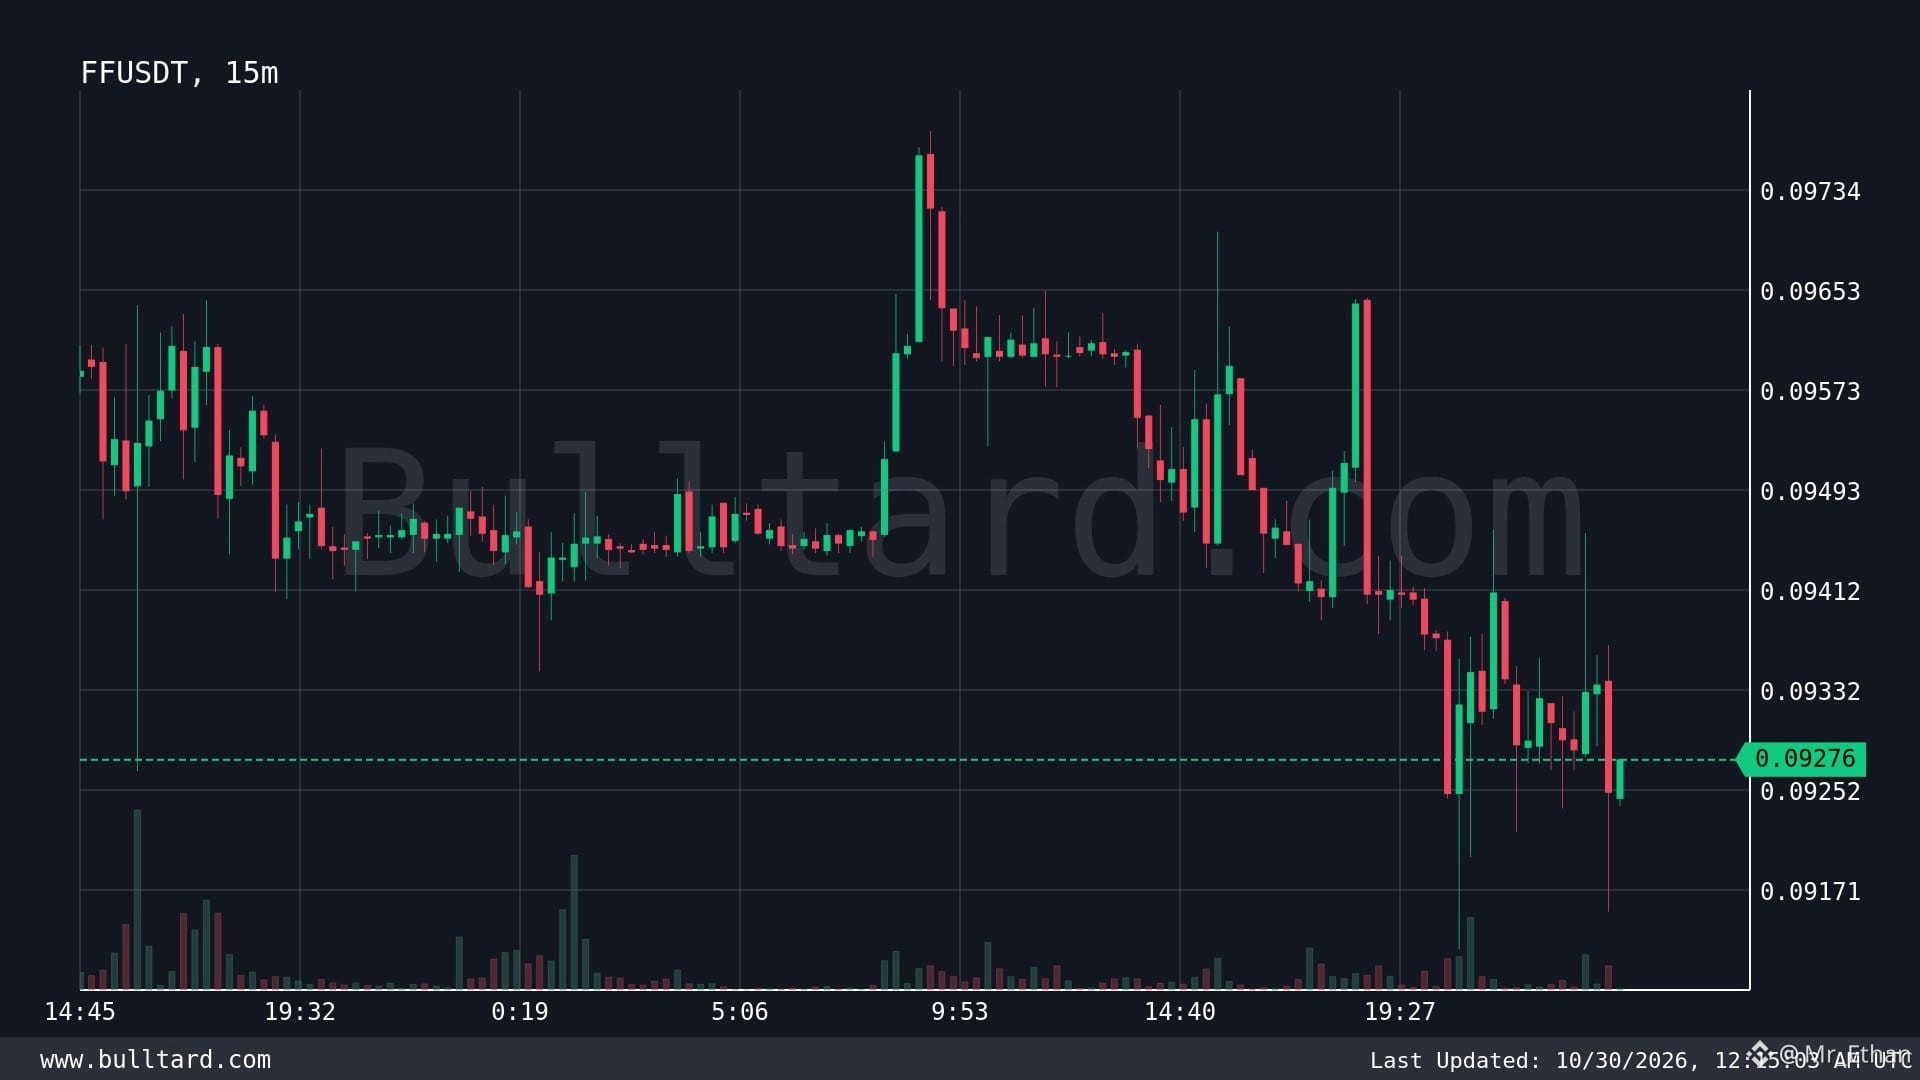
I’m keeping an eye on $FF today. The price is currently around $0.09276, down 2% over the last 24 hours, but the short-term activity is worth watching.
What caught my attention is the latest 1-minute volume. Around 24.5K USDT was traded, with 65% coming from sellers. That tells me selling pressure is still present, even though price moved up 1.2% in the same minute.
I’ve learned not to judge a move by green candles alone. Sometimes a quick bounce happens while larger sellers are still controlling the market.
One positive sign is the trading activity. With 2.8M USDT in 24-hour Binance volume, there is some liquidity and market interest. However, volume alone doesn't guarantee a sustained recovery.
My focus now is whether buyers can absorb the selling pressure and maintain upward momentum.
I prefer waiting for confirmation instead of jumping into every small pump.
Do you think is preparing for a recovery, or is this just a temporary bounce?
$FF $BTC
{spot}(BTCUSDT)
{spot}(FFUSDT)
: Interesting Buying Activity Despite Selling Pressure! 📊
I’m keeping an eye on $FF today. The price is currently around $0.09276, down 2% over the last 24 hours, but the short-term activity is worth watching.
What caught my attention is the latest 1-minute volume. Around 24.5K USDT was traded, with 65% coming from sellers. That tells me selling pressure is still present, even though price moved up 1.2% in the same minute.
I’ve learned not to judge a move by green candles alone. Sometimes a quick bounce happens while larger sellers are still controlling the market.
One positive sign is the trading activity. With 2.8M USDT in 24-hour Binance volume, there is some liquidity and market interest. However, volume alone doesn't guarantee a sustained recovery.
My focus now is whether buyers can absorb the selling pressure and maintain upward momentum.
I prefer waiting for confirmation instead of jumping into every small pump.
Do you think is preparing for a recovery, or is this just a temporary bounce?
$FF $BTC
247
·
--
Daily MACD Turns Bearish – I’m Watching This Level Closely
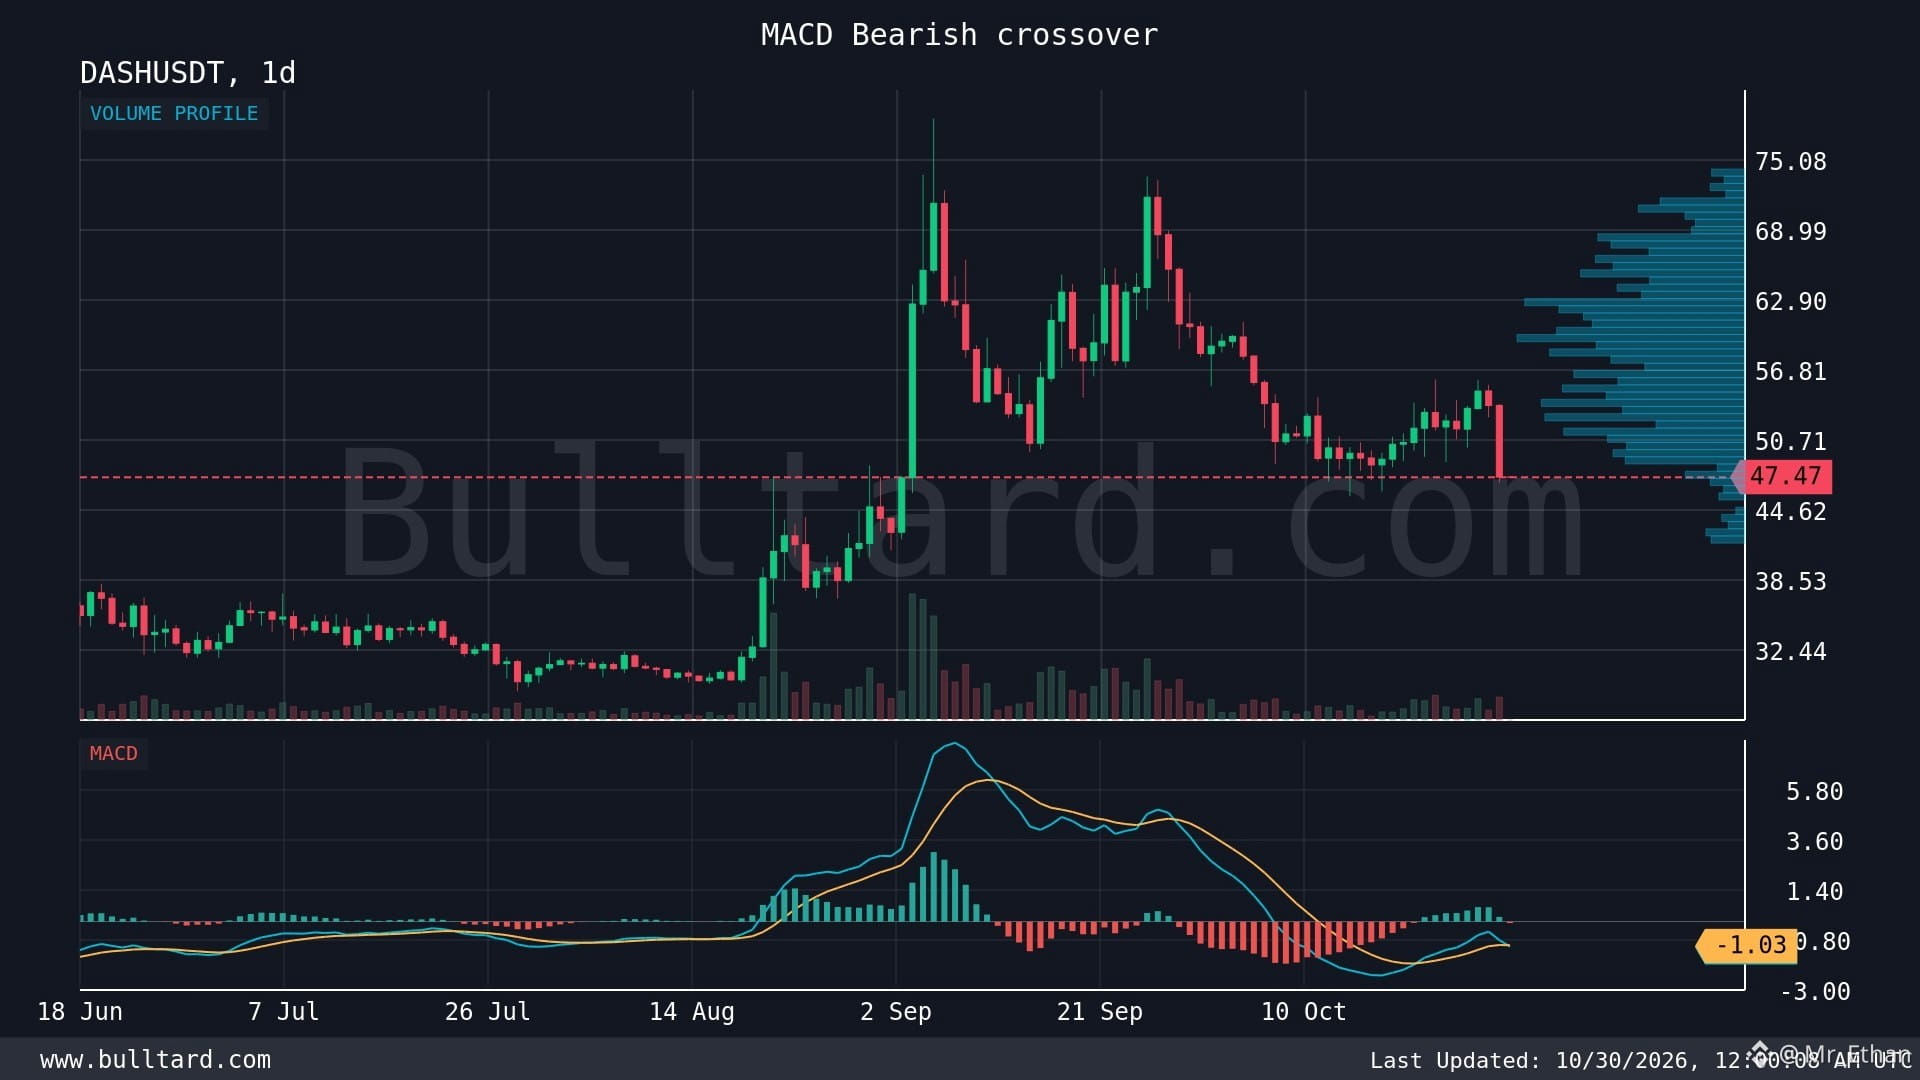
I’ve been watching DASH closely, and the daily chart is starting to show some weakness. The MACD has formed a bearish crossover, which tells me that buying momentum may be slowing down.
With DASH trading around $47.47 on Binance, I’m paying more attention to how price reacts around its current levels.
What I find interesting is that DASH still has a solid place in the crypto payment space. Its focus on fast, low-cost transactions gives it a clear use case. Compared with older payment-focused coins, DASH has an established network and a long history in the market.
But there are risks too. Competition from Litecoin, stablecoins, and newer payment solutions is strong. Adoption also needs to grow if DASH wants to stay relevant.
From my experience, a MACD bearish crossover alone isn't enough to confirm a major downtrend. I always look for volume, support levels, and price confirmation before making a move.
My approach right now is patience, not chasing trades.
Do you think DASH can recover its bullish momentum, or are we looking at more downside?
$DASH $BNB
{spot}(BNBUSDT)
{spot}(DASHUSDT)
Daily MACD Turns Bearish – I’m Watching This Level Closely
I’ve been watching DASH closely, and the daily chart is starting to show some weakness. The MACD has formed a bearish crossover, which tells me that buying momentum may be slowing down.
With DASH trading around $47.47 on Binance, I’m paying more attention to how price reacts around its current levels.
What I find interesting is that DASH still has a solid place in the crypto payment space. Its focus on fast, low-cost transactions gives it a clear use case. Compared with older payment-focused coins, DASH has an established network and a long history in the market.
But there are risks too. Competition from Litecoin, stablecoins, and newer payment solutions is strong. Adoption also needs to grow if DASH wants to stay relevant.
From my experience, a MACD bearish crossover alone isn't enough to confirm a major downtrend. I always look for volume, support levels, and price confirmation before making a move.
My approach right now is patience, not chasing trades.
Do you think DASH can recover its bullish momentum, or are we looking at more downside?
$DASH $BNB
309
·
--
Падение
Meme Coin or Market Opportunity? 🐸
I’ve learned that meme coins can move fast, but they can also punish anyone who enters without a plan. That’s why I’m keeping an eye on $PEPE.
PEPE has built a strong identity in the meme coin market. Its biggest strength is community attention, high trading interest, and the ability to attract traders when market sentiment turns positive.
Unlike projects focused on solving technical problems, PEPE mainly runs on culture, speculation, and community momentum. That’s what makes it different from utility-focused tokens, but it also creates risk.
I’ve seen how quickly meme coins can rally when volume increases and social media attention grows. The same works in reverse. When buyers lose interest, price can fall sharply, especially when liquidity becomes thin.
My approach is simple: I watch trading volume, market structure, Bitcoin’s direction, and key support levels before considering an entry. I never assume that popularity guarantees long-term value.
For me, the biggest lesson is that timing and risk management matter more than hype. PEPE may offer opportunities, but I’m staying realistic about the downside too.
What do you think about ? Can its community keep it relevant, or does it need stronger long-term demand?
$ETH $PEPE
{spot}(PEPEUSDT)
{spot}(ETHUSDT)
Meme Coin or Market Opportunity? 🐸
I’ve learned that meme coins can move fast, but they can also punish anyone who enters without a plan. That’s why I’m keeping an eye on $PEPE .
PEPE has built a strong identity in the meme coin market. Its biggest strength is community attention, high trading interest, and the ability to attract traders when market sentiment turns positive.
Unlike projects focused on solving technical problems, PEPE mainly runs on culture, speculation, and community momentum. That’s what makes it different from utility-focused tokens, but it also creates risk.
I’ve seen how quickly meme coins can rally when volume increases and social media attention grows. The same works in reverse. When buyers lose interest, price can fall sharply, especially when liquidity becomes thin.
My approach is simple: I watch trading volume, market structure, Bitcoin’s direction, and key support levels before considering an entry. I never assume that popularity guarantees long-term value.
For me, the biggest lesson is that timing and risk management matter more than hype. PEPE may offer opportunities, but I’m staying realistic about the downside too.
What do you think about ? Can its community keep it relevant, or does it need stronger long-term demand?
$ETH $PEPE

77
·
--
Падение
I’m Watching This Bearish MACD Signal 👀
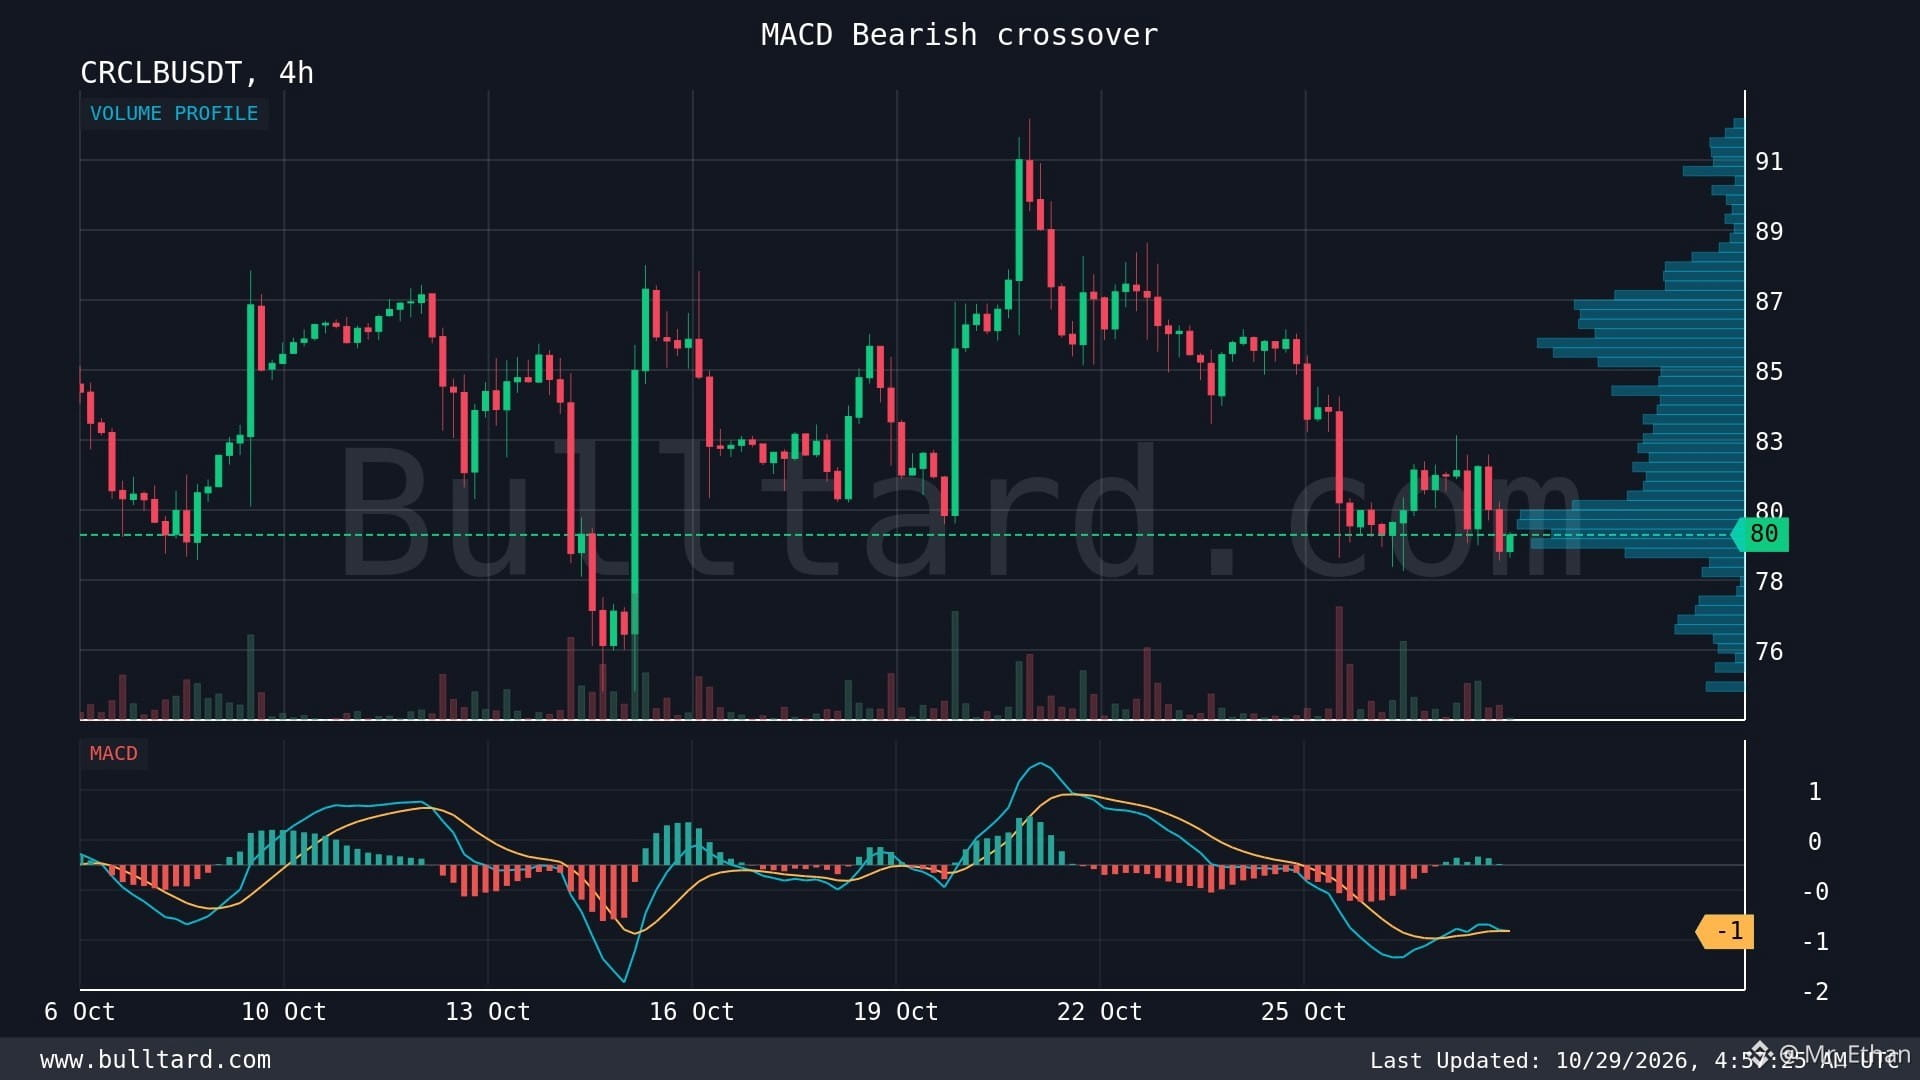
I’m keeping a close eye on CRCLB/USDT after spotting a bearish MACD crossover on the 4H chart. The price is around $79.68 on Binance, and this is a signal I don’t want to ignore.
From my experience, a bearish crossover can suggest that buying momentum is fading. But I’ve learned that one indicator alone is never enough to confirm a trend reversal.
What I’m watching:
🔴 MACD: The bearish crossover suggests sellers may be gaining control.
📉 Price action: I want to see whether CRCLB breaks below nearby support or holds its current range.
⚠️ Risk: If buyers step back in and volume increases, this bearish setup could fail quickly.
One thing I’ve learned in crypto is that chasing every signal often leads to poor entries. I prefer waiting for candle confirmation, checking volume, and watching Bitcoin’s direction before making a move.
CRCLB could see more downside if selling pressure continues, but I’m not treating this crossover as a guaranteed short opportunity.
My focus is simple: protect capital first, then look for a clear setup.
Do you think CRCLB will continue lower, or could buyers reverse the momentum?
$CRCLB
{spot}(CRCLBUSDT)
I’m Watching This Bearish MACD Signal 👀
I’m keeping a close eye on CRCLB/USDT after spotting a bearish MACD crossover on the 4H chart. The price is around $79.68 on Binance, and this is a signal I don’t want to ignore.
From my experience, a bearish crossover can suggest that buying momentum is fading. But I’ve learned that one indicator alone is never enough to confirm a trend reversal.
What I’m watching:
🔴 MACD: The bearish crossover suggests sellers may be gaining control.
📉 Price action: I want to see whether CRCLB breaks below nearby support or holds its current range.
⚠️ Risk: If buyers step back in and volume increases, this bearish setup could fail quickly.
One thing I’ve learned in crypto is that chasing every signal often leads to poor entries. I prefer waiting for candle confirmation, checking volume, and watching Bitcoin’s direction before making a move.
CRCLB could see more downside if selling pressure continues, but I’m not treating this crossover as a guaranteed short opportunity.
My focus is simple: protect capital first, then look for a clear setup.
Do you think CRCLB will continue lower, or could buyers reverse the momentum?
$CRCLB
116
·
--
Рост
🔴 Long Liquidation: A Signal I’m Watching Closely
I’ve learned that liquidation data can reveal a lot about market sentiment. Today, $ALGO saw a $1.3313K long liquidation on Binance around $0.10206. It’s not a huge amount, but it’s still worth watching alongside price action and trading volume.
When long positions get liquidated, it usually means leveraged traders were caught on the wrong side of a price move. If selling pressure continues, more leveraged positions could face risk. But I never assume one liquidation event means a bigger crash is coming.
What interests me about Algorand is its focus on fast transactions, low fees, and efficient blockchain infrastructure. These features can support payments and decentralized applications. Compared with networks like Ethereum, Algorand aims to offer a different balance of speed, cost, and scalability.
Still, strong technology doesn’t guarantee strong token performance. ALGO also faces competition, changing market sentiment, and the challenge of turning blockchain adoption into lasting demand.
My approach is to watch whether holds support or shows further weakness. I’ve seen traders lose money by reacting emotionally to every liquidation alert.
Do you think ALGO can recover from this pressure, or could more downside follow?
$ALGO
{spot}(ALGOUSDT)
$ETH
{spot}(ETHUSDT)
🔴 Long Liquidation: A Signal I’m Watching Closely
I’ve learned that liquidation data can reveal a lot about market sentiment. Today, $ALGO saw a $1.3313K long liquidation on Binance around $0.10206. It’s not a huge amount, but it’s still worth watching alongside price action and trading volume.
When long positions get liquidated, it usually means leveraged traders were caught on the wrong side of a price move. If selling pressure continues, more leveraged positions could face risk. But I never assume one liquidation event means a bigger crash is coming.
What interests me about Algorand is its focus on fast transactions, low fees, and efficient blockchain infrastructure. These features can support payments and decentralized applications. Compared with networks like Ethereum, Algorand aims to offer a different balance of speed, cost, and scalability.
Still, strong technology doesn’t guarantee strong token performance. ALGO also faces competition, changing market sentiment, and the challenge of turning blockchain adoption into lasting demand.
My approach is to watch whether holds support or shows further weakness. I’ve seen traders lose money by reacting emotionally to every liquidation alert.
Do you think ALGO can recover from this pressure, or could more downside follow?
$ALGO
$ETH

3
274
·
--
Падение
📉 A Small Bearish Signal Worth Watching
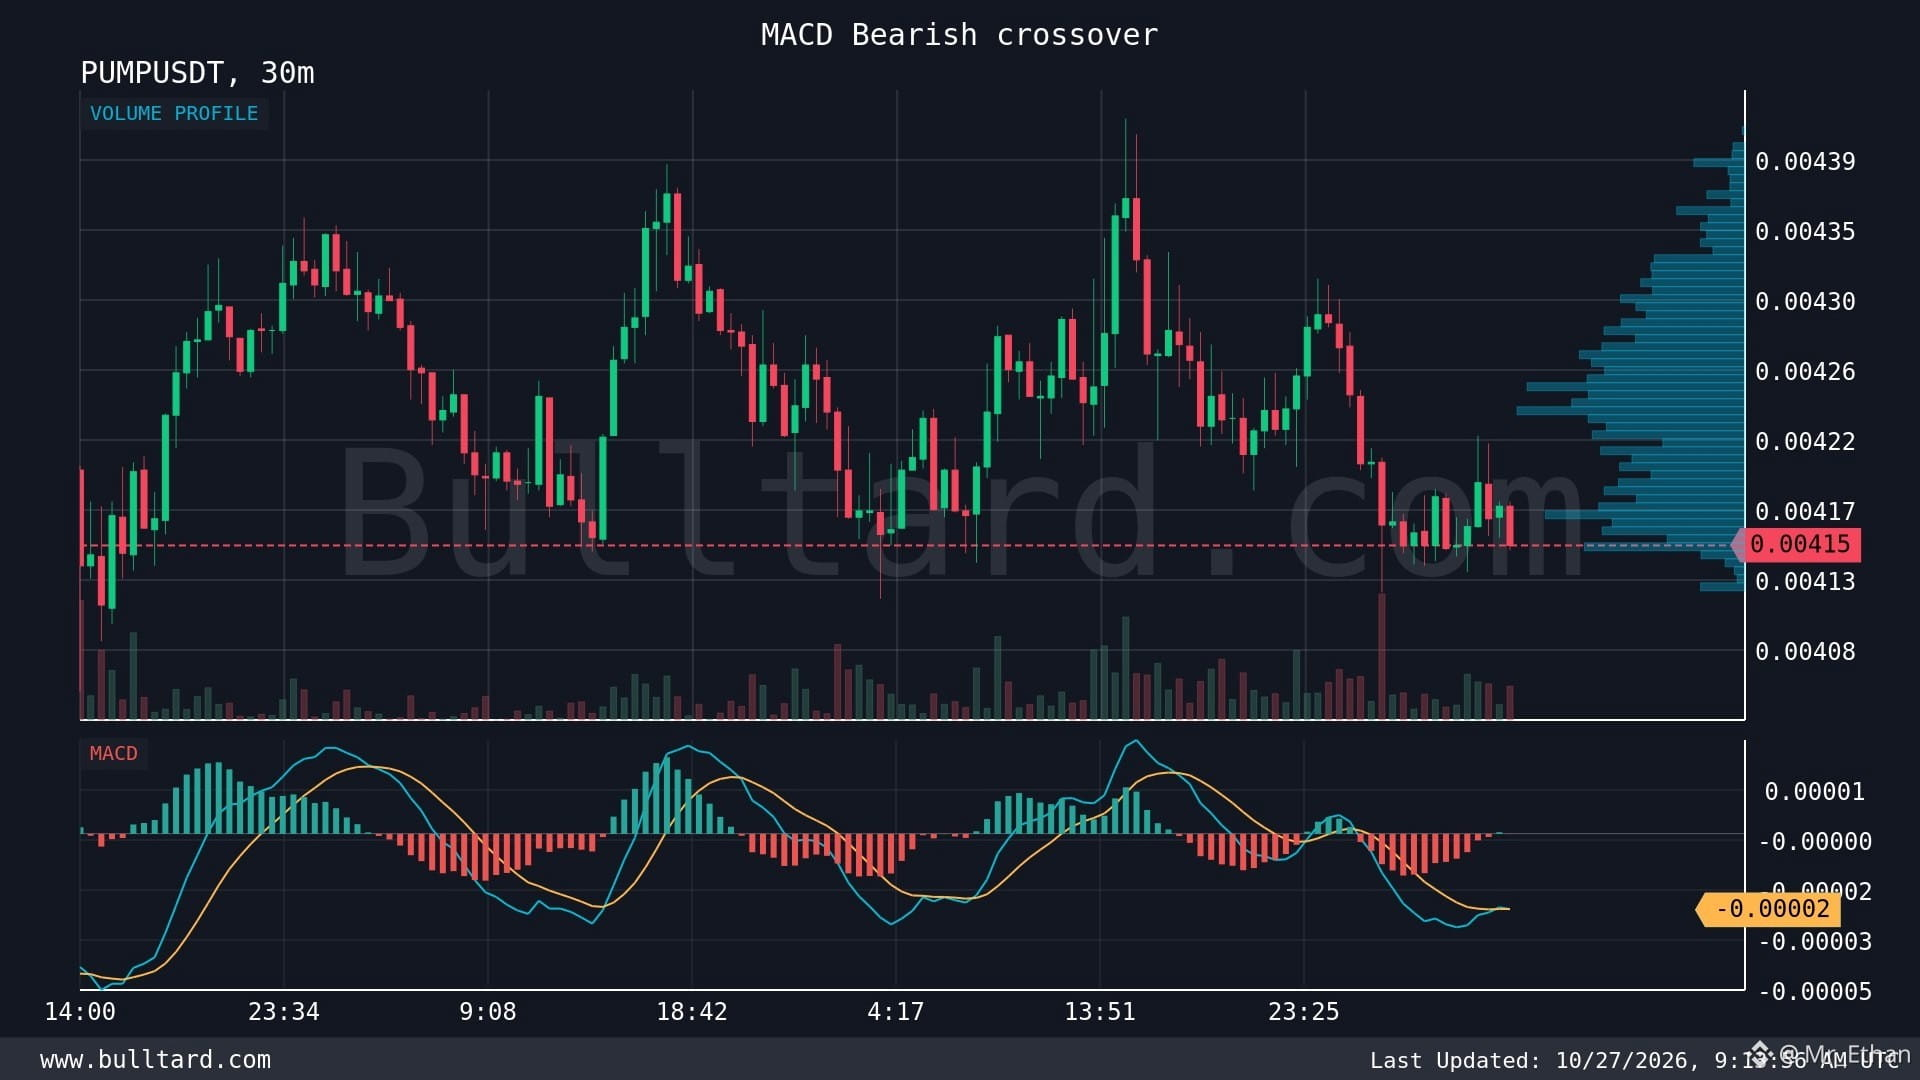
I’m watching PUMP closely today. On the 30-minute chart, PUMP is trading around $0.004148, and the MACD has formed a bearish crossover. The MACD line is slightly below the signal line, suggesting short-term momentum may be weakening.
From my experience, signals like this matter most when price action confirms them. A crossover alone doesn’t mean a major drop is coming, but it tells me to pay more attention to selling pressure.
PUMP stands out because it is closely tied to the Solana memecoin launchpad ecosystem. Its appeal comes from community activity, token trading, and the demand around launching new meme coins. Compared with many smaller tokens, its ecosystem connection gives traders a clear narrative to follow.
Still, there are real risks. Memecoin sentiment can change quickly, liquidity can shift, and sharp rallies can reverse just as fast. Unlike established assets with broader utility, PUMP remains highly sensitive to speculation and market attention.
My approach is simple: I want to see volume and support levels before making a decision. I’ve learned that protecting capital matters more than chasing every move.
Will PUMP recover its momentum, or are sellers gaining control?
$PUMP
{spot}(PUMPUSDT)
$BTC
{spot}(BTCUSDT)
📉 A Small Bearish Signal Worth Watching
I’m watching PUMP closely today. On the 30-minute chart, PUMP is trading around $0.004148, and the MACD has formed a bearish crossover. The MACD line is slightly below the signal line, suggesting short-term momentum may be weakening.
From my experience, signals like this matter most when price action confirms them. A crossover alone doesn’t mean a major drop is coming, but it tells me to pay more attention to selling pressure.
PUMP stands out because it is closely tied to the Solana memecoin launchpad ecosystem. Its appeal comes from community activity, token trading, and the demand around launching new meme coins. Compared with many smaller tokens, its ecosystem connection gives traders a clear narrative to follow.
Still, there are real risks. Memecoin sentiment can change quickly, liquidity can shift, and sharp rallies can reverse just as fast. Unlike established assets with broader utility, PUMP remains highly sensitive to speculation and market attention.
My approach is simple: I want to see volume and support levels before making a decision. I’ve learned that protecting capital matters more than chasing every move.
Will PUMP recover its momentum, or are sellers gaining control?
$PUMP
$BTC
219
·
--
Падение
📉 : Bearish MACD Signal on the 30-Minute Chart
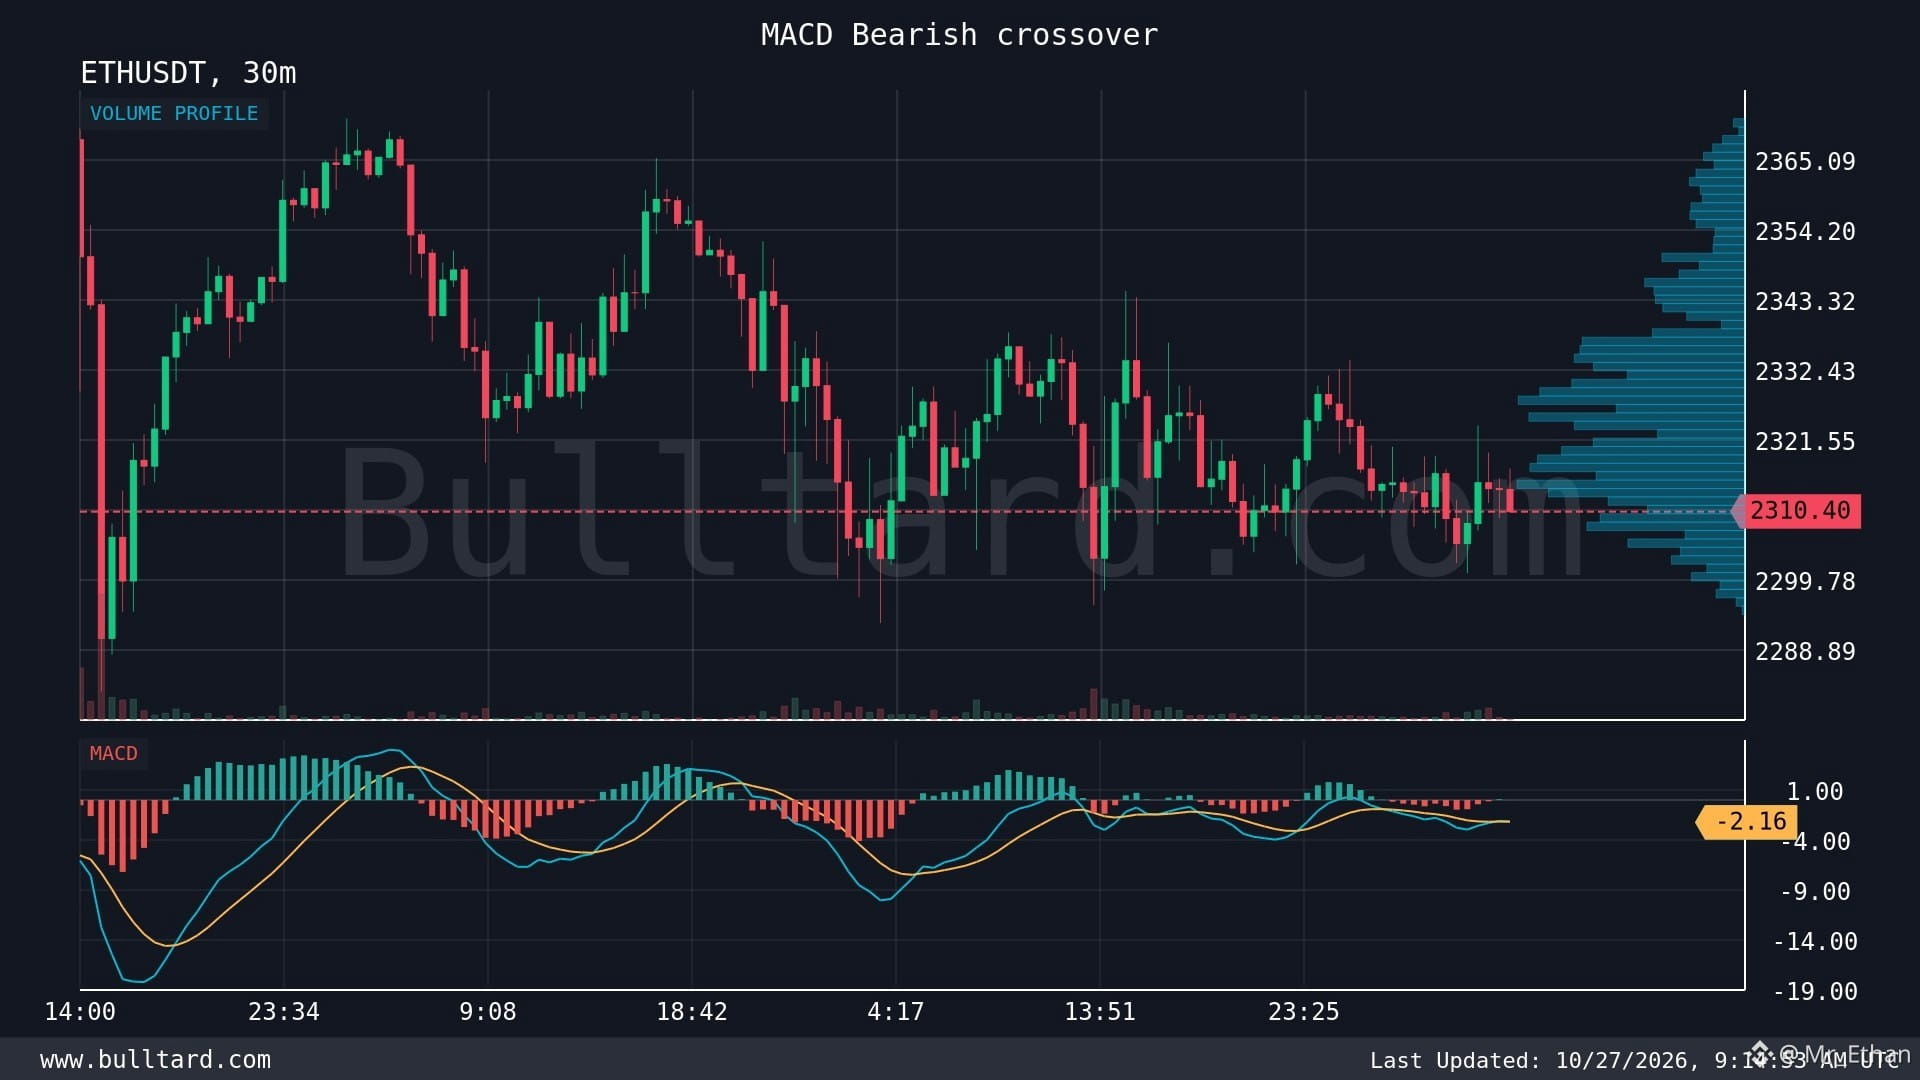
I’m keeping a close eye on Ethereum right now. ETH is trading around $2,310.40, and the 30-minute MACD is showing a bearish crossover. It’s a signal I don’t like to ignore.
From my experience, MACD crossovers can help spot a shift in momentum, especially when selling pressure starts building. But I never treat one indicator as a guarantee of where price will go next.
Ethereum still has strong fundamentals. Its smart contract ecosystem, DeFi activity, and growing Layer 2 network make ETH different from many other crypto assets. However, strong fundamentals don’t always protect price during short-term market weakness.
My concern here is whether sellers can maintain pressure below the current price. If bearish momentum builds, ETH could test nearby support levels. On the other hand, if buyers step in and volume increases, this crossover could turn into a false signal.
I’ve learned that chasing every MACD signal can be costly. I prefer waiting for price action and volume confirmation before making a move. Risk management matters more than predicting every candle.
What do you think? Will ETH continue lower, or can buyers push it back up?
$ETH
{spot}(ETHUSDT)
$BNB
{spot}(BNBUSDT)
📉 : Bearish MACD Signal on the 30-Minute Chart
I’m keeping a close eye on Ethereum right now. ETH is trading around $2,310.40, and the 30-minute MACD is showing a bearish crossover. It’s a signal I don’t like to ignore.
From my experience, MACD crossovers can help spot a shift in momentum, especially when selling pressure starts building. But I never treat one indicator as a guarantee of where price will go next.
Ethereum still has strong fundamentals. Its smart contract ecosystem, DeFi activity, and growing Layer 2 network make ETH different from many other crypto assets. However, strong fundamentals don’t always protect price during short-term market weakness.
My concern here is whether sellers can maintain pressure below the current price. If bearish momentum builds, ETH could test nearby support levels. On the other hand, if buyers step in and volume increases, this crossover could turn into a false signal.
I’ve learned that chasing every MACD signal can be costly. I prefer waiting for price action and volume confirmation before making a move. Risk management matters more than predicting every candle.
What do you think? Will ETH continue lower, or can buyers push it back up?
$ETH
$BNB
173
·
--
Падение
I’ve learned that with $PEPE
{spot}(PEPEUSDT)
, market sentiment can change faster than most people expect. 🐸
I’m always interested in how meme coins move when traders start chasing momentum. PEPE has built a strong identity in the meme coin market, driven by its community, online attention, and high-risk trading culture.
What makes PEPE different is its brand recognition and ability to attract attention quickly. Compared with smaller meme coins, that visibility can help it maintain stronger market interest. But attention alone doesn’t guarantee long-term value.
Unlike projects focused on DeFi, smart contracts, or real-world applications, PEPE’s price depends heavily on community activity, liquidity, and speculation. That creates opportunities during strong meme coin rallies, but it also brings serious risks when momentum fades.
I’ve seen how quickly green candles can turn red when buyers lose confidence. That’s why I watch trading volume, liquidity, Bitcoin’s direction, and overall market sentiment instead of following hype blindly.
My approach is simple: I respect the momentum, but I never forget the risk. Meme coins can move fast in both directions, and protecting capital matters more than catching every pump.
What’s your view on $PEPE right now? Can community momentum keep it strong, or does it need a broader market rally?
#PEPE #MEME #Crypto
I’ve learned that with $PEPE
, market sentiment can change faster than most people expect. 🐸
I’m always interested in how meme coins move when traders start chasing momentum. PEPE has built a strong identity in the meme coin market, driven by its community, online attention, and high-risk trading culture.
What makes PEPE different is its brand recognition and ability to attract attention quickly. Compared with smaller meme coins, that visibility can help it maintain stronger market interest. But attention alone doesn’t guarantee long-term value.
Unlike projects focused on DeFi, smart contracts, or real-world applications, PEPE’s price depends heavily on community activity, liquidity, and speculation. That creates opportunities during strong meme coin rallies, but it also brings serious risks when momentum fades.
I’ve seen how quickly green candles can turn red when buyers lose confidence. That’s why I watch trading volume, liquidity, Bitcoin’s direction, and overall market sentiment instead of following hype blindly.
My approach is simple: I respect the momentum, but I never forget the risk. Meme coins can move fast in both directions, and protecting capital matters more than catching every pump.
What’s your view on $PEPE right now? Can community momentum keep it strong, or does it need a broader market rally?
#PEPE #MEME #Crypto

1
237
·
--
Падение
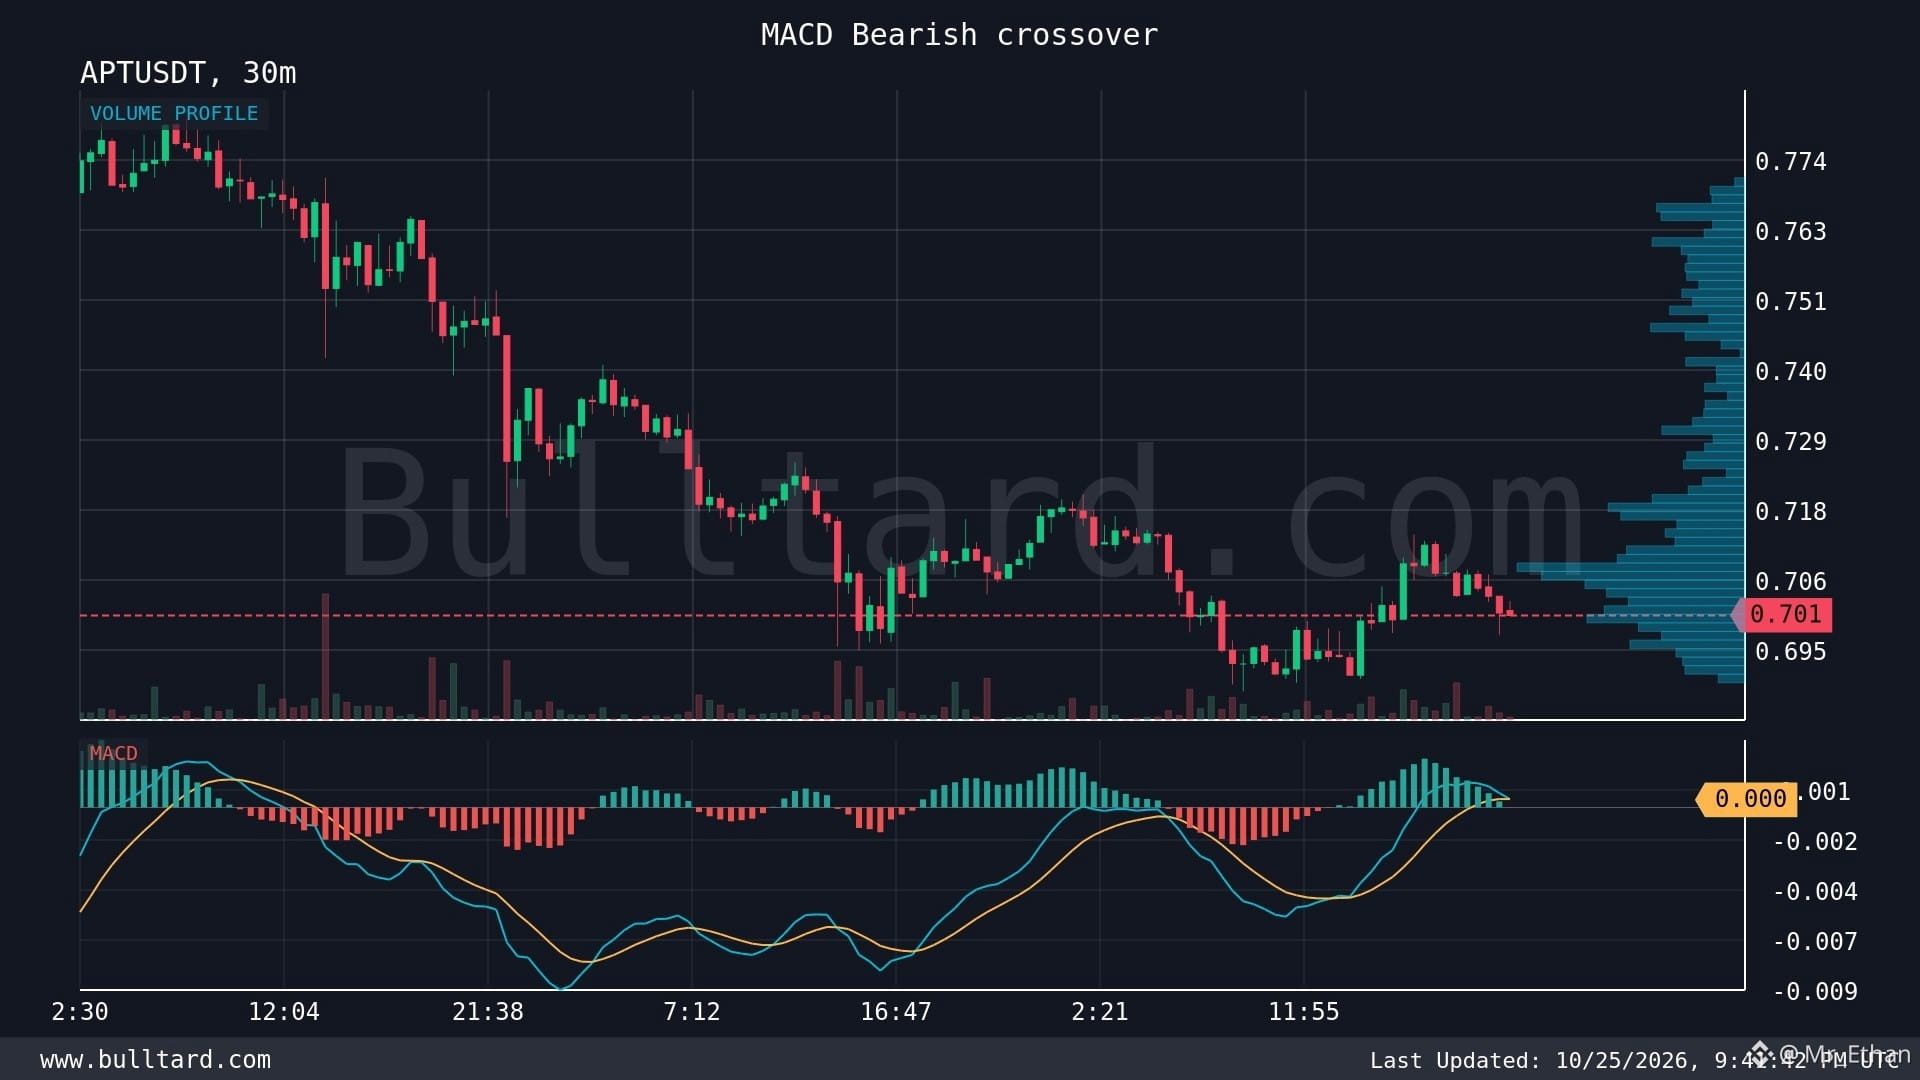
I’m watching #APT🔥 /USDT closely after this 30-minute MACD bearish crossover. 📉
APT is trading around $0.7006, with the MACD line at 0.0004186 and the signal line at 0.0004256. The MACD line has slipped slightly below the signal line, which suggests short-term momentum may be cooling.
I’ve learned that when a signal appears near a weak price structure, it deserves attention. But I never treat one crossover as a guaranteed direction.
Aptos is a Layer 1 blockchain built for fast transactions and scalable applications. Its Move programming language and focus on performance help it stand out in a competitive space alongside Sui and other smart contract networks.
The opportunity is clear: better blockchain performance can support DeFi, gaming, and consumer apps. The challenge is turning that technology into lasting adoption while competing for users, developers, and liquidity. Token supply and broader market weakness can also put pressure on APT.
My next step is to watch trading volume and nearby support. If sellers gain strength, downside pressure could continue. If buyers defend support, this crossover may become a false signal.
My lesson is simple: follow the price, not just the indicator.
Do you think can recover, or are sellers gaining control? $APT
{spot}(APTUSDT)
I’m watching #APT🔥 /USDT closely after this 30-minute MACD bearish crossover. 📉
APT is trading around $0.7006, with the MACD line at 0.0004186 and the signal line at 0.0004256. The MACD line has slipped slightly below the signal line, which suggests short-term momentum may be cooling.
I’ve learned that when a signal appears near a weak price structure, it deserves attention. But I never treat one crossover as a guaranteed direction.
Aptos is a Layer 1 blockchain built for fast transactions and scalable applications. Its Move programming language and focus on performance help it stand out in a competitive space alongside Sui and other smart contract networks.
The opportunity is clear: better blockchain performance can support DeFi, gaming, and consumer apps. The challenge is turning that technology into lasting adoption while competing for users, developers, and liquidity. Token supply and broader market weakness can also put pressure on APT.
My next step is to watch trading volume and nearby support. If sellers gain strength, downside pressure could continue. If buyers defend support, this crossover may become a false signal.
My lesson is simple: follow the price, not just the indicator.
Do you think can recover, or are sellers gaining control? $APT
3
1.1k
·
--
Рост
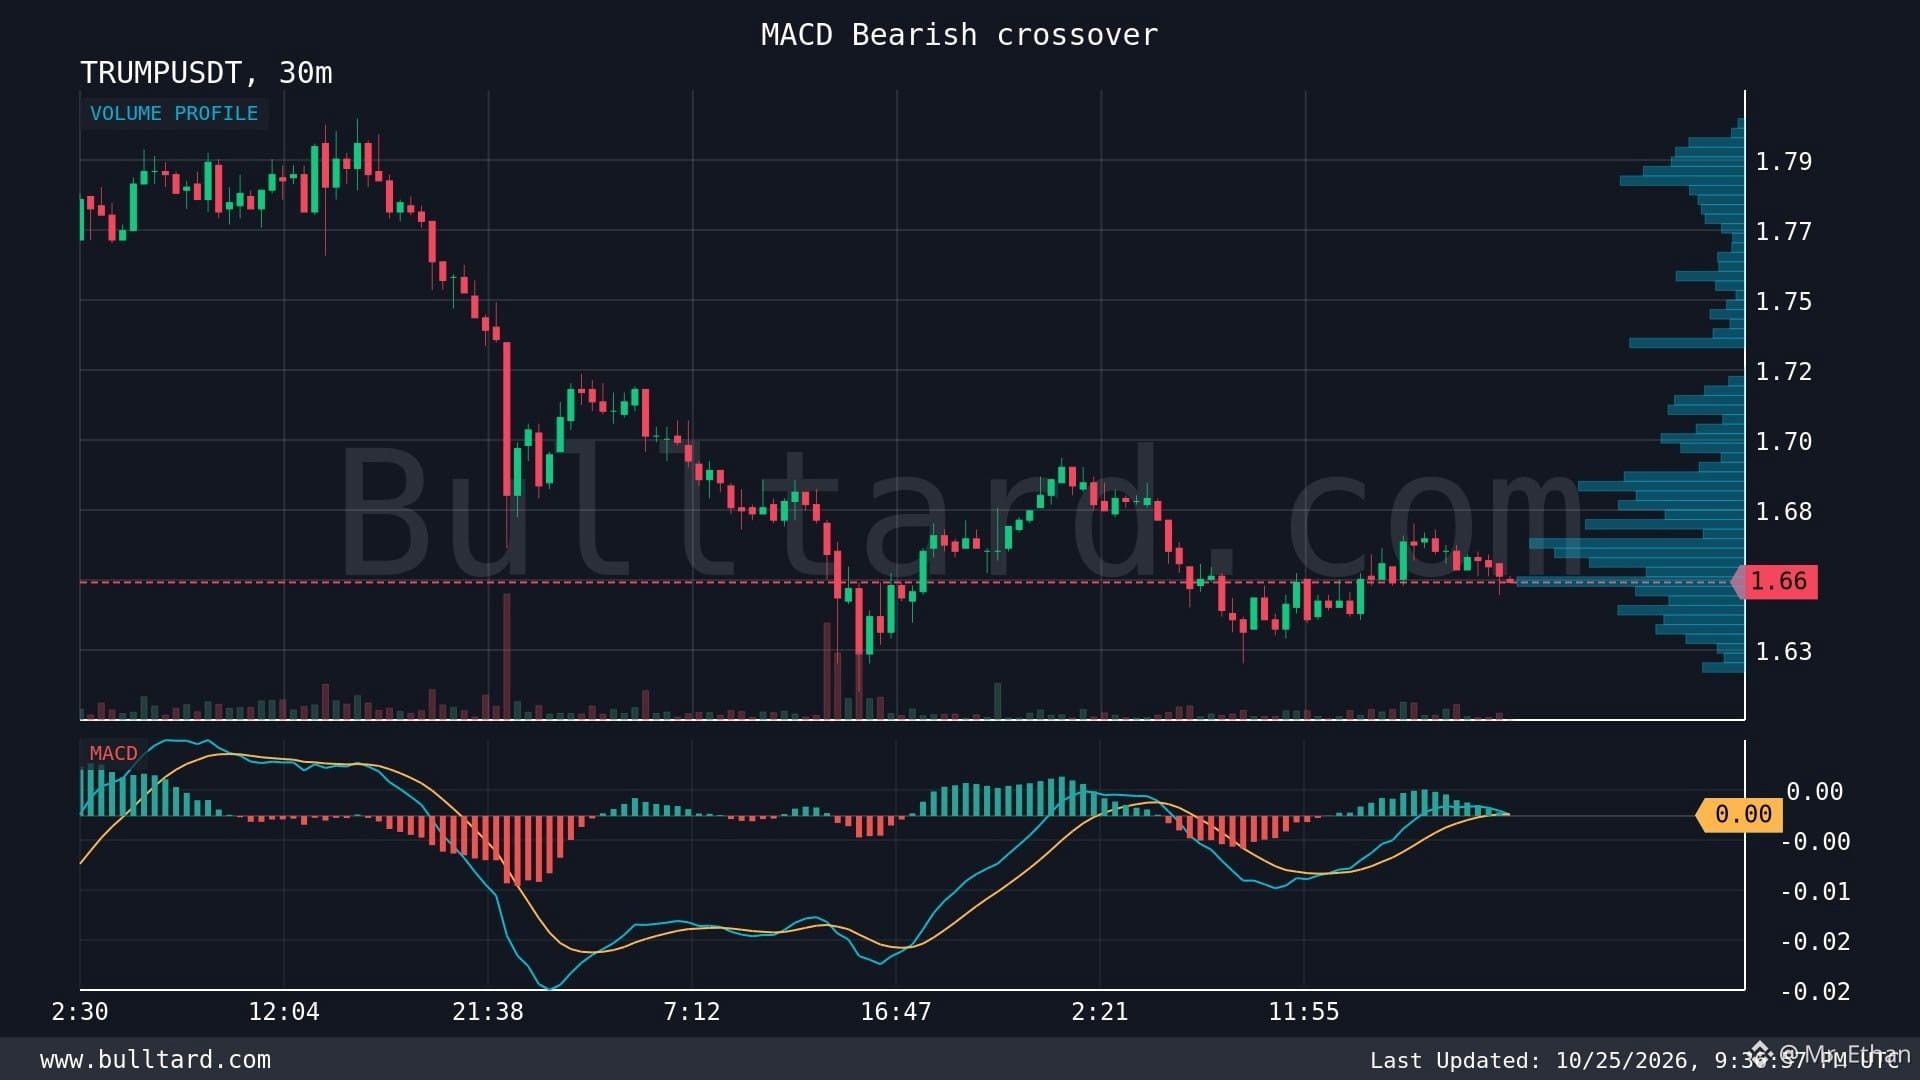
I’m keeping an eye on @Square-Creator-d7346d2667aa3 /USDT after this 30-minute MACD bearish crossover. 👀
The price is around $1.656, with the MACD line at 0.000178 and the signal line at 0.0001841. The MACD line has moved slightly below the signal line, suggesting that short-term momentum may be weakening.
I’ve learned that small crossovers can be early warning signs, but they aren’t enough to confirm a bigger move.
TRUMP is a politically themed meme coin, so its price action can be heavily influenced by social media attention, headlines, and sudden shifts in market sentiment. That attention can create strong rallies, but it can also lead to sharp reversals. Unlike established DeFi projects, TRUMP doesn’t offer the same core lending or financial infrastructure value.
For me, the main risk is volatility. If sellers gain control and price breaks support, bearish pressure could build. But if buyers return with strong volume, this crossover may turn into a false signal.
My approach is to watch volume, support levels, and broader crypto market direction before taking a position. I never let one indicator make the decision for me.
Do you think will face more selling pressure, or can buyers regain control? 📉 $TRUMP
{spot}(TRUMPUSDT)
I’m keeping an eye on @Trump /USDT after this 30-minute MACD bearish crossover. 👀
The price is around $1.656, with the MACD line at 0.000178 and the signal line at 0.0001841. The MACD line has moved slightly below the signal line, suggesting that short-term momentum may be weakening.
I’ve learned that small crossovers can be early warning signs, but they aren’t enough to confirm a bigger move.
TRUMP is a politically themed meme coin, so its price action can be heavily influenced by social media attention, headlines, and sudden shifts in market sentiment. That attention can create strong rallies, but it can also lead to sharp reversals. Unlike established DeFi projects, TRUMP doesn’t offer the same core lending or financial infrastructure value.
For me, the main risk is volatility. If sellers gain control and price breaks support, bearish pressure could build. But if buyers return with strong volume, this crossover may turn into a false signal.
My approach is to watch volume, support levels, and broader crypto market direction before taking a position. I never let one indicator make the decision for me.
Do you think will face more selling pressure, or can buyers regain control? 📉 $TRUMP
348
·
--
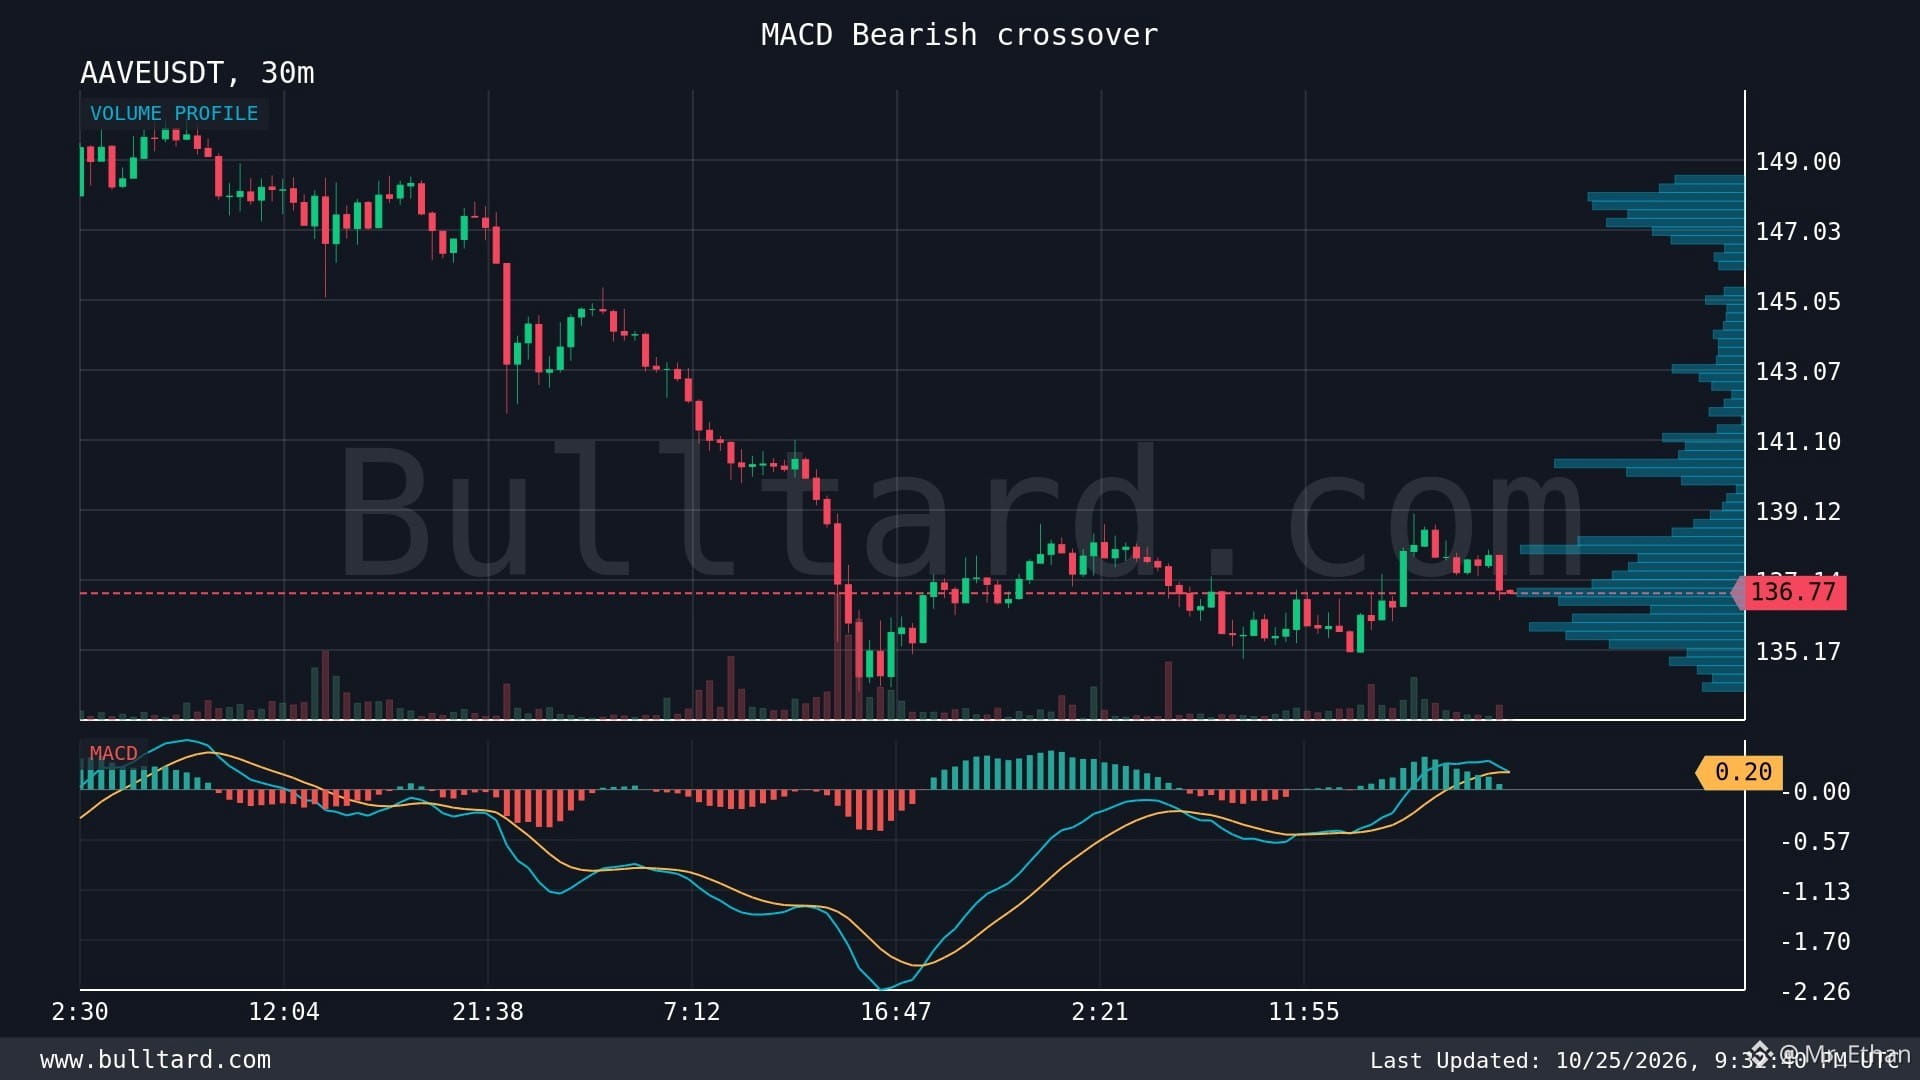
I’m watching $AAVE
{spot}(AAVEUSDT)
closely after this 30-minute MACD bearish crossover. 👀
AAVE is trading around $136.77, and the MACD line and signal line are both near 0.1958. This is a level I want to watch carefully before making any decision.
I’ve learned that these small signals can matter, but they don’t tell the whole story.
AAVE is one of the key projects in DeFi. It lets users lend and borrow crypto without relying on traditional banks. Its strength is its established lending infrastructure and role in the DeFi ecosystem. Compared with many smaller DeFi tokens, AAVE has a more mature track record, but it still faces smart contract risks, changing market conditions, and competition from other lending protocols.
For now, the bearish crossover could point to weakening short-term momentum. If selling pressure builds, I’d watch whether price breaks nearby support. If buyers step in and momentum recovers, this signal could quickly lose its meaning.
My rule is simple: I never trade on MACD alone. I combine it with price action, volume, and key support and resistance levels.
Crypto has taught me that protecting capital matters more than chasing every move.
What do you think about AAVE here? Will bears take control, or can buyers push the price back up? 📊
I’m watching $AAVE
closely after this 30-minute MACD bearish crossover. 👀
AAVE is trading around $136.77, and the MACD line and signal line are both near 0.1958. This is a level I want to watch carefully before making any decision.
I’ve learned that these small signals can matter, but they don’t tell the whole story.
AAVE is one of the key projects in DeFi. It lets users lend and borrow crypto without relying on traditional banks. Its strength is its established lending infrastructure and role in the DeFi ecosystem. Compared with many smaller DeFi tokens, AAVE has a more mature track record, but it still faces smart contract risks, changing market conditions, and competition from other lending protocols.
For now, the bearish crossover could point to weakening short-term momentum. If selling pressure builds, I’d watch whether price breaks nearby support. If buyers step in and momentum recovers, this signal could quickly lose its meaning.
My rule is simple: I never trade on MACD alone. I combine it with price action, volume, and key support and resistance levels.
Crypto has taught me that protecting capital matters more than chasing every move.
What do you think about AAVE here? Will bears take control, or can buyers push the price back up? 📊
313
·
--
Рост
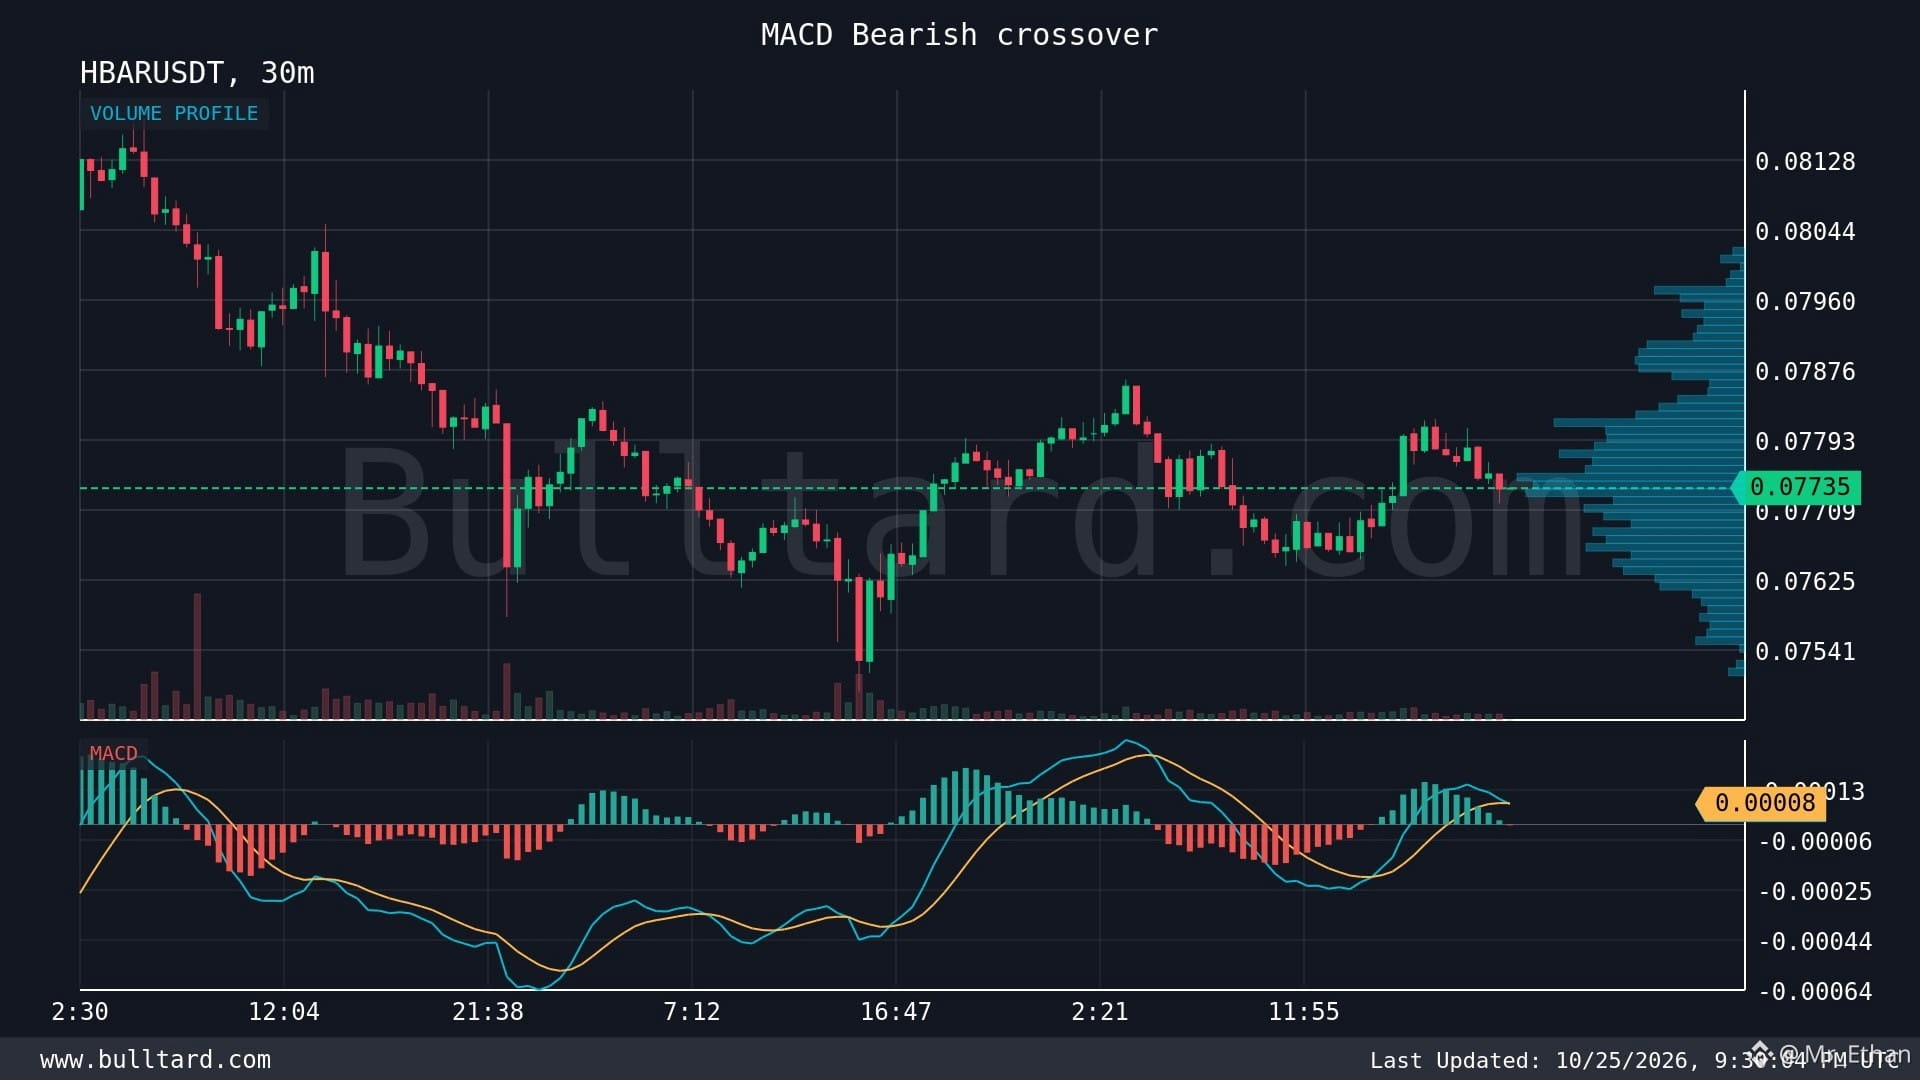
🚨 $HBAR /USDT: I’m Watching This Key Support Level Closely! 📉
I’m keeping an eye on HBAR because the 30-minute MACD has shown a bearish crossover. For me, this is a signal to watch carefully, not a reason to enter a trade blindly.
💰 Current Price: 0.07735
🛡️ Support: 0.07680
🎯 Downside Target: 0.07600
🚧 Resistance: 0.07800
I’ve learned that support levels can look strong until sellers push through them. If HBAR breaks below 0.07680 with solid selling volume, I’ll watch for a possible move toward 0.07600.
But there’s another side to this setup. If buyers defend support and push the price back above resistance, the bearish signal could lose strength. Crypto moves fast, and MACD alone is never enough for me to make a decision.
I also watch volume, candle closes, and Bitcoin’s direction before taking a position. HBAR has potential in the blockchain space, but adoption and real demand matter more than hype. Competition and broader market weakness remain risks.
My takeaway: I’d rather wait for confirmation than chase a candle and regret it later.
What do you think? Will HBAR break below 0.07680, or will buyers step in and reverse the move?
#HBAR #Hedera #CryptoTrading #Altcoins #BinanceSquare
{spot}(HBARUSDT)
🚨 $HBAR /USDT: I’m Watching This Key Support Level Closely! 📉
I’m keeping an eye on HBAR because the 30-minute MACD has shown a bearish crossover. For me, this is a signal to watch carefully, not a reason to enter a trade blindly.
💰 Current Price: 0.07735
🛡️ Support: 0.07680
🎯 Downside Target: 0.07600
🚧 Resistance: 0.07800
I’ve learned that support levels can look strong until sellers push through them. If HBAR breaks below 0.07680 with solid selling volume, I’ll watch for a possible move toward 0.07600.
But there’s another side to this setup. If buyers defend support and push the price back above resistance, the bearish signal could lose strength. Crypto moves fast, and MACD alone is never enough for me to make a decision.
I also watch volume, candle closes, and Bitcoin’s direction before taking a position. HBAR has potential in the blockchain space, but adoption and real demand matter more than hype. Competition and broader market weakness remain risks.
My takeaway: I’d rather wait for confirmation than chase a candle and regret it later.
What do you think? Will HBAR break below 0.07680, or will buyers step in and reverse the move?
#HBAR #Hedera #CryptoTrading #Altcoins #BinanceSquare
1
463
·
--
$PENDLE
{spot}(PENDLEUSDT)
/USDT: I’m Watching This Bearish Signal 📉
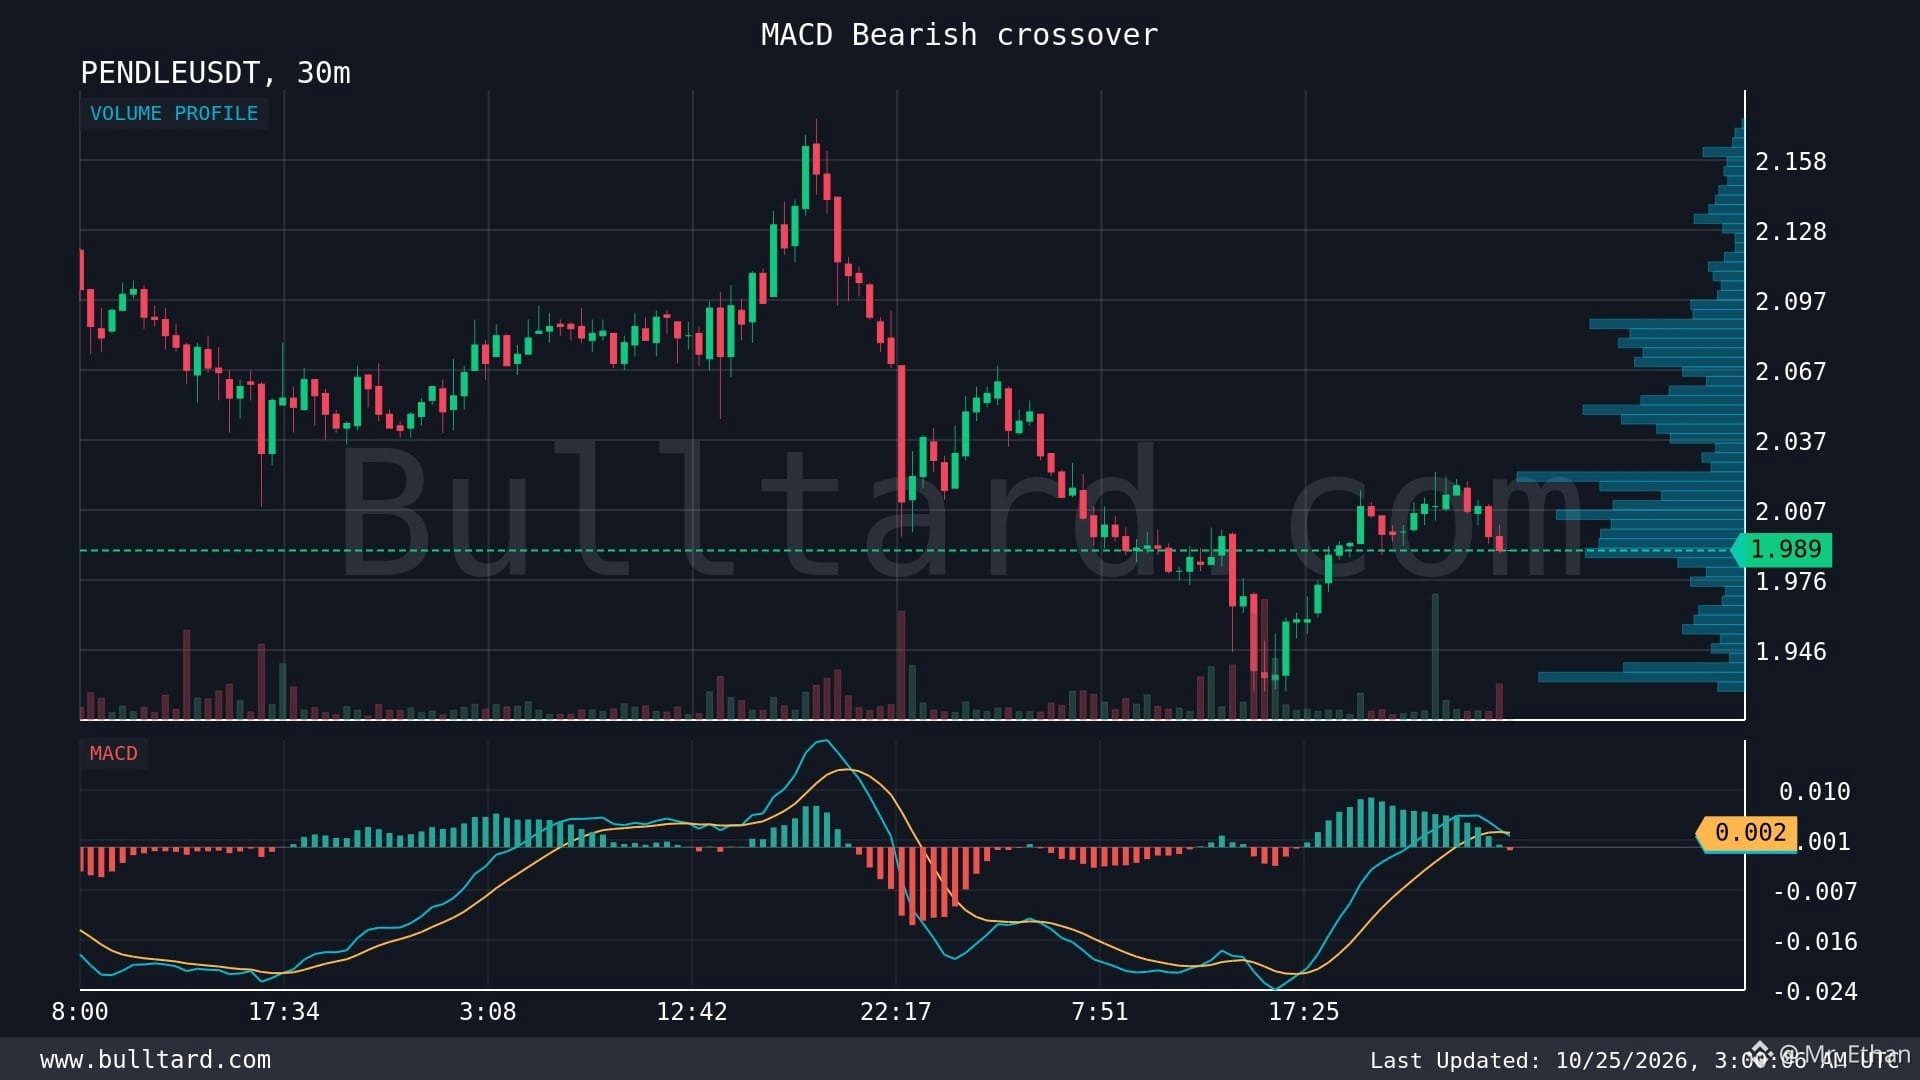
I’ve been checking PENDLE/USDT on the 30-minute chart, and the latest MACD crossover has caught my attention.
PENDLE is trading around $1.989. The MACD line is at 0.001899, below the signal line at 0.002434. This suggests short-term buying momentum may be losing strength.
What I find interesting about Pendle is its approach to DeFi yields. It allows users to separate an asset’s principal from its future yield, giving them more ways to manage risk or speculate on returns. That makes it different from many standard DeFi tokens.
I believe yield trading can play a useful role in DeFi, especially for users who want more control over their returns. But there are risks too. Smart contract vulnerabilities, changing yields, low liquidity, and falling demand can all affect the ecosystem and PENDLE’s price.
My trading experience has taught me not to treat every bearish crossover as a sell signal. I want to see volume, support levels, and follow-through before drawing stronger conclusions.
For now, I’m watching how price reacts around current levels rather than making emotional moves.
What do you think? Will PENDLE recover its momentum, or is more downside possible?
#PENDLE #DeFi #CryptoTrading #BinanceSquare
$PENDLE
/USDT: I’m Watching This Bearish Signal 📉
I’ve been checking PENDLE/USDT on the 30-minute chart, and the latest MACD crossover has caught my attention.
PENDLE is trading around $1.989. The MACD line is at 0.001899, below the signal line at 0.002434. This suggests short-term buying momentum may be losing strength.
What I find interesting about Pendle is its approach to DeFi yields. It allows users to separate an asset’s principal from its future yield, giving them more ways to manage risk or speculate on returns. That makes it different from many standard DeFi tokens.
I believe yield trading can play a useful role in DeFi, especially for users who want more control over their returns. But there are risks too. Smart contract vulnerabilities, changing yields, low liquidity, and falling demand can all affect the ecosystem and PENDLE’s price.
My trading experience has taught me not to treat every bearish crossover as a sell signal. I want to see volume, support levels, and follow-through before drawing stronger conclusions.
For now, I’m watching how price reacts around current levels rather than making emotional moves.
What do you think? Will PENDLE recover its momentum, or is more downside possible?
#PENDLE #DeFi #CryptoTrading #BinanceSquare
1
93
·
--
$CHIP
{spot}(CHIPUSDT)
/USDT: I’m Watching This MACD Signal Closely 📉
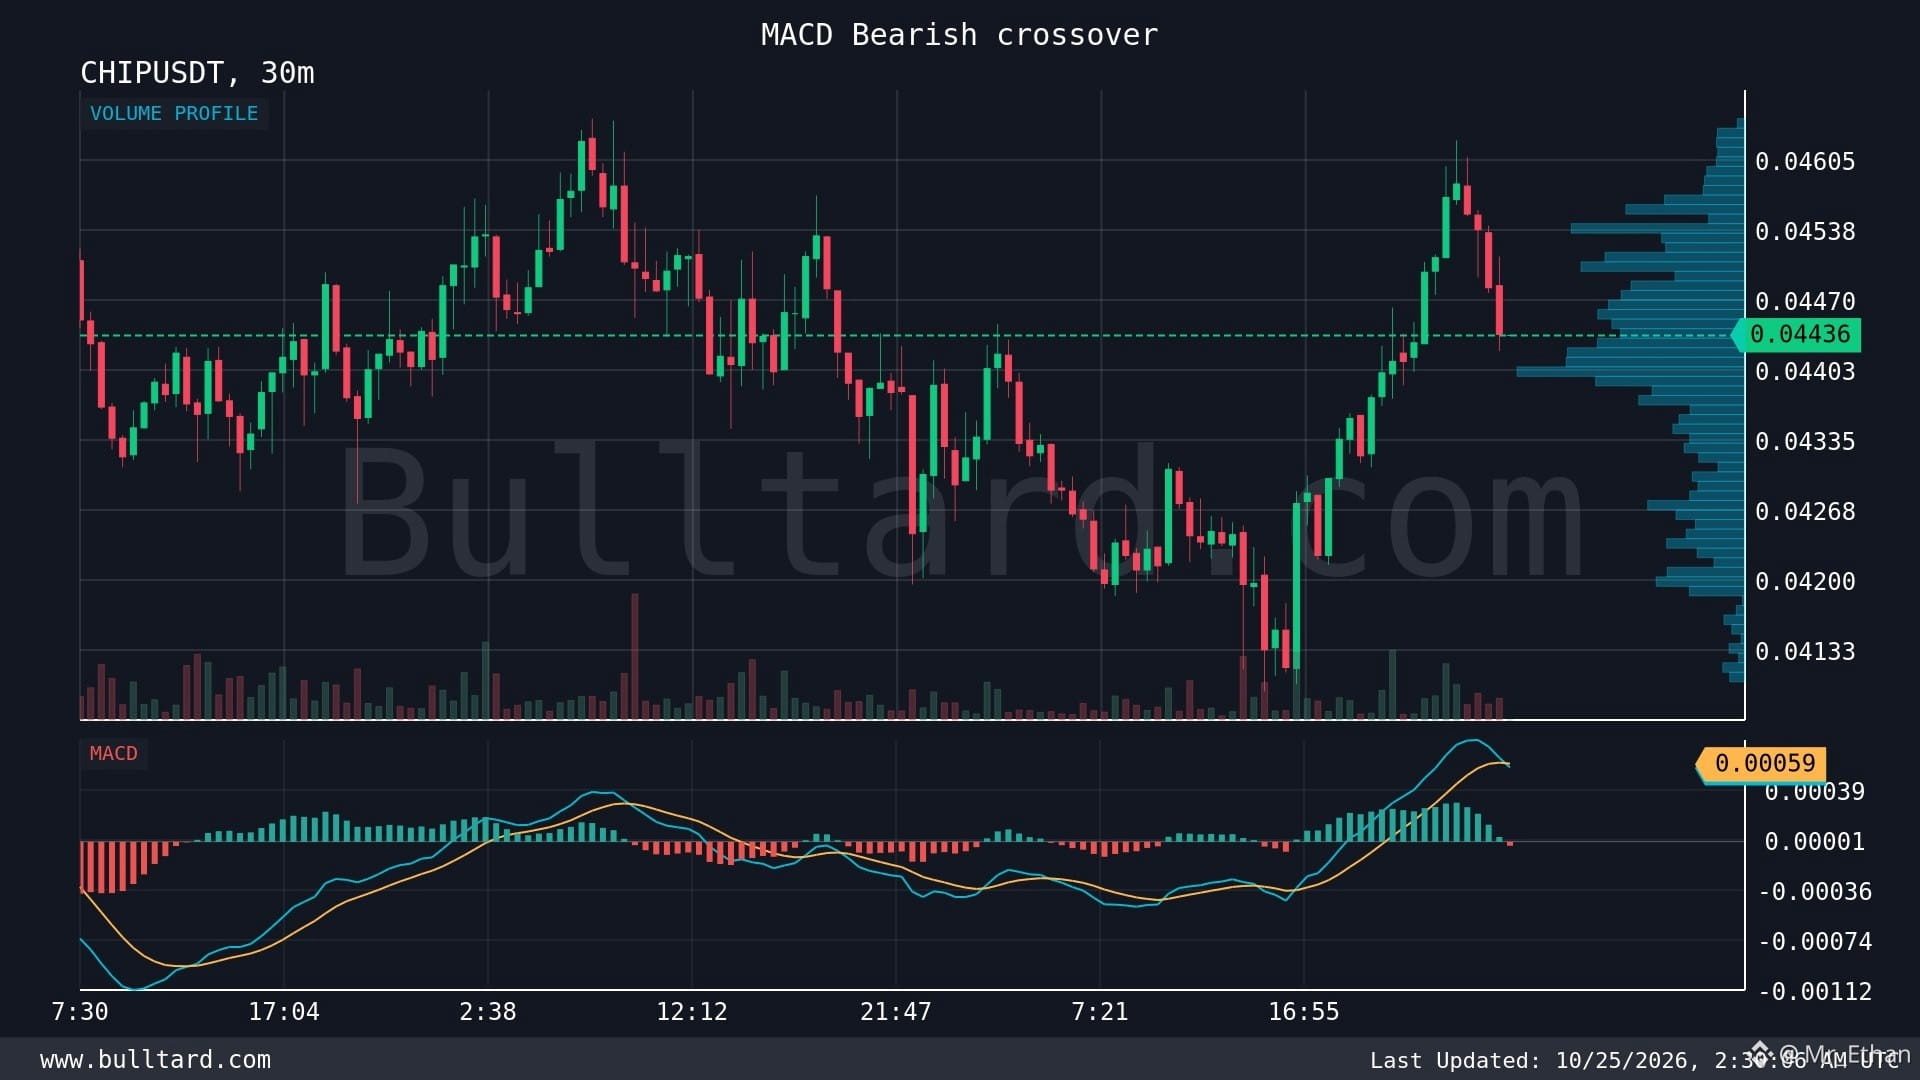
I’ve been looking at CHIP/USDT on the 30-minute chart, and there’s a small shift in momentum that caught my attention.
The price is currently around $0.04436. The MACD line sits at 0.0005615, slightly below the signal line at 0.000591. This bearish crossover suggests that buying momentum may be weakening in the short term.
From my experience, these signals are useful, but I never rely on MACD alone. I also watch volume, support levels, and how price reacts after the crossover. Sometimes sellers take control, while other times the signal reverses quickly.
What interests me most is the broader potential of blockchain and AI-related crypto projects. If CHIP can build real utility, attract users, and maintain demand, that could matter more over time than short-term price movements. However, I always check the project's actual use case, liquidity, token supply, and adoption before forming a long-term view.
My biggest lesson from trading altcoins is simple: a signal is a warning, not a guarantee. I prefer confirmation over emotional decisions.
What’s your view on CHIP/USDT? Will bearish momentum continue, or could buyers regain control?
#CHIP #CryptoTrading #MACD #BinanceSquare
$CHIP
/USDT: I’m Watching This MACD Signal Closely 📉
I’ve been looking at CHIP/USDT on the 30-minute chart, and there’s a small shift in momentum that caught my attention.
The price is currently around $0.04436. The MACD line sits at 0.0005615, slightly below the signal line at 0.000591. This bearish crossover suggests that buying momentum may be weakening in the short term.
From my experience, these signals are useful, but I never rely on MACD alone. I also watch volume, support levels, and how price reacts after the crossover. Sometimes sellers take control, while other times the signal reverses quickly.
What interests me most is the broader potential of blockchain and AI-related crypto projects. If CHIP can build real utility, attract users, and maintain demand, that could matter more over time than short-term price movements. However, I always check the project's actual use case, liquidity, token supply, and adoption before forming a long-term view.
My biggest lesson from trading altcoins is simple: a signal is a warning, not a guarantee. I prefer confirmation over emotional decisions.
What’s your view on CHIP/USDT? Will bearish momentum continue, or could buyers regain control?
#CHIP #CryptoTrading #MACD #BinanceSquare
238
·
--
$MTL
{spot}(MTLUSDT)
/USDT: I’m Watching This Bearish MACD Signal 👀
I’ve been watching MTL/USDT on the 30-minute chart, and the latest MACD setup is worth paying attention to.
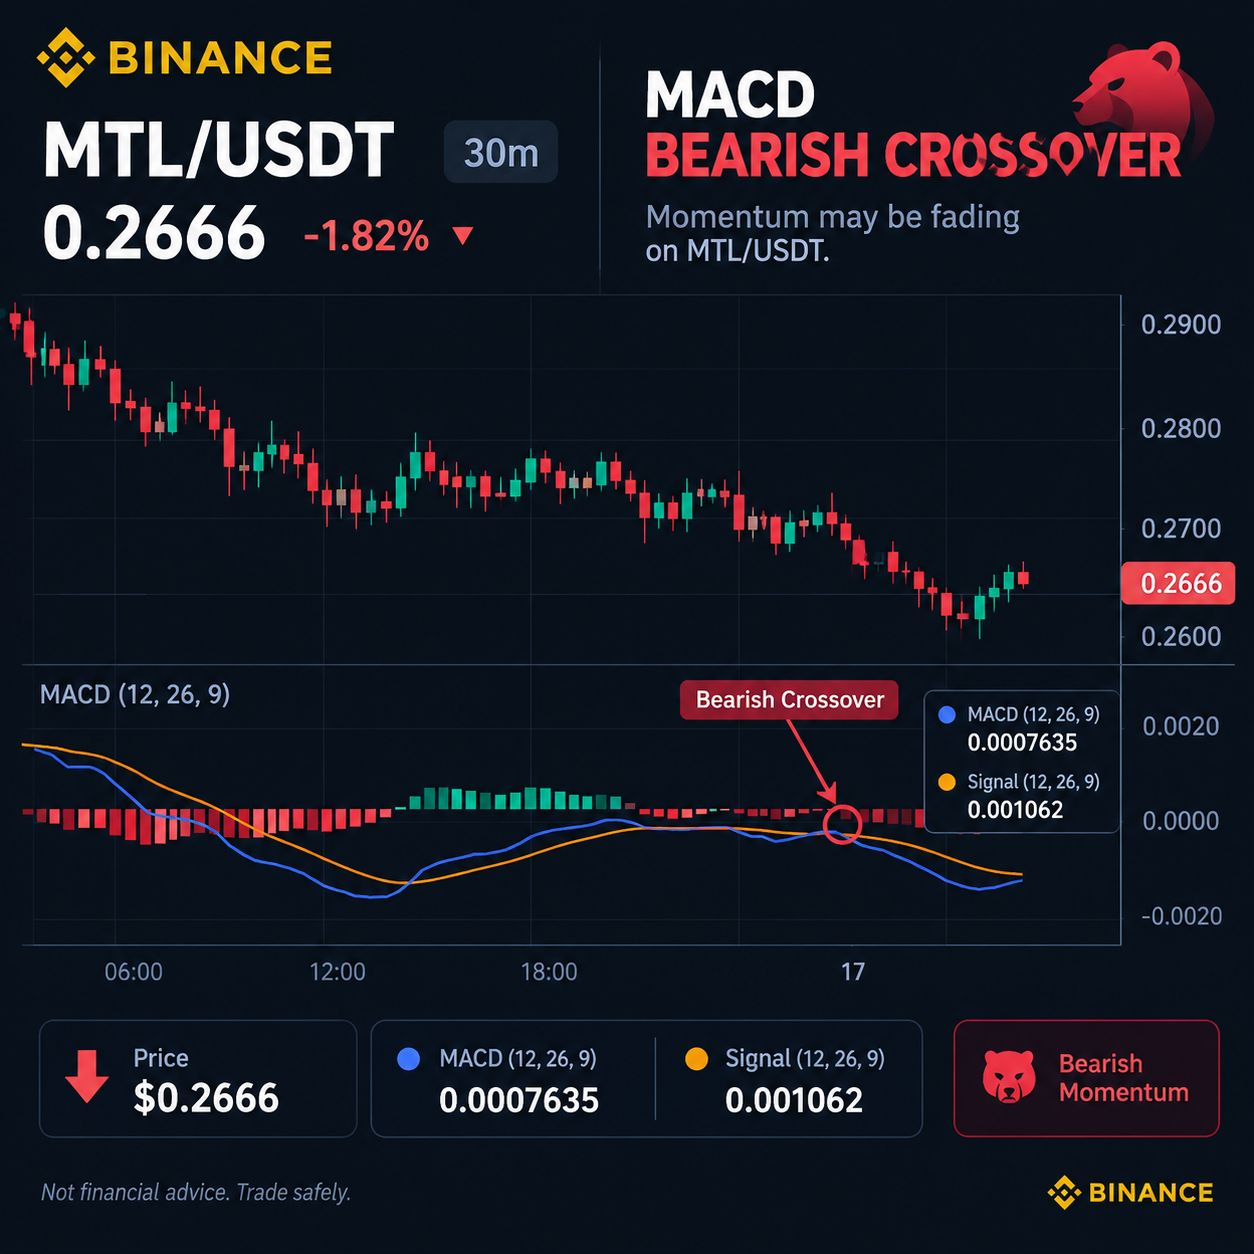
MTL is trading around $0.2666, and the MACD line is at 0.0007635, below the signal line at 0.001062. This bearish crossover suggests that short-term buying momentum may be fading.
From my experience, I never treat one indicator as a complete trading strategy. MACD helps me understand momentum, but price action tells me whether sellers are actually taking control.
One strength of MTL is its connection to the Metal ecosystem, which focuses on blockchain-based financial services. Like other crypto projects, its long-term potential depends on real adoption, utility, liquidity, and market demand.
But there are risks. Smaller altcoins can move sharply, and a bearish crossover can quickly reverse if buyers step back in. Bitcoin’s direction and overall market sentiment can also influence MTL.
My approach is simple: I watch support levels, trading volume, and the next candle closes before making a decision. I’ve learned that chasing every signal often costs more than waiting for confirmation.
What do you think? Will MTL face more selling pressure, or could buyers turn this signal around?
#MTL #CryptoTrading #MACD #BinanceSquare
$MTL
/USDT: I’m Watching This Bearish MACD Signal 👀
I’ve been watching MTL/USDT on the 30-minute chart, and the latest MACD setup is worth paying attention to.
MTL is trading around $0.2666, and the MACD line is at 0.0007635, below the signal line at 0.001062. This bearish crossover suggests that short-term buying momentum may be fading.
From my experience, I never treat one indicator as a complete trading strategy. MACD helps me understand momentum, but price action tells me whether sellers are actually taking control.
One strength of MTL is its connection to the Metal ecosystem, which focuses on blockchain-based financial services. Like other crypto projects, its long-term potential depends on real adoption, utility, liquidity, and market demand.
But there are risks. Smaller altcoins can move sharply, and a bearish crossover can quickly reverse if buyers step back in. Bitcoin’s direction and overall market sentiment can also influence MTL.
My approach is simple: I watch support levels, trading volume, and the next candle closes before making a decision. I’ve learned that chasing every signal often costs more than waiting for confirmation.
What do you think? Will MTL face more selling pressure, or could buyers turn this signal around?
#MTL #CryptoTrading #MACD #BinanceSquare
293
·
--
Падение
$SYRUP
{spot}(SYRUPUSDT)
/USDT: I’m Watching This Bearish MACD Signal Closely 📉
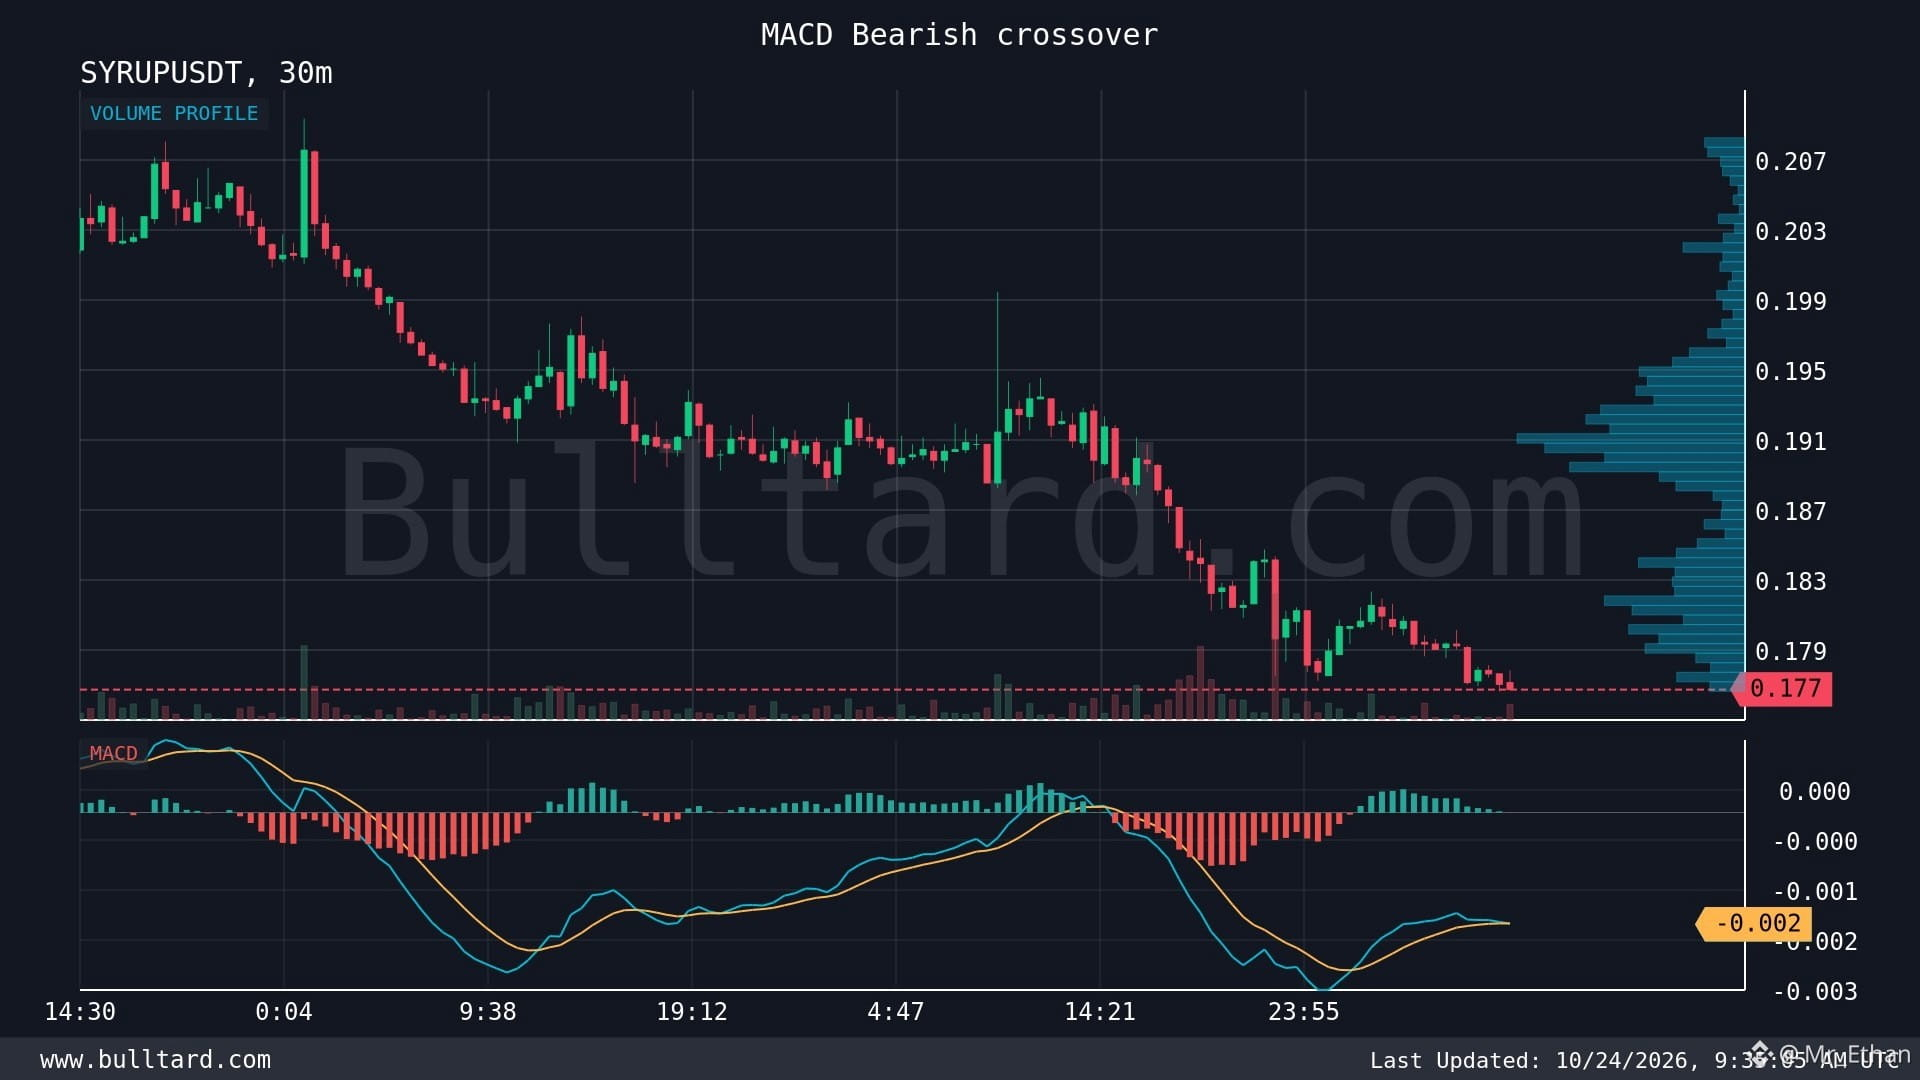
I’m keeping an eye on SYRUP around $0.1772 after spotting a bearish MACD crossover on the 30-minute chart.
My MACD line is at -0.001776, just below the signal line at -0.001774. The gap is tiny, so I’m not treating this as a confirmed downtrend yet. Still, it’s a signal worth watching.
SYRUP is linked to Maple Finance, a project focused on bringing institutional credit and lending into DeFi. I like the real-world use case because crypto needs more than speculation. It needs lending systems that connect capital with actual borrowing demand.
But there are risks too. Credit exposure, borrower defaults, liquidity issues, and changing market sentiment can all affect confidence in DeFi lending projects. Compared with purely speculative tokens, SYRUP has a connection to financial activity, but that doesn’t guarantee price growth.
For now, I’m watching trading volume, nearby support, and whether the MACD gap widens. If selling pressure increases, downside momentum could build. If buyers step in, this crossover may quickly lose significance.
My lesson from trading is simple: I never let one indicator make my decision.
Are you watching SYRUP for a potential dip or waiting for bullish confirmation?
#SYRUP #DeFi #CryptoTrading #MACD #BinanceSquare
$SYRUP
/USDT: I’m Watching This Bearish MACD Signal Closely 📉
I’m keeping an eye on SYRUP around $0.1772 after spotting a bearish MACD crossover on the 30-minute chart.
My MACD line is at -0.001776, just below the signal line at -0.001774. The gap is tiny, so I’m not treating this as a confirmed downtrend yet. Still, it’s a signal worth watching.
SYRUP is linked to Maple Finance, a project focused on bringing institutional credit and lending into DeFi. I like the real-world use case because crypto needs more than speculation. It needs lending systems that connect capital with actual borrowing demand.
But there are risks too. Credit exposure, borrower defaults, liquidity issues, and changing market sentiment can all affect confidence in DeFi lending projects. Compared with purely speculative tokens, SYRUP has a connection to financial activity, but that doesn’t guarantee price growth.
For now, I’m watching trading volume, nearby support, and whether the MACD gap widens. If selling pressure increases, downside momentum could build. If buyers step in, this crossover may quickly lose significance.
My lesson from trading is simple: I never let one indicator make my decision.
Are you watching SYRUP for a potential dip or waiting for bullish confirmation?
#SYRUP #DeFi #CryptoTrading #MACD #BinanceSquare
1
330
·
--
$BTC
{spot}(BTCUSDT)
/USDT: Bitcoin Is Showing Bearish Pressure on the 30M Chart 📉
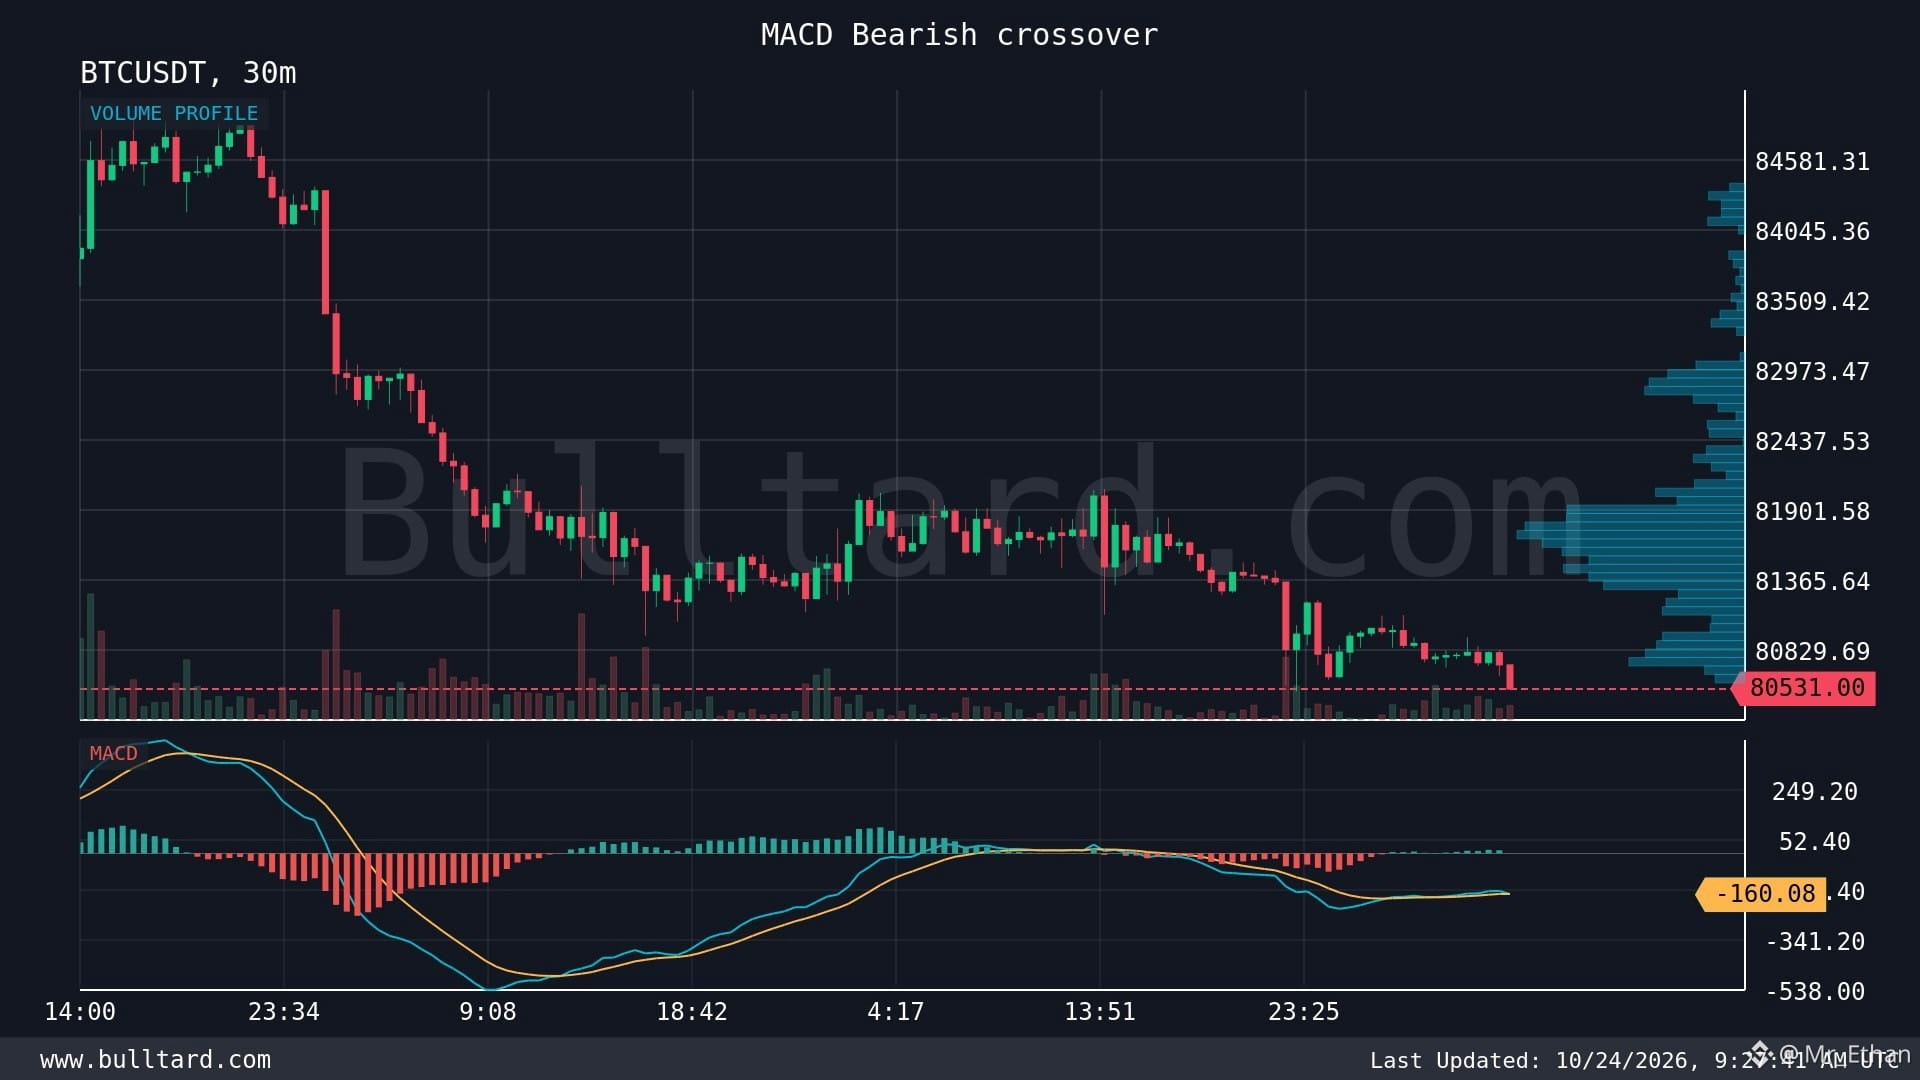
I’m watching Bitcoin closely around $80,531 because the latest 30-minute MACD crossover is giving a small warning signal.
My MACD line is at -160.42, while the signal line is at -160.08. The MACD line has moved below the signal line, suggesting short-term bearish momentum.
From my trading experience, I’ve learned that one crossover alone is never enough to confirm a bigger move. Bitcoin can easily reverse if buyers step back in with strong volume.
The good thing about MACD is that it helps me spot momentum changes early. But its weakness is that it can produce false signals when the market moves sideways. Compared with RSI, which helps track overbought and oversold conditions, MACD gives me a clearer view of momentum direction.
For now, I’m watching price action around nearby support levels and looking for volume confirmation before making any decision. If selling pressure builds, BTC could face more downside. If buyers defend support, this signal may fade quickly.
My biggest lesson in crypto is simple: protecting capital matters more than chasing every move.
I’m staying cautious, not blindly bearish.
What do you think? Will BTC continue lower, or are buyers preparing a reversal? 👇
#Bitcoin #BTCUSDT #CryptoTrading #MACD #BinanceSquare
$BTC
/USDT: Bitcoin Is Showing Bearish Pressure on the 30M Chart 📉
I’m watching Bitcoin closely around $80,531 because the latest 30-minute MACD crossover is giving a small warning signal.
My MACD line is at -160.42, while the signal line is at -160.08. The MACD line has moved below the signal line, suggesting short-term bearish momentum.
From my trading experience, I’ve learned that one crossover alone is never enough to confirm a bigger move. Bitcoin can easily reverse if buyers step back in with strong volume.
The good thing about MACD is that it helps me spot momentum changes early. But its weakness is that it can produce false signals when the market moves sideways. Compared with RSI, which helps track overbought and oversold conditions, MACD gives me a clearer view of momentum direction.
For now, I’m watching price action around nearby support levels and looking for volume confirmation before making any decision. If selling pressure builds, BTC could face more downside. If buyers defend support, this signal may fade quickly.
My biggest lesson in crypto is simple: protecting capital matters more than chasing every move.
I’m staying cautious, not blindly bearish.
What do you think? Will BTC continue lower, or are buyers preparing a reversal? 👇
#Bitcoin #BTCUSDT #CryptoTrading #MACD #BinanceSquare
97
·
--
$BNCB
{spot}(BNCBUSDT)
/USDT: I’m Watching This 30m MACD Signal 👀
I’ve been keeping an eye on BNCB/USDT, and the 30-minute MACD is showing a small bearish crossover.
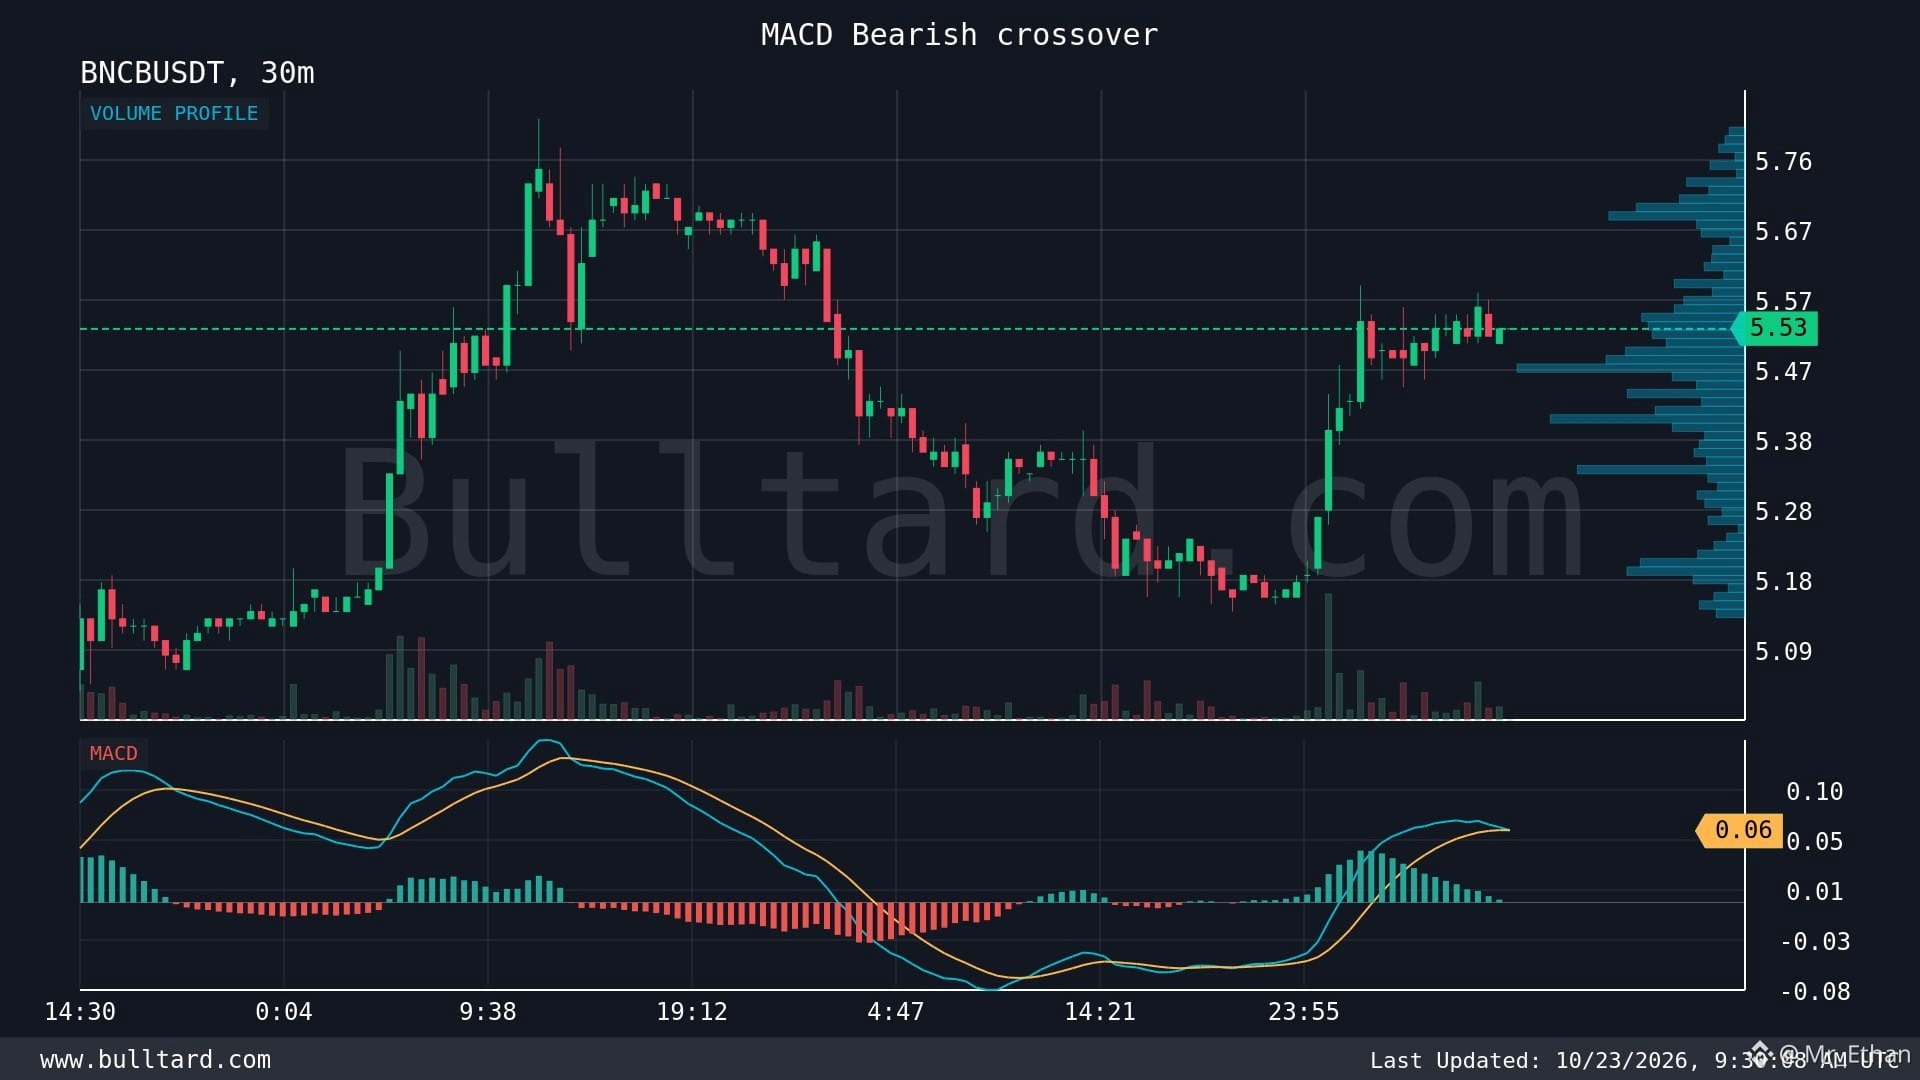
Price is around 5.53 USDT. The MACD line is at 0.06291, just below the signal line at 0.06297. The gap is tiny, but it’s worth watching.
From my experience, a bearish crossover can signal that buying momentum is slowing down. Still, I don’t treat one indicator as a reason to enter a trade immediately.
What matters now is price action. If BNCB starts making lower highs and selling volume increases, the bearish signal could gain strength. But if buyers defend the current level and price pushes back up, this crossover may turn into a false signal.
I also like to check the RSI, volume, and nearby support levels before making a decision. Compared with relying on MACD alone, combining indicators with price structure gives me a clearer picture.
My biggest lesson in crypto trading is simple: a signal is a warning, not a guarantee. Small crossovers can reverse quickly, especially in volatile altcoins with thinner liquidity.
For now, I’m watching how price reacts around 5.53 rather than rushing into a position.
What do you think? Will BNCB continue lower, or can buyers regain momentum? 📉📈
#BNCB #CryptoTrading #MACD #BinanceSquare
$BNCB
/USDT: I’m Watching This 30m MACD Signal 👀
I’ve been keeping an eye on BNCB/USDT, and the 30-minute MACD is showing a small bearish crossover.
Price is around 5.53 USDT. The MACD line is at 0.06291, just below the signal line at 0.06297. The gap is tiny, but it’s worth watching.
From my experience, a bearish crossover can signal that buying momentum is slowing down. Still, I don’t treat one indicator as a reason to enter a trade immediately.
What matters now is price action. If BNCB starts making lower highs and selling volume increases, the bearish signal could gain strength. But if buyers defend the current level and price pushes back up, this crossover may turn into a false signal.
I also like to check the RSI, volume, and nearby support levels before making a decision. Compared with relying on MACD alone, combining indicators with price structure gives me a clearer picture.
My biggest lesson in crypto trading is simple: a signal is a warning, not a guarantee. Small crossovers can reverse quickly, especially in volatile altcoins with thinner liquidity.
For now, I’m watching how price reacts around 5.53 rather than rushing into a position.
What do you think? Will BNCB continue lower, or can buyers regain momentum? 📉📈
#BNCB #CryptoTrading #MACD #BinanceSquare
93
·
--
Падение
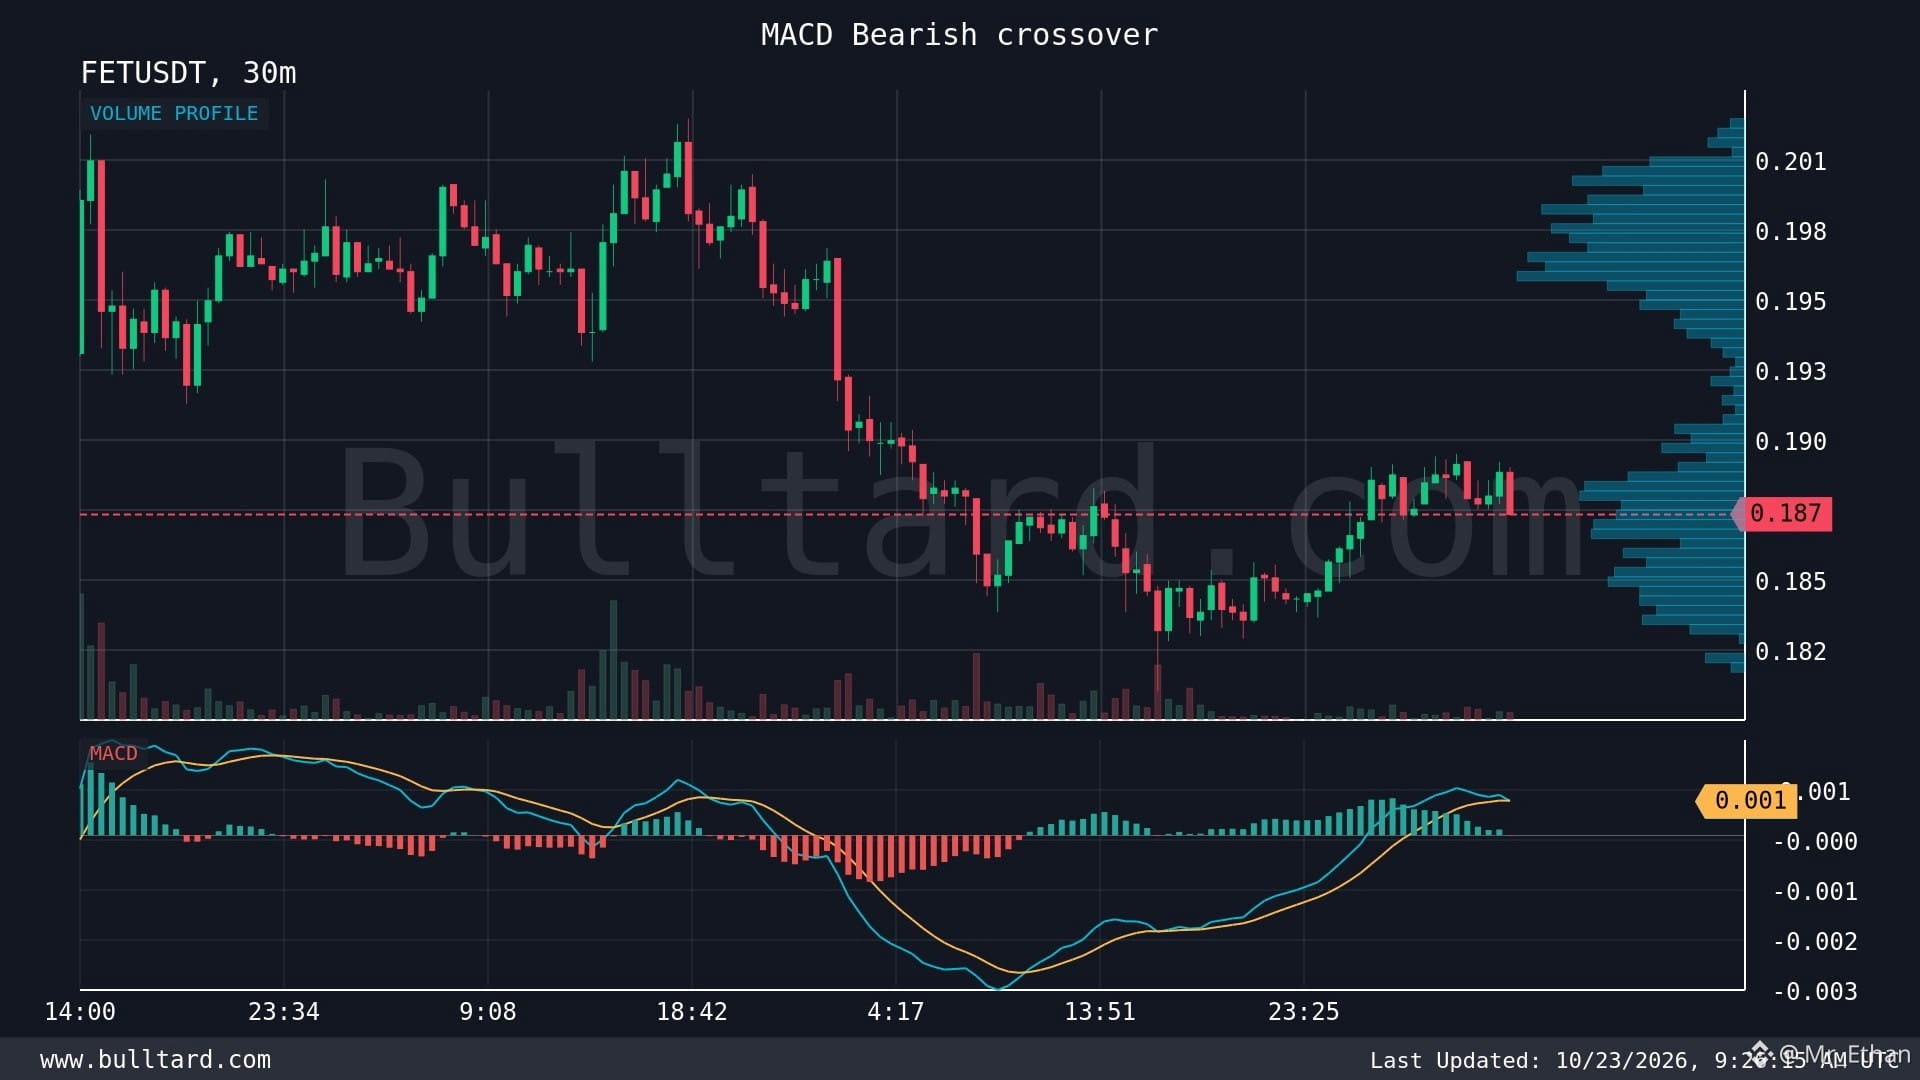
📉 $FET
{spot}(FETUSDT)
/USDT: MACD Shows Early Bearish Pressure
I’m watching FET/USDT closely as the 30-minute chart shows a bearish MACD crossover. The price is around $0.1873, and this is a signal I don’t want to ignore.
My attention is on the MACD line at 0.0006109 and the signal line at 0.0006168. The MACD has slipped slightly below the signal line, suggesting that short-term bullish momentum may be weakening.
I’ve learned that these small crossovers can be useful warnings, but they don’t always lead to a major drop. In crypto, one strong buying candle can quickly change the picture.
FET is part of the AI and blockchain space, which gives the project an interesting long-term narrative. Still, strong fundamentals don’t protect a token from short-term selling pressure. Compared with other AI-related tokens, FET also faces competition and changing market sentiment.
For now, I’m watching trading volume, nearby support, and whether the MACD gap starts widening. If selling pressure increases, the price could face more downside. If buyers step in, this signal may turn into a false alarm.
My lesson is simple: follow confirmation, not just indicators.
Are you seeing a potential pullback in FET, or could buyers regain control? 👀
#FET #FetchAI #CryptoTrading #MACD
📉 $FET
/USDT: MACD Shows Early Bearish Pressure
I’m watching FET/USDT closely as the 30-minute chart shows a bearish MACD crossover. The price is around $0.1873, and this is a signal I don’t want to ignore.
My attention is on the MACD line at 0.0006109 and the signal line at 0.0006168. The MACD has slipped slightly below the signal line, suggesting that short-term bullish momentum may be weakening.
I’ve learned that these small crossovers can be useful warnings, but they don’t always lead to a major drop. In crypto, one strong buying candle can quickly change the picture.
FET is part of the AI and blockchain space, which gives the project an interesting long-term narrative. Still, strong fundamentals don’t protect a token from short-term selling pressure. Compared with other AI-related tokens, FET also faces competition and changing market sentiment.
For now, I’m watching trading volume, nearby support, and whether the MACD gap starts widening. If selling pressure increases, the price could face more downside. If buyers step in, this signal may turn into a false alarm.
My lesson is simple: follow confirmation, not just indicators.
Are you seeing a potential pullback in FET, or could buyers regain control? 👀
#FET #FetchAI #CryptoTrading #MACD
1
451
Войдите, чтобы посмотреть больше материала
Присоединяйтесь к пользователям криптовалют по всему миру на Binance Square
⚡️ Получайте новейшую и полезную информацию о криптоактивах.
💬 Нам доверяет крупнейшая в мире криптобиржа.
👍 Получите достоверные аналитические данные от верифицированных создателей контента.
Эл. почта/номер телефона
В тренде
EarningsSeason
Просмотров: 6.5M
32,636 обсуждают
Earnings Season Session 3: Will Google & Microsoft Beat Earnings Expectations?
Binance Square Official
·Лайков: 184
·Просмотров: 108.9k
USMidtermElections
Просмотров: 70,030
889 обсуждают
StrategySTRCReaches$99.95ForFirstTimeIn165Days
Просмотров: 130
6 обсуждают