

#soxlb
soxlb
Просмотров: 46,284
1,703 обсуждают
Популярные
Новые

·
--
🔻 The AI & Tech tokens are getting slaughtered today — SOXLB -12%, FET -10%, AI -13.5%. Bloodbath or buying opportunity? Let's break it down 🧵
Why these three together? They're all tech-adjacent tokens riding the same bearish wave. When sector-wide selling hits, correlations spike — and that's where the edge lies.
📊 SOXLB ($85.75) — Down 12.3% with RSI at 37.6 on the 4H. Price is well below all major SMAs (7/25/99 daily), confirming strong downtrend. Volume surging at 1.28x average. Shorts are piling in but RSI hasn't hit oversold yet — more pain possible.
🤖 FET ($0.159) — Down 9.9%, RSI 30.6 and approaching oversold on 4H. Bearish MACD cross with expanding histogram. Volume 2.57x normal — this is conviction selling, not just drift. Key support at $0.151 is the next line of defense.
🧠 AI ($0.0173) — The hardest hit at -13.5%, RSI already oversold at 24.9 on 4H. But here's the catch: volume is only 0.06x average. This is a low-liquidity flush, which means bounces can be violent… but catching that knife is risky.
📋 Trade Plans (all shorts):
• SOXLB → Entry: $82.93-$88.57 | SL: $97.05 | TP: $80.44
• FET → Entry: $0.156-$0.162 | SL: $0.172 | TP: $0.151
• AI → Entry: $0.017-$0.0176 | SL: $0.0185 | TP: $0.0165
⚡ Which one do you think bounces first? Or are they all going lower? Drop your pick 👇
#SOXLB #FET #AI
364


$SOXLB: The Sprint Toward a Static Checklist
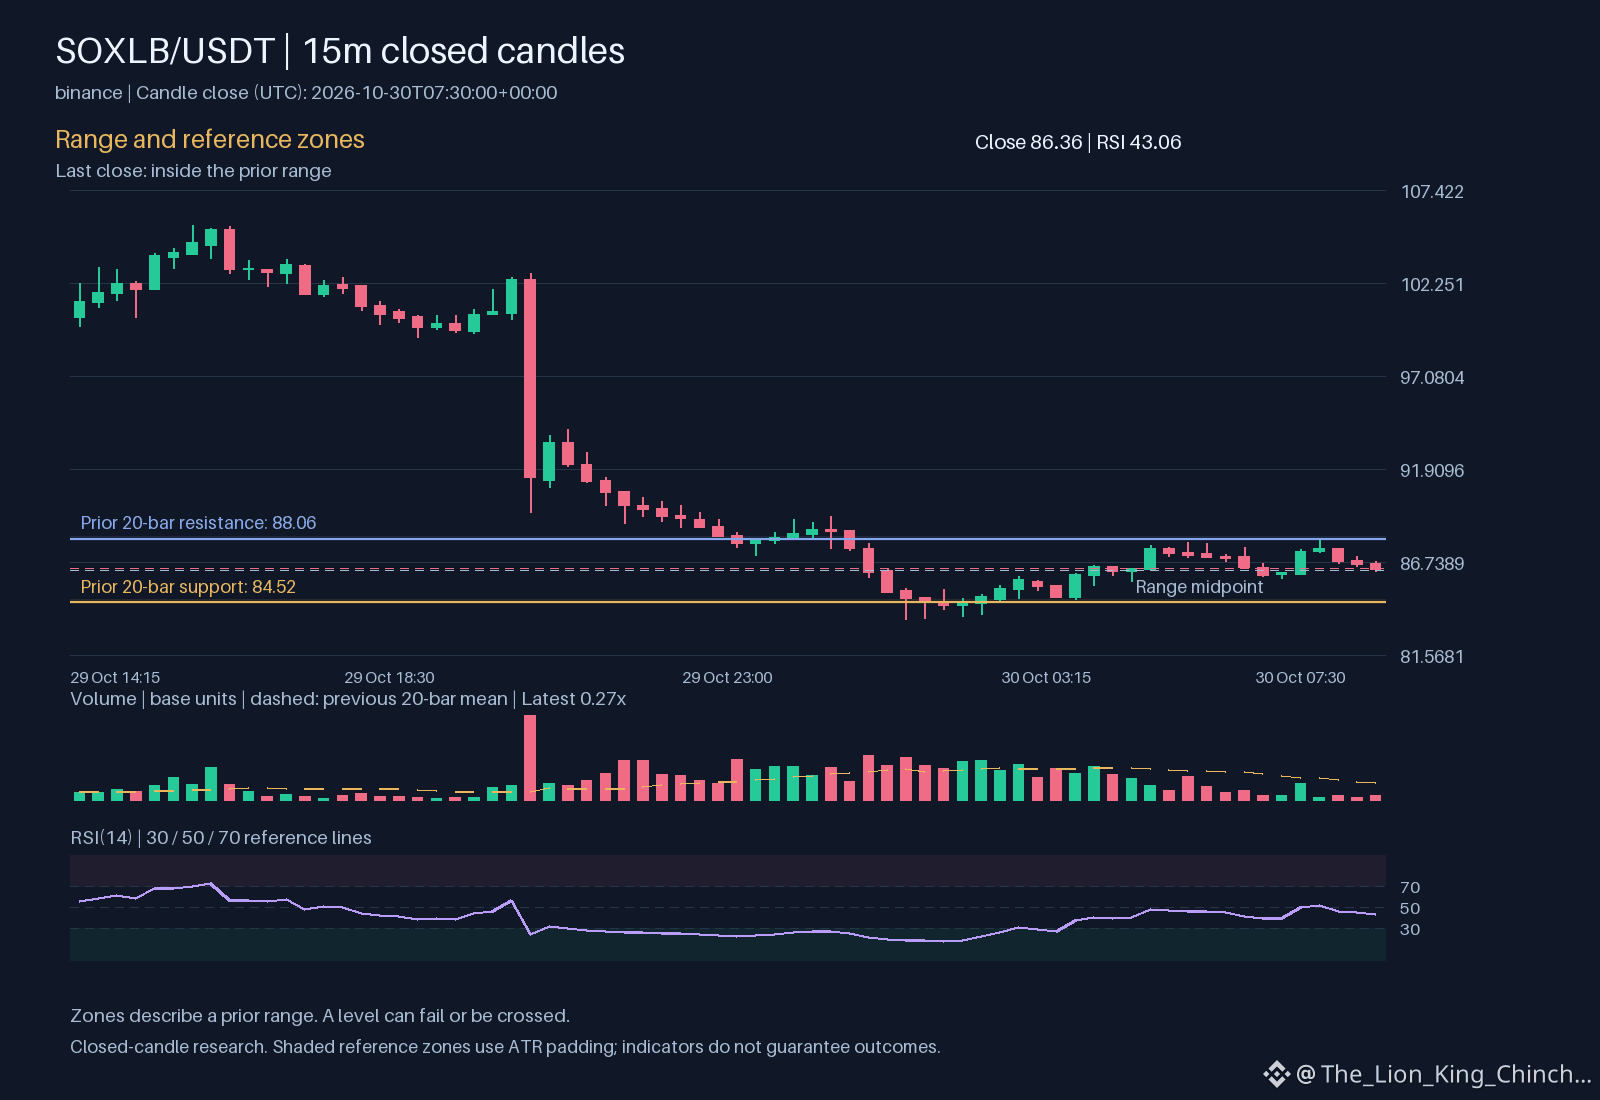
I sometimes imagine my research habit is like a professional athlete preparing for a race, only to realize I am actually just a person in pajamas staring at a screen. There is a specific humor in watching a calm watchlist while my mind races at high speeds. I tell myself I will wait for a perfect signal, but as soon as a candle moves, my internal logic starts sprinting to justify a shortcut. For $SOXLB, the daily change is -12.3605 and the hourly direction is down. Even when the data feels quiet, the urge to find a hidden pattern is loud.
The trap is understandable because our brains hate missing out on perceived momentum. When we see the price at 86.36 and an RSI of 43.06, we often try to bend our rules to fit the current motion. If the RSI is not yet at an extreme, we might invent a reason why the current level is special. This mental flexibility is actually a risk. It turns a disciplined strategy into a series of impulsive guesses based on short-term feelings.
A useful habit is to perform a reverse check. Instead of asking why a move might continue, ask what specific evidence would prove my current idea is wrong. For example, if the hourly trend stays down but volume is not above the baseline, the move might lack the strength I imagined. By checking the ATR at 0.915547 against the recent range, I can see if the volatility actually matches my excitement. True learning happens when we let the checklist slow us down instead of racing to ignore it. A calm mind sees the chart more clearly than a rushing one.
Probabilistic market research, not a recommendation or guaranteed return.
Have you caught yourself changing a rule after seeing a fast move?
#SOXLB
$SOXLB : The Sprint Toward a Static Checklist
I sometimes imagine my research habit is like a professional athlete preparing for a race, only to realize I am actually just a person in pajamas staring at a screen. There is a specific humor in watching a calm watchlist while my mind races at high speeds. I tell myself I will wait for a perfect signal, but as soon as a candle moves, my internal logic starts sprinting to justify a shortcut. For $SOXLB , the daily change is -12.3605 and the hourly direction is down. Even when the data feels quiet, the urge to find a hidden pattern is loud.
The trap is understandable because our brains hate missing out on perceived momentum. When we see the price at 86.36 and an RSI of 43.06, we often try to bend our rules to fit the current motion. If the RSI is not yet at an extreme, we might invent a reason why the current level is special. This mental flexibility is actually a risk. It turns a disciplined strategy into a series of impulsive guesses based on short-term feelings.
A useful habit is to perform a reverse check. Instead of asking why a move might continue, ask what specific evidence would prove my current idea is wrong. For example, if the hourly trend stays down but volume is not above the baseline, the move might lack the strength I imagined. By checking the ATR at 0.915547 against the recent range, I can see if the volatility actually matches my excitement. True learning happens when we let the checklist slow us down instead of racing to ignore it. A calm mind sees the chart more clearly than a rushing one.
Probabilistic market research, not a recommendation or guaranteed return.
Have you caught yourself changing a rule after seeing a fast move?
#SOXLB
53

·
--
Down 12.36% to $86.62 on $34.41M volume, what signals actual stabilization here?
Hourly candles show a modest 0.86% bounce to 86.85, but volume sits at 0.39x the 23-hour average. Weak volume on an hourly bounce suggests limited conviction.
Scenario watch: A sustained push back above the 105.45 high signals potential buyers stepping in. Conversely, sliding under the 83.54 low invalidates the stabilization attempt.
Will you wait for volume confirmation above 105.45, or does breaking 83.54 force an immediate exit?
Tap $SOXLB for the live chart. #SOXLB #BinanceSquare
1

·
--
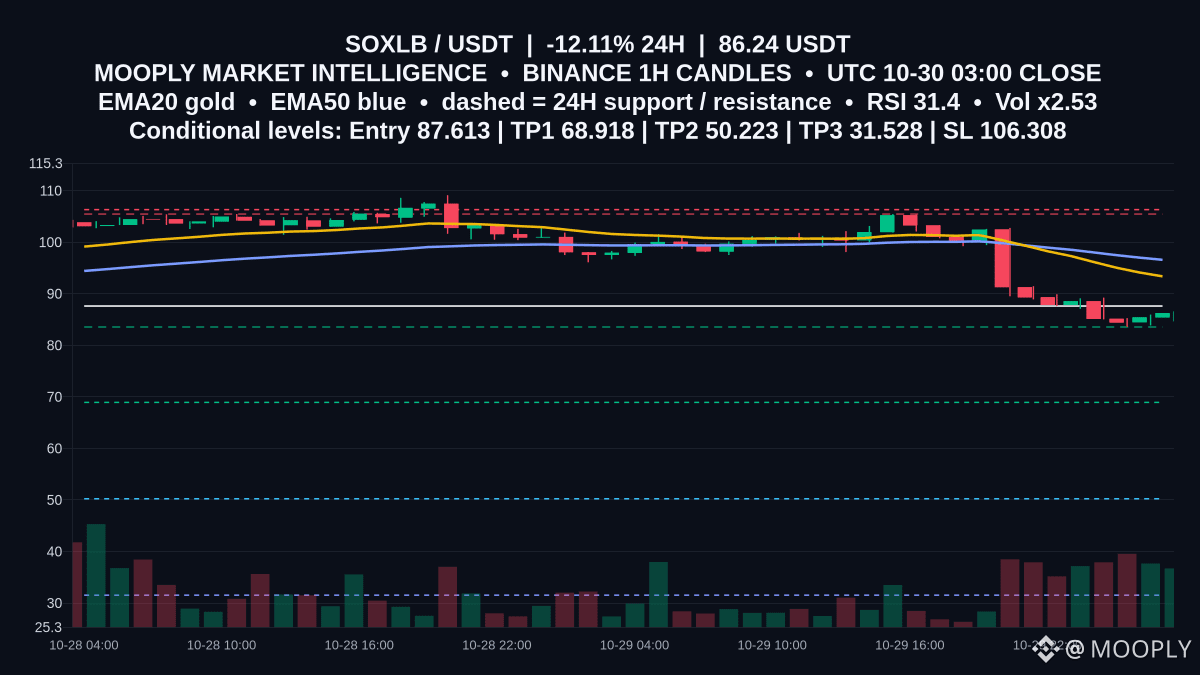
Heavy sellers clamp down on $SOXLB: -12.114% in 24h to 86.24, on 36,716,268.6982 volume and 146,125 trades.
Price sits beneath falling EMA20/EMA50 (93.365/96.58) with RSI at 31.38 and volume up 2.53x, making 83.54 a pivotal support to watch; 105.45 is the ceiling that defines the bear risk boundary.
📍 Potential entry: 87.613
🎯 Target 1: 68.918
🎯 Target 2: 50.223
🛑 Stop / invalidation: 106.308
A retest toward 87.613 that stalls below the EMAs would keep downside pressure, with a break of 83.54 opening room toward 68.918. A firm hourly close above 105.45—or tagging 106.308—would invalidate and signal momentum repair. Will buyers defend 83.54 on the next test, or does price slide toward 68.918 next?
Not financial advice.
#SOXLB #PriceActionNotes #DownsideLevels
Heavy sellers clamp down on $SOXLB : -12.114% in 24h to 86.24, on 36,716,268.6982 volume and 146,125 trades.
Price sits beneath falling EMA20/EMA50 (93.365/96.58) with RSI at 31.38 and volume up 2.53x, making 83.54 a pivotal support to watch; 105.45 is the ceiling that defines the bear risk boundary.
📍 Potential entry: 87.613
🎯 Target 1: 68.918
🎯 Target 2: 50.223
🛑 Stop / invalidation: 106.308
A retest toward 87.613 that stalls below the EMAs would keep downside pressure, with a break of 83.54 opening room toward 68.918. A firm hourly close above 105.45—or tagging 106.308—would invalidate and signal momentum repair. Will buyers defend 83.54 on the next test, or does price slide toward 68.918 next?
Not financial advice.
#SOXLB #PriceActionNotes #DownsideLevels
53

·
--
$SOXLB — Short Setup | Market Analysis
SOXLBUSDT is exhibiting pronounced bearish momentum, having declined by nearly 12% in the last 24 hours. This significant price depreciation, coupled with substantial volume, indicates strong selling pressure is likely to persist. Traders may anticipate a continuation of the downtrend as market sentiment favors further price erosion.
Market Context
24h Change: -11.92%
24h Volume: 35.6M USDT
Trade Plan
Entry: 85.53
Stop Loss: 86.81
TP1: 83.82
TP2: 82.11
TP3: 80.4
⚖️ Risk:Reward (TP1) 1:1.34
Confirmation Trigger: Immediate execution around current market price.
Risk Note: Cryptocurrency markets are exceptionally volatile. Ensure strict adherence to your stop-loss order and manage your position size responsibly to mitigate potential losses.
Trade the plan, not the emotion.
#SOXLB #soxlb
6
$SOXLB: A Research Question: What Does a Helpful Crypto Post Owe Its Reader?: From a Patient Perspective
A fair dilemma arises when analysts share public views on $SOXLB. The tension lies between providing useful insight and exploiting uncertainty for attention. Many readers look for clear direction, yet markets rarely offer simple answers. When hourly direction is up and volume is above baseline, it is easy to imply certainty. However, such observations describe only a snapshot, not a prediction.
Reasonable readers may disagree because they value different evidence. Some prioritize short-term momentum, while others focus on broader structure. A post that highlights only supportive data risks becoming persuasive rather than helpful. It frames a single scenario as the likely outcome, ignoring alternative paths. This selective emphasis can mislead even well-intentioned audiences.
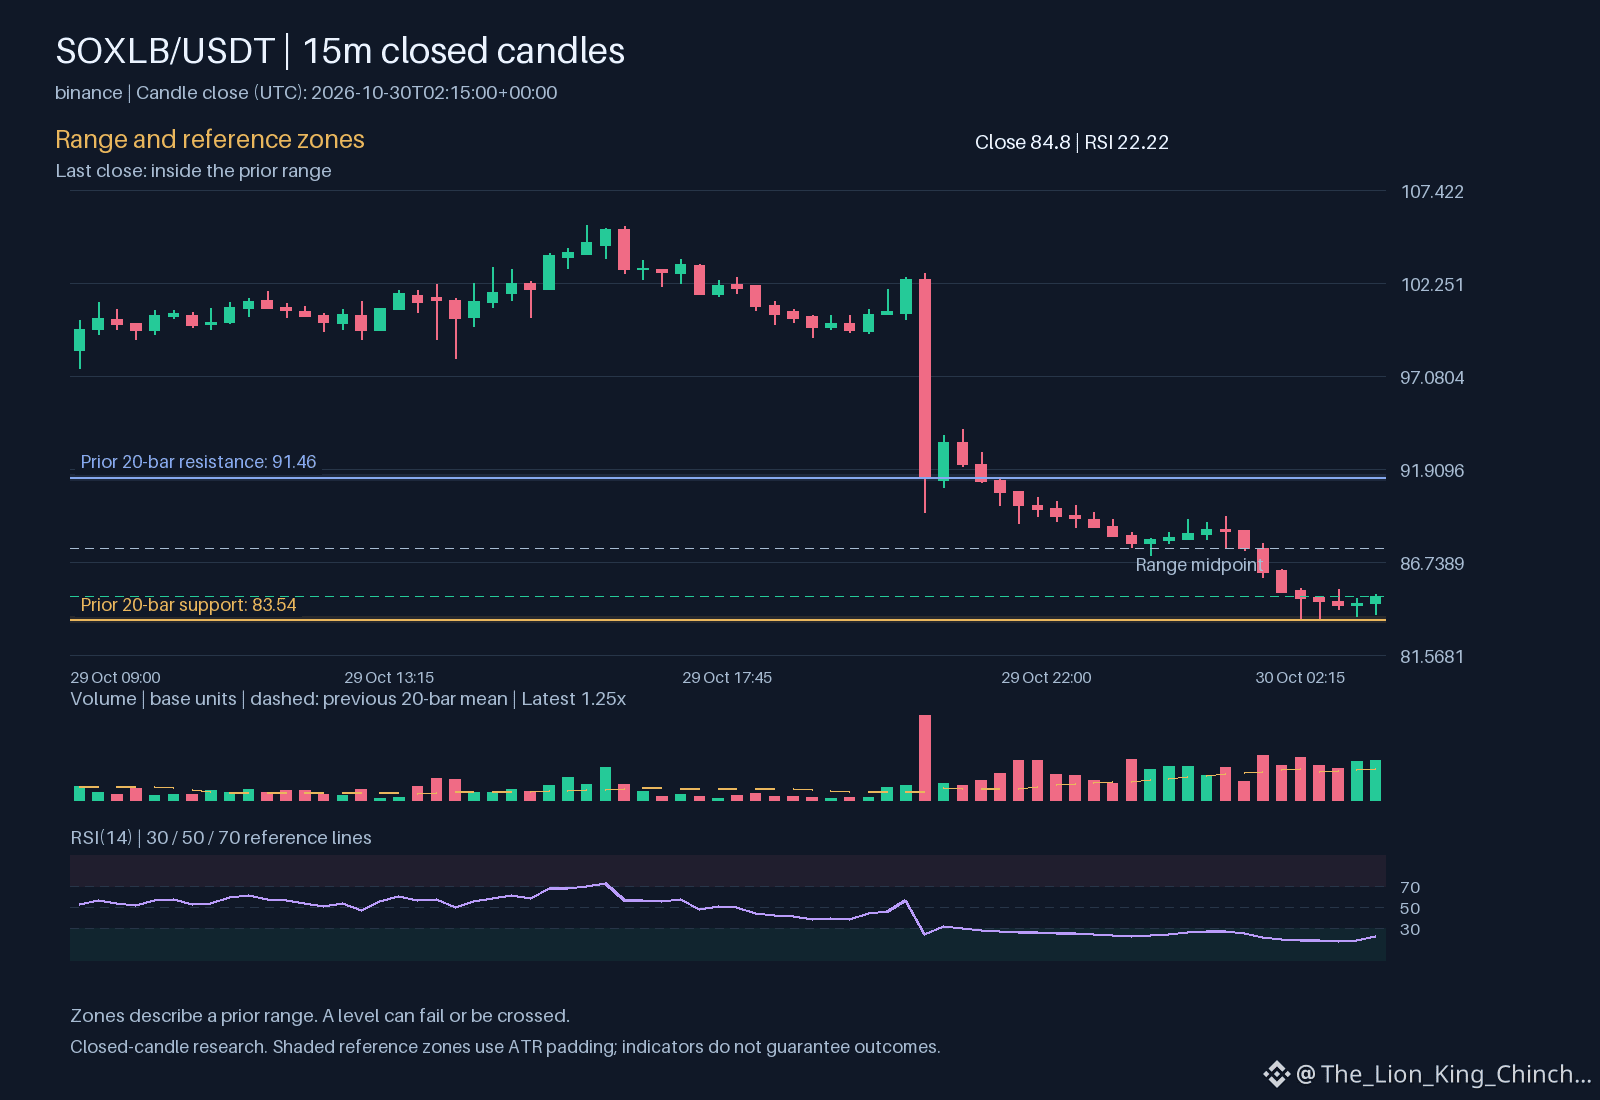
A transparent way to discuss uncertainty is to separate current facts from conditional scenarios. Begin with what is directly observed: price 84.8, RSI 22.2163, and relative volume 1.25178. Then outline what could happen if key levels break or hold. Avoid implying that any single indicator confirms a trend. Instead, show how multiple pieces of evidence interact.
This approach teaches readers to distinguish evidence from persuasion. It acknowledges that public analysis operates under incentives, such as visibility or engagement. Write to Earn platforms exemplify this dilemma; they reward output, not necessarily accuracy. Recognizing this helps consumers evaluate content on its merits rather than its popularity. Thoughtful disagreement should be welcomed as a sign of healthy skepticism, not as conflict.
Probabilistic market research, not a recommendation or guaranteed return.
What makes a crypto post helpful rather than merely persuasive?
#SOXLB #CryptoCommunity #CryptoLearning
Binance spot proof for $SOXLB: closed price 84.8 USDT.
Source: binance. Closed candle: 2026-10-30T02:15:00+00:00.
$SOXLB : A Research Question: What Does a Helpful Crypto Post Owe Its Reader?: From a Patient Perspective
A fair dilemma arises when analysts share public views on $SOXLB . The tension lies between providing useful insight and exploiting uncertainty for attention. Many readers look for clear direction, yet markets rarely offer simple answers. When hourly direction is up and volume is above baseline, it is easy to imply certainty. However, such observations describe only a snapshot, not a prediction.
Reasonable readers may disagree because they value different evidence. Some prioritize short-term momentum, while others focus on broader structure. A post that highlights only supportive data risks becoming persuasive rather than helpful. It frames a single scenario as the likely outcome, ignoring alternative paths. This selective emphasis can mislead even well-intentioned audiences.
A transparent way to discuss uncertainty is to separate current facts from conditional scenarios. Begin with what is directly observed: price 84.8, RSI 22.2163, and relative volume 1.25178. Then outline what could happen if key levels break or hold. Avoid implying that any single indicator confirms a trend. Instead, show how multiple pieces of evidence interact.
This approach teaches readers to distinguish evidence from persuasion. It acknowledges that public analysis operates under incentives, such as visibility or engagement. Write to Earn platforms exemplify this dilemma; they reward output, not necessarily accuracy. Recognizing this helps consumers evaluate content on its merits rather than its popularity. Thoughtful disagreement should be welcomed as a sign of healthy skepticism, not as conflict.
Probabilistic market research, not a recommendation or guaranteed return.
What makes a crypto post helpful rather than merely persuasive?
#SOXLB #CryptoCommunity #CryptoLearning
Binance spot proof for $SOXLB : closed price 84.8 USDT.
Source: binance. Closed candle: 2026-10-30T02:15:00+00:00.
153

·
--
$SOXLB
🔻 $SOXLB SHORT SETUP 🔴 Sellers are stepping in — here's the setup. ⚡
$SOXLB is experiencing significant downward pressure, reflecting a sharp 24-hour decline as it drifts near its daily lows. Increased selling volume confirms that bearish sentiment is dominating the current market structure.
📊 24h: -11.14% | Vol: $26,337,411.30
📉 TRADE PLAN
🔹 Entry: 91.00
🛑 Stop Loss: 94.80
🎯 TP1: 85.30
🎯 TP2: 81.50
🎯 TP3: 77.70
⚖️ Risk:Reward (TP1): 1:1.50
🔔 Trigger: A clean breakdown and sustained close below the 90.00 support level would provide the necessary confirmation for this short bias.
⚠️ Risk Note: High volatility is present; ensure your position size is managed according to your risk tolerance.
Always wait for the price to confirm the trend before entering any position.
Click below 👇🏻 to trade
$SOXLB
Follow @T4_TZX for more updates...
#SOXLB #CryptoTrading #MarketAnalysis #BinanceSquare
$SOXLB
🔻 $SOXLB SHORT SETUP 🔴 Sellers are stepping in — here's the setup. ⚡
$SOXLB is experiencing significant downward pressure, reflecting a sharp 24-hour decline as it drifts near its daily lows. Increased selling volume confirms that bearish sentiment is dominating the current market structure.
📊 24h: -11.14% | Vol: $26,337,411.30
📉 TRADE PLAN
🔹 Entry: 91.00
🛑 Stop Loss: 94.80
🎯 TP1: 85.30
🎯 TP2: 81.50
🎯 TP3: 77.70
⚖️ Risk:Reward (TP1): 1:1.50
🔔 Trigger: A clean breakdown and sustained close below the 90.00 support level would provide the necessary confirmation for this short bias.
⚠️ Risk Note: High volatility is present; ensure your position size is managed according to your risk tolerance.
Always wait for the price to confirm the trend before entering any position.
Click below 👇🏻 to trade
$SOXLB
Follow @T4_TZX for more updates...
#SOXLB #CryptoTrading #MarketAnalysis #BinanceSquare
·
--
$SOXLB dropped 3.96% to $100.65 on $26.58M volume.
Hourly volume dried up to 0.33x the daily average as price closed down 2.18% to 101.
If buyers reclaim the session high near 109.11 on rising volume, continuation toward prior momentum becomes viable. Conversely, a breakdown below the 23-hour range low of 96.08 invalidates stabilization and signals deeper risk.
Will a push above 109.11 confirm strength, or does a slip under 96.08 invalidate the bounce?
Tap $SOXLB for the live chart. #SOXLB #BinanceSquare
2

·
--
$SOXLB
Update: Fundamentals & Roadmap
Fundamentals: $SOXLB (Semicon Bull 3X ETF Tokenized Stock) bridges traditional finance and DeFi, giving traders 3x daily leveraged exposure to the global semiconductor industry. Driven by sustained AI hardware demand and chip sector earnings, fundamental momentum remains tied to global tech markets. However, high 3x daily leverage demands strict risk control due to rapid price volatility.
Roadmap: Key milestones focus on expanding multi-chain liquidity, boosting integration across top decentralized exchanges, and increasing cross-margin utility. Continued updates aim to refine real-time tracking accuracy against underlying chip assets while expanding automated trading vault support.
#SOXLB #Binance #cryptouniverseofficial #Square
{spot}(SOXLBUSDT)
$SOXLB
Update: Fundamentals & Roadmap
Fundamentals: $SOXLB (Semicon Bull 3X ETF Tokenized Stock) bridges traditional finance and DeFi, giving traders 3x daily leveraged exposure to the global semiconductor industry. Driven by sustained AI hardware demand and chip sector earnings, fundamental momentum remains tied to global tech markets. However, high 3x daily leverage demands strict risk control due to rapid price volatility.
Roadmap: Key milestones focus on expanding multi-chain liquidity, boosting integration across top decentralized exchanges, and increasing cross-margin utility. Continued updates aim to refine real-time tracking accuracy against underlying chip assets while expanding automated trading vault support.
#SOXLB #Binance #cryptouniverseofficial #Square
82

·
--
$SOXLB
🔻 $SOXLB SHORT SETUP 🔴 Sellers are stepping in — here's the setup. ⚡
$SOXLB is under significant bearish pressure, posting a -4.00% decline as sellers push the price toward the lower end of the daily range. Heavy trading volume suggests that the current downward momentum is well-supported by market participants.
📊 24h: -4.00% | Vol: $31,632,597.26
📉 TRADE PLAN
🔹 Entry: 100.89
🛑 Stop Loss: 103.50
🎯 TP1: 96.90
🎯 TP2: 94.50
🎯 TP3: 92.00
⚖️ Risk:Reward (TP1): 1:1.53
🔔 Trigger: A confirmed breakdown and hold below the $100.00 psychological level.
⚠️ Risk Note: High volatility near recent lows can cause sudden price spikes; manage your exposure carefully.
Keep a close eye on the volume and wait for price action to confirm the bearish trend before committing.
Click below 👇🏻 to trade
$SOXLB
Follow @TZX_Crypto for more updates...
#SOXLB #CryptoTrading #MarketAnalysis #BinanceSquare
$SOXLB
🔻 $SOXLB SHORT SETUP 🔴 Sellers are stepping in — here's the setup. ⚡
$SOXLB is under significant bearish pressure, posting a -4.00% decline as sellers push the price toward the lower end of the daily range. Heavy trading volume suggests that the current downward momentum is well-supported by market participants.
📊 24h: -4.00% | Vol: $31,632,597.26
📉 TRADE PLAN
🔹 Entry: 100.89
🛑 Stop Loss: 103.50
🎯 TP1: 96.90
🎯 TP2: 94.50
🎯 TP3: 92.00
⚖️ Risk:Reward (TP1): 1:1.53
🔔 Trigger: A confirmed breakdown and hold below the $100.00 psychological level.
⚠️ Risk Note: High volatility near recent lows can cause sudden price spikes; manage your exposure carefully.
Keep a close eye on the volume and wait for price action to confirm the bearish trend before committing.
Click below 👇🏻 to trade
$SOXLB
Follow @TZX_Crypto for more updates...
#SOXLB #CryptoTrading #MarketAnalysis #BinanceSquare
1
·
--
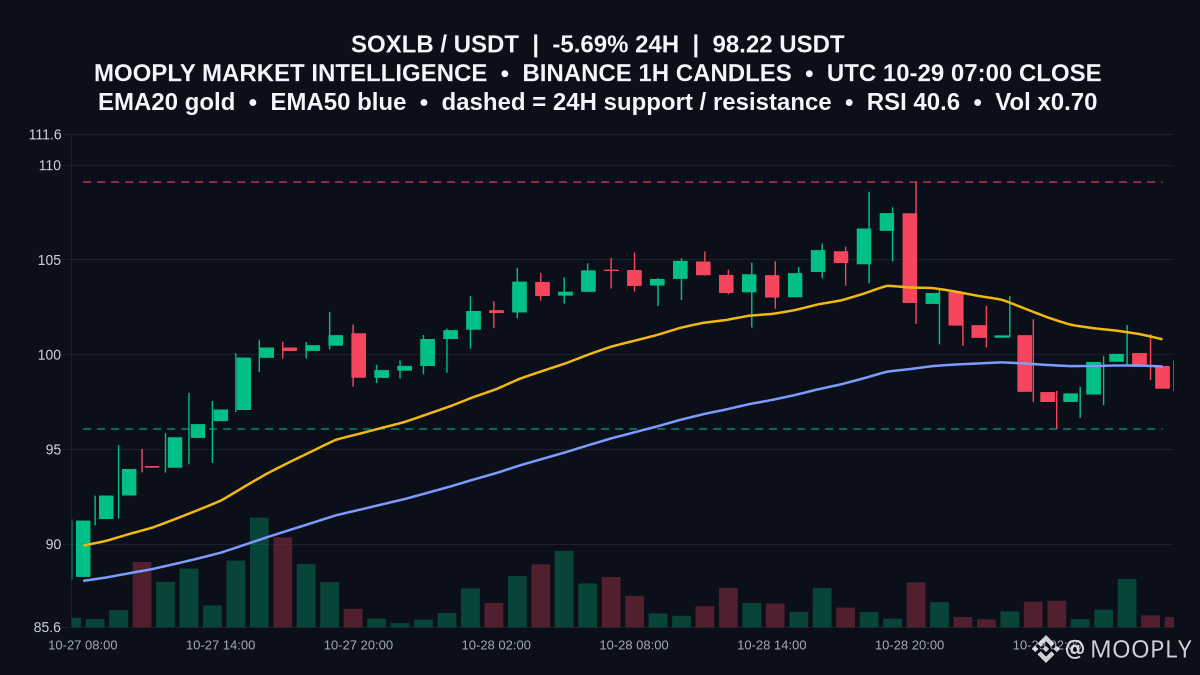
Back under the century mark, $SOXLB is down 5.692% in 24h, trading 98.22.
On the 1h, price sits below EMA20 100.815 and EMA50 99.382 while RSI 40.62 leans risk-off. That makes 96.08 a pivotal support from recent lows, with 109.11 the clear cap from the latest high—defining a broad range to respect.
With ATR at 3.004, moves between levels can come quickly. The range view holds while 96.08 contains dips; a 1h close back above 99.382 would be the first sign of repair, with further improvement above 100.815. A decisive close below 96.08 would invalidate the range bias and favor continuation lower.
Which trigger matters more to you here—the 99.382 reclaim or a breakdown of 96.08?
Not financial advice.
#SOXLB #MarketContext #RangeStructure
50

·
--
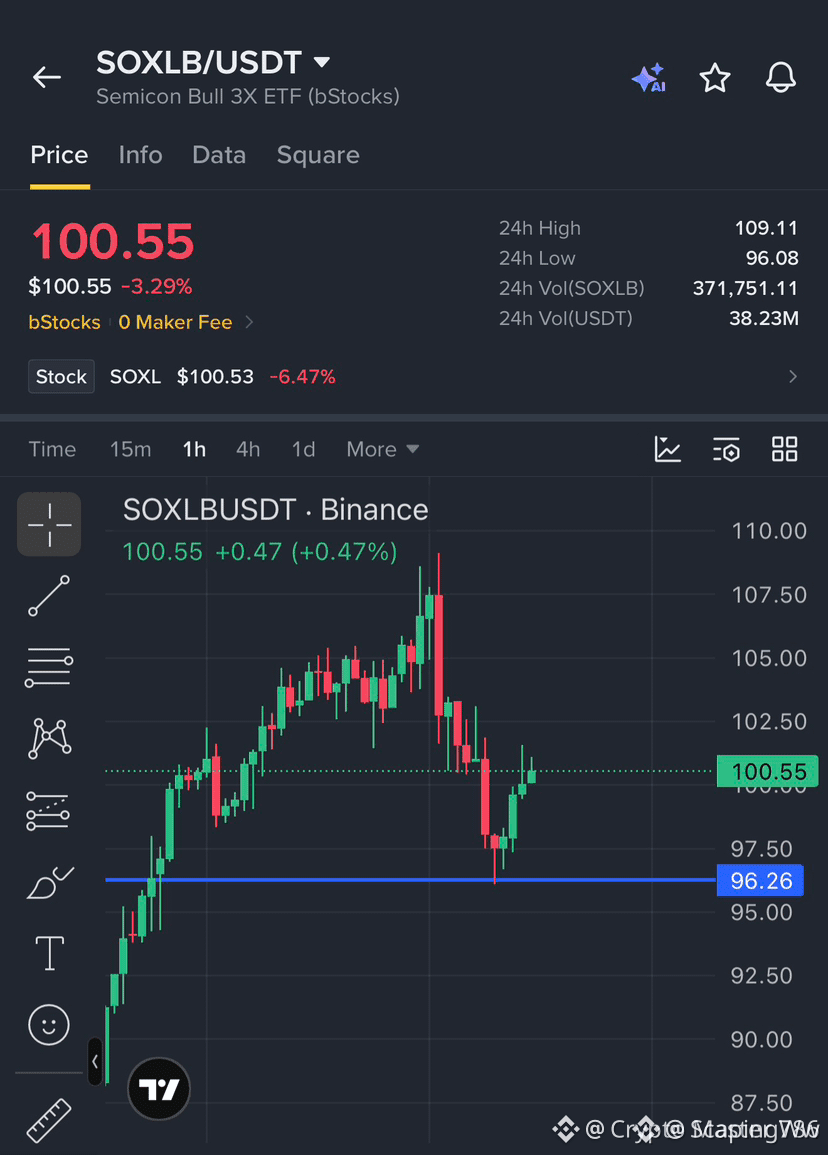
🚀 $SOXLB BOUNCING OFF SUPPORT, READY FOR A QUICK CLIMB! 🟢
Entry: 99.50‑100.60 ⚡
Target: 102.50 / 105.00 / 107.50 🚀
Stop Loss: 96.00 ⚠️
📊 The demand wall at $96.26 finally gave way, and smart money is re‑stacking above $99. The order flow shows a clean absorption of sell pressure, hinting at a liquidity sweep that could fuel the next thrust. ⚡ Volume spikes on the 15‑min chart reinforce the recovery narrative, while the price respects the $100.60 ceiling as a fresh breakout trigger. 🌊 Buyers are lining up, and a clean retest could lock in a swift rally.
💬 How are you positioning for the next leg on this bounce? 👇
⚠️ Not financial advice. Always manage your risk. 🛡️
🏷️ #SOXLB #LongSetup #Recovery #Crypto
🔥 🚀
8

·
--
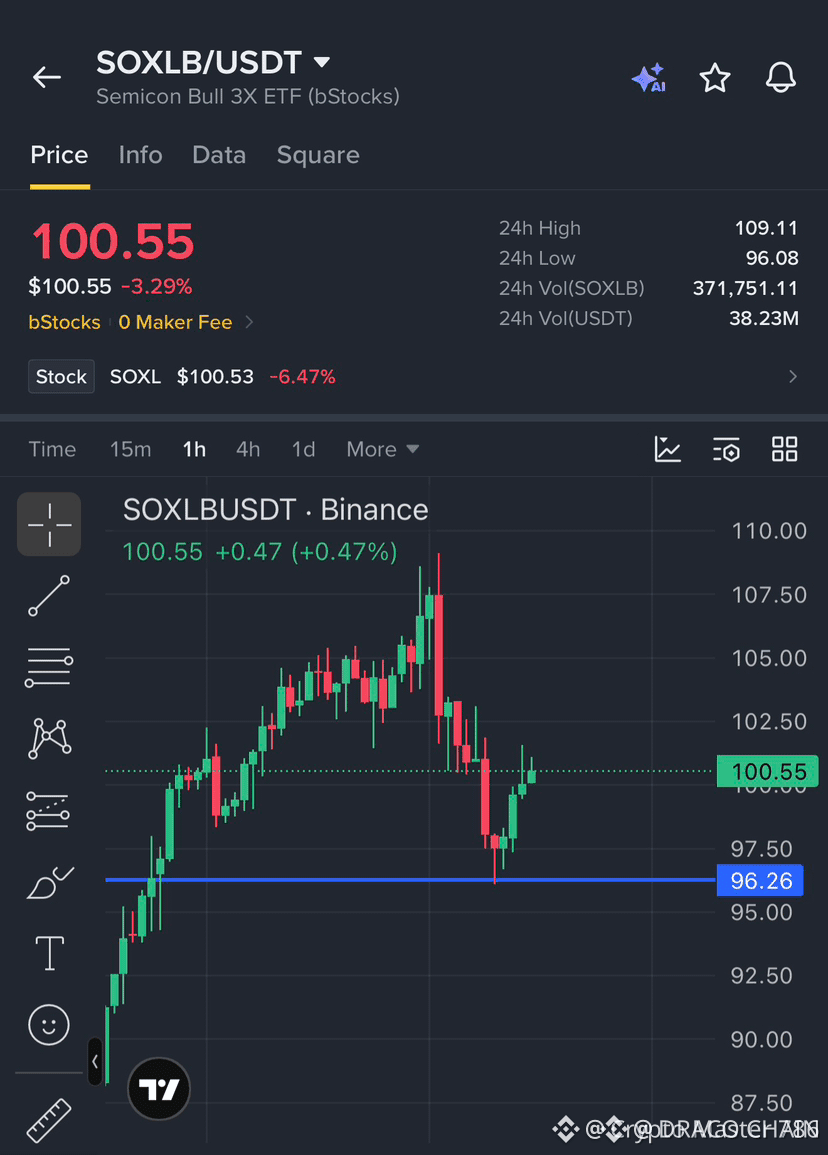
🚀 $SOXLB BOUNCING OFF SUPPORT – NEW LONG WINDOW EMERGES! 📈
Entry: 99.50‑100.60 ⚡
Target: 102.50 / 105.00 / 107.50 🚀
Stop Loss: 96.00 ⚠️
📊 The $96.26 demand zone has held firm three times, acting as a liquidity sink where smart money has been swallowing sell orders. 📌 Buyers now reclaim the area, pushing momentum toward the 100‑level range with volume confirming the uptick. ⚡ A clean entry band between $99.50 and $100.60 aligns with the order‑block retest, offering a compelling risk‑reward profile as price eyes the $102.5‑$107.5 corridor.
💬 Does the $96.26 block give you confidence to load up, or are you waiting for a deeper pullback? 👇
⚠️ Not financial advice. Always manage your risk. 🛡️
🏷️ #SOXLB #LongSetup #Liquidity #Crypto
🔥 💎
4

·
--
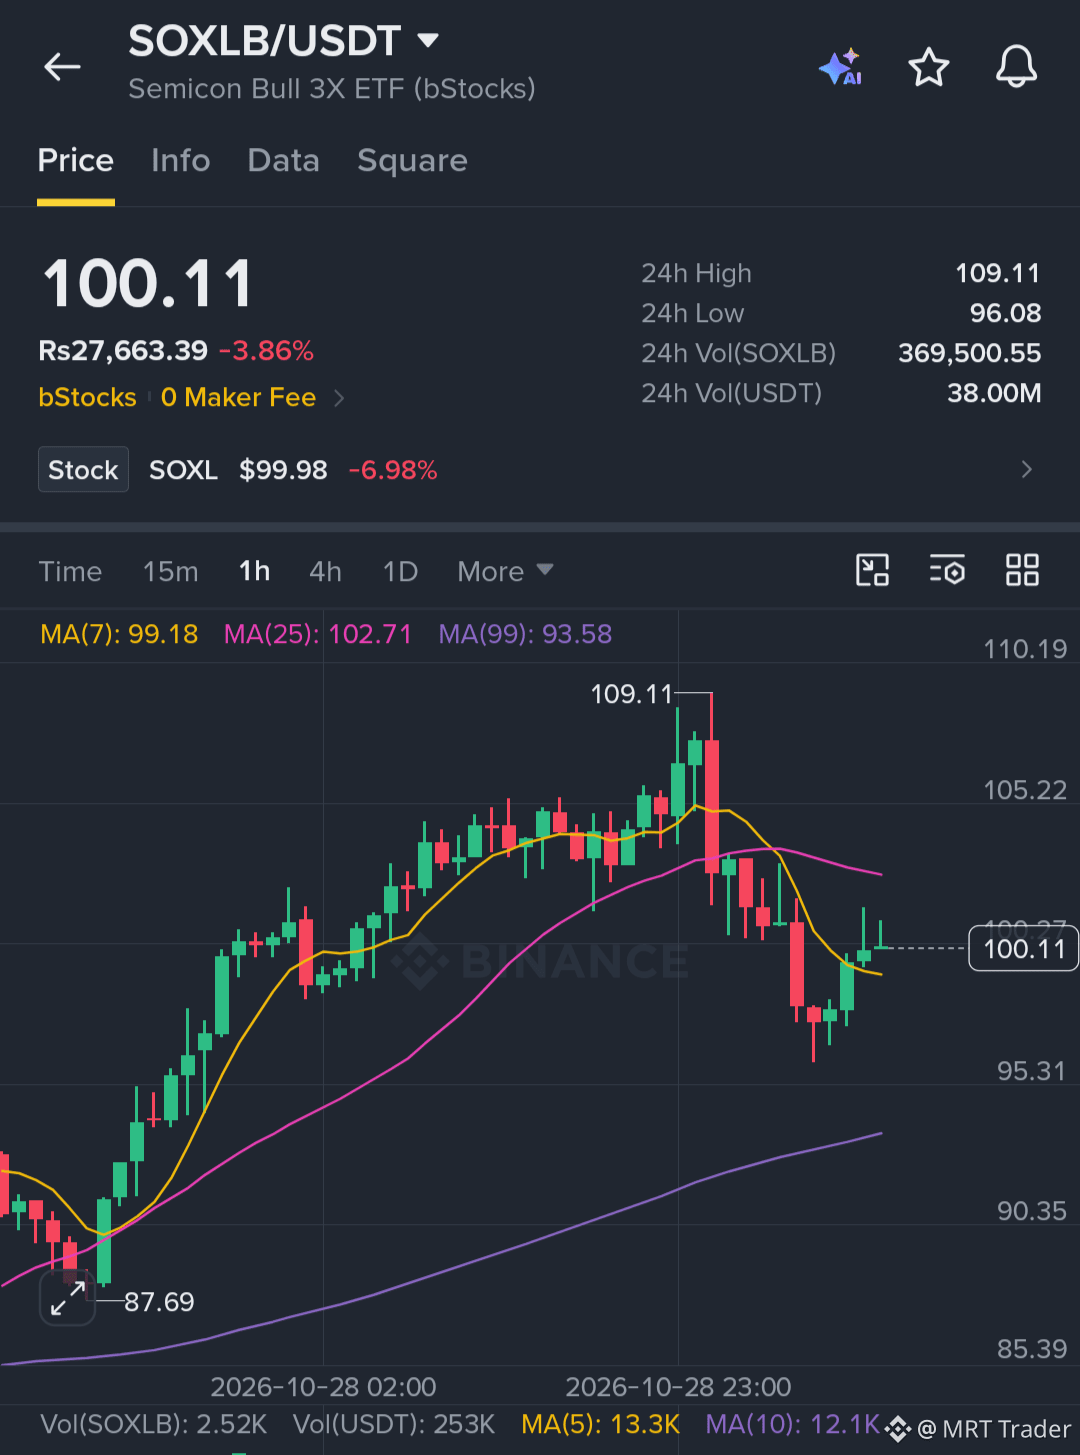
Guys, I'm watching $SOXLB for a fresh long opportunity. Price has bounced off $96.26 support and buyers are starting to step back in.
Key Level:
🟢 Bullish above: 99.20
Trade Setup (Long):
🟢 Entry Zone: 99.55 – 100.55
🎯 Targets: 102.45 / 104.90 / 107.35
⛔ Stop Loss: 96.15
Wait for confirmation before entering and manage risk appropriately.
Click here to buy now 👉 $SOXLB
{spot}(SOXLBUSDT)
#SOXLB #EarningsSeason #Write2Earn
Guys, I'm watching $SOXLB for a fresh long opportunity. Price has bounced off $96.26 support and buyers are starting to step back in.
Key Level:
🟢 Bullish above: 99.20
Trade Setup (Long):
🟢 Entry Zone: 99.55 – 100.55
🎯 Targets: 102.45 / 104.90 / 107.35
⛔ Stop Loss: 96.15
Wait for confirmation before entering and manage risk appropriately.
Click here to buy now 👉 $SOXLB
#SOXLB #EarningsSeason #Write2Earn
Key Level:
🟢 Bullish above: 99.20
Trade Setup (Long):
🟢 Entry Zone: 99.55 – 100.55
🎯 Targets: 102.45 / 104.90 / 107.35
⛔ Stop Loss: 96.15
Wait for confirmation before entering and manage risk appropriately.
Click here to buy now 👉 $SOXLB
#SOXLB #EarningsSeason #Write2Earn
1
20
·
--
🔻 Tech tokens in freefall — Google, Semis, and Chips all bleeding red
Three tech-adjacent tokens getting hammered in the same session. When big tech names and semiconductor plays drop together, it's usually risk-off across the board. Worth watching if you're hunting for bounces or riding the short side 📉
📊 GOOGLB — $292.91 (-10.2%)
RSI 4H at 18.2 — deeply oversold territory. Volume surging at 9.58x normal, which means panic selling is in full swing. Price well below all SMAs. The question is whether this is capitulation or just the beginning.
📊 SOXLB — $97.83 (-5.8%)
Consolidation mode with neutral RSI at 53.3. Volume is normal, so this isn't panic — it's a slow bleed. Trading below SMA25 on the daily ($113) and the gap is widening. Semiconductor exposure in crypto is feeling the heat.
📊 CHIP — $0.0475 (-13.4%)
The hardest hit of the three. RSI 4H at 42.6, strong downtrend with price below all key moving averages. Small cap + heavy selling = high risk. Don't try to catch this knife without confirmation.
🎯 Trade Plans:
GOOGLB — Short: Entry $290-$296 | SL $303.85 | TP $281.47
SOXLB — Short: Entry $95.6-$100 | SL $106.8 | TP $92.72
CHIP — Short: Entry $0.0463-$0.0487 | SL $0.0522 | TP $0.0449
Which one do you think bounces first? Or are we going lower? 👇
#GOOGLB #SOXLB #CHIP
246
·
--
🔴 $SOXLB SHORT Setup
$SOXLB is losing ground fast.
📊 SOXLBUSDT displays strong bearish sentiment with a notable 24-hour decline of over 5% on significant volume. This indicates a clear breakdown in price structure, suggesting further downside potential. The current market conditions favor a short position to capture continued downward momentum.
🎯 Trade Plan
Entry: 97.17
Stop Loss: 99.11
TP1: 95.23
TP2: 93.28
TP3: 91.34
⚖️ Risk:Reward (TP1) 1:1.00
⚡ Trigger: Execute upon reaching current market price
⚠️ Risk Note: Trading cryptocurrencies carries substantial risk and may not be suitable for all investors. Only risk capital you can afford to lose.
Not financial advice. Do your own research.
#SOXLB #soxlb
13

·
--
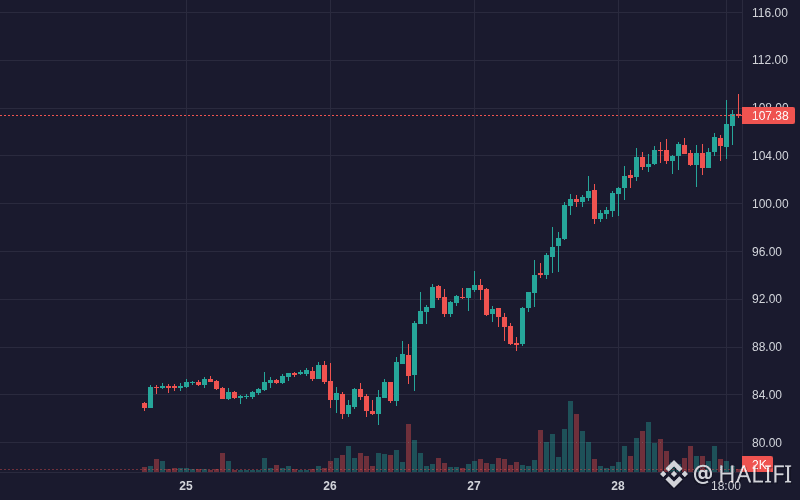
$SOXLB SOXLB is showing bullish movement: 6.71% (Crypto).
Volume: 43.83M | Last: $107.40
Key signals: strong momentum, high volatility, high trader activity.
Bias Daily: BULLISH 🟢 | Weekly: BULLISH 🟢
SOXLB gained 5.59% over 24h to $106.65, driven by tokenized equity momentum despite persistent leverage decay risks.
**Tokenized asset demand (High)**: Expansion of bStocks ecosystem drives continuous 24/7 liquidity and buying interest into leveraged semiconductor exposure.
- **Trend continuation (High)**: Price pushed above upper Bollinger Band ($106.41) and EMA 7 ($104.96) holds well above EMA 25 ($102.44) → sustained bullish breakout momentum.
- **Net inflow reversal (Medium)**: Latest hour reversed prolonged outflows with +$209K net inflows and positive large participant buying.
#SOXLB #FOMCWatch #CanGoogleDefindItsCore #fomcwatch #Crypto
2
8

·
--
Trading at $106.36, $SOXLB just pushed 5.43% higher on $45.62M in volume.
The latest hourly close printed at 106.65, extending past the prior 23-hour high of 105.86. However, hourly volume running at just 0.52x the preceding average suggests caution against chasing late momentum blindly.
A bullish continuation scenario requires holding above the prior range high of 105.86. Conversely, a drop back under the 98.32 session low invalidates the breakout structure.
Will you wait for volume confirmation above 105.86, or watch for a retest of the 98.32 floor?
Tap $SOXLB for the live chart. #SOXLB #BinanceSquare
6

·
--
$SOXLB looks ready to push higher right now 🚀
Buy $SOXLB 105.2726 to 106.7694
SL 100.4321
Targets 115.5268 / 121.5646 / 130.6214
RSI is at 68 so buyers have room to run
Up 6.0 percent today and holding strong near the top
Price is in the zone right now
Tap $SOXLB to buy
Last 7 days of my calls, 44 hit target and 93 hit stop
Are you buying this one 👇
#SOXLB #TradingSignals
8

·
--
$SOXLB +4.56% | $MUB +4.13% | $GMX +3.91%
#SOXLB nudged up to $104.82, gaining +4.56% on $49.7 M of trade. The price lift is backed by a healthy volume spike, suggesting buyers are stepping in with confidence.
#MUB climbed to $970.69, up +4.13% while moving $13.8 M. The modest but steady inflow could point to a broader appetite for diversified bond exposure.
#GMX rose to $8.77, +3.91% on $1.3 M volume. As a permission‑less on‑chain exchange offering 70+ assets and up to 100x leverage, its modest volume still reflects solid interest from leveraged traders. 🧐
Keep an eye on whether the rising volumes for these ETFs translate into longer‑term price momentum.
#Write2Earn #Binance
1
Войдите, чтобы посмотреть больше материала
Присоединяйтесь к пользователям криптовалют по всему миру на Binance Square
⚡️ Получайте новейшую и полезную информацию о криптоактивах.
💬 Нам доверяет крупнейшая в мире криптобиржа.
👍 Получите достоверные аналитические данные от верифицированных создателей контента.
Эл. почта/номер телефона
В тренде
1
#$1.5BInLeveragedCryptoBetsLiquidated
Просмотров: 3,741
58 обсуждают
2
#KOSPIFalls3.53%BackBelow6000
Просмотров: 7,020
261 обсуждают
3
#USMidtermElections
Просмотров: 120,564
1,525 обсуждают
4
#StrategySTRCReaches$99.95ForFirstTimeIn165Days
Просмотров: 2,057
62 обсуждают
5
#BinanceWillListPredictPREDICT
Просмотров: 32,555
703 обсуждают
6
#SwitzerlandFirstSpotBitcoinETFExpectedToTradeInNovember
Просмотров: 1,263
72 обсуждают
7
#StrategyReports$21BQ3OperatingProfit
Просмотров: 1,352
41 обсуждают
8
#TwoAddressesHoldingAbout1.28BUSDTFrozen
Просмотров: 16,669
406 обсуждают
9
#FirstDigitalBlacklistsAttackerAddressHoldingAbout3.4MFDUSD
Просмотров: 584
17 обсуждают
10
#BitcoinDropsBelow$80K
Просмотров: 72,393
171 обсуждают