

#marketcap
marketcap
Просмотров: 747,001
2,822 обсуждают
Популярные
Новые

·
--
🚨 $MEME RARE $1M MARKET CAP CLIMB IN A SEA OF 23M TOKENS! 📈
📊 Only 118 tokens out of 23.1 million breach the $1 M market‑cap threshold – roughly 0.00051% of the supply, or 1 in 196,000. 🌊 This scarcity underscores how arduous it is for a memecoin to capture genuine liquidity amid a flood of new projects. 🦈 Smart money eyes sustainable demand, not just token issuance, and the gap between headline cap and real‑world order flow remains stark. 💡 Will the next wave of institutional interest finally surface for a worthy memecoin? 💬 What’s your take on the odds of a breakout? 👇
⚠️ Not financial advice. Always manage your risk. 🛡️
🏷️ #MEME #MarketCap #TokenDynamics #Crypto
🔥 💎
26

Market Cap Stuck Near $2.68 Trillion
Total crypto market cap is hovering around $2.67–2.69 trillion.
This is classic consolidation. Bitcoin’s ability to hold $80k is currently the main support for the entire market.
#CryptoMarket #Bitcoin #MarketCap
Market Cap Stuck Near $2.68 Trillion
Total crypto market cap is hovering around $2.67–2.69 trillion.
This is classic consolidation. Bitcoin’s ability to hold $80k is currently the main support for the entire market.
#CryptoMarket #Bitcoin #MarketCap
Total crypto market cap is hovering around $2.67–2.69 trillion.
This is classic consolidation. Bitcoin’s ability to hold $80k is currently the main support for the entire market.
#CryptoMarket #Bitcoin #MarketCap
12

Different data providers reported different circulating supply figures for $SHELL, producing market-cap estimates around $6 million or higher.
Market cap equals token price multiplied by circulating supply. When supply estimates differ, reported capitalization differs too. Check each provider's methodology and timestamp before comparing figures. Consistent data is more useful than choosing the highest or lowest estimate.
#MarketCap #Tokenomics #DataQuality CryptoEducation
Different data providers reported different circulating supply figures for $SHELL , producing market-cap estimates around $6 million or higher.
Market cap equals token price multiplied by circulating supply. When supply estimates differ, reported capitalization differs too. Check each provider's methodology and timestamp before comparing figures. Consistent data is more useful than choosing the highest or lowest estimate.
#MarketCap #Tokenomics #DataQuality CryptoEducation
48
·
--
Статья
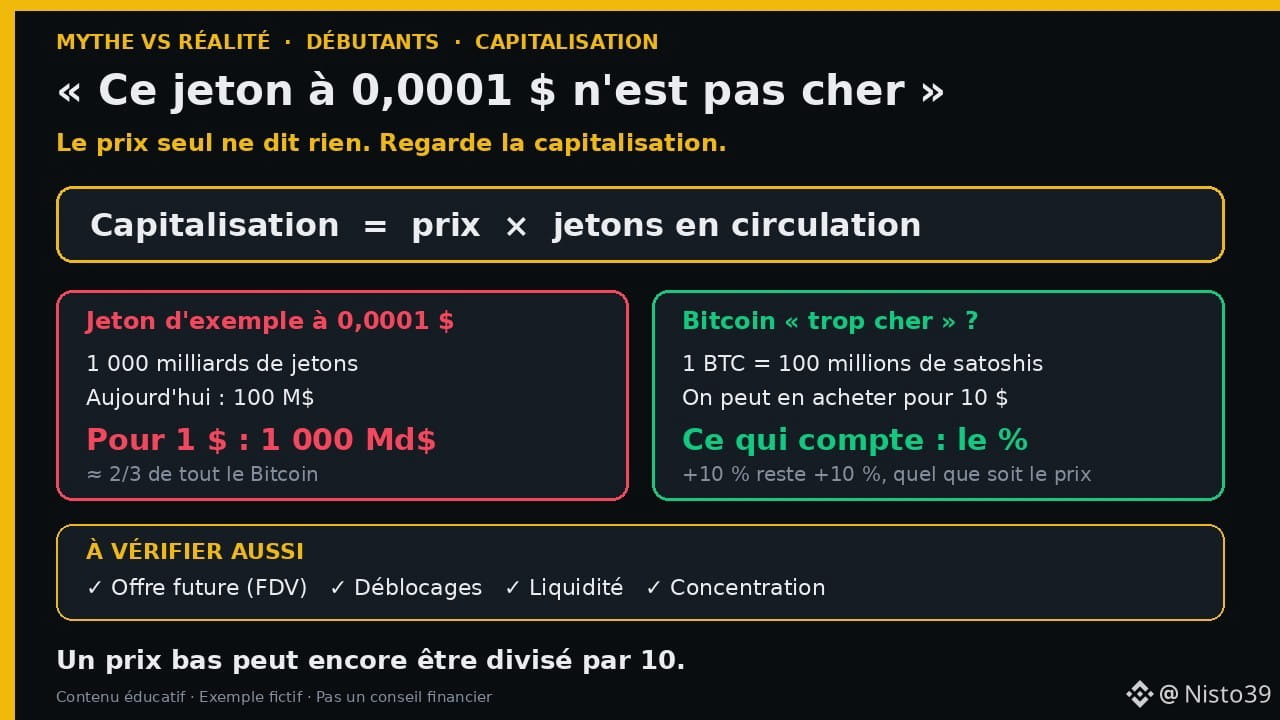
« Ce jeton à 0,0001 $ n'est pas cher » : le mythe qui piège les débutantsAïcha, étudiante à Douala, a 20 000 FCFA de côté. Un ami lui montre un jeton à 0,0001 $ : « Regarde, c'est pas cher ! S'il arrive juste à 1 $, tu fais x10 000. » Elle hésite entre ce jeton et un petit morceau de $BTC, qui lui paraît « trop cher » à environ 78 000 $.
C'est sans doute le piège le plus répandu chez les débutants. Démontons-le calmement.
🔢 Le prix d'un jeton ne dit presque rien
Le prix d'une crypto, c'est la valeur d'UNE unité. Mais une crypto peut avoir 21 millions d'unités ou 500 000 milliards d'unités. Comparer deux prix sans regarder le nombre d'unités, c'est comme comparer deux gâteaux en regardant seulement la taille d'une part, sans savoir en combien de parts chacun est coupé.
Le chiffre qui compte s'appelle la capitalisation (market cap) :
➡️ capitalisation = prix × nombre de jetons en circulation.
C'est, en gros, la valeur totale que le marché donne à tout le projet.
🧮 Faisons le calcul que l'ami d'Aïcha n'a pas fait
Imaginons le jeton d'exemple « ZEN » : 0,0001 $ et 1 000 milliards de jetons en circulation.
• Capitalisation aujourd'hui : 0,0001 × 1 000 milliards = 100 millions $.
• Pour valoir 1 $, il faudrait : 1 × 1 000 milliards = 1 000 milliards $.
1 000 milliards de dollars, c'est environ les deux tiers de la valeur totale du Bitcoin aujourd'hui (près de 20 millions de BTC × ~78 000 $ ≈ 1 550 milliards $). Un petit jeton inconnu devrait donc devenir presque aussi gros que la plus grande crypto du monde. Possible en théorie, extrêmement improbable en pratique.
Exemple réel : le $DOGE compte plus de 150 milliards d'unités en circulation, et ce nombre augmente chaque année (il n'a pas de plafond). Pour qu'un DOGE vaille 10 $, sa capitalisation devrait dépasser 1 500 milliards $, soit à peu près toute la valeur actuelle du Bitcoin. C'est pour ça que « DOGE à 10 $ » relève plus du rêve que du calcul.
🍰 « Bitcoin est trop cher pour moi » : autre mythe
Personne n'est obligé d'acheter un Bitcoin entier. Un BTC se divise en 100 millions de petites unités appelées satoshis. Avec 10 $ (environ 6 000 FCFA), on peut détenir une fraction de BTC. Ce qui compte pour ton résultat, ce n'est pas le prix unitaire, c'est le pourcentage de hausse ou de baisse. Si un actif monte de 10 %, tes 10 $ deviennent 11 $, que tu aies acheté 0,0001 BTC ou 100 000 jetons à 0,0001 $.
⚠️ Les autres chiffres à regarder avant d'acheter
1️⃣ L'offre maximale et l'offre future : certains projets n'ont qu'une petite partie de leurs jetons en circulation. Le reste sera « débloqué » plus tard (pour l'équipe, les investisseurs…). Plus de jetons sur le marché peut faire pression sur le prix.
2️⃣ La FDV (valeur totalement diluée) : prix × offre maximale. Si la FDV est 10 ou 20 fois la capitalisation actuelle, il y a beaucoup de jetons qui arrivent.
3️⃣ La liquidité et le volume : un jeton très peu échangé peut afficher un joli prix… mais impossible de revendre sans le faire chuter.
4️⃣ La concentration : si quelques portefeuilles détiennent l'essentiel des jetons, ils peuvent vendre d'un coup.
Ces informations sont visibles gratuitement sur la fiche d'une crypto (sur Binance, CoinMarketCap ou CoinGecko). Deux minutes de lecture évitent beaucoup de regrets.
🚩 Signaux d'alerte classiques
• « C'est pas cher, ça ne peut que monter » : faux, un prix bas peut encore être divisé par 10.
• « Il suffit qu'il atteigne 1 $ » : fais toujours le calcul de capitalisation.
• Promesses de x100 sur WhatsApp ou Telegram, souvent par des gens qui ont déjà acheté et cherchent des acheteurs.
✅ Ce qu'Aïcha retient
Elle ne choisit pas « le moins cher », elle compare des capitalisations, vérifie l'offre future, et ne met que ce qu'elle peut se permettre de perdre. Le prix unitaire, lui, n'est qu'une question de découpage.
Et toi, avant de lire ça, tu pensais qu'un jeton à 0,0001 $ avait « plus de potentiel » qu'un jeton à 50 $ ? Quel est le coin « pas cher » qu'on t'a le plus vanté ? Dis-le en commentaire 👇
Contenu éducatif, pas un conseil financier. Les cryptomonnaies sont volatiles et peuvent perdre une grande partie de leur valeur.
#Crypto #MarketCap #Education #Afrique #Debutant
« Ce jeton à 0,0001 $ n'est pas cher » : le mythe qui piège les débutants
Aïcha, étudiante à Douala, a 20 000 FCFA de côté. Un ami lui montre un jeton à 0,0001 $ : « Regarde, c'est pas cher ! S'il arrive juste à 1 $, tu fais x10 000. » Elle hésite entre ce jeton et un petit morceau de $BTC , qui lui paraît « trop cher » à environ 78 000 $.
C'est sans doute le piège le plus répandu chez les débutants. Démontons-le calmement.
🔢 Le prix d'un jeton ne dit presque rien
Le prix d'une crypto, c'est la valeur d'UNE unité. Mais une crypto peut avoir 21 millions d'unités ou 500 000 milliards d'unités. Comparer deux prix sans regarder le nombre d'unités, c'est comme comparer deux gâteaux en regardant seulement la taille d'une part, sans savoir en combien de parts chacun est coupé.
Le chiffre qui compte s'appelle la capitalisation (market cap) :
➡️ capitalisation = prix × nombre de jetons en circulation.
C'est, en gros, la valeur totale que le marché donne à tout le projet.
🧮 Faisons le calcul que l'ami d'Aïcha n'a pas fait
Imaginons le jeton d'exemple « ZEN » : 0,0001 $ et 1 000 milliards de jetons en circulation.
• Capitalisation aujourd'hui : 0,0001 × 1 000 milliards = 100 millions $.
• Pour valoir 1 $, il faudrait : 1 × 1 000 milliards = 1 000 milliards $.
1 000 milliards de dollars, c'est environ les deux tiers de la valeur totale du Bitcoin aujourd'hui (près de 20 millions de BTC × ~78 000 $ ≈ 1 550 milliards $). Un petit jeton inconnu devrait donc devenir presque aussi gros que la plus grande crypto du monde. Possible en théorie, extrêmement improbable en pratique.
Exemple réel : le $DOGE compte plus de 150 milliards d'unités en circulation, et ce nombre augmente chaque année (il n'a pas de plafond). Pour qu'un DOGE vaille 10 $, sa capitalisation devrait dépasser 1 500 milliards $, soit à peu près toute la valeur actuelle du Bitcoin. C'est pour ça que « DOGE à 10 $ » relève plus du rêve que du calcul.
🍰 « Bitcoin est trop cher pour moi » : autre mythe
Personne n'est obligé d'acheter un Bitcoin entier. Un BTC se divise en 100 millions de petites unités appelées satoshis. Avec 10 $ (environ 6 000 FCFA), on peut détenir une fraction de BTC. Ce qui compte pour ton résultat, ce n'est pas le prix unitaire, c'est le pourcentage de hausse ou de baisse. Si un actif monte de 10 %, tes 10 $ deviennent 11 $, que tu aies acheté 0,0001 BTC ou 100 000 jetons à 0,0001 $.
⚠️ Les autres chiffres à regarder avant d'acheter
1️⃣ L'offre maximale et l'offre future : certains projets n'ont qu'une petite partie de leurs jetons en circulation. Le reste sera « débloqué » plus tard (pour l'équipe, les investisseurs…). Plus de jetons sur le marché peut faire pression sur le prix.
2️⃣ La FDV (valeur totalement diluée) : prix × offre maximale. Si la FDV est 10 ou 20 fois la capitalisation actuelle, il y a beaucoup de jetons qui arrivent.
3️⃣ La liquidité et le volume : un jeton très peu échangé peut afficher un joli prix… mais impossible de revendre sans le faire chuter.
4️⃣ La concentration : si quelques portefeuilles détiennent l'essentiel des jetons, ils peuvent vendre d'un coup.
Ces informations sont visibles gratuitement sur la fiche d'une crypto (sur Binance, CoinMarketCap ou CoinGecko). Deux minutes de lecture évitent beaucoup de regrets.
🚩 Signaux d'alerte classiques
• « C'est pas cher, ça ne peut que monter » : faux, un prix bas peut encore être divisé par 10.
• « Il suffit qu'il atteigne 1 $ » : fais toujours le calcul de capitalisation.
• Promesses de x100 sur WhatsApp ou Telegram, souvent par des gens qui ont déjà acheté et cherchent des acheteurs.
✅ Ce qu'Aïcha retient
Elle ne choisit pas « le moins cher », elle compare des capitalisations, vérifie l'offre future, et ne met que ce qu'elle peut se permettre de perdre. Le prix unitaire, lui, n'est qu'une question de découpage.
Et toi, avant de lire ça, tu pensais qu'un jeton à 0,0001 $ avait « plus de potentiel » qu'un jeton à 50 $ ? Quel est le coin « pas cher » qu'on t'a le plus vanté ? Dis-le en commentaire 👇
Contenu éducatif, pas un conseil financier. Les cryptomonnaies sont volatiles et peuvent perdre une grande partie de leur valeur.
#Crypto #MarketCap #Education #Afrique #Debutant
73

·
--
Рост
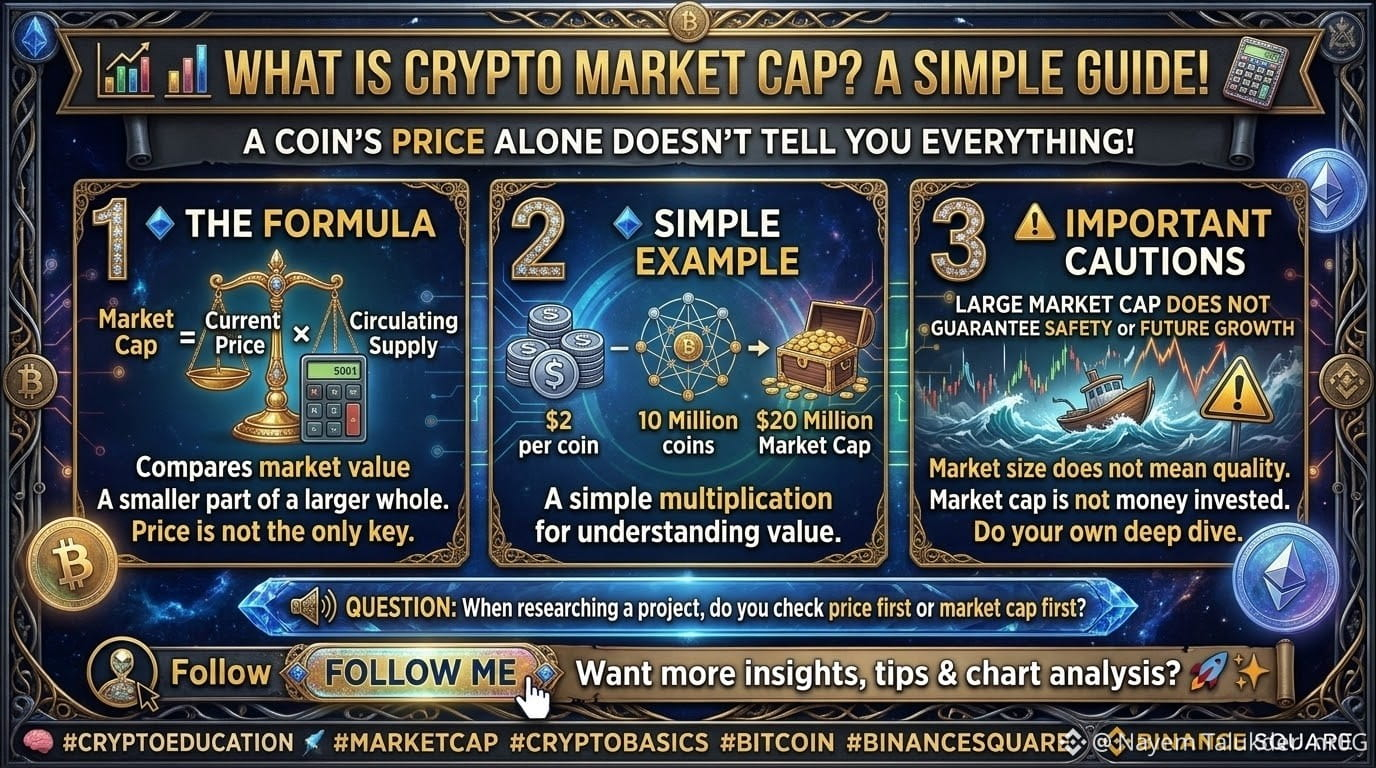
📊 What Is Crypto Market Cap? A Simple Guide!
A coin's price alone doesn't tell you everything!
🔹 The Formula: Market Cap = Current Price × Circulating Supply
🔹 Simple Example: If a coin trades at $2 and has 10 million coins in circulation, its market cap is $20 million.
{spot}(ZECUSDT)
{spot}(TRXUSDT)
{spot}(BNBUSDT)
🔹 Why Does It Matter? It helps compare the market value of different crypto assets.
⚠️ A larger market cap does not guarantee safety, quality, or future growth. Market cap is not the same as money invested.
💬 Question: When researching a crypto project, do you check price first or market cap first?
#MarketCap #CryptoBasics #Bitcoin❗ #BinanceSquare
$ZEC $TRX $BNB
📊 What Is Crypto Market Cap? A Simple Guide!
A coin's price alone doesn't tell you everything!
🔹 The Formula: Market Cap = Current Price × Circulating Supply
🔹 Simple Example: If a coin trades at $2 and has 10 million coins in circulation, its market cap is $20 million.
🔹 Why Does It Matter? It helps compare the market value of different crypto assets.
⚠️ A larger market cap does not guarantee safety, quality, or future growth. Market cap is not the same as money invested.
💬 Question: When researching a crypto project, do you check price first or market cap first?
#MarketCap #CryptoBasics #Bitcoin❗ #BinanceSquare
$ZEC $TRX $BNB
Shaon 13:
ok
1
2
268
$SHELL | Why Market-Cap Figures Differ Between Data Sites
The research report found that recent $SHELL market-cap estimates varied from roughly $6 million to 10.4 million. It also noted a substantial difference in reported circulating supply, with some sources listing approximately 270 million tokens and others around 458 million.
That discrepancy matters because market capitalization is calculated by multiplying the current token price by the circulating supply used by the data provider.
If two platforms use different circulating-supply figures, their market-cap estimates can differ even when they show nearly identical prices. This does not automatically mean one platform has made a mistake, but it does mean the underlying methodology needs to be checked.
Three terms are especially important.
Circulating market capitalization uses the provider's estimate of tokens currently circulating.
Fully diluted valuation, or FDV, generally uses the total or maximum token supply specified by the relevant methodology.
Total supply describes tokens that have been created, although the exact treatment of locked, burned or otherwise restricted tokens may vary by provider.
These measures answer different questions. Market cap estimates the value of the circulating supply at the current price, while FDV illustrates what valuation would look like under a broader supply assumption. Neither number alone tells us whether a token is cheap or expensive.
When comparing tokens, record the source, timestamp, circulating supply and calculation method. Consistent methodology makes comparisons far more meaningful.
#Tokenomics #MarketCap #DataQuality CryptoEducation Fundamentals

1
38
$SHELL: Vì sao dữ liệu vốn hóa giữa các nguồn khác nhau?
Các nhà cung cấp dữ liệu khác nhau đưa ra số liệu nguồn cung lưu hành của $SHELL không giống nhau, dẫn đến các ước tính vốn hóa thị trường quanh 6 triệu USD hoặc cao hơn.
Vốn hóa thị trường được tính bằng giá token nhân với nguồn cung lưu hành. Khi số liệu nguồn cung khác nhau, vốn hóa được báo cáo cũng sẽ khác. Hãy kiểm tra phương pháp tính và thời điểm cập nhật của từng nguồn trước khi so sánh. Dữ liệu nhất quán quan trọng hơn việc chọn con số cao nhất hoặc thấp nhất.
#MarketCap #Tokenomics #DataQuality CryptoEducation
$SHELL : Vì sao dữ liệu vốn hóa giữa các nguồn khác nhau?
Các nhà cung cấp dữ liệu khác nhau đưa ra số liệu nguồn cung lưu hành của $SHELL không giống nhau, dẫn đến các ước tính vốn hóa thị trường quanh 6 triệu USD hoặc cao hơn.
Vốn hóa thị trường được tính bằng giá token nhân với nguồn cung lưu hành. Khi số liệu nguồn cung khác nhau, vốn hóa được báo cáo cũng sẽ khác. Hãy kiểm tra phương pháp tính và thời điểm cập nhật của từng nguồn trước khi so sánh. Dữ liệu nhất quán quan trọng hơn việc chọn con số cao nhất hoặc thấp nhất.
#MarketCap #Tokenomics #DataQuality CryptoEducation
8

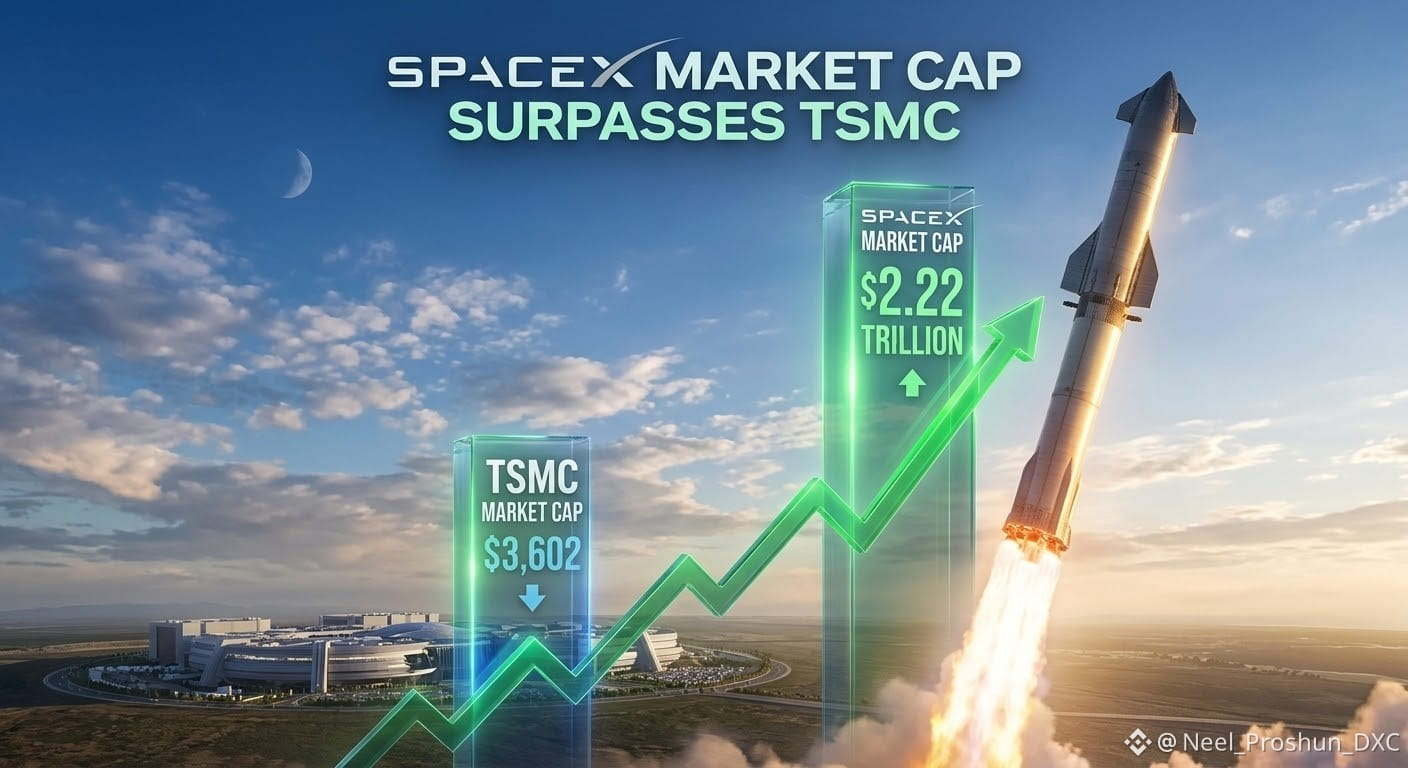
🌌 HISTORIC MILESTONE: SpaceX Hits $2.22 Trillion Valuation!
#SpaceXMarketCapSurpassesTSMC
In an unprecedented market move, SpaceX's market capitalization has officially reached a staggering $2.22 Trillion, officially surpassing semiconductor titan TSMC! 🚀
Following a massive post-earnings rally, Elon Musk’s aerospace giant continues to redefine industry standards. From commercial spaceflight to global satellite connectivity via Starlink, SpaceX is proving that the sky is no longer the limit—it’s just the starting line.
💡 Do you think SpaceX will eventually become the world's most valuable company? Let’s discuss! ⚡
#SpaceX #marketcap #stockmarket $SPCXB
{spot}(SPCXBUSDT)
🌌 HISTORIC MILESTONE: SpaceX Hits $2.22 Trillion Valuation!
#SpaceXMarketCapSurpassesTSMC
In an unprecedented market move, SpaceX's market capitalization has officially reached a staggering $2.22 Trillion, officially surpassing semiconductor titan TSMC! 🚀
Following a massive post-earnings rally, Elon Musk’s aerospace giant continues to redefine industry standards. From commercial spaceflight to global satellite connectivity via Starlink, SpaceX is proving that the sky is no longer the limit—it’s just the starting line.
💡 Do you think SpaceX will eventually become the world's most valuable company? Let’s discuss! ⚡
#SpaceX #marketcap #stockmarket $SPCXB
128

·
--
Статья
Is a Cheap Coin Really Cheap? Price vs Market Cap ExplainedDay 6 of my crypto learning series
When I started learning crypto, one idea felt obvious: a coin priced at $0.01 must be cheap, and a coin priced at $50,000 must be expensive. It turns out this is one of the most common beginner mistakes. The price of one coin does not tell you how big or how valuable the whole coin is. Here is what I learned, in simple words.
What is price?
Price is simply what one coin costs right now. If a coin is priced at $2, then buying one coin costs $2. That is all it tells you.
What is market cap?
Market cap is short for market capitalization. It shows the total size of a coin, and it is calculated like this:
Market cap = price × circulating supply
Circulating supply means the number of coins that are available and trading right now.
A simple example (made-up numbers)
Imagine two coins:
Coin A: price $0.01, with 100 billion coins in circulation. Market cap = $1 billion.Coin B: price $0.50, with 2 billion coins in circulation. Market cap = $1 billion.
Both coins have the same market cap. They are the same size. But Coin A looks “cheap” because each coin costs just one cent. Coin A is not cheaper. It just has many more coins. This is why a low price alone does not mean cheap.
Think of it like pizza
Imagine two pizzas of the same size. One is cut into 4 big slices, and the other into 100 tiny slices. A tiny slice costs less, but you are not getting a better deal. The whole pizza is the same size. Price is the price of one slice. Market cap is the price of the whole pizza.
Other numbers to read next to price
Circulating supply. The coins available now. It affects market cap directly.
Max supply. The most coins that can ever exist. Bitcoin has a maximum of 21 million. Ethereum has no fixed maximum, as we learned on Day 2.
Fully diluted valuation (FDV). This is the value if all future coins already existed at today’s price. If there is a big gap between market cap and FDV, many coins have not been released yet. More coins entering the market later could affect the price. FDV is a theoretical number, so treat it as a warning sign, not a prediction.
24-hour trading volume. How much of the coin was bought and sold in the last day. It shows how active the market is. A coin with very low volume can be hard to sell at the price you see.
What market cap does not tell you
It is not money invested. Market cap is just the last price multiplied by supply. Nobody put that full amount in.It does not mean a coin is a good buy. It helps you compare size, not decide value.It can be shaky for small coins. Small coins can move a lot, even on small trades.Supply numbers can differ. Different sites may count “circulating supply” slightly differently, so compare more than one source.
A simple checklist before you judge any coin
Don’t judge by price alone.Check the market cap.Check circulating supply and max supply.Compare market cap with FDV.Look at 24-hour volume.Check the same numbers on more than one source.
Final thoughts
Price is one small piece of the picture. Market cap, supply, and volume help you see the rest. Understanding them will not tell you what will happen next, because nobody can predict that. But it will stop you from making the “cheap coin” mistake. I am not recommending any coin in this series. Please do your own research.
This is learning, not financial advice. Crypto prices can swing a lot, and you can lose money.
Question for you: Did you ever think a coin was “cheap” because of its price? Tell me below 👇
Day 7 is about how to research a coin before you trust it.
#Crypto #MarketCap #LearnCrypto #Beginners
Is a Cheap Coin Really Cheap? Price vs Market Cap Explained
Day 6 of my crypto learning series
When I started learning crypto, one idea felt obvious: a coin priced at $0.01 must be cheap, and a coin priced at $50,000 must be expensive. It turns out this is one of the most common beginner mistakes. The price of one coin does not tell you how big or how valuable the whole coin is. Here is what I learned, in simple words.
What is price?
Price is simply what one coin costs right now. If a coin is priced at $2, then buying one coin costs $2. That is all it tells you.
What is market cap?
Market cap is short for market capitalization. It shows the total size of a coin, and it is calculated like this:
Market cap = price × circulating supply
Circulating supply means the number of coins that are available and trading right now.
A simple example (made-up numbers)
Imagine two coins:
Coin A: price $0.01, with 100 billion coins in circulation. Market cap = $1 billion.Coin B: price $0.50, with 2 billion coins in circulation. Market cap = $1 billion.
Both coins have the same market cap. They are the same size. But Coin A looks “cheap” because each coin costs just one cent. Coin A is not cheaper. It just has many more coins. This is why a low price alone does not mean cheap.
Think of it like pizza
Imagine two pizzas of the same size. One is cut into 4 big slices, and the other into 100 tiny slices. A tiny slice costs less, but you are not getting a better deal. The whole pizza is the same size. Price is the price of one slice. Market cap is the price of the whole pizza.
Other numbers to read next to price
Circulating supply. The coins available now. It affects market cap directly.
Max supply. The most coins that can ever exist. Bitcoin has a maximum of 21 million. Ethereum has no fixed maximum, as we learned on Day 2.
Fully diluted valuation (FDV). This is the value if all future coins already existed at today’s price. If there is a big gap between market cap and FDV, many coins have not been released yet. More coins entering the market later could affect the price. FDV is a theoretical number, so treat it as a warning sign, not a prediction.
24-hour trading volume. How much of the coin was bought and sold in the last day. It shows how active the market is. A coin with very low volume can be hard to sell at the price you see.
What market cap does not tell you
It is not money invested. Market cap is just the last price multiplied by supply. Nobody put that full amount in.It does not mean a coin is a good buy. It helps you compare size, not decide value.It can be shaky for small coins. Small coins can move a lot, even on small trades.Supply numbers can differ. Different sites may count “circulating supply” slightly differently, so compare more than one source.
A simple checklist before you judge any coin
Don’t judge by price alone.Check the market cap.Check circulating supply and max supply.Compare market cap with FDV.Look at 24-hour volume.Check the same numbers on more than one source.
Final thoughts
Price is one small piece of the picture. Market cap, supply, and volume help you see the rest. Understanding them will not tell you what will happen next, because nobody can predict that. But it will stop you from making the “cheap coin” mistake. I am not recommending any coin in this series. Please do your own research.
This is learning, not financial advice. Crypto prices can swing a lot, and you can lose money.
Question for you: Did you ever think a coin was “cheap” because of its price? Tell me below 👇
Day 7 is about how to research a coin before you trust it.
#Crypto #MarketCap #LearnCrypto #Beginners
120

One cohort's market cap has climbed 41% since late August while $BTC managed about 7%.
That kind of gap is where accounts get emotional. You either chase what already moved because missing it feels worse than being wrong, or you stay loyal to a Bitcoin-only plan and watch the rest of the tape make the wait feel expensive.
Market cap is just price multiplied by supply, so this is not a mood survey. CryptoQuant's comparison says capital showed up in that cohort several times faster than it did in Bitcoin, 41% against 7%.
I've seen this shape in earlier cycles, usually after the first $BTC leg goes quiet. Relative strength leaks elsewhere, attention stays glued to Bitcoin, and anyone still trading last cycle's $ETH or $SOL playbook waits until the move looks obvious. Obvious is often when the risk flips. A spread that wide can keep running if fresh money is still rotating, and it can also be the stretch that punishes late greed.
Where do you think this gap goes from here?
#Bitcoin #Crypto #MarketCap

2

·
--
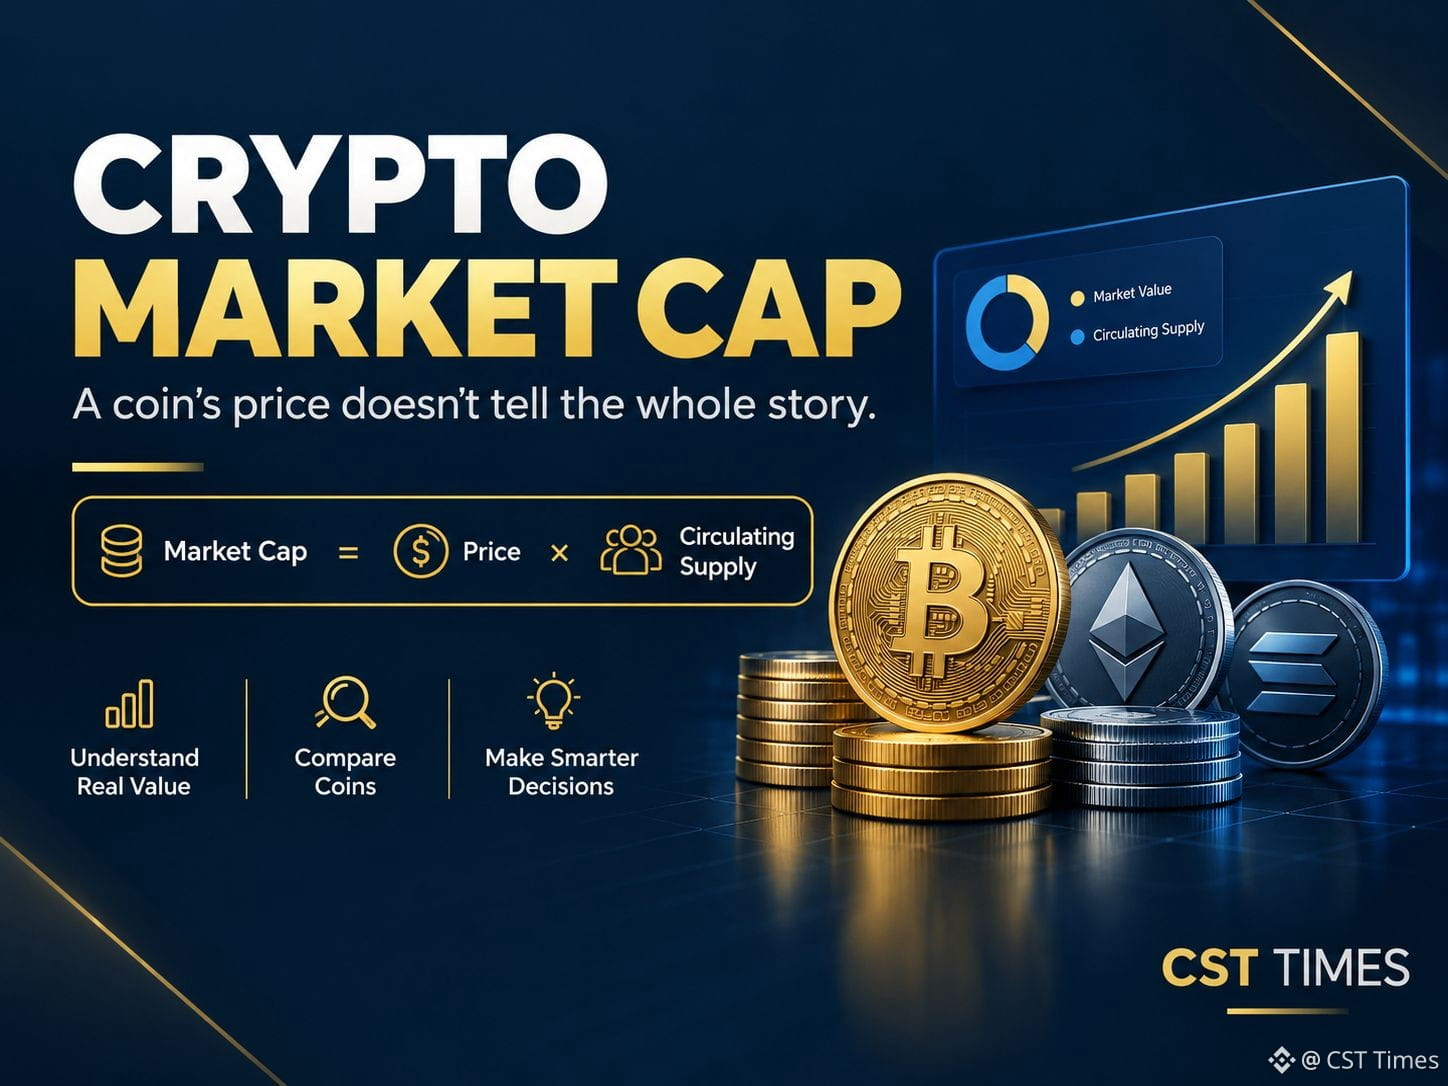
A $0.10 crypto coin isn't always cheaper than a $1,000 coin.
Why? Because a coin’s price doesn’t tell the whole story.
📊 Market Cap = Price × Circulating Supply
Learn how crypto market cap works, how it compares with FDV, and what to check before judging a cryptocurrency.
Read the full guide: Scan the QR code:
Question: When comparing crypto coins, do you check the price or market cap first?
#cryptomarketcap #marketcap #blocakchain

104

·
--
A coin trading at $0.10 is not automatically cheaper than a coin trading at $10.
Market capitalization changes the entire picture.
Consider these projects:
$GRT — Blockchain data indexing
$SAND — Gaming and virtual worlds
$MANA — Virtual-world ecosystem
Before setting a future price target, I would calculate:
* Current market cap
* Circulating token supply
* Market cap required at the target price
* Possible future token dilution
A price target without a valuation model is just a number.
Which coin do you think is most misunderstood by the market?
#MarketCap #CryptoEducation #altcoins

474

·
--
Beyond speculation: The long-term macro curve of the crypto market
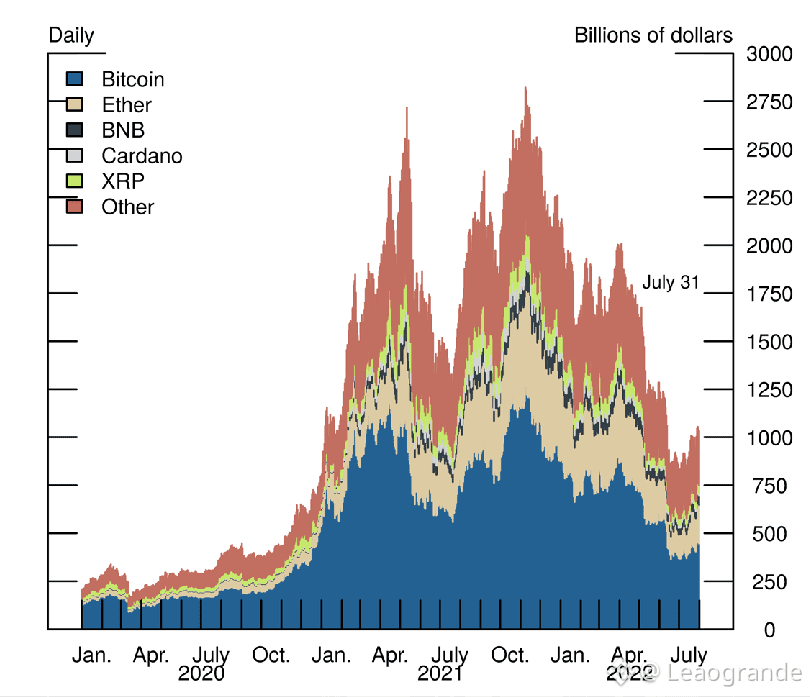
When we analyze daily noises and short-term volatility, it is easy to lose sight of the long-term structural trend. The total market capitalization chart (TOTAL) shows a clear pattern of increasingly higher fund consolidation throughout the halving cycles and global liquidity expansion.
💡 3 Pillars of the Sector Growth Projection:
- Increase in Historical Minimums (Higher Lows):
With each market cycle, the minimum value of the crypto market consolidates at levels significantly higher than the previous cycle. This reflects the retention of capital and permanent infrastructure in the ecosystem.
- Maturation of Liquidity Composition:
Solid infrastructure assets (Bitcoin, Ethereum, BNB) and stablecoins maintain the value of the network, while speculative liquidity gradually migrates to new operating theses (RWA, IA and L2s).
- Direct Institutional Capital Entry:
With the consolidation of spot ETFs and institutional custody infrastructure, the crypto market transitions from a purely retail-driven ecosystem to an asset class integrated with global finance.
{spot}(BTCUSDT)
#marketcap #BTC走势分析
Beyond speculation: The long-term macro curve of the crypto market
When we analyze daily noises and short-term volatility, it is easy to lose sight of the long-term structural trend. The total market capitalization chart (TOTAL) shows a clear pattern of increasingly higher fund consolidation throughout the halving cycles and global liquidity expansion.
💡 3 Pillars of the Sector Growth Projection:
- Increase in Historical Minimums (Higher Lows):
With each market cycle, the minimum value of the crypto market consolidates at levels significantly higher than the previous cycle. This reflects the retention of capital and permanent infrastructure in the ecosystem.
- Maturation of Liquidity Composition:
Solid infrastructure assets (Bitcoin, Ethereum, BNB) and stablecoins maintain the value of the network, while speculative liquidity gradually migrates to new operating theses (RWA, IA and L2s).
- Direct Institutional Capital Entry:
With the consolidation of spot ETFs and institutional custody infrastructure, the crypto market transitions from a purely retail-driven ecosystem to an asset class integrated with global finance.
#marketcap #BTC走势分析
90

·
--
Can $LUNC Reach ₹10? Breaking Down the Trillion-Rupee Math! 📉🚀
Is it mathematically possible for Terra Classic ($LUNC) to hit ₹10 INR? Let’s analyze the current supply data directly from the charts!
🔢 The Market Cap Calculation:
Circulating Supply: 5.52 Trillion LUNC
Target Price: ₹10 INR
Required Market Cap: ₹55.2 Trillion INR (~$660+ Billion USD)
💡 The Reality Check:
At a valuation of ₹55.2 Trillion, LUNC’s market cap would become massive—surpassing many top global tech giants and claiming a huge percentage of the entire cryptocurrency market.
🔥 What Needs to Happen for ₹10?
Aggressive Supply Burns: With 5.52 Trillion tokens currently in circulation, reaching ₹10 requires a monumental, long-term reduction in supply through continuous community burns and utility-driven deflation.
Unprecedented Market Influx: A multi-trillion-dollar global crypto super-cycle would be needed to inject this level of capital into legacy meme/recovery tokens.
What is your long-term outlook for Terra Classic? Can community burns make the impossible possible? Drop your predictions below! 👇
#LUNC #TerraClassic #CryptoAnalysis #BinanceSquare #marketcap
{spot}(LUNCUSDT)
Can $LUNC Reach ₹10? Breaking Down the Trillion-Rupee Math! 📉🚀
Is it mathematically possible for Terra Classic ($LUNC ) to hit ₹10 INR? Let’s analyze the current supply data directly from the charts!
🔢 The Market Cap Calculation:
Circulating Supply: 5.52 Trillion LUNC
Target Price: ₹10 INR
Required Market Cap: ₹55.2 Trillion INR (~$660+ Billion USD)
💡 The Reality Check:
At a valuation of ₹55.2 Trillion, LUNC’s market cap would become massive—surpassing many top global tech giants and claiming a huge percentage of the entire cryptocurrency market.
🔥 What Needs to Happen for ₹10?
Aggressive Supply Burns: With 5.52 Trillion tokens currently in circulation, reaching ₹10 requires a monumental, long-term reduction in supply through continuous community burns and utility-driven deflation.
Unprecedented Market Influx: A multi-trillion-dollar global crypto super-cycle would be needed to inject this level of capital into legacy meme/recovery tokens.
What is your long-term outlook for Terra Classic? Can community burns make the impossible possible? Drop your predictions below! 👇
#LUNC #TerraClassic #CryptoAnalysis #BinanceSquare #marketcap
11
1.3k

·
--
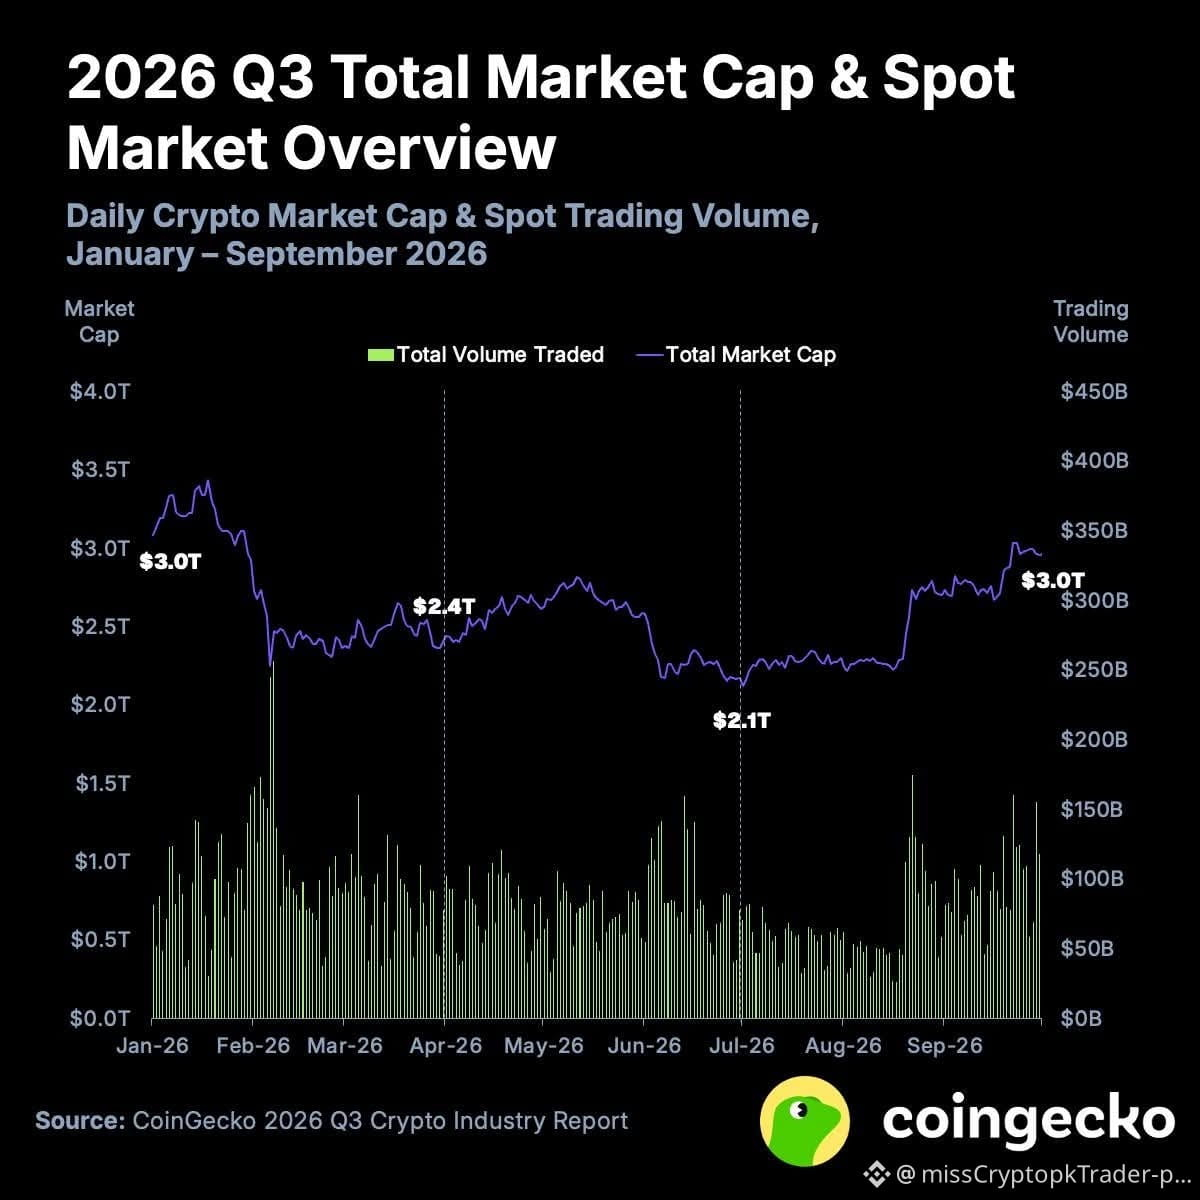
Crypto market caps rebound 39% in Q3, ending three‑quarter decline.
Total crypto market cap rose $840 billion, or 39.6%, to $3 trillion — the largest quarterly gain since Q4 2024. It peaked near $3 trillion on Sep 21 and closed the quarter at $2.96 trillion, still 4% lower year‑to‑date.
August delivered the bulk of the gain, jumping 21.8% (+$490 billion) after the US Treasury doubled its long‑dated bond buybacks and steady net inflows into spot Bitcoin ETFs. Ethereum surged 71% to $2,684, supported by $3.1 billion net inflows into US spot ETH funds.
Average daily volume fell 8.6% to $73.3 billion; spot volume on the top ten centralized exchanges dropped 14.2% to $1.65 trillion. Open interest on perpetual futures rose 40.6% to just over $100 billion, the first time since Q3 2025. Binance’s spot share expanded to 42.7% from 38.7% in Q2.
Which metric—market‑cap growth, trading volume, or open interest—will drive the next quarter’s price trends?
#Crypto #Bitcoin #Ethereum #MarketCap #FinTech

1
57
THE CRYPTO MARKET ISN'T MOVING AS ONE!
An October 18 market snapshot placed total crypto market capitalization near $2.7 trillion.
But market cap alone doesn't tell the full story.
Check:
• How many coins are advancing?
• Is trading volume increasing or falling?
• Are gains concentrated in just a few tokens?
A green headline can hide a weak broader market.
💬 Do you check total market cap or BTC dominance first?
#CryptoMarket #MarketCap #Bitcoin #TradingInsights
53
·
--
Can $PEPE Reach ₹1? Breaking Down the Trillion-Dollar Math! 🐸📊
Is it mathematically possible for Pepe Coin ($PEPE ) to reach ₹1 INR? Let's analyze the exact circulating supply and market cap dynamics!
🔢 The Market Cap Calculation:
Circulating Supply: 413.77 Trillion PEPE
Target Price: ₹1 INR
Required Market Cap: ₹413.77 Trillion INR (~$5 Trillion USD)
💡 Market Comparison:
At ₹413.77 Trillion, PEPE's valuation would be nearly 3x the size of Bitcoin's ($BTC) current market cap!
🚀 What Makes It Possible?
Aggressive Token Burning: If significant supply burns occur over time, the required market cap to hit ₹1 drops drastically.
Exponential Crypto Expansion: As global crypto adoption surges into multi-trillion-dollar territory, top meme assets could reach unprecedented valuations.
What's your long-term price target for $PEPE ? Drop your predictions below! 👇
#PEPE #pepecoin #CryptoAnalysis
#memecoins #marketcap
{spot}(PEPEUSDT)
Can $PEPE Reach ₹1? Breaking Down the Trillion-Dollar Math! 🐸📊
Is it mathematically possible for Pepe Coin ($PEPE ) to reach ₹1 INR? Let's analyze the exact circulating supply and market cap dynamics!
🔢 The Market Cap Calculation:
Circulating Supply: 413.77 Trillion PEPE
Target Price: ₹1 INR
Required Market Cap: ₹413.77 Trillion INR (~$5 Trillion USD)
💡 Market Comparison:
At ₹413.77 Trillion, PEPE's valuation would be nearly 3x the size of Bitcoin's ($BTC) current market cap!
🚀 What Makes It Possible?
Aggressive Token Burning: If significant supply burns occur over time, the required market cap to hit ₹1 drops drastically.
Exponential Crypto Expansion: As global crypto adoption surges into multi-trillion-dollar territory, top meme assets could reach unprecedented valuations.
What's your long-term price target for $PEPE ? Drop your predictions below! 👇
#PEPE #pepecoin #CryptoAnalysis
#memecoins #marketcap
1
191
If you're still buying $BTC just because it hit a trillion faster than anything else, stop now.
That headline is how traders talk themselves into late entries and then have no plan for the exit. You feel the story, you chase it, and the position turns into a bag you cannot explain.
Bitcoin reached a $1 trillion market cap faster than any other asset in history. No venture capital, no board of directors, no marketing budget. A decentralized network did that while traditional assets needed companies, governments, and decades of promotion. One camp treats this as proof the old system is finished and that $BTC is the only serious allocation left. The other camp calls the trillion a vanity number that says nothing about valuation, timing, or whether rotating some exposure into $ETH would have been the more honest trade once the milestone was already public.
Both sides are staring at the same fact and drawing opposite trades. I think the achievement holds up and the trade does not. Getting there with no marketing department is a genuine break from every asset that came before it. Using that fact as your entry thesis is how people donate money to whoever sold them the headline.
Where do you think this goes from here?
#Bitcoin #BTC #MarketCap
6
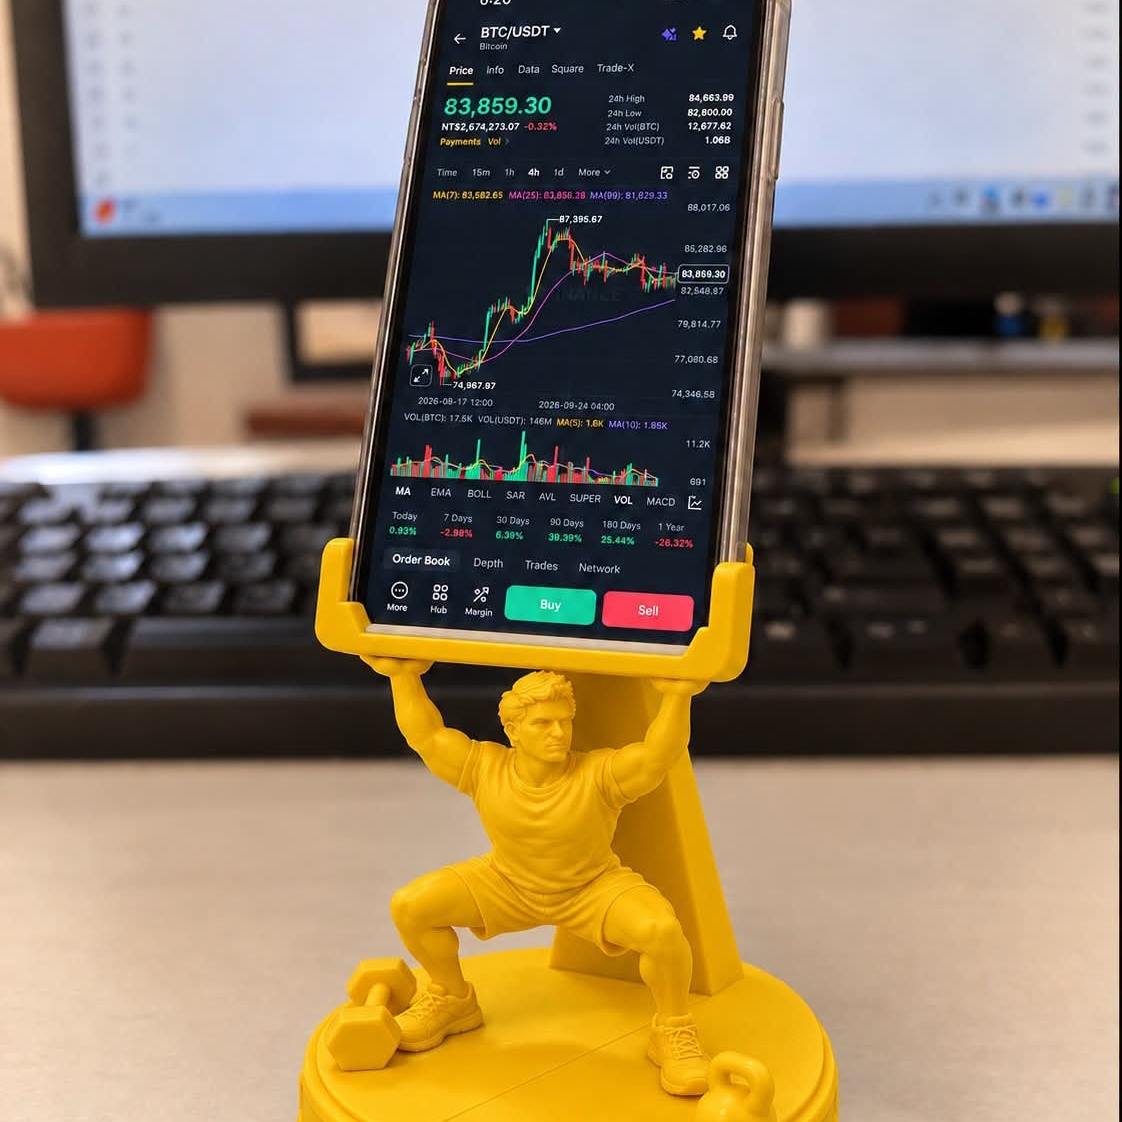
🔥 CRYPTO MARKET RECLAIMS $3T — BULLS ARE BACK? 🚀
After 3 consecutive quarters of decline, Q3 2026 delivered a powerful recovery! 📈
💰 +39.6% quarterly growth
📊 $840.1B added to market cap
🚀 September peak: $3.0T
📍 Q3 close: $2.96T
From July’s reported $2.1T low to a $3T September peak — crypto staged a major comeback!
But can the momentum survive Q4 volatility? 👀
Is $4T the next milestone, or will bears strike back? 🐂🐻
#Crypto #Bitcoin #MarketCap #CoinGecko #CryptoNews
$BTC $ETH $XRP
1
1
97

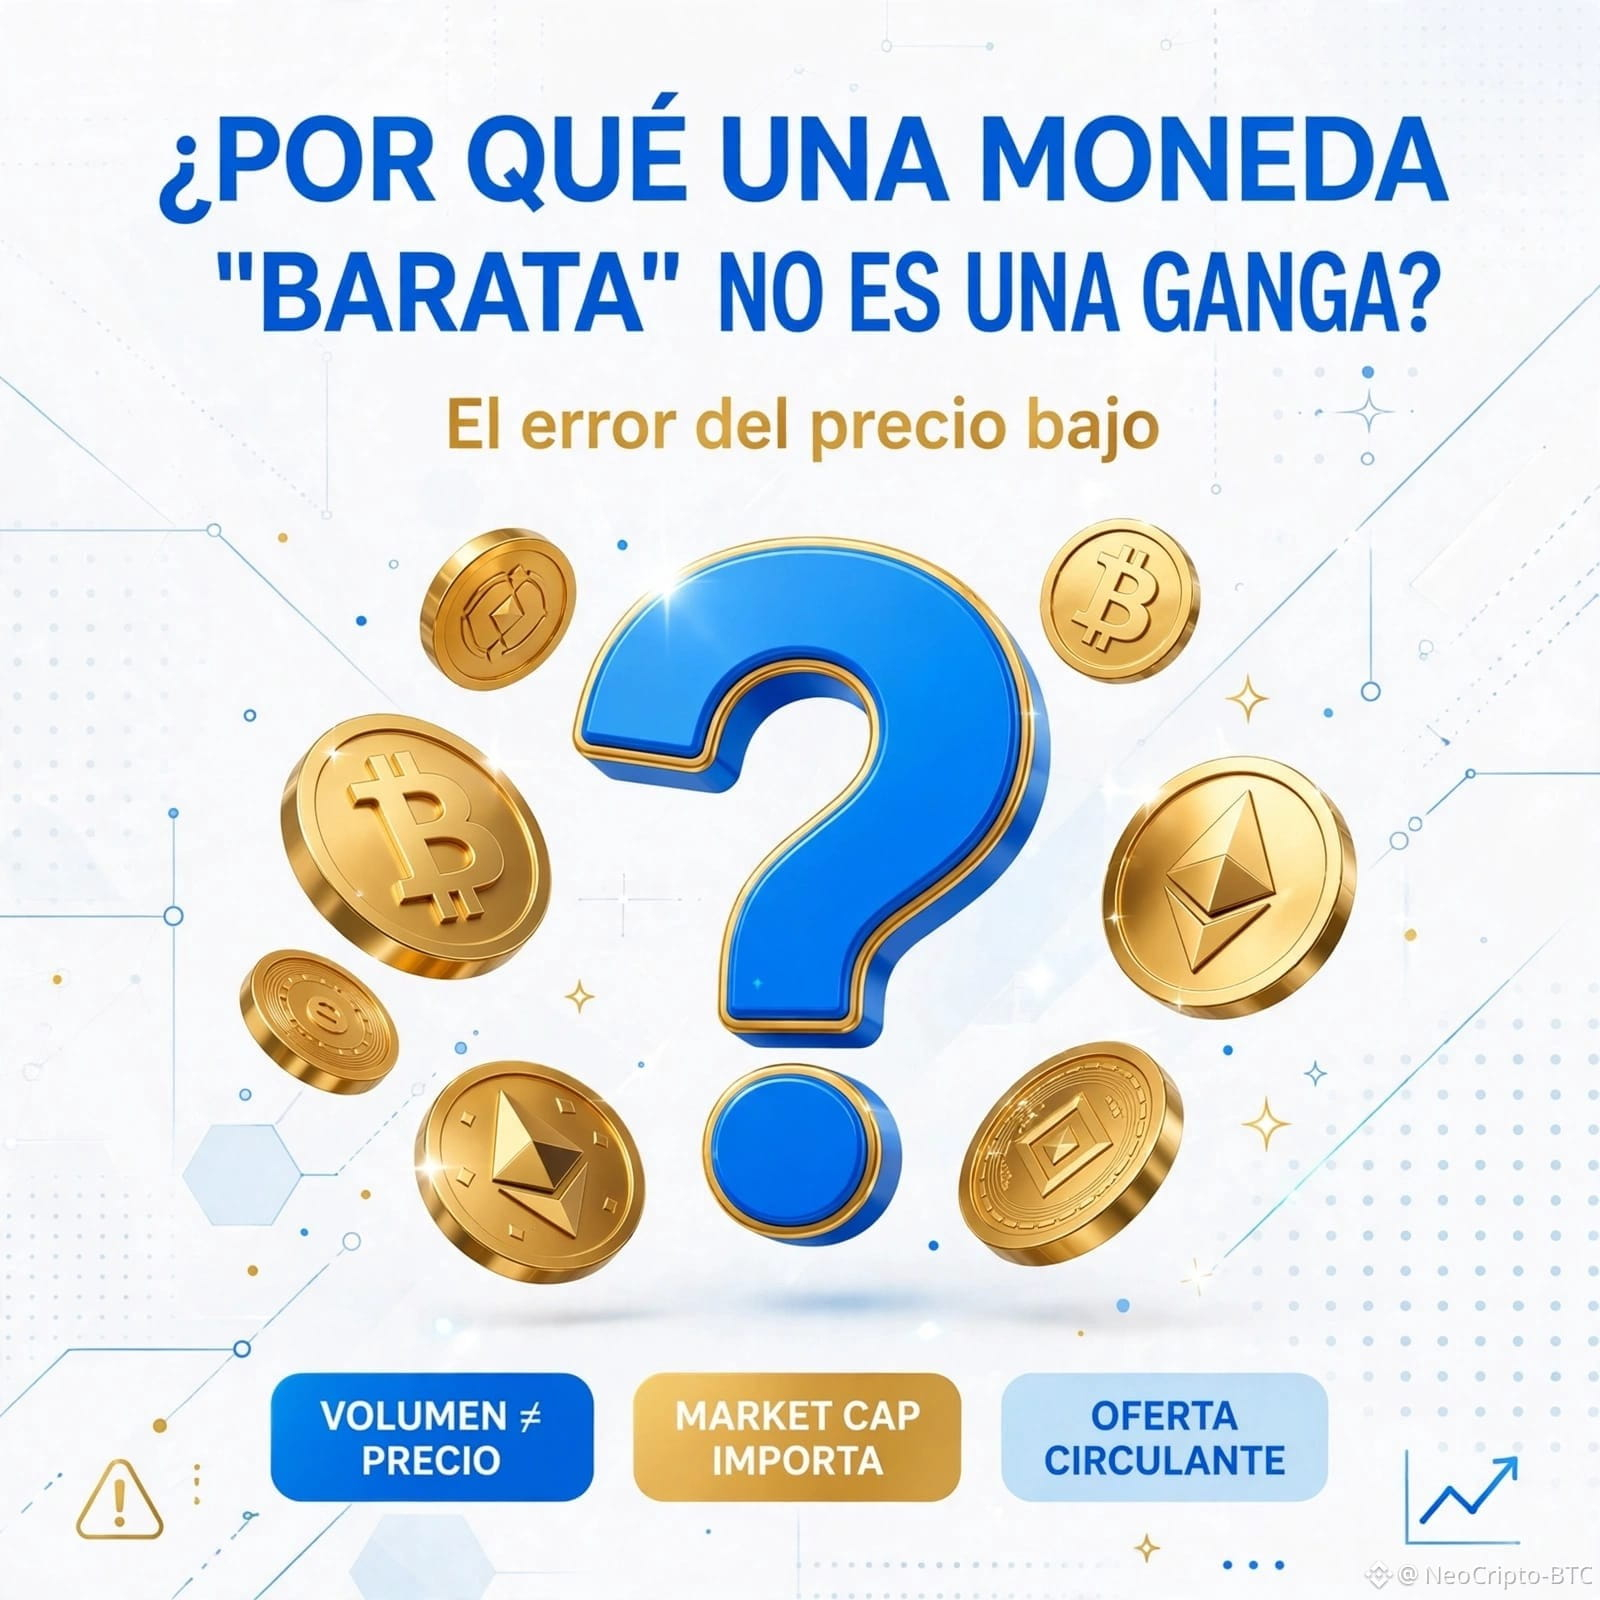
Por qué una moneda "barata" no es una ganga
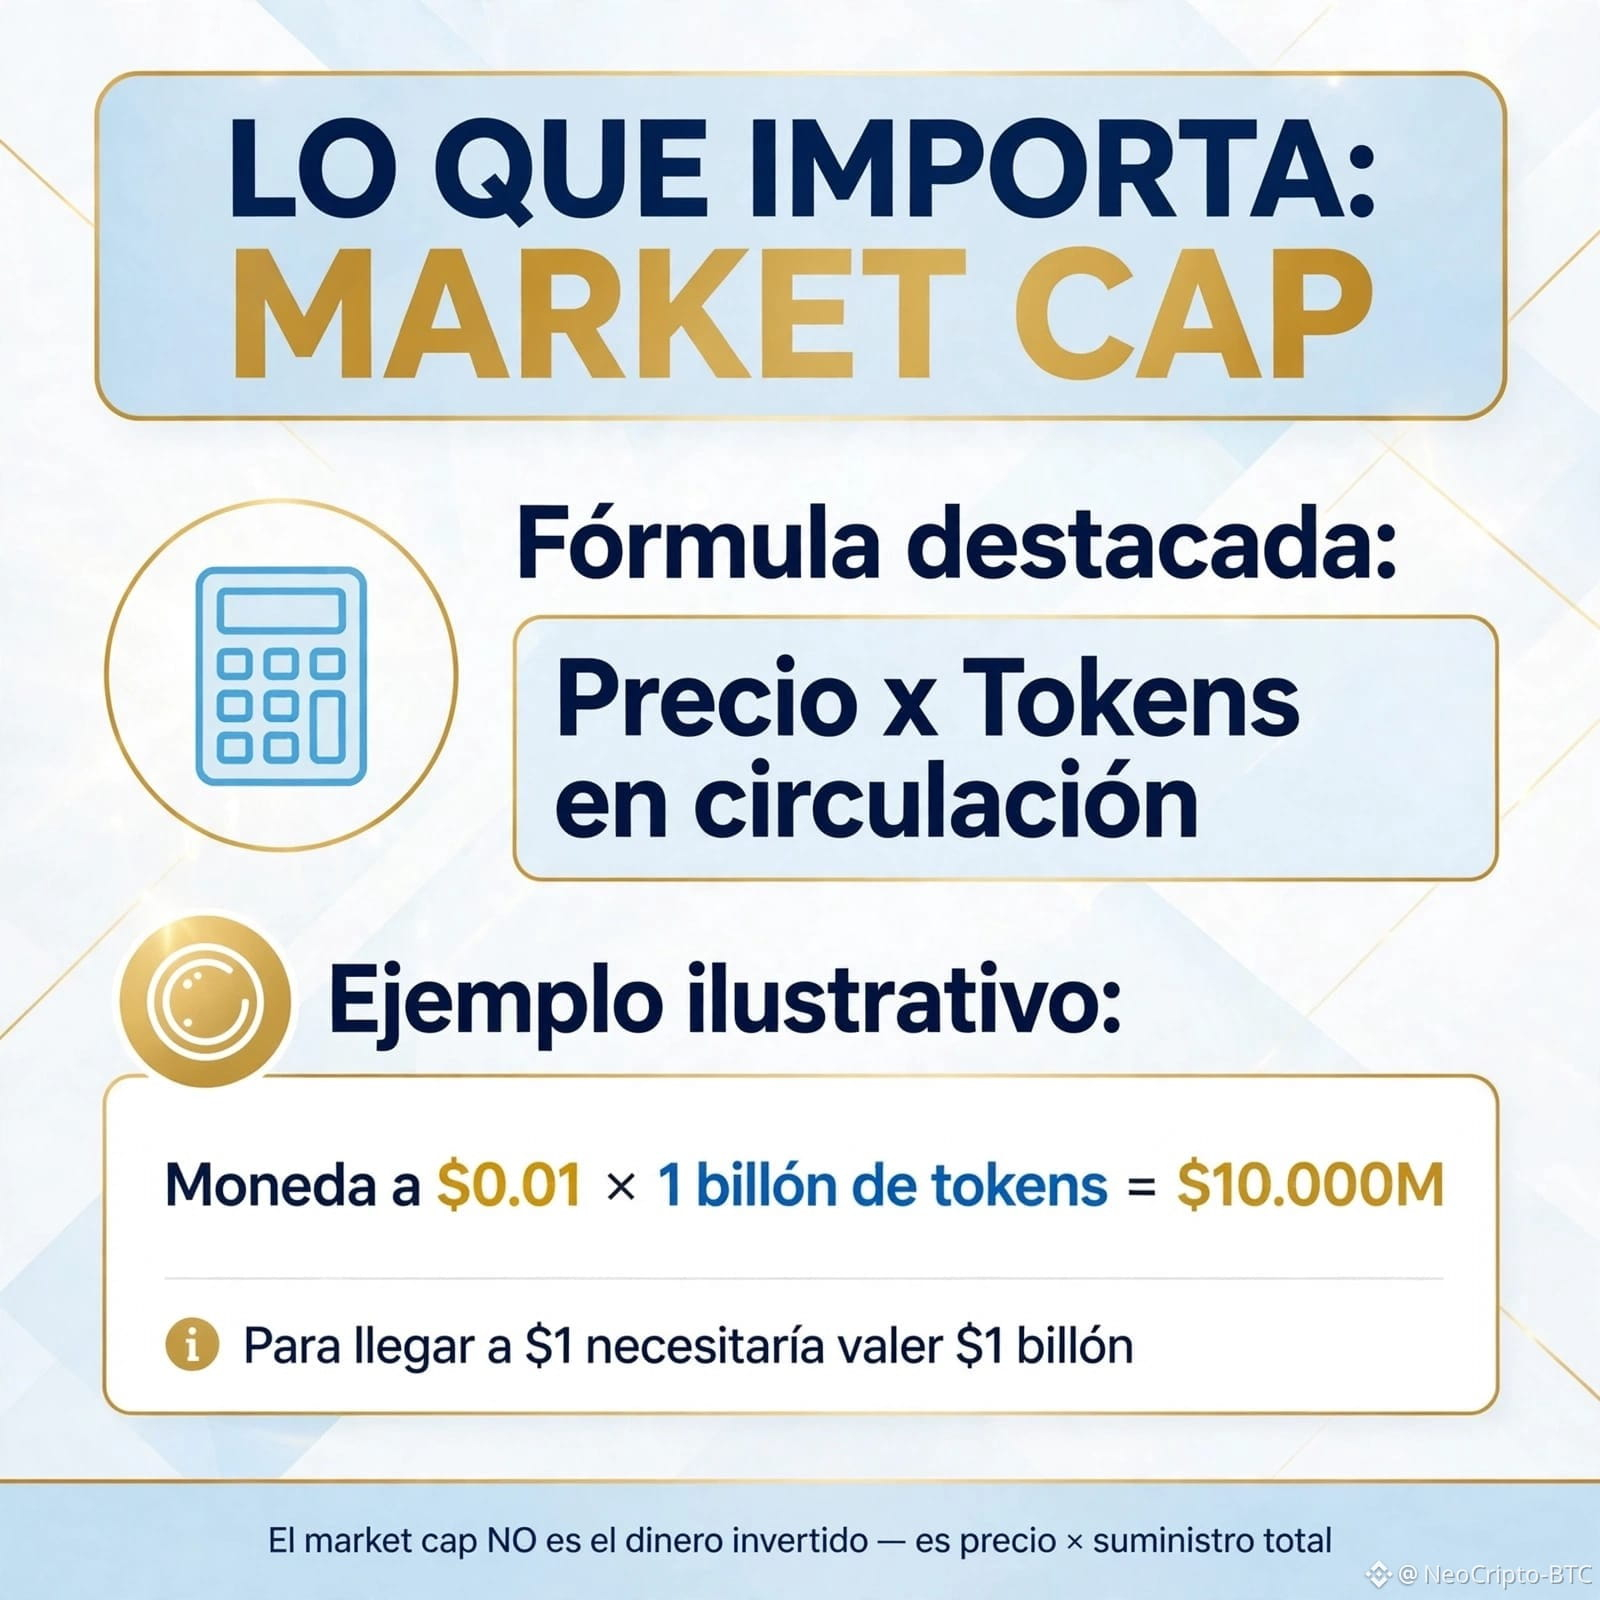
Error clásico de principiante: ver una moneda a $0.01 y pensar "está barata, si llega a $1 me hago millonario". Lo que importa no es el precio, es la capitalización de mercado: precio × tokens en circulación. Una moneda a $0.01 con un billón de tokens ya vale $10.000 millones — para llegar a $1 necesitaría valer $1 billón, más que el Bitcoin entero. Guarda este post antes de tu próxima compra. ¿Alguna vez compraste una moneda solo porque estaba "barata"? Comenta 👇
#marketcap
{spot}(BTCUSDT)
{spot}(NVDABUSDT)
{spot}(AAPLBUSDT)
Por qué una moneda "barata" no es una ganga
Error clásico de principiante: ver una moneda a $0.01 y pensar "está barata, si llega a $1 me hago millonario". Lo que importa no es el precio, es la capitalización de mercado: precio × tokens en circulación. Una moneda a $0.01 con un billón de tokens ya vale $10.000 millones — para llegar a $1 necesitaría valer $1 billón, más que el Bitcoin entero. Guarda este post antes de tu próxima compra. ¿Alguna vez compraste una moneda solo porque estaba "barata"? Comenta 👇
#marketcap
270
Войдите, чтобы посмотреть больше материала
Присоединяйтесь к пользователям криптовалют по всему миру на Binance Square
⚡️ Получайте новейшую и полезную информацию о криптоактивах.
💬 Нам доверяет крупнейшая в мире криптобиржа.
👍 Получите достоверные аналитические данные от верифицированных создателей контента.
Эл. почта/номер телефона
В тренде
1
#$1.5BInLeveragedCryptoBetsLiquidated
Просмотров: 85
17 обсуждают
2
#KOSPIFalls3.53%BackBelow6000
Просмотров: 1,187
61 обсуждают
3
#USMidtermElections
Просмотров: 98,544
1,287 обсуждают
4
#StrategySTRCReaches$99.95ForFirstTimeIn165Days
Просмотров: 1,554
48 обсуждают
5
#BinanceWillListPredictPREDICT
Просмотров: 19,956
511 обсуждают
6
#SwitzerlandFirstSpotBitcoinETFExpectedToTradeInNovember
Просмотров: 1,107
60 обсуждают
7
#StrategyReports$21BQ3OperatingProfit
Просмотров: 1,124
40 обсуждают
8
#TwoAddressesHoldingAbout1.28BUSDTFrozen
Просмотров: 9,070
278 обсуждают
9
#FirstDigitalBlacklistsAttackerAddressHoldingAbout3.4MFDUSD
Просмотров: 376
14 обсуждают
10
#BitcoinDropsBelow$80K
Просмотров: 66,300
165 обсуждают