

#grt
grt
Просмотров: 1.6M
3,618 обсуждают
Популярные
Новые


·
--
Падение
$GRT VOLUME EXPLODES 4.3X AS PRICE JUMPS 3.2% — BEARISH REVERSAL OR JUST A LIQUIDITY TRAP?
$GRT has recorded a sharp 3.2% move in just 15 minutes, accompanied by a massive 4.3x volume spike. But the bigger picture tells a different story. Is this genuine buying pressure, or simply a temporary liquidity squeeze before another move lower?
Market Structure: Bearish
My bias remains bearish because the 1H and daily charts continue to show Lower Highs and Lower Lows, while BTC is also under bearish pressure.
The declining Open Interest and seller-leaning taker flow suggest that the recent price surge may be driven more by short-term liquidity activity than sustained buying demand.
Key Resistance Zones
- $0.02142
- $0.02161–$0.02183
- Major invalidation: $0.02275
Potential Short Entry:
I am watching the $0.02142–$0.02183 resistance zone for a rejection. Another possibility is a liquidity sweep above $0.02275 followed by a failed reclaim.
However, I want confirmation through a 1H bearish engulfing candle, rejection wick, or lower-timeframe bearish market-structure shift before considering an entry.
Downside Targets
- TP1: $0.02091
- TP2: $0.01907
- TP3: $0.01879
Derivatives & Market Flow
- Open Interest: $2.8M (-11.4% in 24H)
- Funding Rate: -0.0403%
- Taker Buy/Sell Ratio: 0.93x
What Would Change My Bias?
A confirmed 1H candle close above $0.02275 would invalidate this bearish setup and shift my attention toward a potential bullish reversal.
My strategy is simple: No chasing green candles, no emotional entries, and no trades without confirmation.
The weekly structure is still bullish, so this remains a bearish setup against the higher-timeframe trend. Risk management comes first.
Not financial advice. Educational technical analysis only.
#GRT #CryptoTrading #TechnicalAnalysis #Altcoins #BinanceSquare
{future}(GRTUSDT)
$GRT VOLUME EXPLODES 4.3X AS PRICE JUMPS 3.2% — BEARISH REVERSAL OR JUST A LIQUIDITY TRAP?
$GRT has recorded a sharp 3.2% move in just 15 minutes, accompanied by a massive 4.3x volume spike. But the bigger picture tells a different story. Is this genuine buying pressure, or simply a temporary liquidity squeeze before another move lower?
Market Structure: Bearish
My bias remains bearish because the 1H and daily charts continue to show Lower Highs and Lower Lows, while BTC is also under bearish pressure.
The declining Open Interest and seller-leaning taker flow suggest that the recent price surge may be driven more by short-term liquidity activity than sustained buying demand.
Key Resistance Zones
- $0.02142
- $0.02161–$0.02183
- Major invalidation: $0.02275
Potential Short Entry:
I am watching the $0.02142–$0.02183 resistance zone for a rejection. Another possibility is a liquidity sweep above $0.02275 followed by a failed reclaim.
However, I want confirmation through a 1H bearish engulfing candle, rejection wick, or lower-timeframe bearish market-structure shift before considering an entry.
Downside Targets
- TP1: $0.02091
- TP2: $0.01907
- TP3: $0.01879
Derivatives & Market Flow
- Open Interest: $2.8M (-11.4% in 24H)
- Funding Rate: -0.0403%
- Taker Buy/Sell Ratio: 0.93x
What Would Change My Bias?
A confirmed 1H candle close above $0.02275 would invalidate this bearish setup and shift my attention toward a potential bullish reversal.
My strategy is simple: No chasing green candles, no emotional entries, and no trades without confirmation.
The weekly structure is still bullish, so this remains a bearish setup against the higher-timeframe trend. Risk management comes first.
Not financial advice. Educational technical analysis only.
#GRT #CryptoTrading #TechnicalAnalysis #Altcoins #BinanceSquare
51


·
--
📊 GRT – توصية تداول
🟢 LONG – مراقبة الدخول
السعر الحالي: 0.02099
التحليل: ارتفاع حجم التداول بنسبة 616.1% مع صعود السعر 2.1% يشير إلى دخول سيولة ونشاط شرائي ملحوظ بعد تراجع العملة 7.5% خلال 24 ساعة. قد يكون بداية ارتداد، لكن يجب مراقبة استمرار ضغط المشترين.
🎯 الأهداف:
* الهدف الأول: 0.0218
* الهدف الثاني: 0.0226
* الهدف الثالث: 0.0235
🛑 وقف الخسارة: 0.0202
🔥 ابحث عن الفرص
$GRT #GRT
1
40

·
--
📊 GRT – توصية تداول
🔴 SHORT – تصحيح محتمل
السعر الحالي: 0.02126
التحليل: مؤشر RSI عند 70 على إطار 30 دقيقة، ما يشير إلى دخول منطقة التشبع الشرائي واحتمال حدوث جني أرباح أو تصحيح هبوطي. يُفضّل انتظار تأكيد ضعف الزخم قبل الدخول.
🎯 الأهداف:
* الهدف الأول: 0.02090
* الهدف الثاني: 0.02050
* الهدف الثالث: 0.02000
🛑 وقف الخسارة: 0.02165
⚠️ التشبع الشرائي لا يعني هبوطًا مؤكدًا.
🔥 ابحث عن الفرص
$GRT #GRT
77

·
--
#GRT $GRT Lo más visible de GRTUSDT puede empujar a una conclusión rápida; el gráfico puede contar una historia distinta. Después de -11.82% en 24h, GRTUSDT cotiza alrededor de 0.01909 y el mínimo del periodo está en 0.019. Una cifra mueve la mirada; precio, volumen y estructura construyen la lectura completa. Para un inversionista, la pregunta no es si la narrativa de GRT suena bien, sino si esa utilidad empieza a traducirse en demanda del token, liquidez y respuesta del precio; si el mercado no la reconoce, la tesis pierde fuerza. $GRT La distancia desde ese mínimo es de aproximadamente 0.47%, con 6.5M USDT de volumen. Es una lectura de ubicación y presión; la próxima dirección sigue sin estar confirmada. La primera impresión viene del porcentaje; la segunda, de dónde está el precio y cuánto volumen acompaña el movimiento. ¿Qué confirmación del gráfico justificaría una entrada y qué movimiento obligaría a descartarla? $GRT #Nomadacripto #trading #TrendingTopic · Nómada
#GRT $GRT Lo más visible de GRTUSDT puede empujar a una conclusión rápida; el gráfico puede contar una historia distinta. Después de -11.82% en 24h, GRTUSDT cotiza alrededor de 0.01909 y el mínimo del periodo está en 0.019. Una cifra mueve la mirada; precio, volumen y estructura construyen la lectura completa. Para un inversionista, la pregunta no es si la narrativa de GRT suena bien, sino si esa utilidad empieza a traducirse en demanda del token, liquidez y respuesta del precio; si el mercado no la reconoce, la tesis pierde fuerza. $GRT La distancia desde ese mínimo es de aproximadamente 0.47%, con 6.5M USDT de volumen. Es una lectura de ubicación y presión; la próxima dirección sigue sin estar confirmada. La primera impresión viene del porcentaje; la segunda, de dónde está el precio y cuánto volumen acompaña el movimiento. ¿Qué confirmación del gráfico justificaría una entrada y qué movimiento obligaría a descartarla? $GRT #Nomadacripto #trading #TrendingTopic · Nómada
2
212

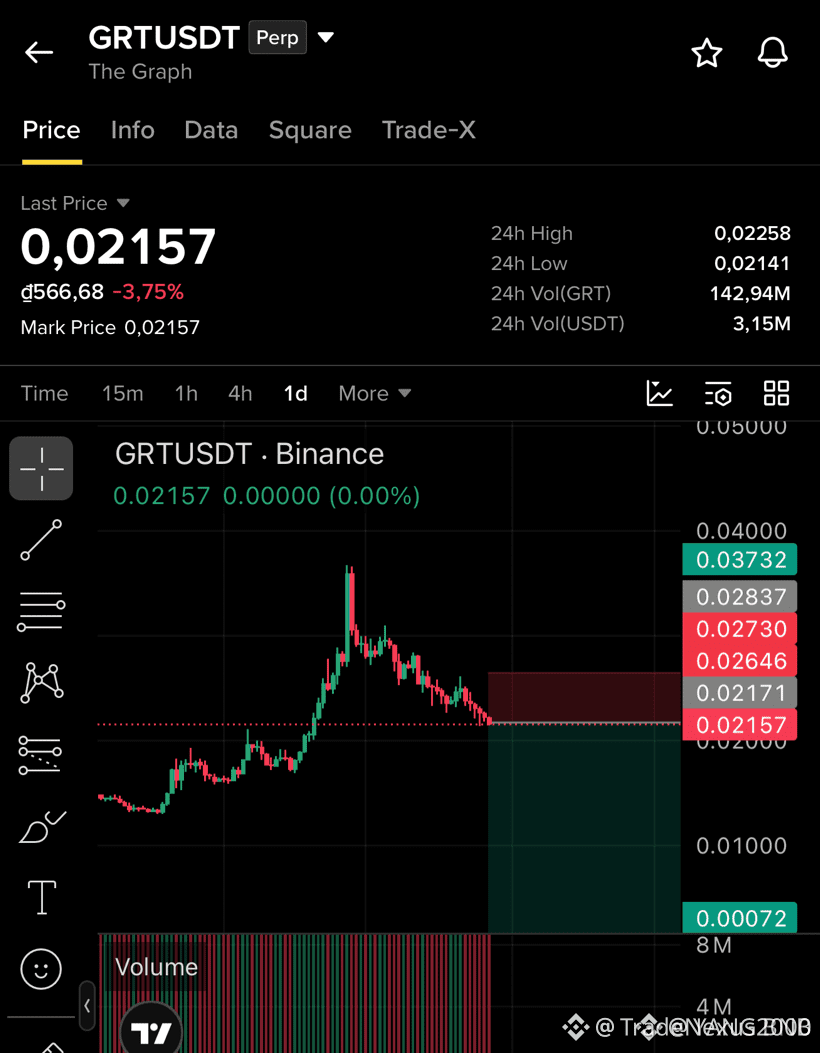
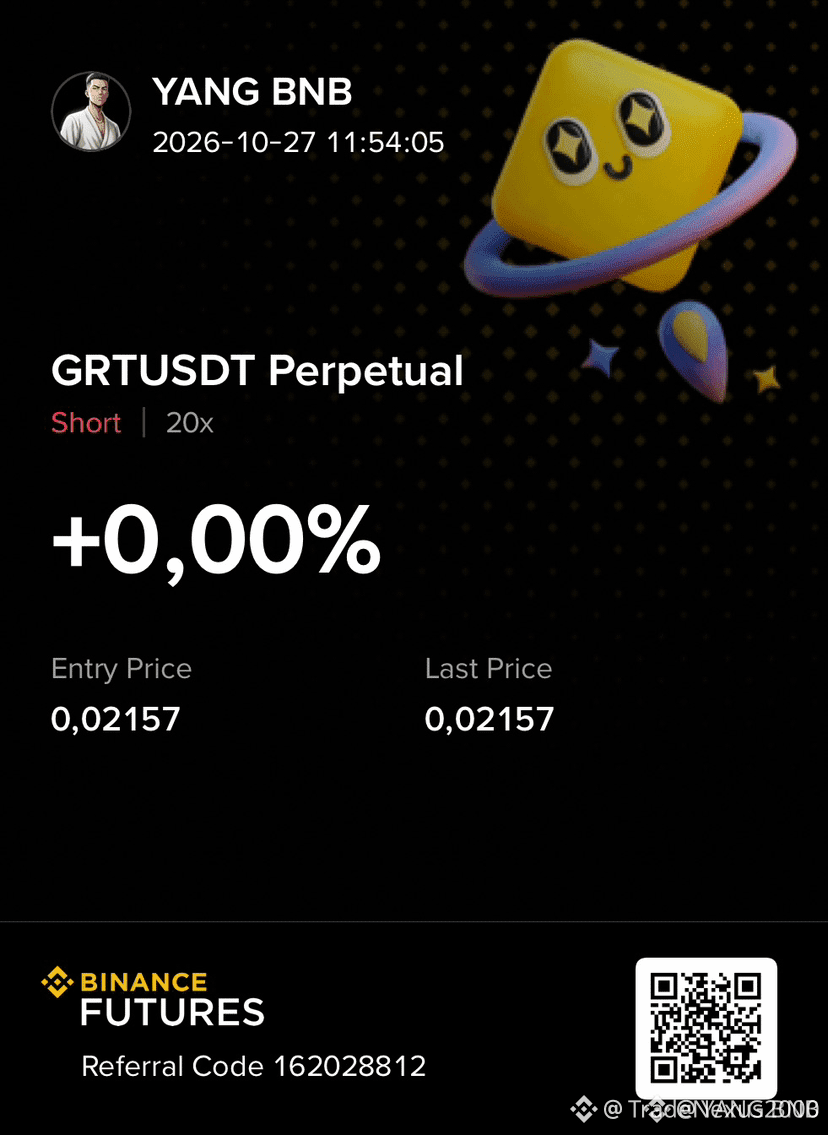
🔴 $GRT BEARS CHARGING THROUGH REJECTION ZONE! 💥
Entry: 0.0215-0.0220 ⚡
Target: 0.0190 / 0.0160 / 0.0120 🚀
Stop Loss: 0.02646 ⚠️
📊 The recent bounce off the $0.0350‑$0.0370 ceiling left a fresh liquidity pool in its wake, and the market is now carving lower highs with surgical precision. 🔍 Each failed attempt to reclaim that zone signals institutional short pressure, turning the 0.0215 support into a high‑probability demand block. 🌊 Should price pierce this level, the cascade toward the TP cluster aligns with classic smart‑money liquidity sweeps.
💬 Do you see the next wave of shorts loading up below the 0.0215 threshold? 👇
⚠️ Not financial advice. Always manage your risk. 🛡️
🏷️ #GRT #ShortSetup #Bearish #Crypto
🔴 🦈
6

·
--
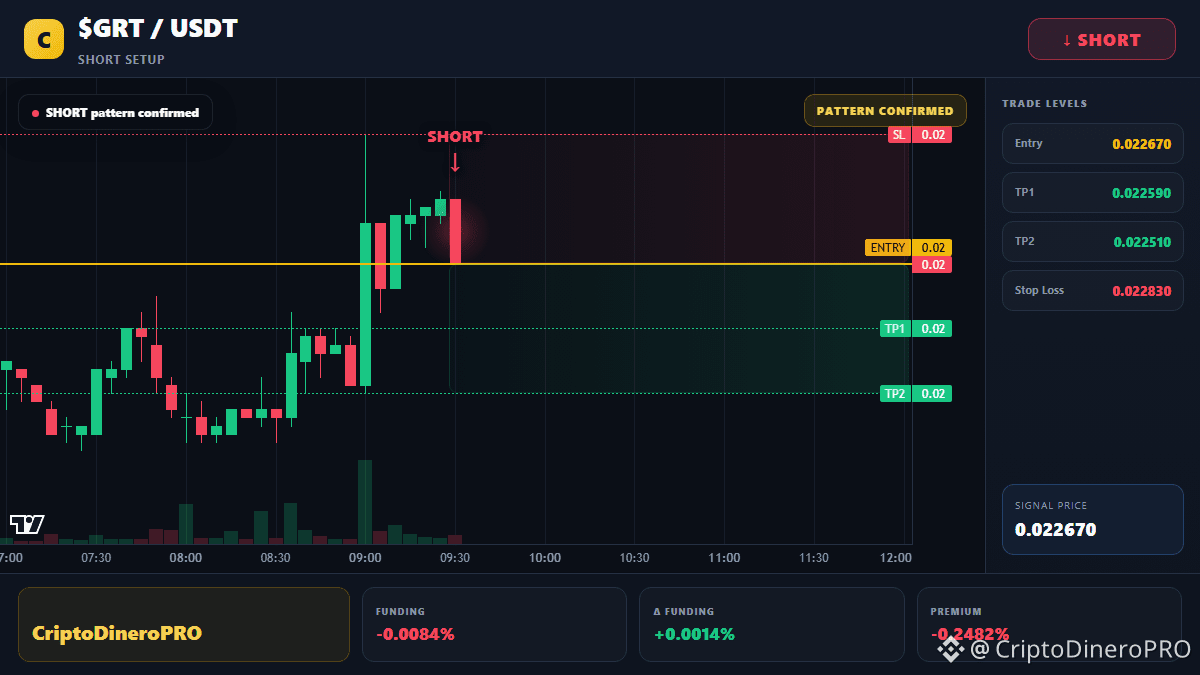
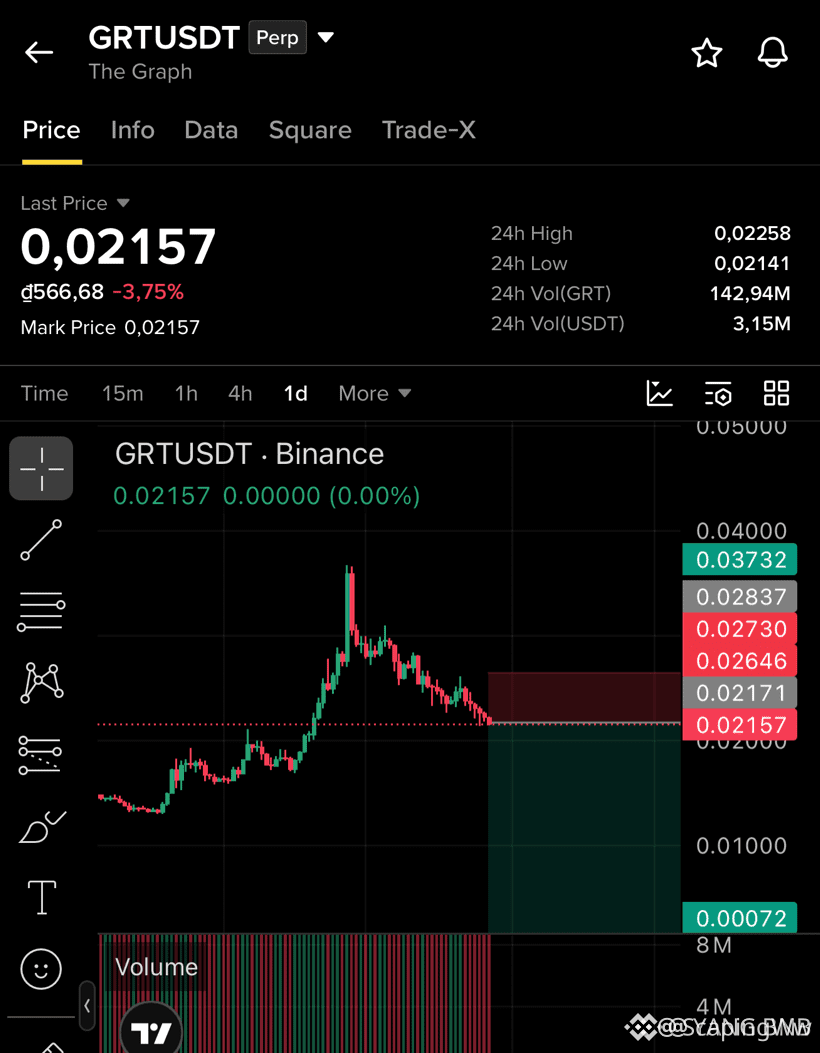
🚨 $GRT BEARISH BREAKDOWN AFTER RESISTANCE REJECTION! 📉
Entry: 0.0215-0.0220 ⚡
Target: 0.0190 🚀
Target: 0.0160 🚀
Target: 0.0120 🚀
Stop Loss: 0.02646 ⚠️
The bears have seized control as $GRT was spurned from the $0.0350‑$0.0370 ceiling, carving fresh lower highs 📊. Liquidity is draining into the $0.0215 support pocket, a classic smart‑money trap that forces shorts to flood in 🦈⚡. Volume spikes and a bearish divergence on the 4H RSI cement the down‑trend, making the sell‑side momentum hard to ignore 📉.
💬 Are you loading the short at the 0.0215 zone or waiting for the next liquidity sweep? 👇
⚠️ Not financial advice. Always manage your risk. 🛡️
🏷️ #GRT #ShortSetup #Bearish #Crypto
🦈 🔥
15


·
--
Статья
GRT费率正负拧着,多头账户六成四却先爆币安费率收到负、OKX却还在正——GRT两边拧着,账户多头却占到约六成四;近一天清算几乎全砸多头,多头约35520美金、空头约26刀,清差拉开到约1377倍。
币安约 0.02239000 美元(-2.1840%),OKX 约 0.02240000 美元(-2.1834%)。24小时多头清算约35520、空头约26,合计约35545、44笔。持仓量币安约301万、OKX约67万;账户多空约64.3%/35.6%。币安费率约-0.000370、OKX约+0.000020,正负拧反。
费率方向都拧着、账户还偏多,被扫掉的却几乎全是多单——更像结构上偏多杠杆先被点名,而不是空头主导的对倒。
#GRT #资金费率 #多空比 #持仓量
费率一边负一边正、多头账户约六成四——清多却被拉开到约1377倍,是费率在报警还是仓位更先露馅?
实时查看:https://www.coinboss.com/currencies/GRT
GRT费率正负拧着,多头账户六成四却先爆
币安费率收到负、OKX却还在正——GRT两边拧着,账户多头却占到约六成四;近一天清算几乎全砸多头,多头约35520美金、空头约26刀,清差拉开到约1377倍。
币安约 0.02239000 美元(-2.1840%),OKX 约 0.02240000 美元(-2.1834%)。24小时多头清算约35520、空头约26,合计约35545、44笔。持仓量币安约301万、OKX约67万;账户多空约64.3%/35.6%。币安费率约-0.000370、OKX约+0.000020,正负拧反。
费率方向都拧着、账户还偏多,被扫掉的却几乎全是多单——更像结构上偏多杠杆先被点名,而不是空头主导的对倒。
#GRT #资金费率 #多空比 #持仓量
费率一边负一边正、多头账户约六成四——清多却被拉开到约1377倍,是费率在报警还是仓位更先露馅?
实时查看:https://www.coinboss.com/currencies/GRT
3


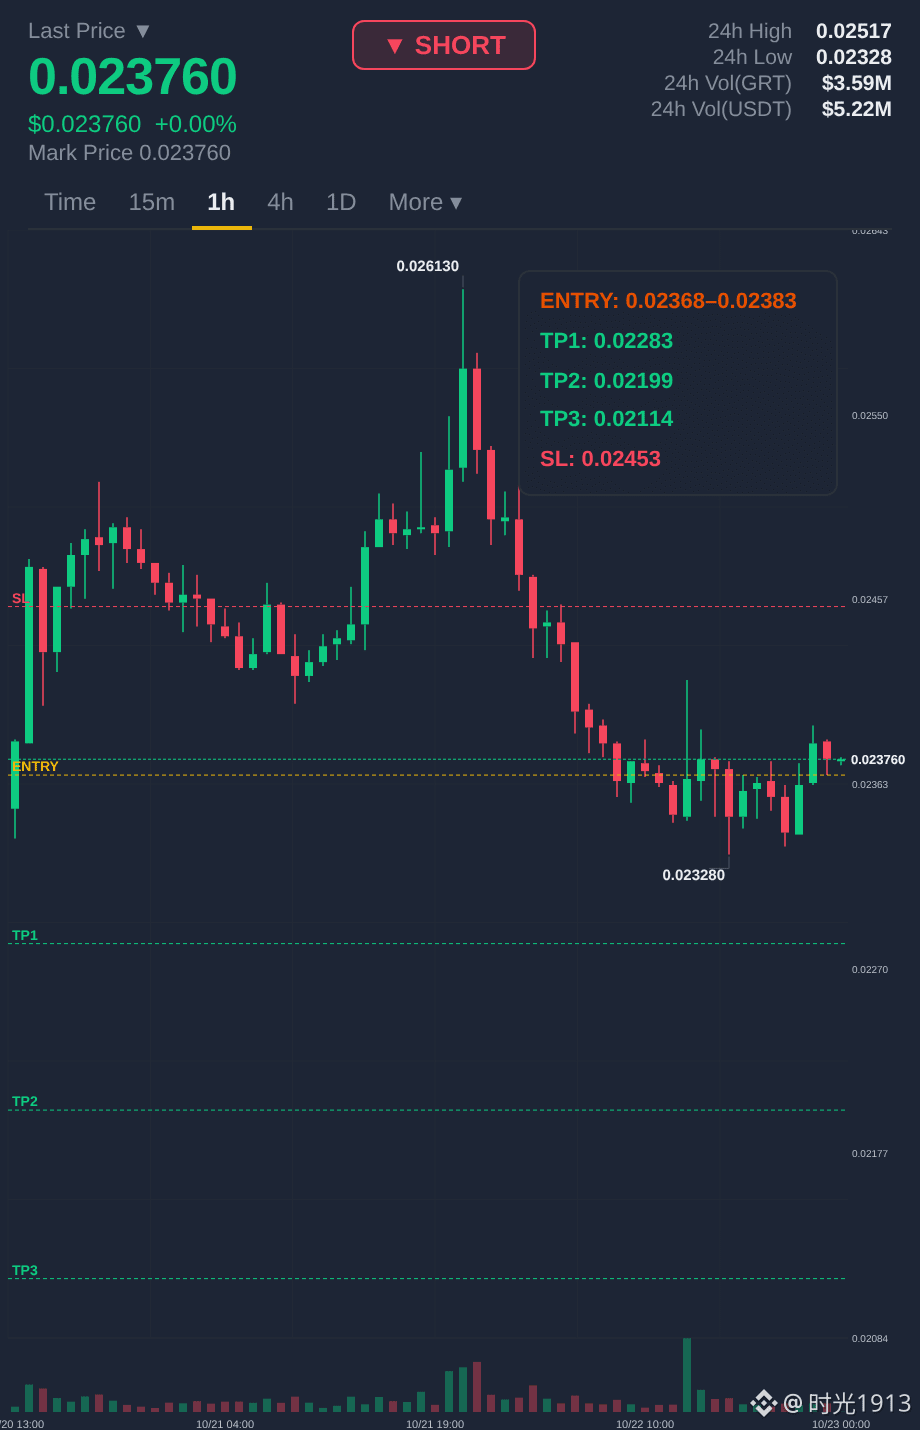

$GRT SLICES THROUGH 0.0190 RESISTANCE WITH EXPLOSIVE BULLISH MOMENTUM! 💥⚡
Entry: 0.01920 - 0.01955 ⚡
Target: 0.02070 🚀
Stop Loss: 0.01870 ⚠️
📌 Buyers just smashed through the critical 0.0190 resistance cap, flipping a heavy supply zone into an active bid floor. Momentum is accelerating quickly as aggressive order flow sweeps up remaining seller liquidity above the breakout trigger.
📊 With volume expanding rapidly on short timeframes, holding structural support opens a clean runway toward our upper target expansion zones. 💡 Risk-to-reward is dialed in tightly with invalidation anchored just below the breakout origin. 💬 Are you bidding this breakout momentum directly or waiting for a retest? 👇
⚠️ Not financial advice. Always manage your risk. 🛡️
🏷️ #GRT #Breakout #Crypto #Altcoins #Trading
🚀 ⚡
13

$GRT MOMENTUM RE-IGNITES AS BUYERS SEIZE CONTROL OF THE TAPE! ⚡ 🐂
Buyers are taking the steering wheel on $GRT as fresh momentum surges across key order flow channels. 📊 Accumulation is stepping up, showing classic signs of structural expansion while ecosystem plays like $ARB and $UAI start catching a secondary bid.
When order books start tilting like this after a quiet compression phase, momentum traders jump on the train before retail even notices the breakout. ⚡ Capital is clearly shifting toward high-beta utility assets with real volume behind them. 💬 Are you riding this momentum wave on $GRT right now or waiting for a pull-back retest? 👇
⚠️ Not financial advice. Always manage your risk. 🛡️
🏷️ #GRT #ARB #UAI #Momentum #Crypto
🔥 💎
22
💥 $GRT PREPARES FOR BREAKOUT AS BUYERS FLIP KEY DEMAND ZONE! 🐂
Entry: 0.01920 - 0.01965 ⚡
Target: 0.02000 / 0.02030 / 0.02060 🚀
Stop Loss: 0.01870 ⚠️
📌 Smart money is quietly absorbing sell-side liquidity at the lower boundary, building a solid base for the next upward expansion. 📊 Buyers are stepping in to defend this demand block aggressively, opening up a pristine risk-to-reward ratio as market structure shifts bullish.
💡 As momentum spreads across key setups like $ZEC and $BULLA , current order flow signals that sellers are completely running out of ammo. 💬 Are you bidding inside this accumulation pocket or waiting for the breakout confirmation? 👇
⚠️ Not financial advice. Always manage your risk. 🛡️
🏷️ #GRT #LongSetup #Crypto #Altcoins #Trading
🔥 💎
17

·
--
🚨 $GRT SLAMS THROUGH RESISTANCE AS MOMENTUM BUYERS STEP IN FOR THE EXTENSION! ⚡
Entry: 0.0198 - 0.0200 ⚡
Target: 0.0205 - 0.0220 🚀
Stop Loss: 0.0185 ⚠️
$GRT has cleanly flipped a key overhead resistance zone into high-conviction support, confirming buyers are aggressive on dips. 📊 Order flow shows steady accumulation as market participants absorb sell-side liquidity at these retest levels.
Momentum across high-beta alts is rotating fast, with privacy heavyweights like $ZEC aiming for $2k and $DASH charging toward $100. ⚡ When structural reclaims align across multiple sectors, expansion phases tend to follow with swift execution.
💡 As long as support holds firm above the stop, the path of least resistance points toward overhead expansion. 💬 Are you bidding this breakout retest or waiting for higher confirmation? 👇
⚠️ Not financial advice. Always manage your risk. 🛡️
🏷️ #GRT #LongSetup #Breakout #Altcoins #Crypto
🔥 ⚡
19
⚡ $GRT ACCELERATES PAST $0.020 AS BULLS UNLEASH NEXT MOMENTUM LEG! 🚀
Target: 0.0212 🚀
Bulls just sliced through the $0.020 level with fierce conviction, locking in our first profit target at $0.0205 as buying volume accelerates. 📊 Order flow reveals aggressive market orders absorbing sell-side liquidity, paving a clean path for upside continuation. ⚡
We are locking in gains and letting remaining positions run toward higher supply zones. 📌 Strategic positioning pays off when momentum aligns with strong market structure. 💡
💬 Are you holding your runners for $0.0212 or securing gains early here? 👇
⚠️ Not financial advice. Always manage your risk. 🛡️
🏷️ #GRT #Altcoins #Breakout #Crypto
🔥 💎
12
·
--
🚨 $GRT SLAMS DIRECTLY INTO HEAVY RESISTANCE AS MARKET MAKERS PREPARE TO DUMP! 📉
Entry: 0.02060 - 0.02085 ⚡
Target: 0.01900 - 0.01620 🎯
Stop Loss: 0.02170 ⚠️
📌 $GRT pushed hard into a structural brick wall, and smart money is already capping the upside. 🦈 Buying volume is completely fading out, leaving overextended breakout chasers trapped right at this high-timeframe supply block.
📉 Order flow shows sellers taking aggressive control to sweep the downside liquidity pools. 💬 Are you positioning short here or waiting for support to crack first? 👇
⚠️ Not financial advice. Always manage your risk. 🛡️
🏷️ #GRT #ShortSetup #Crypto #MarketAnalysis
📉 🦈
18
·
--
🔻 $GRT FAILS AT RESISTANCE AS SELLERS HEAVILY ABSORB BUYING PRESSURE! 🚨
Entry: 0.01987 - 0.0205 ⚡
Target: 0.0198 - 0.0182 🎯
Stop Loss: 0.0218 ⚠️
The distribution structure on $GRT is getting ugly for bulls as buyers run out of steam right into this critical supply zone. 📉 Order flow shows heavy overhead selling absorbing every minor pump attempt, setting up a prime environment for downside expansion. 🔍
Smart money is clearly preparing for a liquidity sweep below recent lows once this support shelf gives out. 📊 If sellers keep pressing this level, expect momentum to accelerate fast towards our lower targets. 💬 Are you capitalizing on this weakness or holding out for a deeper pullback? 👇
⚠️ Not financial advice. Always manage your risk. 🛡️
🏷️ #GRT #ShortSetup #Altcoins #CryptoTrading
🐻 🔻
28

🔍 The Graph (GRT): Powering the Future of Web3 Data! 🚀
The Graph is a decentralized protocol that helps applications access and organize blockchain data. Reliable data infrastructure plays an important role in building the next generation of Web3.
💡 Can decentralized data become even more important in the future?
What do you think about GRT? Share your thoughts below! 👇
#TheGraph #GRT #Web3 #Blockchain #BinanceSquare

171
Войдите, чтобы посмотреть больше материала
Присоединяйтесь к пользователям криптовалют по всему миру на Binance Square
⚡️ Получайте новейшую и полезную информацию о криптоактивах.
💬 Нам доверяет крупнейшая в мире криптобиржа.
👍 Получите достоверные аналитические данные от верифицированных создателей контента.
Эл. почта/номер телефона
В тренде
1
#UniswapA16zSeekDeFiExemptionFromIllinoisCryptoTax
Просмотров: 15,403
611 обсуждают
2
#HKDollarStablecoinHKDAPToLaunchOnSolana
Просмотров: 10,005
363 обсуждают
3
#$1.5BInLeveragedCryptoBetsLiquidated
Просмотров: 26,859
224 обсуждают
4
#TrezorSaysCryptoBilisSoldWalletMayContainMaliciousComponents
Просмотров: 1,662
52 обсуждают
5
#KOSPIFalls3.53%BackBelow6000
Просмотров: 52,836
1,009 обсуждают
6
#AmazonSharesFallAbout7%InPremarketTrading
Просмотров: 23,693
534 обсуждают
7
#USMidtermElections
Просмотров: 213,471
2,276 обсуждают
8
#StrategySTRCReaches$99.95ForFirstTimeIn165Days
Просмотров: 16,149
92 обсуждают
9
#BinanceWillListPredictPREDICT
Просмотров: 78,665
1,317 обсуждают
10
#SwitzerlandFirstSpotBitcoinETFExpectedToTradeInNovember
Просмотров: 2,697
104 обсуждают