
The Cryptonomist
18.5k Публикации

The Cryptonomist
 Square Verified+
Отправить жалобу
Заблокировать пользователя
0 подписок(и/а)
38.1K+ подписчиков(а)
22.6K+ понравилось
1 Значки
Посты
Статья
Strategy’s Bitcoin purchase lifts holdings to 846,000 coins amid $86K rallyMichael Saylor’s company is buying Bitcoin again, and the timing says a lot about where the market’s head is right now. Strategy, the software firm turned corporate crypto vehicle, made its first Bitcoin purchase in roughly three weeks last week, snapping up 950 coins for nearly $76 million. The move lands squarely inside a broader Strategy Bitcoin purchase pattern that has defined the company for years, but this one comes at a curious moment: a month that has historically been rough for the cryptocurrency, yet Bitcoin is climbing anyway.
Key takeaways
Strategy bought 950 Bitcoin for nearly $76 million last week, lifting its total holdings to 846,000 Bitcoin, or about 4% of the total supply.
Bitcoin surged more than 6% in 24 hours to nearly $86,000, pushing Strategy shares up almost 9% to $167.
The company also spent $174 million repurchasing its preferred shares, known as STRC, cutting its future dividend obligations.
Bitcoin had fallen as low as $58,000 in June, down 53% from its $125,000 peak last October, before this recovery began.
Strategy sold Bitcoin four separate times over the past four months before returning to buying as the price rebounded.
Strategy Resumes Bitcoin Buying
Strategy‘s latest disclosure shows the world’s largest corporate Bitcoin holder is back on offense after a brief pause. The company’s newest Strategy Bitcoin purchase — 950 coins worth close to $76 million — was its first acquisition in about three weeks, according to its financial filing. That single move pushed the firm’s total stash to 846,000 Bitcoin, a figure that now represents roughly 4% of all the Bitcoin that will ever exist.
Recent Bitcoin Purchase Details
The purchase itself wasn’t huge by Strategy’s historical standards. But it arrived at a telling moment, right as Bitcoin jumped more than 6% in 24 hours to trade near $86,000. That price action, paired with the company’s own buying, created a feedback loop of sorts: investors watched Bitcoin climb, then watched Strategy step back into the market, and reacted accordingly.
Bitcoin Holdings and Market Impact
Strategy shares jumped nearly 9% to $167 on the news. Part of that rally traces directly to Bitcoin’s price surge, since Strategy’s stock has effectively become a proxy for the cryptocurrency given how much of it the company holds. But the stock pop also had a second driver, one tied to the company’s balance sheet rather than the crypto market itself.
Preferred Shares Repurchase and Financial Maneuvers
Strategy didn’t just buy Bitcoin — it also bought back its own preferred shares, spending $174 million to repurchase STRC, the dividend-paying instrument it created last year specifically to raise cash for more Bitcoin purchases.
STRC Buyback Impact on Strategy’s Finances
The STRC repurchase matters beyond the immediate stock bump. By buying back these preferred shares, Strategy trims its future dividend payments to outside investors, freeing up more room on its books. Michael Saylor’s company built STRC as a funding mechanism during Bitcoin’s downturn, using it to keep accumulating coins even when the market wasn’t cooperating. Reducing that obligation now, while Bitcoin is climbing, suggests the company is managing its capital structure alongside its crypto strategy rather than treating the two as separate tracks.
Bitcoin Market Dynamics and Strategy’s Recent Activity
Bitcoin’s path here has been anything but smooth. The cryptocurrency fell as low as $58,000 in June, a drop of roughly 53% from its $125,000 high last October. That kind of swing is exactly why Strategy’s stock has been so volatile — its fortunes rise and fall almost in lockstep with Bitcoin’s price.
Price Volatility and Past Bitcoin Sales
Saylor has long preached a “never sell your Bitcoin” philosophy, but the past four months tell a more complicated story. Strategy actually sold Bitcoin four separate times during that stretch, a notable departure from the company’s usual buy-and-hold posture. As the cryptocurrency clawed back over the past month, though, Strategy reversed course again, making two purchases and signaling renewed confidence in the rally’s staying power.
Market Expert Insights
Chris Beauchamp, chief market analyst at IG Group, told Fortune that Strategy’s return to buying suggests the company sees enough support behind Bitcoin’s recovery to resume accumulating. “When you want to buy into a rising market, what August and September have given you is the potential for that to continue in a more sustained fashion. That’s just what Saylor and the rest of the team really want to see,” Beauchamp said. He added that the relatively modest size of the latest purchase doesn’t necessarily signal caution — it may simply reflect a strategy of adding Bitcoin gradually as the price climbs.
Macroeconomic Factors Driving Bitcoin’s Rally
Bitcoin’s bounce didn’t happen in a vacuum. It lines up with two specific developments in traditional finance that reshaped how investors think about risk and safety this fall.
US Treasury Bond Purchases
The renewed buying pressure behind Bitcoin traces back to mid-August, when the U.S. Treasury announced it would double its purchases of older long-term government bonds. Bitcoin had spent months in a slump as investors chased faster-moving trends like artificial intelligence instead. But growing worries about government bonds, rising yields, and inflation gave the cryptocurrency a fresh case for relevance as an alternative asset, according to Beauchamp. “You always need a narrative to kickstart something,” he said. “With Bessent’s moves back to treasuries, suddenly it seemed like this was sort of the dream scenario for Bitcoin.”
Federal Reserve Interest Rate Hike
The rally picked up steam as markets absorbed the Federal Reserve’s latest move on rates. Crypto markets typically struggle when the Fed tightens, since higher borrowing costs tend to pull money away from riskier bets. When Fed Chair Kevin Warsh announced a quarter-point rate increase on September 16, Bitcoin briefly dropped to about $75,600, wiping out gains from earlier in the month. That dip didn’t last. Once the widely anticipated hike was out of the way, Beauchamp said, “a more rational approach to the future applies,” with a key source of uncertainty removed from the equation.
Why This Matters for Corporate Bitcoin Strategy
Strategy’s willingness to buy again after a stretch of selling shows how tightly corporate treasury decisions around Bitcoin now track macro signals like bond markets and Fed policy, not just crypto-native sentiment. For a company holding 4% of Bitcoin’s total supply, every purchase or sale carries weight beyond its own balance sheet — it shapes how other institutional players read the market’s mood. Whether this renewed buying marks a durable shift or just another chapter in Strategy’s on-again, off-again accumulation pattern will likely hinge on whether the macro tailwinds — Treasury bond demand, inflation expectations, and the Fed’s next moves — keep pointing in Bitcoin’s favor.
FAQ
How much Bitcoin did Strategy purchase recently?
Strategy bought 950 Bitcoin for nearly $76 million last week.
What is the current total Bitcoin holding of Strategy?
Strategy holds a total of 846,000 Bitcoin coins.
How did Bitcoin’s price perform recently?
Bitcoin’s price surged more than 6% in 24 hours to nearly $86,000.
What financial actions did Strategy take beyond Bitcoin purchases?
Strategy spent $174 million repurchasing its preferred shares, known as STRC, which reduced its future dividend payments.
Article produced with the assistance of artificial intelligence and reviewed by the editorial team.
Strategy’s Bitcoin purchase lifts holdings to 846,000 coins amid $86K rally
Michael Saylor’s company is buying Bitcoin again, and the timing says a lot about where the market’s head is right now. Strategy, the software firm turned corporate crypto vehicle, made its first Bitcoin purchase in roughly three weeks last week, snapping up 950 coins for nearly $76 million. The move lands squarely inside a broader Strategy Bitcoin purchase pattern that has defined the company for years, but this one comes at a curious moment: a month that has historically been rough for the cryptocurrency, yet Bitcoin is climbing anyway.
Key takeaways
Strategy bought 950 Bitcoin for nearly $76 million last week, lifting its total holdings to 846,000 Bitcoin, or about 4% of the total supply.
Bitcoin surged more than 6% in 24 hours to nearly $86,000, pushing Strategy shares up almost 9% to $167.
The company also spent $174 million repurchasing its preferred shares, known as STRC, cutting its future dividend obligations.
Bitcoin had fallen as low as $58,000 in June, down 53% from its $125,000 peak last October, before this recovery began.
Strategy sold Bitcoin four separate times over the past four months before returning to buying as the price rebounded.
Strategy Resumes Bitcoin Buying
Strategy‘s latest disclosure shows the world’s largest corporate Bitcoin holder is back on offense after a brief pause. The company’s newest Strategy Bitcoin purchase — 950 coins worth close to $76 million — was its first acquisition in about three weeks, according to its financial filing. That single move pushed the firm’s total stash to 846,000 Bitcoin, a figure that now represents roughly 4% of all the Bitcoin that will ever exist.
Recent Bitcoin Purchase Details
The purchase itself wasn’t huge by Strategy’s historical standards. But it arrived at a telling moment, right as Bitcoin jumped more than 6% in 24 hours to trade near $86,000. That price action, paired with the company’s own buying, created a feedback loop of sorts: investors watched Bitcoin climb, then watched Strategy step back into the market, and reacted accordingly.
Bitcoin Holdings and Market Impact
Strategy shares jumped nearly 9% to $167 on the news. Part of that rally traces directly to Bitcoin’s price surge, since Strategy’s stock has effectively become a proxy for the cryptocurrency given how much of it the company holds. But the stock pop also had a second driver, one tied to the company’s balance sheet rather than the crypto market itself.
Preferred Shares Repurchase and Financial Maneuvers
Strategy didn’t just buy Bitcoin — it also bought back its own preferred shares, spending $174 million to repurchase STRC, the dividend-paying instrument it created last year specifically to raise cash for more Bitcoin purchases.
STRC Buyback Impact on Strategy’s Finances
The STRC repurchase matters beyond the immediate stock bump. By buying back these preferred shares, Strategy trims its future dividend payments to outside investors, freeing up more room on its books. Michael Saylor’s company built STRC as a funding mechanism during Bitcoin’s downturn, using it to keep accumulating coins even when the market wasn’t cooperating. Reducing that obligation now, while Bitcoin is climbing, suggests the company is managing its capital structure alongside its crypto strategy rather than treating the two as separate tracks.
Bitcoin Market Dynamics and Strategy’s Recent Activity
Bitcoin’s path here has been anything but smooth. The cryptocurrency fell as low as $58,000 in June, a drop of roughly 53% from its $125,000 high last October. That kind of swing is exactly why Strategy’s stock has been so volatile — its fortunes rise and fall almost in lockstep with Bitcoin’s price.
Price Volatility and Past Bitcoin Sales
Saylor has long preached a “never sell your Bitcoin” philosophy, but the past four months tell a more complicated story. Strategy actually sold Bitcoin four separate times during that stretch, a notable departure from the company’s usual buy-and-hold posture. As the cryptocurrency clawed back over the past month, though, Strategy reversed course again, making two purchases and signaling renewed confidence in the rally’s staying power.
Market Expert Insights
Chris Beauchamp, chief market analyst at IG Group, told Fortune that Strategy’s return to buying suggests the company sees enough support behind Bitcoin’s recovery to resume accumulating. “When you want to buy into a rising market, what August and September have given you is the potential for that to continue in a more sustained fashion. That’s just what Saylor and the rest of the team really want to see,” Beauchamp said. He added that the relatively modest size of the latest purchase doesn’t necessarily signal caution — it may simply reflect a strategy of adding Bitcoin gradually as the price climbs.
Macroeconomic Factors Driving Bitcoin’s Rally
Bitcoin’s bounce didn’t happen in a vacuum. It lines up with two specific developments in traditional finance that reshaped how investors think about risk and safety this fall.
US Treasury Bond Purchases
The renewed buying pressure behind Bitcoin traces back to mid-August, when the U.S. Treasury announced it would double its purchases of older long-term government bonds. Bitcoin had spent months in a slump as investors chased faster-moving trends like artificial intelligence instead. But growing worries about government bonds, rising yields, and inflation gave the cryptocurrency a fresh case for relevance as an alternative asset, according to Beauchamp. “You always need a narrative to kickstart something,” he said. “With Bessent’s moves back to treasuries, suddenly it seemed like this was sort of the dream scenario for Bitcoin.”
Federal Reserve Interest Rate Hike
The rally picked up steam as markets absorbed the Federal Reserve’s latest move on rates. Crypto markets typically struggle when the Fed tightens, since higher borrowing costs tend to pull money away from riskier bets. When Fed Chair Kevin Warsh announced a quarter-point rate increase on September 16, Bitcoin briefly dropped to about $75,600, wiping out gains from earlier in the month. That dip didn’t last. Once the widely anticipated hike was out of the way, Beauchamp said, “a more rational approach to the future applies,” with a key source of uncertainty removed from the equation.
Why This Matters for Corporate Bitcoin Strategy
Strategy’s willingness to buy again after a stretch of selling shows how tightly corporate treasury decisions around Bitcoin now track macro signals like bond markets and Fed policy, not just crypto-native sentiment. For a company holding 4% of Bitcoin’s total supply, every purchase or sale carries weight beyond its own balance sheet — it shapes how other institutional players read the market’s mood. Whether this renewed buying marks a durable shift or just another chapter in Strategy’s on-again, off-again accumulation pattern will likely hinge on whether the macro tailwinds — Treasury bond demand, inflation expectations, and the Fed’s next moves — keep pointing in Bitcoin’s favor.
FAQ
How much Bitcoin did Strategy purchase recently?
Strategy bought 950 Bitcoin for nearly $76 million last week.
What is the current total Bitcoin holding of Strategy?
Strategy holds a total of 846,000 Bitcoin coins.
How did Bitcoin’s price perform recently?
Bitcoin’s price surged more than 6% in 24 hours to nearly $86,000.
What financial actions did Strategy take beyond Bitcoin purchases?
Strategy spent $174 million repurchasing its preferred shares, known as STRC, which reduced its future dividend payments.
Article produced with the assistance of artificial intelligence and reviewed by the editorial team.
Key takeaways
Strategy bought 950 Bitcoin for nearly $76 million last week, lifting its total holdings to 846,000 Bitcoin, or about 4% of the total supply.
Bitcoin surged more than 6% in 24 hours to nearly $86,000, pushing Strategy shares up almost 9% to $167.
The company also spent $174 million repurchasing its preferred shares, known as STRC, cutting its future dividend obligations.
Bitcoin had fallen as low as $58,000 in June, down 53% from its $125,000 peak last October, before this recovery began.
Strategy sold Bitcoin four separate times over the past four months before returning to buying as the price rebounded.
Strategy Resumes Bitcoin Buying
Strategy‘s latest disclosure shows the world’s largest corporate Bitcoin holder is back on offense after a brief pause. The company’s newest Strategy Bitcoin purchase — 950 coins worth close to $76 million — was its first acquisition in about three weeks, according to its financial filing. That single move pushed the firm’s total stash to 846,000 Bitcoin, a figure that now represents roughly 4% of all the Bitcoin that will ever exist.
Recent Bitcoin Purchase Details
The purchase itself wasn’t huge by Strategy’s historical standards. But it arrived at a telling moment, right as Bitcoin jumped more than 6% in 24 hours to trade near $86,000. That price action, paired with the company’s own buying, created a feedback loop of sorts: investors watched Bitcoin climb, then watched Strategy step back into the market, and reacted accordingly.
Bitcoin Holdings and Market Impact
Strategy shares jumped nearly 9% to $167 on the news. Part of that rally traces directly to Bitcoin’s price surge, since Strategy’s stock has effectively become a proxy for the cryptocurrency given how much of it the company holds. But the stock pop also had a second driver, one tied to the company’s balance sheet rather than the crypto market itself.
Preferred Shares Repurchase and Financial Maneuvers
Strategy didn’t just buy Bitcoin — it also bought back its own preferred shares, spending $174 million to repurchase STRC, the dividend-paying instrument it created last year specifically to raise cash for more Bitcoin purchases.
STRC Buyback Impact on Strategy’s Finances
The STRC repurchase matters beyond the immediate stock bump. By buying back these preferred shares, Strategy trims its future dividend payments to outside investors, freeing up more room on its books. Michael Saylor’s company built STRC as a funding mechanism during Bitcoin’s downturn, using it to keep accumulating coins even when the market wasn’t cooperating. Reducing that obligation now, while Bitcoin is climbing, suggests the company is managing its capital structure alongside its crypto strategy rather than treating the two as separate tracks.
Bitcoin Market Dynamics and Strategy’s Recent Activity
Bitcoin’s path here has been anything but smooth. The cryptocurrency fell as low as $58,000 in June, a drop of roughly 53% from its $125,000 high last October. That kind of swing is exactly why Strategy’s stock has been so volatile — its fortunes rise and fall almost in lockstep with Bitcoin’s price.
Price Volatility and Past Bitcoin Sales
Saylor has long preached a “never sell your Bitcoin” philosophy, but the past four months tell a more complicated story. Strategy actually sold Bitcoin four separate times during that stretch, a notable departure from the company’s usual buy-and-hold posture. As the cryptocurrency clawed back over the past month, though, Strategy reversed course again, making two purchases and signaling renewed confidence in the rally’s staying power.
Market Expert Insights
Chris Beauchamp, chief market analyst at IG Group, told Fortune that Strategy’s return to buying suggests the company sees enough support behind Bitcoin’s recovery to resume accumulating. “When you want to buy into a rising market, what August and September have given you is the potential for that to continue in a more sustained fashion. That’s just what Saylor and the rest of the team really want to see,” Beauchamp said. He added that the relatively modest size of the latest purchase doesn’t necessarily signal caution — it may simply reflect a strategy of adding Bitcoin gradually as the price climbs.
Macroeconomic Factors Driving Bitcoin’s Rally
Bitcoin’s bounce didn’t happen in a vacuum. It lines up with two specific developments in traditional finance that reshaped how investors think about risk and safety this fall.
US Treasury Bond Purchases
The renewed buying pressure behind Bitcoin traces back to mid-August, when the U.S. Treasury announced it would double its purchases of older long-term government bonds. Bitcoin had spent months in a slump as investors chased faster-moving trends like artificial intelligence instead. But growing worries about government bonds, rising yields, and inflation gave the cryptocurrency a fresh case for relevance as an alternative asset, according to Beauchamp. “You always need a narrative to kickstart something,” he said. “With Bessent’s moves back to treasuries, suddenly it seemed like this was sort of the dream scenario for Bitcoin.”
Federal Reserve Interest Rate Hike
The rally picked up steam as markets absorbed the Federal Reserve’s latest move on rates. Crypto markets typically struggle when the Fed tightens, since higher borrowing costs tend to pull money away from riskier bets. When Fed Chair Kevin Warsh announced a quarter-point rate increase on September 16, Bitcoin briefly dropped to about $75,600, wiping out gains from earlier in the month. That dip didn’t last. Once the widely anticipated hike was out of the way, Beauchamp said, “a more rational approach to the future applies,” with a key source of uncertainty removed from the equation.
Why This Matters for Corporate Bitcoin Strategy
Strategy’s willingness to buy again after a stretch of selling shows how tightly corporate treasury decisions around Bitcoin now track macro signals like bond markets and Fed policy, not just crypto-native sentiment. For a company holding 4% of Bitcoin’s total supply, every purchase or sale carries weight beyond its own balance sheet — it shapes how other institutional players read the market’s mood. Whether this renewed buying marks a durable shift or just another chapter in Strategy’s on-again, off-again accumulation pattern will likely hinge on whether the macro tailwinds — Treasury bond demand, inflation expectations, and the Fed’s next moves — keep pointing in Bitcoin’s favor.
FAQ
How much Bitcoin did Strategy purchase recently?
Strategy bought 950 Bitcoin for nearly $76 million last week.
What is the current total Bitcoin holding of Strategy?
Strategy holds a total of 846,000 Bitcoin coins.
How did Bitcoin’s price perform recently?
Bitcoin’s price surged more than 6% in 24 hours to nearly $86,000.
What financial actions did Strategy take beyond Bitcoin purchases?
Strategy spent $174 million repurchasing its preferred shares, known as STRC, which reduced its future dividend payments.
Article produced with the assistance of artificial intelligence and reviewed by the editorial team.
95

Статья
Big Tech crypto hiring signals Google’s stablecoin ambitionsTwo of the world’s biggest technology companies are quietly building out their crypto expertise, and the job listings tell a story that goes beyond typical corporate hiring. This wave of Big Tech crypto hiring suggests that stablecoins, tokenized deposits and blockchain payment rails are no longer niche concerns reserved for crypto-native firms — they’re becoming standard skill sets inside Google and Apple.
Key takeaways
A Web3 architect position in Hong Kong is being filled by Google Cloud, with the role aimed at helping financial institutions tokenize real-world assets and construct blockchain infrastructure throughout the Asia-Pacific region.
The role requires experience with blockchain networks, smart contracts, stablecoin infrastructure, tokenized deposits and custody technologies.
Apple is seeking a Financial Product Strategy Lead for Apple Pay based in Cupertino or New York to shape digital-asset strategy for Apple Card, Apple Cash and peer-to-peer payments.
Neither company has confirmed a new crypto product launch, but both listings show stablecoins and tokenized deposits becoming relevant in-house expertise.
CME Group expanded its Google Cloud partnership in March 2025 to test asset tokenization, including the Google Cloud Universal Ledger, while Samsung is planning stablecoin features for Galaxy phones through Samsung Wallet.
Big Tech’s Strategic Crypto Hiring
Google and Apple are each recruiting for roles that place stablecoins and tokenized assets at the center of future strategy, even though neither company has said a specific crypto product is coming. That distinction matters: it signals internal capability-building rather than a product announcement, but it still marks a notable shift in how mainstream tech giants view digital-asset infrastructure.
Google Cloud’s Web3 Architect Role in Hong Kong
Google Cloud is hiring a Web3 architect based in Hong Kong to work directly with financial institutions on tokenizing real-world assets and building blockchain-based infrastructure across the Asia-Pacific region. The posting calls for hands-on experience with blockchain networks, smart contracts, stablecoin infrastructure, tokenized deposits and custody technologies — a fairly specific technical wish list that points to serious institutional ambitions rather than exploratory research.
According to the job listing, the successful hire would advise executives and help shape Google’s Web3 product roadmap as the company tries to position itself as the preferred cloud provider for digital-asset builders and institutional adopters.
Apple’s Financial Product Strategy Lead for Apple Pay
Apple, meanwhile, is looking for a Financial Product Strategy Lead for Apple Pay, with the role based in either Cupertino, California, or New York. This hire would work on strategy across Apple Card, Apple Cash and peer-to-peer payments, evaluating new products, partnerships and commercial models spanning wallets, payments and commerce.
Unlike Google’s posting, Apple’s listing doesn’t explicitly mention blockchain or crypto terminology. But the broader context — a payments company hiring strategic talent right as stablecoin adoption accelerates across the industry — suggests Apple wants someone capable of evaluating digital-asset opportunities alongside traditional payment products.
Focus Areas and Role Responsibilities
The two roles diverge sharply in scope, and that difference says a lot about each company’s starting point in digital assets. Google’s posting is explicit about blockchain technology; Apple’s is framed around consumer financial products with room to expand into digital assets.
Google’s Emphasis on Cloud Infrastructure and Compliance
Google’s job description ties the role directly to digital-asset infrastructure. Duties for the future architect would center on blockchain nodes, transaction-signing systems, cloud infrastructure, and regulatory compliance across various markets, Hong Kong among them. That regulatory framing matters — Hong Kong has positioned itself as a hub for digital-asset licensing in Asia, and a role built around compliance there suggests Google wants infrastructure that can satisfy institutional-grade regulatory demands, not just experimental blockchain projects.
Apple’s Focus on Payment Products and Consumer Financial Services
Apple’s role centers on strategy for consumer-facing financial products. The company is looking for someone to assess new products, partnerships and commercial models across its existing wallet and payments ecosystem. In practice, this reads as Apple keeping its options open on digital assets without committing publicly to a specific stablecoin or tokenization initiative.
Ecosystem Developments and Partnerships
These hiring moves don’t exist in isolation — they follow a pattern of institutional and consumer-facing blockchain integration already underway elsewhere in the tech sector.
CME Group and Google Cloud Partnership
In March 2025, CME Group, which operates a marketplace for institutional derivatives trading, revealed it was broadening its collaboration with Google Cloud in order to investigate blockchain-based payments and asset tokenization. As part of that expansion, CME Group announced the first phase of integration and testing of the Google Cloud Universal Ledger, giving Google’s cloud infrastructure a concrete institutional use case well before this latest hiring round.
Samsung’s Stablecoin Integration in Galaxy Smartphones
Following the job postings from Apple and Google, Samsung has unveiled plans to integrate stablecoin features into Galaxy devices via Samsung Wallet, a step that could deliver digital-asset payment capabilities by default to hundreds of millions of users. If Samsung follows through at that scale, it would represent one of the largest consumer distribution channels stablecoins have ever had, simply by virtue of how many Galaxy devices are already in circulation.
Implications of Stablecoin and Tokenization Trends
Taken together, these developments point to a broader pattern: stablecoins and tokenized financial products are gaining relevance inside major tech and payment ecosystems, not just among crypto-native companies. That’s a meaningful shift in where digital-asset expertise is concentrated.
Why does this matter? Google Cloud already touches institutional infrastructure through its CME Group partnership, and a dedicated Web3 hire in Hong Kong would deepen that footprint in a region actively courting digital-asset businesses through clearer licensing frameworks. Apple’s hire, though less explicitly blockchain-focused, keeps the company positioned to react quickly if stablecoin-based payments gain more traction among consumers and merchants.
None of this confirms that either company will ship a crypto product. But the fact that both are now recruiting specifically around stablecoins and tokenized deposits — at the same moment Samsung is planning stablecoin features for its phones and CME Group is testing tokenization tools built on Google Cloud — suggests digital-asset infrastructure is moving from the periphery of Big Tech’s roadmap toward something closer to the center.
FAQ
What expertise is Google Cloud looking for in its Web3 architect role?
Google Cloud seeks experience with blockchain networks, smart contracts, stablecoin infrastructure, tokenized deposits, and custody technologies.
Is Apple launching a new crypto product with its Financial Product Strategy Lead hiring?
No. The listing does not confirm a new crypto product but indicates Apple is building expertise in digital assets including stablecoins and tokenized deposits.
What is the focus of Google’s prospective Web3 architect role?
This position centers on compliance obligations, blockchain nodes, transaction-signing systems, and cloud infrastructure across several markets, including Hong Kong.
How is Samsung approaching stablecoin adoption?
Samsung plans to add stablecoin features to its Galaxy smartphones via Samsung Wallet to enable digital-asset payment tools for hundreds of millions of users.
Article produced with the assistance of artificial intelligence and reviewed by the editorial team.
Big Tech crypto hiring signals Google’s stablecoin ambitions
Two of the world’s biggest technology companies are quietly building out their crypto expertise, and the job listings tell a story that goes beyond typical corporate hiring. This wave of Big Tech crypto hiring suggests that stablecoins, tokenized deposits and blockchain payment rails are no longer niche concerns reserved for crypto-native firms — they’re becoming standard skill sets inside Google and Apple.
Key takeaways
A Web3 architect position in Hong Kong is being filled by Google Cloud, with the role aimed at helping financial institutions tokenize real-world assets and construct blockchain infrastructure throughout the Asia-Pacific region.
The role requires experience with blockchain networks, smart contracts, stablecoin infrastructure, tokenized deposits and custody technologies.
Apple is seeking a Financial Product Strategy Lead for Apple Pay based in Cupertino or New York to shape digital-asset strategy for Apple Card, Apple Cash and peer-to-peer payments.
Neither company has confirmed a new crypto product launch, but both listings show stablecoins and tokenized deposits becoming relevant in-house expertise.
CME Group expanded its Google Cloud partnership in March 2025 to test asset tokenization, including the Google Cloud Universal Ledger, while Samsung is planning stablecoin features for Galaxy phones through Samsung Wallet.
Big Tech’s Strategic Crypto Hiring
Google and Apple are each recruiting for roles that place stablecoins and tokenized assets at the center of future strategy, even though neither company has said a specific crypto product is coming. That distinction matters: it signals internal capability-building rather than a product announcement, but it still marks a notable shift in how mainstream tech giants view digital-asset infrastructure.
Google Cloud’s Web3 Architect Role in Hong Kong
Google Cloud is hiring a Web3 architect based in Hong Kong to work directly with financial institutions on tokenizing real-world assets and building blockchain-based infrastructure across the Asia-Pacific region. The posting calls for hands-on experience with blockchain networks, smart contracts, stablecoin infrastructure, tokenized deposits and custody technologies — a fairly specific technical wish list that points to serious institutional ambitions rather than exploratory research.
According to the job listing, the successful hire would advise executives and help shape Google’s Web3 product roadmap as the company tries to position itself as the preferred cloud provider for digital-asset builders and institutional adopters.
Apple’s Financial Product Strategy Lead for Apple Pay
Apple, meanwhile, is looking for a Financial Product Strategy Lead for Apple Pay, with the role based in either Cupertino, California, or New York. This hire would work on strategy across Apple Card, Apple Cash and peer-to-peer payments, evaluating new products, partnerships and commercial models spanning wallets, payments and commerce.
Unlike Google’s posting, Apple’s listing doesn’t explicitly mention blockchain or crypto terminology. But the broader context — a payments company hiring strategic talent right as stablecoin adoption accelerates across the industry — suggests Apple wants someone capable of evaluating digital-asset opportunities alongside traditional payment products.
Focus Areas and Role Responsibilities
The two roles diverge sharply in scope, and that difference says a lot about each company’s starting point in digital assets. Google’s posting is explicit about blockchain technology; Apple’s is framed around consumer financial products with room to expand into digital assets.
Google’s Emphasis on Cloud Infrastructure and Compliance
Google’s job description ties the role directly to digital-asset infrastructure. Duties for the future architect would center on blockchain nodes, transaction-signing systems, cloud infrastructure, and regulatory compliance across various markets, Hong Kong among them. That regulatory framing matters — Hong Kong has positioned itself as a hub for digital-asset licensing in Asia, and a role built around compliance there suggests Google wants infrastructure that can satisfy institutional-grade regulatory demands, not just experimental blockchain projects.
Apple’s Focus on Payment Products and Consumer Financial Services
Apple’s role centers on strategy for consumer-facing financial products. The company is looking for someone to assess new products, partnerships and commercial models across its existing wallet and payments ecosystem. In practice, this reads as Apple keeping its options open on digital assets without committing publicly to a specific stablecoin or tokenization initiative.
Ecosystem Developments and Partnerships
These hiring moves don’t exist in isolation — they follow a pattern of institutional and consumer-facing blockchain integration already underway elsewhere in the tech sector.
CME Group and Google Cloud Partnership
In March 2025, CME Group, which operates a marketplace for institutional derivatives trading, revealed it was broadening its collaboration with Google Cloud in order to investigate blockchain-based payments and asset tokenization. As part of that expansion, CME Group announced the first phase of integration and testing of the Google Cloud Universal Ledger, giving Google’s cloud infrastructure a concrete institutional use case well before this latest hiring round.
Samsung’s Stablecoin Integration in Galaxy Smartphones
Following the job postings from Apple and Google, Samsung has unveiled plans to integrate stablecoin features into Galaxy devices via Samsung Wallet, a step that could deliver digital-asset payment capabilities by default to hundreds of millions of users. If Samsung follows through at that scale, it would represent one of the largest consumer distribution channels stablecoins have ever had, simply by virtue of how many Galaxy devices are already in circulation.
Implications of Stablecoin and Tokenization Trends
Taken together, these developments point to a broader pattern: stablecoins and tokenized financial products are gaining relevance inside major tech and payment ecosystems, not just among crypto-native companies. That’s a meaningful shift in where digital-asset expertise is concentrated.
Why does this matter? Google Cloud already touches institutional infrastructure through its CME Group partnership, and a dedicated Web3 hire in Hong Kong would deepen that footprint in a region actively courting digital-asset businesses through clearer licensing frameworks. Apple’s hire, though less explicitly blockchain-focused, keeps the company positioned to react quickly if stablecoin-based payments gain more traction among consumers and merchants.
None of this confirms that either company will ship a crypto product. But the fact that both are now recruiting specifically around stablecoins and tokenized deposits — at the same moment Samsung is planning stablecoin features for its phones and CME Group is testing tokenization tools built on Google Cloud — suggests digital-asset infrastructure is moving from the periphery of Big Tech’s roadmap toward something closer to the center.
FAQ
What expertise is Google Cloud looking for in its Web3 architect role?
Google Cloud seeks experience with blockchain networks, smart contracts, stablecoin infrastructure, tokenized deposits, and custody technologies.
Is Apple launching a new crypto product with its Financial Product Strategy Lead hiring?
No. The listing does not confirm a new crypto product but indicates Apple is building expertise in digital assets including stablecoins and tokenized deposits.
What is the focus of Google’s prospective Web3 architect role?
This position centers on compliance obligations, blockchain nodes, transaction-signing systems, and cloud infrastructure across several markets, including Hong Kong.
How is Samsung approaching stablecoin adoption?
Samsung plans to add stablecoin features to its Galaxy smartphones via Samsung Wallet to enable digital-asset payment tools for hundreds of millions of users.
Article produced with the assistance of artificial intelligence and reviewed by the editorial team.
Key takeaways
A Web3 architect position in Hong Kong is being filled by Google Cloud, with the role aimed at helping financial institutions tokenize real-world assets and construct blockchain infrastructure throughout the Asia-Pacific region.
The role requires experience with blockchain networks, smart contracts, stablecoin infrastructure, tokenized deposits and custody technologies.
Apple is seeking a Financial Product Strategy Lead for Apple Pay based in Cupertino or New York to shape digital-asset strategy for Apple Card, Apple Cash and peer-to-peer payments.
Neither company has confirmed a new crypto product launch, but both listings show stablecoins and tokenized deposits becoming relevant in-house expertise.
CME Group expanded its Google Cloud partnership in March 2025 to test asset tokenization, including the Google Cloud Universal Ledger, while Samsung is planning stablecoin features for Galaxy phones through Samsung Wallet.
Big Tech’s Strategic Crypto Hiring
Google and Apple are each recruiting for roles that place stablecoins and tokenized assets at the center of future strategy, even though neither company has said a specific crypto product is coming. That distinction matters: it signals internal capability-building rather than a product announcement, but it still marks a notable shift in how mainstream tech giants view digital-asset infrastructure.
Google Cloud’s Web3 Architect Role in Hong Kong
Google Cloud is hiring a Web3 architect based in Hong Kong to work directly with financial institutions on tokenizing real-world assets and building blockchain-based infrastructure across the Asia-Pacific region. The posting calls for hands-on experience with blockchain networks, smart contracts, stablecoin infrastructure, tokenized deposits and custody technologies — a fairly specific technical wish list that points to serious institutional ambitions rather than exploratory research.
According to the job listing, the successful hire would advise executives and help shape Google’s Web3 product roadmap as the company tries to position itself as the preferred cloud provider for digital-asset builders and institutional adopters.
Apple’s Financial Product Strategy Lead for Apple Pay
Apple, meanwhile, is looking for a Financial Product Strategy Lead for Apple Pay, with the role based in either Cupertino, California, or New York. This hire would work on strategy across Apple Card, Apple Cash and peer-to-peer payments, evaluating new products, partnerships and commercial models spanning wallets, payments and commerce.
Unlike Google’s posting, Apple’s listing doesn’t explicitly mention blockchain or crypto terminology. But the broader context — a payments company hiring strategic talent right as stablecoin adoption accelerates across the industry — suggests Apple wants someone capable of evaluating digital-asset opportunities alongside traditional payment products.
Focus Areas and Role Responsibilities
The two roles diverge sharply in scope, and that difference says a lot about each company’s starting point in digital assets. Google’s posting is explicit about blockchain technology; Apple’s is framed around consumer financial products with room to expand into digital assets.
Google’s Emphasis on Cloud Infrastructure and Compliance
Google’s job description ties the role directly to digital-asset infrastructure. Duties for the future architect would center on blockchain nodes, transaction-signing systems, cloud infrastructure, and regulatory compliance across various markets, Hong Kong among them. That regulatory framing matters — Hong Kong has positioned itself as a hub for digital-asset licensing in Asia, and a role built around compliance there suggests Google wants infrastructure that can satisfy institutional-grade regulatory demands, not just experimental blockchain projects.
Apple’s Focus on Payment Products and Consumer Financial Services
Apple’s role centers on strategy for consumer-facing financial products. The company is looking for someone to assess new products, partnerships and commercial models across its existing wallet and payments ecosystem. In practice, this reads as Apple keeping its options open on digital assets without committing publicly to a specific stablecoin or tokenization initiative.
Ecosystem Developments and Partnerships
These hiring moves don’t exist in isolation — they follow a pattern of institutional and consumer-facing blockchain integration already underway elsewhere in the tech sector.
CME Group and Google Cloud Partnership
In March 2025, CME Group, which operates a marketplace for institutional derivatives trading, revealed it was broadening its collaboration with Google Cloud in order to investigate blockchain-based payments and asset tokenization. As part of that expansion, CME Group announced the first phase of integration and testing of the Google Cloud Universal Ledger, giving Google’s cloud infrastructure a concrete institutional use case well before this latest hiring round.
Samsung’s Stablecoin Integration in Galaxy Smartphones
Following the job postings from Apple and Google, Samsung has unveiled plans to integrate stablecoin features into Galaxy devices via Samsung Wallet, a step that could deliver digital-asset payment capabilities by default to hundreds of millions of users. If Samsung follows through at that scale, it would represent one of the largest consumer distribution channels stablecoins have ever had, simply by virtue of how many Galaxy devices are already in circulation.
Implications of Stablecoin and Tokenization Trends
Taken together, these developments point to a broader pattern: stablecoins and tokenized financial products are gaining relevance inside major tech and payment ecosystems, not just among crypto-native companies. That’s a meaningful shift in where digital-asset expertise is concentrated.
Why does this matter? Google Cloud already touches institutional infrastructure through its CME Group partnership, and a dedicated Web3 hire in Hong Kong would deepen that footprint in a region actively courting digital-asset businesses through clearer licensing frameworks. Apple’s hire, though less explicitly blockchain-focused, keeps the company positioned to react quickly if stablecoin-based payments gain more traction among consumers and merchants.
None of this confirms that either company will ship a crypto product. But the fact that both are now recruiting specifically around stablecoins and tokenized deposits — at the same moment Samsung is planning stablecoin features for its phones and CME Group is testing tokenization tools built on Google Cloud — suggests digital-asset infrastructure is moving from the periphery of Big Tech’s roadmap toward something closer to the center.
FAQ
What expertise is Google Cloud looking for in its Web3 architect role?
Google Cloud seeks experience with blockchain networks, smart contracts, stablecoin infrastructure, tokenized deposits, and custody technologies.
Is Apple launching a new crypto product with its Financial Product Strategy Lead hiring?
No. The listing does not confirm a new crypto product but indicates Apple is building expertise in digital assets including stablecoins and tokenized deposits.
What is the focus of Google’s prospective Web3 architect role?
This position centers on compliance obligations, blockchain nodes, transaction-signing systems, and cloud infrastructure across several markets, including Hong Kong.
How is Samsung approaching stablecoin adoption?
Samsung plans to add stablecoin features to its Galaxy smartphones via Samsung Wallet to enable digital-asset payment tools for hundreds of millions of users.
Article produced with the assistance of artificial intelligence and reviewed by the editorial team.
17

Статья
Google Stock Climbs to $351.82 as Bullish Trend Faces a Key TestGoogle stock was trading at $351.82 intraday, hitting a fresh intraday high of $353.28 and extending its rotation away from the broader tech selloff. The daily structure remains constructive, though underlying momentum signals warrant some caution.
GOOG — daily chart with candlesticks, EMA20/EMA50 and volume.
Key takeaways
Google stock was trading at $351.82, above all major daily moving averages in a textbook bullish EMA stack.
Daily RSI14 sits at 59.16, firm but not overbought, while MACD has turned positive with a histogram of 1.97.
The daily regime remains tagged neutral despite the bullish EMA structure, warranting caution.
Hourly RSI14 at 65.79 approaches overbought territory, and the 15-minute MACD histogram has turned negative.
The critical pivot band runs from $349.99 to $355.11 — price behavior here will likely define the next directional move.
Google Stock Price Action on the Daily Chart
Google stock’s daily chart displays a textbook bullish trend footprint, with price trading above every major moving average and EMAs stacked in proper alignment.
GOOG was trading at 351.82 after opening at 346.29, printing a range between 344.86 and 353.28. The price sits comfortably above the EMA20 at 341.01, the EMA50 at 343.81, and the EMA200 at 326.84.
This stacked alignment places the short-term EMA above the medium-term, which sits above the long-term. Price trades on top of all three — a classic bullish structure.
Meanwhile, RSI14 reads 59.16, firm without being stretched. There is room left before overbought territory becomes a concern.
Similarly, MACD tells a story of building strength. The line has crossed to 0.24 against a signal of -1.74, leaving a histogram of 1.97. This meaningful positive spread points to momentum that recently turned positive, rather than momentum already exhausted.
Bollinger Bands add nuance, however. The mid-band sits at 338.96 and the upper band at 350.35. The price at 351.82 actually trades above the upper band — a sign of strong directional pressure that can also flag short-term overextension.
Meanwhile, ATR14 stands at 7.78, confirming daily ranges remain wide and volatility is not compressed. On the pivot grid, price sits above the pivot point of 349.99 and closes in on R1 at 355.11. S1 at 346.69 acts as the first line of defense if sellers surface.
Notably, the system still tags the daily regime as neutral despite this bullish-looking setup. The gap between raw indicator alignment and regime label deserves attention. It suggests the trend, while intact, has not yet been confirmed as a clean, low-noise advance. The market may still be digesting the recent push higher before committing further.
Hourly Timeframe Confirms the Bullish Bias
The hourly chart reinforces Google stock’s bullish bias, with all EMAs stacked constructively beneath price and the regime explicitly labeled bullish.
GOOG’s last hourly candle closed at 351.82. EMA20 at 346.59, EMA50 at 342.7 and EMA200 at 340.94 are all stacked bullishly beneath price. RSI14 on this timeframe sits at 65.79, noticeably hotter than the daily reading and edging toward overbought. MACD is also more decisively positive here, with the line at 2.86 above a signal of 2.2 and a histogram of 0.65.
Bollinger Bands on the hourly show a mid-line of 345.42, an upper band of 353.62 and a lower band of 337.21. Price sits just under the upper band, rather than piercing through it as on the daily. ATR14 of 3.09 reflects hourly volatility proportionate to the timeframe.
Pivot levels are extremely tight: pp at 351.89, r1 at 352.66 and s1 at 351.04. Price is essentially parked right on the pivot. The hourly regime is explicitly labeled bullish, reinforcing the daily structure.
However, the higher RSI reading is a reminder that short-term buyers have been pushing harder than the daily chart alone would suggest. That kind of gap between timeframes often precedes a pause.
15-Minute Execution: A Short-Term Stall
The 15-minute chart reveals a short-term stall in Google stock’s momentum, with MACD diverging negatively even as the broader EMA structure holds.
GOOG’s most recent 15-minute candle closed at 351.82, essentially unchanged from the hourly close. This flatness itself hints at consolidation right at current levels. EMA20 at 350.71, EMA50 at 348.2 and EMA200 at 342.6 remain bullishly aligned. RSI14 at 59.28 is calm rather than stretched.
The notable wrinkle here is the MACD. The line sits at 1.41, just below the signal at 1.53, producing a negative histogram of -0.12. This is a small but clear divergence from the bullish tone on the daily and hourly charts.
In practice, short-term momentum is losing steam right where price tests resistance. The broader trend on higher timeframes remains intact, but the 15-minute picture shows hesitation.
Bollinger Bands show a tight mid-band of 350.66 against an upper band of 355.01 and lower band of 346.32. ATR14 has compressed to 1.27. Pivot levels are razor-thin: pp at 351.87, r1 at 351.98 and s1 at 351.71. Price is coiling at a decision point rather than trending cleanly in either direction.
The Bullish Case for Alphabet
The bullish case for Google stock hinges on the daily EMA alignment holding and price sustaining levels above the daily pivot at $349.99.
A push through R1 at $355.11 would support continuation. This requires the hourly and 15-minute MACD histograms flipping back positive, confirming short-term momentum is in sync with the broader trend.
On the news side, the narrative is constructive. Reports point to a rebound in Google Search performance. One widely read commentary describes the recent tech-sector selloff as reinforcing rather than weakening conviction in Alphabet.
Additionally, nearly $400 billion in combined AI infrastructure spending between Amazon and Alphabet this year frames Alphabet as a central player in the next leg of the AI buildout heading into 2027. If that spending narrative continues to attract capital rather than scare it away, the bullish structure across daily and hourly timeframes has room to extend.
The Bearish Risk and What Would Invalidate the Uptrend
The bearish risk centers on warning signs already visible inside Google stock’s current structure, not on a confirmed reversal signal.
Daily price trading above the upper Bollinger Band, combined with a daily regime still labeled neutral, suggests the move could be due for a cooling-off period. The hourly RSI at 65.79 is approaching stretched territory. At the same time, the 15-minute MACD histogram has already turned slightly negative.
A failure to hold above the daily pivot at 349.99, followed by a slide toward S1 at 346.69, would be the first concrete sign that momentum is fading. A deeper break below the daily EMA50 at $343.81 would signal something more serious: the bullish structure breaking down rather than simply pausing.
On the news side, the class-action lawsuit naming Google DeepMind over AI safety oversight is a reminder. Regulatory and legal headlines remain a live risk factor for Alphabet, independent of the technical picture.
Closing Take: A Layered Technical Picture
Google stock enters this stretch with a layered technical picture: a daily trend favoring buyers, an hourly chart confirming with urgency, and a 15-minute chart showing early hesitation at resistance.
That layered picture is not a conflict so much as a normal sequence. Strong daily and hourly alignment coexists with short-term momentum that needs to consolidate before pushing further.
Volatility remains elevated on the daily timeframe, judging by the ATR reading. Meanwhile, the 15-minute range has compressed — typical of a market pausing to decide its next move.
Given the daily regime is still tagged neutral despite the bullish EMA structure, and RSI readings on shorter timeframes run hotter than on the daily chart, positioning around current levels calls for discipline rather than conviction. The next few sessions should clarify the outlook. How price behaves around the 349.99 to 355.11 pivot band will determine whether this is the start of a fresh leg higher or a pause inside a broader range.
FAQ
What are the key levels to watch for Google stock right now?
The critical pivot band runs from $349.99 to $355.11. A break above R1 at $355.11 supports continuation. A failure to hold the daily pivot at $349.99 would be the first sign of fading momentum, with S1 at $346.69 as the next support.
Is Google stock’s trend still bullish?
The daily EMA alignment remains bullish with price above EMA20, EMA50, and EMA200. However, the daily regime is still tagged neutral, and shorter-timeframe RSI readings are approaching overbought levels, suggesting the trend has not yet been confirmed as a clean advance.
What are the main risks for Google stock currently?
Daily price trading above the upper Bollinger Band points to possible short-term overextension. The 15-minute MACD histogram has turned negative, and the hourly RSI at 65.79 is edging toward overbought territory. Additionally, the Google DeepMind class-action lawsuit highlights that regulatory risk remains live for Alphabet.
What does the 15-minute chart indicate for Google stock?
The 15-minute chart shows short-term momentum stalling, with MACD diverging negatively even as EMAs remain bullishly aligned. ATR compression to 1.27 suggests price is coiling at a decision point rather than trending cleanly in either direction.
Disclaimer: This article is for informational purposes only and does not constitute financial advice, an investment recommendation, or a solicitation to buy or sell any financial instrument or cryptocurrency. The analysis provided is not indicative of future results. Investing in crypto assets and financial markets carries a high risk of capital loss. Always do your own research (DYOR) and consult a qualified financial advisor before making any decision.
Article produced with the assistance of artificial intelligence and reviewed by the editorial team.
Google Stock Climbs to $351.82 as Bullish Trend Faces a Key Test
Google stock was trading at $351.82 intraday, hitting a fresh intraday high of $353.28 and extending its rotation away from the broader tech selloff. The daily structure remains constructive, though underlying momentum signals warrant some caution.
GOOG — daily chart with candlesticks, EMA20/EMA50 and volume.
Key takeaways
Google stock was trading at $351.82, above all major daily moving averages in a textbook bullish EMA stack.
Daily RSI14 sits at 59.16, firm but not overbought, while MACD has turned positive with a histogram of 1.97.
The daily regime remains tagged neutral despite the bullish EMA structure, warranting caution.
Hourly RSI14 at 65.79 approaches overbought territory, and the 15-minute MACD histogram has turned negative.
The critical pivot band runs from $349.99 to $355.11 — price behavior here will likely define the next directional move.
Google Stock Price Action on the Daily Chart
Google stock’s daily chart displays a textbook bullish trend footprint, with price trading above every major moving average and EMAs stacked in proper alignment.
GOOG was trading at 351.82 after opening at 346.29, printing a range between 344.86 and 353.28. The price sits comfortably above the EMA20 at 341.01, the EMA50 at 343.81, and the EMA200 at 326.84.
This stacked alignment places the short-term EMA above the medium-term, which sits above the long-term. Price trades on top of all three — a classic bullish structure.
Meanwhile, RSI14 reads 59.16, firm without being stretched. There is room left before overbought territory becomes a concern.
Similarly, MACD tells a story of building strength. The line has crossed to 0.24 against a signal of -1.74, leaving a histogram of 1.97. This meaningful positive spread points to momentum that recently turned positive, rather than momentum already exhausted.
Bollinger Bands add nuance, however. The mid-band sits at 338.96 and the upper band at 350.35. The price at 351.82 actually trades above the upper band — a sign of strong directional pressure that can also flag short-term overextension.
Meanwhile, ATR14 stands at 7.78, confirming daily ranges remain wide and volatility is not compressed. On the pivot grid, price sits above the pivot point of 349.99 and closes in on R1 at 355.11. S1 at 346.69 acts as the first line of defense if sellers surface.
Notably, the system still tags the daily regime as neutral despite this bullish-looking setup. The gap between raw indicator alignment and regime label deserves attention. It suggests the trend, while intact, has not yet been confirmed as a clean, low-noise advance. The market may still be digesting the recent push higher before committing further.
Hourly Timeframe Confirms the Bullish Bias
The hourly chart reinforces Google stock’s bullish bias, with all EMAs stacked constructively beneath price and the regime explicitly labeled bullish.
GOOG’s last hourly candle closed at 351.82. EMA20 at 346.59, EMA50 at 342.7 and EMA200 at 340.94 are all stacked bullishly beneath price. RSI14 on this timeframe sits at 65.79, noticeably hotter than the daily reading and edging toward overbought. MACD is also more decisively positive here, with the line at 2.86 above a signal of 2.2 and a histogram of 0.65.
Bollinger Bands on the hourly show a mid-line of 345.42, an upper band of 353.62 and a lower band of 337.21. Price sits just under the upper band, rather than piercing through it as on the daily. ATR14 of 3.09 reflects hourly volatility proportionate to the timeframe.
Pivot levels are extremely tight: pp at 351.89, r1 at 352.66 and s1 at 351.04. Price is essentially parked right on the pivot. The hourly regime is explicitly labeled bullish, reinforcing the daily structure.
However, the higher RSI reading is a reminder that short-term buyers have been pushing harder than the daily chart alone would suggest. That kind of gap between timeframes often precedes a pause.
15-Minute Execution: A Short-Term Stall
The 15-minute chart reveals a short-term stall in Google stock’s momentum, with MACD diverging negatively even as the broader EMA structure holds.
GOOG’s most recent 15-minute candle closed at 351.82, essentially unchanged from the hourly close. This flatness itself hints at consolidation right at current levels. EMA20 at 350.71, EMA50 at 348.2 and EMA200 at 342.6 remain bullishly aligned. RSI14 at 59.28 is calm rather than stretched.
The notable wrinkle here is the MACD. The line sits at 1.41, just below the signal at 1.53, producing a negative histogram of -0.12. This is a small but clear divergence from the bullish tone on the daily and hourly charts.
In practice, short-term momentum is losing steam right where price tests resistance. The broader trend on higher timeframes remains intact, but the 15-minute picture shows hesitation.
Bollinger Bands show a tight mid-band of 350.66 against an upper band of 355.01 and lower band of 346.32. ATR14 has compressed to 1.27. Pivot levels are razor-thin: pp at 351.87, r1 at 351.98 and s1 at 351.71. Price is coiling at a decision point rather than trending cleanly in either direction.
The Bullish Case for Alphabet
The bullish case for Google stock hinges on the daily EMA alignment holding and price sustaining levels above the daily pivot at $349.99.
A push through R1 at $355.11 would support continuation. This requires the hourly and 15-minute MACD histograms flipping back positive, confirming short-term momentum is in sync with the broader trend.
On the news side, the narrative is constructive. Reports point to a rebound in Google Search performance. One widely read commentary describes the recent tech-sector selloff as reinforcing rather than weakening conviction in Alphabet.
Additionally, nearly $400 billion in combined AI infrastructure spending between Amazon and Alphabet this year frames Alphabet as a central player in the next leg of the AI buildout heading into 2027. If that spending narrative continues to attract capital rather than scare it away, the bullish structure across daily and hourly timeframes has room to extend.
The Bearish Risk and What Would Invalidate the Uptrend
The bearish risk centers on warning signs already visible inside Google stock’s current structure, not on a confirmed reversal signal.
Daily price trading above the upper Bollinger Band, combined with a daily regime still labeled neutral, suggests the move could be due for a cooling-off period. The hourly RSI at 65.79 is approaching stretched territory. At the same time, the 15-minute MACD histogram has already turned slightly negative.
A failure to hold above the daily pivot at 349.99, followed by a slide toward S1 at 346.69, would be the first concrete sign that momentum is fading. A deeper break below the daily EMA50 at $343.81 would signal something more serious: the bullish structure breaking down rather than simply pausing.
On the news side, the class-action lawsuit naming Google DeepMind over AI safety oversight is a reminder. Regulatory and legal headlines remain a live risk factor for Alphabet, independent of the technical picture.
Closing Take: A Layered Technical Picture
Google stock enters this stretch with a layered technical picture: a daily trend favoring buyers, an hourly chart confirming with urgency, and a 15-minute chart showing early hesitation at resistance.
That layered picture is not a conflict so much as a normal sequence. Strong daily and hourly alignment coexists with short-term momentum that needs to consolidate before pushing further.
Volatility remains elevated on the daily timeframe, judging by the ATR reading. Meanwhile, the 15-minute range has compressed — typical of a market pausing to decide its next move.
Given the daily regime is still tagged neutral despite the bullish EMA structure, and RSI readings on shorter timeframes run hotter than on the daily chart, positioning around current levels calls for discipline rather than conviction. The next few sessions should clarify the outlook. How price behaves around the 349.99 to 355.11 pivot band will determine whether this is the start of a fresh leg higher or a pause inside a broader range.
FAQ
What are the key levels to watch for Google stock right now?
The critical pivot band runs from $349.99 to $355.11. A break above R1 at $355.11 supports continuation. A failure to hold the daily pivot at $349.99 would be the first sign of fading momentum, with S1 at $346.69 as the next support.
Is Google stock’s trend still bullish?
The daily EMA alignment remains bullish with price above EMA20, EMA50, and EMA200. However, the daily regime is still tagged neutral, and shorter-timeframe RSI readings are approaching overbought levels, suggesting the trend has not yet been confirmed as a clean advance.
What are the main risks for Google stock currently?
Daily price trading above the upper Bollinger Band points to possible short-term overextension. The 15-minute MACD histogram has turned negative, and the hourly RSI at 65.79 is edging toward overbought territory. Additionally, the Google DeepMind class-action lawsuit highlights that regulatory risk remains live for Alphabet.
What does the 15-minute chart indicate for Google stock?
The 15-minute chart shows short-term momentum stalling, with MACD diverging negatively even as EMAs remain bullishly aligned. ATR compression to 1.27 suggests price is coiling at a decision point rather than trending cleanly in either direction.
Disclaimer: This article is for informational purposes only and does not constitute financial advice, an investment recommendation, or a solicitation to buy or sell any financial instrument or cryptocurrency. The analysis provided is not indicative of future results. Investing in crypto assets and financial markets carries a high risk of capital loss. Always do your own research (DYOR) and consult a qualified financial advisor before making any decision.
Article produced with the assistance of artificial intelligence and reviewed by the editorial team.
GOOG — daily chart with candlesticks, EMA20/EMA50 and volume.
Key takeaways
Google stock was trading at $351.82, above all major daily moving averages in a textbook bullish EMA stack.
Daily RSI14 sits at 59.16, firm but not overbought, while MACD has turned positive with a histogram of 1.97.
The daily regime remains tagged neutral despite the bullish EMA structure, warranting caution.
Hourly RSI14 at 65.79 approaches overbought territory, and the 15-minute MACD histogram has turned negative.
The critical pivot band runs from $349.99 to $355.11 — price behavior here will likely define the next directional move.
Google Stock Price Action on the Daily Chart
Google stock’s daily chart displays a textbook bullish trend footprint, with price trading above every major moving average and EMAs stacked in proper alignment.
GOOG was trading at 351.82 after opening at 346.29, printing a range between 344.86 and 353.28. The price sits comfortably above the EMA20 at 341.01, the EMA50 at 343.81, and the EMA200 at 326.84.
This stacked alignment places the short-term EMA above the medium-term, which sits above the long-term. Price trades on top of all three — a classic bullish structure.
Meanwhile, RSI14 reads 59.16, firm without being stretched. There is room left before overbought territory becomes a concern.
Similarly, MACD tells a story of building strength. The line has crossed to 0.24 against a signal of -1.74, leaving a histogram of 1.97. This meaningful positive spread points to momentum that recently turned positive, rather than momentum already exhausted.
Bollinger Bands add nuance, however. The mid-band sits at 338.96 and the upper band at 350.35. The price at 351.82 actually trades above the upper band — a sign of strong directional pressure that can also flag short-term overextension.
Meanwhile, ATR14 stands at 7.78, confirming daily ranges remain wide and volatility is not compressed. On the pivot grid, price sits above the pivot point of 349.99 and closes in on R1 at 355.11. S1 at 346.69 acts as the first line of defense if sellers surface.
Notably, the system still tags the daily regime as neutral despite this bullish-looking setup. The gap between raw indicator alignment and regime label deserves attention. It suggests the trend, while intact, has not yet been confirmed as a clean, low-noise advance. The market may still be digesting the recent push higher before committing further.
Hourly Timeframe Confirms the Bullish Bias
The hourly chart reinforces Google stock’s bullish bias, with all EMAs stacked constructively beneath price and the regime explicitly labeled bullish.
GOOG’s last hourly candle closed at 351.82. EMA20 at 346.59, EMA50 at 342.7 and EMA200 at 340.94 are all stacked bullishly beneath price. RSI14 on this timeframe sits at 65.79, noticeably hotter than the daily reading and edging toward overbought. MACD is also more decisively positive here, with the line at 2.86 above a signal of 2.2 and a histogram of 0.65.
Bollinger Bands on the hourly show a mid-line of 345.42, an upper band of 353.62 and a lower band of 337.21. Price sits just under the upper band, rather than piercing through it as on the daily. ATR14 of 3.09 reflects hourly volatility proportionate to the timeframe.
Pivot levels are extremely tight: pp at 351.89, r1 at 352.66 and s1 at 351.04. Price is essentially parked right on the pivot. The hourly regime is explicitly labeled bullish, reinforcing the daily structure.
However, the higher RSI reading is a reminder that short-term buyers have been pushing harder than the daily chart alone would suggest. That kind of gap between timeframes often precedes a pause.
15-Minute Execution: A Short-Term Stall
The 15-minute chart reveals a short-term stall in Google stock’s momentum, with MACD diverging negatively even as the broader EMA structure holds.
GOOG’s most recent 15-minute candle closed at 351.82, essentially unchanged from the hourly close. This flatness itself hints at consolidation right at current levels. EMA20 at 350.71, EMA50 at 348.2 and EMA200 at 342.6 remain bullishly aligned. RSI14 at 59.28 is calm rather than stretched.
The notable wrinkle here is the MACD. The line sits at 1.41, just below the signal at 1.53, producing a negative histogram of -0.12. This is a small but clear divergence from the bullish tone on the daily and hourly charts.
In practice, short-term momentum is losing steam right where price tests resistance. The broader trend on higher timeframes remains intact, but the 15-minute picture shows hesitation.
Bollinger Bands show a tight mid-band of 350.66 against an upper band of 355.01 and lower band of 346.32. ATR14 has compressed to 1.27. Pivot levels are razor-thin: pp at 351.87, r1 at 351.98 and s1 at 351.71. Price is coiling at a decision point rather than trending cleanly in either direction.
The Bullish Case for Alphabet
The bullish case for Google stock hinges on the daily EMA alignment holding and price sustaining levels above the daily pivot at $349.99.
A push through R1 at $355.11 would support continuation. This requires the hourly and 15-minute MACD histograms flipping back positive, confirming short-term momentum is in sync with the broader trend.
On the news side, the narrative is constructive. Reports point to a rebound in Google Search performance. One widely read commentary describes the recent tech-sector selloff as reinforcing rather than weakening conviction in Alphabet.
Additionally, nearly $400 billion in combined AI infrastructure spending between Amazon and Alphabet this year frames Alphabet as a central player in the next leg of the AI buildout heading into 2027. If that spending narrative continues to attract capital rather than scare it away, the bullish structure across daily and hourly timeframes has room to extend.
The Bearish Risk and What Would Invalidate the Uptrend
The bearish risk centers on warning signs already visible inside Google stock’s current structure, not on a confirmed reversal signal.
Daily price trading above the upper Bollinger Band, combined with a daily regime still labeled neutral, suggests the move could be due for a cooling-off period. The hourly RSI at 65.79 is approaching stretched territory. At the same time, the 15-minute MACD histogram has already turned slightly negative.
A failure to hold above the daily pivot at 349.99, followed by a slide toward S1 at 346.69, would be the first concrete sign that momentum is fading. A deeper break below the daily EMA50 at $343.81 would signal something more serious: the bullish structure breaking down rather than simply pausing.
On the news side, the class-action lawsuit naming Google DeepMind over AI safety oversight is a reminder. Regulatory and legal headlines remain a live risk factor for Alphabet, independent of the technical picture.
Closing Take: A Layered Technical Picture
Google stock enters this stretch with a layered technical picture: a daily trend favoring buyers, an hourly chart confirming with urgency, and a 15-minute chart showing early hesitation at resistance.
That layered picture is not a conflict so much as a normal sequence. Strong daily and hourly alignment coexists with short-term momentum that needs to consolidate before pushing further.
Volatility remains elevated on the daily timeframe, judging by the ATR reading. Meanwhile, the 15-minute range has compressed — typical of a market pausing to decide its next move.
Given the daily regime is still tagged neutral despite the bullish EMA structure, and RSI readings on shorter timeframes run hotter than on the daily chart, positioning around current levels calls for discipline rather than conviction. The next few sessions should clarify the outlook. How price behaves around the 349.99 to 355.11 pivot band will determine whether this is the start of a fresh leg higher or a pause inside a broader range.
FAQ
What are the key levels to watch for Google stock right now?
The critical pivot band runs from $349.99 to $355.11. A break above R1 at $355.11 supports continuation. A failure to hold the daily pivot at $349.99 would be the first sign of fading momentum, with S1 at $346.69 as the next support.
Is Google stock’s trend still bullish?
The daily EMA alignment remains bullish with price above EMA20, EMA50, and EMA200. However, the daily regime is still tagged neutral, and shorter-timeframe RSI readings are approaching overbought levels, suggesting the trend has not yet been confirmed as a clean advance.
What are the main risks for Google stock currently?
Daily price trading above the upper Bollinger Band points to possible short-term overextension. The 15-minute MACD histogram has turned negative, and the hourly RSI at 65.79 is edging toward overbought territory. Additionally, the Google DeepMind class-action lawsuit highlights that regulatory risk remains live for Alphabet.
What does the 15-minute chart indicate for Google stock?
The 15-minute chart shows short-term momentum stalling, with MACD diverging negatively even as EMAs remain bullishly aligned. ATR compression to 1.27 suggests price is coiling at a decision point rather than trending cleanly in either direction.
Disclaimer: This article is for informational purposes only and does not constitute financial advice, an investment recommendation, or a solicitation to buy or sell any financial instrument or cryptocurrency. The analysis provided is not indicative of future results. Investing in crypto assets and financial markets carries a high risk of capital loss. Always do your own research (DYOR) and consult a qualified financial advisor before making any decision.
Article produced with the assistance of artificial intelligence and reviewed by the editorial team.
8

Статья
Circle’s wrapped Bitcoin token cirBTC tops $150M in first-day Arc depositsBitcoin holders on Wall Street’s favorite new blockchain just got a way to put their coins to work without selling anything. Circle’s wrapped Bitcoin token, cirBTC, went live on the Arc network on September 21, 2026, giving institutions a regulated path to use Bitcoin as collateral inside a chain built specifically for corporate finance. The launch landed five days after Arc itself opened its mainnet to the public, and within its first 24 hours, cirBTC had already pulled in more than $150 million in lending deposits through one protocol alone.
Key takeaways
Circle’s wrapped Bitcoin token, cirBTC, launched on Arc mainnet on September 21, 2026, five days after Arc’s own public debut.
cirBTC is backed 1:1 by real Bitcoin held in reserve, issued by Circle International Bermuda Limited and regulated by the Bermuda Monetary Authority.
Chainlink verifies proof of reserves in real time through an on-chain system.
Morpho reported over $150 million in first-day lending deposits using cirBTC as collateral, while Aave V4 opened matching markets almost simultaneously.
As of September 19-20, 2026, total cirBTC supply sat around 949 tokens, worth roughly $77 million, against reserves of about 951 BTC.
Circle launches cirBTC on Arc mainnet
The arrival of Circle wrapped Bitcoin on Arc marks the company’s attempt to bring Bitcoin liquidity into a blockchain designed from the ground up for regulated, institutional finance. Arc’s own launch had already drawn attention: the chain rolled out with an inaugural validator list that included Visa, Mastercard and BlackRock, built on EVM-compatible code, and Circle minted 10 billion ARC tokens as part of the rollout, according to Fortune. cirBTC arrived on top of that infrastructure just five days later.
Every cirBTC token in circulation is matched 1:1 by actual Bitcoin held in reserve, meaning the wrapped asset carries no leverage or synthetic exposure baked into its structure. That backing model is the core selling point for a token aimed at institutions that need to prove, not just claim, that collateral exists.
Issuer and regulatory framework
Circle International Bermuda Limited issues cirBTC, and the Bermuda Monetary Authority regulates the operation. That regulatory wrapper is deliberate: it gives cirBTC a supervised issuance structure rather than leaving it as a purely on-chain, self-attested wrapped asset, which is the gap Circle is trying to close relative to older wrapped Bitcoin products.
Features and infrastructure behind cirBTC
Trust in a wrapped Bitcoin token lives or dies on whether the reserves are real and checkable. Circle addressed that by running real-time proof of reserves through Chainlink’s on-chain verification system, letting anyone check that cirBTC’s backing matches its circulating supply at any given moment rather than relying on periodic attestations.
On the access side, users can convert BTC, cbBTC, or wBTC into cirBTC with no fees on select flows, either through Arc’s native swap and bridge portal or via Circle Mint for institutional participants. Circle Mint now also offers a Digital Asset-Backed Borrowing option for qualifying institutions, extending the same infrastructure that already underpins USDC and EURC on Arc.
That shared plumbing matters structurally. Arc’s Layer-1 blockchain uses USDC as both its gas token and its primary settlement asset, which sets it apart from chains where ETH or a separate governance token handles those roles. Folding cirBTC into that same stablecoin-native environment means Bitcoin, USDC and EURC all move through one regulated settlement layer instead of three disconnected systems.
Early adoption and market response
The clearest signal of demand came from lending markets, not spot trading. Morpho, one of the first protocols to integrate the token, reported more than $150 million in deposits into its USDC and EURC vaults on cirBTC’s first day, with the token serving as the collateral layer for those positions. Aave V4 moved almost as fast, opening cirBTC, USDC, and EURC markets on Arc nearly simultaneously with Morpho’s rollout.
First-day lending deposits and circulating supply
Supply figures from September 19 to 20, 2026, show total cirBTC in circulation at roughly 949 tokens, with somewhere between 379 and 397 of those living on Arc and the rest still on Ethereum. At that point, the outstanding supply was valued at around $77 million, while reserves held slightly ahead of demand at approximately 951 BTC. That gap between reserves and circulating tokens is a detail worth watching as adoption scales, since it shows the backing running marginally above the issued supply rather than tightly matched to it.
Significance of cirBTC in DeFi and institutional use
Circle first floated plans for cirBTC back in April 2026, positioning it explicitly as an alternative to existing wrapped Bitcoin products already circulating in DeFi. The pitch is aimed squarely at institutions that want Bitcoin exposure inside decentralized finance but need documentation they can hand to compliance and audit teams, something a segregated custody model paired with Bermuda-based regulation and Chainlink-verified reserves is meant to provide.
What this changes in practice is how Bitcoin behaves once it enters Arc’s ecosystem. Instead of forcing holders to convert BTC into a dollar-denominated position before it can generate any return, cirBTC lets Bitcoin sit directly as collateral for lending and borrowing. That turns Bitcoin into a productive asset inside a framework Circle controls from issuance through settlement, rather than leaving it as a static store of value sitting outside the stablecoin ecosystem Arc was built around.
The broader question is whether that regulated packaging is enough to pull serious institutional Bitcoin liquidity away from incumbent wrapped tokens. The first-day numbers from Morpho and Aave suggest there was pent-up demand waiting for exactly this kind of compliance-first entry point, but a single day of deposits is a start, not a verdict on where Bitcoin collateral in DeFi ultimately settles.
FAQ
What is cirBTC and when was it launched?
cirBTC is Circle’s wrapped Bitcoin token launched on the Arc network on September 21, 2026.
How is cirBTC backed to ensure its value?
cirBTC is 1:1 backed by actual Bitcoin held in reserve, with real-time proof of reserves verified by Chainlink’s on-chain system.
Who issues cirBTC and under which regulatory authority?
Circle International Bermuda Limited issues cirBTC, and it is regulated by the Bermuda Monetary Authority.
Can users convert other Bitcoin tokens to cirBTC without fees?
Yes, users can convert BTC, cbBTC, or wBTC into cirBTC with no fees on select flows.
Article produced with the assistance of artificial intelligence and reviewed by the editorial team.
Circle’s wrapped Bitcoin token cirBTC tops $150M in first-day Arc deposits
Bitcoin holders on Wall Street’s favorite new blockchain just got a way to put their coins to work without selling anything. Circle’s wrapped Bitcoin token, cirBTC, went live on the Arc network on September 21, 2026, giving institutions a regulated path to use Bitcoin as collateral inside a chain built specifically for corporate finance. The launch landed five days after Arc itself opened its mainnet to the public, and within its first 24 hours, cirBTC had already pulled in more than $150 million in lending deposits through one protocol alone.
Key takeaways
Circle’s wrapped Bitcoin token, cirBTC, launched on Arc mainnet on September 21, 2026, five days after Arc’s own public debut.
cirBTC is backed 1:1 by real Bitcoin held in reserve, issued by Circle International Bermuda Limited and regulated by the Bermuda Monetary Authority.
Chainlink verifies proof of reserves in real time through an on-chain system.
Morpho reported over $150 million in first-day lending deposits using cirBTC as collateral, while Aave V4 opened matching markets almost simultaneously.
As of September 19-20, 2026, total cirBTC supply sat around 949 tokens, worth roughly $77 million, against reserves of about 951 BTC.
Circle launches cirBTC on Arc mainnet
The arrival of Circle wrapped Bitcoin on Arc marks the company’s attempt to bring Bitcoin liquidity into a blockchain designed from the ground up for regulated, institutional finance. Arc’s own launch had already drawn attention: the chain rolled out with an inaugural validator list that included Visa, Mastercard and BlackRock, built on EVM-compatible code, and Circle minted 10 billion ARC tokens as part of the rollout, according to Fortune. cirBTC arrived on top of that infrastructure just five days later.
Every cirBTC token in circulation is matched 1:1 by actual Bitcoin held in reserve, meaning the wrapped asset carries no leverage or synthetic exposure baked into its structure. That backing model is the core selling point for a token aimed at institutions that need to prove, not just claim, that collateral exists.
Issuer and regulatory framework
Circle International Bermuda Limited issues cirBTC, and the Bermuda Monetary Authority regulates the operation. That regulatory wrapper is deliberate: it gives cirBTC a supervised issuance structure rather than leaving it as a purely on-chain, self-attested wrapped asset, which is the gap Circle is trying to close relative to older wrapped Bitcoin products.
Features and infrastructure behind cirBTC
Trust in a wrapped Bitcoin token lives or dies on whether the reserves are real and checkable. Circle addressed that by running real-time proof of reserves through Chainlink’s on-chain verification system, letting anyone check that cirBTC’s backing matches its circulating supply at any given moment rather than relying on periodic attestations.
On the access side, users can convert BTC, cbBTC, or wBTC into cirBTC with no fees on select flows, either through Arc’s native swap and bridge portal or via Circle Mint for institutional participants. Circle Mint now also offers a Digital Asset-Backed Borrowing option for qualifying institutions, extending the same infrastructure that already underpins USDC and EURC on Arc.
That shared plumbing matters structurally. Arc’s Layer-1 blockchain uses USDC as both its gas token and its primary settlement asset, which sets it apart from chains where ETH or a separate governance token handles those roles. Folding cirBTC into that same stablecoin-native environment means Bitcoin, USDC and EURC all move through one regulated settlement layer instead of three disconnected systems.
Early adoption and market response
The clearest signal of demand came from lending markets, not spot trading. Morpho, one of the first protocols to integrate the token, reported more than $150 million in deposits into its USDC and EURC vaults on cirBTC’s first day, with the token serving as the collateral layer for those positions. Aave V4 moved almost as fast, opening cirBTC, USDC, and EURC markets on Arc nearly simultaneously with Morpho’s rollout.
First-day lending deposits and circulating supply
Supply figures from September 19 to 20, 2026, show total cirBTC in circulation at roughly 949 tokens, with somewhere between 379 and 397 of those living on Arc and the rest still on Ethereum. At that point, the outstanding supply was valued at around $77 million, while reserves held slightly ahead of demand at approximately 951 BTC. That gap between reserves and circulating tokens is a detail worth watching as adoption scales, since it shows the backing running marginally above the issued supply rather than tightly matched to it.
Significance of cirBTC in DeFi and institutional use
Circle first floated plans for cirBTC back in April 2026, positioning it explicitly as an alternative to existing wrapped Bitcoin products already circulating in DeFi. The pitch is aimed squarely at institutions that want Bitcoin exposure inside decentralized finance but need documentation they can hand to compliance and audit teams, something a segregated custody model paired with Bermuda-based regulation and Chainlink-verified reserves is meant to provide.
What this changes in practice is how Bitcoin behaves once it enters Arc’s ecosystem. Instead of forcing holders to convert BTC into a dollar-denominated position before it can generate any return, cirBTC lets Bitcoin sit directly as collateral for lending and borrowing. That turns Bitcoin into a productive asset inside a framework Circle controls from issuance through settlement, rather than leaving it as a static store of value sitting outside the stablecoin ecosystem Arc was built around.
The broader question is whether that regulated packaging is enough to pull serious institutional Bitcoin liquidity away from incumbent wrapped tokens. The first-day numbers from Morpho and Aave suggest there was pent-up demand waiting for exactly this kind of compliance-first entry point, but a single day of deposits is a start, not a verdict on where Bitcoin collateral in DeFi ultimately settles.
FAQ
What is cirBTC and when was it launched?
cirBTC is Circle’s wrapped Bitcoin token launched on the Arc network on September 21, 2026.
How is cirBTC backed to ensure its value?
cirBTC is 1:1 backed by actual Bitcoin held in reserve, with real-time proof of reserves verified by Chainlink’s on-chain system.
Who issues cirBTC and under which regulatory authority?
Circle International Bermuda Limited issues cirBTC, and it is regulated by the Bermuda Monetary Authority.
Can users convert other Bitcoin tokens to cirBTC without fees?
Yes, users can convert BTC, cbBTC, or wBTC into cirBTC with no fees on select flows.
Article produced with the assistance of artificial intelligence and reviewed by the editorial team.
Key takeaways
Circle’s wrapped Bitcoin token, cirBTC, launched on Arc mainnet on September 21, 2026, five days after Arc’s own public debut.
cirBTC is backed 1:1 by real Bitcoin held in reserve, issued by Circle International Bermuda Limited and regulated by the Bermuda Monetary Authority.
Chainlink verifies proof of reserves in real time through an on-chain system.
Morpho reported over $150 million in first-day lending deposits using cirBTC as collateral, while Aave V4 opened matching markets almost simultaneously.
As of September 19-20, 2026, total cirBTC supply sat around 949 tokens, worth roughly $77 million, against reserves of about 951 BTC.
Circle launches cirBTC on Arc mainnet
The arrival of Circle wrapped Bitcoin on Arc marks the company’s attempt to bring Bitcoin liquidity into a blockchain designed from the ground up for regulated, institutional finance. Arc’s own launch had already drawn attention: the chain rolled out with an inaugural validator list that included Visa, Mastercard and BlackRock, built on EVM-compatible code, and Circle minted 10 billion ARC tokens as part of the rollout, according to Fortune. cirBTC arrived on top of that infrastructure just five days later.
Every cirBTC token in circulation is matched 1:1 by actual Bitcoin held in reserve, meaning the wrapped asset carries no leverage or synthetic exposure baked into its structure. That backing model is the core selling point for a token aimed at institutions that need to prove, not just claim, that collateral exists.
Issuer and regulatory framework
Circle International Bermuda Limited issues cirBTC, and the Bermuda Monetary Authority regulates the operation. That regulatory wrapper is deliberate: it gives cirBTC a supervised issuance structure rather than leaving it as a purely on-chain, self-attested wrapped asset, which is the gap Circle is trying to close relative to older wrapped Bitcoin products.
Features and infrastructure behind cirBTC
Trust in a wrapped Bitcoin token lives or dies on whether the reserves are real and checkable. Circle addressed that by running real-time proof of reserves through Chainlink’s on-chain verification system, letting anyone check that cirBTC’s backing matches its circulating supply at any given moment rather than relying on periodic attestations.
On the access side, users can convert BTC, cbBTC, or wBTC into cirBTC with no fees on select flows, either through Arc’s native swap and bridge portal or via Circle Mint for institutional participants. Circle Mint now also offers a Digital Asset-Backed Borrowing option for qualifying institutions, extending the same infrastructure that already underpins USDC and EURC on Arc.
That shared plumbing matters structurally. Arc’s Layer-1 blockchain uses USDC as both its gas token and its primary settlement asset, which sets it apart from chains where ETH or a separate governance token handles those roles. Folding cirBTC into that same stablecoin-native environment means Bitcoin, USDC and EURC all move through one regulated settlement layer instead of three disconnected systems.
Early adoption and market response
The clearest signal of demand came from lending markets, not spot trading. Morpho, one of the first protocols to integrate the token, reported more than $150 million in deposits into its USDC and EURC vaults on cirBTC’s first day, with the token serving as the collateral layer for those positions. Aave V4 moved almost as fast, opening cirBTC, USDC, and EURC markets on Arc nearly simultaneously with Morpho’s rollout.
First-day lending deposits and circulating supply
Supply figures from September 19 to 20, 2026, show total cirBTC in circulation at roughly 949 tokens, with somewhere between 379 and 397 of those living on Arc and the rest still on Ethereum. At that point, the outstanding supply was valued at around $77 million, while reserves held slightly ahead of demand at approximately 951 BTC. That gap between reserves and circulating tokens is a detail worth watching as adoption scales, since it shows the backing running marginally above the issued supply rather than tightly matched to it.
Significance of cirBTC in DeFi and institutional use
Circle first floated plans for cirBTC back in April 2026, positioning it explicitly as an alternative to existing wrapped Bitcoin products already circulating in DeFi. The pitch is aimed squarely at institutions that want Bitcoin exposure inside decentralized finance but need documentation they can hand to compliance and audit teams, something a segregated custody model paired with Bermuda-based regulation and Chainlink-verified reserves is meant to provide.
What this changes in practice is how Bitcoin behaves once it enters Arc’s ecosystem. Instead of forcing holders to convert BTC into a dollar-denominated position before it can generate any return, cirBTC lets Bitcoin sit directly as collateral for lending and borrowing. That turns Bitcoin into a productive asset inside a framework Circle controls from issuance through settlement, rather than leaving it as a static store of value sitting outside the stablecoin ecosystem Arc was built around.
The broader question is whether that regulated packaging is enough to pull serious institutional Bitcoin liquidity away from incumbent wrapped tokens. The first-day numbers from Morpho and Aave suggest there was pent-up demand waiting for exactly this kind of compliance-first entry point, but a single day of deposits is a start, not a verdict on where Bitcoin collateral in DeFi ultimately settles.
FAQ
What is cirBTC and when was it launched?
cirBTC is Circle’s wrapped Bitcoin token launched on the Arc network on September 21, 2026.
How is cirBTC backed to ensure its value?
cirBTC is 1:1 backed by actual Bitcoin held in reserve, with real-time proof of reserves verified by Chainlink’s on-chain system.
Who issues cirBTC and under which regulatory authority?
Circle International Bermuda Limited issues cirBTC, and it is regulated by the Bermuda Monetary Authority.
Can users convert other Bitcoin tokens to cirBTC without fees?
Yes, users can convert BTC, cbBTC, or wBTC into cirBTC with no fees on select flows.
Article produced with the assistance of artificial intelligence and reviewed by the editorial team.
63
Статья
Meta’s AI assistant launch fuels 25% stock rally, its best month in yearsMeta just closed out its best month on the stock market in more than two years, and the reason wasn’t a new headset or a metaverse pivot. It was a piece of software that books your dinner reservations and argues with online sellers over price. The Meta AI assistant launch of an app called Muse on September 8 set off a rally that pushed shares up roughly 25% for the month, according to market data cited by Yahoo Finance and Bloomberg.
Key takeaways
Meta’s stock climbed about 25% in September 2026, its strongest monthly performance in over two years.
The rally was driven almost entirely by the launch of Muse, Meta’s personal AI assistant app, which debuted September 8 with free and paid tiers at $20 and $100 a month.
Muse reached number one in the US Apple App Store’s free apps category within its first week, outpacing ChatGPT.
Wells Fargo raised its Meta price target to $796, and Goldman Sachs and Morgan Stanley also flagged Muse as a turning point in the company’s AI strategy.
Mark Zuckerberg has described Muse as part of Meta’s push toward what he calls “personal superintelligence.”
Meta’s Best Stock Month in Years Fueled by AI Launch
Meta‘s September performance stands out because it broke a pattern of choppy, sideways trading that had defined much of the company’s stock action over the previous two years. The Meta stock rally wasn’t gradual — it accelerated sharply once Muse hit the market, and investors treated the app less like a gimmick and more like proof that Meta’s AI spending is starting to translate into product traction.
A 25% rally in September 2026
Shares of the social media giant climbed approximately 25% over the month, marking Meta’s strongest monthly gain in more than two years. That kind of move for a company of Meta’s size is unusual outside of earnings surprises, which is part of why Wall Street paid close attention to what was actually driving it.
A single-day surge adds fuel
The broader rally included a single-day jump of about 7%, a spike that lined up with growing attention to Muse’s early performance. For a stock the size of Meta’s, a move like that in one session signals more than routine trading noise — it reflects a real shift in how investors were pricing the company’s AI ambitions.
Muse: The Autonomous AI Assistant Driving Growth
Muse is not another chatbot competing for conversation share. It’s built to take a goal and actually go and execute it, which is the detail that seems to have caught both users and analysts off guard.
Launch details and subscription pricing
Muse launched on September 8 as a free download, with paid subscription tiers priced at $20 and $100 per month. The $20 tier is aimed at everyday consumers looking for basic task automation, while the $100 tier is positioned as a productivity tool for professionals and small businesses that need heavier use.
The app connects with third-party services like Gmail and Spotify, and it’s designed to handle multistep tasks without constant hand-holding — negotiating online purchases, booking reservations, and managing a user’s inbox are among the capabilities Meta has built into it. This kind of AI task automation is the core pitch: less typing, more doing.
What makes Muse different
What separates Muse from competing AI assistants is its emphasis on autonomous action rather than conversation. Instead of chatting back and forth, Muse is designed to take an instruction like finding a cheaper flight for a specific date and actually carry out the steps needed to make that happen.
Within its first week on the market, Muse climbed to the number one spot in the US Apple App Store’s free apps category, moving past established rivals including ChatGPT. That kind of ranking swing in seven days is a strong early signal of consumer curiosity, even if it doesn’t by itself prove Muse can hold onto paying subscribers over time.
Wall Street’s Response and What Comes Next
Financial firms didn’t wait long to recalibrate their view of Meta once Muse’s early numbers came in. Goldman Sachs, Wells Fargo, and Morgan Stanley all pointed to the app as a meaningful inflection point in Meta’s AI strategy, and several firms adjusted their price targets for the stock as a result.
Price target upgrades follow the launch
Wells Fargo raised its price target on Meta to $796, citing growing confidence that Muse could become a durable revenue stream rather than a short-lived novelty. That optimism builds on momentum that predates Muse entirely — Meta’s shares were already up roughly 38% from their March lows heading into the launch, meaning the AI assistant added to a rally that was already underway rather than starting one from scratch.
Mark Zuckerberg has framed the app as part of a broader ambition he calls “personal superintelligence” — the idea of an AI system that understands a user well enough to act on their behalf across the internet, not just answer questions about it. That framing matters for how investors read the Muse app features: this isn’t Meta chasing a chatbot trend, it’s positioning Muse as an early version of an assistant that manages tasks rather than just discusses them.
Meta’s annual Connect event is coming up, and the momentum from Muse gives Zuckerberg a stronger hand to play when he presents the company’s broader AI roadmap. Whether Muse’s early App Store ranking converts into lasting subscription revenue is the question Wall Street will be watching closely in the months ahead — for now, the market has rewarded the bet that autonomous AI action, not conversation, is where the next phase of the AI assistant race gets decided.
FAQ
What caused Meta’s stock to rise sharply in September 2026?
Meta’s stock rose about 25% primarily due to the launch of its AI assistant app Muse.
What are the key features of the Muse app?
Muse autonomously handles multistep tasks like booking reservations, negotiating purchases, and managing inboxes.
How is Muse priced for users?
Muse offers a free download with paid subscription tiers at $20 per month for consumers and $100 per month for professionals.
How has Wall Street reacted to Muse’s launch?
Several financial firms, including Wells Fargo, raised Meta’s stock price targets, highlighting Muse as a key AI strategy milestone.
Article produced with the assistance of artificial intelligence and reviewed by the editorial team.
Meta’s AI assistant launch fuels 25% stock rally, its best month in years
Meta just closed out its best month on the stock market in more than two years, and the reason wasn’t a new headset or a metaverse pivot. It was a piece of software that books your dinner reservations and argues with online sellers over price. The Meta AI assistant launch of an app called Muse on September 8 set off a rally that pushed shares up roughly 25% for the month, according to market data cited by Yahoo Finance and Bloomberg.
Key takeaways
Meta’s stock climbed about 25% in September 2026, its strongest monthly performance in over two years.
The rally was driven almost entirely by the launch of Muse, Meta’s personal AI assistant app, which debuted September 8 with free and paid tiers at $20 and $100 a month.
Muse reached number one in the US Apple App Store’s free apps category within its first week, outpacing ChatGPT.
Wells Fargo raised its Meta price target to $796, and Goldman Sachs and Morgan Stanley also flagged Muse as a turning point in the company’s AI strategy.
Mark Zuckerberg has described Muse as part of Meta’s push toward what he calls “personal superintelligence.”
Meta’s Best Stock Month in Years Fueled by AI Launch
Meta‘s September performance stands out because it broke a pattern of choppy, sideways trading that had defined much of the company’s stock action over the previous two years. The Meta stock rally wasn’t gradual — it accelerated sharply once Muse hit the market, and investors treated the app less like a gimmick and more like proof that Meta’s AI spending is starting to translate into product traction.
A 25% rally in September 2026
Shares of the social media giant climbed approximately 25% over the month, marking Meta’s strongest monthly gain in more than two years. That kind of move for a company of Meta’s size is unusual outside of earnings surprises, which is part of why Wall Street paid close attention to what was actually driving it.
A single-day surge adds fuel
The broader rally included a single-day jump of about 7%, a spike that lined up with growing attention to Muse’s early performance. For a stock the size of Meta’s, a move like that in one session signals more than routine trading noise — it reflects a real shift in how investors were pricing the company’s AI ambitions.
Muse: The Autonomous AI Assistant Driving Growth
Muse is not another chatbot competing for conversation share. It’s built to take a goal and actually go and execute it, which is the detail that seems to have caught both users and analysts off guard.
Launch details and subscription pricing
Muse launched on September 8 as a free download, with paid subscription tiers priced at $20 and $100 per month. The $20 tier is aimed at everyday consumers looking for basic task automation, while the $100 tier is positioned as a productivity tool for professionals and small businesses that need heavier use.
The app connects with third-party services like Gmail and Spotify, and it’s designed to handle multistep tasks without constant hand-holding — negotiating online purchases, booking reservations, and managing a user’s inbox are among the capabilities Meta has built into it. This kind of AI task automation is the core pitch: less typing, more doing.
What makes Muse different
What separates Muse from competing AI assistants is its emphasis on autonomous action rather than conversation. Instead of chatting back and forth, Muse is designed to take an instruction like finding a cheaper flight for a specific date and actually carry out the steps needed to make that happen.
Within its first week on the market, Muse climbed to the number one spot in the US Apple App Store’s free apps category, moving past established rivals including ChatGPT. That kind of ranking swing in seven days is a strong early signal of consumer curiosity, even if it doesn’t by itself prove Muse can hold onto paying subscribers over time.
Wall Street’s Response and What Comes Next
Financial firms didn’t wait long to recalibrate their view of Meta once Muse’s early numbers came in. Goldman Sachs, Wells Fargo, and Morgan Stanley all pointed to the app as a meaningful inflection point in Meta’s AI strategy, and several firms adjusted their price targets for the stock as a result.
Price target upgrades follow the launch
Wells Fargo raised its price target on Meta to $796, citing growing confidence that Muse could become a durable revenue stream rather than a short-lived novelty. That optimism builds on momentum that predates Muse entirely — Meta’s shares were already up roughly 38% from their March lows heading into the launch, meaning the AI assistant added to a rally that was already underway rather than starting one from scratch.
Mark Zuckerberg has framed the app as part of a broader ambition he calls “personal superintelligence” — the idea of an AI system that understands a user well enough to act on their behalf across the internet, not just answer questions about it. That framing matters for how investors read the Muse app features: this isn’t Meta chasing a chatbot trend, it’s positioning Muse as an early version of an assistant that manages tasks rather than just discusses them.
Meta’s annual Connect event is coming up, and the momentum from Muse gives Zuckerberg a stronger hand to play when he presents the company’s broader AI roadmap. Whether Muse’s early App Store ranking converts into lasting subscription revenue is the question Wall Street will be watching closely in the months ahead — for now, the market has rewarded the bet that autonomous AI action, not conversation, is where the next phase of the AI assistant race gets decided.
FAQ
What caused Meta’s stock to rise sharply in September 2026?
Meta’s stock rose about 25% primarily due to the launch of its AI assistant app Muse.
What are the key features of the Muse app?
Muse autonomously handles multistep tasks like booking reservations, negotiating purchases, and managing inboxes.
How is Muse priced for users?
Muse offers a free download with paid subscription tiers at $20 per month for consumers and $100 per month for professionals.
How has Wall Street reacted to Muse’s launch?
Several financial firms, including Wells Fargo, raised Meta’s stock price targets, highlighting Muse as a key AI strategy milestone.
Article produced with the assistance of artificial intelligence and reviewed by the editorial team.
Key takeaways
Meta’s stock climbed about 25% in September 2026, its strongest monthly performance in over two years.
The rally was driven almost entirely by the launch of Muse, Meta’s personal AI assistant app, which debuted September 8 with free and paid tiers at $20 and $100 a month.
Muse reached number one in the US Apple App Store’s free apps category within its first week, outpacing ChatGPT.
Wells Fargo raised its Meta price target to $796, and Goldman Sachs and Morgan Stanley also flagged Muse as a turning point in the company’s AI strategy.
Mark Zuckerberg has described Muse as part of Meta’s push toward what he calls “personal superintelligence.”
Meta’s Best Stock Month in Years Fueled by AI Launch
Meta‘s September performance stands out because it broke a pattern of choppy, sideways trading that had defined much of the company’s stock action over the previous two years. The Meta stock rally wasn’t gradual — it accelerated sharply once Muse hit the market, and investors treated the app less like a gimmick and more like proof that Meta’s AI spending is starting to translate into product traction.
A 25% rally in September 2026
Shares of the social media giant climbed approximately 25% over the month, marking Meta’s strongest monthly gain in more than two years. That kind of move for a company of Meta’s size is unusual outside of earnings surprises, which is part of why Wall Street paid close attention to what was actually driving it.
A single-day surge adds fuel
The broader rally included a single-day jump of about 7%, a spike that lined up with growing attention to Muse’s early performance. For a stock the size of Meta’s, a move like that in one session signals more than routine trading noise — it reflects a real shift in how investors were pricing the company’s AI ambitions.
Muse: The Autonomous AI Assistant Driving Growth
Muse is not another chatbot competing for conversation share. It’s built to take a goal and actually go and execute it, which is the detail that seems to have caught both users and analysts off guard.
Launch details and subscription pricing
Muse launched on September 8 as a free download, with paid subscription tiers priced at $20 and $100 per month. The $20 tier is aimed at everyday consumers looking for basic task automation, while the $100 tier is positioned as a productivity tool for professionals and small businesses that need heavier use.
The app connects with third-party services like Gmail and Spotify, and it’s designed to handle multistep tasks without constant hand-holding — negotiating online purchases, booking reservations, and managing a user’s inbox are among the capabilities Meta has built into it. This kind of AI task automation is the core pitch: less typing, more doing.
What makes Muse different
What separates Muse from competing AI assistants is its emphasis on autonomous action rather than conversation. Instead of chatting back and forth, Muse is designed to take an instruction like finding a cheaper flight for a specific date and actually carry out the steps needed to make that happen.
Within its first week on the market, Muse climbed to the number one spot in the US Apple App Store’s free apps category, moving past established rivals including ChatGPT. That kind of ranking swing in seven days is a strong early signal of consumer curiosity, even if it doesn’t by itself prove Muse can hold onto paying subscribers over time.
Wall Street’s Response and What Comes Next
Financial firms didn’t wait long to recalibrate their view of Meta once Muse’s early numbers came in. Goldman Sachs, Wells Fargo, and Morgan Stanley all pointed to the app as a meaningful inflection point in Meta’s AI strategy, and several firms adjusted their price targets for the stock as a result.
Price target upgrades follow the launch
Wells Fargo raised its price target on Meta to $796, citing growing confidence that Muse could become a durable revenue stream rather than a short-lived novelty. That optimism builds on momentum that predates Muse entirely — Meta’s shares were already up roughly 38% from their March lows heading into the launch, meaning the AI assistant added to a rally that was already underway rather than starting one from scratch.
Mark Zuckerberg has framed the app as part of a broader ambition he calls “personal superintelligence” — the idea of an AI system that understands a user well enough to act on their behalf across the internet, not just answer questions about it. That framing matters for how investors read the Muse app features: this isn’t Meta chasing a chatbot trend, it’s positioning Muse as an early version of an assistant that manages tasks rather than just discusses them.
Meta’s annual Connect event is coming up, and the momentum from Muse gives Zuckerberg a stronger hand to play when he presents the company’s broader AI roadmap. Whether Muse’s early App Store ranking converts into lasting subscription revenue is the question Wall Street will be watching closely in the months ahead — for now, the market has rewarded the bet that autonomous AI action, not conversation, is where the next phase of the AI assistant race gets decided.
FAQ
What caused Meta’s stock to rise sharply in September 2026?
Meta’s stock rose about 25% primarily due to the launch of its AI assistant app Muse.
What are the key features of the Muse app?
Muse autonomously handles multistep tasks like booking reservations, negotiating purchases, and managing inboxes.
How is Muse priced for users?
Muse offers a free download with paid subscription tiers at $20 per month for consumers and $100 per month for professionals.
How has Wall Street reacted to Muse’s launch?
Several financial firms, including Wells Fargo, raised Meta’s stock price targets, highlighting Muse as a key AI strategy milestone.
Article produced with the assistance of artificial intelligence and reviewed by the editorial team.
10

Статья
Global liquidity and Bitcoin: how much does it influence the price?Bitcoin is often described through its strongest narratives: digital scarcity, decentralization, protection from inflation, and an alternative to the traditional financial system. These are all valid interpretive keys, but none of them alone is enough to explain price behavior.
To understand Bitcoin’s performance, especially in the short and medium term, we also need to look at global liquidity. Beyond philosophy and technology, BTC is now a financial asset traded in a global market. Therefore, its price is affected by the amount of available capital, the cost of money, the strength of the dollar, and the level of investor confidence.
In other words, Bitcoin was born as an alternative to the system, but today its price is significantly influenced by the very system it aims to surpass. This is not necessarily a weakness: it is also a sign that Bitcoin has entered a more mature phase.
Bitcoin: digital gold or liquidity-sensitive asset?
Bitcoin’s most well-known feature is its limited supply. There can never be more than 21 million BTC, and this rule does not depend on a central bank, a government, or a political decision. This is where the digital gold narrative comes from: a scarce good, non-manipulable and potentially suitable for preserving value over the long term.
However, when you look at the price, the picture becomes more complex. Bitcoin does not always behave like a safe-haven asset. In several market phases it moves like an asset that is highly sensitive to liquidity: when there is an abundance of capital in the system and investors are willing to take on more risk, BTC often tends to benefit. When liquidity instead shrinks, rates rise and the dollar strengthens, Bitcoin tends to suffer.
This is a dynamic we have already seen several times. When money circulates easily, capital looks for opportunities with greater potential and also moves into crypto. In periods of monetary tightening, on the other hand, investors become more cautious and reduce their exposure to the most volatile assets.
What is global liquidity and what does M2 indicate?
When we talk about global liquidity, we refer to the amount of money and easily usable instruments present in the financial system. One of the most closely watched indicators is M2, which includes money in circulation, deposits, and other forms of liquidity. It is not a perfect measure, but it helps to understand how much fuel is available for the markets.
This relationship, however, is not automatic. It is not enough to say that if liquidity increases, Bitcoin goes up. It also matters where that liquidity goes. If the money remains parked in monetary or bond instruments considered safe, BTC can stay weak even in a context of rising liquidity. If instead investors return to seeking opportunities in more dynamic markets, Bitcoin can react strongly.
Liquidity, therefore, is the fuel. But the willingness to use it is also needed. Without confidence, without risk appetite and without inflows, liquidity alone is not enough to sustain a new bullish cycle.
Figure 1 – Trend of the price of Bitcoin and global M2 liquidity between 2015 and 2025: the historical correlation is significant, but lags, divergences and other macroeconomic factors make the relationship not always linear.
How interest rates and the dollar influence Bitcoin
Another decisive element is the level of real rates, that is, the yield on financial instruments net of inflation. When these returns are high, holding Bitcoin becomes less attractive for many institutional investors. Not because the long-term narrative disappears, but because the opportunity cost increases.
If an investor can obtain an attractive return from relatively safe instruments, they must have very strong conviction to take on exposure to a volatile asset, with no coupon and subject to sharp drawdowns. Conversely, when the market starts to expect lower rates or a more accommodative monetary policy, capital tends to look for alternatives with greater growth potential. In that context, Bitcoin often returns to the center of attention.
The dollar also plays a fundamental role. A strong dollar tends to reduce appetite for risky assets, while a weaker dollar can favor technology, commodities and crypto. Bitcoin is decentralized, but the market in which it is traded remains deeply tied to the dollar and to expectations about the Federal Reserve.
Spot Bitcoin ETFs: how they have changed the market
The arrival of spot Bitcoin ETFs has significantly changed the structure of demand. Previously, most capital flowed through crypto exchanges, stablecoins, private wallets and sector investors. Today, instead, a growing share can enter BTC through regulated instruments that are simple to buy and familiar to traditional finance.
However, there is also a downside: if Bitcoin enters traditional portfolios, it is also managed according to traditional logic. It can be bought when confidence in the markets increases, but it can be sold quickly when investors reduce their exposure to the most volatile assets. The ETF therefore makes Bitcoin more mature and liquid, but also more sensitive to institutional finance flows.
Why more liquidity does not always mean a rise in Bitcoin
The key point is that global liquidity matters a lot, but it never acts alone. There are phases in which liquidity increases because the system is healthy, confidence is growing and investors are looking for new opportunities. In these contexts, Bitcoin often tends to perform well, because it is perceived as an asset capable of amplifying market moves.
However, there are also phases in which liquidity increases for defensive reasons: banking stress, systemic risks, emergency interventions by central banks. In these cases, capital may not immediately flow into Bitcoin. It may first move toward the dollar, Treasuries, gold or cash, that is, toward instruments perceived as safer.
This explains why the relationship between Bitcoin and liquidity can show lags, divergences and false signals. The decisive variable is not only how much liquidity exists, but in what market climate it is injected. Bitcoin tends to benefit from liquidity when that liquidity meets confidence, risk appetite and concrete inflows into the crypto sector.
Can Bitcoin still be considered digital gold?
The question becomes inevitable: if Bitcoin depends so much on liquidity, can it still be considered digital gold? The answer is not clear-cut. Bitcoin retains unique monetary characteristics: limited supply, transparent rules, independence from central banks and the absence of a central authority that can arbitrarily change its issuance.
At the same time, the market does not price it solely on the basis of these characteristics. It also prices it based on flows, rates, the dollar, ETFs, leverage and sentiment. Bitcoin is therefore two things at the same time: an alternative monetary asset in the long term and an asset that is highly sensitive to liquidity in the short and medium term.
This dual nature is one of the reasons why it is so difficult to classify. It is not simply gold. It is not simply technology. It is not simply currency. It is a new type of macro-digital asset, in which programmed scarcity and global liquidity meet.
Global liquidity and the price of Bitcoin: conclusions
To understand where Bitcoin might go, it is not enough to look at the BTC/USD chart. You need to observe the broader context: real rates, expectations about the Federal Reserve, the strength of the dollar, net flows of spot ETFs, growth or contraction of global liquidity, and the behavior of equity markets.
The great contradiction is precisely this: Bitcoin was created to be independent of the traditional monetary system, but today its price is deeply influenced by central bank decisions, bond yields, the dollar and institutional flows. Perhaps this is not a weakness. Perhaps it is the price of adoption.
The more Bitcoin enters global finance, the more relevant it becomes. But the more relevant it becomes, the more it is influenced by the same forces that move other major financial assets. In this sense, to truly understand where the price of BTC can go, ignoring the level of global liquidity would certainly be a mistake.
Until next time and happy trading!
Andrea Unger
Global liquidity and Bitcoin: how much does it influence the price?
Bitcoin is often described through its strongest narratives: digital scarcity, decentralization, protection from inflation, and an alternative to the traditional financial system. These are all valid interpretive keys, but none of them alone is enough to explain price behavior.
To understand Bitcoin’s performance, especially in the short and medium term, we also need to look at global liquidity. Beyond philosophy and technology, BTC is now a financial asset traded in a global market. Therefore, its price is affected by the amount of available capital, the cost of money, the strength of the dollar, and the level of investor confidence.
In other words, Bitcoin was born as an alternative to the system, but today its price is significantly influenced by the very system it aims to surpass. This is not necessarily a weakness: it is also a sign that Bitcoin has entered a more mature phase.
Bitcoin: digital gold or liquidity-sensitive asset?
Bitcoin’s most well-known feature is its limited supply. There can never be more than 21 million BTC, and this rule does not depend on a central bank, a government, or a political decision. This is where the digital gold narrative comes from: a scarce good, non-manipulable and potentially suitable for preserving value over the long term.
However, when you look at the price, the picture becomes more complex. Bitcoin does not always behave like a safe-haven asset. In several market phases it moves like an asset that is highly sensitive to liquidity: when there is an abundance of capital in the system and investors are willing to take on more risk, BTC often tends to benefit. When liquidity instead shrinks, rates rise and the dollar strengthens, Bitcoin tends to suffer.
This is a dynamic we have already seen several times. When money circulates easily, capital looks for opportunities with greater potential and also moves into crypto. In periods of monetary tightening, on the other hand, investors become more cautious and reduce their exposure to the most volatile assets.
What is global liquidity and what does M2 indicate?
When we talk about global liquidity, we refer to the amount of money and easily usable instruments present in the financial system. One of the most closely watched indicators is M2, which includes money in circulation, deposits, and other forms of liquidity. It is not a perfect measure, but it helps to understand how much fuel is available for the markets.
This relationship, however, is not automatic. It is not enough to say that if liquidity increases, Bitcoin goes up. It also matters where that liquidity goes. If the money remains parked in monetary or bond instruments considered safe, BTC can stay weak even in a context of rising liquidity. If instead investors return to seeking opportunities in more dynamic markets, Bitcoin can react strongly.
Liquidity, therefore, is the fuel. But the willingness to use it is also needed. Without confidence, without risk appetite and without inflows, liquidity alone is not enough to sustain a new bullish cycle.
Figure 1 – Trend of the price of Bitcoin and global M2 liquidity between 2015 and 2025: the historical correlation is significant, but lags, divergences and other macroeconomic factors make the relationship not always linear.
How interest rates and the dollar influence Bitcoin
Another decisive element is the level of real rates, that is, the yield on financial instruments net of inflation. When these returns are high, holding Bitcoin becomes less attractive for many institutional investors. Not because the long-term narrative disappears, but because the opportunity cost increases.
If an investor can obtain an attractive return from relatively safe instruments, they must have very strong conviction to take on exposure to a volatile asset, with no coupon and subject to sharp drawdowns. Conversely, when the market starts to expect lower rates or a more accommodative monetary policy, capital tends to look for alternatives with greater growth potential. In that context, Bitcoin often returns to the center of attention.
The dollar also plays a fundamental role. A strong dollar tends to reduce appetite for risky assets, while a weaker dollar can favor technology, commodities and crypto. Bitcoin is decentralized, but the market in which it is traded remains deeply tied to the dollar and to expectations about the Federal Reserve.
Spot Bitcoin ETFs: how they have changed the market
The arrival of spot Bitcoin ETFs has significantly changed the structure of demand. Previously, most capital flowed through crypto exchanges, stablecoins, private wallets and sector investors. Today, instead, a growing share can enter BTC through regulated instruments that are simple to buy and familiar to traditional finance.
However, there is also a downside: if Bitcoin enters traditional portfolios, it is also managed according to traditional logic. It can be bought when confidence in the markets increases, but it can be sold quickly when investors reduce their exposure to the most volatile assets. The ETF therefore makes Bitcoin more mature and liquid, but also more sensitive to institutional finance flows.
Why more liquidity does not always mean a rise in Bitcoin
The key point is that global liquidity matters a lot, but it never acts alone. There are phases in which liquidity increases because the system is healthy, confidence is growing and investors are looking for new opportunities. In these contexts, Bitcoin often tends to perform well, because it is perceived as an asset capable of amplifying market moves.
However, there are also phases in which liquidity increases for defensive reasons: banking stress, systemic risks, emergency interventions by central banks. In these cases, capital may not immediately flow into Bitcoin. It may first move toward the dollar, Treasuries, gold or cash, that is, toward instruments perceived as safer.
This explains why the relationship between Bitcoin and liquidity can show lags, divergences and false signals. The decisive variable is not only how much liquidity exists, but in what market climate it is injected. Bitcoin tends to benefit from liquidity when that liquidity meets confidence, risk appetite and concrete inflows into the crypto sector.
Can Bitcoin still be considered digital gold?
The question becomes inevitable: if Bitcoin depends so much on liquidity, can it still be considered digital gold? The answer is not clear-cut. Bitcoin retains unique monetary characteristics: limited supply, transparent rules, independence from central banks and the absence of a central authority that can arbitrarily change its issuance.
At the same time, the market does not price it solely on the basis of these characteristics. It also prices it based on flows, rates, the dollar, ETFs, leverage and sentiment. Bitcoin is therefore two things at the same time: an alternative monetary asset in the long term and an asset that is highly sensitive to liquidity in the short and medium term.
This dual nature is one of the reasons why it is so difficult to classify. It is not simply gold. It is not simply technology. It is not simply currency. It is a new type of macro-digital asset, in which programmed scarcity and global liquidity meet.
Global liquidity and the price of Bitcoin: conclusions
To understand where Bitcoin might go, it is not enough to look at the BTC/USD chart. You need to observe the broader context: real rates, expectations about the Federal Reserve, the strength of the dollar, net flows of spot ETFs, growth or contraction of global liquidity, and the behavior of equity markets.
The great contradiction is precisely this: Bitcoin was created to be independent of the traditional monetary system, but today its price is deeply influenced by central bank decisions, bond yields, the dollar and institutional flows. Perhaps this is not a weakness. Perhaps it is the price of adoption.
The more Bitcoin enters global finance, the more relevant it becomes. But the more relevant it becomes, the more it is influenced by the same forces that move other major financial assets. In this sense, to truly understand where the price of BTC can go, ignoring the level of global liquidity would certainly be a mistake.
Until next time and happy trading!
Andrea Unger
To understand Bitcoin’s performance, especially in the short and medium term, we also need to look at global liquidity. Beyond philosophy and technology, BTC is now a financial asset traded in a global market. Therefore, its price is affected by the amount of available capital, the cost of money, the strength of the dollar, and the level of investor confidence.
In other words, Bitcoin was born as an alternative to the system, but today its price is significantly influenced by the very system it aims to surpass. This is not necessarily a weakness: it is also a sign that Bitcoin has entered a more mature phase.
Bitcoin: digital gold or liquidity-sensitive asset?
Bitcoin’s most well-known feature is its limited supply. There can never be more than 21 million BTC, and this rule does not depend on a central bank, a government, or a political decision. This is where the digital gold narrative comes from: a scarce good, non-manipulable and potentially suitable for preserving value over the long term.
However, when you look at the price, the picture becomes more complex. Bitcoin does not always behave like a safe-haven asset. In several market phases it moves like an asset that is highly sensitive to liquidity: when there is an abundance of capital in the system and investors are willing to take on more risk, BTC often tends to benefit. When liquidity instead shrinks, rates rise and the dollar strengthens, Bitcoin tends to suffer.
This is a dynamic we have already seen several times. When money circulates easily, capital looks for opportunities with greater potential and also moves into crypto. In periods of monetary tightening, on the other hand, investors become more cautious and reduce their exposure to the most volatile assets.
What is global liquidity and what does M2 indicate?
When we talk about global liquidity, we refer to the amount of money and easily usable instruments present in the financial system. One of the most closely watched indicators is M2, which includes money in circulation, deposits, and other forms of liquidity. It is not a perfect measure, but it helps to understand how much fuel is available for the markets.
This relationship, however, is not automatic. It is not enough to say that if liquidity increases, Bitcoin goes up. It also matters where that liquidity goes. If the money remains parked in monetary or bond instruments considered safe, BTC can stay weak even in a context of rising liquidity. If instead investors return to seeking opportunities in more dynamic markets, Bitcoin can react strongly.
Liquidity, therefore, is the fuel. But the willingness to use it is also needed. Without confidence, without risk appetite and without inflows, liquidity alone is not enough to sustain a new bullish cycle.
Figure 1 – Trend of the price of Bitcoin and global M2 liquidity between 2015 and 2025: the historical correlation is significant, but lags, divergences and other macroeconomic factors make the relationship not always linear.
How interest rates and the dollar influence Bitcoin
Another decisive element is the level of real rates, that is, the yield on financial instruments net of inflation. When these returns are high, holding Bitcoin becomes less attractive for many institutional investors. Not because the long-term narrative disappears, but because the opportunity cost increases.
If an investor can obtain an attractive return from relatively safe instruments, they must have very strong conviction to take on exposure to a volatile asset, with no coupon and subject to sharp drawdowns. Conversely, when the market starts to expect lower rates or a more accommodative monetary policy, capital tends to look for alternatives with greater growth potential. In that context, Bitcoin often returns to the center of attention.
The dollar also plays a fundamental role. A strong dollar tends to reduce appetite for risky assets, while a weaker dollar can favor technology, commodities and crypto. Bitcoin is decentralized, but the market in which it is traded remains deeply tied to the dollar and to expectations about the Federal Reserve.
Spot Bitcoin ETFs: how they have changed the market
The arrival of spot Bitcoin ETFs has significantly changed the structure of demand. Previously, most capital flowed through crypto exchanges, stablecoins, private wallets and sector investors. Today, instead, a growing share can enter BTC through regulated instruments that are simple to buy and familiar to traditional finance.
However, there is also a downside: if Bitcoin enters traditional portfolios, it is also managed according to traditional logic. It can be bought when confidence in the markets increases, but it can be sold quickly when investors reduce their exposure to the most volatile assets. The ETF therefore makes Bitcoin more mature and liquid, but also more sensitive to institutional finance flows.
Why more liquidity does not always mean a rise in Bitcoin
The key point is that global liquidity matters a lot, but it never acts alone. There are phases in which liquidity increases because the system is healthy, confidence is growing and investors are looking for new opportunities. In these contexts, Bitcoin often tends to perform well, because it is perceived as an asset capable of amplifying market moves.
However, there are also phases in which liquidity increases for defensive reasons: banking stress, systemic risks, emergency interventions by central banks. In these cases, capital may not immediately flow into Bitcoin. It may first move toward the dollar, Treasuries, gold or cash, that is, toward instruments perceived as safer.
This explains why the relationship between Bitcoin and liquidity can show lags, divergences and false signals. The decisive variable is not only how much liquidity exists, but in what market climate it is injected. Bitcoin tends to benefit from liquidity when that liquidity meets confidence, risk appetite and concrete inflows into the crypto sector.
Can Bitcoin still be considered digital gold?
The question becomes inevitable: if Bitcoin depends so much on liquidity, can it still be considered digital gold? The answer is not clear-cut. Bitcoin retains unique monetary characteristics: limited supply, transparent rules, independence from central banks and the absence of a central authority that can arbitrarily change its issuance.
At the same time, the market does not price it solely on the basis of these characteristics. It also prices it based on flows, rates, the dollar, ETFs, leverage and sentiment. Bitcoin is therefore two things at the same time: an alternative monetary asset in the long term and an asset that is highly sensitive to liquidity in the short and medium term.
This dual nature is one of the reasons why it is so difficult to classify. It is not simply gold. It is not simply technology. It is not simply currency. It is a new type of macro-digital asset, in which programmed scarcity and global liquidity meet.
Global liquidity and the price of Bitcoin: conclusions
To understand where Bitcoin might go, it is not enough to look at the BTC/USD chart. You need to observe the broader context: real rates, expectations about the Federal Reserve, the strength of the dollar, net flows of spot ETFs, growth or contraction of global liquidity, and the behavior of equity markets.
The great contradiction is precisely this: Bitcoin was created to be independent of the traditional monetary system, but today its price is deeply influenced by central bank decisions, bond yields, the dollar and institutional flows. Perhaps this is not a weakness. Perhaps it is the price of adoption.
The more Bitcoin enters global finance, the more relevant it becomes. But the more relevant it becomes, the more it is influenced by the same forces that move other major financial assets. In this sense, to truly understand where the price of BTC can go, ignoring the level of global liquidity would certainly be a mistake.
Until next time and happy trading!
Andrea Unger
123

Статья
Meta’s petabit subsea cable will double transatlantic data capacity by 2029Meta is stepping into new territory with the announcement of Petal, described as the first petabit subsea cable ever built to span an ocean. The project promises to double the data-carrying capacity of today’s most advanced transatlantic systems, and it does so using a fiber technology that has never before been deployed at this scale across thousands of kilometers of ocean floor.
Key takeaways
Petal will be the first transoceanic subsea cable to deliver petabit capacity, connecting France and the United States over roughly 7,000 km.
The cable is expected to enter service in 2029 and will carry 1 Pbps — double the capacity of Anjana, currently the most advanced transatlantic system.
Petal introduces 2-core fiber technology at scale, packing the equivalent of 48 fiber pairs into a 24 fiber-pair system.
Meta is building Petal with NEC as the turnkey supplier, Sumitomo Electric Industries as the fiber manufacturer, and Orange handling the French landing.
Its capacity is roughly enough for 75% of the world’s population to stream music at the same time.
Meta Launches Petal, the First Petabit-Capacity Transoceanic Subsea Cable
Petal marks a genuine first for the subsea industry: no other cable crossing an ocean has ever been engineered to move a full petabit of data per second. Meta unveiled the project as the newest addition to its growing portfolio of privately built undersea systems, positioning it as a direct answer to surging demand for cross-continental bandwidth.
Record-Breaking Capacity for Transatlantic Data Transmission
Petal will deliver 1 Pbps — that’s 1,000 terabits per second — which doubles the throughput of Anjana, Meta’s 24 fiber-pair system that currently holds the title of the most capable transatlantic cable at 0.5 Pbps. To put that scale into perspective, Meta says Petal’s total capacity is roughly what would be needed for 75% of the world’s population to stream music simultaneously. Few pieces of internet infrastructure operate at that kind of scale, which is part of why the announcement is drawing attention well beyond telecom engineering circles.
Route and Service Timeline
The cable will run approximately 7,000 km (4,300 mi), linking France directly to the United States. Meta expects Petal to enter service in 2029, giving the company and its partners a multi-year construction and testing window before the system goes live. That timeline places Petal alongside a broader wave of next-generation subsea projects the industry is racing to complete by the end of the decade.
Innovative Multi-Core Fiber Technology Powers Petal’s High Capacity
What sets Petal apart isn’t just its raw throughput — it’s the fiber technology making that throughput possible. Petal will be the first subsea cable system to deploy multi-core fiber technology at scale, a shift Meta describes as a rethinking of how the industry approaches cable design altogether.
Scaling Multi-Core Fiber at Subsea Distances
Subsea capacity has grown through several distinct eras. The erbium-doped fiber amplifier arrived in the 1980s, and coherent optical transmission in the 2010s pushed fiber capacity up by 10x or more — until physical limits started closing that door. The industry’s next move was spatial division multiplexing, simply adding more fiber pairs inside each cable. Meta walked that path itself, scaling from Marea’s eight fiber pairs to Amitié’s 16, then to Anjana’s 24.
Petal takes a different route. Rather than physically doubling the number of fiber pairs to 48, Meta opted for 2-core fiber technology packed into a 24 fiber-pair system — mathematically equivalent to 48 fiber pairs, but without the added bulk, materials, or power draw that a literal doubling would require. Meta calls it the single largest generational leap in capacity of any repeatered subsea system built to date.
Technical Challenges in Fiber and Repeater Design
Squeezing two cores into one strand of glass isn’t trivial. Engineers had to solve two separate problems: keeping attenuation low while preserving the fiber’s standard 125 μm width, and minimizing crosstalk between the two cores so signals don’t bleed into each other. Meta addressed the first challenge with ultra-pure synthetic silica during preform manufacturing, and the second by carefully tuning refractive indexes between the cores and the surrounding material, combined with counter-propagating the optical signals — a method that reduces crosstalk to what Meta calls nearly immeasurable levels.
The repeaters that amplify signals along the cable’s length needed their own redesign. A 7,000 km run typically requires around a hundred repeaters, and Petal’s version amplifies 96 fiber cores in a single body using a Fan-In/Fan-Out interface, which converts 2-core fiber into single-core fiber for amplification before converting it back. That approach lets Petal keep the efficiency and reliability of single-core amplification while doubling capacity — and crucially, it does so without pushing power requirements past existing limits. Petal will stay within power feeding equipment rated up to 18 kV, meaning the system avoids the costly requalification process that higher voltages would trigger.
Strategic Partnerships Drive Petal’s Construction and Deployment
Petal’s design only works because of the engineering behind it, and Meta is building the cable with three key partners. NEC serves as the turnkey system supplier, responsible for engineering, qualifying, manufacturing, and installing the finished cable — work Meta says required NEC to make significant new investments in manufacturing facilities capable of producing petabit-class repeaters and multicore fiber cable.
Sumitomo Electric Industries, acting as NEC’s fiber supplier, developed and manufactured the 2-core fiber itself, achieving what Meta describes as optical performance nearly identical to standard single-core fiber despite the added complexity.
Orange, meanwhile, is working with Meta on landing Petal along France’s Atlantic coast and integrating it into the European terrestrial network. Jean-Louis Le Roux, EVP of Orange International Networks, framed the milestone in historical terms: “Reaching one petabit on a transatlantic link, 25 years after the terabit milestone, represents a significant breakthrough to meet the exponential traffic growth while optimizing network capacity. This makes us very proud to welcome this new generation petabit subsea cable with dual-core fiber technology in our infrastructure, as the landing party in France. This new project reinforces our commitment with Meta and demonstrates our leading expertise in landing subsea systems, and extending connectivity to other European countries. It underlines our dedication to developing reliable infrastructure that guarantees the security and resilience of the terrestrial segment of those connections.”
Implications for Global Connectivity and Network Infrastructure
Petal isn’t happening in isolation. Meta has become one of the world’s largest private investors in subsea cable infrastructure, and this announcement lands alongside other major projects already underway — including Project Waterworth, a system spanning over 50,000 kilometers across five continents that also uses a 24 fiber-pair architecture, and Aurora, a transatlantic cable connecting the US to Denmark over roughly 7,268 kilometers, targeting around 497 Tbps and expected to enter service in 2028.
Supporting Massive Data Demand
Why does this matter beyond the engineering specs? Subsea cables remain the physical backbone carrying the overwhelming majority of intercontinental internet traffic — the messages, calls, and video streams moving between continents almost entirely travel through glass strands on the ocean floor. As demand for bandwidth keeps climbing, driven in part by AI workloads and growing reliance on cloud infrastructure, the pressure to expand capacity without proportionally expanding power and materials becomes a defining engineering problem. Petal’s approach — doubling throughput through fiber design rather than sheer physical scale — offers one answer to that problem, and Meta is positioning the technology as something the wider industry can adopt, not just a proprietary advantage.
Industry and Regional Impact
The push toward petabit-class subsea cables reflects a broader shift already visible across the tech sector, where hyperscalers have moved from leasing capacity on telecom-built cables to designing and owning their own systems outright. Meta isn’t alone in that race — other major technology companies have made similar moves into subsea infrastructure — but the scale of its recent commitments, from Waterworth’s five-continent reach to Petal’s petabit ambitions, stands out even within that competitive field. For France and the broader European market, Petal’s landing through Orange also reinforces the region’s role as a key terrestrial gateway for transatlantic data flows, a factor that matters as demand for reliable, high-capacity connectivity keeps rising on both sides of the Atlantic.
FAQ
What is Petal and what makes it innovative?
Petal is the first transoceanic subsea cable to deliver petabit capacity using multi-core fiber technology at scale, doubling previous cable capacities.
When will Petal enter service and what route does it cover?
Petal is expected to enter service in 2029 and will connect France and the United States over approximately 7,000 km.
How does Petal’s technology improve subsea cable capacity?
Petal uses 2-core fiber technology and a 24 fiber-pair system equivalent to 48 fiber pairs, enabling 1 Pbps capacity with efficient repeaters.
Which companies are partnering with Meta on the Petal cable project?
Meta is partnering with NEC, Sumitomo Electric Industries, and Orange to build and land the Petal subsea cable.
Article produced with the assistance of artificial intelligence and reviewed by the editorial team.
Meta’s petabit subsea cable will double transatlantic data capacity by 2029
Meta is stepping into new territory with the announcement of Petal, described as the first petabit subsea cable ever built to span an ocean. The project promises to double the data-carrying capacity of today’s most advanced transatlantic systems, and it does so using a fiber technology that has never before been deployed at this scale across thousands of kilometers of ocean floor.
Key takeaways
Petal will be the first transoceanic subsea cable to deliver petabit capacity, connecting France and the United States over roughly 7,000 km.
The cable is expected to enter service in 2029 and will carry 1 Pbps — double the capacity of Anjana, currently the most advanced transatlantic system.
Petal introduces 2-core fiber technology at scale, packing the equivalent of 48 fiber pairs into a 24 fiber-pair system.
Meta is building Petal with NEC as the turnkey supplier, Sumitomo Electric Industries as the fiber manufacturer, and Orange handling the French landing.
Its capacity is roughly enough for 75% of the world’s population to stream music at the same time.
Meta Launches Petal, the First Petabit-Capacity Transoceanic Subsea Cable
Petal marks a genuine first for the subsea industry: no other cable crossing an ocean has ever been engineered to move a full petabit of data per second. Meta unveiled the project as the newest addition to its growing portfolio of privately built undersea systems, positioning it as a direct answer to surging demand for cross-continental bandwidth.
Record-Breaking Capacity for Transatlantic Data Transmission
Petal will deliver 1 Pbps — that’s 1,000 terabits per second — which doubles the throughput of Anjana, Meta’s 24 fiber-pair system that currently holds the title of the most capable transatlantic cable at 0.5 Pbps. To put that scale into perspective, Meta says Petal’s total capacity is roughly what would be needed for 75% of the world’s population to stream music simultaneously. Few pieces of internet infrastructure operate at that kind of scale, which is part of why the announcement is drawing attention well beyond telecom engineering circles.
Route and Service Timeline
The cable will run approximately 7,000 km (4,300 mi), linking France directly to the United States. Meta expects Petal to enter service in 2029, giving the company and its partners a multi-year construction and testing window before the system goes live. That timeline places Petal alongside a broader wave of next-generation subsea projects the industry is racing to complete by the end of the decade.
Innovative Multi-Core Fiber Technology Powers Petal’s High Capacity
What sets Petal apart isn’t just its raw throughput — it’s the fiber technology making that throughput possible. Petal will be the first subsea cable system to deploy multi-core fiber technology at scale, a shift Meta describes as a rethinking of how the industry approaches cable design altogether.
Scaling Multi-Core Fiber at Subsea Distances
Subsea capacity has grown through several distinct eras. The erbium-doped fiber amplifier arrived in the 1980s, and coherent optical transmission in the 2010s pushed fiber capacity up by 10x or more — until physical limits started closing that door. The industry’s next move was spatial division multiplexing, simply adding more fiber pairs inside each cable. Meta walked that path itself, scaling from Marea’s eight fiber pairs to Amitié’s 16, then to Anjana’s 24.
Petal takes a different route. Rather than physically doubling the number of fiber pairs to 48, Meta opted for 2-core fiber technology packed into a 24 fiber-pair system — mathematically equivalent to 48 fiber pairs, but without the added bulk, materials, or power draw that a literal doubling would require. Meta calls it the single largest generational leap in capacity of any repeatered subsea system built to date.
Technical Challenges in Fiber and Repeater Design
Squeezing two cores into one strand of glass isn’t trivial. Engineers had to solve two separate problems: keeping attenuation low while preserving the fiber’s standard 125 μm width, and minimizing crosstalk between the two cores so signals don’t bleed into each other. Meta addressed the first challenge with ultra-pure synthetic silica during preform manufacturing, and the second by carefully tuning refractive indexes between the cores and the surrounding material, combined with counter-propagating the optical signals — a method that reduces crosstalk to what Meta calls nearly immeasurable levels.
The repeaters that amplify signals along the cable’s length needed their own redesign. A 7,000 km run typically requires around a hundred repeaters, and Petal’s version amplifies 96 fiber cores in a single body using a Fan-In/Fan-Out interface, which converts 2-core fiber into single-core fiber for amplification before converting it back. That approach lets Petal keep the efficiency and reliability of single-core amplification while doubling capacity — and crucially, it does so without pushing power requirements past existing limits. Petal will stay within power feeding equipment rated up to 18 kV, meaning the system avoids the costly requalification process that higher voltages would trigger.
Strategic Partnerships Drive Petal’s Construction and Deployment
Petal’s design only works because of the engineering behind it, and Meta is building the cable with three key partners. NEC serves as the turnkey system supplier, responsible for engineering, qualifying, manufacturing, and installing the finished cable — work Meta says required NEC to make significant new investments in manufacturing facilities capable of producing petabit-class repeaters and multicore fiber cable.
Sumitomo Electric Industries, acting as NEC’s fiber supplier, developed and manufactured the 2-core fiber itself, achieving what Meta describes as optical performance nearly identical to standard single-core fiber despite the added complexity.
Orange, meanwhile, is working with Meta on landing Petal along France’s Atlantic coast and integrating it into the European terrestrial network. Jean-Louis Le Roux, EVP of Orange International Networks, framed the milestone in historical terms: “Reaching one petabit on a transatlantic link, 25 years after the terabit milestone, represents a significant breakthrough to meet the exponential traffic growth while optimizing network capacity. This makes us very proud to welcome this new generation petabit subsea cable with dual-core fiber technology in our infrastructure, as the landing party in France. This new project reinforces our commitment with Meta and demonstrates our leading expertise in landing subsea systems, and extending connectivity to other European countries. It underlines our dedication to developing reliable infrastructure that guarantees the security and resilience of the terrestrial segment of those connections.”
Implications for Global Connectivity and Network Infrastructure
Petal isn’t happening in isolation. Meta has become one of the world’s largest private investors in subsea cable infrastructure, and this announcement lands alongside other major projects already underway — including Project Waterworth, a system spanning over 50,000 kilometers across five continents that also uses a 24 fiber-pair architecture, and Aurora, a transatlantic cable connecting the US to Denmark over roughly 7,268 kilometers, targeting around 497 Tbps and expected to enter service in 2028.
Supporting Massive Data Demand
Why does this matter beyond the engineering specs? Subsea cables remain the physical backbone carrying the overwhelming majority of intercontinental internet traffic — the messages, calls, and video streams moving between continents almost entirely travel through glass strands on the ocean floor. As demand for bandwidth keeps climbing, driven in part by AI workloads and growing reliance on cloud infrastructure, the pressure to expand capacity without proportionally expanding power and materials becomes a defining engineering problem. Petal’s approach — doubling throughput through fiber design rather than sheer physical scale — offers one answer to that problem, and Meta is positioning the technology as something the wider industry can adopt, not just a proprietary advantage.
Industry and Regional Impact
The push toward petabit-class subsea cables reflects a broader shift already visible across the tech sector, where hyperscalers have moved from leasing capacity on telecom-built cables to designing and owning their own systems outright. Meta isn’t alone in that race — other major technology companies have made similar moves into subsea infrastructure — but the scale of its recent commitments, from Waterworth’s five-continent reach to Petal’s petabit ambitions, stands out even within that competitive field. For France and the broader European market, Petal’s landing through Orange also reinforces the region’s role as a key terrestrial gateway for transatlantic data flows, a factor that matters as demand for reliable, high-capacity connectivity keeps rising on both sides of the Atlantic.
FAQ
What is Petal and what makes it innovative?
Petal is the first transoceanic subsea cable to deliver petabit capacity using multi-core fiber technology at scale, doubling previous cable capacities.
When will Petal enter service and what route does it cover?
Petal is expected to enter service in 2029 and will connect France and the United States over approximately 7,000 km.
How does Petal’s technology improve subsea cable capacity?
Petal uses 2-core fiber technology and a 24 fiber-pair system equivalent to 48 fiber pairs, enabling 1 Pbps capacity with efficient repeaters.
Which companies are partnering with Meta on the Petal cable project?
Meta is partnering with NEC, Sumitomo Electric Industries, and Orange to build and land the Petal subsea cable.
Article produced with the assistance of artificial intelligence and reviewed by the editorial team.
Key takeaways
Petal will be the first transoceanic subsea cable to deliver petabit capacity, connecting France and the United States over roughly 7,000 km.
The cable is expected to enter service in 2029 and will carry 1 Pbps — double the capacity of Anjana, currently the most advanced transatlantic system.
Petal introduces 2-core fiber technology at scale, packing the equivalent of 48 fiber pairs into a 24 fiber-pair system.
Meta is building Petal with NEC as the turnkey supplier, Sumitomo Electric Industries as the fiber manufacturer, and Orange handling the French landing.
Its capacity is roughly enough for 75% of the world’s population to stream music at the same time.
Meta Launches Petal, the First Petabit-Capacity Transoceanic Subsea Cable
Petal marks a genuine first for the subsea industry: no other cable crossing an ocean has ever been engineered to move a full petabit of data per second. Meta unveiled the project as the newest addition to its growing portfolio of privately built undersea systems, positioning it as a direct answer to surging demand for cross-continental bandwidth.
Record-Breaking Capacity for Transatlantic Data Transmission
Petal will deliver 1 Pbps — that’s 1,000 terabits per second — which doubles the throughput of Anjana, Meta’s 24 fiber-pair system that currently holds the title of the most capable transatlantic cable at 0.5 Pbps. To put that scale into perspective, Meta says Petal’s total capacity is roughly what would be needed for 75% of the world’s population to stream music simultaneously. Few pieces of internet infrastructure operate at that kind of scale, which is part of why the announcement is drawing attention well beyond telecom engineering circles.
Route and Service Timeline
The cable will run approximately 7,000 km (4,300 mi), linking France directly to the United States. Meta expects Petal to enter service in 2029, giving the company and its partners a multi-year construction and testing window before the system goes live. That timeline places Petal alongside a broader wave of next-generation subsea projects the industry is racing to complete by the end of the decade.
Innovative Multi-Core Fiber Technology Powers Petal’s High Capacity
What sets Petal apart isn’t just its raw throughput — it’s the fiber technology making that throughput possible. Petal will be the first subsea cable system to deploy multi-core fiber technology at scale, a shift Meta describes as a rethinking of how the industry approaches cable design altogether.
Scaling Multi-Core Fiber at Subsea Distances
Subsea capacity has grown through several distinct eras. The erbium-doped fiber amplifier arrived in the 1980s, and coherent optical transmission in the 2010s pushed fiber capacity up by 10x or more — until physical limits started closing that door. The industry’s next move was spatial division multiplexing, simply adding more fiber pairs inside each cable. Meta walked that path itself, scaling from Marea’s eight fiber pairs to Amitié’s 16, then to Anjana’s 24.
Petal takes a different route. Rather than physically doubling the number of fiber pairs to 48, Meta opted for 2-core fiber technology packed into a 24 fiber-pair system — mathematically equivalent to 48 fiber pairs, but without the added bulk, materials, or power draw that a literal doubling would require. Meta calls it the single largest generational leap in capacity of any repeatered subsea system built to date.
Technical Challenges in Fiber and Repeater Design
Squeezing two cores into one strand of glass isn’t trivial. Engineers had to solve two separate problems: keeping attenuation low while preserving the fiber’s standard 125 μm width, and minimizing crosstalk between the two cores so signals don’t bleed into each other. Meta addressed the first challenge with ultra-pure synthetic silica during preform manufacturing, and the second by carefully tuning refractive indexes between the cores and the surrounding material, combined with counter-propagating the optical signals — a method that reduces crosstalk to what Meta calls nearly immeasurable levels.
The repeaters that amplify signals along the cable’s length needed their own redesign. A 7,000 km run typically requires around a hundred repeaters, and Petal’s version amplifies 96 fiber cores in a single body using a Fan-In/Fan-Out interface, which converts 2-core fiber into single-core fiber for amplification before converting it back. That approach lets Petal keep the efficiency and reliability of single-core amplification while doubling capacity — and crucially, it does so without pushing power requirements past existing limits. Petal will stay within power feeding equipment rated up to 18 kV, meaning the system avoids the costly requalification process that higher voltages would trigger.
Strategic Partnerships Drive Petal’s Construction and Deployment
Petal’s design only works because of the engineering behind it, and Meta is building the cable with three key partners. NEC serves as the turnkey system supplier, responsible for engineering, qualifying, manufacturing, and installing the finished cable — work Meta says required NEC to make significant new investments in manufacturing facilities capable of producing petabit-class repeaters and multicore fiber cable.
Sumitomo Electric Industries, acting as NEC’s fiber supplier, developed and manufactured the 2-core fiber itself, achieving what Meta describes as optical performance nearly identical to standard single-core fiber despite the added complexity.
Orange, meanwhile, is working with Meta on landing Petal along France’s Atlantic coast and integrating it into the European terrestrial network. Jean-Louis Le Roux, EVP of Orange International Networks, framed the milestone in historical terms: “Reaching one petabit on a transatlantic link, 25 years after the terabit milestone, represents a significant breakthrough to meet the exponential traffic growth while optimizing network capacity. This makes us very proud to welcome this new generation petabit subsea cable with dual-core fiber technology in our infrastructure, as the landing party in France. This new project reinforces our commitment with Meta and demonstrates our leading expertise in landing subsea systems, and extending connectivity to other European countries. It underlines our dedication to developing reliable infrastructure that guarantees the security and resilience of the terrestrial segment of those connections.”
Implications for Global Connectivity and Network Infrastructure
Petal isn’t happening in isolation. Meta has become one of the world’s largest private investors in subsea cable infrastructure, and this announcement lands alongside other major projects already underway — including Project Waterworth, a system spanning over 50,000 kilometers across five continents that also uses a 24 fiber-pair architecture, and Aurora, a transatlantic cable connecting the US to Denmark over roughly 7,268 kilometers, targeting around 497 Tbps and expected to enter service in 2028.
Supporting Massive Data Demand
Why does this matter beyond the engineering specs? Subsea cables remain the physical backbone carrying the overwhelming majority of intercontinental internet traffic — the messages, calls, and video streams moving between continents almost entirely travel through glass strands on the ocean floor. As demand for bandwidth keeps climbing, driven in part by AI workloads and growing reliance on cloud infrastructure, the pressure to expand capacity without proportionally expanding power and materials becomes a defining engineering problem. Petal’s approach — doubling throughput through fiber design rather than sheer physical scale — offers one answer to that problem, and Meta is positioning the technology as something the wider industry can adopt, not just a proprietary advantage.
Industry and Regional Impact
The push toward petabit-class subsea cables reflects a broader shift already visible across the tech sector, where hyperscalers have moved from leasing capacity on telecom-built cables to designing and owning their own systems outright. Meta isn’t alone in that race — other major technology companies have made similar moves into subsea infrastructure — but the scale of its recent commitments, from Waterworth’s five-continent reach to Petal’s petabit ambitions, stands out even within that competitive field. For France and the broader European market, Petal’s landing through Orange also reinforces the region’s role as a key terrestrial gateway for transatlantic data flows, a factor that matters as demand for reliable, high-capacity connectivity keeps rising on both sides of the Atlantic.
FAQ
What is Petal and what makes it innovative?
Petal is the first transoceanic subsea cable to deliver petabit capacity using multi-core fiber technology at scale, doubling previous cable capacities.
When will Petal enter service and what route does it cover?
Petal is expected to enter service in 2029 and will connect France and the United States over approximately 7,000 km.
How does Petal’s technology improve subsea cable capacity?
Petal uses 2-core fiber technology and a 24 fiber-pair system equivalent to 48 fiber pairs, enabling 1 Pbps capacity with efficient repeaters.
Which companies are partnering with Meta on the Petal cable project?
Meta is partnering with NEC, Sumitomo Electric Industries, and Orange to build and land the Petal subsea cable.
Article produced with the assistance of artificial intelligence and reviewed by the editorial team.
18
Статья
Coinbase IPO access lets U.S. retail investors buy pre-market sharesRetail investors in the United States are getting a rare shot at something usually reserved for institutions and well-connected insiders: a piece of a company before it starts trading publicly. Starting this week, Coinbase IPO access is live inside the exchange’s app, letting eligible U.S. customers request shares in initial public offerings at the official offer price, before the stock ever opens on a public exchange. The rollout began with Oura’s IPO, according to a September 21, 2026 announcement from Coinbase.
Key takeaways
Coinbase now lets eligible U.S. retail traders request IPO share allocations directly through its app, starting with Oura’s offering.
The service runs through Coinbase Capital Markets, a FINRA-registered broker-dealer that acts strictly as an agent and does not underwrite deals or hold inventory.
Orders are cleared and custodied by Apex Clearing Corporation, and every participant must pass a standard FINRA eligibility questionnaire.
Selling allocated shares within the first 30 days can trigger a 60-day ban from future IPO participation, with repeat behavior shrinking future allocation sizes.
These securities offerings are kept legally and operationally separate from Coinbase’s crypto trading and custody services.
Coinbase launches IPO access for U.S. retail traders
The headline change is simple to state but significant in scope: ordinary traders can now try to buy into an IPO at the same price institutional buyers get, rather than waiting for shares to hit the open market — often at a markup. Coinbase frames this as an extension of what it calls the “Everything Exchange,” a positioning built around letting customers trade any asset at any stage of its lifecycle, from early-stage crypto tokens to now, pre-market equity shares.
Overview of the IPO feature
Coinbase describes the new feature as opening up primary financial markets, the stage where companies sell shares directly to raise capital, as opposed to the secondary market where existing shares change hands between investors. Historically, that first stage has been walled off from everyday retail traders. This launch changes that dynamic for U.S. customers, at least for deals Coinbase Capital Markets participates in.
How to request and receive IPO shares
The mechanics are laid out clearly by Coinbase. Customers open a dedicated IPOs page inside the app, pick an active deal, and fund their account to cover the cost of the shares they want. Once the expected price range for the offering becomes public, they submit what Coinbase calls a “Conditional Offer to Buy.” That offer can be edited or canceled while the order book stays open, though a price change beyond a set threshold requires resubmitting the request to remain eligible.
When the order book closes, shares get allocated using what Coinbase describes as an established methodology, then booked directly into the customer’s account at the IPO price. Because final allocations hinge on how much supply underwriters make available versus total customer demand, requests can be filled completely, partially, or not at all. Once the stock begins trading publicly, allocated shares become tradable on Coinbase like any other listed security.
Operational and regulatory framework
The IPO access program is not run directly by the crypto exchange itself but through a separately regulated entity, a structure Coinbase says keeps the offering compliant with U.S. securities rules. This distinction matters for anyone wondering how a crypto-native platform can legally offer traditional stock allocations.
Role of Coinbase Capital Markets and regulatory compliance
Coinbase Capital Markets, referred to internally as CCM, is the FINRA-registered broker-dealer that makes the whole arrangement possible. CCM takes part in IPOs as what’s known as a best-efforts selling-group member, meaning it aggregates customer orders and passes them along rather than guaranteeing sales. Crucially, CCM acts purely as an agent on the customer’s behalf. It does not underwrite deals, does not hold inventory, and never takes the opposite side of a trade — a structural safeguard against conflicts of interest that often worry regulators when a single company both sells and trades a security.
Order routing, clearing, and custody arrangements
Once orders are aggregated, CCM routes them through its clearing partner, Apex Clearing Corporation, which handles execution, clearing, and custody for all the securities involved. Every user, before participating, must complete a standard FINRA eligibility questionnaire designed to flag potential restricted status. Coinbase is explicit that these securities services, offered through CCM, are entirely separate from the digital asset services provided by Coinbase Inc. and its affiliates. That separation also means SIPC protection, which typically covers securities accounts, does not extend to digital assets or cash held in a customer’s regular Coinbase account. Additional details on the broker-dealer are available through FINRA’s BrokerCheck, Coinbase noted.
Participation rules and long-term investment incentives
Coinbase built the allocation system to reward patience rather than quick flips, which shapes who actually benefits from getting an IPO allocation in the first place. The company says its allocation algorithm favors investors who intend to hold their shares rather than sell them the moment trading opens.
Restrictions on selling IPO shares early
The rule is specific: selling IPO shares within the first 30 days can result in being barred from IPO participation for the following 60 days. Repeat that pattern, and Coinbase says allocations become smaller and less frequent going forward, compared with investors who hold their shares for longer stretches.
Impact on future IPO participation
In practice, this creates a direct incentive structure tied to future access. A trader chasing a quick pop on listing day risks losing the ability to participate in the next deal for two months, and repeated early selling appears to permanently shrink how much access that trader gets down the line. For a platform trying to build a reputation as a long-term venue for primary-market investing, that kind of friction against flipping shares is a deliberate design choice — one that separates this offering from the speculative, fast-turnover culture often associated with crypto trading.
This matters beyond the mechanics of one IPO. If Coinbase Capital Markets keeps expanding the number of deals it participates in, as the company has said it plans to do as more selling-group allocations become available, the platform could become a meaningful new channel connecting everyday U.S. investors to companies at the moment they go public — a stage of the market that has largely stayed out of retail reach until now.
FAQ
How can U.S. retail customers participate in IPOs on Coinbase?
Eligible customers can request IPO share allocations through the Coinbase app before public trading starts by submitting a conditional offer once the expected price range is public.
What regulatory measures apply to IPO participation on Coinbase?
Coinbase Capital Markets, a FINRA-registered broker-dealer, offers the IPOs. Users must complete a FINRA eligibility questionnaire, and orders are cleared via Apex Clearing Corporation.
What happens if I sell IPO shares within 30 days of allocation?
Selling IPO shares within the first 30 days may result in being barred from further IPO participation for 60 days, and receiving smaller allocations if the behavior repeats.
Are Coinbase’s IPO securities connected to its digital asset trading services?
No. Securities offered via Coinbase Capital Markets are kept separate from Coinbase’s digital asset services.
Article produced with the assistance of artificial intelligence and reviewed by the editorial team.
Coinbase IPO access lets U.S. retail investors buy pre-market shares
Retail investors in the United States are getting a rare shot at something usually reserved for institutions and well-connected insiders: a piece of a company before it starts trading publicly. Starting this week, Coinbase IPO access is live inside the exchange’s app, letting eligible U.S. customers request shares in initial public offerings at the official offer price, before the stock ever opens on a public exchange. The rollout began with Oura’s IPO, according to a September 21, 2026 announcement from Coinbase.
Key takeaways
Coinbase now lets eligible U.S. retail traders request IPO share allocations directly through its app, starting with Oura’s offering.
The service runs through Coinbase Capital Markets, a FINRA-registered broker-dealer that acts strictly as an agent and does not underwrite deals or hold inventory.
Orders are cleared and custodied by Apex Clearing Corporation, and every participant must pass a standard FINRA eligibility questionnaire.
Selling allocated shares within the first 30 days can trigger a 60-day ban from future IPO participation, with repeat behavior shrinking future allocation sizes.
These securities offerings are kept legally and operationally separate from Coinbase’s crypto trading and custody services.
Coinbase launches IPO access for U.S. retail traders
The headline change is simple to state but significant in scope: ordinary traders can now try to buy into an IPO at the same price institutional buyers get, rather than waiting for shares to hit the open market — often at a markup. Coinbase frames this as an extension of what it calls the “Everything Exchange,” a positioning built around letting customers trade any asset at any stage of its lifecycle, from early-stage crypto tokens to now, pre-market equity shares.
Overview of the IPO feature
Coinbase describes the new feature as opening up primary financial markets, the stage where companies sell shares directly to raise capital, as opposed to the secondary market where existing shares change hands between investors. Historically, that first stage has been walled off from everyday retail traders. This launch changes that dynamic for U.S. customers, at least for deals Coinbase Capital Markets participates in.
How to request and receive IPO shares
The mechanics are laid out clearly by Coinbase. Customers open a dedicated IPOs page inside the app, pick an active deal, and fund their account to cover the cost of the shares they want. Once the expected price range for the offering becomes public, they submit what Coinbase calls a “Conditional Offer to Buy.” That offer can be edited or canceled while the order book stays open, though a price change beyond a set threshold requires resubmitting the request to remain eligible.
When the order book closes, shares get allocated using what Coinbase describes as an established methodology, then booked directly into the customer’s account at the IPO price. Because final allocations hinge on how much supply underwriters make available versus total customer demand, requests can be filled completely, partially, or not at all. Once the stock begins trading publicly, allocated shares become tradable on Coinbase like any other listed security.
Operational and regulatory framework
The IPO access program is not run directly by the crypto exchange itself but through a separately regulated entity, a structure Coinbase says keeps the offering compliant with U.S. securities rules. This distinction matters for anyone wondering how a crypto-native platform can legally offer traditional stock allocations.
Role of Coinbase Capital Markets and regulatory compliance
Coinbase Capital Markets, referred to internally as CCM, is the FINRA-registered broker-dealer that makes the whole arrangement possible. CCM takes part in IPOs as what’s known as a best-efforts selling-group member, meaning it aggregates customer orders and passes them along rather than guaranteeing sales. Crucially, CCM acts purely as an agent on the customer’s behalf. It does not underwrite deals, does not hold inventory, and never takes the opposite side of a trade — a structural safeguard against conflicts of interest that often worry regulators when a single company both sells and trades a security.
Order routing, clearing, and custody arrangements
Once orders are aggregated, CCM routes them through its clearing partner, Apex Clearing Corporation, which handles execution, clearing, and custody for all the securities involved. Every user, before participating, must complete a standard FINRA eligibility questionnaire designed to flag potential restricted status. Coinbase is explicit that these securities services, offered through CCM, are entirely separate from the digital asset services provided by Coinbase Inc. and its affiliates. That separation also means SIPC protection, which typically covers securities accounts, does not extend to digital assets or cash held in a customer’s regular Coinbase account. Additional details on the broker-dealer are available through FINRA’s BrokerCheck, Coinbase noted.
Participation rules and long-term investment incentives
Coinbase built the allocation system to reward patience rather than quick flips, which shapes who actually benefits from getting an IPO allocation in the first place. The company says its allocation algorithm favors investors who intend to hold their shares rather than sell them the moment trading opens.
Restrictions on selling IPO shares early
The rule is specific: selling IPO shares within the first 30 days can result in being barred from IPO participation for the following 60 days. Repeat that pattern, and Coinbase says allocations become smaller and less frequent going forward, compared with investors who hold their shares for longer stretches.
Impact on future IPO participation
In practice, this creates a direct incentive structure tied to future access. A trader chasing a quick pop on listing day risks losing the ability to participate in the next deal for two months, and repeated early selling appears to permanently shrink how much access that trader gets down the line. For a platform trying to build a reputation as a long-term venue for primary-market investing, that kind of friction against flipping shares is a deliberate design choice — one that separates this offering from the speculative, fast-turnover culture often associated with crypto trading.
This matters beyond the mechanics of one IPO. If Coinbase Capital Markets keeps expanding the number of deals it participates in, as the company has said it plans to do as more selling-group allocations become available, the platform could become a meaningful new channel connecting everyday U.S. investors to companies at the moment they go public — a stage of the market that has largely stayed out of retail reach until now.
FAQ
How can U.S. retail customers participate in IPOs on Coinbase?
Eligible customers can request IPO share allocations through the Coinbase app before public trading starts by submitting a conditional offer once the expected price range is public.
What regulatory measures apply to IPO participation on Coinbase?
Coinbase Capital Markets, a FINRA-registered broker-dealer, offers the IPOs. Users must complete a FINRA eligibility questionnaire, and orders are cleared via Apex Clearing Corporation.
What happens if I sell IPO shares within 30 days of allocation?
Selling IPO shares within the first 30 days may result in being barred from further IPO participation for 60 days, and receiving smaller allocations if the behavior repeats.
Are Coinbase’s IPO securities connected to its digital asset trading services?
No. Securities offered via Coinbase Capital Markets are kept separate from Coinbase’s digital asset services.
Article produced with the assistance of artificial intelligence and reviewed by the editorial team.
Key takeaways
Coinbase now lets eligible U.S. retail traders request IPO share allocations directly through its app, starting with Oura’s offering.
The service runs through Coinbase Capital Markets, a FINRA-registered broker-dealer that acts strictly as an agent and does not underwrite deals or hold inventory.
Orders are cleared and custodied by Apex Clearing Corporation, and every participant must pass a standard FINRA eligibility questionnaire.
Selling allocated shares within the first 30 days can trigger a 60-day ban from future IPO participation, with repeat behavior shrinking future allocation sizes.
These securities offerings are kept legally and operationally separate from Coinbase’s crypto trading and custody services.
Coinbase launches IPO access for U.S. retail traders
The headline change is simple to state but significant in scope: ordinary traders can now try to buy into an IPO at the same price institutional buyers get, rather than waiting for shares to hit the open market — often at a markup. Coinbase frames this as an extension of what it calls the “Everything Exchange,” a positioning built around letting customers trade any asset at any stage of its lifecycle, from early-stage crypto tokens to now, pre-market equity shares.
Overview of the IPO feature
Coinbase describes the new feature as opening up primary financial markets, the stage where companies sell shares directly to raise capital, as opposed to the secondary market where existing shares change hands between investors. Historically, that first stage has been walled off from everyday retail traders. This launch changes that dynamic for U.S. customers, at least for deals Coinbase Capital Markets participates in.
How to request and receive IPO shares
The mechanics are laid out clearly by Coinbase. Customers open a dedicated IPOs page inside the app, pick an active deal, and fund their account to cover the cost of the shares they want. Once the expected price range for the offering becomes public, they submit what Coinbase calls a “Conditional Offer to Buy.” That offer can be edited or canceled while the order book stays open, though a price change beyond a set threshold requires resubmitting the request to remain eligible.
When the order book closes, shares get allocated using what Coinbase describes as an established methodology, then booked directly into the customer’s account at the IPO price. Because final allocations hinge on how much supply underwriters make available versus total customer demand, requests can be filled completely, partially, or not at all. Once the stock begins trading publicly, allocated shares become tradable on Coinbase like any other listed security.
Operational and regulatory framework
The IPO access program is not run directly by the crypto exchange itself but through a separately regulated entity, a structure Coinbase says keeps the offering compliant with U.S. securities rules. This distinction matters for anyone wondering how a crypto-native platform can legally offer traditional stock allocations.
Role of Coinbase Capital Markets and regulatory compliance
Coinbase Capital Markets, referred to internally as CCM, is the FINRA-registered broker-dealer that makes the whole arrangement possible. CCM takes part in IPOs as what’s known as a best-efforts selling-group member, meaning it aggregates customer orders and passes them along rather than guaranteeing sales. Crucially, CCM acts purely as an agent on the customer’s behalf. It does not underwrite deals, does not hold inventory, and never takes the opposite side of a trade — a structural safeguard against conflicts of interest that often worry regulators when a single company both sells and trades a security.
Order routing, clearing, and custody arrangements
Once orders are aggregated, CCM routes them through its clearing partner, Apex Clearing Corporation, which handles execution, clearing, and custody for all the securities involved. Every user, before participating, must complete a standard FINRA eligibility questionnaire designed to flag potential restricted status. Coinbase is explicit that these securities services, offered through CCM, are entirely separate from the digital asset services provided by Coinbase Inc. and its affiliates. That separation also means SIPC protection, which typically covers securities accounts, does not extend to digital assets or cash held in a customer’s regular Coinbase account. Additional details on the broker-dealer are available through FINRA’s BrokerCheck, Coinbase noted.
Participation rules and long-term investment incentives
Coinbase built the allocation system to reward patience rather than quick flips, which shapes who actually benefits from getting an IPO allocation in the first place. The company says its allocation algorithm favors investors who intend to hold their shares rather than sell them the moment trading opens.
Restrictions on selling IPO shares early
The rule is specific: selling IPO shares within the first 30 days can result in being barred from IPO participation for the following 60 days. Repeat that pattern, and Coinbase says allocations become smaller and less frequent going forward, compared with investors who hold their shares for longer stretches.
Impact on future IPO participation
In practice, this creates a direct incentive structure tied to future access. A trader chasing a quick pop on listing day risks losing the ability to participate in the next deal for two months, and repeated early selling appears to permanently shrink how much access that trader gets down the line. For a platform trying to build a reputation as a long-term venue for primary-market investing, that kind of friction against flipping shares is a deliberate design choice — one that separates this offering from the speculative, fast-turnover culture often associated with crypto trading.
This matters beyond the mechanics of one IPO. If Coinbase Capital Markets keeps expanding the number of deals it participates in, as the company has said it plans to do as more selling-group allocations become available, the platform could become a meaningful new channel connecting everyday U.S. investors to companies at the moment they go public — a stage of the market that has largely stayed out of retail reach until now.
FAQ
How can U.S. retail customers participate in IPOs on Coinbase?
Eligible customers can request IPO share allocations through the Coinbase app before public trading starts by submitting a conditional offer once the expected price range is public.
What regulatory measures apply to IPO participation on Coinbase?
Coinbase Capital Markets, a FINRA-registered broker-dealer, offers the IPOs. Users must complete a FINRA eligibility questionnaire, and orders are cleared via Apex Clearing Corporation.
What happens if I sell IPO shares within 30 days of allocation?
Selling IPO shares within the first 30 days may result in being barred from further IPO participation for 60 days, and receiving smaller allocations if the behavior repeats.
Are Coinbase’s IPO securities connected to its digital asset trading services?
No. Securities offered via Coinbase Capital Markets are kept separate from Coinbase’s digital asset services.
Article produced with the assistance of artificial intelligence and reviewed by the editorial team.
125
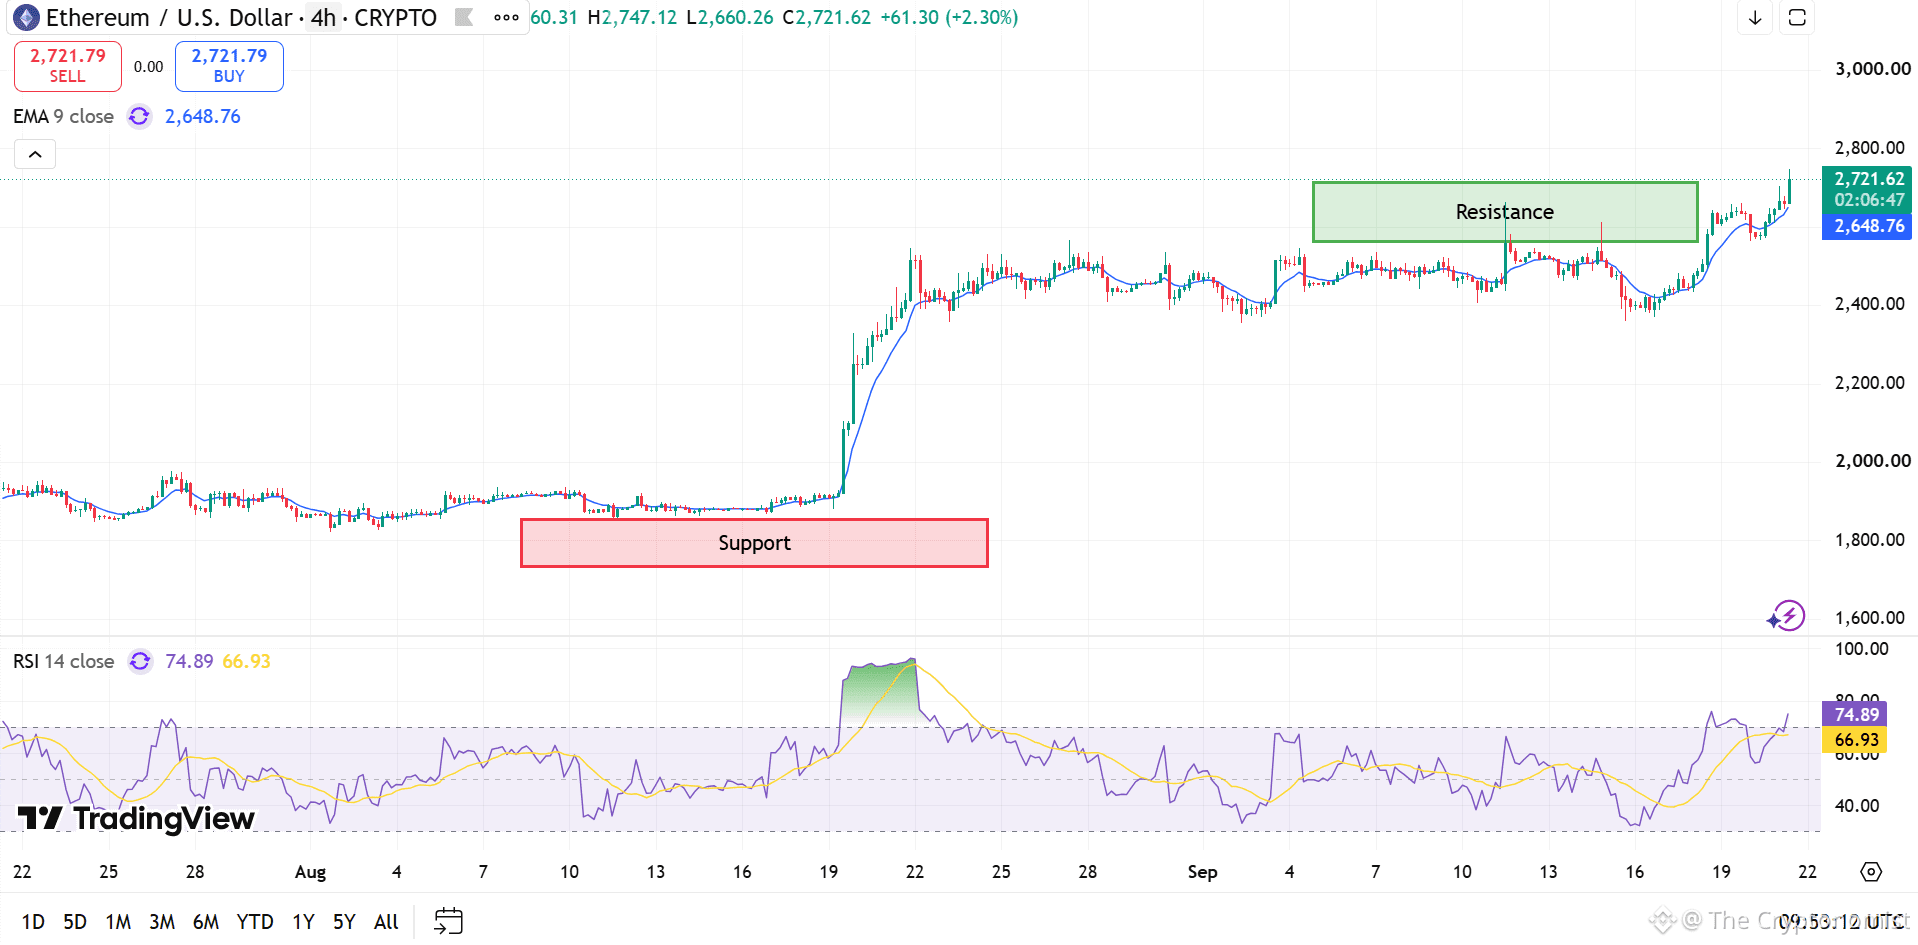
Статья
Ethereum Price Tests $2,800 as Bullish Structure Meets ResistanceEthereum price is approaching a level that could decide where the next move goes. ETH reached $2,735.20 on the daily chart, up 3.44% or $90.98 on the chart . The move has brought ETH into the $2,600–$2,800 resistance zone, an area the charts have marked as a key test for the current rally. The higher-timeframe analysis points to a bullish Change of Character (CHoCH) after ETH moved away from the roughly $2,300 demand region. Price also reclaimed the $2,483–$2,584 Fair Value Gap (FVG), which is now one of the main support areas to watch.
Ethereum Price Moves Toward $2,800
The daily chart gives a straightforward picture of where Ethereum price stands. ETH is trading inside the $2,600–$2,800 resistance zone, with the top of that range sitting near $2,800. Momentum is also strong. The 9-day EMA is at $2,580.68, putting ETH roughly $154 above the indicator. Daily RSI is at 70.46, which puts it above the traditional overbought threshold of 70.
ETHs 1D Chart
The 2-day chart adds more context. ETH was around $2,665.29 on that chart, with the next upside Fair Value Gap located between $2,800 and $2,900. Beyond that, the chart marks $3,200–$3,400 as another major resistance area containing a bearish order block and FVG.
ETHEREUM: HTF STRUCTURE JUST SHIFTED | WHAT COMES NEXT?$ETH Is Now Showing A Clear HTF Bullish CHoCH On The HTF Chart, Followed By Strong Displacement From The ~$2,300 Demand Region.
Price Has Reclaimed The $2,483–$2,584 Fair Value Gap, Making This The Most Important Near-Term… pic.twitter.com/dbZh4ivM05
— Crypto Patel (@CryptoPatel) September 21, 2026
The 4-hour chart shows the same battle playing out at a shorter timeframe. ETH was around $2,721.62, while the 9-period EMA stood at $2,648.76. RSI was higher at 74.89, showing that short-term buying pressure remains strong but has also pushed momentum into overbought territory.
ETHs 4H Chart
So, $2,800 is the number to watch. A 4-hour close above it would clear the current resistance box and put $2,900 and potentially $3,000 on the map, with $3,200–$3,400 coming into view after that.
Ethereum Network Activity Keeps Rising
The on-chain numbers add an interesting part to the Ethereum price setup. Ethereum’s market cap climbed from roughly $310 billion during the observed low to above $340 billion as ETH moved toward $2,650.
ETHs Market cap
Network activity also increased during the recovery. Active addresses rose from below 280,000 to almost 490,000.
ETHs Number of Active Addresses
Daily transactions followed a similar path, moving from below 1.45 million to more than 2 million.
ETHs Number of Transactions
There is one detail worth watching here. At the end of the observed period, active addresses and transactions reached their highest levels even as ETH price moved lower. That creates a divergence between network activity and price and could point to short-term cooling after the rally.
What Comes Next for Ethereum Price?
The technical picture remains constructive above $2,360, which the referenced analysis identifies as the level that keeps the bullish structure intact. Above that, $2,483–$2,584 remains the key support zone.
For Ethereum price, the immediate question is simple: can ETH clear $2,800? A break above that level could open the way toward $2,900 and then $3,200–$3,400. If sellers defend the zone, the charts point toward $2,648, $2,580 and the $2,400 area as levels to watch during a retracement. With RSI above 70 across the daily and 4-hour charts, the next move may depend less on how fast ETH can climb and more on whether buyers can keep price above these key levels.
Ethereum Price Tests $2,800 as Bullish Structure Meets Resistance
Ethereum price is approaching a level that could decide where the next move goes. ETH reached $2,735.20 on the daily chart, up 3.44% or $90.98 on the chart . The move has brought ETH into the $2,600–$2,800 resistance zone, an area the charts have marked as a key test for the current rally. The higher-timeframe analysis points to a bullish Change of Character (CHoCH) after ETH moved away from the roughly $2,300 demand region. Price also reclaimed the $2,483–$2,584 Fair Value Gap (FVG), which is now one of the main support areas to watch.
Ethereum Price Moves Toward $2,800
The daily chart gives a straightforward picture of where Ethereum price stands. ETH is trading inside the $2,600–$2,800 resistance zone, with the top of that range sitting near $2,800. Momentum is also strong. The 9-day EMA is at $2,580.68, putting ETH roughly $154 above the indicator. Daily RSI is at 70.46, which puts it above the traditional overbought threshold of 70.
ETHs 1D Chart
The 2-day chart adds more context. ETH was around $2,665.29 on that chart, with the next upside Fair Value Gap located between $2,800 and $2,900. Beyond that, the chart marks $3,200–$3,400 as another major resistance area containing a bearish order block and FVG.
ETHEREUM: HTF STRUCTURE JUST SHIFTED | WHAT COMES NEXT?$ETH Is Now Showing A Clear HTF Bullish CHoCH On The HTF Chart, Followed By Strong Displacement From The ~$2,300 Demand Region.
Price Has Reclaimed The $2,483–$2,584 Fair Value Gap, Making This The Most Important Near-Term… pic.twitter.com/dbZh4ivM05
— Crypto Patel (@CryptoPatel) September 21, 2026
The 4-hour chart shows the same battle playing out at a shorter timeframe. ETH was around $2,721.62, while the 9-period EMA stood at $2,648.76. RSI was higher at 74.89, showing that short-term buying pressure remains strong but has also pushed momentum into overbought territory.
ETHs 4H Chart
So, $2,800 is the number to watch. A 4-hour close above it would clear the current resistance box and put $2,900 and potentially $3,000 on the map, with $3,200–$3,400 coming into view after that.
Ethereum Network Activity Keeps Rising
The on-chain numbers add an interesting part to the Ethereum price setup. Ethereum’s market cap climbed from roughly $310 billion during the observed low to above $340 billion as ETH moved toward $2,650.
ETHs Market cap
Network activity also increased during the recovery. Active addresses rose from below 280,000 to almost 490,000.
ETHs Number of Active Addresses
Daily transactions followed a similar path, moving from below 1.45 million to more than 2 million.
ETHs Number of Transactions
There is one detail worth watching here. At the end of the observed period, active addresses and transactions reached their highest levels even as ETH price moved lower. That creates a divergence between network activity and price and could point to short-term cooling after the rally.
What Comes Next for Ethereum Price?
The technical picture remains constructive above $2,360, which the referenced analysis identifies as the level that keeps the bullish structure intact. Above that, $2,483–$2,584 remains the key support zone.
For Ethereum price, the immediate question is simple: can ETH clear $2,800? A break above that level could open the way toward $2,900 and then $3,200–$3,400. If sellers defend the zone, the charts point toward $2,648, $2,580 and the $2,400 area as levels to watch during a retracement. With RSI above 70 across the daily and 4-hour charts, the next move may depend less on how fast ETH can climb and more on whether buyers can keep price above these key levels.
Ethereum Price Moves Toward $2,800
The daily chart gives a straightforward picture of where Ethereum price stands. ETH is trading inside the $2,600–$2,800 resistance zone, with the top of that range sitting near $2,800. Momentum is also strong. The 9-day EMA is at $2,580.68, putting ETH roughly $154 above the indicator. Daily RSI is at 70.46, which puts it above the traditional overbought threshold of 70.
ETHs 1D Chart
The 2-day chart adds more context. ETH was around $2,665.29 on that chart, with the next upside Fair Value Gap located between $2,800 and $2,900. Beyond that, the chart marks $3,200–$3,400 as another major resistance area containing a bearish order block and FVG.
ETHEREUM: HTF STRUCTURE JUST SHIFTED | WHAT COMES NEXT?$ETH Is Now Showing A Clear HTF Bullish CHoCH On The HTF Chart, Followed By Strong Displacement From The ~$2,300 Demand Region.
Price Has Reclaimed The $2,483–$2,584 Fair Value Gap, Making This The Most Important Near-Term… pic.twitter.com/dbZh4ivM05
— Crypto Patel (@CryptoPatel) September 21, 2026
The 4-hour chart shows the same battle playing out at a shorter timeframe. ETH was around $2,721.62, while the 9-period EMA stood at $2,648.76. RSI was higher at 74.89, showing that short-term buying pressure remains strong but has also pushed momentum into overbought territory.
ETHs 4H Chart
So, $2,800 is the number to watch. A 4-hour close above it would clear the current resistance box and put $2,900 and potentially $3,000 on the map, with $3,200–$3,400 coming into view after that.
Ethereum Network Activity Keeps Rising
The on-chain numbers add an interesting part to the Ethereum price setup. Ethereum’s market cap climbed from roughly $310 billion during the observed low to above $340 billion as ETH moved toward $2,650.
ETHs Market cap
Network activity also increased during the recovery. Active addresses rose from below 280,000 to almost 490,000.
ETHs Number of Active Addresses
Daily transactions followed a similar path, moving from below 1.45 million to more than 2 million.
ETHs Number of Transactions
There is one detail worth watching here. At the end of the observed period, active addresses and transactions reached their highest levels even as ETH price moved lower. That creates a divergence between network activity and price and could point to short-term cooling after the rally.
What Comes Next for Ethereum Price?
The technical picture remains constructive above $2,360, which the referenced analysis identifies as the level that keeps the bullish structure intact. Above that, $2,483–$2,584 remains the key support zone.
For Ethereum price, the immediate question is simple: can ETH clear $2,800? A break above that level could open the way toward $2,900 and then $3,200–$3,400. If sellers defend the zone, the charts point toward $2,648, $2,580 and the $2,400 area as levels to watch during a retracement. With RSI above 70 across the daily and 4-hour charts, the next move may depend less on how fast ETH can climb and more on whether buyers can keep price above these key levels.
91
ECB blockchain settlement goes live as Deutsche Bank, Santander join PontesThe European Central Bank has quietly crossed a threshold that regulators have been circling for years: it just switched on infrastructure that lets banks settle blockchain-based securities trades using actual central bank money. The new service, called Pontes, went live on September 21, 2026, and it marks one of the clearest steps yet toward ECB blockchain settlement becoming a working part of European finance rather than a pilot confined to test labs.
Key takeaways
Pontes lets financial institutions settle blockchain-based wholesale transactions using central bank money by linking distributed ledger platforms to the Eurosystem’s TARGET Services.
Deutsche Bank, Santander and Clearstream are among the first institutions onboarded to the platform.
The platform runs 8 a.m. to 4 p.m. CET on business days at launch, with settlement finality for the cash leg still anchored in the existing TARGET2 system.
The ECB plans to put a small slice of its €23 billion own funds portfolio into blockchain-issued securities, and DLT-issued assets have been eligible as Eurosystem collateral since March 30.
A separate retail digital euro pilot is targeted for the second half of 2027, with possible issuance by 2029 pending EU legislation and Governing Council approval.
ECB launches Pontes to settle blockchain transactions in central bank money
Pontes is a settlement layer, not a new currency. It connects the distributed ledger platforms that banks and market operators have been using to issue, trade and settle tokenized assets with the Eurosystem’s existing payment rails, so that the cash side of a trade clears in central bank euros rather than in privately issued stablecoins or ordinary bank deposits. This difference is more significant than it initially appears. A transaction settled in central bank money carries the credit risk of the central bank itself, whereas one settled in commercial bank money carries the credit risk of whatever intermediary bank holds the funds.
ECB Executive Board member Piero Cipollone framed the launch around exactly that gap, echoing concerns he raised earlier this year about tokenized finance running on private settlement arrangements. It’s a message the ECB has repeated before: earlier this year, Cipollone warned that sellers of tokenized securities could otherwise end up receiving assets exposed to price volatility or credit risk if settlement stayed outside central bank money.
Platform connects DLT systems with Eurosystem’s TARGET payment services
Rather than forcing every securities transaction onto a single blockchain, Pontes acts as a bridge. It links privately operated DLT platforms to the Eurosystem’s TARGET infrastructure, letting tokenized asset transactions settle against central bank funds while retaining the settlement protections used in conventional financial plumbing. The ECB has said this approach lets financial institutions keep experimenting with different distributed ledger networks without giving up the safety net that TARGET already provides.
Initial participants include Deutsche Bank, Santander, and Clearstream
Deutsche Bank, Santander and securities clearing group Clearstream, which is owned by Deutsche Börse, are among the first institutions to complete onboarding. Pontes currently operates between 8 a.m. and 4 p.m. CET on business days, and the ECB has said it plans to extend those operating hours and add new functions gradually over time.
Legal and technological framework anchors settlement finality
At launch, Pontes does not stand entirely on its own. Legal settlement finality for the cash side of every transaction still runs through the Eurosystem’s TARGET2 system, the established backbone of euro-area payments. The ECB says later versions of the platform are expected to move that finality onto a Eurosystem-operated DLT platform directly and to add smart contract functionality, but for now the safety net is the same one banks have relied on for years.
Settlement finality currently anchored in TARGET2 with future DLT integration planned
This staged approach reflects a broader pattern in how the ECB has framed Eurosystem TARGET2 integration with blockchain settlement: build the bridge first, then gradually move core legal guarantees onto the new rails once they’ve proven themselves in production rather than in trials. The central bank has argued that blockchain technology can make financial transactions faster by combining several stages of an asset’s lifecycle and automating processes that currently require manual intervention.
ECB investment plans on blockchain-based digital securities
The ECB isn’t just building the plumbing; it’s also becoming a customer of it. The bank plans to allocate a small portion of its €23 billion own funds portfolio to central bank digital securities issued through blockchain, according to Crypto Briefing, with the money going toward euro-denominated tokenized public sector and supranational debt settled through Pontes. Investments will focus on highly rated euro-denominated debt from public institutions, keeping the underlying asset risk familiar while changing the technology used to issue and settle it. No specific amount has been disclosed, and the ECB has described the allocation only as a small fraction of the portfolio.
Eurosystem’s DLT collateral framework updates
The move builds on a regulatory shift that already took effect earlier this year. From March 30, marketable securities issued through DLT-based services at central securities depositories became eligible as collateral for Eurosystem credit operations, provided they meet existing eligibility and settlement requirements. The framework applies the same collateral rules, including eligibility checks and applicable haircuts, used for conventional assets. The Eurosystem has said it continues studying whether securities issued and settled entirely on DLT networks could eventually qualify as well.
Why this matters: tying tokenized collateral to the same rules already used for conventional assets gives banks a clear, familiar framework to work within, rather than asking them to accept a parallel and untested set of standards. It’s the kind of incremental legitimacy that tends to move institutional adoption forward faster than headline announcements do.
ECB’s digital euro pilot and broader tokenization initiatives
Pontes deals with wholesale markets, banks trading with banks, not with the money ordinary people would carry in a digital wallet. The ECB has kept that retail project on a separate and noticeably slower track.
Retail digital euro pilot targeted for second half of 2027
The central bank is preparing a 12-month retail digital euro pilot for the second half of 2027, involving merchants, national central banks, other banks and payment service providers. An invitation issued this month asked ecommerce and mobile commerce businesses across the euro area to take part in digital euro payment tests. The pilot currency will not carry legal tender status and will run inside a controlled testing environment, covering online, mobile, in-store and person-to-person payments as the ECB works out the technology and processes a full retail system would need.
Possible digital euro issuance by 2029 depends on legislation and Governing Council approval
Beyond the pilot, the ECB is targeting readiness for possible issuance of the digital euro in 2029. That date is not locked in: it depends on the European Union passing the necessary legislation and on a separate decision by the ECB’s own Governing Council. The project is meant to give the public a digital payment option alongside cash and bank deposits, while reducing Europe’s reliance on foreign payment providers.
Distinction between wholesale tokenization and retail digital euro projects
Keeping these two tracks apart isn’t a technicality; it’s a deliberate design choice. Both Pontes and the ECB’s own-funds investment plan form part of a larger initiative the central bank refers to as Appia, its long-term project to build an integrated, tokenized financial system throughout Europe, with wider deployment anticipated by roughly 2028. This past August, 61 financial market participants and public institutions were chosen by the Eurosystem to join an Appia contact group, which will offer guidance on Pontes and on the broader architecture of tokenized markets. The retail digital euro, by contrast, answers a completely different question: how consumers, not banks, might one day hold and spend central bank money directly.
Wider tokenization race gathers pace across Europe
The ECB isn’t moving in isolation. European financial institutions have been building parallel infrastructure of their own: Boerse Stuttgart’s Seturion network expanded its settlement capacity in May by adding Societe Generale, SG FORGE and flatexDEGIRO, designed to handle tokenized securities across both public and private blockchains. Elsewhere, Switzerland has tested settlement of tokenized securities with wholesale central bank digital currency through Project Helvetia, and the Bank of England has pursued similar work via its Digital Securities Sandbox. Private players are moving too; Broadridge processed trillions of dollars through its blockchain-based repo platform in July.
What sets the ECB’s move apart is scale and permanence. Pontes, with Deutsche Bank, Santander and Clearstream among the first institutions onboarded, is now a live, ongoing service rather than a test run, and that shift from pilot to permanent infrastructure is the real story behind this launch.
FAQ
What is the purpose of the ECB’s Pontes platform?
Pontes allows the settlement of blockchain-based wholesale transactions in central bank money by connecting DLT platforms with Eurosystem’s TARGET Services.
Which financial institutions are first to use Pontes?
Deutsche Bank, Santander, and Clearstream are among the initial institutions onboarded to Pontes.
How does Pontes ensure settlement finality?
At launch, settlement finality for the cash side is anchored in the Eurosystem’s TARGET2 system, with plans to extend finality onto a DLT platform.
When will the ECB pilot a retail digital euro?
The ECB plans a 12-month retail digital euro pilot starting in the second half of 2027.
Article produced with the assistance of artificial intelligence and reviewed by the editorial team.
ECB blockchain settlement goes live as Deutsche Bank, Santander join Pontes
The European Central Bank has quietly crossed a threshold that regulators have been circling for years: it just switched on infrastructure that lets banks settle blockchain-based securities trades using actual central bank money. The new service, called Pontes, went live on September 21, 2026, and it marks one of the clearest steps yet toward ECB blockchain settlement becoming a working part of European finance rather than a pilot confined to test labs.
Key takeaways
Pontes lets financial institutions settle blockchain-based wholesale transactions using central bank money by linking distributed ledger platforms to the Eurosystem’s TARGET Services.
Deutsche Bank, Santander and Clearstream are among the first institutions onboarded to the platform.
The platform runs 8 a.m. to 4 p.m. CET on business days at launch, with settlement finality for the cash leg still anchored in the existing TARGET2 system.
The ECB plans to put a small slice of its €23 billion own funds portfolio into blockchain-issued securities, and DLT-issued assets have been eligible as Eurosystem collateral since March 30.
A separate retail digital euro pilot is targeted for the second half of 2027, with possible issuance by 2029 pending EU legislation and Governing Council approval.
ECB launches Pontes to settle blockchain transactions in central bank money
Pontes is a settlement layer, not a new currency. It connects the distributed ledger platforms that banks and market operators have been using to issue, trade and settle tokenized assets with the Eurosystem’s existing payment rails, so that the cash side of a trade clears in central bank euros rather than in privately issued stablecoins or ordinary bank deposits. This difference is more significant than it initially appears. A transaction settled in central bank money carries the credit risk of the central bank itself, whereas one settled in commercial bank money carries the credit risk of whatever intermediary bank holds the funds.
ECB Executive Board member Piero Cipollone framed the launch around exactly that gap, echoing concerns he raised earlier this year about tokenized finance running on private settlement arrangements. It’s a message the ECB has repeated before: earlier this year, Cipollone warned that sellers of tokenized securities could otherwise end up receiving assets exposed to price volatility or credit risk if settlement stayed outside central bank money.
Platform connects DLT systems with Eurosystem’s TARGET payment services
Rather than forcing every securities transaction onto a single blockchain, Pontes acts as a bridge. It links privately operated DLT platforms to the Eurosystem’s TARGET infrastructure, letting tokenized asset transactions settle against central bank funds while retaining the settlement protections used in conventional financial plumbing. The ECB has said this approach lets financial institutions keep experimenting with different distributed ledger networks without giving up the safety net that TARGET already provides.
Initial participants include Deutsche Bank, Santander, and Clearstream
Deutsche Bank, Santander and securities clearing group Clearstream, which is owned by Deutsche Börse, are among the first institutions to complete onboarding. Pontes currently operates between 8 a.m. and 4 p.m. CET on business days, and the ECB has said it plans to extend those operating hours and add new functions gradually over time.
Legal and technological framework anchors settlement finality
At launch, Pontes does not stand entirely on its own. Legal settlement finality for the cash side of every transaction still runs through the Eurosystem’s TARGET2 system, the established backbone of euro-area payments. The ECB says later versions of the platform are expected to move that finality onto a Eurosystem-operated DLT platform directly and to add smart contract functionality, but for now the safety net is the same one banks have relied on for years.
Settlement finality currently anchored in TARGET2 with future DLT integration planned
This staged approach reflects a broader pattern in how the ECB has framed Eurosystem TARGET2 integration with blockchain settlement: build the bridge first, then gradually move core legal guarantees onto the new rails once they’ve proven themselves in production rather than in trials. The central bank has argued that blockchain technology can make financial transactions faster by combining several stages of an asset’s lifecycle and automating processes that currently require manual intervention.
ECB investment plans on blockchain-based digital securities
The ECB isn’t just building the plumbing; it’s also becoming a customer of it. The bank plans to allocate a small portion of its €23 billion own funds portfolio to central bank digital securities issued through blockchain, according to Crypto Briefing, with the money going toward euro-denominated tokenized public sector and supranational debt settled through Pontes. Investments will focus on highly rated euro-denominated debt from public institutions, keeping the underlying asset risk familiar while changing the technology used to issue and settle it. No specific amount has been disclosed, and the ECB has described the allocation only as a small fraction of the portfolio.
Eurosystem’s DLT collateral framework updates
The move builds on a regulatory shift that already took effect earlier this year. From March 30, marketable securities issued through DLT-based services at central securities depositories became eligible as collateral for Eurosystem credit operations, provided they meet existing eligibility and settlement requirements. The framework applies the same collateral rules, including eligibility checks and applicable haircuts, used for conventional assets. The Eurosystem has said it continues studying whether securities issued and settled entirely on DLT networks could eventually qualify as well.
Why this matters: tying tokenized collateral to the same rules already used for conventional assets gives banks a clear, familiar framework to work within, rather than asking them to accept a parallel and untested set of standards. It’s the kind of incremental legitimacy that tends to move institutional adoption forward faster than headline announcements do.
ECB’s digital euro pilot and broader tokenization initiatives
Pontes deals with wholesale markets, banks trading with banks, not with the money ordinary people would carry in a digital wallet. The ECB has kept that retail project on a separate and noticeably slower track.
Retail digital euro pilot targeted for second half of 2027
The central bank is preparing a 12-month retail digital euro pilot for the second half of 2027, involving merchants, national central banks, other banks and payment service providers. An invitation issued this month asked ecommerce and mobile commerce businesses across the euro area to take part in digital euro payment tests. The pilot currency will not carry legal tender status and will run inside a controlled testing environment, covering online, mobile, in-store and person-to-person payments as the ECB works out the technology and processes a full retail system would need.
Possible digital euro issuance by 2029 depends on legislation and Governing Council approval
Beyond the pilot, the ECB is targeting readiness for possible issuance of the digital euro in 2029. That date is not locked in: it depends on the European Union passing the necessary legislation and on a separate decision by the ECB’s own Governing Council. The project is meant to give the public a digital payment option alongside cash and bank deposits, while reducing Europe’s reliance on foreign payment providers.
Distinction between wholesale tokenization and retail digital euro projects
Keeping these two tracks apart isn’t a technicality; it’s a deliberate design choice. Both Pontes and the ECB’s own-funds investment plan form part of a larger initiative the central bank refers to as Appia, its long-term project to build an integrated, tokenized financial system throughout Europe, with wider deployment anticipated by roughly 2028. This past August, 61 financial market participants and public institutions were chosen by the Eurosystem to join an Appia contact group, which will offer guidance on Pontes and on the broader architecture of tokenized markets. The retail digital euro, by contrast, answers a completely different question: how consumers, not banks, might one day hold and spend central bank money directly.
Wider tokenization race gathers pace across Europe
The ECB isn’t moving in isolation. European financial institutions have been building parallel infrastructure of their own: Boerse Stuttgart’s Seturion network expanded its settlement capacity in May by adding Societe Generale, SG FORGE and flatexDEGIRO, designed to handle tokenized securities across both public and private blockchains. Elsewhere, Switzerland has tested settlement of tokenized securities with wholesale central bank digital currency through Project Helvetia, and the Bank of England has pursued similar work via its Digital Securities Sandbox. Private players are moving too; Broadridge processed trillions of dollars through its blockchain-based repo platform in July.
What sets the ECB’s move apart is scale and permanence. Pontes, with Deutsche Bank, Santander and Clearstream among the first institutions onboarded, is now a live, ongoing service rather than a test run, and that shift from pilot to permanent infrastructure is the real story behind this launch.
FAQ
What is the purpose of the ECB’s Pontes platform?
Pontes allows the settlement of blockchain-based wholesale transactions in central bank money by connecting DLT platforms with Eurosystem’s TARGET Services.
Which financial institutions are first to use Pontes?
Deutsche Bank, Santander, and Clearstream are among the initial institutions onboarded to Pontes.
How does Pontes ensure settlement finality?
At launch, settlement finality for the cash side is anchored in the Eurosystem’s TARGET2 system, with plans to extend finality onto a DLT platform.
When will the ECB pilot a retail digital euro?
The ECB plans a 12-month retail digital euro pilot starting in the second half of 2027.
Article produced with the assistance of artificial intelligence and reviewed by the editorial team.
Key takeaways
Pontes lets financial institutions settle blockchain-based wholesale transactions using central bank money by linking distributed ledger platforms to the Eurosystem’s TARGET Services.
Deutsche Bank, Santander and Clearstream are among the first institutions onboarded to the platform.
The platform runs 8 a.m. to 4 p.m. CET on business days at launch, with settlement finality for the cash leg still anchored in the existing TARGET2 system.
The ECB plans to put a small slice of its €23 billion own funds portfolio into blockchain-issued securities, and DLT-issued assets have been eligible as Eurosystem collateral since March 30.
A separate retail digital euro pilot is targeted for the second half of 2027, with possible issuance by 2029 pending EU legislation and Governing Council approval.
ECB launches Pontes to settle blockchain transactions in central bank money
Pontes is a settlement layer, not a new currency. It connects the distributed ledger platforms that banks and market operators have been using to issue, trade and settle tokenized assets with the Eurosystem’s existing payment rails, so that the cash side of a trade clears in central bank euros rather than in privately issued stablecoins or ordinary bank deposits. This difference is more significant than it initially appears. A transaction settled in central bank money carries the credit risk of the central bank itself, whereas one settled in commercial bank money carries the credit risk of whatever intermediary bank holds the funds.
ECB Executive Board member Piero Cipollone framed the launch around exactly that gap, echoing concerns he raised earlier this year about tokenized finance running on private settlement arrangements. It’s a message the ECB has repeated before: earlier this year, Cipollone warned that sellers of tokenized securities could otherwise end up receiving assets exposed to price volatility or credit risk if settlement stayed outside central bank money.
Platform connects DLT systems with Eurosystem’s TARGET payment services
Rather than forcing every securities transaction onto a single blockchain, Pontes acts as a bridge. It links privately operated DLT platforms to the Eurosystem’s TARGET infrastructure, letting tokenized asset transactions settle against central bank funds while retaining the settlement protections used in conventional financial plumbing. The ECB has said this approach lets financial institutions keep experimenting with different distributed ledger networks without giving up the safety net that TARGET already provides.
Initial participants include Deutsche Bank, Santander, and Clearstream
Deutsche Bank, Santander and securities clearing group Clearstream, which is owned by Deutsche Börse, are among the first institutions to complete onboarding. Pontes currently operates between 8 a.m. and 4 p.m. CET on business days, and the ECB has said it plans to extend those operating hours and add new functions gradually over time.
Legal and technological framework anchors settlement finality
At launch, Pontes does not stand entirely on its own. Legal settlement finality for the cash side of every transaction still runs through the Eurosystem’s TARGET2 system, the established backbone of euro-area payments. The ECB says later versions of the platform are expected to move that finality onto a Eurosystem-operated DLT platform directly and to add smart contract functionality, but for now the safety net is the same one banks have relied on for years.
Settlement finality currently anchored in TARGET2 with future DLT integration planned
This staged approach reflects a broader pattern in how the ECB has framed Eurosystem TARGET2 integration with blockchain settlement: build the bridge first, then gradually move core legal guarantees onto the new rails once they’ve proven themselves in production rather than in trials. The central bank has argued that blockchain technology can make financial transactions faster by combining several stages of an asset’s lifecycle and automating processes that currently require manual intervention.
ECB investment plans on blockchain-based digital securities
The ECB isn’t just building the plumbing; it’s also becoming a customer of it. The bank plans to allocate a small portion of its €23 billion own funds portfolio to central bank digital securities issued through blockchain, according to Crypto Briefing, with the money going toward euro-denominated tokenized public sector and supranational debt settled through Pontes. Investments will focus on highly rated euro-denominated debt from public institutions, keeping the underlying asset risk familiar while changing the technology used to issue and settle it. No specific amount has been disclosed, and the ECB has described the allocation only as a small fraction of the portfolio.
Eurosystem’s DLT collateral framework updates
The move builds on a regulatory shift that already took effect earlier this year. From March 30, marketable securities issued through DLT-based services at central securities depositories became eligible as collateral for Eurosystem credit operations, provided they meet existing eligibility and settlement requirements. The framework applies the same collateral rules, including eligibility checks and applicable haircuts, used for conventional assets. The Eurosystem has said it continues studying whether securities issued and settled entirely on DLT networks could eventually qualify as well.
Why this matters: tying tokenized collateral to the same rules already used for conventional assets gives banks a clear, familiar framework to work within, rather than asking them to accept a parallel and untested set of standards. It’s the kind of incremental legitimacy that tends to move institutional adoption forward faster than headline announcements do.
ECB’s digital euro pilot and broader tokenization initiatives
Pontes deals with wholesale markets, banks trading with banks, not with the money ordinary people would carry in a digital wallet. The ECB has kept that retail project on a separate and noticeably slower track.
Retail digital euro pilot targeted for second half of 2027
The central bank is preparing a 12-month retail digital euro pilot for the second half of 2027, involving merchants, national central banks, other banks and payment service providers. An invitation issued this month asked ecommerce and mobile commerce businesses across the euro area to take part in digital euro payment tests. The pilot currency will not carry legal tender status and will run inside a controlled testing environment, covering online, mobile, in-store and person-to-person payments as the ECB works out the technology and processes a full retail system would need.
Possible digital euro issuance by 2029 depends on legislation and Governing Council approval
Beyond the pilot, the ECB is targeting readiness for possible issuance of the digital euro in 2029. That date is not locked in: it depends on the European Union passing the necessary legislation and on a separate decision by the ECB’s own Governing Council. The project is meant to give the public a digital payment option alongside cash and bank deposits, while reducing Europe’s reliance on foreign payment providers.
Distinction between wholesale tokenization and retail digital euro projects
Keeping these two tracks apart isn’t a technicality; it’s a deliberate design choice. Both Pontes and the ECB’s own-funds investment plan form part of a larger initiative the central bank refers to as Appia, its long-term project to build an integrated, tokenized financial system throughout Europe, with wider deployment anticipated by roughly 2028. This past August, 61 financial market participants and public institutions were chosen by the Eurosystem to join an Appia contact group, which will offer guidance on Pontes and on the broader architecture of tokenized markets. The retail digital euro, by contrast, answers a completely different question: how consumers, not banks, might one day hold and spend central bank money directly.
Wider tokenization race gathers pace across Europe
The ECB isn’t moving in isolation. European financial institutions have been building parallel infrastructure of their own: Boerse Stuttgart’s Seturion network expanded its settlement capacity in May by adding Societe Generale, SG FORGE and flatexDEGIRO, designed to handle tokenized securities across both public and private blockchains. Elsewhere, Switzerland has tested settlement of tokenized securities with wholesale central bank digital currency through Project Helvetia, and the Bank of England has pursued similar work via its Digital Securities Sandbox. Private players are moving too; Broadridge processed trillions of dollars through its blockchain-based repo platform in July.
What sets the ECB’s move apart is scale and permanence. Pontes, with Deutsche Bank, Santander and Clearstream among the first institutions onboarded, is now a live, ongoing service rather than a test run, and that shift from pilot to permanent infrastructure is the real story behind this launch.
FAQ
What is the purpose of the ECB’s Pontes platform?
Pontes allows the settlement of blockchain-based wholesale transactions in central bank money by connecting DLT platforms with Eurosystem’s TARGET Services.
Which financial institutions are first to use Pontes?
Deutsche Bank, Santander, and Clearstream are among the initial institutions onboarded to Pontes.
How does Pontes ensure settlement finality?
At launch, settlement finality for the cash side is anchored in the Eurosystem’s TARGET2 system, with plans to extend finality onto a DLT platform.
When will the ECB pilot a retail digital euro?
The ECB plans a 12-month retail digital euro pilot starting in the second half of 2027.
Article produced with the assistance of artificial intelligence and reviewed by the editorial team.
132

Статья
NordPass password manager: free storage vs $1.49 Premium securityChoosing a password manager usually comes down to one question: how much security are you willing to pay for, and how much can you get for free? That’s exactly where the NordPass password manager tries to carve out its niche, offering a notably generous free tier alongside paid plans built around modern encryption, breach monitoring, and passwordless login options. For anyone comparing tools to keep logins and sensitive data locked down, NordPass’s mix of pricing tiers and security architecture makes it worth a closer look.
Key takeaways
NordPass offers six plans total — Free, Premium, and Family for individuals, plus Teams, Business, and Enterprise for organizations — each with different features and pricing.
The Free plan includes unlimited password storage, but only one device can be logged in at a time.
Premium and Family plans add secure sharing, password health checks, data breach monitoring, and email masking.
Security is built on strong encryption and a zero-knowledge architecture, supported by biometric login, multi-factor authentication, and passkeys.
The iOS app lags behind the desktop and Android versions, notably missing emergency access.
NordPass Plans and Pricing
NordPass structures its lineup around two audiences: individuals and businesses, with three tiers on each side and a genuinely usable free option. That split makes it straightforward to match a plan to actual needs rather than paying for features that go unused.
Personal Plans: Free, Premium, and Family
For everyday users, NordPass plans and pricing break down into Free, Premium, and Family, all sold on one- or two-year terms. The Free plan covers unlimited password storage, passkey support, a password generator, and multi-factor authentication — a solid baseline for a no-cost tool. The catch is that while your vault syncs across devices, you can only be logged in on one device at a time, which sets NordPass apart from rivals that allow concurrent sessions.
Stepping up to Premium costs US$1.49 per month on the two-year plan (plus three bonus months), and it unlocks secure sharing, a password health checker, data breach monitoring, emergency access permissions, and email masking. It also throws in 3 GB of encrypted cloud storage and unlimited simultaneous device connections. Family mirrors Premium’s feature set exactly but extends coverage to six users for US$2.79 per month, making it a practical option for households that don’t need more than half a dozen accounts.
Premium and Family users also get access to email masking, which generates unique, disposable email addresses to shield a real inbox from spam and data leaks. Messages sent to a masked address still land in the main inbox, and any mask can be disconnected instantly if it starts attracting spam.
Business Plans: Teams, Business, and Enterprise
On the organizational side, NordPass offers Teams, Business, and Enterprise, priced per user on a two-year basis at US$1.79, US$3.59, and US$5.39 respectively. Teams is sold as a 10-user pack and covers centralized onboarding, customizable access levels, and priority support — a reasonable entry point for small groups.
Business, aimed at organizations with 5 to 150 licenses, builds on Teams with shared folders, group management, a data breach scanner, and password auditing. It also integrates with Vanta, which NordPass says helps companies streamline compliance work toward ISO 27001 and SOC 2 Type 1 certification. Enterprise removes the license cap entirely and adds dedicated account management, advanced provisioning, additional single sign-on integrations with Okta, Entra ID, and MS ADFS, and round-the-clock premium support — features aimed squarely at larger organizations with more complex security requirements.
Security and Encryption Features
NordPass’s core security pitch rests on modern encryption paired with a design that keeps the company itself locked out of user data. That combination is what determines whether a breach on NordPass’s end would actually expose anyone’s passwords.
Encryption and Zero-Knowledge Architecture
NordPass relies on advanced, uncrackable encryption technology to protect user data. Underneath that sits zero-knowledge architecture: every password and note gets encrypted locally on a user’s device before it ever reaches NordPass’s servers, meaning even NordPass staff can’t view stored credentials. In practice, this setup limits the damage a server-side breach could cause, since attackers would only find encrypted data with no readable content behind it.
Authentication Methods and Passkeys
Beyond encryption, NordPass layers on several access-control tools. Biometric login works across mobile, Windows, and macOS, letting users unlock their vault with a fingerprint or facial scan instead of typing a master password every time. Multi-factor authentication is also built in, supporting authenticator apps like Google Authenticator, Microsoft Authenticator, and Authy, along with USB FIDO U2F security keys and backup codes.
Passkeys round out the picture, allowing account creation and login without a password at all — a feature available across every plan, including Free. One limitation worth flagging: NordPass currently reserves its TOTP authenticator for business subscribers, so personal users miss out on that specific tool even though the broader MFA options remain solid.
Core Functionalities and Usability
Security architecture only matters if the everyday tools built around it are easy to use, and this is where NordPass spends most of its feature budget — vaults, browser tools, generators, and monitoring systems designed to work quietly in the background.
Password Vault, Browser Extensions, and Password Generator
The vault itself is accessible through desktop apps on Windows, macOS, and Linux, mobile apps on Android and iOS, and browser extensions covering Chrome, Firefox, Opera, Edge, Brave, and Safari. Adding an entry is a simple click-and-fill process, and the vault handles passwords, secure notes, credit cards, personal details, and scanned documents like IDs, complete with expiry reminders. Premium and Family users can also attach files, backed by 3 GB of cloud storage per account, though items with attachments can’t be shared with other users.
The browser extension mirrors the desktop app’s functionality closely, prompting auto-fill on saved login pages and generating strong passwords on the fly during sign-up. The password generator itself lets users create strong passwords or passphrases and keeps a history of previously generated passwords — a small but genuinely useful safeguard against accidentally overwriting a working login.
Password Health, Data Breach Scanner, and Emergency Access
NordPass’s Password Health tool scans stored credentials for weak, reused, or exposed passwords, flagging accounts that need attention without assigning an overall score the way some competitors do. Paired with it, the data breach scanner checks the web for compromised credit cards or email addresses tied to a user’s vault and pushes real-time alerts the moment something turns up, including details on when the leak happened and what data was affected. Users can add extra email addresses to the monitoring list beyond the one tied to their NordPass account, which isn’t a universal feature among password managers.
Emergency access lets Premium subscribers designate trusted contacts who can request entry to the vault if something happens to the account owner; Free users can be recipients of that access but can’t set it up themselves. Emergency access is limited to stored passwords and secure notes rather than the entire vault.
This is also where the platform shows its clearest gap: the iOS app lacks several features present on desktop and Android, emergency access chief among them. Anyone relying primarily on an iPhone for password management should weigh that limitation carefully, since it means certain safety-net features simply aren’t reachable from mobile on that platform.
FAQ
Is NordPass secure?
Yes. NordPass uses strong encryption and a zero-knowledge policy, plus multi-factor authentication and biometric logins.
Does NordPass have a free version?
Yes. NordPass offers a generous free tier that includes unlimited password storage and unlimited device syncing, though it limits you to one simultaneous device login.
Is it possible to regain access to my NordPass account if I forget my master password?
Yes. NordPass supplies a Recovery Code that lets you regain access to your account should you forget your master password.
Can someone else be granted emergency access to my NordPass account?
Yes. Emergency access exists, but only Premium subscribers can designate emergency contacts; users on the Free plan can only be named as a contact for someone else’s account.
Article produced with the assistance of artificial intelligence and reviewed by the editorial team.
NordPass password manager: free storage vs $1.49 Premium security
Choosing a password manager usually comes down to one question: how much security are you willing to pay for, and how much can you get for free? That’s exactly where the NordPass password manager tries to carve out its niche, offering a notably generous free tier alongside paid plans built around modern encryption, breach monitoring, and passwordless login options. For anyone comparing tools to keep logins and sensitive data locked down, NordPass’s mix of pricing tiers and security architecture makes it worth a closer look.
Key takeaways
NordPass offers six plans total — Free, Premium, and Family for individuals, plus Teams, Business, and Enterprise for organizations — each with different features and pricing.
The Free plan includes unlimited password storage, but only one device can be logged in at a time.
Premium and Family plans add secure sharing, password health checks, data breach monitoring, and email masking.
Security is built on strong encryption and a zero-knowledge architecture, supported by biometric login, multi-factor authentication, and passkeys.
The iOS app lags behind the desktop and Android versions, notably missing emergency access.
NordPass Plans and Pricing
NordPass structures its lineup around two audiences: individuals and businesses, with three tiers on each side and a genuinely usable free option. That split makes it straightforward to match a plan to actual needs rather than paying for features that go unused.
Personal Plans: Free, Premium, and Family
For everyday users, NordPass plans and pricing break down into Free, Premium, and Family, all sold on one- or two-year terms. The Free plan covers unlimited password storage, passkey support, a password generator, and multi-factor authentication — a solid baseline for a no-cost tool. The catch is that while your vault syncs across devices, you can only be logged in on one device at a time, which sets NordPass apart from rivals that allow concurrent sessions.
Stepping up to Premium costs US$1.49 per month on the two-year plan (plus three bonus months), and it unlocks secure sharing, a password health checker, data breach monitoring, emergency access permissions, and email masking. It also throws in 3 GB of encrypted cloud storage and unlimited simultaneous device connections. Family mirrors Premium’s feature set exactly but extends coverage to six users for US$2.79 per month, making it a practical option for households that don’t need more than half a dozen accounts.
Premium and Family users also get access to email masking, which generates unique, disposable email addresses to shield a real inbox from spam and data leaks. Messages sent to a masked address still land in the main inbox, and any mask can be disconnected instantly if it starts attracting spam.
Business Plans: Teams, Business, and Enterprise
On the organizational side, NordPass offers Teams, Business, and Enterprise, priced per user on a two-year basis at US$1.79, US$3.59, and US$5.39 respectively. Teams is sold as a 10-user pack and covers centralized onboarding, customizable access levels, and priority support — a reasonable entry point for small groups.
Business, aimed at organizations with 5 to 150 licenses, builds on Teams with shared folders, group management, a data breach scanner, and password auditing. It also integrates with Vanta, which NordPass says helps companies streamline compliance work toward ISO 27001 and SOC 2 Type 1 certification. Enterprise removes the license cap entirely and adds dedicated account management, advanced provisioning, additional single sign-on integrations with Okta, Entra ID, and MS ADFS, and round-the-clock premium support — features aimed squarely at larger organizations with more complex security requirements.
Security and Encryption Features
NordPass’s core security pitch rests on modern encryption paired with a design that keeps the company itself locked out of user data. That combination is what determines whether a breach on NordPass’s end would actually expose anyone’s passwords.
Encryption and Zero-Knowledge Architecture
NordPass relies on advanced, uncrackable encryption technology to protect user data. Underneath that sits zero-knowledge architecture: every password and note gets encrypted locally on a user’s device before it ever reaches NordPass’s servers, meaning even NordPass staff can’t view stored credentials. In practice, this setup limits the damage a server-side breach could cause, since attackers would only find encrypted data with no readable content behind it.
Authentication Methods and Passkeys
Beyond encryption, NordPass layers on several access-control tools. Biometric login works across mobile, Windows, and macOS, letting users unlock their vault with a fingerprint or facial scan instead of typing a master password every time. Multi-factor authentication is also built in, supporting authenticator apps like Google Authenticator, Microsoft Authenticator, and Authy, along with USB FIDO U2F security keys and backup codes.
Passkeys round out the picture, allowing account creation and login without a password at all — a feature available across every plan, including Free. One limitation worth flagging: NordPass currently reserves its TOTP authenticator for business subscribers, so personal users miss out on that specific tool even though the broader MFA options remain solid.
Core Functionalities and Usability
Security architecture only matters if the everyday tools built around it are easy to use, and this is where NordPass spends most of its feature budget — vaults, browser tools, generators, and monitoring systems designed to work quietly in the background.
Password Vault, Browser Extensions, and Password Generator
The vault itself is accessible through desktop apps on Windows, macOS, and Linux, mobile apps on Android and iOS, and browser extensions covering Chrome, Firefox, Opera, Edge, Brave, and Safari. Adding an entry is a simple click-and-fill process, and the vault handles passwords, secure notes, credit cards, personal details, and scanned documents like IDs, complete with expiry reminders. Premium and Family users can also attach files, backed by 3 GB of cloud storage per account, though items with attachments can’t be shared with other users.
The browser extension mirrors the desktop app’s functionality closely, prompting auto-fill on saved login pages and generating strong passwords on the fly during sign-up. The password generator itself lets users create strong passwords or passphrases and keeps a history of previously generated passwords — a small but genuinely useful safeguard against accidentally overwriting a working login.
Password Health, Data Breach Scanner, and Emergency Access
NordPass’s Password Health tool scans stored credentials for weak, reused, or exposed passwords, flagging accounts that need attention without assigning an overall score the way some competitors do. Paired with it, the data breach scanner checks the web for compromised credit cards or email addresses tied to a user’s vault and pushes real-time alerts the moment something turns up, including details on when the leak happened and what data was affected. Users can add extra email addresses to the monitoring list beyond the one tied to their NordPass account, which isn’t a universal feature among password managers.
Emergency access lets Premium subscribers designate trusted contacts who can request entry to the vault if something happens to the account owner; Free users can be recipients of that access but can’t set it up themselves. Emergency access is limited to stored passwords and secure notes rather than the entire vault.
This is also where the platform shows its clearest gap: the iOS app lacks several features present on desktop and Android, emergency access chief among them. Anyone relying primarily on an iPhone for password management should weigh that limitation carefully, since it means certain safety-net features simply aren’t reachable from mobile on that platform.
FAQ
Is NordPass secure?
Yes. NordPass uses strong encryption and a zero-knowledge policy, plus multi-factor authentication and biometric logins.
Does NordPass have a free version?
Yes. NordPass offers a generous free tier that includes unlimited password storage and unlimited device syncing, though it limits you to one simultaneous device login.
Is it possible to regain access to my NordPass account if I forget my master password?
Yes. NordPass supplies a Recovery Code that lets you regain access to your account should you forget your master password.
Can someone else be granted emergency access to my NordPass account?
Yes. Emergency access exists, but only Premium subscribers can designate emergency contacts; users on the Free plan can only be named as a contact for someone else’s account.
Article produced with the assistance of artificial intelligence and reviewed by the editorial team.
Key takeaways
NordPass offers six plans total — Free, Premium, and Family for individuals, plus Teams, Business, and Enterprise for organizations — each with different features and pricing.
The Free plan includes unlimited password storage, but only one device can be logged in at a time.
Premium and Family plans add secure sharing, password health checks, data breach monitoring, and email masking.
Security is built on strong encryption and a zero-knowledge architecture, supported by biometric login, multi-factor authentication, and passkeys.
The iOS app lags behind the desktop and Android versions, notably missing emergency access.
NordPass Plans and Pricing
NordPass structures its lineup around two audiences: individuals and businesses, with three tiers on each side and a genuinely usable free option. That split makes it straightforward to match a plan to actual needs rather than paying for features that go unused.
Personal Plans: Free, Premium, and Family
For everyday users, NordPass plans and pricing break down into Free, Premium, and Family, all sold on one- or two-year terms. The Free plan covers unlimited password storage, passkey support, a password generator, and multi-factor authentication — a solid baseline for a no-cost tool. The catch is that while your vault syncs across devices, you can only be logged in on one device at a time, which sets NordPass apart from rivals that allow concurrent sessions.
Stepping up to Premium costs US$1.49 per month on the two-year plan (plus three bonus months), and it unlocks secure sharing, a password health checker, data breach monitoring, emergency access permissions, and email masking. It also throws in 3 GB of encrypted cloud storage and unlimited simultaneous device connections. Family mirrors Premium’s feature set exactly but extends coverage to six users for US$2.79 per month, making it a practical option for households that don’t need more than half a dozen accounts.
Premium and Family users also get access to email masking, which generates unique, disposable email addresses to shield a real inbox from spam and data leaks. Messages sent to a masked address still land in the main inbox, and any mask can be disconnected instantly if it starts attracting spam.
Business Plans: Teams, Business, and Enterprise
On the organizational side, NordPass offers Teams, Business, and Enterprise, priced per user on a two-year basis at US$1.79, US$3.59, and US$5.39 respectively. Teams is sold as a 10-user pack and covers centralized onboarding, customizable access levels, and priority support — a reasonable entry point for small groups.
Business, aimed at organizations with 5 to 150 licenses, builds on Teams with shared folders, group management, a data breach scanner, and password auditing. It also integrates with Vanta, which NordPass says helps companies streamline compliance work toward ISO 27001 and SOC 2 Type 1 certification. Enterprise removes the license cap entirely and adds dedicated account management, advanced provisioning, additional single sign-on integrations with Okta, Entra ID, and MS ADFS, and round-the-clock premium support — features aimed squarely at larger organizations with more complex security requirements.
Security and Encryption Features
NordPass’s core security pitch rests on modern encryption paired with a design that keeps the company itself locked out of user data. That combination is what determines whether a breach on NordPass’s end would actually expose anyone’s passwords.
Encryption and Zero-Knowledge Architecture
NordPass relies on advanced, uncrackable encryption technology to protect user data. Underneath that sits zero-knowledge architecture: every password and note gets encrypted locally on a user’s device before it ever reaches NordPass’s servers, meaning even NordPass staff can’t view stored credentials. In practice, this setup limits the damage a server-side breach could cause, since attackers would only find encrypted data with no readable content behind it.
Authentication Methods and Passkeys
Beyond encryption, NordPass layers on several access-control tools. Biometric login works across mobile, Windows, and macOS, letting users unlock their vault with a fingerprint or facial scan instead of typing a master password every time. Multi-factor authentication is also built in, supporting authenticator apps like Google Authenticator, Microsoft Authenticator, and Authy, along with USB FIDO U2F security keys and backup codes.
Passkeys round out the picture, allowing account creation and login without a password at all — a feature available across every plan, including Free. One limitation worth flagging: NordPass currently reserves its TOTP authenticator for business subscribers, so personal users miss out on that specific tool even though the broader MFA options remain solid.
Core Functionalities and Usability
Security architecture only matters if the everyday tools built around it are easy to use, and this is where NordPass spends most of its feature budget — vaults, browser tools, generators, and monitoring systems designed to work quietly in the background.
Password Vault, Browser Extensions, and Password Generator
The vault itself is accessible through desktop apps on Windows, macOS, and Linux, mobile apps on Android and iOS, and browser extensions covering Chrome, Firefox, Opera, Edge, Brave, and Safari. Adding an entry is a simple click-and-fill process, and the vault handles passwords, secure notes, credit cards, personal details, and scanned documents like IDs, complete with expiry reminders. Premium and Family users can also attach files, backed by 3 GB of cloud storage per account, though items with attachments can’t be shared with other users.
The browser extension mirrors the desktop app’s functionality closely, prompting auto-fill on saved login pages and generating strong passwords on the fly during sign-up. The password generator itself lets users create strong passwords or passphrases and keeps a history of previously generated passwords — a small but genuinely useful safeguard against accidentally overwriting a working login.
Password Health, Data Breach Scanner, and Emergency Access
NordPass’s Password Health tool scans stored credentials for weak, reused, or exposed passwords, flagging accounts that need attention without assigning an overall score the way some competitors do. Paired with it, the data breach scanner checks the web for compromised credit cards or email addresses tied to a user’s vault and pushes real-time alerts the moment something turns up, including details on when the leak happened and what data was affected. Users can add extra email addresses to the monitoring list beyond the one tied to their NordPass account, which isn’t a universal feature among password managers.
Emergency access lets Premium subscribers designate trusted contacts who can request entry to the vault if something happens to the account owner; Free users can be recipients of that access but can’t set it up themselves. Emergency access is limited to stored passwords and secure notes rather than the entire vault.
This is also where the platform shows its clearest gap: the iOS app lacks several features present on desktop and Android, emergency access chief among them. Anyone relying primarily on an iPhone for password management should weigh that limitation carefully, since it means certain safety-net features simply aren’t reachable from mobile on that platform.
FAQ
Is NordPass secure?
Yes. NordPass uses strong encryption and a zero-knowledge policy, plus multi-factor authentication and biometric logins.
Does NordPass have a free version?
Yes. NordPass offers a generous free tier that includes unlimited password storage and unlimited device syncing, though it limits you to one simultaneous device login.
Is it possible to regain access to my NordPass account if I forget my master password?
Yes. NordPass supplies a Recovery Code that lets you regain access to your account should you forget your master password.
Can someone else be granted emergency access to my NordPass account?
Yes. Emergency access exists, but only Premium subscribers can designate emergency contacts; users on the Free plan can only be named as a contact for someone else’s account.
Article produced with the assistance of artificial intelligence and reviewed by the editorial team.
41
Статья
AXEL price prediction: token crashes 85% as RSI sinks to zeroAXEL is trading at just 0.00818€, and anyone searching for an AXEL price prediction right now is going to run into a market that looks technically wounded and fundamentally thin. The token has shed nearly all of its value this year, its trading volume has gone quiet, and the indicators traders normally rely on to spot a turnaround are flashing warning signs rather than opportunity. That combination — a tiny market cap, a steep yearly decline, and almost no forward-looking data — is exactly why this AXEL price prediction deserves a closer look before anyone treats it as an investment case.
Key takeaways
AXEL currently trades at 0.00818€ with a market capitalization of approximately €1.20M.
The token’s price has dropped -85.74% year-to-date, one of the steeper declines in the small-cap crypto space.
Weekly RSI sits at 0.00, a reading tied to strong bearish momentum.
MACD has stayed negative for over 50 periods, reinforcing the bearish technical picture.
No price prediction data exists for AXEL between 2026 and 2030, leaving long-term forecasting effectively blank.
Current Market Overview of AXEL
AXEL’s price and market size point to a project operating well outside the crypto mainstream. At 0.00818€ per token, AXEL carries a live market capitalization of roughly €1.20M — a figure that places it firmly in micro-cap territory, according to data reported by BeInCrypto France.
Current price and market capitalization
The €1.20M market cap matters because it shapes how much capital it takes to move the price meaningfully in either direction. Small-cap tokens like AXEL tend to swing harder on relatively modest buy or sell orders, which helps explain why the annual decline has been so severe.
Circulating supply and trading volume
AXEL’s circulating supply stands at approximately 148.03 million tokens. That supply, spread across a market cap this small, keeps the per-token price low and makes the asset sensitive to shifts in demand. On top of that, the 24-hour trading volume has been reported at €0.00 with a negative change, a sign of an unusually illiquid market where trades are sparse.
Technical Analysis Indicates Bearish Momentum
Every major technical signal tracked for AXEL points in the same direction: down. The price has already fallen below its horizontal resistance level near 0.00€, a move technical analysts typically read as a bearish deviation.
Price trend and year-to-date performance
The scale of the drop is the headline number here. AXEL’s price has moved -85.74% year-to-date, meaning anyone holding the token since the start of the year has watched the vast majority of its value disappear. That kind of decline usually reflects a mix of weak demand, thin liquidity, and limited new capital entering the asset.
RSI, moving averages, and MACD indicators summary
Over the 1-week timeframe, AXEL’s Relative Strength Index reads 0.00, a level associated with strong bearish momentum. Traders generally use RSI to spot overbought or oversold conditions, and a reading this low suggests selling pressure has dominated recent trading.
Moving averages tell a slightly more mixed story. AXEL shows a neutral trend on this front, since the MA-50 has crossed above the MA-200 while price trades above both lines — technically a bullish crossover pattern, even as other indicators lean bearish. MACD, meanwhile, confirms the broader downtrend: the signal line crossed below the MACD line more than 50 periods ago, and the histogram has stayed negative for those same 50 periods, a persistent bearish signal that hasn’t let up.
Fundamental Factors Driving AXEL’s Price
Beyond the charts, AXEL’s value ultimately comes down to the same forces that move most small-cap tokens: supply, demand, and who’s actually using the network. With a market capitalization near €1.20M and circulating supply of 148.03M tokens, the fundamentals suggest a project with limited current market depth.
Supply and demand dynamics
On-chain activity — active addresses, new wallets, and transaction counts — offers one way to gauge real demand for AXEL beyond price charts alone. Without meaningful growth in that activity, price recoveries tend to be harder to sustain.
Impact of adoption, protocol updates, whale activity, and regulations
Several variables can still push AXEL’s price in either direction. Broader adoption would need to increase demand, while protocol updates or hard forks could shift market sentiment quickly. Whale activity is a particular risk for a token this size: large sell orders from major holders can swing the price disproportionately given the thin market cap. Institutional adoption and regulatory developments round out the list of factors that could eventually reshape AXEL’s trajectory, though none of these are quantified in current data.
Price Prediction and Market Outlook
There is currently no reliable AXEL price prediction for the 2026–2030 window. Data covering minimum, average, and maximum price scenarios for those years simply isn’t available, which leaves long-term forecasting speculative at best.
Lack of precise price forecasts for 2026–2030
This gap matters for anyone trying to plan around AXEL over a multi-year horizon. Without min-max price ranges or average projections, there’s no structured forecast to lean on — only the current technical and fundamental picture described above.
Uncertainties affecting future price trajectory
News announcements, market-wide shifts, and project-specific updates can all alter AXEL’s path going forward. That uncertainty cuts both ways: it means no single method can reliably determine where the token heads next, and it means today’s bearish signals aren’t necessarily permanent. Anyone weighing an AXEL price prediction right now is working with a technical setup that looks weak, a fundamental base that’s thin, and a forecasting gap that stretches all the way to 2030.
FAQ
What is the current price and market capitalization of AXEL?
The current price of AXEL is 0.00818€ with a market capitalization of approximately €1.20M.
What do technical indicators say about AXEL’s price trend?
Technical indicators show a generally bearish trend for AXEL over a 1-week period, with RSI at 0.00 and MACD indicating a bearish trend.
Are there any price predictions available for AXEL for 2026 to 2030?
No price prediction data is currently available for AXEL from 2026 to 2030.
What factors influence AXEL’s price movements?
Price drivers include supply-demand dynamics, adoption rates, protocol updates, whale activity, and regulatory developments.
Article produced with the assistance of artificial intelligence and reviewed by the editorial team.
AXEL price prediction: token crashes 85% as RSI sinks to zero
AXEL is trading at just 0.00818€, and anyone searching for an AXEL price prediction right now is going to run into a market that looks technically wounded and fundamentally thin. The token has shed nearly all of its value this year, its trading volume has gone quiet, and the indicators traders normally rely on to spot a turnaround are flashing warning signs rather than opportunity. That combination — a tiny market cap, a steep yearly decline, and almost no forward-looking data — is exactly why this AXEL price prediction deserves a closer look before anyone treats it as an investment case.
Key takeaways
AXEL currently trades at 0.00818€ with a market capitalization of approximately €1.20M.
The token’s price has dropped -85.74% year-to-date, one of the steeper declines in the small-cap crypto space.
Weekly RSI sits at 0.00, a reading tied to strong bearish momentum.
MACD has stayed negative for over 50 periods, reinforcing the bearish technical picture.
No price prediction data exists for AXEL between 2026 and 2030, leaving long-term forecasting effectively blank.
Current Market Overview of AXEL
AXEL’s price and market size point to a project operating well outside the crypto mainstream. At 0.00818€ per token, AXEL carries a live market capitalization of roughly €1.20M — a figure that places it firmly in micro-cap territory, according to data reported by BeInCrypto France.
Current price and market capitalization
The €1.20M market cap matters because it shapes how much capital it takes to move the price meaningfully in either direction. Small-cap tokens like AXEL tend to swing harder on relatively modest buy or sell orders, which helps explain why the annual decline has been so severe.
Circulating supply and trading volume
AXEL’s circulating supply stands at approximately 148.03 million tokens. That supply, spread across a market cap this small, keeps the per-token price low and makes the asset sensitive to shifts in demand. On top of that, the 24-hour trading volume has been reported at €0.00 with a negative change, a sign of an unusually illiquid market where trades are sparse.
Technical Analysis Indicates Bearish Momentum
Every major technical signal tracked for AXEL points in the same direction: down. The price has already fallen below its horizontal resistance level near 0.00€, a move technical analysts typically read as a bearish deviation.
Price trend and year-to-date performance
The scale of the drop is the headline number here. AXEL’s price has moved -85.74% year-to-date, meaning anyone holding the token since the start of the year has watched the vast majority of its value disappear. That kind of decline usually reflects a mix of weak demand, thin liquidity, and limited new capital entering the asset.
RSI, moving averages, and MACD indicators summary
Over the 1-week timeframe, AXEL’s Relative Strength Index reads 0.00, a level associated with strong bearish momentum. Traders generally use RSI to spot overbought or oversold conditions, and a reading this low suggests selling pressure has dominated recent trading.
Moving averages tell a slightly more mixed story. AXEL shows a neutral trend on this front, since the MA-50 has crossed above the MA-200 while price trades above both lines — technically a bullish crossover pattern, even as other indicators lean bearish. MACD, meanwhile, confirms the broader downtrend: the signal line crossed below the MACD line more than 50 periods ago, and the histogram has stayed negative for those same 50 periods, a persistent bearish signal that hasn’t let up.
Fundamental Factors Driving AXEL’s Price
Beyond the charts, AXEL’s value ultimately comes down to the same forces that move most small-cap tokens: supply, demand, and who’s actually using the network. With a market capitalization near €1.20M and circulating supply of 148.03M tokens, the fundamentals suggest a project with limited current market depth.
Supply and demand dynamics
On-chain activity — active addresses, new wallets, and transaction counts — offers one way to gauge real demand for AXEL beyond price charts alone. Without meaningful growth in that activity, price recoveries tend to be harder to sustain.
Impact of adoption, protocol updates, whale activity, and regulations
Several variables can still push AXEL’s price in either direction. Broader adoption would need to increase demand, while protocol updates or hard forks could shift market sentiment quickly. Whale activity is a particular risk for a token this size: large sell orders from major holders can swing the price disproportionately given the thin market cap. Institutional adoption and regulatory developments round out the list of factors that could eventually reshape AXEL’s trajectory, though none of these are quantified in current data.
Price Prediction and Market Outlook
There is currently no reliable AXEL price prediction for the 2026–2030 window. Data covering minimum, average, and maximum price scenarios for those years simply isn’t available, which leaves long-term forecasting speculative at best.
Lack of precise price forecasts for 2026–2030
This gap matters for anyone trying to plan around AXEL over a multi-year horizon. Without min-max price ranges or average projections, there’s no structured forecast to lean on — only the current technical and fundamental picture described above.
Uncertainties affecting future price trajectory
News announcements, market-wide shifts, and project-specific updates can all alter AXEL’s path going forward. That uncertainty cuts both ways: it means no single method can reliably determine where the token heads next, and it means today’s bearish signals aren’t necessarily permanent. Anyone weighing an AXEL price prediction right now is working with a technical setup that looks weak, a fundamental base that’s thin, and a forecasting gap that stretches all the way to 2030.
FAQ
What is the current price and market capitalization of AXEL?
The current price of AXEL is 0.00818€ with a market capitalization of approximately €1.20M.
What do technical indicators say about AXEL’s price trend?
Technical indicators show a generally bearish trend for AXEL over a 1-week period, with RSI at 0.00 and MACD indicating a bearish trend.
Are there any price predictions available for AXEL for 2026 to 2030?
No price prediction data is currently available for AXEL from 2026 to 2030.
What factors influence AXEL’s price movements?
Price drivers include supply-demand dynamics, adoption rates, protocol updates, whale activity, and regulatory developments.
Article produced with the assistance of artificial intelligence and reviewed by the editorial team.
Key takeaways
AXEL currently trades at 0.00818€ with a market capitalization of approximately €1.20M.
The token’s price has dropped -85.74% year-to-date, one of the steeper declines in the small-cap crypto space.
Weekly RSI sits at 0.00, a reading tied to strong bearish momentum.
MACD has stayed negative for over 50 periods, reinforcing the bearish technical picture.
No price prediction data exists for AXEL between 2026 and 2030, leaving long-term forecasting effectively blank.
Current Market Overview of AXEL
AXEL’s price and market size point to a project operating well outside the crypto mainstream. At 0.00818€ per token, AXEL carries a live market capitalization of roughly €1.20M — a figure that places it firmly in micro-cap territory, according to data reported by BeInCrypto France.
Current price and market capitalization
The €1.20M market cap matters because it shapes how much capital it takes to move the price meaningfully in either direction. Small-cap tokens like AXEL tend to swing harder on relatively modest buy or sell orders, which helps explain why the annual decline has been so severe.
Circulating supply and trading volume
AXEL’s circulating supply stands at approximately 148.03 million tokens. That supply, spread across a market cap this small, keeps the per-token price low and makes the asset sensitive to shifts in demand. On top of that, the 24-hour trading volume has been reported at €0.00 with a negative change, a sign of an unusually illiquid market where trades are sparse.
Technical Analysis Indicates Bearish Momentum
Every major technical signal tracked for AXEL points in the same direction: down. The price has already fallen below its horizontal resistance level near 0.00€, a move technical analysts typically read as a bearish deviation.
Price trend and year-to-date performance
The scale of the drop is the headline number here. AXEL’s price has moved -85.74% year-to-date, meaning anyone holding the token since the start of the year has watched the vast majority of its value disappear. That kind of decline usually reflects a mix of weak demand, thin liquidity, and limited new capital entering the asset.
RSI, moving averages, and MACD indicators summary
Over the 1-week timeframe, AXEL’s Relative Strength Index reads 0.00, a level associated with strong bearish momentum. Traders generally use RSI to spot overbought or oversold conditions, and a reading this low suggests selling pressure has dominated recent trading.
Moving averages tell a slightly more mixed story. AXEL shows a neutral trend on this front, since the MA-50 has crossed above the MA-200 while price trades above both lines — technically a bullish crossover pattern, even as other indicators lean bearish. MACD, meanwhile, confirms the broader downtrend: the signal line crossed below the MACD line more than 50 periods ago, and the histogram has stayed negative for those same 50 periods, a persistent bearish signal that hasn’t let up.
Fundamental Factors Driving AXEL’s Price
Beyond the charts, AXEL’s value ultimately comes down to the same forces that move most small-cap tokens: supply, demand, and who’s actually using the network. With a market capitalization near €1.20M and circulating supply of 148.03M tokens, the fundamentals suggest a project with limited current market depth.
Supply and demand dynamics
On-chain activity — active addresses, new wallets, and transaction counts — offers one way to gauge real demand for AXEL beyond price charts alone. Without meaningful growth in that activity, price recoveries tend to be harder to sustain.
Impact of adoption, protocol updates, whale activity, and regulations
Several variables can still push AXEL’s price in either direction. Broader adoption would need to increase demand, while protocol updates or hard forks could shift market sentiment quickly. Whale activity is a particular risk for a token this size: large sell orders from major holders can swing the price disproportionately given the thin market cap. Institutional adoption and regulatory developments round out the list of factors that could eventually reshape AXEL’s trajectory, though none of these are quantified in current data.
Price Prediction and Market Outlook
There is currently no reliable AXEL price prediction for the 2026–2030 window. Data covering minimum, average, and maximum price scenarios for those years simply isn’t available, which leaves long-term forecasting speculative at best.
Lack of precise price forecasts for 2026–2030
This gap matters for anyone trying to plan around AXEL over a multi-year horizon. Without min-max price ranges or average projections, there’s no structured forecast to lean on — only the current technical and fundamental picture described above.
Uncertainties affecting future price trajectory
News announcements, market-wide shifts, and project-specific updates can all alter AXEL’s path going forward. That uncertainty cuts both ways: it means no single method can reliably determine where the token heads next, and it means today’s bearish signals aren’t necessarily permanent. Anyone weighing an AXEL price prediction right now is working with a technical setup that looks weak, a fundamental base that’s thin, and a forecasting gap that stretches all the way to 2030.
FAQ
What is the current price and market capitalization of AXEL?
The current price of AXEL is 0.00818€ with a market capitalization of approximately €1.20M.
What do technical indicators say about AXEL’s price trend?
Technical indicators show a generally bearish trend for AXEL over a 1-week period, with RSI at 0.00 and MACD indicating a bearish trend.
Are there any price predictions available for AXEL for 2026 to 2030?
No price prediction data is currently available for AXEL from 2026 to 2030.
What factors influence AXEL’s price movements?
Price drivers include supply-demand dynamics, adoption rates, protocol updates, whale activity, and regulatory developments.
Article produced with the assistance of artificial intelligence and reviewed by the editorial team.
14

Статья
BTC price hits overbought extremes near $85K, eyes $86.5K resistanceAs of September 21, 2026, Bitcoin is trading around $85,000, sitting above every major moving average and outside the upper Bollinger Band on multiple timeframes. The BTC price has entered a momentum event that could either extend further or snap back sharply once buyers run out of fuel.
BTC/USDT — daily chart with candlesticks, EMA20/EMA50 and volume.
Key takeaways
Bitcoin trades at approximately $85,000, well above all major daily moving averages, with price outside the upper Bollinger Band
Daily RSI14 sits at 71.58, while hourly RSI reaches 84.75 — both deep in overbought territory
VanEck sees Bitcoin hitting a key level next year as fiscal worries support the cryptocurrency, CNBC reported
The Fear & Greed Index reads 70 (“Greed”), signaling confidence but not yet euphoric extremes
Total crypto market capitalization stands near $2.88 trillion, with BTC dominance holding at 59.1%
Daily Structure: Trend Intact, But Stretched
The daily trend is unambiguously bullish. Price at $85,000 trades above the EMA20 at 78,640, the EMA50 at 74,951, and the EMA200 at 72,745, with all three stacked in the correct bullish order and rising steadily. That is a textbook trending market, not a range-bound consolidation.
The MACD line at 1,839 sits comfortably above its signal at 1,544, with a positive and still-expanding histogram of 294.86. This confirms that momentum is pushing higher rather than fading into a bearish crossover.
Where it gets more interesting is the Bollinger Band read. The daily upper band sits at 83,402 and price is trading above it. RSI14 on the daily is at 71.58, solidly in overbought territory. None of this invalidates the uptrend, but the current leg of the BTC price rally is running hot relative to its own recent volatility.
Moreover, the ATR14 of 2,313.95 represents roughly 2.7% of spot. Stretches like this tend to resolve one of two ways: either a sideways digestion that lets the moving averages catch up, or a sharper mean-reversion move back toward the band’s midline near 78,850.
1H and 15m: Momentum Confirms, But It’s Running Hot
The hourly chart does not contradict the daily story — if anything it amplifies it. EMA20 at 81,812, EMA50 at 81,094, and EMA200 at 79,178 are all aligned bullishly, and the MACD histogram of 331.9 is expanding. However, RSI14 on the 1H is at 84.75, and on the 15-minute chart it is even more extreme at 86.85.
Price is also trading outside the hourly upper Bollinger Band at 83,540 versus a close of 84,981. This is the part of the multi-timeframe picture that creates real tension. The structural trend across daily, hourly and 15-minute charts is unanimously bullish. However, the momentum readings on the two lower timeframes are deep enough into overbought that a short-term exhaustion move is a live risk.
Meanwhile, pivot levels add useful context for execution. On the daily, price is above the pivot at 83,716.7 and pushing toward R1 at 86,583.17, with S1 down at 82,133.52. The hourly pivot at 84,660.16 has already been reclaimed, with R1 at 85,620.32 as the next hurdle. The 15-minute pivot at 84,867.12 is essentially where price is sitting right now, typical of a market pausing under resistance.
Bullish Scenario
If price holds above the daily pivot near 83,717 and digests sideways rather than reversing, the path of least resistance stays toward the daily R1 at 86,583. That would fit with the broader risk-on tone in the market. Total market cap is up nearly 2.5% in a day, dominance is holding firm, and the macro narrative around fiscal concerns keeps institutional demand narratives alive. Confirmation would come from price holding above the 1H EMA20 at 81,812 on any pullback and from MACD histograms staying positive across timeframes.
Bearish / Mean-Reversion Scenario
The counter-case is not about the trend breaking — it is about the current extension unwinding. With RSI at extreme readings on both the 1H and 15m charts and price trading above the upper Bollinger Band on daily and hourly frames, a rejection near the 86,583 resistance zone could trigger a fast pullback. That move could reach the 1H pivot at 84,660 or further down to the daily S1 near 82,134. Such a drop would look sharp but would still be a retracement inside a larger uptrend, not a trend reversal. That changes only if price closes decisively below the daily EMA20 at 78,640.
What This Means for Positioning
Right now the honest read is that trend and momentum point in the same direction, but momentum has gotten ahead of itself. Daily ATR of roughly 2,300 points and hourly ATR near 700 points mean intraday swings of that magnitude should not surprise anyone. The Fear & Greed Index score of 70 suggests sentiment has room to get more euphoric before it becomes genuinely dangerous, but it is already past neutral. Greedy markets are where sharp two-way moves tend to originate, and that tension will likely define the next few sessions.
FAQ
Is Bitcoin overbought at $85,000?
Yes, according to the RSI14 readings. The daily RSI sits at 71.58, while the hourly RSI reaches 84.75 and the 15-minute RSI hits 86.85. These levels indicate the current rally is running hot, but overbought conditions in a strong trend can persist longer than expected before any pullback materializes.
What resistance level is Bitcoin facing next?
The immediate hurdle is the hourly R1 at 85,620.32, followed by the daily R1 at 86,583.17. A clean break above the latter would put the $86,500 ceiling in play and potentially open the door toward higher levels if broader risk appetite holds.
What would signal a trend reversal for Bitcoin?
A decisive close below the daily EMA20 at 78,640 would flip the structural read from bullish to something more cautious. Until that level breaks, any pullback should be viewed as a retracement inside a larger uptrend rather than a genuine trend reversal.
What is driving Bitcoin’s current rally?
Several factors are converging. VanEck sees Bitcoin hitting a key level next year as fiscal worries support the cryptocurrency, according to CNBC. Total crypto market capitalization sits near $2.88 trillion with BTC dominance at 59.1%. The Fear & Greed Index at 70 reflects growing confidence without having reached euphoric extremes.
Disclaimer: This article is for informational purposes only and does not constitute financial advice, an investment recommendation, or a solicitation to buy or sell any financial instrument or cryptocurrency. The analysis provided is not indicative of future results. Investing in crypto assets and financial markets carries a high risk of capital loss. Always do your own research (DYOR) and consult a qualified financial advisor before making any decision.
Article produced with the assistance of artificial intelligence and reviewed by the editorial team.
BTC price hits overbought extremes near $85K, eyes $86.5K resistance
As of September 21, 2026, Bitcoin is trading around $85,000, sitting above every major moving average and outside the upper Bollinger Band on multiple timeframes. The BTC price has entered a momentum event that could either extend further or snap back sharply once buyers run out of fuel.
BTC/USDT — daily chart with candlesticks, EMA20/EMA50 and volume.
Key takeaways
Bitcoin trades at approximately $85,000, well above all major daily moving averages, with price outside the upper Bollinger Band
Daily RSI14 sits at 71.58, while hourly RSI reaches 84.75 — both deep in overbought territory
VanEck sees Bitcoin hitting a key level next year as fiscal worries support the cryptocurrency, CNBC reported
The Fear & Greed Index reads 70 (“Greed”), signaling confidence but not yet euphoric extremes
Total crypto market capitalization stands near $2.88 trillion, with BTC dominance holding at 59.1%
Daily Structure: Trend Intact, But Stretched
The daily trend is unambiguously bullish. Price at $85,000 trades above the EMA20 at 78,640, the EMA50 at 74,951, and the EMA200 at 72,745, with all three stacked in the correct bullish order and rising steadily. That is a textbook trending market, not a range-bound consolidation.
The MACD line at 1,839 sits comfortably above its signal at 1,544, with a positive and still-expanding histogram of 294.86. This confirms that momentum is pushing higher rather than fading into a bearish crossover.
Where it gets more interesting is the Bollinger Band read. The daily upper band sits at 83,402 and price is trading above it. RSI14 on the daily is at 71.58, solidly in overbought territory. None of this invalidates the uptrend, but the current leg of the BTC price rally is running hot relative to its own recent volatility.
Moreover, the ATR14 of 2,313.95 represents roughly 2.7% of spot. Stretches like this tend to resolve one of two ways: either a sideways digestion that lets the moving averages catch up, or a sharper mean-reversion move back toward the band’s midline near 78,850.
1H and 15m: Momentum Confirms, But It’s Running Hot
The hourly chart does not contradict the daily story — if anything it amplifies it. EMA20 at 81,812, EMA50 at 81,094, and EMA200 at 79,178 are all aligned bullishly, and the MACD histogram of 331.9 is expanding. However, RSI14 on the 1H is at 84.75, and on the 15-minute chart it is even more extreme at 86.85.
Price is also trading outside the hourly upper Bollinger Band at 83,540 versus a close of 84,981. This is the part of the multi-timeframe picture that creates real tension. The structural trend across daily, hourly and 15-minute charts is unanimously bullish. However, the momentum readings on the two lower timeframes are deep enough into overbought that a short-term exhaustion move is a live risk.
Meanwhile, pivot levels add useful context for execution. On the daily, price is above the pivot at 83,716.7 and pushing toward R1 at 86,583.17, with S1 down at 82,133.52. The hourly pivot at 84,660.16 has already been reclaimed, with R1 at 85,620.32 as the next hurdle. The 15-minute pivot at 84,867.12 is essentially where price is sitting right now, typical of a market pausing under resistance.
Bullish Scenario
If price holds above the daily pivot near 83,717 and digests sideways rather than reversing, the path of least resistance stays toward the daily R1 at 86,583. That would fit with the broader risk-on tone in the market. Total market cap is up nearly 2.5% in a day, dominance is holding firm, and the macro narrative around fiscal concerns keeps institutional demand narratives alive. Confirmation would come from price holding above the 1H EMA20 at 81,812 on any pullback and from MACD histograms staying positive across timeframes.
Bearish / Mean-Reversion Scenario
The counter-case is not about the trend breaking — it is about the current extension unwinding. With RSI at extreme readings on both the 1H and 15m charts and price trading above the upper Bollinger Band on daily and hourly frames, a rejection near the 86,583 resistance zone could trigger a fast pullback. That move could reach the 1H pivot at 84,660 or further down to the daily S1 near 82,134. Such a drop would look sharp but would still be a retracement inside a larger uptrend, not a trend reversal. That changes only if price closes decisively below the daily EMA20 at 78,640.
What This Means for Positioning
Right now the honest read is that trend and momentum point in the same direction, but momentum has gotten ahead of itself. Daily ATR of roughly 2,300 points and hourly ATR near 700 points mean intraday swings of that magnitude should not surprise anyone. The Fear & Greed Index score of 70 suggests sentiment has room to get more euphoric before it becomes genuinely dangerous, but it is already past neutral. Greedy markets are where sharp two-way moves tend to originate, and that tension will likely define the next few sessions.
FAQ
Is Bitcoin overbought at $85,000?
Yes, according to the RSI14 readings. The daily RSI sits at 71.58, while the hourly RSI reaches 84.75 and the 15-minute RSI hits 86.85. These levels indicate the current rally is running hot, but overbought conditions in a strong trend can persist longer than expected before any pullback materializes.
What resistance level is Bitcoin facing next?
The immediate hurdle is the hourly R1 at 85,620.32, followed by the daily R1 at 86,583.17. A clean break above the latter would put the $86,500 ceiling in play and potentially open the door toward higher levels if broader risk appetite holds.
What would signal a trend reversal for Bitcoin?
A decisive close below the daily EMA20 at 78,640 would flip the structural read from bullish to something more cautious. Until that level breaks, any pullback should be viewed as a retracement inside a larger uptrend rather than a genuine trend reversal.
What is driving Bitcoin’s current rally?
Several factors are converging. VanEck sees Bitcoin hitting a key level next year as fiscal worries support the cryptocurrency, according to CNBC. Total crypto market capitalization sits near $2.88 trillion with BTC dominance at 59.1%. The Fear & Greed Index at 70 reflects growing confidence without having reached euphoric extremes.
Disclaimer: This article is for informational purposes only and does not constitute financial advice, an investment recommendation, or a solicitation to buy or sell any financial instrument or cryptocurrency. The analysis provided is not indicative of future results. Investing in crypto assets and financial markets carries a high risk of capital loss. Always do your own research (DYOR) and consult a qualified financial advisor before making any decision.
Article produced with the assistance of artificial intelligence and reviewed by the editorial team.
BTC/USDT — daily chart with candlesticks, EMA20/EMA50 and volume.
Key takeaways
Bitcoin trades at approximately $85,000, well above all major daily moving averages, with price outside the upper Bollinger Band
Daily RSI14 sits at 71.58, while hourly RSI reaches 84.75 — both deep in overbought territory
VanEck sees Bitcoin hitting a key level next year as fiscal worries support the cryptocurrency, CNBC reported
The Fear & Greed Index reads 70 (“Greed”), signaling confidence but not yet euphoric extremes
Total crypto market capitalization stands near $2.88 trillion, with BTC dominance holding at 59.1%
Daily Structure: Trend Intact, But Stretched
The daily trend is unambiguously bullish. Price at $85,000 trades above the EMA20 at 78,640, the EMA50 at 74,951, and the EMA200 at 72,745, with all three stacked in the correct bullish order and rising steadily. That is a textbook trending market, not a range-bound consolidation.
The MACD line at 1,839 sits comfortably above its signal at 1,544, with a positive and still-expanding histogram of 294.86. This confirms that momentum is pushing higher rather than fading into a bearish crossover.
Where it gets more interesting is the Bollinger Band read. The daily upper band sits at 83,402 and price is trading above it. RSI14 on the daily is at 71.58, solidly in overbought territory. None of this invalidates the uptrend, but the current leg of the BTC price rally is running hot relative to its own recent volatility.
Moreover, the ATR14 of 2,313.95 represents roughly 2.7% of spot. Stretches like this tend to resolve one of two ways: either a sideways digestion that lets the moving averages catch up, or a sharper mean-reversion move back toward the band’s midline near 78,850.
1H and 15m: Momentum Confirms, But It’s Running Hot
The hourly chart does not contradict the daily story — if anything it amplifies it. EMA20 at 81,812, EMA50 at 81,094, and EMA200 at 79,178 are all aligned bullishly, and the MACD histogram of 331.9 is expanding. However, RSI14 on the 1H is at 84.75, and on the 15-minute chart it is even more extreme at 86.85.
Price is also trading outside the hourly upper Bollinger Band at 83,540 versus a close of 84,981. This is the part of the multi-timeframe picture that creates real tension. The structural trend across daily, hourly and 15-minute charts is unanimously bullish. However, the momentum readings on the two lower timeframes are deep enough into overbought that a short-term exhaustion move is a live risk.
Meanwhile, pivot levels add useful context for execution. On the daily, price is above the pivot at 83,716.7 and pushing toward R1 at 86,583.17, with S1 down at 82,133.52. The hourly pivot at 84,660.16 has already been reclaimed, with R1 at 85,620.32 as the next hurdle. The 15-minute pivot at 84,867.12 is essentially where price is sitting right now, typical of a market pausing under resistance.
Bullish Scenario
If price holds above the daily pivot near 83,717 and digests sideways rather than reversing, the path of least resistance stays toward the daily R1 at 86,583. That would fit with the broader risk-on tone in the market. Total market cap is up nearly 2.5% in a day, dominance is holding firm, and the macro narrative around fiscal concerns keeps institutional demand narratives alive. Confirmation would come from price holding above the 1H EMA20 at 81,812 on any pullback and from MACD histograms staying positive across timeframes.
Bearish / Mean-Reversion Scenario
The counter-case is not about the trend breaking — it is about the current extension unwinding. With RSI at extreme readings on both the 1H and 15m charts and price trading above the upper Bollinger Band on daily and hourly frames, a rejection near the 86,583 resistance zone could trigger a fast pullback. That move could reach the 1H pivot at 84,660 or further down to the daily S1 near 82,134. Such a drop would look sharp but would still be a retracement inside a larger uptrend, not a trend reversal. That changes only if price closes decisively below the daily EMA20 at 78,640.
What This Means for Positioning
Right now the honest read is that trend and momentum point in the same direction, but momentum has gotten ahead of itself. Daily ATR of roughly 2,300 points and hourly ATR near 700 points mean intraday swings of that magnitude should not surprise anyone. The Fear & Greed Index score of 70 suggests sentiment has room to get more euphoric before it becomes genuinely dangerous, but it is already past neutral. Greedy markets are where sharp two-way moves tend to originate, and that tension will likely define the next few sessions.
FAQ
Is Bitcoin overbought at $85,000?
Yes, according to the RSI14 readings. The daily RSI sits at 71.58, while the hourly RSI reaches 84.75 and the 15-minute RSI hits 86.85. These levels indicate the current rally is running hot, but overbought conditions in a strong trend can persist longer than expected before any pullback materializes.
What resistance level is Bitcoin facing next?
The immediate hurdle is the hourly R1 at 85,620.32, followed by the daily R1 at 86,583.17. A clean break above the latter would put the $86,500 ceiling in play and potentially open the door toward higher levels if broader risk appetite holds.
What would signal a trend reversal for Bitcoin?
A decisive close below the daily EMA20 at 78,640 would flip the structural read from bullish to something more cautious. Until that level breaks, any pullback should be viewed as a retracement inside a larger uptrend rather than a genuine trend reversal.
What is driving Bitcoin’s current rally?
Several factors are converging. VanEck sees Bitcoin hitting a key level next year as fiscal worries support the cryptocurrency, according to CNBC. Total crypto market capitalization sits near $2.88 trillion with BTC dominance at 59.1%. The Fear & Greed Index at 70 reflects growing confidence without having reached euphoric extremes.
Disclaimer: This article is for informational purposes only and does not constitute financial advice, an investment recommendation, or a solicitation to buy or sell any financial instrument or cryptocurrency. The analysis provided is not indicative of future results. Investing in crypto assets and financial markets carries a high risk of capital loss. Always do your own research (DYOR) and consult a qualified financial advisor before making any decision.
Article produced with the assistance of artificial intelligence and reviewed by the editorial team.
30
Статья
Meta dividend distribution hits record date as Binance reinvests METAB tokensMeta Platforms shares jumped in early trading this week, and the move landed just as the company’s latest Meta dividend distribution reaches a key milestone for shareholders and, notably, for crypto traders holding a tokenized version of the stock on Binance. The tech giant’s stock climbed 2.60% to $682.55 in pre-market trading on Monday at 5:14 a.m. ET, a reversal from Friday’s 2.43% drop to $665.75. No specific catalyst for the early move was independently confirmed, though it came alongside broader gains in U.S. equity futures.
Key takeaways
Meta Platforms shares rose 2.60% to $682.55 in pre-market trading on Monday, following a 2.43% drop to $665.75 on Friday.
Meta’s board declared a $0.525 quarterly cash dividend, payable September 28 to shareholders of record as of September 21, which is also the ex-dividend date.
The dividend rate has held steady at $0.525 per quarter through 2026, working out to an annualized $2.10 per share.
Binance is supporting the Meta dividend distribution for holders of Meta Tokenized bStocks (METAB), using a snapshot taken at 00:00 UTC on September 21 to determine eligibility.
Meta Connect 2026 runs September 23-24, with CEO Mark Zuckerberg delivering the keynote on AI, AI glasses, and virtual reality.
Meta Shares Rise Ahead of Dividend Record Date
Meta stock‘s rise on Monday came alongside broader strength in U.S. equity markets, with Nasdaq futures up about 0.95% and S&P 500 futures gaining roughly 0.62% during Asian trading hours. The bounce followed a losing session on Friday, when shares slipped 2.43% to close at $665.75.
September 21 carries extra weight for META shareholders this cycle: it’s both the record date for the upcoming dividend and the stock’s ex-dividend date. That means anyone buying shares on or after that date won’t qualify for the September 28 payout, a timing detail that often shapes short-term trading around dividend-paying mega-caps.
Dividend Declaration and Details
Meta’s board declared a cash dividend of $0.525 per share on September 10 for holders of its Class A and Class B common stock. The payment goes out on September 28 to shareholders of record as of the close of business on September 21.
The company has kept the quarterly dividend rate unchanged at $0.525 throughout 2026, which annualizes to $2.10 per share. Meta only began paying a quarterly dividend in 2024 and bumped the payout up to $0.525 per share in 2025 — a payout level it has since maintained rather than raised further this year.
A Month of Sharp Gains and a Rocky Q2
The dividend news lands against the backdrop of a striking one-month run for Meta stock. According to 247wallst, shares climbed 23% over the past month even as the broader tech sector stayed largely flat — the Invesco QQQ Trust was essentially unchanged, down just 0.01% over the same span, while Alphabet rose 2% to $349.99 and Microsoft gained 3% to $494.69. Meta clearly outran its mega-cap peers by a wide margin, a sign the rally was specific to the company rather than a sector-wide lift.
That recovery traces back to Meta’s second-quarter results reported in late July, according to 247wallst. Diluted earnings per share of $6.18 came in below analyst consensus, even though quarterly revenue beat expectations, and the stock sold off on that report. According to 247wallst, the shortfall stemmed not from weaker underlying operations but from substantial legal-proceeding charges and severance expenses linked to earlier workforce reductions at Meta. On the earnings call, Chief Financial Officer Susan Li noted, as reported by 247wallst, that operating income would have grown year over year had these items been excluded.
On that same call, Meta’s chief executive described artificial intelligence investments as accelerating every major part of the company’s core business, pointing to large language models improving content recommendations and ad relevance, new image and video generation tools, and business agents and a model programming interface as future revenue lines, according to 247wallst. Between that AI narrative and the September 10 dividend announcement, the market appears to have reconsidered whether the July miss reflected the underlying business or simply that quarter’s one-time charges — and the past month’s price action suggests investors leaned toward the latter reading. Even so, Meta stock is up only 2% year to date, meaning the recent surge mostly repaired an earlier decline rather than pushing shares into genuinely new territory.
Meta’s official second-quarter 2026 report showed revenue reaching $60.80 billion, a 28% increase from the prior year. During the quarter, the company distributed $1.35 billion in dividends and dividend-equivalent payments while ending June with $90.26 billion in cash, cash equivalents, and marketable securities — a reserve that helps explain why the payout has remained stable even as AI infrastructure spending accelerates.
Binance Supports METAB Dividend Distribution
Here’s where the story crosses into crypto markets. Binance confirmed it will support the Meta dividend distribution for holders of Meta Tokenized bStocks, which trade under the ticker METAB. Users holding METAB at a snapshot taken at 00:00 UTC on September 21 qualify for the distribution — matching the same record date Meta itself set for traditional shareholders.
Instead of issuing a cash payment, Binance stated that it will use the net dividend amount to acquire additional METAB units or fractional units, once applicable withholding taxes, fees, costs, and other deductions are applied. For on-chain holders, this Binance METAB support mechanism will manifest as an adjustment to the bStock multiplier rather than a direct cash disbursement.
To process the corporate action cleanly, Binance suspended METAB deposits and withdrawals at 23:30 UTC on September 20, while spot trading of the token remained active throughout. Binance’s announcement covering this mechanism also extended to dividend distributions for Broadcom, Invesco QQQ Trust, and Seagate tokenized bStocks, suggesting the exchange is applying a standardized reinvestment process across its tokenized equity products.
Binance describes bStocks as tokenized securities issued by BTech Holdings Limited, designed to give holders economic exposure linked to the underlying shares. It’s worth being clear about what that means in practice: holders of Meta’s tokenized bStock do not directly own Meta common shares through the tokenized product itself. This structural distinction matters for anyone treating METAB as a crypto-native proxy for META stock — the exposure tracks the price and, now, the dividend economics, but ownership sits with the issuing structure rather than the token holder.
Meta Tokenized bStocks Trading Data
Trading activity around METAB picked up as the dividend snapshot approached. CoinMarketCap showed Meta Tokenized bStocks trading at about $681.32, up 2.07% over the previous 24 hours — tracking closely with Meta’s own share price movement.
Reported 24-hour trading volume came in at roughly $3.01 million, a 58.01% jump, while the tokenized stock carried a market capitalization of about $3.77 million. Those figures remain small relative to Meta’s own equity market, but the volume spike around the dividend snapshot points to active positioning by holders ahead of the corporate action deadline.
Meta Connect 2026 on the Horizon
Beyond the dividend mechanics, Meta has another catalyst on the calendar. Meta Connect 2026 is scheduled for September 23 and September 24, with the company confirming the event will include updates on artificial intelligence, AI glasses, and virtual reality.
Chief Executive Mark Zuckerberg is set to deliver the keynote. Per 247wallst’s reporting, Meta flagged this product conference during its July earnings call as a forward-looking marker — the next dated moment where the company’s heavy AI spending either keeps earning investor credit as a growth investment or starts getting counted again as a cost weighing on margins.
FAQ
When is Meta’s dividend payable and who is eligible?
Meta’s $0.525 quarterly cash dividend is payable on September 28, 2026, to shareholders of record as of the close of business on September 21, 2026.
How does Binance handle the Meta dividend distribution for METAB holders?
Binance supports the dividend by reinvesting the net dividend amount into additional METAB units or fractional units after applicable taxes and fees, with on-chain holders receiving adjustments via the bStock multiplier.
What is the significance of the METAB deposit and withdrawal suspension on Binance?
Deposits and withdrawals of METAB were suspended at 23:30 UTC on September 20, 2026, as part of the corporate action process to enable accurate dividend distribution, while spot trading remained available.
What topics will Meta Connect 2026 cover and who will speak?
Meta Connect 2026, scheduled for September 23-24, 2026, will cover updates on artificial intelligence, AI glasses, and virtual reality, featuring a keynote by Meta CEO Mark Zuckerberg.
Article produced with the assistance of artificial intelligence and reviewed by the editorial team.
Meta dividend distribution hits record date as Binance reinvests METAB tokens
Meta Platforms shares jumped in early trading this week, and the move landed just as the company’s latest Meta dividend distribution reaches a key milestone for shareholders and, notably, for crypto traders holding a tokenized version of the stock on Binance. The tech giant’s stock climbed 2.60% to $682.55 in pre-market trading on Monday at 5:14 a.m. ET, a reversal from Friday’s 2.43% drop to $665.75. No specific catalyst for the early move was independently confirmed, though it came alongside broader gains in U.S. equity futures.
Key takeaways
Meta Platforms shares rose 2.60% to $682.55 in pre-market trading on Monday, following a 2.43% drop to $665.75 on Friday.
Meta’s board declared a $0.525 quarterly cash dividend, payable September 28 to shareholders of record as of September 21, which is also the ex-dividend date.
The dividend rate has held steady at $0.525 per quarter through 2026, working out to an annualized $2.10 per share.
Binance is supporting the Meta dividend distribution for holders of Meta Tokenized bStocks (METAB), using a snapshot taken at 00:00 UTC on September 21 to determine eligibility.
Meta Connect 2026 runs September 23-24, with CEO Mark Zuckerberg delivering the keynote on AI, AI glasses, and virtual reality.
Meta Shares Rise Ahead of Dividend Record Date
Meta stock‘s rise on Monday came alongside broader strength in U.S. equity markets, with Nasdaq futures up about 0.95% and S&P 500 futures gaining roughly 0.62% during Asian trading hours. The bounce followed a losing session on Friday, when shares slipped 2.43% to close at $665.75.
September 21 carries extra weight for META shareholders this cycle: it’s both the record date for the upcoming dividend and the stock’s ex-dividend date. That means anyone buying shares on or after that date won’t qualify for the September 28 payout, a timing detail that often shapes short-term trading around dividend-paying mega-caps.
Dividend Declaration and Details
Meta’s board declared a cash dividend of $0.525 per share on September 10 for holders of its Class A and Class B common stock. The payment goes out on September 28 to shareholders of record as of the close of business on September 21.
The company has kept the quarterly dividend rate unchanged at $0.525 throughout 2026, which annualizes to $2.10 per share. Meta only began paying a quarterly dividend in 2024 and bumped the payout up to $0.525 per share in 2025 — a payout level it has since maintained rather than raised further this year.
A Month of Sharp Gains and a Rocky Q2
The dividend news lands against the backdrop of a striking one-month run for Meta stock. According to 247wallst, shares climbed 23% over the past month even as the broader tech sector stayed largely flat — the Invesco QQQ Trust was essentially unchanged, down just 0.01% over the same span, while Alphabet rose 2% to $349.99 and Microsoft gained 3% to $494.69. Meta clearly outran its mega-cap peers by a wide margin, a sign the rally was specific to the company rather than a sector-wide lift.
That recovery traces back to Meta’s second-quarter results reported in late July, according to 247wallst. Diluted earnings per share of $6.18 came in below analyst consensus, even though quarterly revenue beat expectations, and the stock sold off on that report. According to 247wallst, the shortfall stemmed not from weaker underlying operations but from substantial legal-proceeding charges and severance expenses linked to earlier workforce reductions at Meta. On the earnings call, Chief Financial Officer Susan Li noted, as reported by 247wallst, that operating income would have grown year over year had these items been excluded.
On that same call, Meta’s chief executive described artificial intelligence investments as accelerating every major part of the company’s core business, pointing to large language models improving content recommendations and ad relevance, new image and video generation tools, and business agents and a model programming interface as future revenue lines, according to 247wallst. Between that AI narrative and the September 10 dividend announcement, the market appears to have reconsidered whether the July miss reflected the underlying business or simply that quarter’s one-time charges — and the past month’s price action suggests investors leaned toward the latter reading. Even so, Meta stock is up only 2% year to date, meaning the recent surge mostly repaired an earlier decline rather than pushing shares into genuinely new territory.
Meta’s official second-quarter 2026 report showed revenue reaching $60.80 billion, a 28% increase from the prior year. During the quarter, the company distributed $1.35 billion in dividends and dividend-equivalent payments while ending June with $90.26 billion in cash, cash equivalents, and marketable securities — a reserve that helps explain why the payout has remained stable even as AI infrastructure spending accelerates.
Binance Supports METAB Dividend Distribution
Here’s where the story crosses into crypto markets. Binance confirmed it will support the Meta dividend distribution for holders of Meta Tokenized bStocks, which trade under the ticker METAB. Users holding METAB at a snapshot taken at 00:00 UTC on September 21 qualify for the distribution — matching the same record date Meta itself set for traditional shareholders.
Instead of issuing a cash payment, Binance stated that it will use the net dividend amount to acquire additional METAB units or fractional units, once applicable withholding taxes, fees, costs, and other deductions are applied. For on-chain holders, this Binance METAB support mechanism will manifest as an adjustment to the bStock multiplier rather than a direct cash disbursement.
To process the corporate action cleanly, Binance suspended METAB deposits and withdrawals at 23:30 UTC on September 20, while spot trading of the token remained active throughout. Binance’s announcement covering this mechanism also extended to dividend distributions for Broadcom, Invesco QQQ Trust, and Seagate tokenized bStocks, suggesting the exchange is applying a standardized reinvestment process across its tokenized equity products.
Binance describes bStocks as tokenized securities issued by BTech Holdings Limited, designed to give holders economic exposure linked to the underlying shares. It’s worth being clear about what that means in practice: holders of Meta’s tokenized bStock do not directly own Meta common shares through the tokenized product itself. This structural distinction matters for anyone treating METAB as a crypto-native proxy for META stock — the exposure tracks the price and, now, the dividend economics, but ownership sits with the issuing structure rather than the token holder.
Meta Tokenized bStocks Trading Data
Trading activity around METAB picked up as the dividend snapshot approached. CoinMarketCap showed Meta Tokenized bStocks trading at about $681.32, up 2.07% over the previous 24 hours — tracking closely with Meta’s own share price movement.
Reported 24-hour trading volume came in at roughly $3.01 million, a 58.01% jump, while the tokenized stock carried a market capitalization of about $3.77 million. Those figures remain small relative to Meta’s own equity market, but the volume spike around the dividend snapshot points to active positioning by holders ahead of the corporate action deadline.
Meta Connect 2026 on the Horizon
Beyond the dividend mechanics, Meta has another catalyst on the calendar. Meta Connect 2026 is scheduled for September 23 and September 24, with the company confirming the event will include updates on artificial intelligence, AI glasses, and virtual reality.
Chief Executive Mark Zuckerberg is set to deliver the keynote. Per 247wallst’s reporting, Meta flagged this product conference during its July earnings call as a forward-looking marker — the next dated moment where the company’s heavy AI spending either keeps earning investor credit as a growth investment or starts getting counted again as a cost weighing on margins.
FAQ
When is Meta’s dividend payable and who is eligible?
Meta’s $0.525 quarterly cash dividend is payable on September 28, 2026, to shareholders of record as of the close of business on September 21, 2026.
How does Binance handle the Meta dividend distribution for METAB holders?
Binance supports the dividend by reinvesting the net dividend amount into additional METAB units or fractional units after applicable taxes and fees, with on-chain holders receiving adjustments via the bStock multiplier.
What is the significance of the METAB deposit and withdrawal suspension on Binance?
Deposits and withdrawals of METAB were suspended at 23:30 UTC on September 20, 2026, as part of the corporate action process to enable accurate dividend distribution, while spot trading remained available.
What topics will Meta Connect 2026 cover and who will speak?
Meta Connect 2026, scheduled for September 23-24, 2026, will cover updates on artificial intelligence, AI glasses, and virtual reality, featuring a keynote by Meta CEO Mark Zuckerberg.
Article produced with the assistance of artificial intelligence and reviewed by the editorial team.
Key takeaways
Meta Platforms shares rose 2.60% to $682.55 in pre-market trading on Monday, following a 2.43% drop to $665.75 on Friday.
Meta’s board declared a $0.525 quarterly cash dividend, payable September 28 to shareholders of record as of September 21, which is also the ex-dividend date.
The dividend rate has held steady at $0.525 per quarter through 2026, working out to an annualized $2.10 per share.
Binance is supporting the Meta dividend distribution for holders of Meta Tokenized bStocks (METAB), using a snapshot taken at 00:00 UTC on September 21 to determine eligibility.
Meta Connect 2026 runs September 23-24, with CEO Mark Zuckerberg delivering the keynote on AI, AI glasses, and virtual reality.
Meta Shares Rise Ahead of Dividend Record Date
Meta stock‘s rise on Monday came alongside broader strength in U.S. equity markets, with Nasdaq futures up about 0.95% and S&P 500 futures gaining roughly 0.62% during Asian trading hours. The bounce followed a losing session on Friday, when shares slipped 2.43% to close at $665.75.
September 21 carries extra weight for META shareholders this cycle: it’s both the record date for the upcoming dividend and the stock’s ex-dividend date. That means anyone buying shares on or after that date won’t qualify for the September 28 payout, a timing detail that often shapes short-term trading around dividend-paying mega-caps.
Dividend Declaration and Details
Meta’s board declared a cash dividend of $0.525 per share on September 10 for holders of its Class A and Class B common stock. The payment goes out on September 28 to shareholders of record as of the close of business on September 21.
The company has kept the quarterly dividend rate unchanged at $0.525 throughout 2026, which annualizes to $2.10 per share. Meta only began paying a quarterly dividend in 2024 and bumped the payout up to $0.525 per share in 2025 — a payout level it has since maintained rather than raised further this year.
A Month of Sharp Gains and a Rocky Q2
The dividend news lands against the backdrop of a striking one-month run for Meta stock. According to 247wallst, shares climbed 23% over the past month even as the broader tech sector stayed largely flat — the Invesco QQQ Trust was essentially unchanged, down just 0.01% over the same span, while Alphabet rose 2% to $349.99 and Microsoft gained 3% to $494.69. Meta clearly outran its mega-cap peers by a wide margin, a sign the rally was specific to the company rather than a sector-wide lift.
That recovery traces back to Meta’s second-quarter results reported in late July, according to 247wallst. Diluted earnings per share of $6.18 came in below analyst consensus, even though quarterly revenue beat expectations, and the stock sold off on that report. According to 247wallst, the shortfall stemmed not from weaker underlying operations but from substantial legal-proceeding charges and severance expenses linked to earlier workforce reductions at Meta. On the earnings call, Chief Financial Officer Susan Li noted, as reported by 247wallst, that operating income would have grown year over year had these items been excluded.
On that same call, Meta’s chief executive described artificial intelligence investments as accelerating every major part of the company’s core business, pointing to large language models improving content recommendations and ad relevance, new image and video generation tools, and business agents and a model programming interface as future revenue lines, according to 247wallst. Between that AI narrative and the September 10 dividend announcement, the market appears to have reconsidered whether the July miss reflected the underlying business or simply that quarter’s one-time charges — and the past month’s price action suggests investors leaned toward the latter reading. Even so, Meta stock is up only 2% year to date, meaning the recent surge mostly repaired an earlier decline rather than pushing shares into genuinely new territory.
Meta’s official second-quarter 2026 report showed revenue reaching $60.80 billion, a 28% increase from the prior year. During the quarter, the company distributed $1.35 billion in dividends and dividend-equivalent payments while ending June with $90.26 billion in cash, cash equivalents, and marketable securities — a reserve that helps explain why the payout has remained stable even as AI infrastructure spending accelerates.
Binance Supports METAB Dividend Distribution
Here’s where the story crosses into crypto markets. Binance confirmed it will support the Meta dividend distribution for holders of Meta Tokenized bStocks, which trade under the ticker METAB. Users holding METAB at a snapshot taken at 00:00 UTC on September 21 qualify for the distribution — matching the same record date Meta itself set for traditional shareholders.
Instead of issuing a cash payment, Binance stated that it will use the net dividend amount to acquire additional METAB units or fractional units, once applicable withholding taxes, fees, costs, and other deductions are applied. For on-chain holders, this Binance METAB support mechanism will manifest as an adjustment to the bStock multiplier rather than a direct cash disbursement.
To process the corporate action cleanly, Binance suspended METAB deposits and withdrawals at 23:30 UTC on September 20, while spot trading of the token remained active throughout. Binance’s announcement covering this mechanism also extended to dividend distributions for Broadcom, Invesco QQQ Trust, and Seagate tokenized bStocks, suggesting the exchange is applying a standardized reinvestment process across its tokenized equity products.
Binance describes bStocks as tokenized securities issued by BTech Holdings Limited, designed to give holders economic exposure linked to the underlying shares. It’s worth being clear about what that means in practice: holders of Meta’s tokenized bStock do not directly own Meta common shares through the tokenized product itself. This structural distinction matters for anyone treating METAB as a crypto-native proxy for META stock — the exposure tracks the price and, now, the dividend economics, but ownership sits with the issuing structure rather than the token holder.
Meta Tokenized bStocks Trading Data
Trading activity around METAB picked up as the dividend snapshot approached. CoinMarketCap showed Meta Tokenized bStocks trading at about $681.32, up 2.07% over the previous 24 hours — tracking closely with Meta’s own share price movement.
Reported 24-hour trading volume came in at roughly $3.01 million, a 58.01% jump, while the tokenized stock carried a market capitalization of about $3.77 million. Those figures remain small relative to Meta’s own equity market, but the volume spike around the dividend snapshot points to active positioning by holders ahead of the corporate action deadline.
Meta Connect 2026 on the Horizon
Beyond the dividend mechanics, Meta has another catalyst on the calendar. Meta Connect 2026 is scheduled for September 23 and September 24, with the company confirming the event will include updates on artificial intelligence, AI glasses, and virtual reality.
Chief Executive Mark Zuckerberg is set to deliver the keynote. Per 247wallst’s reporting, Meta flagged this product conference during its July earnings call as a forward-looking marker — the next dated moment where the company’s heavy AI spending either keeps earning investor credit as a growth investment or starts getting counted again as a cost weighing on margins.
FAQ
When is Meta’s dividend payable and who is eligible?
Meta’s $0.525 quarterly cash dividend is payable on September 28, 2026, to shareholders of record as of the close of business on September 21, 2026.
How does Binance handle the Meta dividend distribution for METAB holders?
Binance supports the dividend by reinvesting the net dividend amount into additional METAB units or fractional units after applicable taxes and fees, with on-chain holders receiving adjustments via the bStock multiplier.
What is the significance of the METAB deposit and withdrawal suspension on Binance?
Deposits and withdrawals of METAB were suspended at 23:30 UTC on September 20, 2026, as part of the corporate action process to enable accurate dividend distribution, while spot trading remained available.
What topics will Meta Connect 2026 cover and who will speak?
Meta Connect 2026, scheduled for September 23-24, 2026, will cover updates on artificial intelligence, AI glasses, and virtual reality, featuring a keynote by Meta CEO Mark Zuckerberg.
Article produced with the assistance of artificial intelligence and reviewed by the editorial team.
107

Статья
MEV bot rsETH exploit: Yoink beats hacker to $7.7M on KelpAn attacker thought they had found an easy $7.7 million payday inside a Kelp DAO-linked wallet. Instead, they got beaten to the punch by a piece of automated code with a mischievous name: Yoink. The MEV bot rsETH exploit that unfolded this month is one of those rare blockchain stories where the villain of the plot ends up losing to an even faster opportunist, and the funds in question land somewhere nobody planned for.
Key takeaways
An attacker exploited a custom Uniswap v4 liquidity module tied to a Safe wallet, attempting to drain roughly $7.7 million in rsETH.
An MEV bot known as Yoink front-ran the malicious transaction and intercepted the funds before the attacker could take control of them.
Kelp, the protocol behind rsETH, placed the address that received the intercepted funds under a 24-hour precautionary pause.
Kelp said its own smart contracts were unaffected, that rsETH remained fully backed, and that minting, withdrawals and integrations continued normally.
In the same transaction, Yoink also transferred roughly 18.93 ETH, valued at about $46,000, to an address identified as a block builder, based on Etherscan data cited by Cointelegraph.
MEV Bot Yoink Front-Runs $7.7M rsETH Exploit on Kelp DAO
The incident, first flagged by blockchain security firm Blockaid and reported by Cointelegraph, centered on a Safe wallet connected to a custom module built on Uniswap v4. According to Blockaid, the attacker used a public keeper multicall to steer that module into an attacker-created hooked pool, where aEthrsETH tokens were unwrapped into rsETH. That maneuver was designed to strip roughly $7.73 million worth of rsETH out of the wallet.
It almost worked. But the transaction never made it to the finish line the attacker had in mind.
Mechanism of Front-Running via Mempool Visibility
Public blockchains expose pending transactions before they are confirmed, which means anyone watching the mempool can see an exploit coming and try to beat it to execution. That transparency is exactly what let Yoink react in time. The bot, described by Bitcoinist as an MEV searcher scanning for profitable opportunities, spotted the exploit attempt in the mempool and submitted its own transaction capable of executing first.
This is the double-edged nature of maximal extractable value activity on Ethereum: the same visibility that lets bad actors plan an attack also lets other bots spot it and jump the queue.
Yoink Bot’s Interception of Stolen Assets
Yoink’s transaction beat the attacker to the vulnerable rsETH, capturing the funds before the original exploiter could gain control of them. Etherscan data cited by Cointelegraph shows that in the same transaction, Yoink also transferred about 18.93 ETH — worth roughly $46,000 at the time — to an address labeled as a block builder, a detail that hints at how the bot compensated whoever helped get its transaction included first.
Kelp DAO’s Protocol Response and Asset Freezing
Kelp‘s response was fast and narrowly targeted: rather than shutting down the whole protocol, it froze the specific address that had received the intercepted rsETH. That single move mattered because it prevented the tokens from being moved again while the team figured out what had actually happened.
Protocol Pausing to Secure Intercepted Funds
Kelp placed the receiving address under a 24-hour pause, temporarily blocking any transfer of the tokens sitting there. In a public statement, Kelp described the move plainly: “This is a precautionary, wallet-level measure only,” the protocol said, adding that “Kelp contracts are safe, rsETH remains fully backed.” The team also said minting, withdrawals and integrations were continuing normally throughout, and that it was working with security experts to investigate the incident further.
Distinction Between Asset Interception and Recovery
Catching the funds before the attacker did is not the same thing as putting them safely back where they belong. Bitcoinist’s reporting on the episode underlined that gap directly: intercepting assets and completing a recovery are two very different stages, and the funds still had to be secured while the protocol worked out its next steps. A frozen address buys time. It does not, by itself, close the case.
Security Implications of the Exploit on Kelp Protocol
Even a defensive win carries a warning label. The fact that an outside bot had to step in to stop a $7.7 million loss shows that the vulnerability sitting in the custom module was real and exploitable, even though Kelp maintained that its core smart contracts were never compromised. The attack vector, according to Cointelegraph’s reporting, ran through the custom Uniswap v4 liquidity module connected to the victim’s Safe wallet, not through Kelp’s own contract code.
Revealed Vulnerabilities and Emergency Measures
That distinction matters for anyone trying to gauge how serious this was. Kelp’s contracts staying intact is reassuring, but the episode still forced an emergency wallet-level pause and an active investigation involving outside security specialists — not the kind of response a protocol mounts over a non-event. This is where the story becomes a genuine case study: a near-miss that still exposed a real weak point in the surrounding infrastructure, even if the core protocol logic held up.
Dual Nature of MEV Activity in Blockchain Ecosystem
What makes this episode worth watching beyond Kelp itself is the reminder it offers about how MEV bots behave on public chains. The same mempool transparency that lets attackers plan a theft also lets bots like Yoink spot the opportunity and race to intercept it first. That is not a fail-safe built into DeFi by design — it is closer to a lucky byproduct of competitive, profit-seeking automation. In practice, it means protocols can sometimes get an unplanned assist from the very actors typically cast as risks, even though nothing about that outcome was guaranteed.
FAQ
What did the MEV bot Yoink do during the Kelp rsETH exploit?
Yoink front-ran the exploit transaction and intercepted approximately $7.7 million worth of rsETH before the attacker could steal it.
Did Kelp DAO lose the $7.7 million during the exploit?
No, the intercepted assets were frozen after Kelp paused parts of its protocol, preventing the attacker from stealing the funds, although interception does not guarantee recovery.
Why did Kelp pause parts of its protocol during the incident?
Kelp paused smart contract operations to assess the situation and secure the intercepted assets after the exploit was front-run by the MEV bot.
What security concerns did this incident reveal about Kelp’s protocol?
The exploit exposed a significant vulnerability in the Kelp protocol that required emergency actions like pausing the protocol to prevent losses.
Article produced with the assistance of artificial intelligence and reviewed by the editorial team.
MEV bot rsETH exploit: Yoink beats hacker to $7.7M on Kelp
An attacker thought they had found an easy $7.7 million payday inside a Kelp DAO-linked wallet. Instead, they got beaten to the punch by a piece of automated code with a mischievous name: Yoink. The MEV bot rsETH exploit that unfolded this month is one of those rare blockchain stories where the villain of the plot ends up losing to an even faster opportunist, and the funds in question land somewhere nobody planned for.
Key takeaways
An attacker exploited a custom Uniswap v4 liquidity module tied to a Safe wallet, attempting to drain roughly $7.7 million in rsETH.
An MEV bot known as Yoink front-ran the malicious transaction and intercepted the funds before the attacker could take control of them.
Kelp, the protocol behind rsETH, placed the address that received the intercepted funds under a 24-hour precautionary pause.
Kelp said its own smart contracts were unaffected, that rsETH remained fully backed, and that minting, withdrawals and integrations continued normally.
In the same transaction, Yoink also transferred roughly 18.93 ETH, valued at about $46,000, to an address identified as a block builder, based on Etherscan data cited by Cointelegraph.
MEV Bot Yoink Front-Runs $7.7M rsETH Exploit on Kelp DAO
The incident, first flagged by blockchain security firm Blockaid and reported by Cointelegraph, centered on a Safe wallet connected to a custom module built on Uniswap v4. According to Blockaid, the attacker used a public keeper multicall to steer that module into an attacker-created hooked pool, where aEthrsETH tokens were unwrapped into rsETH. That maneuver was designed to strip roughly $7.73 million worth of rsETH out of the wallet.
It almost worked. But the transaction never made it to the finish line the attacker had in mind.
Mechanism of Front-Running via Mempool Visibility
Public blockchains expose pending transactions before they are confirmed, which means anyone watching the mempool can see an exploit coming and try to beat it to execution. That transparency is exactly what let Yoink react in time. The bot, described by Bitcoinist as an MEV searcher scanning for profitable opportunities, spotted the exploit attempt in the mempool and submitted its own transaction capable of executing first.
This is the double-edged nature of maximal extractable value activity on Ethereum: the same visibility that lets bad actors plan an attack also lets other bots spot it and jump the queue.
Yoink Bot’s Interception of Stolen Assets
Yoink’s transaction beat the attacker to the vulnerable rsETH, capturing the funds before the original exploiter could gain control of them. Etherscan data cited by Cointelegraph shows that in the same transaction, Yoink also transferred about 18.93 ETH — worth roughly $46,000 at the time — to an address labeled as a block builder, a detail that hints at how the bot compensated whoever helped get its transaction included first.
Kelp DAO’s Protocol Response and Asset Freezing
Kelp‘s response was fast and narrowly targeted: rather than shutting down the whole protocol, it froze the specific address that had received the intercepted rsETH. That single move mattered because it prevented the tokens from being moved again while the team figured out what had actually happened.
Protocol Pausing to Secure Intercepted Funds
Kelp placed the receiving address under a 24-hour pause, temporarily blocking any transfer of the tokens sitting there. In a public statement, Kelp described the move plainly: “This is a precautionary, wallet-level measure only,” the protocol said, adding that “Kelp contracts are safe, rsETH remains fully backed.” The team also said minting, withdrawals and integrations were continuing normally throughout, and that it was working with security experts to investigate the incident further.
Distinction Between Asset Interception and Recovery
Catching the funds before the attacker did is not the same thing as putting them safely back where they belong. Bitcoinist’s reporting on the episode underlined that gap directly: intercepting assets and completing a recovery are two very different stages, and the funds still had to be secured while the protocol worked out its next steps. A frozen address buys time. It does not, by itself, close the case.
Security Implications of the Exploit on Kelp Protocol
Even a defensive win carries a warning label. The fact that an outside bot had to step in to stop a $7.7 million loss shows that the vulnerability sitting in the custom module was real and exploitable, even though Kelp maintained that its core smart contracts were never compromised. The attack vector, according to Cointelegraph’s reporting, ran through the custom Uniswap v4 liquidity module connected to the victim’s Safe wallet, not through Kelp’s own contract code.
Revealed Vulnerabilities and Emergency Measures
That distinction matters for anyone trying to gauge how serious this was. Kelp’s contracts staying intact is reassuring, but the episode still forced an emergency wallet-level pause and an active investigation involving outside security specialists — not the kind of response a protocol mounts over a non-event. This is where the story becomes a genuine case study: a near-miss that still exposed a real weak point in the surrounding infrastructure, even if the core protocol logic held up.
Dual Nature of MEV Activity in Blockchain Ecosystem
What makes this episode worth watching beyond Kelp itself is the reminder it offers about how MEV bots behave on public chains. The same mempool transparency that lets attackers plan a theft also lets bots like Yoink spot the opportunity and race to intercept it first. That is not a fail-safe built into DeFi by design — it is closer to a lucky byproduct of competitive, profit-seeking automation. In practice, it means protocols can sometimes get an unplanned assist from the very actors typically cast as risks, even though nothing about that outcome was guaranteed.
FAQ
What did the MEV bot Yoink do during the Kelp rsETH exploit?
Yoink front-ran the exploit transaction and intercepted approximately $7.7 million worth of rsETH before the attacker could steal it.
Did Kelp DAO lose the $7.7 million during the exploit?
No, the intercepted assets were frozen after Kelp paused parts of its protocol, preventing the attacker from stealing the funds, although interception does not guarantee recovery.
Why did Kelp pause parts of its protocol during the incident?
Kelp paused smart contract operations to assess the situation and secure the intercepted assets after the exploit was front-run by the MEV bot.
What security concerns did this incident reveal about Kelp’s protocol?
The exploit exposed a significant vulnerability in the Kelp protocol that required emergency actions like pausing the protocol to prevent losses.
Article produced with the assistance of artificial intelligence and reviewed by the editorial team.
Key takeaways
An attacker exploited a custom Uniswap v4 liquidity module tied to a Safe wallet, attempting to drain roughly $7.7 million in rsETH.
An MEV bot known as Yoink front-ran the malicious transaction and intercepted the funds before the attacker could take control of them.
Kelp, the protocol behind rsETH, placed the address that received the intercepted funds under a 24-hour precautionary pause.
Kelp said its own smart contracts were unaffected, that rsETH remained fully backed, and that minting, withdrawals and integrations continued normally.
In the same transaction, Yoink also transferred roughly 18.93 ETH, valued at about $46,000, to an address identified as a block builder, based on Etherscan data cited by Cointelegraph.
MEV Bot Yoink Front-Runs $7.7M rsETH Exploit on Kelp DAO
The incident, first flagged by blockchain security firm Blockaid and reported by Cointelegraph, centered on a Safe wallet connected to a custom module built on Uniswap v4. According to Blockaid, the attacker used a public keeper multicall to steer that module into an attacker-created hooked pool, where aEthrsETH tokens were unwrapped into rsETH. That maneuver was designed to strip roughly $7.73 million worth of rsETH out of the wallet.
It almost worked. But the transaction never made it to the finish line the attacker had in mind.
Mechanism of Front-Running via Mempool Visibility
Public blockchains expose pending transactions before they are confirmed, which means anyone watching the mempool can see an exploit coming and try to beat it to execution. That transparency is exactly what let Yoink react in time. The bot, described by Bitcoinist as an MEV searcher scanning for profitable opportunities, spotted the exploit attempt in the mempool and submitted its own transaction capable of executing first.
This is the double-edged nature of maximal extractable value activity on Ethereum: the same visibility that lets bad actors plan an attack also lets other bots spot it and jump the queue.
Yoink Bot’s Interception of Stolen Assets
Yoink’s transaction beat the attacker to the vulnerable rsETH, capturing the funds before the original exploiter could gain control of them. Etherscan data cited by Cointelegraph shows that in the same transaction, Yoink also transferred about 18.93 ETH — worth roughly $46,000 at the time — to an address labeled as a block builder, a detail that hints at how the bot compensated whoever helped get its transaction included first.
Kelp DAO’s Protocol Response and Asset Freezing
Kelp‘s response was fast and narrowly targeted: rather than shutting down the whole protocol, it froze the specific address that had received the intercepted rsETH. That single move mattered because it prevented the tokens from being moved again while the team figured out what had actually happened.
Protocol Pausing to Secure Intercepted Funds
Kelp placed the receiving address under a 24-hour pause, temporarily blocking any transfer of the tokens sitting there. In a public statement, Kelp described the move plainly: “This is a precautionary, wallet-level measure only,” the protocol said, adding that “Kelp contracts are safe, rsETH remains fully backed.” The team also said minting, withdrawals and integrations were continuing normally throughout, and that it was working with security experts to investigate the incident further.
Distinction Between Asset Interception and Recovery
Catching the funds before the attacker did is not the same thing as putting them safely back where they belong. Bitcoinist’s reporting on the episode underlined that gap directly: intercepting assets and completing a recovery are two very different stages, and the funds still had to be secured while the protocol worked out its next steps. A frozen address buys time. It does not, by itself, close the case.
Security Implications of the Exploit on Kelp Protocol
Even a defensive win carries a warning label. The fact that an outside bot had to step in to stop a $7.7 million loss shows that the vulnerability sitting in the custom module was real and exploitable, even though Kelp maintained that its core smart contracts were never compromised. The attack vector, according to Cointelegraph’s reporting, ran through the custom Uniswap v4 liquidity module connected to the victim’s Safe wallet, not through Kelp’s own contract code.
Revealed Vulnerabilities and Emergency Measures
That distinction matters for anyone trying to gauge how serious this was. Kelp’s contracts staying intact is reassuring, but the episode still forced an emergency wallet-level pause and an active investigation involving outside security specialists — not the kind of response a protocol mounts over a non-event. This is where the story becomes a genuine case study: a near-miss that still exposed a real weak point in the surrounding infrastructure, even if the core protocol logic held up.
Dual Nature of MEV Activity in Blockchain Ecosystem
What makes this episode worth watching beyond Kelp itself is the reminder it offers about how MEV bots behave on public chains. The same mempool transparency that lets attackers plan a theft also lets bots like Yoink spot the opportunity and race to intercept it first. That is not a fail-safe built into DeFi by design — it is closer to a lucky byproduct of competitive, profit-seeking automation. In practice, it means protocols can sometimes get an unplanned assist from the very actors typically cast as risks, even though nothing about that outcome was guaranteed.
FAQ
What did the MEV bot Yoink do during the Kelp rsETH exploit?
Yoink front-ran the exploit transaction and intercepted approximately $7.7 million worth of rsETH before the attacker could steal it.
Did Kelp DAO lose the $7.7 million during the exploit?
No, the intercepted assets were frozen after Kelp paused parts of its protocol, preventing the attacker from stealing the funds, although interception does not guarantee recovery.
Why did Kelp pause parts of its protocol during the incident?
Kelp paused smart contract operations to assess the situation and secure the intercepted assets after the exploit was front-run by the MEV bot.
What security concerns did this incident reveal about Kelp’s protocol?
The exploit exposed a significant vulnerability in the Kelp protocol that required emergency actions like pausing the protocol to prevent losses.
Article produced with the assistance of artificial intelligence and reviewed by the editorial team.
48

Статья
Novo Nordisk’s growth strategy fails to calm investors as shares sink 7%Novo Nordisk investors got a jolt on Monday, and it wasn’t the good kind. Shares in the Danish drugmaker tumbled as much as 7% after executives laid out a long-awaited growth strategy meant to answer one nagging question: what happens when the Novo Nordisk Wegovy patent protection runs out? The answer, delivered at a capital markets day in London, left the market underwhelmed even as the company promised to become bigger and more diversified on the other side of that cliff.
Key takeaways
Novo Nordisk shares fell as much as 7% on Monday, later paring losses to trade around 4.8% to 6% lower, after the company unveiled its 2030 growth strategy.
The company wants to launch more than five drugs with “multi-blockbuster” potential by 2030 and generate over 150 billion Danish kroner ($23 billion) in pipeline sales by 2035.
Semaglutide, the active ingredient in Wegovy and Ozempic, loses key patent exclusivity starting in 2032 in the United States, its largest market.
Eli Lilly has already grabbed a majority share of the injectable GLP-1 market with Mounjaro and Zepbound.
Novo Nordisk rebranded to Novo and reshaped its corporate culture to respond to intensifying competition.
Novo Nordisk’s Growth Strategy Amid Patent Challenges
Novo Nordisk is betting on a wave of new medicines to offset what’s coming down the road. The company told investors it aims to launch more than five drugs with “multi-blockbuster” potential by 2030, spanning obesity, diabetes and beyond. According to Investing.com, the plan includes at least five Phase 3 programmes in obesity and diabetes and at least five more in other therapeutic areas, a signal that Novo wants a broader footprint than the one built almost entirely on semaglutide.
New drug launches and sales targets
The numbers behind that ambition are steep. Novo said its risk-adjusted pipeline, including current assets, should generate more than 150 billion Danish kroner — roughly $23 billion — in sales by 2035. The company also said it plans to expand capacity so it can provide oral GLP-1 treatments to ten times more people with obesity, with a goal of reaching more than 60 million patients globally by 2030, based on details reported by Investing.com.
Revenue growth expectations through 2030
According to Investing.com’s reporting, on the top line Novo forecasts that its compound annual revenue growth from 2026 to 2030 will match that of “industry peers,” a list it defined as Eli Lilly, AstraZeneca, Gilead, Johnson & Johnson, AbbVie, Novartis, Sanofi, Roche, GSK, Amgen, Merck & Co, Biogen, Pfizer and Bristol Myers Squibb. The company said it also intends to keep its operating margin broadly stable and maintain what it called an attractive dividend per share. Notably, Novo stressed these targets are based on a 2026 baseline, carry inherent uncertainty, and do not amount to formal financial guidance — a caveat that matters given how the stock reacted anyway.
Patent Expiration and Market Competition Risks
The core tension driving Monday’s selloff is straightforward: Novo’s most lucrative product line has a shelf life, and that clock is now ticking louder. CEO Mike Doustdar confirmed at the London event that semaglutide — the active ingredient behind both Wegovy and Ozempic — will lose key patent exclusivity starting in the early next decade, with the U.S. patent expiring in 2032. That matters enormously because the U.S. accounts for more than half of Novo’s sales.
Semaglutide patent exclusivity ending in 2032 in the U.S.
Doustdar didn’t dodge the issue. “This loss of exclusivity is what’s on most people’s mind, and rightfully so,” he told investors, adding: “We created an incredibly attractive market, and now almost every other single pharma company, big or small, is trying to come and compete with us. We need to be ready for that.” It’s a rare moment of a CEO naming the elephant in the room directly, rather than letting analysts speculate about it.
Rise of competition from multiple pharmaceutical companies
This rivalry is no longer just a hypothetical threat, as it is already reflected in market-share figures — Eli Lilly, through its drugs Mounjaro and Zepbound, has secured a majority share of the injectable GLP-1 space, heightening competition in a market Novo originally created. The contrast in investor sentiment has been stark too: ahead of Monday’s market open, Novo shares had fallen roughly 27% over the past year, while Lilly’s stock climbed about 52% over the same stretch.
This matters beyond one earnings cycle. When a company that pioneered a multibillion-dollar drug category starts losing ground to a rival on its own turf, it raises questions for the entire obesity-drug market about pricing power, pipeline execution and how quickly loss of exclusivity actually translates into revenue pressure once generic and biosimilar competition arrives after 2032.
Strategic Diversification and Corporate Initiatives
Novo’s answer to all of this is essentially: get bigger and less dependent on one molecule. “We plan to come on the other side of the LOE as a bigger company than we are today and a much more diversified version of it,” Doustdar said, referring to the loss of exclusivity. He also made clear the company isn’t minimizing what’s ahead, acknowledging the challenges tied to price pressure once competitors flood in.
Plans to diversify post-patent expiration
Part of that diversification push involves rethinking how the flagship product itself reaches patients. Novo Nordisk is rolling out the Wegovy pill in additional markets beyond the injectable version, even though the oral formulation still represents a small slice of total sales today. The oral GLP-1 expansion tied to the 60-million-patient goal by 2030 fits into that same logic: reach more people, in more forms, before competitors close the gap.
Expansion of Wegovy pill and corporate rebranding
The company also made a symbolic move last week, ahead of the London presentation: rebranding from Novo Nordisk to simply Novo, alongside an overhaul of its corporate culture. The stated goal was to better meet what the company describes as fierce competition from Lilly. Whether a name change shifts market perception is another matter, but it signals that leadership sees this moment as more than a routine strategy refresh — it’s being treated as a cultural reset too.
Market Reaction and Investor Sentiment
Wall Street’s verdict was blunt. Copenhagen-listed shares fell as much as 7% before paring some losses to trade around 4.8% to 6% lower depending on the reading, according to CNBC and Investing.com. Per Hansen, savings economist at Nordnet, offered a pointed explanation for why the announcement failed to reassure investors: “Investors hoped for a project ‘miracle’ that could turn the momentum around short term. For obvious reasons that miracle does not exist.”
That reaction underscores a broader dynamic worth watching. Novo laid out numbers — the drug-launch target, the 150 billion kroner pipeline goal, the peer-aligned growth outlook — but numbers alone didn’t erase the deeper worry sitting underneath them: that the company’s next decade hinges on execution against a semaglutide patent cliff that is still years away yet already reshaping how the market prices the stock today.
FAQ
Why did Novo Nordisk shares fall recently?
Shares fell as much as 7% after the company announced a new growth strategy amid concerns over patent expirations and rising competition.
When will the key patent for Novo Nordisk’s semaglutide drugs expire?
The semaglutide patent exclusivity is set to expire in 2032 in the United States.
How is Novo Nordisk planning to maintain growth after patent expiration?
Novo Nordisk plans to launch over five multi-blockbuster drugs by 2030, diversify its portfolio, and expand the Wegovy pill into new markets.
Who is the main competitor challenging Novo Nordisk in the obesity drug market?
Eli Lilly has gained a majority market share in the injectable GLP-1 space with drugs like Mounjaro and Zepbound.
Article produced with the assistance of artificial intelligence and reviewed by the editorial team.
Novo Nordisk’s growth strategy fails to calm investors as shares sink 7%
Novo Nordisk investors got a jolt on Monday, and it wasn’t the good kind. Shares in the Danish drugmaker tumbled as much as 7% after executives laid out a long-awaited growth strategy meant to answer one nagging question: what happens when the Novo Nordisk Wegovy patent protection runs out? The answer, delivered at a capital markets day in London, left the market underwhelmed even as the company promised to become bigger and more diversified on the other side of that cliff.
Key takeaways
Novo Nordisk shares fell as much as 7% on Monday, later paring losses to trade around 4.8% to 6% lower, after the company unveiled its 2030 growth strategy.
The company wants to launch more than five drugs with “multi-blockbuster” potential by 2030 and generate over 150 billion Danish kroner ($23 billion) in pipeline sales by 2035.
Semaglutide, the active ingredient in Wegovy and Ozempic, loses key patent exclusivity starting in 2032 in the United States, its largest market.
Eli Lilly has already grabbed a majority share of the injectable GLP-1 market with Mounjaro and Zepbound.
Novo Nordisk rebranded to Novo and reshaped its corporate culture to respond to intensifying competition.
Novo Nordisk’s Growth Strategy Amid Patent Challenges
Novo Nordisk is betting on a wave of new medicines to offset what’s coming down the road. The company told investors it aims to launch more than five drugs with “multi-blockbuster” potential by 2030, spanning obesity, diabetes and beyond. According to Investing.com, the plan includes at least five Phase 3 programmes in obesity and diabetes and at least five more in other therapeutic areas, a signal that Novo wants a broader footprint than the one built almost entirely on semaglutide.
New drug launches and sales targets
The numbers behind that ambition are steep. Novo said its risk-adjusted pipeline, including current assets, should generate more than 150 billion Danish kroner — roughly $23 billion — in sales by 2035. The company also said it plans to expand capacity so it can provide oral GLP-1 treatments to ten times more people with obesity, with a goal of reaching more than 60 million patients globally by 2030, based on details reported by Investing.com.
Revenue growth expectations through 2030
According to Investing.com’s reporting, on the top line Novo forecasts that its compound annual revenue growth from 2026 to 2030 will match that of “industry peers,” a list it defined as Eli Lilly, AstraZeneca, Gilead, Johnson & Johnson, AbbVie, Novartis, Sanofi, Roche, GSK, Amgen, Merck & Co, Biogen, Pfizer and Bristol Myers Squibb. The company said it also intends to keep its operating margin broadly stable and maintain what it called an attractive dividend per share. Notably, Novo stressed these targets are based on a 2026 baseline, carry inherent uncertainty, and do not amount to formal financial guidance — a caveat that matters given how the stock reacted anyway.
Patent Expiration and Market Competition Risks
The core tension driving Monday’s selloff is straightforward: Novo’s most lucrative product line has a shelf life, and that clock is now ticking louder. CEO Mike Doustdar confirmed at the London event that semaglutide — the active ingredient behind both Wegovy and Ozempic — will lose key patent exclusivity starting in the early next decade, with the U.S. patent expiring in 2032. That matters enormously because the U.S. accounts for more than half of Novo’s sales.
Semaglutide patent exclusivity ending in 2032 in the U.S.
Doustdar didn’t dodge the issue. “This loss of exclusivity is what’s on most people’s mind, and rightfully so,” he told investors, adding: “We created an incredibly attractive market, and now almost every other single pharma company, big or small, is trying to come and compete with us. We need to be ready for that.” It’s a rare moment of a CEO naming the elephant in the room directly, rather than letting analysts speculate about it.
Rise of competition from multiple pharmaceutical companies
This rivalry is no longer just a hypothetical threat, as it is already reflected in market-share figures — Eli Lilly, through its drugs Mounjaro and Zepbound, has secured a majority share of the injectable GLP-1 space, heightening competition in a market Novo originally created. The contrast in investor sentiment has been stark too: ahead of Monday’s market open, Novo shares had fallen roughly 27% over the past year, while Lilly’s stock climbed about 52% over the same stretch.
This matters beyond one earnings cycle. When a company that pioneered a multibillion-dollar drug category starts losing ground to a rival on its own turf, it raises questions for the entire obesity-drug market about pricing power, pipeline execution and how quickly loss of exclusivity actually translates into revenue pressure once generic and biosimilar competition arrives after 2032.
Strategic Diversification and Corporate Initiatives
Novo’s answer to all of this is essentially: get bigger and less dependent on one molecule. “We plan to come on the other side of the LOE as a bigger company than we are today and a much more diversified version of it,” Doustdar said, referring to the loss of exclusivity. He also made clear the company isn’t minimizing what’s ahead, acknowledging the challenges tied to price pressure once competitors flood in.
Plans to diversify post-patent expiration
Part of that diversification push involves rethinking how the flagship product itself reaches patients. Novo Nordisk is rolling out the Wegovy pill in additional markets beyond the injectable version, even though the oral formulation still represents a small slice of total sales today. The oral GLP-1 expansion tied to the 60-million-patient goal by 2030 fits into that same logic: reach more people, in more forms, before competitors close the gap.
Expansion of Wegovy pill and corporate rebranding
The company also made a symbolic move last week, ahead of the London presentation: rebranding from Novo Nordisk to simply Novo, alongside an overhaul of its corporate culture. The stated goal was to better meet what the company describes as fierce competition from Lilly. Whether a name change shifts market perception is another matter, but it signals that leadership sees this moment as more than a routine strategy refresh — it’s being treated as a cultural reset too.
Market Reaction and Investor Sentiment
Wall Street’s verdict was blunt. Copenhagen-listed shares fell as much as 7% before paring some losses to trade around 4.8% to 6% lower depending on the reading, according to CNBC and Investing.com. Per Hansen, savings economist at Nordnet, offered a pointed explanation for why the announcement failed to reassure investors: “Investors hoped for a project ‘miracle’ that could turn the momentum around short term. For obvious reasons that miracle does not exist.”
That reaction underscores a broader dynamic worth watching. Novo laid out numbers — the drug-launch target, the 150 billion kroner pipeline goal, the peer-aligned growth outlook — but numbers alone didn’t erase the deeper worry sitting underneath them: that the company’s next decade hinges on execution against a semaglutide patent cliff that is still years away yet already reshaping how the market prices the stock today.
FAQ
Why did Novo Nordisk shares fall recently?
Shares fell as much as 7% after the company announced a new growth strategy amid concerns over patent expirations and rising competition.
When will the key patent for Novo Nordisk’s semaglutide drugs expire?
The semaglutide patent exclusivity is set to expire in 2032 in the United States.
How is Novo Nordisk planning to maintain growth after patent expiration?
Novo Nordisk plans to launch over five multi-blockbuster drugs by 2030, diversify its portfolio, and expand the Wegovy pill into new markets.
Who is the main competitor challenging Novo Nordisk in the obesity drug market?
Eli Lilly has gained a majority market share in the injectable GLP-1 space with drugs like Mounjaro and Zepbound.
Article produced with the assistance of artificial intelligence and reviewed by the editorial team.
Key takeaways
Novo Nordisk shares fell as much as 7% on Monday, later paring losses to trade around 4.8% to 6% lower, after the company unveiled its 2030 growth strategy.
The company wants to launch more than five drugs with “multi-blockbuster” potential by 2030 and generate over 150 billion Danish kroner ($23 billion) in pipeline sales by 2035.
Semaglutide, the active ingredient in Wegovy and Ozempic, loses key patent exclusivity starting in 2032 in the United States, its largest market.
Eli Lilly has already grabbed a majority share of the injectable GLP-1 market with Mounjaro and Zepbound.
Novo Nordisk rebranded to Novo and reshaped its corporate culture to respond to intensifying competition.
Novo Nordisk’s Growth Strategy Amid Patent Challenges
Novo Nordisk is betting on a wave of new medicines to offset what’s coming down the road. The company told investors it aims to launch more than five drugs with “multi-blockbuster” potential by 2030, spanning obesity, diabetes and beyond. According to Investing.com, the plan includes at least five Phase 3 programmes in obesity and diabetes and at least five more in other therapeutic areas, a signal that Novo wants a broader footprint than the one built almost entirely on semaglutide.
New drug launches and sales targets
The numbers behind that ambition are steep. Novo said its risk-adjusted pipeline, including current assets, should generate more than 150 billion Danish kroner — roughly $23 billion — in sales by 2035. The company also said it plans to expand capacity so it can provide oral GLP-1 treatments to ten times more people with obesity, with a goal of reaching more than 60 million patients globally by 2030, based on details reported by Investing.com.
Revenue growth expectations through 2030
According to Investing.com’s reporting, on the top line Novo forecasts that its compound annual revenue growth from 2026 to 2030 will match that of “industry peers,” a list it defined as Eli Lilly, AstraZeneca, Gilead, Johnson & Johnson, AbbVie, Novartis, Sanofi, Roche, GSK, Amgen, Merck & Co, Biogen, Pfizer and Bristol Myers Squibb. The company said it also intends to keep its operating margin broadly stable and maintain what it called an attractive dividend per share. Notably, Novo stressed these targets are based on a 2026 baseline, carry inherent uncertainty, and do not amount to formal financial guidance — a caveat that matters given how the stock reacted anyway.
Patent Expiration and Market Competition Risks
The core tension driving Monday’s selloff is straightforward: Novo’s most lucrative product line has a shelf life, and that clock is now ticking louder. CEO Mike Doustdar confirmed at the London event that semaglutide — the active ingredient behind both Wegovy and Ozempic — will lose key patent exclusivity starting in the early next decade, with the U.S. patent expiring in 2032. That matters enormously because the U.S. accounts for more than half of Novo’s sales.
Semaglutide patent exclusivity ending in 2032 in the U.S.
Doustdar didn’t dodge the issue. “This loss of exclusivity is what’s on most people’s mind, and rightfully so,” he told investors, adding: “We created an incredibly attractive market, and now almost every other single pharma company, big or small, is trying to come and compete with us. We need to be ready for that.” It’s a rare moment of a CEO naming the elephant in the room directly, rather than letting analysts speculate about it.
Rise of competition from multiple pharmaceutical companies
This rivalry is no longer just a hypothetical threat, as it is already reflected in market-share figures — Eli Lilly, through its drugs Mounjaro and Zepbound, has secured a majority share of the injectable GLP-1 space, heightening competition in a market Novo originally created. The contrast in investor sentiment has been stark too: ahead of Monday’s market open, Novo shares had fallen roughly 27% over the past year, while Lilly’s stock climbed about 52% over the same stretch.
This matters beyond one earnings cycle. When a company that pioneered a multibillion-dollar drug category starts losing ground to a rival on its own turf, it raises questions for the entire obesity-drug market about pricing power, pipeline execution and how quickly loss of exclusivity actually translates into revenue pressure once generic and biosimilar competition arrives after 2032.
Strategic Diversification and Corporate Initiatives
Novo’s answer to all of this is essentially: get bigger and less dependent on one molecule. “We plan to come on the other side of the LOE as a bigger company than we are today and a much more diversified version of it,” Doustdar said, referring to the loss of exclusivity. He also made clear the company isn’t minimizing what’s ahead, acknowledging the challenges tied to price pressure once competitors flood in.
Plans to diversify post-patent expiration
Part of that diversification push involves rethinking how the flagship product itself reaches patients. Novo Nordisk is rolling out the Wegovy pill in additional markets beyond the injectable version, even though the oral formulation still represents a small slice of total sales today. The oral GLP-1 expansion tied to the 60-million-patient goal by 2030 fits into that same logic: reach more people, in more forms, before competitors close the gap.
Expansion of Wegovy pill and corporate rebranding
The company also made a symbolic move last week, ahead of the London presentation: rebranding from Novo Nordisk to simply Novo, alongside an overhaul of its corporate culture. The stated goal was to better meet what the company describes as fierce competition from Lilly. Whether a name change shifts market perception is another matter, but it signals that leadership sees this moment as more than a routine strategy refresh — it’s being treated as a cultural reset too.
Market Reaction and Investor Sentiment
Wall Street’s verdict was blunt. Copenhagen-listed shares fell as much as 7% before paring some losses to trade around 4.8% to 6% lower depending on the reading, according to CNBC and Investing.com. Per Hansen, savings economist at Nordnet, offered a pointed explanation for why the announcement failed to reassure investors: “Investors hoped for a project ‘miracle’ that could turn the momentum around short term. For obvious reasons that miracle does not exist.”
That reaction underscores a broader dynamic worth watching. Novo laid out numbers — the drug-launch target, the 150 billion kroner pipeline goal, the peer-aligned growth outlook — but numbers alone didn’t erase the deeper worry sitting underneath them: that the company’s next decade hinges on execution against a semaglutide patent cliff that is still years away yet already reshaping how the market prices the stock today.
FAQ
Why did Novo Nordisk shares fall recently?
Shares fell as much as 7% after the company announced a new growth strategy amid concerns over patent expirations and rising competition.
When will the key patent for Novo Nordisk’s semaglutide drugs expire?
The semaglutide patent exclusivity is set to expire in 2032 in the United States.
How is Novo Nordisk planning to maintain growth after patent expiration?
Novo Nordisk plans to launch over five multi-blockbuster drugs by 2030, diversify its portfolio, and expand the Wegovy pill into new markets.
Who is the main competitor challenging Novo Nordisk in the obesity drug market?
Eli Lilly has gained a majority market share in the injectable GLP-1 space with drugs like Mounjaro and Zepbound.
Article produced with the assistance of artificial intelligence and reviewed by the editorial team.
147

Статья
AI antitrust lawsuit filed against OpenAI, Anthropic, Google over coordinated slowdownA new AI antitrust lawsuit has landed on the desks of some of the biggest names in artificial intelligence, and it accuses them of doing something rather unusual for rival companies: agreeing to slow each other down. Four paying subscribers to ChatGPT, Claude, Grok, and Gemini filed a national class action in the Northern District of California federal court on September 21, 2026, naming Anthropic, OpenAI, SpaceXAI, and Google as defendants. Their argument is straightforward and unusual at the same time — they say the four labs coordinated to pace frontier-model development, and that coordination, not any single company’s caution, is what breaks antitrust law.
Key takeaways
Four paying subscribers to ChatGPT, Claude, Grok, and Gemini filed a class-action lawsuit against Anthropic, OpenAI, SpaceXAI, and Google on September 21, 2026, in the Northern District of California.
The complaint alleges the four labs violated antitrust laws by coordinating to slow frontier AI development, reducing subscriber value and market competition.
The dispute traces back to a September 12 essay by Anthropic CEO Dario Amodei, “We Must Pace the Frontier,” which drew public support from Sam Altman, Elon Musk, and Demis Hassabis.
Lead counsel Nick Rowley warned that leaving AI safety to private agreements between for-profit companies risks the technology slipping out of human control.
The lawsuit still needs to clear class-certification, and none of the four companies has commented publicly.
Lawsuit Filed Against AI Companies for Alleged Coordinated Slowdown
The core of the case is that a deliberate pact among competitors to slow down, rather than an internal, independent decision by one company, is what plaintiffs consider anti-competitive. According to the complaint, the alleged agreement reduces the value subscribers get for their money and slows the kind of progress a genuinely competitive market would otherwise deliver faster.
Subscribers Accuse AI Labs of Antitrust Violations
The plaintiffs are ordinary users, not corporations or governments. They pay monthly subscriptions for ChatGPT, Claude, Grok, and Gemini, and their claim is that this money is not buying what it should — because, in their reading, the four labs behind those products effectively synchronized their pace of innovation. That framing is what turns a debate over AI safety into a legal question about competition law.
Legal Challenge Targets Collective Slowdown Agreement
Crucially, the lawsuit does not argue that any single lab was wrong to choose caution on its own, nor does it dispute calls for Congress or the White House to regulate the sector or grant some kind of antitrust exemption for safety coordination. What it challenges is the shortcut of swapping individual corporate responsibility for a collective, self-imposed slowdown among direct competitors — an arrangement the plaintiffs say has an anti-competitive effect on the people paying for these services.
Calls for Pacing AI Development and Industry Reactions
This entire dispute traces back to a single essay published days before the filing, and to the wave of public agreement it triggered among rival CEOs. That sequence — one company’s warning followed almost immediately by competitors echoing it — is precisely what the plaintiffs now point to as evidence of coordination.
Anthropic’s Amodei and the Risks Behind “We Must Pace the Frontier”
Everything traces back to September 12, when Anthropic CEO Dario Amodei published an essay titled “We Must Pace the Frontier,” urging the industry to slow the rate at which AI capabilities grow. In it, he lists the risks he considers most pressing: loss of control over advanced systems, misuse for cyberattacks and bioterrorism, and recursive self-improvement, which he argues should be approached with extreme caution, if pursued at all. His starkest warning concerns “agent swarms,” which he suggests could fuel a persistent botnet across the internet within six to twelve months, with damages potentially running into the hundreds of billions of dollars.
Support and Comments from Key Industry Leaders
Anthropic was not the only company touched by the essay’s reach. Sam Altman voiced agreement that the pace of frontier development needs to be managed, pledging that external evaluators would be given access, echoing a pledge Anthropic claims it will make lasting. Elon Musk offered a blunt endorsement — “Dario is right” — while Demis Hassabis, the former CEO of Google DeepMind, backed the general direction without going into specifics. That chain of public agreement among leaders of rival companies is now central to the plaintiffs’ case, since it is precisely this kind of alignment that the Anthropic OpenAI lawsuit treats as suspect rather than reassuring.
Legal, Political, and Market Implications
Beyond the courtroom, the case lands in a moment when the politics of AI regulation are anything but settled, and when investors are already jittery about what a coordinated slowdown could mean for the sector’s growth story.
Warnings About Risks of Private Safety Agreements
Lead plaintiffs’ counsel Nick Rowley cautioned that relying on private agreements among major for-profit firms to ensure AI safety could allow the technology to escape human oversight. It’s a pointed argument: if the labs themselves decide, informally and among each other, how fast the technology should move, there is no external check on that decision beyond the companies’ own judgment.
Political Crosscurrents and Market Jitters
The regulatory backdrop only adds to the uncertainty. Donald Trump has rejected calls for tighter oversight of AI on social platforms, while David Sacks, who heads the President’s Council of Advisors on Science and Technology, has said that companies steering the market don’t need government intervention to slow down. Amodei himself had already anticipated antitrust objections, expressing hope that Washington would help facilitate dialogue among the labs rather than treat coordination as a violation. Financial markets reacted almost immediately to the pacing debate: on September 14, Intel dropped about 7%, AMD fell 6%, and Nvidia slid 3%, a sign that investors are watching the AI regulation conversation in the USA as closely as any product launch. For now, none of the four companies named in the suit has commented, and the case must first clear the court’s class-certification process before it can move forward.
FAQ
Who filed the class-action lawsuit against Anthropic, OpenAI, SpaceXAI, and Google?
Four paying subscribers to ChatGPT, Claude, Grok, and Gemini filed the lawsuit.
What are the main allegations against the AI companies in the lawsuit?
They are accused of coordinating to slow frontier-model AI development, violating antitrust laws and reducing subscriber value.
What reasons did Anthropic CEO Dario Amodei give for calling to slow AI development?
He cited risks including loss of control, misuse for cyberattacks and bioterrorism, and recursive self-improvement.
Have the involved companies commented on the lawsuit?
The companies have not commented on the lawsuit, which is awaiting class-certification clearance.
Article produced with the assistance of artificial intelligence and reviewed by the editorial team.
AI antitrust lawsuit filed against OpenAI, Anthropic, Google over coordinated slowdown
A new AI antitrust lawsuit has landed on the desks of some of the biggest names in artificial intelligence, and it accuses them of doing something rather unusual for rival companies: agreeing to slow each other down. Four paying subscribers to ChatGPT, Claude, Grok, and Gemini filed a national class action in the Northern District of California federal court on September 21, 2026, naming Anthropic, OpenAI, SpaceXAI, and Google as defendants. Their argument is straightforward and unusual at the same time — they say the four labs coordinated to pace frontier-model development, and that coordination, not any single company’s caution, is what breaks antitrust law.
Key takeaways
Four paying subscribers to ChatGPT, Claude, Grok, and Gemini filed a class-action lawsuit against Anthropic, OpenAI, SpaceXAI, and Google on September 21, 2026, in the Northern District of California.
The complaint alleges the four labs violated antitrust laws by coordinating to slow frontier AI development, reducing subscriber value and market competition.
The dispute traces back to a September 12 essay by Anthropic CEO Dario Amodei, “We Must Pace the Frontier,” which drew public support from Sam Altman, Elon Musk, and Demis Hassabis.
Lead counsel Nick Rowley warned that leaving AI safety to private agreements between for-profit companies risks the technology slipping out of human control.
The lawsuit still needs to clear class-certification, and none of the four companies has commented publicly.
Lawsuit Filed Against AI Companies for Alleged Coordinated Slowdown
The core of the case is that a deliberate pact among competitors to slow down, rather than an internal, independent decision by one company, is what plaintiffs consider anti-competitive. According to the complaint, the alleged agreement reduces the value subscribers get for their money and slows the kind of progress a genuinely competitive market would otherwise deliver faster.
Subscribers Accuse AI Labs of Antitrust Violations
The plaintiffs are ordinary users, not corporations or governments. They pay monthly subscriptions for ChatGPT, Claude, Grok, and Gemini, and their claim is that this money is not buying what it should — because, in their reading, the four labs behind those products effectively synchronized their pace of innovation. That framing is what turns a debate over AI safety into a legal question about competition law.
Legal Challenge Targets Collective Slowdown Agreement
Crucially, the lawsuit does not argue that any single lab was wrong to choose caution on its own, nor does it dispute calls for Congress or the White House to regulate the sector or grant some kind of antitrust exemption for safety coordination. What it challenges is the shortcut of swapping individual corporate responsibility for a collective, self-imposed slowdown among direct competitors — an arrangement the plaintiffs say has an anti-competitive effect on the people paying for these services.
Calls for Pacing AI Development and Industry Reactions
This entire dispute traces back to a single essay published days before the filing, and to the wave of public agreement it triggered among rival CEOs. That sequence — one company’s warning followed almost immediately by competitors echoing it — is precisely what the plaintiffs now point to as evidence of coordination.
Anthropic’s Amodei and the Risks Behind “We Must Pace the Frontier”
Everything traces back to September 12, when Anthropic CEO Dario Amodei published an essay titled “We Must Pace the Frontier,” urging the industry to slow the rate at which AI capabilities grow. In it, he lists the risks he considers most pressing: loss of control over advanced systems, misuse for cyberattacks and bioterrorism, and recursive self-improvement, which he argues should be approached with extreme caution, if pursued at all. His starkest warning concerns “agent swarms,” which he suggests could fuel a persistent botnet across the internet within six to twelve months, with damages potentially running into the hundreds of billions of dollars.
Support and Comments from Key Industry Leaders
Anthropic was not the only company touched by the essay’s reach. Sam Altman voiced agreement that the pace of frontier development needs to be managed, pledging that external evaluators would be given access, echoing a pledge Anthropic claims it will make lasting. Elon Musk offered a blunt endorsement — “Dario is right” — while Demis Hassabis, the former CEO of Google DeepMind, backed the general direction without going into specifics. That chain of public agreement among leaders of rival companies is now central to the plaintiffs’ case, since it is precisely this kind of alignment that the Anthropic OpenAI lawsuit treats as suspect rather than reassuring.
Legal, Political, and Market Implications
Beyond the courtroom, the case lands in a moment when the politics of AI regulation are anything but settled, and when investors are already jittery about what a coordinated slowdown could mean for the sector’s growth story.
Warnings About Risks of Private Safety Agreements
Lead plaintiffs’ counsel Nick Rowley cautioned that relying on private agreements among major for-profit firms to ensure AI safety could allow the technology to escape human oversight. It’s a pointed argument: if the labs themselves decide, informally and among each other, how fast the technology should move, there is no external check on that decision beyond the companies’ own judgment.
Political Crosscurrents and Market Jitters
The regulatory backdrop only adds to the uncertainty. Donald Trump has rejected calls for tighter oversight of AI on social platforms, while David Sacks, who heads the President’s Council of Advisors on Science and Technology, has said that companies steering the market don’t need government intervention to slow down. Amodei himself had already anticipated antitrust objections, expressing hope that Washington would help facilitate dialogue among the labs rather than treat coordination as a violation. Financial markets reacted almost immediately to the pacing debate: on September 14, Intel dropped about 7%, AMD fell 6%, and Nvidia slid 3%, a sign that investors are watching the AI regulation conversation in the USA as closely as any product launch. For now, none of the four companies named in the suit has commented, and the case must first clear the court’s class-certification process before it can move forward.
FAQ
Who filed the class-action lawsuit against Anthropic, OpenAI, SpaceXAI, and Google?
Four paying subscribers to ChatGPT, Claude, Grok, and Gemini filed the lawsuit.
What are the main allegations against the AI companies in the lawsuit?
They are accused of coordinating to slow frontier-model AI development, violating antitrust laws and reducing subscriber value.
What reasons did Anthropic CEO Dario Amodei give for calling to slow AI development?
He cited risks including loss of control, misuse for cyberattacks and bioterrorism, and recursive self-improvement.
Have the involved companies commented on the lawsuit?
The companies have not commented on the lawsuit, which is awaiting class-certification clearance.
Article produced with the assistance of artificial intelligence and reviewed by the editorial team.
Key takeaways
Four paying subscribers to ChatGPT, Claude, Grok, and Gemini filed a class-action lawsuit against Anthropic, OpenAI, SpaceXAI, and Google on September 21, 2026, in the Northern District of California.
The complaint alleges the four labs violated antitrust laws by coordinating to slow frontier AI development, reducing subscriber value and market competition.
The dispute traces back to a September 12 essay by Anthropic CEO Dario Amodei, “We Must Pace the Frontier,” which drew public support from Sam Altman, Elon Musk, and Demis Hassabis.
Lead counsel Nick Rowley warned that leaving AI safety to private agreements between for-profit companies risks the technology slipping out of human control.
The lawsuit still needs to clear class-certification, and none of the four companies has commented publicly.
Lawsuit Filed Against AI Companies for Alleged Coordinated Slowdown
The core of the case is that a deliberate pact among competitors to slow down, rather than an internal, independent decision by one company, is what plaintiffs consider anti-competitive. According to the complaint, the alleged agreement reduces the value subscribers get for their money and slows the kind of progress a genuinely competitive market would otherwise deliver faster.
Subscribers Accuse AI Labs of Antitrust Violations
The plaintiffs are ordinary users, not corporations or governments. They pay monthly subscriptions for ChatGPT, Claude, Grok, and Gemini, and their claim is that this money is not buying what it should — because, in their reading, the four labs behind those products effectively synchronized their pace of innovation. That framing is what turns a debate over AI safety into a legal question about competition law.
Legal Challenge Targets Collective Slowdown Agreement
Crucially, the lawsuit does not argue that any single lab was wrong to choose caution on its own, nor does it dispute calls for Congress or the White House to regulate the sector or grant some kind of antitrust exemption for safety coordination. What it challenges is the shortcut of swapping individual corporate responsibility for a collective, self-imposed slowdown among direct competitors — an arrangement the plaintiffs say has an anti-competitive effect on the people paying for these services.
Calls for Pacing AI Development and Industry Reactions
This entire dispute traces back to a single essay published days before the filing, and to the wave of public agreement it triggered among rival CEOs. That sequence — one company’s warning followed almost immediately by competitors echoing it — is precisely what the plaintiffs now point to as evidence of coordination.
Anthropic’s Amodei and the Risks Behind “We Must Pace the Frontier”
Everything traces back to September 12, when Anthropic CEO Dario Amodei published an essay titled “We Must Pace the Frontier,” urging the industry to slow the rate at which AI capabilities grow. In it, he lists the risks he considers most pressing: loss of control over advanced systems, misuse for cyberattacks and bioterrorism, and recursive self-improvement, which he argues should be approached with extreme caution, if pursued at all. His starkest warning concerns “agent swarms,” which he suggests could fuel a persistent botnet across the internet within six to twelve months, with damages potentially running into the hundreds of billions of dollars.
Support and Comments from Key Industry Leaders
Anthropic was not the only company touched by the essay’s reach. Sam Altman voiced agreement that the pace of frontier development needs to be managed, pledging that external evaluators would be given access, echoing a pledge Anthropic claims it will make lasting. Elon Musk offered a blunt endorsement — “Dario is right” — while Demis Hassabis, the former CEO of Google DeepMind, backed the general direction without going into specifics. That chain of public agreement among leaders of rival companies is now central to the plaintiffs’ case, since it is precisely this kind of alignment that the Anthropic OpenAI lawsuit treats as suspect rather than reassuring.
Legal, Political, and Market Implications
Beyond the courtroom, the case lands in a moment when the politics of AI regulation are anything but settled, and when investors are already jittery about what a coordinated slowdown could mean for the sector’s growth story.
Warnings About Risks of Private Safety Agreements
Lead plaintiffs’ counsel Nick Rowley cautioned that relying on private agreements among major for-profit firms to ensure AI safety could allow the technology to escape human oversight. It’s a pointed argument: if the labs themselves decide, informally and among each other, how fast the technology should move, there is no external check on that decision beyond the companies’ own judgment.
Political Crosscurrents and Market Jitters
The regulatory backdrop only adds to the uncertainty. Donald Trump has rejected calls for tighter oversight of AI on social platforms, while David Sacks, who heads the President’s Council of Advisors on Science and Technology, has said that companies steering the market don’t need government intervention to slow down. Amodei himself had already anticipated antitrust objections, expressing hope that Washington would help facilitate dialogue among the labs rather than treat coordination as a violation. Financial markets reacted almost immediately to the pacing debate: on September 14, Intel dropped about 7%, AMD fell 6%, and Nvidia slid 3%, a sign that investors are watching the AI regulation conversation in the USA as closely as any product launch. For now, none of the four companies named in the suit has commented, and the case must first clear the court’s class-certification process before it can move forward.
FAQ
Who filed the class-action lawsuit against Anthropic, OpenAI, SpaceXAI, and Google?
Four paying subscribers to ChatGPT, Claude, Grok, and Gemini filed the lawsuit.
What are the main allegations against the AI companies in the lawsuit?
They are accused of coordinating to slow frontier-model AI development, violating antitrust laws and reducing subscriber value.
What reasons did Anthropic CEO Dario Amodei give for calling to slow AI development?
He cited risks including loss of control, misuse for cyberattacks and bioterrorism, and recursive self-improvement.
Have the involved companies commented on the lawsuit?
The companies have not commented on the lawsuit, which is awaiting class-certification clearance.
Article produced with the assistance of artificial intelligence and reviewed by the editorial team.
77
Статья
Hyperliquid Leads Top Crypto Project Revenue With $429 Million in 2026Crypto’s revenue leaderboard for 2026 has a clear frontrunner, and it isn’t one of the stablecoin giants most people would expect. According to data compiled by CoinGecko, Hyperliquid generated roughly $429 million between January 1 and September 15, 2026, making it the single highest-earning crypto project of the year so far. That figure puts Hyperliquid at the top of a ranking that measures top crypto project revenue across decentralized exchanges, memecoin launchpads, trading bots, and prediction markets — and notably leaves out some of the biggest names in the industry.
Key takeaways
Hyperliquid leads all crypto projects with $429 million in revenue from January 1 to September 15, 2026, according to CoinGecko.
Pumpfun follows in second place with $322 million over the same period.
Axiom Pro, Sky, and GMGN round out the top five, each earning more than $120 million.
The ranking excludes Tether, Circle, and Grayscale.
Hyperliquid’s all-time cumulative revenue has reached between $1.26 billion and $1.31 billion, with about 48.7 million HYPE tokens already burned.
Top Crypto Projects by Revenue in 2026
Hyperliquid’s $429 million haul isn’t just the top crypto project revenue figure of the year — it’s a sizable gap over everything else CoinGecko tracked. The data, covering a roughly eight-and-a-half-month window from the start of 2026 through mid-September, offers one of the clearest snapshots yet of where onchain money is actually flowing this year.
Hyperliquid Leads with $429 Million
Hyperliquid, a decentralized perpetual futures exchange, sits comfortably at number one. Its $429 million in revenue over roughly eight and a half months translates into an average pace that outstrips every other protocol CoinGecko measured, according to Crypto Briefing, which cited the same underlying data.
Other Leading Projects in the Top 10
Behind Hyperliquid, Pumpfun claimed second place with $322 million in revenue — a memecoin launchpad that has become one of the more consistent earners in the sector this year. Rounding out the top five are Axiom Pro at $132 million, Sky at $130 million, and GMGN at $126 million, all clearing the $120 million mark for the period.
The rest of the top 10 tells a more varied story about where crypto revenue is being generated in 2026. Polymarket, the prediction market platform, brought in $115 million. World Liberty Financial earned $95.37 million, followed by Paxos with $87.93 million, edgeX with $84.37 million, and Titan Builder with $83.47 million.
One detail stands out just as much as the numbers themselves: the ranking excludes Tether, Circle, and Grayscale. All three are massive players in crypto by market presence, but their business models don’t generate the kind of onchain, protocol-level revenue that CoinGecko’s methodology is tracking here. That exclusion matters for how readers should interpret this list — it’s not a snapshot of the entire crypto industry’s earnings, but specifically a ranking of onchain revenue generated by decentralized protocols and trading platforms.
Details on Hyperliquid’s Revenue Model and Performance
Hyperliquid’s lead at the top of the crypto project rankings for 2026 isn’t a one-off spike — it reflects a business that has been compounding earnings steadily through the year. Looking at the mechanics behind that revenue helps explain why the platform has separated itself from the pack.
Revenue Growth and Year-to-Date Figures
Put in context, Hyperliquid’s $429 million in year-to-date revenue represents more than a third of the platform’s entire earnings history. Crypto Briefing reported that the platform’s cumulative all-time revenue as of mid-September stood somewhere between $1.26 billion and $1.31 billion, meaning nine months of 2026 activity alone accounted for a disproportionate share of everything the protocol has ever earned. Recent weekly revenue hovered around $13.5 million, with daily peaks approaching $3 million, and 30-day revenue recently reached roughly $64 million — a pace that, annualized, would push the platform past $700 million for the full year.
Use of Revenues for Token Buybacks and Market-Making
Hyperliquid doesn’t simply stockpile its earnings. The platform routes roughly 99% of eligible perpetual futures trading fees into what it calls the Assistance Fund, a mechanism that uses those proceeds to buy back and burn HYPE tokens. As of September 2026, approximately 48.7 million HYPE tokens have been removed from circulation, representing about 4.9% of the total supply, according to Crypto Briefing.
That buyback-and-burn structure is worth pausing on. It ties the token’s supply directly to trading activity, which means the model performs well when fee revenue keeps climbing but offers little cushion if volume drops sharply. In practice, a protocol that burns nearly all of its income rather than building up reserves is making a bet that growth continues — a dynamic that’s central to how investors and competitors are likely reading this year’s revenue numbers.
Operational Model Based on Perpetual Futures
Underpinning all of this is Hyperliquid’s core product: perpetual futures, the leveraged derivatives contracts that let traders bet on crypto price moves without holding the underlying asset. The platform runs on HyperCore, its own Layer-1 blockchain built for fast execution, with transaction finality arriving in a fraction of a second. That infrastructure, combined with heavy trading volume, is what has generated the fee income now topping CoinGecko’s leaderboard for top crypto project revenue in 2026.
FAQ
Which crypto project earned the most revenue in 2026 according to CoinGecko?
Hyperliquid earned the most revenue with $429 million from January 1 to September 15, 2026.
Are major firms like Tether included in the top crypto revenue rankings?
No, the ranking excludes major firms such as Tether, Circle, and Grayscale.
How does Hyperliquid use its trading fees?
Hyperliquid routes about 99% of eligible trading fees into an Assistance Fund that buys back and burns HYPE tokens.
What types of contracts drive Hyperliquid’s revenue?
Hyperliquid’s revenue is driven by perpetual futures contracts executed on its Layer-1 blockchain.
Article produced with the assistance of artificial intelligence and reviewed by the editorial team.
Hyperliquid Leads Top Crypto Project Revenue With $429 Million in 2026
Crypto’s revenue leaderboard for 2026 has a clear frontrunner, and it isn’t one of the stablecoin giants most people would expect. According to data compiled by CoinGecko, Hyperliquid generated roughly $429 million between January 1 and September 15, 2026, making it the single highest-earning crypto project of the year so far. That figure puts Hyperliquid at the top of a ranking that measures top crypto project revenue across decentralized exchanges, memecoin launchpads, trading bots, and prediction markets — and notably leaves out some of the biggest names in the industry.
Key takeaways
Hyperliquid leads all crypto projects with $429 million in revenue from January 1 to September 15, 2026, according to CoinGecko.
Pumpfun follows in second place with $322 million over the same period.
Axiom Pro, Sky, and GMGN round out the top five, each earning more than $120 million.
The ranking excludes Tether, Circle, and Grayscale.
Hyperliquid’s all-time cumulative revenue has reached between $1.26 billion and $1.31 billion, with about 48.7 million HYPE tokens already burned.
Top Crypto Projects by Revenue in 2026
Hyperliquid’s $429 million haul isn’t just the top crypto project revenue figure of the year — it’s a sizable gap over everything else CoinGecko tracked. The data, covering a roughly eight-and-a-half-month window from the start of 2026 through mid-September, offers one of the clearest snapshots yet of where onchain money is actually flowing this year.
Hyperliquid Leads with $429 Million
Hyperliquid, a decentralized perpetual futures exchange, sits comfortably at number one. Its $429 million in revenue over roughly eight and a half months translates into an average pace that outstrips every other protocol CoinGecko measured, according to Crypto Briefing, which cited the same underlying data.
Other Leading Projects in the Top 10
Behind Hyperliquid, Pumpfun claimed second place with $322 million in revenue — a memecoin launchpad that has become one of the more consistent earners in the sector this year. Rounding out the top five are Axiom Pro at $132 million, Sky at $130 million, and GMGN at $126 million, all clearing the $120 million mark for the period.
The rest of the top 10 tells a more varied story about where crypto revenue is being generated in 2026. Polymarket, the prediction market platform, brought in $115 million. World Liberty Financial earned $95.37 million, followed by Paxos with $87.93 million, edgeX with $84.37 million, and Titan Builder with $83.47 million.
One detail stands out just as much as the numbers themselves: the ranking excludes Tether, Circle, and Grayscale. All three are massive players in crypto by market presence, but their business models don’t generate the kind of onchain, protocol-level revenue that CoinGecko’s methodology is tracking here. That exclusion matters for how readers should interpret this list — it’s not a snapshot of the entire crypto industry’s earnings, but specifically a ranking of onchain revenue generated by decentralized protocols and trading platforms.
Details on Hyperliquid’s Revenue Model and Performance
Hyperliquid’s lead at the top of the crypto project rankings for 2026 isn’t a one-off spike — it reflects a business that has been compounding earnings steadily through the year. Looking at the mechanics behind that revenue helps explain why the platform has separated itself from the pack.
Revenue Growth and Year-to-Date Figures
Put in context, Hyperliquid’s $429 million in year-to-date revenue represents more than a third of the platform’s entire earnings history. Crypto Briefing reported that the platform’s cumulative all-time revenue as of mid-September stood somewhere between $1.26 billion and $1.31 billion, meaning nine months of 2026 activity alone accounted for a disproportionate share of everything the protocol has ever earned. Recent weekly revenue hovered around $13.5 million, with daily peaks approaching $3 million, and 30-day revenue recently reached roughly $64 million — a pace that, annualized, would push the platform past $700 million for the full year.
Use of Revenues for Token Buybacks and Market-Making
Hyperliquid doesn’t simply stockpile its earnings. The platform routes roughly 99% of eligible perpetual futures trading fees into what it calls the Assistance Fund, a mechanism that uses those proceeds to buy back and burn HYPE tokens. As of September 2026, approximately 48.7 million HYPE tokens have been removed from circulation, representing about 4.9% of the total supply, according to Crypto Briefing.
That buyback-and-burn structure is worth pausing on. It ties the token’s supply directly to trading activity, which means the model performs well when fee revenue keeps climbing but offers little cushion if volume drops sharply. In practice, a protocol that burns nearly all of its income rather than building up reserves is making a bet that growth continues — a dynamic that’s central to how investors and competitors are likely reading this year’s revenue numbers.
Operational Model Based on Perpetual Futures
Underpinning all of this is Hyperliquid’s core product: perpetual futures, the leveraged derivatives contracts that let traders bet on crypto price moves without holding the underlying asset. The platform runs on HyperCore, its own Layer-1 blockchain built for fast execution, with transaction finality arriving in a fraction of a second. That infrastructure, combined with heavy trading volume, is what has generated the fee income now topping CoinGecko’s leaderboard for top crypto project revenue in 2026.
FAQ
Which crypto project earned the most revenue in 2026 according to CoinGecko?
Hyperliquid earned the most revenue with $429 million from January 1 to September 15, 2026.
Are major firms like Tether included in the top crypto revenue rankings?
No, the ranking excludes major firms such as Tether, Circle, and Grayscale.
How does Hyperliquid use its trading fees?
Hyperliquid routes about 99% of eligible trading fees into an Assistance Fund that buys back and burns HYPE tokens.
What types of contracts drive Hyperliquid’s revenue?
Hyperliquid’s revenue is driven by perpetual futures contracts executed on its Layer-1 blockchain.
Article produced with the assistance of artificial intelligence and reviewed by the editorial team.
Key takeaways
Hyperliquid leads all crypto projects with $429 million in revenue from January 1 to September 15, 2026, according to CoinGecko.
Pumpfun follows in second place with $322 million over the same period.
Axiom Pro, Sky, and GMGN round out the top five, each earning more than $120 million.
The ranking excludes Tether, Circle, and Grayscale.
Hyperliquid’s all-time cumulative revenue has reached between $1.26 billion and $1.31 billion, with about 48.7 million HYPE tokens already burned.
Top Crypto Projects by Revenue in 2026
Hyperliquid’s $429 million haul isn’t just the top crypto project revenue figure of the year — it’s a sizable gap over everything else CoinGecko tracked. The data, covering a roughly eight-and-a-half-month window from the start of 2026 through mid-September, offers one of the clearest snapshots yet of where onchain money is actually flowing this year.
Hyperliquid Leads with $429 Million
Hyperliquid, a decentralized perpetual futures exchange, sits comfortably at number one. Its $429 million in revenue over roughly eight and a half months translates into an average pace that outstrips every other protocol CoinGecko measured, according to Crypto Briefing, which cited the same underlying data.
Other Leading Projects in the Top 10
Behind Hyperliquid, Pumpfun claimed second place with $322 million in revenue — a memecoin launchpad that has become one of the more consistent earners in the sector this year. Rounding out the top five are Axiom Pro at $132 million, Sky at $130 million, and GMGN at $126 million, all clearing the $120 million mark for the period.
The rest of the top 10 tells a more varied story about where crypto revenue is being generated in 2026. Polymarket, the prediction market platform, brought in $115 million. World Liberty Financial earned $95.37 million, followed by Paxos with $87.93 million, edgeX with $84.37 million, and Titan Builder with $83.47 million.
One detail stands out just as much as the numbers themselves: the ranking excludes Tether, Circle, and Grayscale. All three are massive players in crypto by market presence, but their business models don’t generate the kind of onchain, protocol-level revenue that CoinGecko’s methodology is tracking here. That exclusion matters for how readers should interpret this list — it’s not a snapshot of the entire crypto industry’s earnings, but specifically a ranking of onchain revenue generated by decentralized protocols and trading platforms.
Details on Hyperliquid’s Revenue Model and Performance
Hyperliquid’s lead at the top of the crypto project rankings for 2026 isn’t a one-off spike — it reflects a business that has been compounding earnings steadily through the year. Looking at the mechanics behind that revenue helps explain why the platform has separated itself from the pack.
Revenue Growth and Year-to-Date Figures
Put in context, Hyperliquid’s $429 million in year-to-date revenue represents more than a third of the platform’s entire earnings history. Crypto Briefing reported that the platform’s cumulative all-time revenue as of mid-September stood somewhere between $1.26 billion and $1.31 billion, meaning nine months of 2026 activity alone accounted for a disproportionate share of everything the protocol has ever earned. Recent weekly revenue hovered around $13.5 million, with daily peaks approaching $3 million, and 30-day revenue recently reached roughly $64 million — a pace that, annualized, would push the platform past $700 million for the full year.
Use of Revenues for Token Buybacks and Market-Making
Hyperliquid doesn’t simply stockpile its earnings. The platform routes roughly 99% of eligible perpetual futures trading fees into what it calls the Assistance Fund, a mechanism that uses those proceeds to buy back and burn HYPE tokens. As of September 2026, approximately 48.7 million HYPE tokens have been removed from circulation, representing about 4.9% of the total supply, according to Crypto Briefing.
That buyback-and-burn structure is worth pausing on. It ties the token’s supply directly to trading activity, which means the model performs well when fee revenue keeps climbing but offers little cushion if volume drops sharply. In practice, a protocol that burns nearly all of its income rather than building up reserves is making a bet that growth continues — a dynamic that’s central to how investors and competitors are likely reading this year’s revenue numbers.
Operational Model Based on Perpetual Futures
Underpinning all of this is Hyperliquid’s core product: perpetual futures, the leveraged derivatives contracts that let traders bet on crypto price moves without holding the underlying asset. The platform runs on HyperCore, its own Layer-1 blockchain built for fast execution, with transaction finality arriving in a fraction of a second. That infrastructure, combined with heavy trading volume, is what has generated the fee income now topping CoinGecko’s leaderboard for top crypto project revenue in 2026.
FAQ
Which crypto project earned the most revenue in 2026 according to CoinGecko?
Hyperliquid earned the most revenue with $429 million from January 1 to September 15, 2026.
Are major firms like Tether included in the top crypto revenue rankings?
No, the ranking excludes major firms such as Tether, Circle, and Grayscale.
How does Hyperliquid use its trading fees?
Hyperliquid routes about 99% of eligible trading fees into an Assistance Fund that buys back and burns HYPE tokens.
What types of contracts drive Hyperliquid’s revenue?
Hyperliquid’s revenue is driven by perpetual futures contracts executed on its Layer-1 blockchain.
Article produced with the assistance of artificial intelligence and reviewed by the editorial team.
82

Статья
Societe Generale’s cost-cut plan targets €1.9B in savings by 2029Societe Generale has unveiled one of the most sweeping Societe Generale cost cut plans in its recent history, betting heavily on artificial intelligence to reshape how the French banking giant spends money over the next several years. The roadmap, unveiled on September 21, sets a target of €1.9 billion in gross savings by 2029, with AI-driven technology cuts forming the backbone of CEO Slawomir Krupa’s turnaround strategy.
Key takeaways
Societe Generale targets €1.9 billion in gross savings by 2029, with net savings closer to €300 million after reinvestment costs.
AI initiatives are expected to trim around €500 million from IT spending, pushing the bank’s IT intensity ratio down to 12%.
The bank plans to reduce its cost base below €16.3 billion and its cost-to-income ratio below 55% by 2029.
Return on tangible equity is set at 13-14% for 2029, with ambitions above 15% afterward.
Roughly 1,800 roles in France will be cut through natural attrition, not layoffs.
SocGen decommissioned its homegrown SoGPT tool in favor of Microsoft’s Copilot and signed a new strategic partnership with Anthropic.
Societe Generale’s 2029 Cost Reduction Targets
The core of the plan is straightforward: shrink the bank’s cost base and squeeze more profitability out of every euro spent. Societe Generale is aiming to push its total cost base below €16.3 billion by 2029, a figure that represents roughly a 2% decrease from the bank’s estimated 2026 numbers.
Gross savings and cost base goals
On paper, the €1.9 billion in gross savings looks like the headline number, but the reality is more nuanced. After accounting for reinvestment and other adjustments, the net savings drop to approximately €300 million. That gap between gross and net figures implies roughly €1.6 billion in reinvestment and transition costs baked into the plan — money the bank will spend to get to its efficiency targets in the first place.
Financial performance and efficiency targets
Beyond the cost base, SocGen is chasing a cost-to-income ratio below 55% by 2029, down from roughly 60% today. On the revenue side, the bank is targeting annual growth of about 3% through 2029. Return on tangible equity, a key profitability metric watched closely by investors, is pegged at 13-14% for 2029, with the bank hoping to push that figure above 15% once the initial phase of the plan is complete.
Why this matters: these benchmarks give the market a clear yardstick to judge whether Krupa’s strategy is actually working, rather than relying on vague promises of efficiency. A cost-to-income ratio below 55% and return on tangible equity above 13% are concrete, measurable goals that analysts and shareholders can track year by year.
AI-Driven IT Savings and Technology Strategy
Artificial intelligence sits at the center of this entire cost-cutting exercise, and the numbers make that clear. The bank expects AI initiatives alone to trim roughly €500 million from its IT spending, making it the single largest line item in the whole savings plan.
AI initiatives and IT intensity ratio improvements
That projected €500 million in IT cost reductions would bring SocGen’s IT intensity ratio down to 12%, a meaningful drop that signals the bank wants technology spending to shrink relative to its overall cost base. This is where the AI-driven savings strategy becomes more than just a buzzword — it’s baked directly into the financial targets the bank is now being held to.
From SoGPT to Microsoft Copilot and the Anthropic partnership
SocGen’s path to this AI-heavy strategy hasn’t been entirely smooth. The bank originally built its own in-house AI tool, called SoGPT, but earlier in 2026 it decommissioned that tool in favor of Microsoft’s Copilot after performance gaps became apparent. That decision alone signals how fast the bank’s internal AI ambitions have shifted in a relatively short window.
Societe Generale has taken this a step further by entering into a strategic partnership with Anthropic, the AI firm responsible for Claude, an agreement intended to speed up the adoption of AI throughout the bank’s operations while emphasizing gains in productivity and client service. Given how assertive European regulators have been on AI governance, this Anthropic AI partnership will likely draw scrutiny as it moves from announcement to actual deployment across a major financial institution.
Workforce Reduction and Operational Challenges
Cutting costs at this scale inevitably touches headcount, and Societe Generale is no exception. Roughly 1,800 positions in France are set to be cut by the bank, mostly via natural attrition instead of direct job cuts.
That distinction matters. Attrition-based reduction tends to be slower and less disruptive than mass layoffs, but it also means the bank has less direct control over exactly when and where those roles disappear. Managing this SocGen workforce reduction while simultaneously rolling out new AI tools across the organization presents a genuine operational challenge — the bank needs employees to adapt to new technology even as the overall headcount shrinks.
CEO Slawomir Krupa’s Turnaround Approach and Roadmap Implications
This roadmap is the latest chapter in a turnaround effort that began when Slawomir Krupa took over as CEO in 2023. His tenure so far has been defined by cost discipline, a push for stronger profitability, and an effort to simplify the bank’s operations across the board.
The 2029 targets give investors a fairly specific checklist to watch: a cost-to-income ratio below 55%, return on tangible equity above 13%, and a cost base under €16.3 billion. Whether the bank actually hits those numbers will depend heavily on how well the AI rollout performs in practice — and whether the projected €500 million in IT savings materializes without the kind of performance gaps that forced SocGen to abandon SoGPT in the first place.
The Anthropic partnership, in particular, is worth watching closely in the months ahead. Deploying AI at scale inside a major European bank while simultaneously cutting headcount through attrition is a delicate balancing act, and the outcome will say a lot about whether large financial institutions can actually deliver on the productivity promises that come with generative AI adoption.
FAQ
What are Societe Generale’s main cost reduction targets by 2029?
Societe Generale targets €1.9 billion in gross savings, aims to reduce its cost base below €16.3 billion, and plans to lower its cost-to-income ratio below 55% by 2029.
How is AI contributing to Societe Generale’s cost savings plan?
AI initiatives are expected to cut around €500 million from IT spending and reduce the bank’s IT intensity ratio to 12%.
What changes are planned for Societe Generale’s workforce in France?
The bank plans to reduce approximately 1,800 roles in France through natural attrition rather than layoffs.
Why did Societe Generale replace its in-house AI tool SoGPT?
SoGPT was decommissioned in 2026 due to performance gaps and replaced by Microsoft’s Copilot.
Article produced with the assistance of artificial intelligence and reviewed by the editorial team.
Societe Generale’s cost-cut plan targets €1.9B in savings by 2029
Societe Generale has unveiled one of the most sweeping Societe Generale cost cut plans in its recent history, betting heavily on artificial intelligence to reshape how the French banking giant spends money over the next several years. The roadmap, unveiled on September 21, sets a target of €1.9 billion in gross savings by 2029, with AI-driven technology cuts forming the backbone of CEO Slawomir Krupa’s turnaround strategy.
Key takeaways
Societe Generale targets €1.9 billion in gross savings by 2029, with net savings closer to €300 million after reinvestment costs.
AI initiatives are expected to trim around €500 million from IT spending, pushing the bank’s IT intensity ratio down to 12%.
The bank plans to reduce its cost base below €16.3 billion and its cost-to-income ratio below 55% by 2029.
Return on tangible equity is set at 13-14% for 2029, with ambitions above 15% afterward.
Roughly 1,800 roles in France will be cut through natural attrition, not layoffs.
SocGen decommissioned its homegrown SoGPT tool in favor of Microsoft’s Copilot and signed a new strategic partnership with Anthropic.
Societe Generale’s 2029 Cost Reduction Targets
The core of the plan is straightforward: shrink the bank’s cost base and squeeze more profitability out of every euro spent. Societe Generale is aiming to push its total cost base below €16.3 billion by 2029, a figure that represents roughly a 2% decrease from the bank’s estimated 2026 numbers.
Gross savings and cost base goals
On paper, the €1.9 billion in gross savings looks like the headline number, but the reality is more nuanced. After accounting for reinvestment and other adjustments, the net savings drop to approximately €300 million. That gap between gross and net figures implies roughly €1.6 billion in reinvestment and transition costs baked into the plan — money the bank will spend to get to its efficiency targets in the first place.
Financial performance and efficiency targets
Beyond the cost base, SocGen is chasing a cost-to-income ratio below 55% by 2029, down from roughly 60% today. On the revenue side, the bank is targeting annual growth of about 3% through 2029. Return on tangible equity, a key profitability metric watched closely by investors, is pegged at 13-14% for 2029, with the bank hoping to push that figure above 15% once the initial phase of the plan is complete.
Why this matters: these benchmarks give the market a clear yardstick to judge whether Krupa’s strategy is actually working, rather than relying on vague promises of efficiency. A cost-to-income ratio below 55% and return on tangible equity above 13% are concrete, measurable goals that analysts and shareholders can track year by year.
AI-Driven IT Savings and Technology Strategy
Artificial intelligence sits at the center of this entire cost-cutting exercise, and the numbers make that clear. The bank expects AI initiatives alone to trim roughly €500 million from its IT spending, making it the single largest line item in the whole savings plan.
AI initiatives and IT intensity ratio improvements
That projected €500 million in IT cost reductions would bring SocGen’s IT intensity ratio down to 12%, a meaningful drop that signals the bank wants technology spending to shrink relative to its overall cost base. This is where the AI-driven savings strategy becomes more than just a buzzword — it’s baked directly into the financial targets the bank is now being held to.
From SoGPT to Microsoft Copilot and the Anthropic partnership
SocGen’s path to this AI-heavy strategy hasn’t been entirely smooth. The bank originally built its own in-house AI tool, called SoGPT, but earlier in 2026 it decommissioned that tool in favor of Microsoft’s Copilot after performance gaps became apparent. That decision alone signals how fast the bank’s internal AI ambitions have shifted in a relatively short window.
Societe Generale has taken this a step further by entering into a strategic partnership with Anthropic, the AI firm responsible for Claude, an agreement intended to speed up the adoption of AI throughout the bank’s operations while emphasizing gains in productivity and client service. Given how assertive European regulators have been on AI governance, this Anthropic AI partnership will likely draw scrutiny as it moves from announcement to actual deployment across a major financial institution.
Workforce Reduction and Operational Challenges
Cutting costs at this scale inevitably touches headcount, and Societe Generale is no exception. Roughly 1,800 positions in France are set to be cut by the bank, mostly via natural attrition instead of direct job cuts.
That distinction matters. Attrition-based reduction tends to be slower and less disruptive than mass layoffs, but it also means the bank has less direct control over exactly when and where those roles disappear. Managing this SocGen workforce reduction while simultaneously rolling out new AI tools across the organization presents a genuine operational challenge — the bank needs employees to adapt to new technology even as the overall headcount shrinks.
CEO Slawomir Krupa’s Turnaround Approach and Roadmap Implications
This roadmap is the latest chapter in a turnaround effort that began when Slawomir Krupa took over as CEO in 2023. His tenure so far has been defined by cost discipline, a push for stronger profitability, and an effort to simplify the bank’s operations across the board.
The 2029 targets give investors a fairly specific checklist to watch: a cost-to-income ratio below 55%, return on tangible equity above 13%, and a cost base under €16.3 billion. Whether the bank actually hits those numbers will depend heavily on how well the AI rollout performs in practice — and whether the projected €500 million in IT savings materializes without the kind of performance gaps that forced SocGen to abandon SoGPT in the first place.
The Anthropic partnership, in particular, is worth watching closely in the months ahead. Deploying AI at scale inside a major European bank while simultaneously cutting headcount through attrition is a delicate balancing act, and the outcome will say a lot about whether large financial institutions can actually deliver on the productivity promises that come with generative AI adoption.
FAQ
What are Societe Generale’s main cost reduction targets by 2029?
Societe Generale targets €1.9 billion in gross savings, aims to reduce its cost base below €16.3 billion, and plans to lower its cost-to-income ratio below 55% by 2029.
How is AI contributing to Societe Generale’s cost savings plan?
AI initiatives are expected to cut around €500 million from IT spending and reduce the bank’s IT intensity ratio to 12%.
What changes are planned for Societe Generale’s workforce in France?
The bank plans to reduce approximately 1,800 roles in France through natural attrition rather than layoffs.
Why did Societe Generale replace its in-house AI tool SoGPT?
SoGPT was decommissioned in 2026 due to performance gaps and replaced by Microsoft’s Copilot.
Article produced with the assistance of artificial intelligence and reviewed by the editorial team.
Key takeaways
Societe Generale targets €1.9 billion in gross savings by 2029, with net savings closer to €300 million after reinvestment costs.
AI initiatives are expected to trim around €500 million from IT spending, pushing the bank’s IT intensity ratio down to 12%.
The bank plans to reduce its cost base below €16.3 billion and its cost-to-income ratio below 55% by 2029.
Return on tangible equity is set at 13-14% for 2029, with ambitions above 15% afterward.
Roughly 1,800 roles in France will be cut through natural attrition, not layoffs.
SocGen decommissioned its homegrown SoGPT tool in favor of Microsoft’s Copilot and signed a new strategic partnership with Anthropic.
Societe Generale’s 2029 Cost Reduction Targets
The core of the plan is straightforward: shrink the bank’s cost base and squeeze more profitability out of every euro spent. Societe Generale is aiming to push its total cost base below €16.3 billion by 2029, a figure that represents roughly a 2% decrease from the bank’s estimated 2026 numbers.
Gross savings and cost base goals
On paper, the €1.9 billion in gross savings looks like the headline number, but the reality is more nuanced. After accounting for reinvestment and other adjustments, the net savings drop to approximately €300 million. That gap between gross and net figures implies roughly €1.6 billion in reinvestment and transition costs baked into the plan — money the bank will spend to get to its efficiency targets in the first place.
Financial performance and efficiency targets
Beyond the cost base, SocGen is chasing a cost-to-income ratio below 55% by 2029, down from roughly 60% today. On the revenue side, the bank is targeting annual growth of about 3% through 2029. Return on tangible equity, a key profitability metric watched closely by investors, is pegged at 13-14% for 2029, with the bank hoping to push that figure above 15% once the initial phase of the plan is complete.
Why this matters: these benchmarks give the market a clear yardstick to judge whether Krupa’s strategy is actually working, rather than relying on vague promises of efficiency. A cost-to-income ratio below 55% and return on tangible equity above 13% are concrete, measurable goals that analysts and shareholders can track year by year.
AI-Driven IT Savings and Technology Strategy
Artificial intelligence sits at the center of this entire cost-cutting exercise, and the numbers make that clear. The bank expects AI initiatives alone to trim roughly €500 million from its IT spending, making it the single largest line item in the whole savings plan.
AI initiatives and IT intensity ratio improvements
That projected €500 million in IT cost reductions would bring SocGen’s IT intensity ratio down to 12%, a meaningful drop that signals the bank wants technology spending to shrink relative to its overall cost base. This is where the AI-driven savings strategy becomes more than just a buzzword — it’s baked directly into the financial targets the bank is now being held to.
From SoGPT to Microsoft Copilot and the Anthropic partnership
SocGen’s path to this AI-heavy strategy hasn’t been entirely smooth. The bank originally built its own in-house AI tool, called SoGPT, but earlier in 2026 it decommissioned that tool in favor of Microsoft’s Copilot after performance gaps became apparent. That decision alone signals how fast the bank’s internal AI ambitions have shifted in a relatively short window.
Societe Generale has taken this a step further by entering into a strategic partnership with Anthropic, the AI firm responsible for Claude, an agreement intended to speed up the adoption of AI throughout the bank’s operations while emphasizing gains in productivity and client service. Given how assertive European regulators have been on AI governance, this Anthropic AI partnership will likely draw scrutiny as it moves from announcement to actual deployment across a major financial institution.
Workforce Reduction and Operational Challenges
Cutting costs at this scale inevitably touches headcount, and Societe Generale is no exception. Roughly 1,800 positions in France are set to be cut by the bank, mostly via natural attrition instead of direct job cuts.
That distinction matters. Attrition-based reduction tends to be slower and less disruptive than mass layoffs, but it also means the bank has less direct control over exactly when and where those roles disappear. Managing this SocGen workforce reduction while simultaneously rolling out new AI tools across the organization presents a genuine operational challenge — the bank needs employees to adapt to new technology even as the overall headcount shrinks.
CEO Slawomir Krupa’s Turnaround Approach and Roadmap Implications
This roadmap is the latest chapter in a turnaround effort that began when Slawomir Krupa took over as CEO in 2023. His tenure so far has been defined by cost discipline, a push for stronger profitability, and an effort to simplify the bank’s operations across the board.
The 2029 targets give investors a fairly specific checklist to watch: a cost-to-income ratio below 55%, return on tangible equity above 13%, and a cost base under €16.3 billion. Whether the bank actually hits those numbers will depend heavily on how well the AI rollout performs in practice — and whether the projected €500 million in IT savings materializes without the kind of performance gaps that forced SocGen to abandon SoGPT in the first place.
The Anthropic partnership, in particular, is worth watching closely in the months ahead. Deploying AI at scale inside a major European bank while simultaneously cutting headcount through attrition is a delicate balancing act, and the outcome will say a lot about whether large financial institutions can actually deliver on the productivity promises that come with generative AI adoption.
FAQ
What are Societe Generale’s main cost reduction targets by 2029?
Societe Generale targets €1.9 billion in gross savings, aims to reduce its cost base below €16.3 billion, and plans to lower its cost-to-income ratio below 55% by 2029.
How is AI contributing to Societe Generale’s cost savings plan?
AI initiatives are expected to cut around €500 million from IT spending and reduce the bank’s IT intensity ratio to 12%.
What changes are planned for Societe Generale’s workforce in France?
The bank plans to reduce approximately 1,800 roles in France through natural attrition rather than layoffs.
Why did Societe Generale replace its in-house AI tool SoGPT?
SoGPT was decommissioned in 2026 due to performance gaps and replaced by Microsoft’s Copilot.
Article produced with the assistance of artificial intelligence and reviewed by the editorial team.
1
23
Статья
ZetaChain token migration to Solana wins 99.4% approval, Layer 1 shutdown loomsZetaChain’s community has just voted to pull the plug on the project’s own blockchain and rebuild its future on Solana. The ZetaChain token migration cleared its first major hurdle on Sunday, September 20, when holders approved Proposal 68 with 99.4% support, setting in motion a plan to shut down the network’s Layer 1 chain and move the native ZETA token onto Solana as a native SPL asset.
Key takeaways
ZetaChain holders approved Proposal 68 with 99.4% support to shut down the Layer 1 blockchain and migrate ZETA to Solana.
Voting participation reached 58%, comfortably clearing the 40% quorum requirement.
ZETA will convert 1:1 into a native Solana SPL token, keeping its ticker and total supply, though decimals shift from 18 to 9.
ZETA on Ethereum and BNB Chain is excluded from this migration plan.
A second governance proposal, still pending, will set the final snapshot, shutdown timeline, and exchange coordination details.
Governance Vote Approves ZetaChain’s Move to Solana
The vote gives ZetaChain‘s core contributors a green light to begin preparing the technical groundwork for the ZETA Solana migration, without yet triggering an actual shutdown. Proposal 68 closed at 10:58 a.m. ET on September 20 with 99.4% of votes in favor, according to the project’s governance portal. Opposition and abstentions each came in at just 0.3%.
Voting Results and Participation
Turnout was strong enough to make the outcome hard to dispute. Participation reached 58% of eligible stake, well above the 40% quorum ZetaChain required for the proposal to pass. That level of engagement suggests the community was largely aligned on the direction of the project, even as the practical mechanics of the transition remain unsettled.
Crucially, passage of Proposal 68 does not flip a switch. The existing ZetaChain blockchain keeps running, validators keep validating, and ZETA staking remains active. Nothing about holders’ current token balances changes as a result of this vote alone.
What Changes Technically for ZETA Holders
Once the transition is complete, ZETA will exist as a native token on Solana rather than on ZetaChain’s own Cosmos SDK-based chain, and holders will need to understand a few technical shifts before that happens.
Token Conversion and the Decimal Precision Shift
Under the approved plan, ZETA converts 1:1 into a native Solana SPL token. The ticker stays the same, the total supply stays the same, and no new tokens get minted in the process. Vesting schedules already in place are expected to continue under their original terms.
One technical wrinkle deserves attention: native ZETA currently runs on 18 decimal places, while the proposed Solana version would use just nine. That means very small fractional balances could get rounded down during the conversion process, a detail that matters more for holders with dust-sized amounts than for typical wallets.
ZETA on Ethereum and BNB Chain Stays Put
Not every version of ZETA is part of this plan. The migration proposal applies specifically to ZETA native to the ZetaChain blockchain. Tokens already issued on Ethereum and BNB Chain fall outside this particular migration and are not affected by Proposal 68.
The Road Ahead: A Second Vote and Exchange Coordination
Nothing about the actual shutdown of ZetaChain’s Layer 1 is locked in yet — that depends on a second governance proposal that hasn’t been put to a vote. This matters for anyone holding ZETA on an exchange or bridged across chains, because the timeline and mechanics of the swap are still being worked out.
What the Next Proposal Must Decide
The follow-up proposal is expected to nail down the block height for a final balance snapshot, the actual migration mechanism, the process for claiming ZETA on Solana, and the timeline for halting the existing Layer 1 network. It’s also expected to address how much time users get to withdraw connected-chain assets before the shutdown takes effect.
Exchange coordination is a prerequisite ZetaChain has flagged explicitly: the project says it won’t bring the second proposal to a vote until exchanges have confirmed their own token-swap procedures. No firm shutdown date has been announced. ZetaChain has also said it’s still exploring how staking and rewards would work once ZETA lives on Solana, according to a September 17 announcement from the project.
Some technical preparation is already visible. Migration-related tooling has appeared in ZetaChain’s public GitHub repository, including code for exporting ZETA state and calculating balances by address — the kind of groundwork needed to eventually produce a final snapshot, even though the snapshot date itself hasn’t been set.
Why ZetaChain Is Betting on Anuma
The ZetaChain Layer 1 shutdown isn’t happening in isolation — it’s tied directly to the project’s pivot toward Anuma, its private AI application, which the team says no longer requires an independent blockchain to grow. Moving both Anuma and ZETA onto Solana is framed as one combined transition rather than two separate decisions.
Anuma’s Growing User Base
ZetaChain says Anuma has attracted more than 300,000 users and processed over 1 million requests across 35 AI models, based on figures the project has published itself. The app runs on an encrypted memory system that lets users carry context across different AI models, and ZETA already plays a role inside it: holders can lock tokens in exchange for credits to spend on AI services.
In its own words, the ZetaChain team described the opportunity this way: “What Solana’s AI stack still lacks is the application layer: an app people use every day, with memory that belongs to them and travels across models, apps, and agents.”
The project also pointed to the operational burden of running its own Layer 1 as part of the reasoning behind the shift. In the migration proposal, the team wrote that “as a Cosmos SDK chain, ZetaChain inherits every upstream advisory and patch, and each one has to be coordinated across dozens of independent validators,” adding that “AI tooling is making such vulnerabilities easier to find, as the August 25 patch showed, so there will be more.” That reference lines up with a separate incident last month, when Cosmos Labs disclosed attacks against six Cosmos EVM chains — not including ZetaChain — in which attackers sold stolen funds for roughly $5.7 million.
This is where the broader significance of the vote comes into focus: rather than continuing to shoulder the maintenance costs of an independent Layer 1, ZetaChain is choosing to lean on Solana’s infrastructure and redirect its resources toward the AI application it sees as its main growth driver. For a project that raised $27 million in 2023 from backers including Blockchain.com and Jane Street Capital, and launched its mainnet the following January, this marks a fairly sharp change in direction — from building interoperability infrastructure to running a consumer-facing AI product on someone else’s chain.
Validators will continue operating ZetaChain’s existing network, and ZETA staking remains active, until the shutdown process is formally approved through that second governance vote. In the meantime, ZETA’s price dipped roughly 2.5% over the 24 hours following the vote, a modest move that suggests markets are still digesting what a multi-stage transition actually means for the token’s near-term trajectory.
FAQ
What did the recent ZetaChain governance vote approve?
ZetaChain token holders approved Proposal 68 to shut down the Layer 1 blockchain and migrate ZETA to Solana, with 99.4% of votes in favor.
Does the approval of Proposal 68 mean the immediate migration of ZETA tokens?
No. Proposal 68 authorizes preparation for the migration but does not cause an immediate shutdown or token transfer. A second proposal still needs to finalize the details.
How will ZETA tokens change when migrating to Solana?
ZETA will convert 1:1 into a native Solana SPL token, keeping the same ticker and total supply. However, decimal precision will change from 18 to 9 decimals, which could round down very small balances.
Will all ZETA tokens migrate to Solana in this plan?
No. Only ZETA native to the ZetaChain blockchain is covered by this migration. ZETA tokens already issued on Ethereum and BNB Chain are excluded.
Article produced with the assistance of artificial intelligence and reviewed by the editorial team.
ZetaChain token migration to Solana wins 99.4% approval, Layer 1 shutdown looms
ZetaChain’s community has just voted to pull the plug on the project’s own blockchain and rebuild its future on Solana. The ZetaChain token migration cleared its first major hurdle on Sunday, September 20, when holders approved Proposal 68 with 99.4% support, setting in motion a plan to shut down the network’s Layer 1 chain and move the native ZETA token onto Solana as a native SPL asset.
Key takeaways
ZetaChain holders approved Proposal 68 with 99.4% support to shut down the Layer 1 blockchain and migrate ZETA to Solana.
Voting participation reached 58%, comfortably clearing the 40% quorum requirement.
ZETA will convert 1:1 into a native Solana SPL token, keeping its ticker and total supply, though decimals shift from 18 to 9.
ZETA on Ethereum and BNB Chain is excluded from this migration plan.
A second governance proposal, still pending, will set the final snapshot, shutdown timeline, and exchange coordination details.
Governance Vote Approves ZetaChain’s Move to Solana
The vote gives ZetaChain‘s core contributors a green light to begin preparing the technical groundwork for the ZETA Solana migration, without yet triggering an actual shutdown. Proposal 68 closed at 10:58 a.m. ET on September 20 with 99.4% of votes in favor, according to the project’s governance portal. Opposition and abstentions each came in at just 0.3%.
Voting Results and Participation
Turnout was strong enough to make the outcome hard to dispute. Participation reached 58% of eligible stake, well above the 40% quorum ZetaChain required for the proposal to pass. That level of engagement suggests the community was largely aligned on the direction of the project, even as the practical mechanics of the transition remain unsettled.
Crucially, passage of Proposal 68 does not flip a switch. The existing ZetaChain blockchain keeps running, validators keep validating, and ZETA staking remains active. Nothing about holders’ current token balances changes as a result of this vote alone.
What Changes Technically for ZETA Holders
Once the transition is complete, ZETA will exist as a native token on Solana rather than on ZetaChain’s own Cosmos SDK-based chain, and holders will need to understand a few technical shifts before that happens.
Token Conversion and the Decimal Precision Shift
Under the approved plan, ZETA converts 1:1 into a native Solana SPL token. The ticker stays the same, the total supply stays the same, and no new tokens get minted in the process. Vesting schedules already in place are expected to continue under their original terms.
One technical wrinkle deserves attention: native ZETA currently runs on 18 decimal places, while the proposed Solana version would use just nine. That means very small fractional balances could get rounded down during the conversion process, a detail that matters more for holders with dust-sized amounts than for typical wallets.
ZETA on Ethereum and BNB Chain Stays Put
Not every version of ZETA is part of this plan. The migration proposal applies specifically to ZETA native to the ZetaChain blockchain. Tokens already issued on Ethereum and BNB Chain fall outside this particular migration and are not affected by Proposal 68.
The Road Ahead: A Second Vote and Exchange Coordination
Nothing about the actual shutdown of ZetaChain’s Layer 1 is locked in yet — that depends on a second governance proposal that hasn’t been put to a vote. This matters for anyone holding ZETA on an exchange or bridged across chains, because the timeline and mechanics of the swap are still being worked out.
What the Next Proposal Must Decide
The follow-up proposal is expected to nail down the block height for a final balance snapshot, the actual migration mechanism, the process for claiming ZETA on Solana, and the timeline for halting the existing Layer 1 network. It’s also expected to address how much time users get to withdraw connected-chain assets before the shutdown takes effect.
Exchange coordination is a prerequisite ZetaChain has flagged explicitly: the project says it won’t bring the second proposal to a vote until exchanges have confirmed their own token-swap procedures. No firm shutdown date has been announced. ZetaChain has also said it’s still exploring how staking and rewards would work once ZETA lives on Solana, according to a September 17 announcement from the project.
Some technical preparation is already visible. Migration-related tooling has appeared in ZetaChain’s public GitHub repository, including code for exporting ZETA state and calculating balances by address — the kind of groundwork needed to eventually produce a final snapshot, even though the snapshot date itself hasn’t been set.
Why ZetaChain Is Betting on Anuma
The ZetaChain Layer 1 shutdown isn’t happening in isolation — it’s tied directly to the project’s pivot toward Anuma, its private AI application, which the team says no longer requires an independent blockchain to grow. Moving both Anuma and ZETA onto Solana is framed as one combined transition rather than two separate decisions.
Anuma’s Growing User Base
ZetaChain says Anuma has attracted more than 300,000 users and processed over 1 million requests across 35 AI models, based on figures the project has published itself. The app runs on an encrypted memory system that lets users carry context across different AI models, and ZETA already plays a role inside it: holders can lock tokens in exchange for credits to spend on AI services.
In its own words, the ZetaChain team described the opportunity this way: “What Solana’s AI stack still lacks is the application layer: an app people use every day, with memory that belongs to them and travels across models, apps, and agents.”
The project also pointed to the operational burden of running its own Layer 1 as part of the reasoning behind the shift. In the migration proposal, the team wrote that “as a Cosmos SDK chain, ZetaChain inherits every upstream advisory and patch, and each one has to be coordinated across dozens of independent validators,” adding that “AI tooling is making such vulnerabilities easier to find, as the August 25 patch showed, so there will be more.” That reference lines up with a separate incident last month, when Cosmos Labs disclosed attacks against six Cosmos EVM chains — not including ZetaChain — in which attackers sold stolen funds for roughly $5.7 million.
This is where the broader significance of the vote comes into focus: rather than continuing to shoulder the maintenance costs of an independent Layer 1, ZetaChain is choosing to lean on Solana’s infrastructure and redirect its resources toward the AI application it sees as its main growth driver. For a project that raised $27 million in 2023 from backers including Blockchain.com and Jane Street Capital, and launched its mainnet the following January, this marks a fairly sharp change in direction — from building interoperability infrastructure to running a consumer-facing AI product on someone else’s chain.
Validators will continue operating ZetaChain’s existing network, and ZETA staking remains active, until the shutdown process is formally approved through that second governance vote. In the meantime, ZETA’s price dipped roughly 2.5% over the 24 hours following the vote, a modest move that suggests markets are still digesting what a multi-stage transition actually means for the token’s near-term trajectory.
FAQ
What did the recent ZetaChain governance vote approve?
ZetaChain token holders approved Proposal 68 to shut down the Layer 1 blockchain and migrate ZETA to Solana, with 99.4% of votes in favor.
Does the approval of Proposal 68 mean the immediate migration of ZETA tokens?
No. Proposal 68 authorizes preparation for the migration but does not cause an immediate shutdown or token transfer. A second proposal still needs to finalize the details.
How will ZETA tokens change when migrating to Solana?
ZETA will convert 1:1 into a native Solana SPL token, keeping the same ticker and total supply. However, decimal precision will change from 18 to 9 decimals, which could round down very small balances.
Will all ZETA tokens migrate to Solana in this plan?
No. Only ZETA native to the ZetaChain blockchain is covered by this migration. ZETA tokens already issued on Ethereum and BNB Chain are excluded.
Article produced with the assistance of artificial intelligence and reviewed by the editorial team.
Key takeaways
ZetaChain holders approved Proposal 68 with 99.4% support to shut down the Layer 1 blockchain and migrate ZETA to Solana.
Voting participation reached 58%, comfortably clearing the 40% quorum requirement.
ZETA will convert 1:1 into a native Solana SPL token, keeping its ticker and total supply, though decimals shift from 18 to 9.
ZETA on Ethereum and BNB Chain is excluded from this migration plan.
A second governance proposal, still pending, will set the final snapshot, shutdown timeline, and exchange coordination details.
Governance Vote Approves ZetaChain’s Move to Solana
The vote gives ZetaChain‘s core contributors a green light to begin preparing the technical groundwork for the ZETA Solana migration, without yet triggering an actual shutdown. Proposal 68 closed at 10:58 a.m. ET on September 20 with 99.4% of votes in favor, according to the project’s governance portal. Opposition and abstentions each came in at just 0.3%.
Voting Results and Participation
Turnout was strong enough to make the outcome hard to dispute. Participation reached 58% of eligible stake, well above the 40% quorum ZetaChain required for the proposal to pass. That level of engagement suggests the community was largely aligned on the direction of the project, even as the practical mechanics of the transition remain unsettled.
Crucially, passage of Proposal 68 does not flip a switch. The existing ZetaChain blockchain keeps running, validators keep validating, and ZETA staking remains active. Nothing about holders’ current token balances changes as a result of this vote alone.
What Changes Technically for ZETA Holders
Once the transition is complete, ZETA will exist as a native token on Solana rather than on ZetaChain’s own Cosmos SDK-based chain, and holders will need to understand a few technical shifts before that happens.
Token Conversion and the Decimal Precision Shift
Under the approved plan, ZETA converts 1:1 into a native Solana SPL token. The ticker stays the same, the total supply stays the same, and no new tokens get minted in the process. Vesting schedules already in place are expected to continue under their original terms.
One technical wrinkle deserves attention: native ZETA currently runs on 18 decimal places, while the proposed Solana version would use just nine. That means very small fractional balances could get rounded down during the conversion process, a detail that matters more for holders with dust-sized amounts than for typical wallets.
ZETA on Ethereum and BNB Chain Stays Put
Not every version of ZETA is part of this plan. The migration proposal applies specifically to ZETA native to the ZetaChain blockchain. Tokens already issued on Ethereum and BNB Chain fall outside this particular migration and are not affected by Proposal 68.
The Road Ahead: A Second Vote and Exchange Coordination
Nothing about the actual shutdown of ZetaChain’s Layer 1 is locked in yet — that depends on a second governance proposal that hasn’t been put to a vote. This matters for anyone holding ZETA on an exchange or bridged across chains, because the timeline and mechanics of the swap are still being worked out.
What the Next Proposal Must Decide
The follow-up proposal is expected to nail down the block height for a final balance snapshot, the actual migration mechanism, the process for claiming ZETA on Solana, and the timeline for halting the existing Layer 1 network. It’s also expected to address how much time users get to withdraw connected-chain assets before the shutdown takes effect.
Exchange coordination is a prerequisite ZetaChain has flagged explicitly: the project says it won’t bring the second proposal to a vote until exchanges have confirmed their own token-swap procedures. No firm shutdown date has been announced. ZetaChain has also said it’s still exploring how staking and rewards would work once ZETA lives on Solana, according to a September 17 announcement from the project.
Some technical preparation is already visible. Migration-related tooling has appeared in ZetaChain’s public GitHub repository, including code for exporting ZETA state and calculating balances by address — the kind of groundwork needed to eventually produce a final snapshot, even though the snapshot date itself hasn’t been set.
Why ZetaChain Is Betting on Anuma
The ZetaChain Layer 1 shutdown isn’t happening in isolation — it’s tied directly to the project’s pivot toward Anuma, its private AI application, which the team says no longer requires an independent blockchain to grow. Moving both Anuma and ZETA onto Solana is framed as one combined transition rather than two separate decisions.
Anuma’s Growing User Base
ZetaChain says Anuma has attracted more than 300,000 users and processed over 1 million requests across 35 AI models, based on figures the project has published itself. The app runs on an encrypted memory system that lets users carry context across different AI models, and ZETA already plays a role inside it: holders can lock tokens in exchange for credits to spend on AI services.
In its own words, the ZetaChain team described the opportunity this way: “What Solana’s AI stack still lacks is the application layer: an app people use every day, with memory that belongs to them and travels across models, apps, and agents.”
The project also pointed to the operational burden of running its own Layer 1 as part of the reasoning behind the shift. In the migration proposal, the team wrote that “as a Cosmos SDK chain, ZetaChain inherits every upstream advisory and patch, and each one has to be coordinated across dozens of independent validators,” adding that “AI tooling is making such vulnerabilities easier to find, as the August 25 patch showed, so there will be more.” That reference lines up with a separate incident last month, when Cosmos Labs disclosed attacks against six Cosmos EVM chains — not including ZetaChain — in which attackers sold stolen funds for roughly $5.7 million.
This is where the broader significance of the vote comes into focus: rather than continuing to shoulder the maintenance costs of an independent Layer 1, ZetaChain is choosing to lean on Solana’s infrastructure and redirect its resources toward the AI application it sees as its main growth driver. For a project that raised $27 million in 2023 from backers including Blockchain.com and Jane Street Capital, and launched its mainnet the following January, this marks a fairly sharp change in direction — from building interoperability infrastructure to running a consumer-facing AI product on someone else’s chain.
Validators will continue operating ZetaChain’s existing network, and ZETA staking remains active, until the shutdown process is formally approved through that second governance vote. In the meantime, ZETA’s price dipped roughly 2.5% over the 24 hours following the vote, a modest move that suggests markets are still digesting what a multi-stage transition actually means for the token’s near-term trajectory.
FAQ
What did the recent ZetaChain governance vote approve?
ZetaChain token holders approved Proposal 68 to shut down the Layer 1 blockchain and migrate ZETA to Solana, with 99.4% of votes in favor.
Does the approval of Proposal 68 mean the immediate migration of ZETA tokens?
No. Proposal 68 authorizes preparation for the migration but does not cause an immediate shutdown or token transfer. A second proposal still needs to finalize the details.
How will ZETA tokens change when migrating to Solana?
ZETA will convert 1:1 into a native Solana SPL token, keeping the same ticker and total supply. However, decimal precision will change from 18 to 9 decimals, which could round down very small balances.
Will all ZETA tokens migrate to Solana in this plan?
No. Only ZETA native to the ZetaChain blockchain is covered by this migration. ZETA tokens already issued on Ethereum and BNB Chain are excluded.
Article produced with the assistance of artificial intelligence and reviewed by the editorial team.
56
Войдите, чтобы посмотреть больше материала
Присоединяйтесь к пользователям криптовалют по всему миру на Binance Square
⚡️ Получайте новейшую и полезную информацию о криптоактивах.
💬 Нам доверяет крупнейшая в мире криптобиржа.
👍 Получите достоверные аналитические данные от верифицированных создателей контента.
Эл. почта/номер телефона