
Mastering Market Moves with jacob
866 Публикации

Mastering Market Moves with jacob
Отправить жалобу
Заблокировать пользователя
Sharing deep insights market knowledge news proven trading strategies and indicators
Случайный трейдер
2.9 г
8.2K+ подписок(и/а)
3.3K+ подписчиков(а)
1.9K+ понравилось
Посты
Все
Цитирования
Видео
PINNED
🇺🇸 U.S INFLATION IS UP TO 3% LOWER THAN EXPECTED YOU KNOW WHAT HAPPENS NEXT #CPIWatch #Inflation #APRBinanceTGE #MarketRebound
🇺🇸 U.S INFLATION IS UP TO 3% LOWER THAN EXPECTED YOU KNOW WHAT HAPPENS NEXT #CPIWatch #Inflation #APRBinanceTGE #MarketRebound
3
1
48
20.8k
PINNED
SEPTEMBER CPI REPORT INFLASTION LOWER THAN EXPECTED
#Inflation #CPIWatch #MarketRebound #BitcoinETFNetInflows
SEPTEMBER CPI REPORT INFLASTION LOWER THAN EXPECTED
#Inflation #CPIWatch #MarketRebound #BitcoinETFNetInflows
#Inflation #CPIWatch #MarketRebound #BitcoinETFNetInflows
9
3.5k
Crypto News Digest: Vitalik on Quantum-Safe Ethereum, Saylor on Bitcoin Metrics, and Binance BNB RewardsHere are the top fresh stories in crypto today:
1. Vitalik Buterin Optimistic on Quantum-Safe Ethereum
- What happened: Ethereum co-founder Vitalik Buterin stated he is strongly bullish on a faster roadmap to make $ETH quantum-safe.
- Why it matters: Accelerated quantum resistance targets core long-term security and cryptographic stability for the network.
- Source: CoinDesk
2. Saylor Points to Rare Bitcoin Metrics
- What happened: MicroStrategy's Michael Saylor highlighted four rare and extreme metrics that $BTC recently hit to explain current price levels.
- Why it matters: Highlights significant technical benchmarks occurring during the current market movement.
- Source: BeInCrypto
3. Binance Announces New BNB Quiz Activity
- What happened: Binance launched a new "Word of the Day" activity themed around stock options.
- Why it matters: Active platform users can test their knowledge to unlock $BNB rewards.
- Source: Binance
#CryptoNews #Bitcoin #Ethereum
Crypto News Digest: Vitalik on Quantum-Safe Ethereum, Saylor on Bitcoin Metrics, and Binance BNB Rewards
Here are the top fresh stories in crypto today:
1. Vitalik Buterin Optimistic on Quantum-Safe Ethereum
- What happened: Ethereum co-founder Vitalik Buterin stated he is strongly bullish on a faster roadmap to make $ETH quantum-safe.
- Why it matters: Accelerated quantum resistance targets core long-term security and cryptographic stability for the network.
- Source: CoinDesk
2. Saylor Points to Rare Bitcoin Metrics
- What happened: MicroStrategy's Michael Saylor highlighted four rare and extreme metrics that $BTC recently hit to explain current price levels.
- Why it matters: Highlights significant technical benchmarks occurring during the current market movement.
- Source: BeInCrypto
3. Binance Announces New BNB Quiz Activity
- What happened: Binance launched a new "Word of the Day" activity themed around stock options.
- Why it matters: Active platform users can test their knowledge to unlock $BNB rewards.
- Source: Binance
#CryptoNews #Bitcoin #Ethereum
1. Vitalik Buterin Optimistic on Quantum-Safe Ethereum
- What happened: Ethereum co-founder Vitalik Buterin stated he is strongly bullish on a faster roadmap to make $ETH quantum-safe.
- Why it matters: Accelerated quantum resistance targets core long-term security and cryptographic stability for the network.
- Source: CoinDesk
2. Saylor Points to Rare Bitcoin Metrics
- What happened: MicroStrategy's Michael Saylor highlighted four rare and extreme metrics that $BTC recently hit to explain current price levels.
- Why it matters: Highlights significant technical benchmarks occurring during the current market movement.
- Source: BeInCrypto
3. Binance Announces New BNB Quiz Activity
- What happened: Binance launched a new "Word of the Day" activity themed around stock options.
- Why it matters: Active platform users can test their knowledge to unlock $BNB rewards.
- Source: Binance
#CryptoNews #Bitcoin #Ethereum
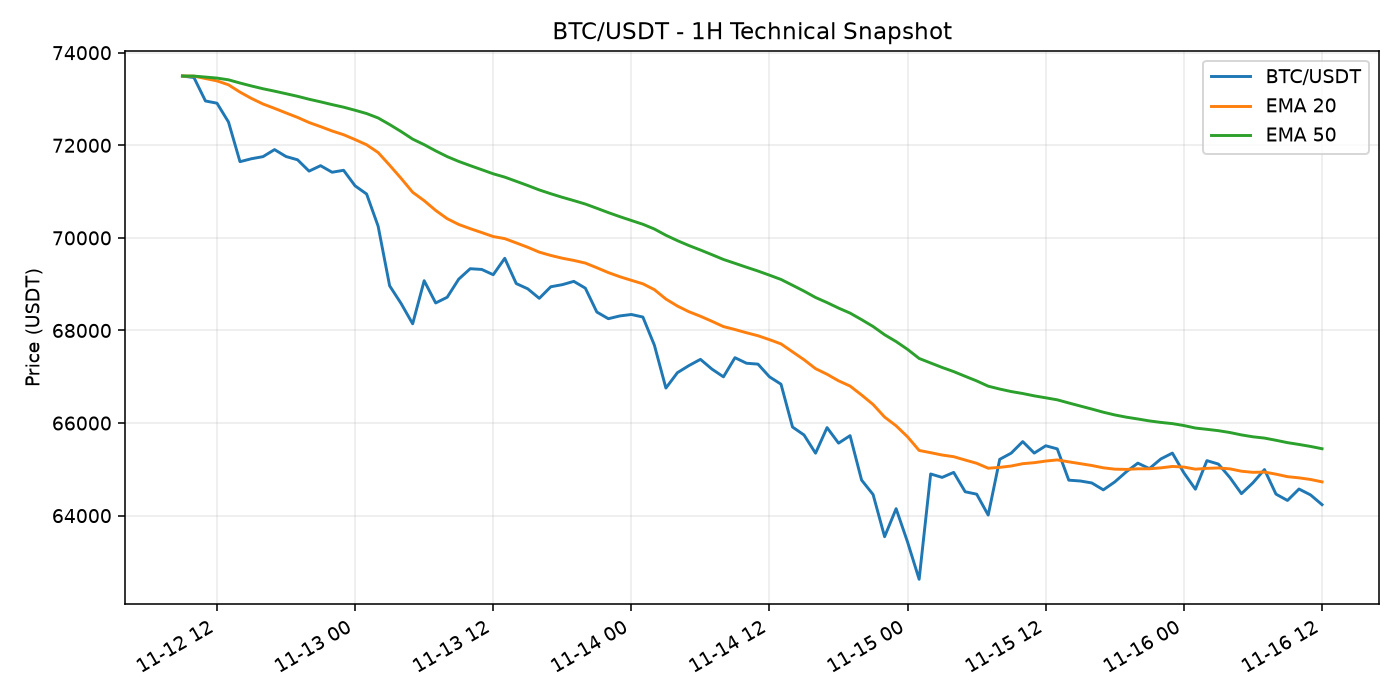
CRYPTO MARKET SNAPSHOT
Data timestamp: 2026-11-16 12:09 UTC. BTC/USDT is $64,240.67 (-1.77% over 24h). Market direction can vary by asset and timeframe, so review liquidity and your own risk limits before making decisions.
Watchlist: $BTC $ETH
#CryptoMarket #Bitcoin #Ethereum
Educational commentary only; not financial advice.
CRYPTO MARKET SNAPSHOT
Data timestamp: 2026-11-16 12:09 UTC. BTC/USDT is $64,240.67 (-1.77% over 24h). Market direction can vary by asset and timeframe, so review liquidity and your own risk limits before making decisions.
Watchlist: $BTC $ETH
#CryptoMarket #Bitcoin #Ethereum
Educational commentary only; not financial advice.
Data timestamp: 2026-11-16 12:09 UTC. BTC/USDT is $64,240.67 (-1.77% over 24h). Market direction can vary by asset and timeframe, so review liquidity and your own risk limits before making decisions.
Watchlist: $BTC $ETH
#CryptoMarket #Bitcoin #Ethereum
Educational commentary only; not financial advice.
72
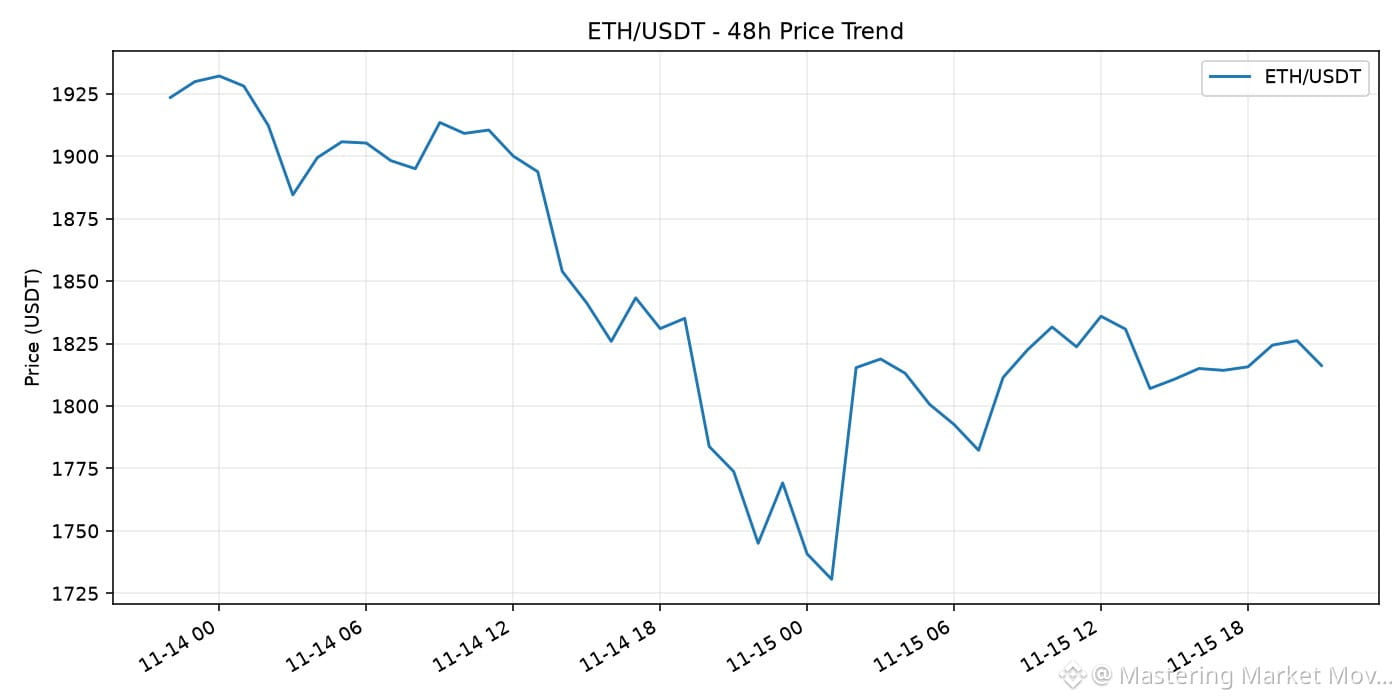
HIGH-VOLUME ALTCOIN WATCH
Snapshot: 2026-11-15 21:23 UTC. $ETH/USDT is among the highest-volume eligible USDT spot pairs in this snapshot. Last price: $1,816.36; 24h change: +2.60%; 24h quote volume: $882,273,308.
High volume signals activity, not guaranteed continuation. Check the chart, official announcements and downside scenarios independently.
$ETH #Crypto #Altcoins #MarketAnalysis
Educational commentary only; not financial advice.
HIGH-VOLUME ALTCOIN WATCH
Snapshot: 2026-11-15 21:23 UTC. $ETH /USDT is among the highest-volume eligible USDT spot pairs in this snapshot. Last price: $1,816.36; 24h change: +2.60%; 24h quote volume: $882,273,308.
High volume signals activity, not guaranteed continuation. Check the chart, official announcements and downside scenarios independently.
$ETH #Crypto #Altcoins #MarketAnalysis
Educational commentary only; not financial advice.
Snapshot: 2026-11-15 21:23 UTC. $ETH /USDT is among the highest-volume eligible USDT spot pairs in this snapshot. Last price: $1,816.36; 24h change: +2.60%; 24h quote volume: $882,273,308.
High volume signals activity, not guaranteed continuation. Check the chart, official announcements and downside scenarios independently.
$ETH #Crypto #Altcoins #MarketAnalysis
Educational commentary only; not financial advice.
1
52
Demystifying Market Depth: How Order Book Dynamics Shape Crypto PricesWhen evaluating cryptocurrency markets, most market participants focus almost entirely on candlestick charts. While historical price action provides valuable context, candlesticks only show where the price has been. They do not show the underlying supply and demand mechanics currently resting in the market.
To understand where price might head next—and more importantly, how easily it can move—intermediate traders must learn to read market depth.
Market depth represents an asset’s ability to sustain large market orders without impacting its price significantly. It is a real-time window into the limit orders sitting on exchange order books. By mastering market depth, you transition from viewing price as a static line on a screen to understanding it as a dynamic equilibrium driven by resting liquidity.
---
### The Anatomy of an Order Book
Before analyzing depth, we must break down the structural foundation of digital asset exchanges: the central limit order book (CLOB).
An order book consists of two main components:
1. **Bids (Buy Orders):** Resting limit orders placed by buyers below the current prevailing market price.
2. **Asks or Offers (Sell Orders):** Resting limit orders placed by sellers above the current market price.
The highest price a buyer is willing to pay is the **Best Bid**, and the lowest price a seller is willing to accept is the **Best Ask**. The difference between these two values is known as the **Bid-Ask Spread**.
When a trader submits a **Market Order**, they accept the best available price on the order book instantly. A market buy order matches against resting ask orders, while a market sell order matches against resting bid orders. Conversely, a **Limit Order** adds liquidity to the order book, sitting at a specified price until another participant fills it. Limit order traders are known as *liquidity makers*, while market order traders are *liquidity takers*.
Market depth is simply the cumulative visualization of these resting limit buy and sell orders across various price levels away from the current market price.
---
### Understanding the Market Depth Chart
Most major exchanges display market depth visually alongside the standard order book ladder. This visual representation typically features two colored zones meeting at the center:
* **Green Zone (Bids):** Accumulates all resting buy orders from the best bid down to lower price levels.
* **Red Zone (Asks):** Accumulates all resting sell orders from the best ask up to higher price levels.
The horizontal axis represents price, while the vertical axis represents cumulative volume.
#### Interpreting Slope and Walls
The shape of the depth curve provides immediate structural insights:
* **Steep Slopes (Thick Depth):** A steep upward slope indicates that large amounts of volume are sitting within a narrow price range. This suggests robust liquidity, meaning it takes significant capital to move the price through this zone.
* **Shallow Slopes (Thin Depth):** A flat or shallow line indicates low volume resting at those price levels. In thin markets, relatively small market orders can push the price rapidly across multiple price ticks.
* **Order Walls:** A near-vertical spike in the depth chart represents a massive concentration of limit orders at a single price point—commonly referred to as a "buy wall" or "sell wall."
While order walls often act as psychological support or resistance levels, they must be interpreted with caution. Market makers and institutional participants frequently place and cancel large limit orders dynamically, meaning visual walls are not guaranteed to hold price action.
---
### Practical Example: Slippage and Price Impact
To appreciate the importance of market depth, consider how liquidity affects order execution in real-world trading scenarios.
Imagine an asset trading at $100. The order book displays the following sell liquidity (asks):
* Level 1: 10 units available at $100.00
* Level 2: 20 units available at $100.50
* Level 3: 50 units available at $101.00
* Level 4: 100 units available at $102.00
If Trader A submits a market buy order for **10 units**, the order is entirely filled at $100.00. The total cost is $1,000, and the average fill price is $100.00. The trade has zero execution slippage.
Now consider Trader B, who submits a market buy order for **70 units** into the exact same book:
* The first 10 units fill at $100.00 ($1,000)
* The next 20 units fill at $100.50 ($2,010)
* The remaining 40 units fill at $101.00 ($4,040)
Trader B spends $7,050 to buy 70 units, resulting in an average purchase price of **$100.71 per unit**.
This difference between the expected execution price ($100.00) and the actual average execution price ($100.71) is **slippage**. It occurred because the buyer's order was larger than the liquidity available at the best ask price, forcing the order to consume liquidity higher up the order book ladder.
In low-depth assets, large market orders can cause massive price spikes or drops, creating extreme volatility and poor execution for traders who rely solely on market orders.
---
### Hidden Layers, Manipulations, and Limitations
While market depth analysis offers vital clues, relying on visible order book data alone carries distinct risks. Modern crypto markets are complex, fast-moving environments influenced by automated trading systems and institutional tactics.
#### 1. Spoofing and Fake Liquidity
Spoofing occurs when a market participant places large, visible limit orders with no intention of letting them fill. For instance, a trader might place a massive buy wall at $95 to create the illusion of strong support, encouraging retail traders to buy at $96. Just before market price falls to hit the $95 wall, the spoofer cancels the order.
#### 2. Iceberg Orders
Institutional traders executing large positions rarely place multi-million-dollar limit orders directly onto the visible order book. Instead, they utilize **Iceberg Orders**—automated execution algorithms that split a massive order into small, visible slices. As soon as one visible slice is filled, the algorithm automatically places the next slice at the same or nearby price level. As a result, a price level that looks "thin" on the market depth chart may actually contain substantial hidden liquidity.
#### 3. Fragmentation Across Exchanges
Unlike traditional equity markets operating under centralized systems, crypto liquidity is fragmented across dozens of centralized exchanges and decentralized automated market makers (AMMs). Strong market depth on one major exchange does not guarantee deep liquidity globally. Cross-exchange arbitrage bots work constantly to align prices across platforms, but liquidity fragmentation remains an important structural limitation.
---
### Strategic Takeaways for Intermediate Traders
Understanding market depth changes how you structure your trades and manage risk:
* **Order Type Selection:** For large trade sizes relative to an asset's average daily volume, use limit orders or algorithmic execution strategies (such as TWAP or VWAP) rather than market orders to minimize slippage.
* **Identifying High-Liquidity Zones:** Instead of treating technical levels as precise lines, cross-reference support and resistance areas with order book depth. Price zones backed by persistent, genuine limit orders often provide more reliable structural support.
* **Volatility Forecasting:** When market depth thins out dramatically on both sides of the book (bids and asks), expect heightened volatility. In thin order books, minor spikes in buying or selling volume can cause disproportionate price swings.
* **Context Over Isolation:** Never analyze market depth in isolation. Combine order book data with volume indicators, macroeconomic conditions, and price trends to form a holistic thesis.
---
### Final Thoughts
Market depth is one of the most powerful tools for understanding the immediate balance between supply and demand. By looking past surface-level price movement and analyzing the structure of resting liquidity, intermediate traders can better protect themselves against slippage, recognize institutional footprint dynamics, and execute trades with greater efficiency.
However, market depth is dynamic, constantly changing in milliseconds as orders are created, filled, and canceled. Managing trade execution requires continuous monitoring, strict risk control, and an appreciation for the structural mechanics that drive modern digital asset exchanges.
#CryptoEducation #MarketDepth #TradingStrategy
Demystifying Market Depth: How Order Book Dynamics Shape Crypto Prices
When evaluating cryptocurrency markets, most market participants focus almost entirely on candlestick charts. While historical price action provides valuable context, candlesticks only show where the price has been. They do not show the underlying supply and demand mechanics currently resting in the market.
To understand where price might head next—and more importantly, how easily it can move—intermediate traders must learn to read market depth.
Market depth represents an asset’s ability to sustain large market orders without impacting its price significantly. It is a real-time window into the limit orders sitting on exchange order books. By mastering market depth, you transition from viewing price as a static line on a screen to understanding it as a dynamic equilibrium driven by resting liquidity.
---
### The Anatomy of an Order Book
Before analyzing depth, we must break down the structural foundation of digital asset exchanges: the central limit order book (CLOB).
An order book consists of two main components:
1. **Bids (Buy Orders):** Resting limit orders placed by buyers below the current prevailing market price.
2. **Asks or Offers (Sell Orders):** Resting limit orders placed by sellers above the current market price.
The highest price a buyer is willing to pay is the **Best Bid**, and the lowest price a seller is willing to accept is the **Best Ask**. The difference between these two values is known as the **Bid-Ask Spread**.
When a trader submits a **Market Order**, they accept the best available price on the order book instantly. A market buy order matches against resting ask orders, while a market sell order matches against resting bid orders. Conversely, a **Limit Order** adds liquidity to the order book, sitting at a specified price until another participant fills it. Limit order traders are known as *liquidity makers*, while market order traders are *liquidity takers*.
Market depth is simply the cumulative visualization of these resting limit buy and sell orders across various price levels away from the current market price.
---
### Understanding the Market Depth Chart
Most major exchanges display market depth visually alongside the standard order book ladder. This visual representation typically features two colored zones meeting at the center:
* **Green Zone (Bids):** Accumulates all resting buy orders from the best bid down to lower price levels.
* **Red Zone (Asks):** Accumulates all resting sell orders from the best ask up to higher price levels.
The horizontal axis represents price, while the vertical axis represents cumulative volume.
#### Interpreting Slope and Walls
The shape of the depth curve provides immediate structural insights:
* **Steep Slopes (Thick Depth):** A steep upward slope indicates that large amounts of volume are sitting within a narrow price range. This suggests robust liquidity, meaning it takes significant capital to move the price through this zone.
* **Shallow Slopes (Thin Depth):** A flat or shallow line indicates low volume resting at those price levels. In thin markets, relatively small market orders can push the price rapidly across multiple price ticks.
* **Order Walls:** A near-vertical spike in the depth chart represents a massive concentration of limit orders at a single price point—commonly referred to as a "buy wall" or "sell wall."
While order walls often act as psychological support or resistance levels, they must be interpreted with caution. Market makers and institutional participants frequently place and cancel large limit orders dynamically, meaning visual walls are not guaranteed to hold price action.
---
### Practical Example: Slippage and Price Impact
To appreciate the importance of market depth, consider how liquidity affects order execution in real-world trading scenarios.
Imagine an asset trading at $100. The order book displays the following sell liquidity (asks):
* Level 1: 10 units available at $100.00
* Level 2: 20 units available at $100.50
* Level 3: 50 units available at $101.00
* Level 4: 100 units available at $102.00
If Trader A submits a market buy order for **10 units**, the order is entirely filled at $100.00. The total cost is $1,000, and the average fill price is $100.00. The trade has zero execution slippage.
Now consider Trader B, who submits a market buy order for **70 units** into the exact same book:
* The first 10 units fill at $100.00 ($1,000)
* The next 20 units fill at $100.50 ($2,010)
* The remaining 40 units fill at $101.00 ($4,040)
Trader B spends $7,050 to buy 70 units, resulting in an average purchase price of **$100.71 per unit**.
This difference between the expected execution price ($100.00) and the actual average execution price ($100.71) is **slippage**. It occurred because the buyer's order was larger than the liquidity available at the best ask price, forcing the order to consume liquidity higher up the order book ladder.
In low-depth assets, large market orders can cause massive price spikes or drops, creating extreme volatility and poor execution for traders who rely solely on market orders.
---
### Hidden Layers, Manipulations, and Limitations
While market depth analysis offers vital clues, relying on visible order book data alone carries distinct risks. Modern crypto markets are complex, fast-moving environments influenced by automated trading systems and institutional tactics.
#### 1. Spoofing and Fake Liquidity
Spoofing occurs when a market participant places large, visible limit orders with no intention of letting them fill. For instance, a trader might place a massive buy wall at $95 to create the illusion of strong support, encouraging retail traders to buy at $96. Just before market price falls to hit the $95 wall, the spoofer cancels the order.
#### 2. Iceberg Orders
Institutional traders executing large positions rarely place multi-million-dollar limit orders directly onto the visible order book. Instead, they utilize **Iceberg Orders**—automated execution algorithms that split a massive order into small, visible slices. As soon as one visible slice is filled, the algorithm automatically places the next slice at the same or nearby price level. As a result, a price level that looks "thin" on the market depth chart may actually contain substantial hidden liquidity.
#### 3. Fragmentation Across Exchanges
Unlike traditional equity markets operating under centralized systems, crypto liquidity is fragmented across dozens of centralized exchanges and decentralized automated market makers (AMMs). Strong market depth on one major exchange does not guarantee deep liquidity globally. Cross-exchange arbitrage bots work constantly to align prices across platforms, but liquidity fragmentation remains an important structural limitation.
---
### Strategic Takeaways for Intermediate Traders
Understanding market depth changes how you structure your trades and manage risk:
* **Order Type Selection:** For large trade sizes relative to an asset's average daily volume, use limit orders or algorithmic execution strategies (such as TWAP or VWAP) rather than market orders to minimize slippage.
* **Identifying High-Liquidity Zones:** Instead of treating technical levels as precise lines, cross-reference support and resistance areas with order book depth. Price zones backed by persistent, genuine limit orders often provide more reliable structural support.
* **Volatility Forecasting:** When market depth thins out dramatically on both sides of the book (bids and asks), expect heightened volatility. In thin order books, minor spikes in buying or selling volume can cause disproportionate price swings.
* **Context Over Isolation:** Never analyze market depth in isolation. Combine order book data with volume indicators, macroeconomic conditions, and price trends to form a holistic thesis.
---
### Final Thoughts
Market depth is one of the most powerful tools for understanding the immediate balance between supply and demand. By looking past surface-level price movement and analyzing the structure of resting liquidity, intermediate traders can better protect themselves against slippage, recognize institutional footprint dynamics, and execute trades with greater efficiency.
However, market depth is dynamic, constantly changing in milliseconds as orders are created, filled, and canceled. Managing trade execution requires continuous monitoring, strict risk control, and an appreciation for the structural mechanics that drive modern digital asset exchanges.
#CryptoEducation #MarketDepth #TradingStrategy
To understand where price might head next—and more importantly, how easily it can move—intermediate traders must learn to read market depth.
Market depth represents an asset’s ability to sustain large market orders without impacting its price significantly. It is a real-time window into the limit orders sitting on exchange order books. By mastering market depth, you transition from viewing price as a static line on a screen to understanding it as a dynamic equilibrium driven by resting liquidity.
---
### The Anatomy of an Order Book
Before analyzing depth, we must break down the structural foundation of digital asset exchanges: the central limit order book (CLOB).
An order book consists of two main components:
1. **Bids (Buy Orders):** Resting limit orders placed by buyers below the current prevailing market price.
2. **Asks or Offers (Sell Orders):** Resting limit orders placed by sellers above the current market price.
The highest price a buyer is willing to pay is the **Best Bid**, and the lowest price a seller is willing to accept is the **Best Ask**. The difference between these two values is known as the **Bid-Ask Spread**.
When a trader submits a **Market Order**, they accept the best available price on the order book instantly. A market buy order matches against resting ask orders, while a market sell order matches against resting bid orders. Conversely, a **Limit Order** adds liquidity to the order book, sitting at a specified price until another participant fills it. Limit order traders are known as *liquidity makers*, while market order traders are *liquidity takers*.
Market depth is simply the cumulative visualization of these resting limit buy and sell orders across various price levels away from the current market price.
---
### Understanding the Market Depth Chart
Most major exchanges display market depth visually alongside the standard order book ladder. This visual representation typically features two colored zones meeting at the center:
* **Green Zone (Bids):** Accumulates all resting buy orders from the best bid down to lower price levels.
* **Red Zone (Asks):** Accumulates all resting sell orders from the best ask up to higher price levels.
The horizontal axis represents price, while the vertical axis represents cumulative volume.
#### Interpreting Slope and Walls
The shape of the depth curve provides immediate structural insights:
* **Steep Slopes (Thick Depth):** A steep upward slope indicates that large amounts of volume are sitting within a narrow price range. This suggests robust liquidity, meaning it takes significant capital to move the price through this zone.
* **Shallow Slopes (Thin Depth):** A flat or shallow line indicates low volume resting at those price levels. In thin markets, relatively small market orders can push the price rapidly across multiple price ticks.
* **Order Walls:** A near-vertical spike in the depth chart represents a massive concentration of limit orders at a single price point—commonly referred to as a "buy wall" or "sell wall."
While order walls often act as psychological support or resistance levels, they must be interpreted with caution. Market makers and institutional participants frequently place and cancel large limit orders dynamically, meaning visual walls are not guaranteed to hold price action.
---
### Practical Example: Slippage and Price Impact
To appreciate the importance of market depth, consider how liquidity affects order execution in real-world trading scenarios.
Imagine an asset trading at $100. The order book displays the following sell liquidity (asks):
* Level 1: 10 units available at $100.00
* Level 2: 20 units available at $100.50
* Level 3: 50 units available at $101.00
* Level 4: 100 units available at $102.00
If Trader A submits a market buy order for **10 units**, the order is entirely filled at $100.00. The total cost is $1,000, and the average fill price is $100.00. The trade has zero execution slippage.
Now consider Trader B, who submits a market buy order for **70 units** into the exact same book:
* The first 10 units fill at $100.00 ($1,000)
* The next 20 units fill at $100.50 ($2,010)
* The remaining 40 units fill at $101.00 ($4,040)
Trader B spends $7,050 to buy 70 units, resulting in an average purchase price of **$100.71 per unit**.
This difference between the expected execution price ($100.00) and the actual average execution price ($100.71) is **slippage**. It occurred because the buyer's order was larger than the liquidity available at the best ask price, forcing the order to consume liquidity higher up the order book ladder.
In low-depth assets, large market orders can cause massive price spikes or drops, creating extreme volatility and poor execution for traders who rely solely on market orders.
---
### Hidden Layers, Manipulations, and Limitations
While market depth analysis offers vital clues, relying on visible order book data alone carries distinct risks. Modern crypto markets are complex, fast-moving environments influenced by automated trading systems and institutional tactics.
#### 1. Spoofing and Fake Liquidity
Spoofing occurs when a market participant places large, visible limit orders with no intention of letting them fill. For instance, a trader might place a massive buy wall at $95 to create the illusion of strong support, encouraging retail traders to buy at $96. Just before market price falls to hit the $95 wall, the spoofer cancels the order.
#### 2. Iceberg Orders
Institutional traders executing large positions rarely place multi-million-dollar limit orders directly onto the visible order book. Instead, they utilize **Iceberg Orders**—automated execution algorithms that split a massive order into small, visible slices. As soon as one visible slice is filled, the algorithm automatically places the next slice at the same or nearby price level. As a result, a price level that looks "thin" on the market depth chart may actually contain substantial hidden liquidity.
#### 3. Fragmentation Across Exchanges
Unlike traditional equity markets operating under centralized systems, crypto liquidity is fragmented across dozens of centralized exchanges and decentralized automated market makers (AMMs). Strong market depth on one major exchange does not guarantee deep liquidity globally. Cross-exchange arbitrage bots work constantly to align prices across platforms, but liquidity fragmentation remains an important structural limitation.
---
### Strategic Takeaways for Intermediate Traders
Understanding market depth changes how you structure your trades and manage risk:
* **Order Type Selection:** For large trade sizes relative to an asset's average daily volume, use limit orders or algorithmic execution strategies (such as TWAP or VWAP) rather than market orders to minimize slippage.
* **Identifying High-Liquidity Zones:** Instead of treating technical levels as precise lines, cross-reference support and resistance areas with order book depth. Price zones backed by persistent, genuine limit orders often provide more reliable structural support.
* **Volatility Forecasting:** When market depth thins out dramatically on both sides of the book (bids and asks), expect heightened volatility. In thin order books, minor spikes in buying or selling volume can cause disproportionate price swings.
* **Context Over Isolation:** Never analyze market depth in isolation. Combine order book data with volume indicators, macroeconomic conditions, and price trends to form a holistic thesis.
---
### Final Thoughts
Market depth is one of the most powerful tools for understanding the immediate balance between supply and demand. By looking past surface-level price movement and analyzing the structure of resting liquidity, intermediate traders can better protect themselves against slippage, recognize institutional footprint dynamics, and execute trades with greater efficiency.
However, market depth is dynamic, constantly changing in milliseconds as orders are created, filled, and canceled. Managing trade execution requires continuous monitoring, strict risk control, and an appreciation for the structural mechanics that drive modern digital asset exchanges.
#CryptoEducation #MarketDepth #TradingStrategy
1
73
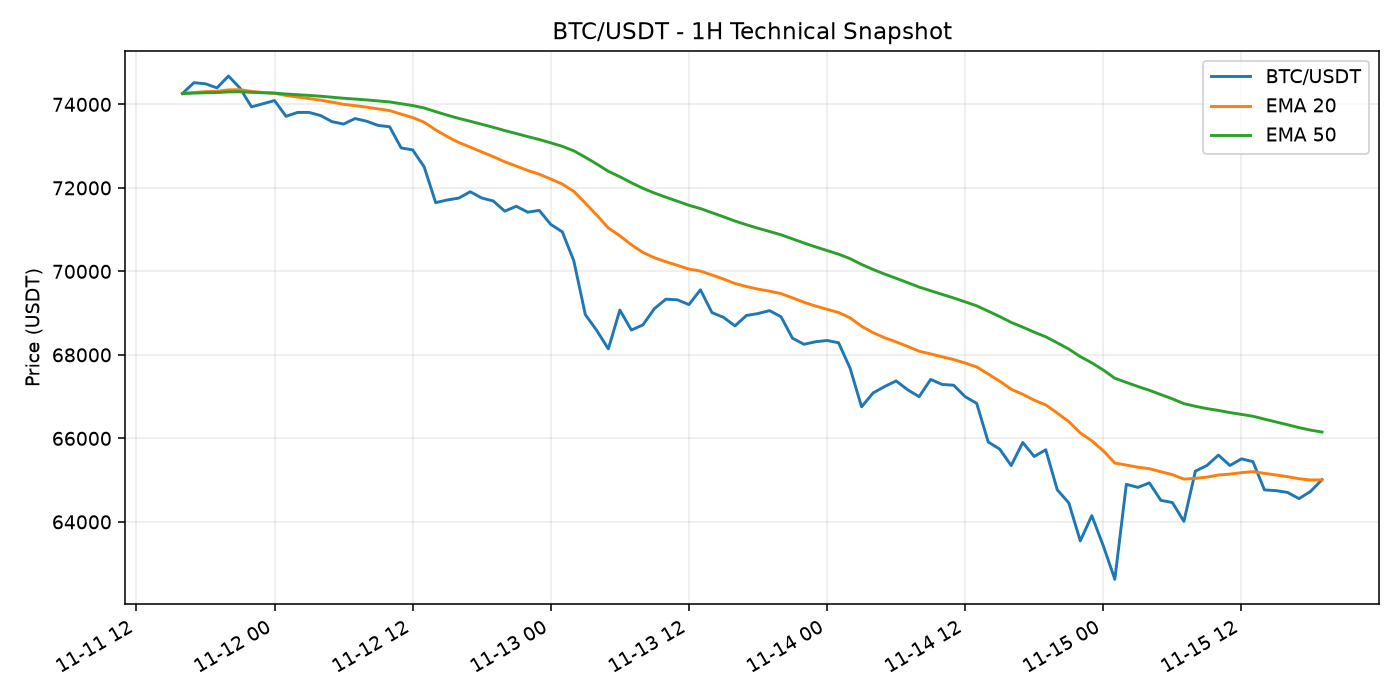
BTC/USDT TECHNICAL CHECK - 1H
Snapshot: 2026-11-15 19:15 UTC. Latest close: $65,011.09. RSI(14): 56.3. EMA20 is below EMA50 on this snapshot. This is a momentum observation, not a standalone buy or sell signal. RSI can remain elevated or depressed during strong trends; confirm with price structure and risk management.
$BTC #Bitcoin #TechnicalAnalysis
Educational commentary only; not financial advice.
BTC/USDT TECHNICAL CHECK - 1H
Snapshot: 2026-11-15 19:15 UTC. Latest close: $65,011.09. RSI(14): 56.3. EMA20 is below EMA50 on this snapshot. This is a momentum observation, not a standalone buy or sell signal. RSI can remain elevated or depressed during strong trends; confirm with price structure and risk management.
$BTC #Bitcoin #TechnicalAnalysis
Educational commentary only; not financial advice.
Snapshot: 2026-11-15 19:15 UTC. Latest close: $65,011.09. RSI(14): 56.3. EMA20 is below EMA50 on this snapshot. This is a momentum observation, not a standalone buy or sell signal. RSI can remain elevated or depressed during strong trends; confirm with price structure and risk management.
$BTC #Bitcoin #TechnicalAnalysis
Educational commentary only; not financial advice.
57
Статья
Market Analysis: Evaluating Price Movements, Volatility, and Key Levels across Major AssetsThe crypto market displays a mixed landscape over the past 24 hours, with varying performance and notable intraday ranges across major assets.
**Price Action & Performance**
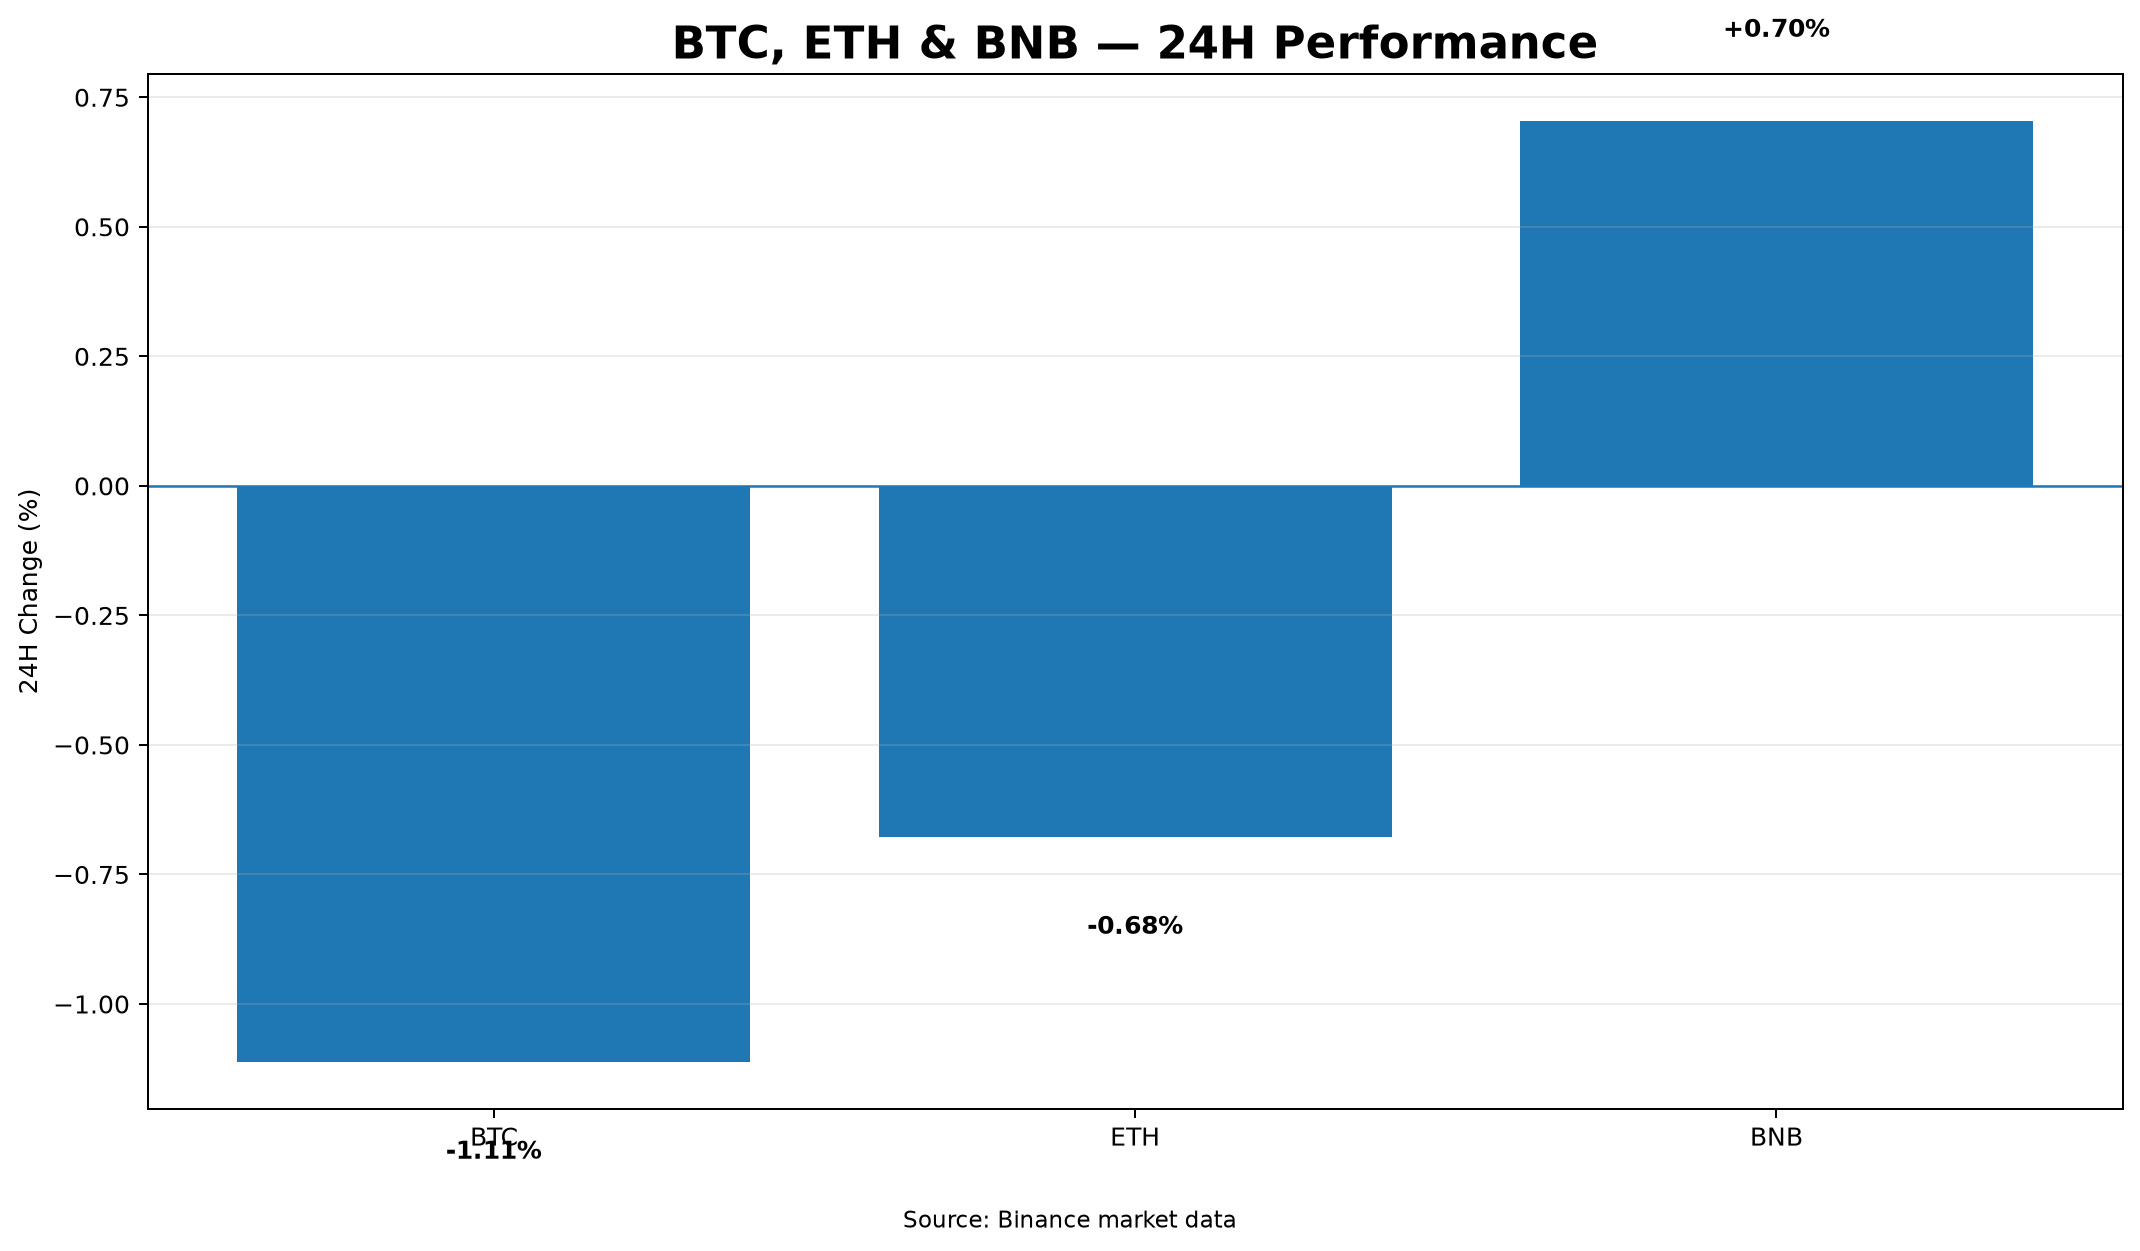
- $BTC is trading at $64,621.75, down 1.112% in the last 24 hours. It registered a 24h high of $66,189.88 and a low of $62,006.00, accompanied by a 24h quote volume of approximately $2.34B (36,273.13 units).
- $ETH stands at $1,814.07, representing a 0.678% decrease over the daily period. Its 24h range spans from $1,711.08 to $1,858.25, with a quote volume of $991.84M (553,208.25 units).
- $BNB shows relative strength compared to the broader market, gaining 0.705% to reach $590.36. It recorded a 24h low of $566.00 and a high of $599.72, generating $120.10M in quote volume (205,160.51 units).
**Relative Strength & Volatility**
BNB is currently outperforming Bitcoin and Ethereum, showing positive momentum despite overall market pullbacks. Volatility remains substantial, particularly for Bitcoin, which traded within a wide $4,183.88 range over the past day. Ethereum experienced a $147.17 spread, while BNB fluctuated by $33.72.
**Market Scenarios**
- **Bullish Scenario:** A sustained move above the 24h resistance levels—$66,189.88 for Bitcoin, $1,858.25 for Ethereum, and $599.72 for BNB—could signal renewed upward momentum if backed by expanding volume.
- **Bearish Scenario:** Failure to hold near current levels could lead to retests of the recent 24h lows at $62,006.00 for Bitcoin, $1,711.08 for Ethereum, and $566.00 for BNB, increasing the likelihood of deeper consolidation.
**Risks & What to Watch**
Key risks include potential liquidity spikes near support and resistance bounds. Market participants should closely monitor trading volume patterns and price behavior near daily highs and lows for clues on trend direction.
#CryptoAnalysis #MarketUpdate #TradingOverview
Market Analysis: Evaluating Price Movements, Volatility, and Key Levels across Major Assets
The crypto market displays a mixed landscape over the past 24 hours, with varying performance and notable intraday ranges across major assets.
**Price Action & Performance**
- $BTC is trading at $64,621.75, down 1.112% in the last 24 hours. It registered a 24h high of $66,189.88 and a low of $62,006.00, accompanied by a 24h quote volume of approximately $2.34B (36,273.13 units).
- $ETH stands at $1,814.07, representing a 0.678% decrease over the daily period. Its 24h range spans from $1,711.08 to $1,858.25, with a quote volume of $991.84M (553,208.25 units).
- $BNB shows relative strength compared to the broader market, gaining 0.705% to reach $590.36. It recorded a 24h low of $566.00 and a high of $599.72, generating $120.10M in quote volume (205,160.51 units).
**Relative Strength & Volatility**
BNB is currently outperforming Bitcoin and Ethereum, showing positive momentum despite overall market pullbacks. Volatility remains substantial, particularly for Bitcoin, which traded within a wide $4,183.88 range over the past day. Ethereum experienced a $147.17 spread, while BNB fluctuated by $33.72.
**Market Scenarios**
- **Bullish Scenario:** A sustained move above the 24h resistance levels—$66,189.88 for Bitcoin, $1,858.25 for Ethereum, and $599.72 for BNB—could signal renewed upward momentum if backed by expanding volume.
- **Bearish Scenario:** Failure to hold near current levels could lead to retests of the recent 24h lows at $62,006.00 for Bitcoin, $1,711.08 for Ethereum, and $566.00 for BNB, increasing the likelihood of deeper consolidation.
**Risks & What to Watch**
Key risks include potential liquidity spikes near support and resistance bounds. Market participants should closely monitor trading volume patterns and price behavior near daily highs and lows for clues on trend direction.
#CryptoAnalysis #MarketUpdate #TradingOverview
**Price Action & Performance**
- $BTC is trading at $64,621.75, down 1.112% in the last 24 hours. It registered a 24h high of $66,189.88 and a low of $62,006.00, accompanied by a 24h quote volume of approximately $2.34B (36,273.13 units).
- $ETH stands at $1,814.07, representing a 0.678% decrease over the daily period. Its 24h range spans from $1,711.08 to $1,858.25, with a quote volume of $991.84M (553,208.25 units).
- $BNB shows relative strength compared to the broader market, gaining 0.705% to reach $590.36. It recorded a 24h low of $566.00 and a high of $599.72, generating $120.10M in quote volume (205,160.51 units).
**Relative Strength & Volatility**
BNB is currently outperforming Bitcoin and Ethereum, showing positive momentum despite overall market pullbacks. Volatility remains substantial, particularly for Bitcoin, which traded within a wide $4,183.88 range over the past day. Ethereum experienced a $147.17 spread, while BNB fluctuated by $33.72.
**Market Scenarios**
- **Bullish Scenario:** A sustained move above the 24h resistance levels—$66,189.88 for Bitcoin, $1,858.25 for Ethereum, and $599.72 for BNB—could signal renewed upward momentum if backed by expanding volume.
- **Bearish Scenario:** Failure to hold near current levels could lead to retests of the recent 24h lows at $62,006.00 for Bitcoin, $1,711.08 for Ethereum, and $566.00 for BNB, increasing the likelihood of deeper consolidation.
**Risks & What to Watch**
Key risks include potential liquidity spikes near support and resistance bounds. Market participants should closely monitor trading volume patterns and price behavior near daily highs and lows for clues on trend direction.
#CryptoAnalysis #MarketUpdate #TradingOverview
114
CRYPTO MARKET SNAPSHOT
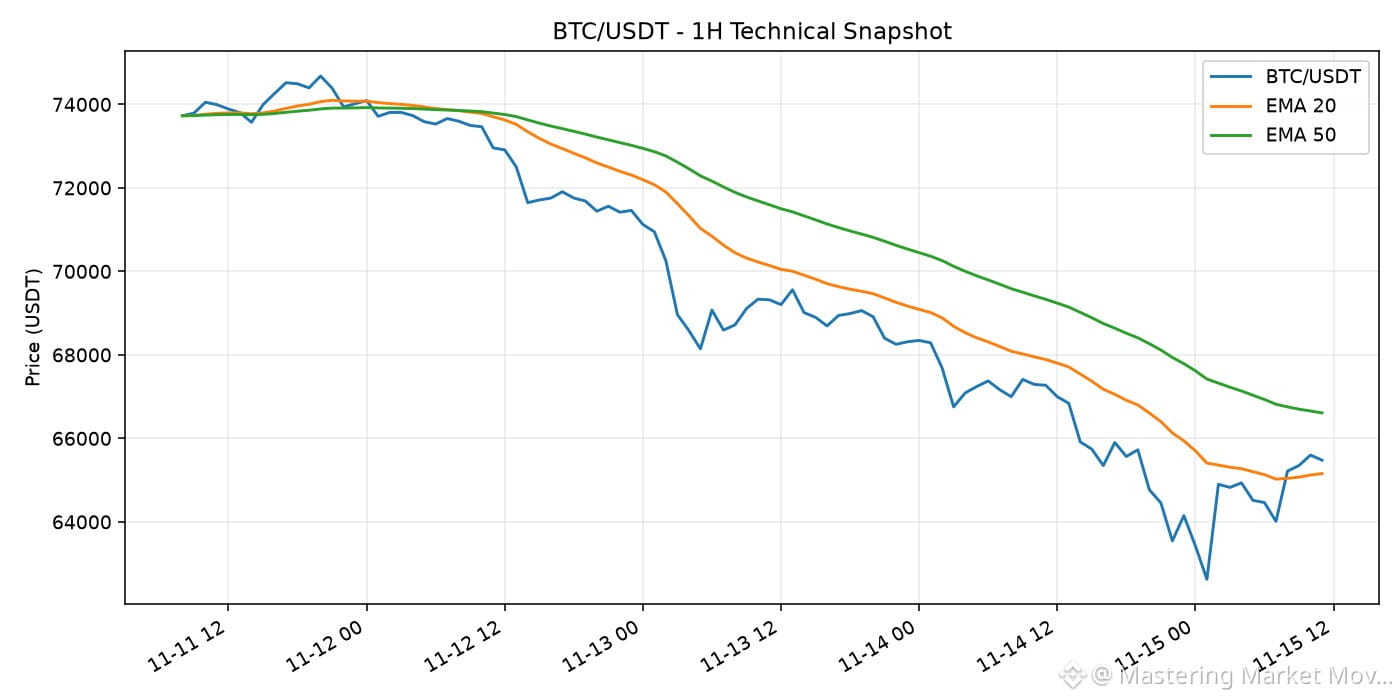
Data timestamp: 2026-11-15 11:36 UTC. BTC/USDT is $65,478.00 (-2.54% over 24h). Market direction can vary by asset and timeframe, so review liquidity and your own risk limits before making decisions.
Watchlist: $BTC $ETH
#CryptoMarket #Bitcoin #Ethereum
Educational commentary only; not financial advice.
CRYPTO MARKET SNAPSHOT
Data timestamp: 2026-11-15 11:36 UTC. BTC/USDT is $65,478.00 (-2.54% over 24h). Market direction can vary by asset and timeframe, so review liquidity and your own risk limits before making decisions.
Watchlist: $BTC $ETH
#CryptoMarket #Bitcoin #Ethereum
Educational commentary only; not financial advice.
Data timestamp: 2026-11-15 11:36 UTC. BTC/USDT is $65,478.00 (-2.54% over 24h). Market direction can vary by asset and timeframe, so review liquidity and your own risk limits before making decisions.
Watchlist: $BTC $ETH
#CryptoMarket #Bitcoin #Ethereum
Educational commentary only; not financial advice.
74
HIGH-VOLUME ALTCOIN WATCH
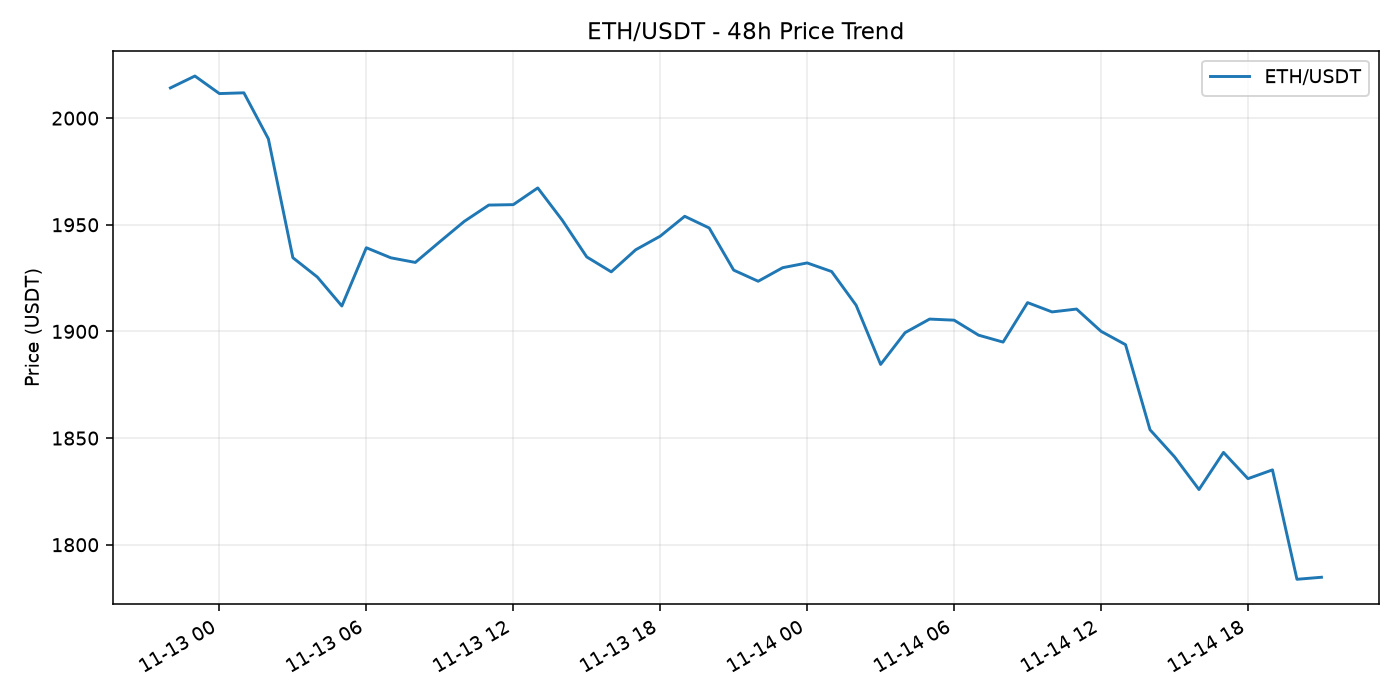
Snapshot: 2026-11-14 20:59 UTC. $ETH/USDT is among the highest-volume eligible USDT spot pairs in this snapshot. Last price: $1,783.80; 24h change: -8.45%; 24h quote volume: $733,909,472.
High volume signals activity, not guaranteed continuation. Check the chart, official announcements and downside scenarios independently.
$ETH #Crypto #Altcoins #MarketAnalysis
Educational commentary only; not financial advice.
HIGH-VOLUME ALTCOIN WATCH
Snapshot: 2026-11-14 20:59 UTC. $ETH /USDT is among the highest-volume eligible USDT spot pairs in this snapshot. Last price: $1,783.80; 24h change: -8.45%; 24h quote volume: $733,909,472.
High volume signals activity, not guaranteed continuation. Check the chart, official announcements and downside scenarios independently.
$ETH #Crypto #Altcoins #MarketAnalysis
Educational commentary only; not financial advice.
Snapshot: 2026-11-14 20:59 UTC. $ETH /USDT is among the highest-volume eligible USDT spot pairs in this snapshot. Last price: $1,783.80; 24h change: -8.45%; 24h quote volume: $733,909,472.
High volume signals activity, not guaranteed continuation. Check the chart, official announcements and downside scenarios independently.
$ETH #Crypto #Altcoins #MarketAnalysis
Educational commentary only; not financial advice.
31
Beyond the Ticker: A Deep Dive into Crypto Market Depth and Order Book MechanicsWhen most market participants analyze cryptocurrency markets, their focus lands almost exclusively on price charts. They monitor candlestick patterns, calculate moving averages, and watch for breakouts across high-level price feeds. However, the last traded price displayed on an exchange dashboard represents only a single data point—a reflection of the past. It tells you where a transaction just occurred, but it reveals very little about what will happen when the next major market order hits the books.
To understand how prices actually move and how trades are filled, intermediate traders must look beneath the surface of ticker quotes. This requires a comprehensive understanding of market depth, order book dynamics, and the underlying liquidity structures that dictate trade execution.
---
### Understanding the Central Limit Order Book (CLOB)
Most centralized cryptocurrency exchanges operate on a Central Limit Order Book (CLOB) model. This system matches buyers and sellers based on price and time priority. The order book consists of two main sides:
1. **Bids (Buy Orders):** A list of open orders from buyers who are willing to purchase an asset at specific prices below the current market price.
2. **Asks or Offers (Sell Orders):** A list of open orders from sellers who are willing to sell an asset at specific prices above the current market price.
The highest bid price and the lowest ask price define the top of the order book. The gap between these two figures is known as the **bid-ask spread**.
In a highly liquid market with tight spreads, the difference between the highest buyer and lowest seller might be a fraction of a cent. In illiquid markets, this spread can widen significantly, increasing execution costs for active traders.
Market participants interact with this book primarily through two types of orders:
* **Limit Orders:** Orders placed to buy or sell at a specific price or better. Limit orders add liquidity to the book and are often referred to as "maker" orders.
* **Market Orders:** Orders executed immediately at the best available current price. Market orders remove liquidity from the book and are referred to as "taker" orders.
Understanding this dynamic is essential: price does not move randomly; it moves because market orders consume the passive limit orders standing in the book.
---
### What is Market Depth?
Market depth refers to the volume of limit orders available at various price levels above and below the current market price. It measures the market’s capacity to sustain large market orders without impacting the asset's price significantly.
A market is considered **deep** if there are significant volumes of pending buy and sell limit orders clustered near the mid-market price. Conversely, a market is **thin** or shallow if available volume is sparse, meaning even modest buying or selling pressure can push the price significantly higher or lower.
Exchanges often visualize market depth using a **Depth Chart**. This chart features two sloping curves:
* A green cumulative bid curve extending to the left (lower prices).
* A red cumulative ask curve extending to the right (higher prices).
The horizontal axis represents price levels, while the vertical axis represents cumulative order volume. Where these two lines converge in the center is the current market price.
#### Reading "Walls" in the Depth Visualizer
When analyzing a depth chart, traders often notice steep vertical sections on either side of the mid-price. These are commonly referred to as **buy walls** or **sell walls**.
* A **buy wall** indicates a massive concentration of limit buy orders at a specific price level. This can act as temporary support, as market sellers must exhaust all the volume at that price before the market can drop further.
* A **sell wall** represents a large concentration of limit sell orders, acting as resistance that market buyers must absorb to push prices higher.
However, visual walls can be deceiving, a topic explored further in the risks section.
---
### Practical Execution: Slippage and Price Impact
To appreciate why market depth matters, one must examine how market orders are routed through the order book.
Consider a hypothetical spot market for Bitcoin where the order book currently looks as follows on the ask side:
* **Level 1:** 0.50 Bitcoin available at $65,000
* **Level 2:** 1.00 Bitcoin available at $65,100
* **Level 3:** 2.00 Bitcoin available at $65,300
* **Level 4:** 5.00 Bitcoin available at $65,600
If a trader submits a market buy order for **3.00 Bitcoin**, the order matching engine will not fill the entire order at the top price of $65,000. Instead, it walks up the book:
1. It buys **0.50 Bitcoin** at $65,000 (Cost: $32,500).
2. It buys **1.00 Bitcoin** at $65,100 (Cost: $65,100).
3. It buys the remaining **1.50 Bitcoin** from Level 3 at $65,300 (Cost: $97,950).
The total expenditure is $195,550, resulting in an **average execution price** of approximately **$65,183.33 per Bitcoin**.
The difference between the initial expected price ($65,000) and the final average execution price ($65,183.33) is called **slippage**.
In thin markets, execution slippage can severely impair trading performance. Traders operating with larger order sizes must evaluate market depth across multiple order book levels rather than relying solely on the single price quoted at the top of the book.
---
### Advanced Order Book Metrics
Intermediate traders often utilize aggregated order book metrics to gauge short-term supply and demand imbalances.
#### 1. Order Book Imbalance (OBI)
Order Book Imbalance measures the relative volume ratio between bids and asks within a defined percentage distance (e.g., 1% or 2%) from the mid-price.
$$\text{Imbalance} = \frac{\text{Bid Volume} - \text{Ask Volume}}{\text{Bid Volume} + \text{Ask Volume}}$$
A positive ratio indicates stronger buying interest resting in the book, while a negative ratio suggests larger overhead selling supply. High-frequency algorithms often track sudden shifts in OBI to anticipate immediate micro-price movements.
#### 2. Cumulative Volume Delta (CVD)
While depth shows *passive* interest, Cumulative Volume Delta tracks *active* aggression. CVD measures the cumulative difference between market buy volume and market sell volume over time. Comparing CVD against price action can reveal key divergences:
* If price is reaching new highs but CVD is trending flat or downward, it suggests buyers are becoming less aggressive, relying instead on passive limit bids.
* If CVD is surging upward while price fails to make new highs, aggressive buyers are likely absorbing a massive passive sell wall.
---
### Risks, Limitations, and Market Realities
While analyzing market depth provides valuable insights into market micro-structure, relying on visible order book data carries substantial risks and limitations.
#### 1. Order Book Spoofing
Visible limit orders are non-binding commitments until executed. Malicious actors or sophisticated algorithms sometimes place large "fake" buy or sell walls far out of the money to deceive retail traders into believing strong support or resistance exists. Once the price approaches that level, the entity cancels the order instantly. Relying purely on static visual depth charts can expose traders to spoofing traps.
#### 2. Iceberg Orders
Institutional participants rarely place massive orders visible on the public order book, as doing so would signal their intentions to the market. Instead, they utilize **iceberg orders**—automated execution algorithms that split a large order into small, visible tranches. When one tranche is executed, the next tranche appears automatically. Consequently, a level that appears to have only minor liquidity might actually conceal significant institutional volume.
#### 3. Market Fragmentation
Unlike traditional equities, which often consolidate order flow into single national exchanges, cryptocurrency liquidity is highly fragmented across dozens of centralized exchanges and decentralized automated market makers (AMMs). Looking at the order book of a single exchange provides an incomplete view of overall global market depth.
#### 4. High-Frequency Cancellation Rates
In modern digital asset markets, a vast majority of order book modifications and cancellations occur in milliseconds. Limit orders are placed and removed dynamically as external conditions change. What appears to be a deep book right now can thin out instantaneously during sudden macroeconomic news events or volatile market movements.
---
### Integrating Market Depth into a Trading Strategy
To use market depth effectively without falling into common execution traps, consider these operational guidelines:
* **Match Order Types to Market Depth:** In shallow trading pairs, avoid large market orders. Utilize limit orders, scaled entry orders, or TWAP (Time-Weighted Average Price) algorithms to minimize market impact.
* **Observe Dynamic Execution:** Pay attention to how the book behaves when price hits a major level. Are the bids growing as sellers attack, or are they vanishing? True depth withstands market orders; illusory depth disappears before impact.
* **Combine Depth with Volume Profiles:** Cross-reference real-time order book depth with historical volume profile tools (like Volume-by-Price) to confirm whether current resting orders align with historical execution zones.
---
### Conclusion
Market depth offers a detailed look into the underlying mechanics of cryptocurrency asset pricing. By moving past simple candlestick patterns and analyzing how bids and asks are structured across order book levels, traders can better estimate trade execution costs, identify genuine liquidity zones, and manage slippage risks effectively.
However, order book data is dynamic, fragmented, and vulnerable to strategic manipulation. Successful market analysis requires viewing depth as one component within a broader analytical frame—balancing order flow metrics with overall market structure, sound risk management, and disciplined position sizing.
#CryptoEducation #MarketDepth #TradingMechanics
Beyond the Ticker: A Deep Dive into Crypto Market Depth and Order Book Mechanics
When most market participants analyze cryptocurrency markets, their focus lands almost exclusively on price charts. They monitor candlestick patterns, calculate moving averages, and watch for breakouts across high-level price feeds. However, the last traded price displayed on an exchange dashboard represents only a single data point—a reflection of the past. It tells you where a transaction just occurred, but it reveals very little about what will happen when the next major market order hits the books.
To understand how prices actually move and how trades are filled, intermediate traders must look beneath the surface of ticker quotes. This requires a comprehensive understanding of market depth, order book dynamics, and the underlying liquidity structures that dictate trade execution.
---
### Understanding the Central Limit Order Book (CLOB)
Most centralized cryptocurrency exchanges operate on a Central Limit Order Book (CLOB) model. This system matches buyers and sellers based on price and time priority. The order book consists of two main sides:
1. **Bids (Buy Orders):** A list of open orders from buyers who are willing to purchase an asset at specific prices below the current market price.
2. **Asks or Offers (Sell Orders):** A list of open orders from sellers who are willing to sell an asset at specific prices above the current market price.
The highest bid price and the lowest ask price define the top of the order book. The gap between these two figures is known as the **bid-ask spread**.
In a highly liquid market with tight spreads, the difference between the highest buyer and lowest seller might be a fraction of a cent. In illiquid markets, this spread can widen significantly, increasing execution costs for active traders.
Market participants interact with this book primarily through two types of orders:
* **Limit Orders:** Orders placed to buy or sell at a specific price or better. Limit orders add liquidity to the book and are often referred to as "maker" orders.
* **Market Orders:** Orders executed immediately at the best available current price. Market orders remove liquidity from the book and are referred to as "taker" orders.
Understanding this dynamic is essential: price does not move randomly; it moves because market orders consume the passive limit orders standing in the book.
---
### What is Market Depth?
Market depth refers to the volume of limit orders available at various price levels above and below the current market price. It measures the market’s capacity to sustain large market orders without impacting the asset's price significantly.
A market is considered **deep** if there are significant volumes of pending buy and sell limit orders clustered near the mid-market price. Conversely, a market is **thin** or shallow if available volume is sparse, meaning even modest buying or selling pressure can push the price significantly higher or lower.
Exchanges often visualize market depth using a **Depth Chart**. This chart features two sloping curves:
* A green cumulative bid curve extending to the left (lower prices).
* A red cumulative ask curve extending to the right (higher prices).
The horizontal axis represents price levels, while the vertical axis represents cumulative order volume. Where these two lines converge in the center is the current market price.
#### Reading "Walls" in the Depth Visualizer
When analyzing a depth chart, traders often notice steep vertical sections on either side of the mid-price. These are commonly referred to as **buy walls** or **sell walls**.
* A **buy wall** indicates a massive concentration of limit buy orders at a specific price level. This can act as temporary support, as market sellers must exhaust all the volume at that price before the market can drop further.
* A **sell wall** represents a large concentration of limit sell orders, acting as resistance that market buyers must absorb to push prices higher.
However, visual walls can be deceiving, a topic explored further in the risks section.
---
### Practical Execution: Slippage and Price Impact
To appreciate why market depth matters, one must examine how market orders are routed through the order book.
Consider a hypothetical spot market for Bitcoin where the order book currently looks as follows on the ask side:
* **Level 1:** 0.50 Bitcoin available at $65,000
* **Level 2:** 1.00 Bitcoin available at $65,100
* **Level 3:** 2.00 Bitcoin available at $65,300
* **Level 4:** 5.00 Bitcoin available at $65,600
If a trader submits a market buy order for **3.00 Bitcoin**, the order matching engine will not fill the entire order at the top price of $65,000. Instead, it walks up the book:
1. It buys **0.50 Bitcoin** at $65,000 (Cost: $32,500).
2. It buys **1.00 Bitcoin** at $65,100 (Cost: $65,100).
3. It buys the remaining **1.50 Bitcoin** from Level 3 at $65,300 (Cost: $97,950).
The total expenditure is $195,550, resulting in an **average execution price** of approximately **$65,183.33 per Bitcoin**.
The difference between the initial expected price ($65,000) and the final average execution price ($65,183.33) is called **slippage**.
In thin markets, execution slippage can severely impair trading performance. Traders operating with larger order sizes must evaluate market depth across multiple order book levels rather than relying solely on the single price quoted at the top of the book.
---
### Advanced Order Book Metrics
Intermediate traders often utilize aggregated order book metrics to gauge short-term supply and demand imbalances.
#### 1. Order Book Imbalance (OBI)
Order Book Imbalance measures the relative volume ratio between bids and asks within a defined percentage distance (e.g., 1% or 2%) from the mid-price.
$$\text{Imbalance} = \frac{\text{Bid Volume} - \text{Ask Volume}}{\text{Bid Volume} + \text{Ask Volume}}$$
A positive ratio indicates stronger buying interest resting in the book, while a negative ratio suggests larger overhead selling supply. High-frequency algorithms often track sudden shifts in OBI to anticipate immediate micro-price movements.
#### 2. Cumulative Volume Delta (CVD)
While depth shows *passive* interest, Cumulative Volume Delta tracks *active* aggression. CVD measures the cumulative difference between market buy volume and market sell volume over time. Comparing CVD against price action can reveal key divergences:
* If price is reaching new highs but CVD is trending flat or downward, it suggests buyers are becoming less aggressive, relying instead on passive limit bids.
* If CVD is surging upward while price fails to make new highs, aggressive buyers are likely absorbing a massive passive sell wall.
---
### Risks, Limitations, and Market Realities
While analyzing market depth provides valuable insights into market micro-structure, relying on visible order book data carries substantial risks and limitations.
#### 1. Order Book Spoofing
Visible limit orders are non-binding commitments until executed. Malicious actors or sophisticated algorithms sometimes place large "fake" buy or sell walls far out of the money to deceive retail traders into believing strong support or resistance exists. Once the price approaches that level, the entity cancels the order instantly. Relying purely on static visual depth charts can expose traders to spoofing traps.
#### 2. Iceberg Orders
Institutional participants rarely place massive orders visible on the public order book, as doing so would signal their intentions to the market. Instead, they utilize **iceberg orders**—automated execution algorithms that split a large order into small, visible tranches. When one tranche is executed, the next tranche appears automatically. Consequently, a level that appears to have only minor liquidity might actually conceal significant institutional volume.
#### 3. Market Fragmentation
Unlike traditional equities, which often consolidate order flow into single national exchanges, cryptocurrency liquidity is highly fragmented across dozens of centralized exchanges and decentralized automated market makers (AMMs). Looking at the order book of a single exchange provides an incomplete view of overall global market depth.
#### 4. High-Frequency Cancellation Rates
In modern digital asset markets, a vast majority of order book modifications and cancellations occur in milliseconds. Limit orders are placed and removed dynamically as external conditions change. What appears to be a deep book right now can thin out instantaneously during sudden macroeconomic news events or volatile market movements.
---
### Integrating Market Depth into a Trading Strategy
To use market depth effectively without falling into common execution traps, consider these operational guidelines:
* **Match Order Types to Market Depth:** In shallow trading pairs, avoid large market orders. Utilize limit orders, scaled entry orders, or TWAP (Time-Weighted Average Price) algorithms to minimize market impact.
* **Observe Dynamic Execution:** Pay attention to how the book behaves when price hits a major level. Are the bids growing as sellers attack, or are they vanishing? True depth withstands market orders; illusory depth disappears before impact.
* **Combine Depth with Volume Profiles:** Cross-reference real-time order book depth with historical volume profile tools (like Volume-by-Price) to confirm whether current resting orders align with historical execution zones.
---
### Conclusion
Market depth offers a detailed look into the underlying mechanics of cryptocurrency asset pricing. By moving past simple candlestick patterns and analyzing how bids and asks are structured across order book levels, traders can better estimate trade execution costs, identify genuine liquidity zones, and manage slippage risks effectively.
However, order book data is dynamic, fragmented, and vulnerable to strategic manipulation. Successful market analysis requires viewing depth as one component within a broader analytical frame—balancing order flow metrics with overall market structure, sound risk management, and disciplined position sizing.
#CryptoEducation #MarketDepth #TradingMechanics
To understand how prices actually move and how trades are filled, intermediate traders must look beneath the surface of ticker quotes. This requires a comprehensive understanding of market depth, order book dynamics, and the underlying liquidity structures that dictate trade execution.
---
### Understanding the Central Limit Order Book (CLOB)
Most centralized cryptocurrency exchanges operate on a Central Limit Order Book (CLOB) model. This system matches buyers and sellers based on price and time priority. The order book consists of two main sides:
1. **Bids (Buy Orders):** A list of open orders from buyers who are willing to purchase an asset at specific prices below the current market price.
2. **Asks or Offers (Sell Orders):** A list of open orders from sellers who are willing to sell an asset at specific prices above the current market price.
The highest bid price and the lowest ask price define the top of the order book. The gap between these two figures is known as the **bid-ask spread**.
In a highly liquid market with tight spreads, the difference between the highest buyer and lowest seller might be a fraction of a cent. In illiquid markets, this spread can widen significantly, increasing execution costs for active traders.
Market participants interact with this book primarily through two types of orders:
* **Limit Orders:** Orders placed to buy or sell at a specific price or better. Limit orders add liquidity to the book and are often referred to as "maker" orders.
* **Market Orders:** Orders executed immediately at the best available current price. Market orders remove liquidity from the book and are referred to as "taker" orders.
Understanding this dynamic is essential: price does not move randomly; it moves because market orders consume the passive limit orders standing in the book.
---
### What is Market Depth?
Market depth refers to the volume of limit orders available at various price levels above and below the current market price. It measures the market’s capacity to sustain large market orders without impacting the asset's price significantly.
A market is considered **deep** if there are significant volumes of pending buy and sell limit orders clustered near the mid-market price. Conversely, a market is **thin** or shallow if available volume is sparse, meaning even modest buying or selling pressure can push the price significantly higher or lower.
Exchanges often visualize market depth using a **Depth Chart**. This chart features two sloping curves:
* A green cumulative bid curve extending to the left (lower prices).
* A red cumulative ask curve extending to the right (higher prices).
The horizontal axis represents price levels, while the vertical axis represents cumulative order volume. Where these two lines converge in the center is the current market price.
#### Reading "Walls" in the Depth Visualizer
When analyzing a depth chart, traders often notice steep vertical sections on either side of the mid-price. These are commonly referred to as **buy walls** or **sell walls**.
* A **buy wall** indicates a massive concentration of limit buy orders at a specific price level. This can act as temporary support, as market sellers must exhaust all the volume at that price before the market can drop further.
* A **sell wall** represents a large concentration of limit sell orders, acting as resistance that market buyers must absorb to push prices higher.
However, visual walls can be deceiving, a topic explored further in the risks section.
---
### Practical Execution: Slippage and Price Impact
To appreciate why market depth matters, one must examine how market orders are routed through the order book.
Consider a hypothetical spot market for Bitcoin where the order book currently looks as follows on the ask side:
* **Level 1:** 0.50 Bitcoin available at $65,000
* **Level 2:** 1.00 Bitcoin available at $65,100
* **Level 3:** 2.00 Bitcoin available at $65,300
* **Level 4:** 5.00 Bitcoin available at $65,600
If a trader submits a market buy order for **3.00 Bitcoin**, the order matching engine will not fill the entire order at the top price of $65,000. Instead, it walks up the book:
1. It buys **0.50 Bitcoin** at $65,000 (Cost: $32,500).
2. It buys **1.00 Bitcoin** at $65,100 (Cost: $65,100).
3. It buys the remaining **1.50 Bitcoin** from Level 3 at $65,300 (Cost: $97,950).
The total expenditure is $195,550, resulting in an **average execution price** of approximately **$65,183.33 per Bitcoin**.
The difference between the initial expected price ($65,000) and the final average execution price ($65,183.33) is called **slippage**.
In thin markets, execution slippage can severely impair trading performance. Traders operating with larger order sizes must evaluate market depth across multiple order book levels rather than relying solely on the single price quoted at the top of the book.
---
### Advanced Order Book Metrics
Intermediate traders often utilize aggregated order book metrics to gauge short-term supply and demand imbalances.
#### 1. Order Book Imbalance (OBI)
Order Book Imbalance measures the relative volume ratio between bids and asks within a defined percentage distance (e.g., 1% or 2%) from the mid-price.
$$\text{Imbalance} = \frac{\text{Bid Volume} - \text{Ask Volume}}{\text{Bid Volume} + \text{Ask Volume}}$$
A positive ratio indicates stronger buying interest resting in the book, while a negative ratio suggests larger overhead selling supply. High-frequency algorithms often track sudden shifts in OBI to anticipate immediate micro-price movements.
#### 2. Cumulative Volume Delta (CVD)
While depth shows *passive* interest, Cumulative Volume Delta tracks *active* aggression. CVD measures the cumulative difference between market buy volume and market sell volume over time. Comparing CVD against price action can reveal key divergences:
* If price is reaching new highs but CVD is trending flat or downward, it suggests buyers are becoming less aggressive, relying instead on passive limit bids.
* If CVD is surging upward while price fails to make new highs, aggressive buyers are likely absorbing a massive passive sell wall.
---
### Risks, Limitations, and Market Realities
While analyzing market depth provides valuable insights into market micro-structure, relying on visible order book data carries substantial risks and limitations.
#### 1. Order Book Spoofing
Visible limit orders are non-binding commitments until executed. Malicious actors or sophisticated algorithms sometimes place large "fake" buy or sell walls far out of the money to deceive retail traders into believing strong support or resistance exists. Once the price approaches that level, the entity cancels the order instantly. Relying purely on static visual depth charts can expose traders to spoofing traps.
#### 2. Iceberg Orders
Institutional participants rarely place massive orders visible on the public order book, as doing so would signal their intentions to the market. Instead, they utilize **iceberg orders**—automated execution algorithms that split a large order into small, visible tranches. When one tranche is executed, the next tranche appears automatically. Consequently, a level that appears to have only minor liquidity might actually conceal significant institutional volume.
#### 3. Market Fragmentation
Unlike traditional equities, which often consolidate order flow into single national exchanges, cryptocurrency liquidity is highly fragmented across dozens of centralized exchanges and decentralized automated market makers (AMMs). Looking at the order book of a single exchange provides an incomplete view of overall global market depth.
#### 4. High-Frequency Cancellation Rates
In modern digital asset markets, a vast majority of order book modifications and cancellations occur in milliseconds. Limit orders are placed and removed dynamically as external conditions change. What appears to be a deep book right now can thin out instantaneously during sudden macroeconomic news events or volatile market movements.
---
### Integrating Market Depth into a Trading Strategy
To use market depth effectively without falling into common execution traps, consider these operational guidelines:
* **Match Order Types to Market Depth:** In shallow trading pairs, avoid large market orders. Utilize limit orders, scaled entry orders, or TWAP (Time-Weighted Average Price) algorithms to minimize market impact.
* **Observe Dynamic Execution:** Pay attention to how the book behaves when price hits a major level. Are the bids growing as sellers attack, or are they vanishing? True depth withstands market orders; illusory depth disappears before impact.
* **Combine Depth with Volume Profiles:** Cross-reference real-time order book depth with historical volume profile tools (like Volume-by-Price) to confirm whether current resting orders align with historical execution zones.
---
### Conclusion
Market depth offers a detailed look into the underlying mechanics of cryptocurrency asset pricing. By moving past simple candlestick patterns and analyzing how bids and asks are structured across order book levels, traders can better estimate trade execution costs, identify genuine liquidity zones, and manage slippage risks effectively.
However, order book data is dynamic, fragmented, and vulnerable to strategic manipulation. Successful market analysis requires viewing depth as one component within a broader analytical frame—balancing order flow metrics with overall market structure, sound risk management, and disciplined position sizing.
#CryptoEducation #MarketDepth #TradingMechanics
35
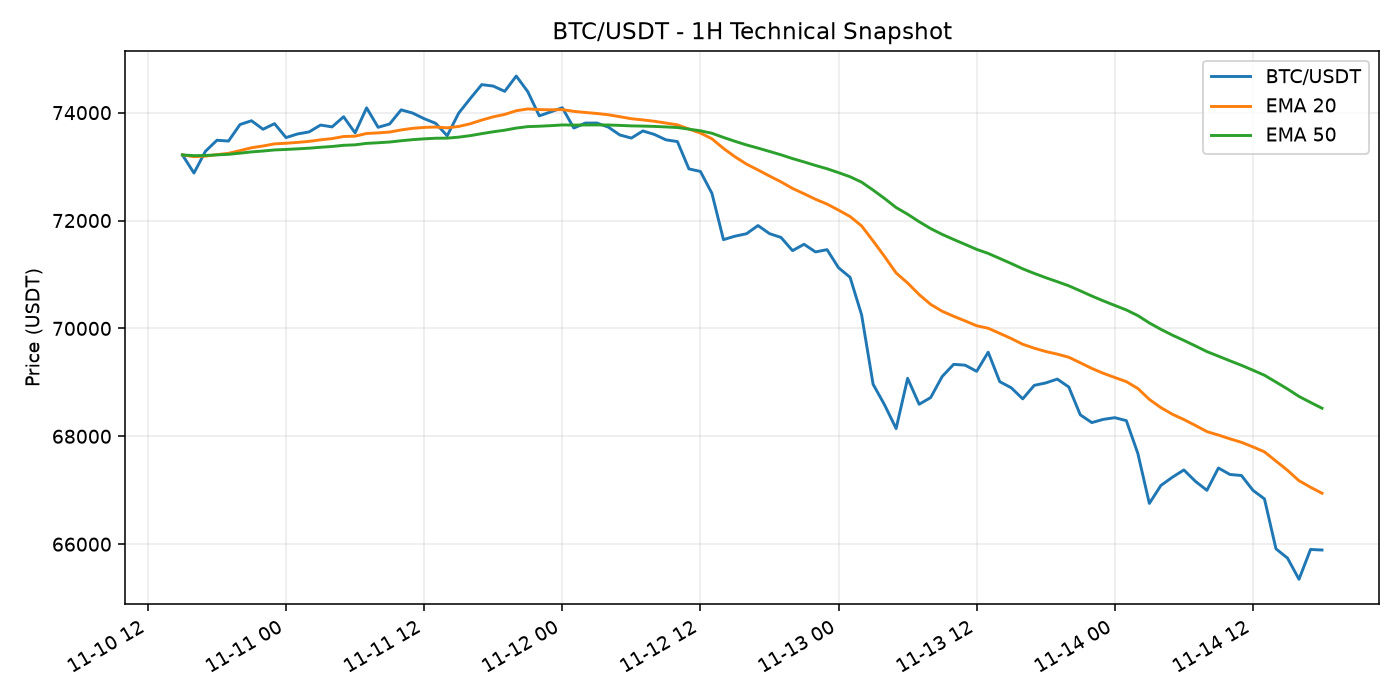
BTC/USDT TECHNICAL CHECK - 1H
Snapshot: 2026-11-14 18:40 UTC. Latest close: $65,892.01. RSI(14): 33.9. EMA20 is below EMA50 on this snapshot. This is a momentum observation, not a standalone buy or sell signal. RSI can remain elevated or depressed during strong trends; confirm with price structure and risk management.
$BTC #Bitcoin #TechnicalAnalysis
Educational commentary only; not financial advice.
BTC/USDT TECHNICAL CHECK - 1H
Snapshot: 2026-11-14 18:40 UTC. Latest close: $65,892.01. RSI(14): 33.9. EMA20 is below EMA50 on this snapshot. This is a momentum observation, not a standalone buy or sell signal. RSI can remain elevated or depressed during strong trends; confirm with price structure and risk management.
$BTC #Bitcoin #TechnicalAnalysis
Educational commentary only; not financial advice.
Snapshot: 2026-11-14 18:40 UTC. Latest close: $65,892.01. RSI(14): 33.9. EMA20 is below EMA50 on this snapshot. This is a momentum observation, not a standalone buy or sell signal. RSI can remain elevated or depressed during strong trends; confirm with price structure and risk management.
$BTC #Bitcoin #TechnicalAnalysis
Educational commentary only; not financial advice.
48
Статья
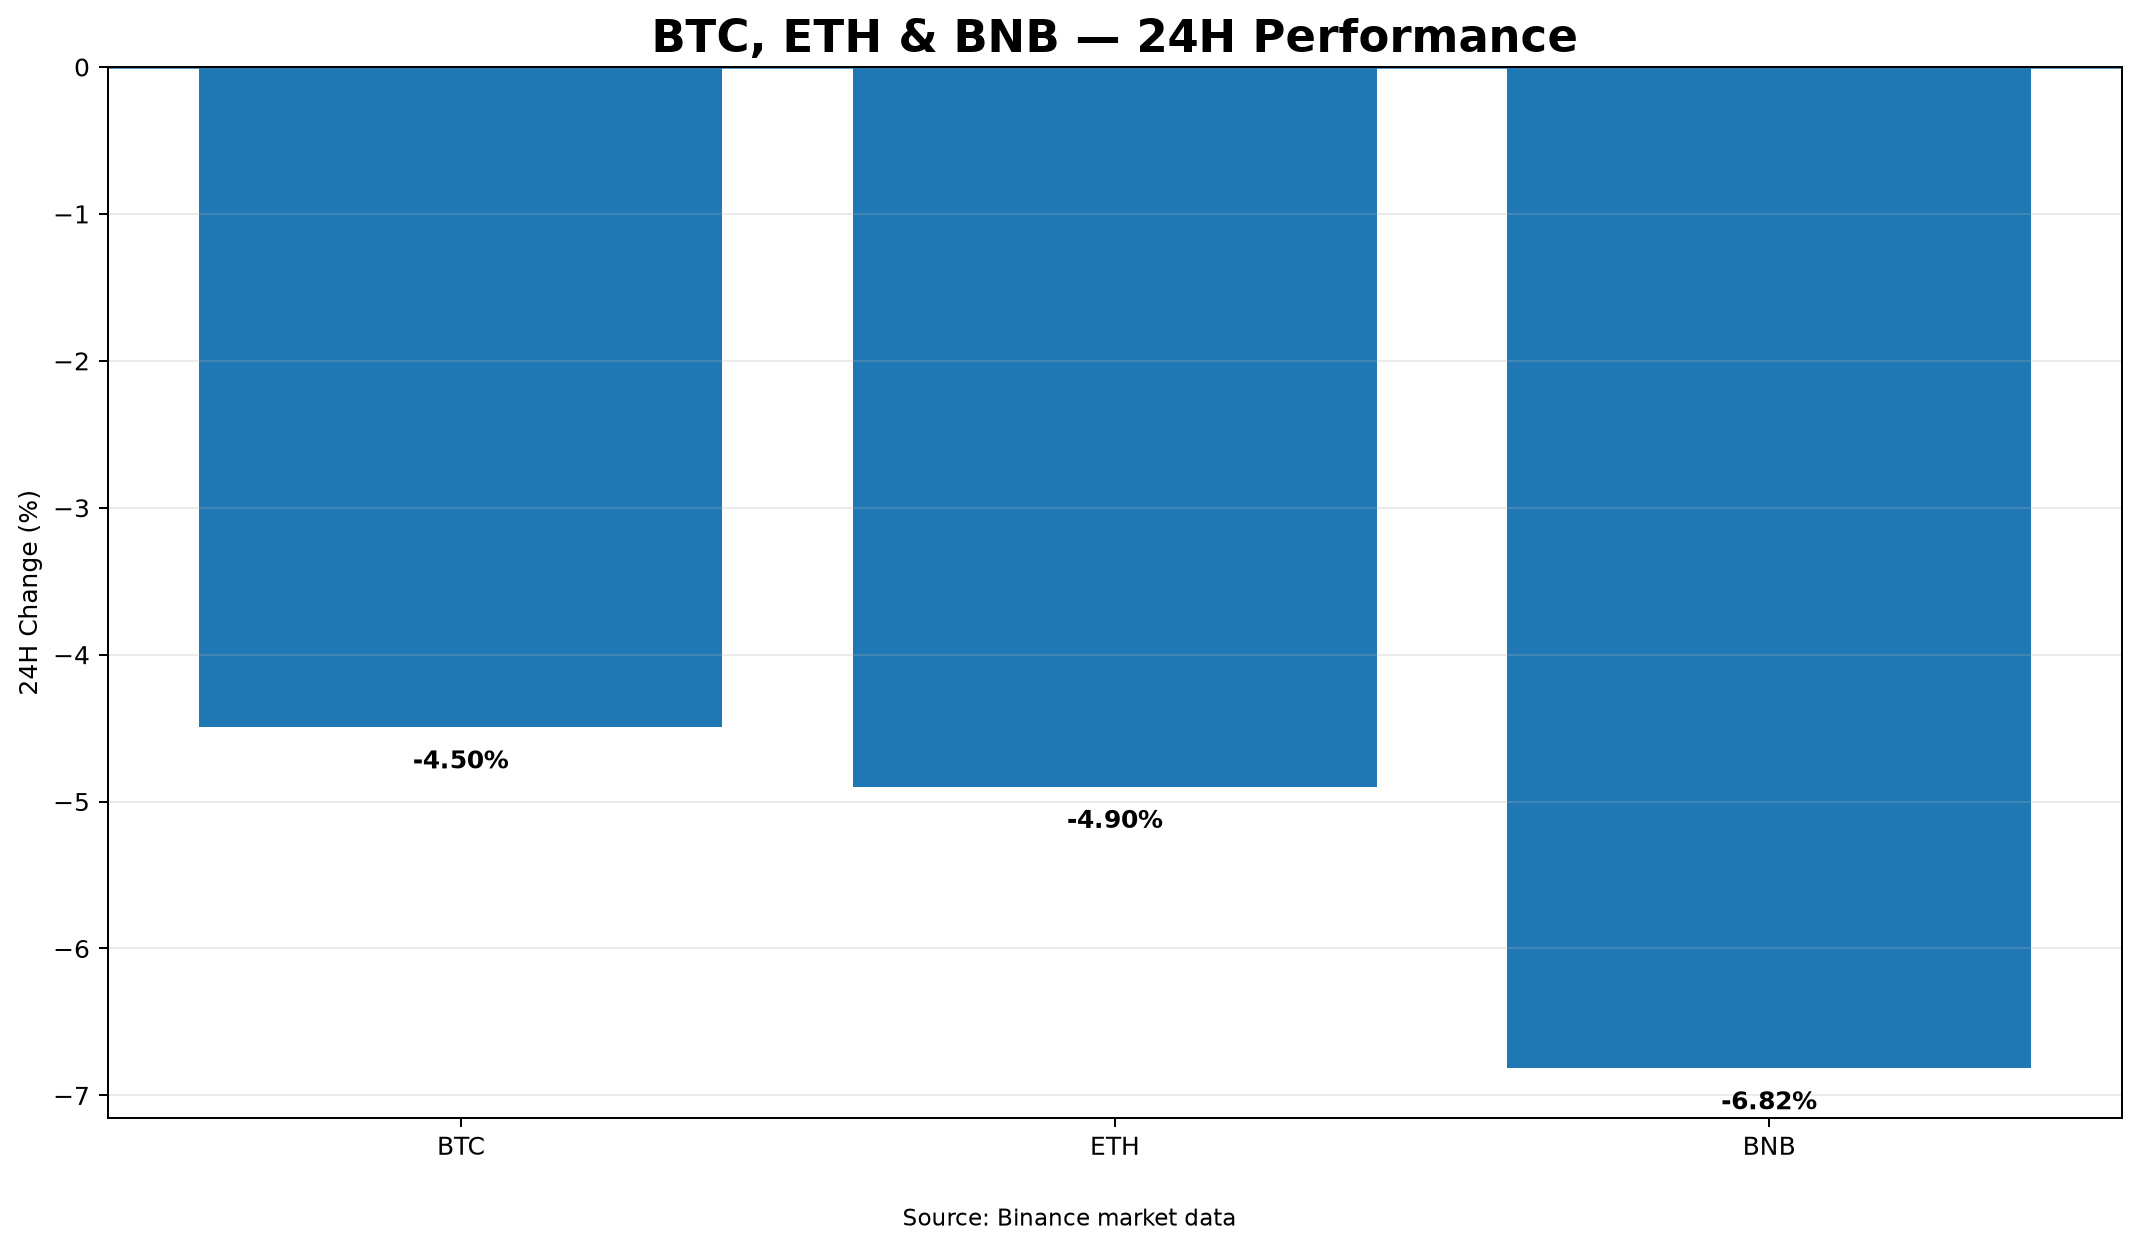
Crypto Market Overview: Intraday Pullback Across Major AssetsThe crypto market experienced notable selling pressure over the past 24 hours. $BTC fell 4.50% to $65,382.65, $ETH dropped 4.90% to $1,828.22, and $BNB saw a steeper decline of 6.82% to $586.97.
Relative Strength & Volatility:
Bitcoin held up slightly better on a relative basis compared to Ethereum and BNB. High intraday volatility pushed all three assets close to their 24-hour lows by the end of the window.
High/Low Ranges & Volume:
- Bitcoin ranged from $65,066.66 to $69,134.01, leading total activity with $1.55B in quote volume.
- Ethereum traded between $1,815.35 and $1,956.50, accumulating $592.13M in volume.
- BNB fluctuated between $586.51 and $639.29, registering $120.92M in volume.
Market Scenarios:
- Bullish Scenario: Reclaiming recent daily highs ($69,134.01 for Bitcoin, $1,956.50 for Ethereum, $639.29 for BNB) accompanied by expanding buy volume could indicate structural stabilization.
- Bearish Scenario: Sustained trading below current 24-hour lows ($65,066.66, $1,815.35, and $586.51) could lead to extended downside momentum.
Risks & What to Watch:
Key risks center around elevated volume during red candles pushing prices past immediate low thresholds. Watch for shifts in trade volume and price action stability around current support levels.
#CryptoAnalysis #MarketUpdate #Trading
Crypto Market Overview: Intraday Pullback Across Major Assets
The crypto market experienced notable selling pressure over the past 24 hours. $BTC fell 4.50% to $65,382.65, $ETH dropped 4.90% to $1,828.22, and $BNB saw a steeper decline of 6.82% to $586.97.
Relative Strength & Volatility:
Bitcoin held up slightly better on a relative basis compared to Ethereum and BNB. High intraday volatility pushed all three assets close to their 24-hour lows by the end of the window.
High/Low Ranges & Volume:
- Bitcoin ranged from $65,066.66 to $69,134.01, leading total activity with $1.55B in quote volume.
- Ethereum traded between $1,815.35 and $1,956.50, accumulating $592.13M in volume.
- BNB fluctuated between $586.51 and $639.29, registering $120.92M in volume.
Market Scenarios:
- Bullish Scenario: Reclaiming recent daily highs ($69,134.01 for Bitcoin, $1,956.50 for Ethereum, $639.29 for BNB) accompanied by expanding buy volume could indicate structural stabilization.
- Bearish Scenario: Sustained trading below current 24-hour lows ($65,066.66, $1,815.35, and $586.51) could lead to extended downside momentum.
Risks & What to Watch:
Key risks center around elevated volume during red candles pushing prices past immediate low thresholds. Watch for shifts in trade volume and price action stability around current support levels.
#CryptoAnalysis #MarketUpdate #Trading
Relative Strength & Volatility:
Bitcoin held up slightly better on a relative basis compared to Ethereum and BNB. High intraday volatility pushed all three assets close to their 24-hour lows by the end of the window.
High/Low Ranges & Volume:
- Bitcoin ranged from $65,066.66 to $69,134.01, leading total activity with $1.55B in quote volume.
- Ethereum traded between $1,815.35 and $1,956.50, accumulating $592.13M in volume.
- BNB fluctuated between $586.51 and $639.29, registering $120.92M in volume.
Market Scenarios:
- Bullish Scenario: Reclaiming recent daily highs ($69,134.01 for Bitcoin, $1,956.50 for Ethereum, $639.29 for BNB) accompanied by expanding buy volume could indicate structural stabilization.
- Bearish Scenario: Sustained trading below current 24-hour lows ($65,066.66, $1,815.35, and $586.51) could lead to extended downside momentum.
Risks & What to Watch:
Key risks center around elevated volume during red candles pushing prices past immediate low thresholds. Watch for shifts in trade volume and price action stability around current support levels.
#CryptoAnalysis #MarketUpdate #Trading
81
Crypto News Brief: $1.2B Recovered in Binance Case, $BTC Dips Below $70K, and $ETH Quantum UpgradesHere are the top crypto stories today:
1. FBI Recovers $1.2 Billion in Stolen Crypto
• What happened: The FBI announced the successful recovery of $1.2 billion in cryptocurrency stolen from Binance.
• Why it matters: Represents one of the largest asset recovery operations conducted by law enforcement in the digital asset space.
• Source: CBS News
2. $BTC Falls Below $70,000 Amid Macro Pressure
• What happened: $BTC slipped under $70,000 following a surge in the U.S. dollar, triggering $1.6 billion in market liquidations.
• Why it matters: Demonstrates significant leverage flushes caused by macroeconomic shifts affecting market liquidity.
• Source: CoinDesk
3. Ethereum Unveils Quantum-Safe Accounts
• What happened: Ethereum introduced quantum-resistant account options, though implementation incurs higher transaction costs.
• Why it matters: Focuses on long-term protocol security to protect $ETH users against future quantum computing risks.
• Source: CryptoSlate
4. Institutional Treasury Sells $ETH to Support DeFi Loan
• What happened: Crypto treasury firm BTCS sold Ether at a loss to protect its $64 million loan on Aave from liquidation.
• Why it matters: Highlights liquidity management challenges facing corporate treasuries using decentralized lending protocols.
• Source: CoinDesk
#CryptoNews #Binance #CryptoMarket
Crypto News Brief: $1.2B Recovered in Binance Case, $BTC Dips Below $70K, and $ETH Quantum Upgrades
Here are the top crypto stories today:
1. FBI Recovers $1.2 Billion in Stolen Crypto
• What happened: The FBI announced the successful recovery of $1.2 billion in cryptocurrency stolen from Binance.
• Why it matters: Represents one of the largest asset recovery operations conducted by law enforcement in the digital asset space.
• Source: CBS News
2. $BTC Falls Below $70,000 Amid Macro Pressure
• What happened: $BTC slipped under $70,000 following a surge in the U.S. dollar, triggering $1.6 billion in market liquidations.
• Why it matters: Demonstrates significant leverage flushes caused by macroeconomic shifts affecting market liquidity.
• Source: CoinDesk
3. Ethereum Unveils Quantum-Safe Accounts
• What happened: Ethereum introduced quantum-resistant account options, though implementation incurs higher transaction costs.
• Why it matters: Focuses on long-term protocol security to protect $ETH users against future quantum computing risks.
• Source: CryptoSlate
4. Institutional Treasury Sells $ETH to Support DeFi Loan
• What happened: Crypto treasury firm BTCS sold Ether at a loss to protect its $64 million loan on Aave from liquidation.
• Why it matters: Highlights liquidity management challenges facing corporate treasuries using decentralized lending protocols.
• Source: CoinDesk
#CryptoNews #Binance #CryptoMarket
1. FBI Recovers $1.2 Billion in Stolen Crypto
• What happened: The FBI announced the successful recovery of $1.2 billion in cryptocurrency stolen from Binance.
• Why it matters: Represents one of the largest asset recovery operations conducted by law enforcement in the digital asset space.
• Source: CBS News
2. $BTC Falls Below $70,000 Amid Macro Pressure
• What happened: $BTC slipped under $70,000 following a surge in the U.S. dollar, triggering $1.6 billion in market liquidations.
• Why it matters: Demonstrates significant leverage flushes caused by macroeconomic shifts affecting market liquidity.
• Source: CoinDesk
3. Ethereum Unveils Quantum-Safe Accounts
• What happened: Ethereum introduced quantum-resistant account options, though implementation incurs higher transaction costs.
• Why it matters: Focuses on long-term protocol security to protect $ETH users against future quantum computing risks.
• Source: CryptoSlate
4. Institutional Treasury Sells $ETH to Support DeFi Loan
• What happened: Crypto treasury firm BTCS sold Ether at a loss to protect its $64 million loan on Aave from liquidation.
• Why it matters: Highlights liquidity management challenges facing corporate treasuries using decentralized lending protocols.
• Source: CoinDesk
#CryptoNews #Binance #CryptoMarket
56
CRYPTO MARKET SNAPSHOT
Data timestamp: 2026-11-14 11:01 UTC. BTC/USDT is $67,304.00 (-2.97% over 24h). Market direction can vary by asset and timeframe, so review liquidity and your own risk limits before making decisions.
Watchlist: $BTC $ETH
#CryptoMarket #Bitcoin #Ethereum
Educational commentary only; not financial advice.
CRYPTO MARKET SNAPSHOT
Data timestamp: 2026-11-14 11:01 UTC. BTC/USDT is $67,304.00 (-2.97% over 24h). Market direction can vary by asset and timeframe, so review liquidity and your own risk limits before making decisions.
Watchlist: $BTC $ETH
#CryptoMarket #Bitcoin #Ethereum
Educational commentary only; not financial advice.
Data timestamp: 2026-11-14 11:01 UTC. BTC/USDT is $67,304.00 (-2.97% over 24h). Market direction can vary by asset and timeframe, so review liquidity and your own risk limits before making decisions.
Watchlist: $BTC $ETH
#CryptoMarket #Bitcoin #Ethereum
Educational commentary only; not financial advice.
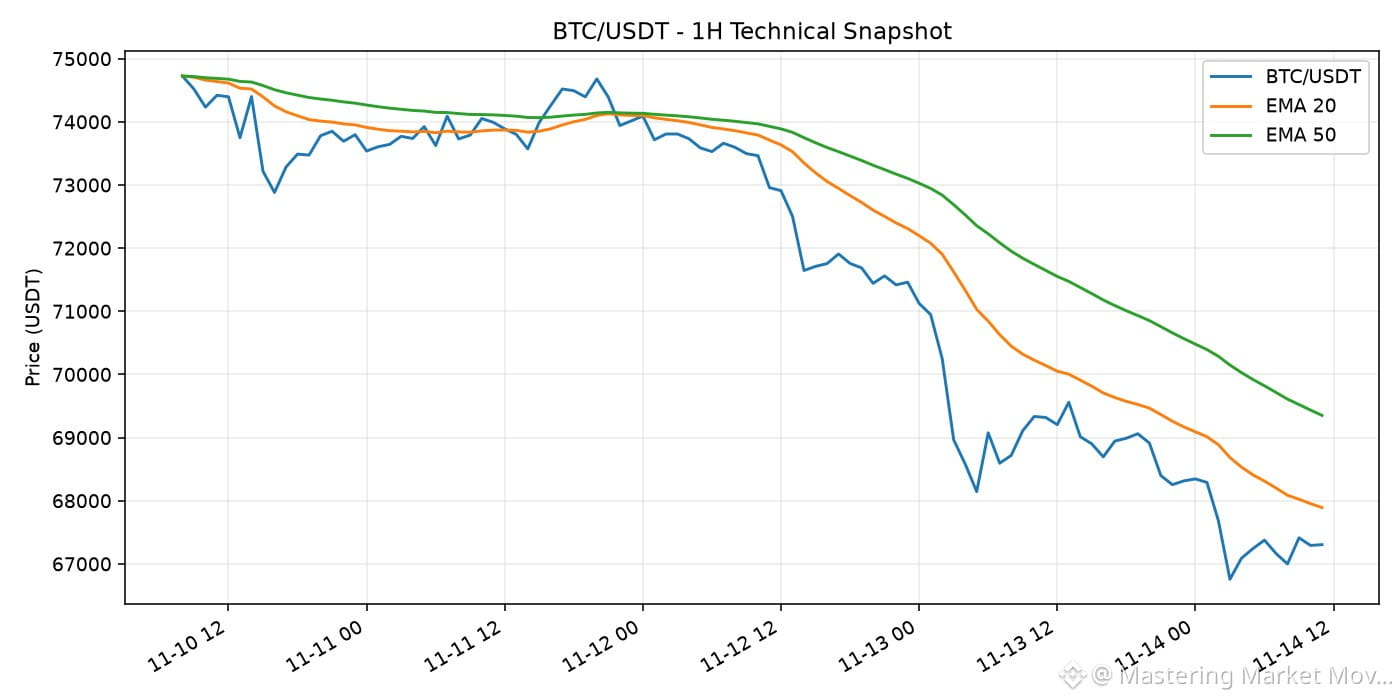
83
HIGH-VOLUME ALTCOIN WATCH
Snapshot: 2026-11-13 22:16 UTC. $ETH/USDT is among the highest-volume eligible USDT spot pairs in this snapshot. Last price: $1,920.80; 24h change: -4.47%; 24h quote volume: $721,840,557.
High volume signals activity, not guaranteed continuation. Check the chart, official announcements and downside scenarios independently.
$ETH #Crypto #Altcoins #MarketAnalysis
Educational commentary only; not financial advice.
HIGH-VOLUME ALTCOIN WATCH
Snapshot: 2026-11-13 22:16 UTC. $ETH /USDT is among the highest-volume eligible USDT spot pairs in this snapshot. Last price: $1,920.80; 24h change: -4.47%; 24h quote volume: $721,840,557.
High volume signals activity, not guaranteed continuation. Check the chart, official announcements and downside scenarios independently.
$ETH #Crypto #Altcoins #MarketAnalysis
Educational commentary only; not financial advice.
Snapshot: 2026-11-13 22:16 UTC. $ETH /USDT is among the highest-volume eligible USDT spot pairs in this snapshot. Last price: $1,920.80; 24h change: -4.47%; 24h quote volume: $721,840,557.
High volume signals activity, not guaranteed continuation. Check the chart, official announcements and downside scenarios independently.
$ETH #Crypto #Altcoins #MarketAnalysis
Educational commentary only; not financial advice.
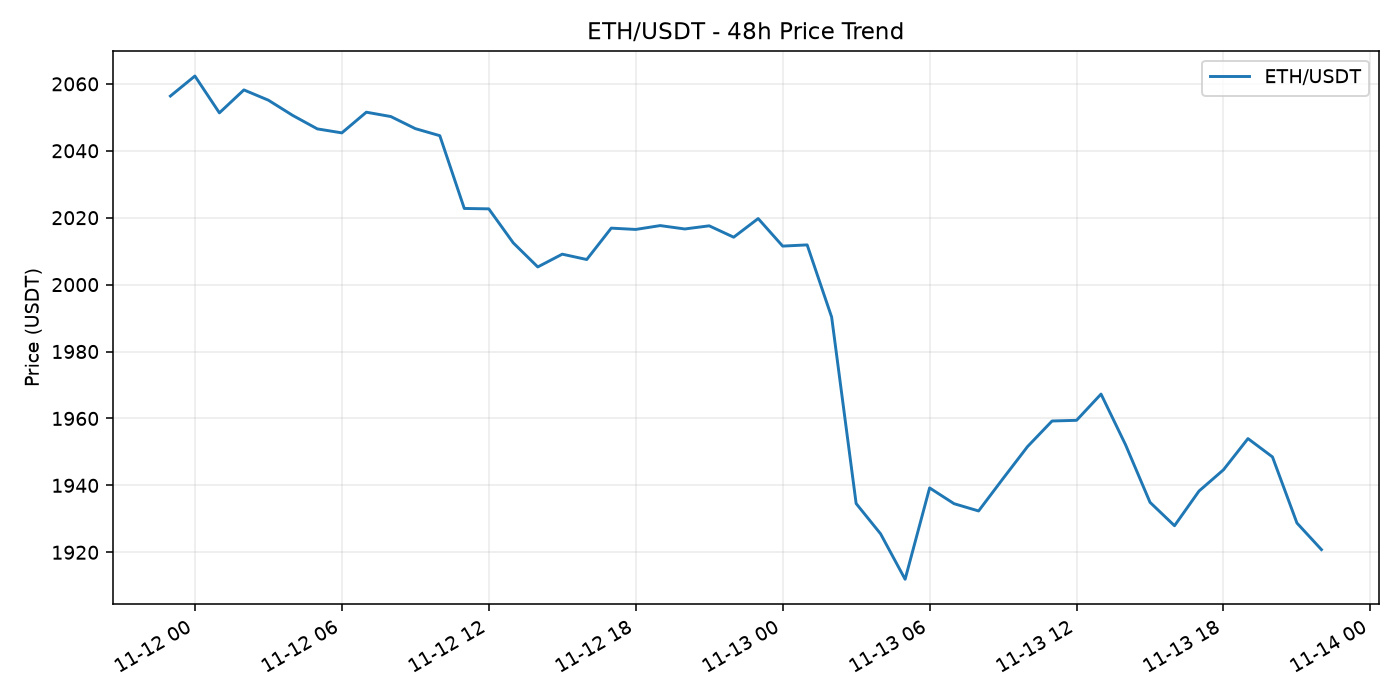
47
Demystifying Market Depth: How to Read Liquidity Beyond the Price ChartWhen observing a digital asset's price chart, most market participants focus on line graphs or candlestick patterns. These visual tools display historic price action—where the price has been over specific intervals. However, historical prices alone do not reveal how easily an asset can move next, nor do they show how much capital is required to shift the current market price up or down.
To understand the mechanics of price movement, traders must look beyond past transaction prices and examine market depth. Market depth offers a real-time window into institutional and retail interest, market liquidity, and potential execution costs. For intermediate traders looking to refine their execution strategies and risk management, mastering market depth is an essential step.
---
### What Is Market Depth?
At its core, market depth refers to a market’s capacity to sustain relatively large market orders without significantly impacting the asset's price. It is directly tied to the exchange's order book, which compiles all active, unexecuted limit orders submitted by market participants.
An order book consists of two main sides:
1. **The Bid Side (Buyers):** Represents participants offering to buy an asset at specific prices below the current market price.
2. **The Ask or Offer Side (Sellers):** Represents participants offering to sell an asset at specific prices above the current market price.
Market depth visualizes the cumulative volume of these bid and ask limit orders across various price levels. A "deep" market possesses a thick layer of limit orders on both sides of the book, absorbing large buying or selling pressure with minimal price fluctuation. Conversely, a "thin" market has sparse limit orders, meaning even modest trade sizes can cause dramatic price swings.
---
### The Architecture of the Order Book
To interpret depth accurately, it helps to understand how the order matching engine functions.
When a trader places a **limit order**, they specify the maximum price they are willing to pay (for a buy) or the minimum price they are willing to accept (for a sell). These orders sit in the order book, creating liquidity. They are non-executed promises waiting for a counterparty.
When a trader places a **market order**, they request an immediate execution at the best available current price. Market orders consume liquidity by matching against existing limit orders in the book.
The difference between the highest bid price and the lowest ask price is known as the **bid-ask spread**.
- In highly liquid environments, this spread is extremely tight (often fractions of a cent or a single basis point).
- In illiquid environments, the spread widens, increasing the cost of immediate entry and exit for market participants.
---
### Understanding Slippage and Price Impact
One of the most practical applications of market depth analysis is calculating and predicting **slippage**. Slippage occurs when a market order executes at a different price than expected due to insufficient depth at the top of the order book.
#### A Practical Example of Market Impact:
Imagine an asset trading at a current mid-market price of $100. A trader decides to place a market buy order worth $100,000.
Looking at the ask side of the order book, the available liquidity appears as follows:
- Level 1: $100.00 — $20,000 available
- Level 2: $100.50 — $30,000 available
- Level 3: $101.00 — $50,000 available
If the trader submits the $100,000 market buy order:
1. The first $20,000 executes at $100.00.
2. The next $30,000 sweeps through Level 2 at $100.50.
3. The remaining $50,000 fills at $101.00.
The average execution price for this trade is approximately $100.65, rather than the initial $100.00 spot price visible on the chart. The $0.65 difference represents the price impact caused by consuming all available liquidity across three distinct levels of depth.
Without reviewing market depth prior to execution, a trader might miscalculate their position size, entry cost, and risk-to-reward ratio.
---
### Visualizing Depth: The Market Depth Chart
Most trading platforms present market depth through a visual depth chart—a dual-sloped diagram with cumulative order volume on the vertical axis and price on the horizontal axis.
- **Green Slope (Bids):** Displays cumulative buy orders descending from the current market price. A steep upward slope indicates significant buying interest grouped near specific levels.
- **Red Slope (Asks):** Displays cumulative sell orders ascending from the current market price. A steep slope here indicates heavy overhead sell liquidity.
#### Identifying Support and Resistance Walls
When a massive concentration of limit orders exists at a specific price point, it creates a visual "wall" on the depth chart.
- A **Buy Wall** occurs when a large aggregate quantity of buy orders sits at a specific price. This can act as temporary support, as market sellers must exhaust that entire capital block before the price can move lower.
- A **Sell Wall** occurs when a large block of sell limit orders sits at a specific price, acting as temporary resistance.
However, interpreting depth walls requires caution, as liquidity in electronic markets is rarely static.
---
### Advanced Concepts: Deception and Phantom Liquidity
While market depth provides valuable insight, taking order book data at face value can be dangerous. Intermediate traders must recognize that visible depth does not always equal guaranteed liquidity.
#### 1. Order Spoofing
Spoofing is a manipulative tactic where traders (often high-frequency algorithms) place large limit orders without the intention of executing them. A large buy wall might be placed just below the current price to create an illusion of strong support, encouraging other market participants to buy. Once the price ticks upward, the large buy order is canceled instantly before it can be filled.
#### 2. Iceberg Orders
Institutional participants wishing to buy or sell large allocations without altering market behavior often use iceberg orders. An iceberg order splits a massive trade into small visible tranches while keeping the remainder hidden. A level might appear to have only a small amount of volume available, but as market orders consume it, the balance automatically replenishes.
#### 3. Algorithmic Cancellation
In modern electronic markets, a significant percentage of visible limit orders are managed by automated market-making algorithms. During periods of sharp market volatility, these algorithms may cancel their quotes simultaneously to limit their own risk. As a result, market depth can evaporate precisely when liquidity is needed most—a phenomenon known as liquidity illusion.
---
### How Intermediate Traders Can Utilize Market Depth
Integrating market depth into a trading framework involves combining qualitative observation with risk controls:
1. **Optimizing Order Types:** For large trades relative to an asset's average daily volume, utilizing limit orders, algorithmic execution (such as Time-Weighted Average Price), or OTC channels can prevent costly slippage.
2. **Evaluating Market Resilience:** Observing how fast the order book replenishes after a large market order sweeps through levels provides insight into real institutional demand. Rapid replenishment suggests strong underlying liquidity.
3. **Refining Stop-Loss Placement:** Placing stop-loss orders directly behind major, genuine liquidity walls can reduce the likelihood of getting caught in transient price spikes, provided the wall represents true resting interest.
---
### Limitations of Market Depth Analysis
While market depth offers essential clarity, it has structural limitations that traders must consider:
- **Off-Chain and Multi-Venue Fragmentation:** Liquidity in digital assets is fragmented across numerous centralized exchanges, decentralized pools, and off-exchange market makers. Looking at the order book of a single exchange provides only a partial view of global liquidity.
- **Latency:** High-frequency traders operate at microsecond speeds. By the time a manual trader observes a depth visual on a standard interface, the underlying book state may have already changed.
- **Derivatives vs. Spot Dynamics:** Spot market depth does not show positioning in perpetual futures, options, or debt markets, which frequently drive spot price direction through arbitrage engines.
---
### Final Thoughts
Market depth transforms an abstract price line into a transparent ecosystem of supply and demand. By understanding how limit and market orders interact, calculating potential price impact, and remaining aware of structural pitfalls like phantom liquidity, traders move away from superficial technical analysis toward a clearer understanding of market microstructures.
Rather than treating price as an isolated metric, viewing price as the clearing point of a dynamic, continuously shifting order book builds a far more resilient foundation for navigating digital asset markets.
#CryptoEducation #MarketDepth #TradingBasics
Demystifying Market Depth: How to Read Liquidity Beyond the Price Chart
When observing a digital asset's price chart, most market participants focus on line graphs or candlestick patterns. These visual tools display historic price action—where the price has been over specific intervals. However, historical prices alone do not reveal how easily an asset can move next, nor do they show how much capital is required to shift the current market price up or down.
To understand the mechanics of price movement, traders must look beyond past transaction prices and examine market depth. Market depth offers a real-time window into institutional and retail interest, market liquidity, and potential execution costs. For intermediate traders looking to refine their execution strategies and risk management, mastering market depth is an essential step.
---
### What Is Market Depth?
At its core, market depth refers to a market’s capacity to sustain relatively large market orders without significantly impacting the asset's price. It is directly tied to the exchange's order book, which compiles all active, unexecuted limit orders submitted by market participants.
An order book consists of two main sides:
1. **The Bid Side (Buyers):** Represents participants offering to buy an asset at specific prices below the current market price.
2. **The Ask or Offer Side (Sellers):** Represents participants offering to sell an asset at specific prices above the current market price.
Market depth visualizes the cumulative volume of these bid and ask limit orders across various price levels. A "deep" market possesses a thick layer of limit orders on both sides of the book, absorbing large buying or selling pressure with minimal price fluctuation. Conversely, a "thin" market has sparse limit orders, meaning even modest trade sizes can cause dramatic price swings.
---
### The Architecture of the Order Book
To interpret depth accurately, it helps to understand how the order matching engine functions.
When a trader places a **limit order**, they specify the maximum price they are willing to pay (for a buy) or the minimum price they are willing to accept (for a sell). These orders sit in the order book, creating liquidity. They are non-executed promises waiting for a counterparty.
When a trader places a **market order**, they request an immediate execution at the best available current price. Market orders consume liquidity by matching against existing limit orders in the book.
The difference between the highest bid price and the lowest ask price is known as the **bid-ask spread**.
- In highly liquid environments, this spread is extremely tight (often fractions of a cent or a single basis point).
- In illiquid environments, the spread widens, increasing the cost of immediate entry and exit for market participants.
---
### Understanding Slippage and Price Impact
One of the most practical applications of market depth analysis is calculating and predicting **slippage**. Slippage occurs when a market order executes at a different price than expected due to insufficient depth at the top of the order book.
#### A Practical Example of Market Impact:
Imagine an asset trading at a current mid-market price of $100. A trader decides to place a market buy order worth $100,000.
Looking at the ask side of the order book, the available liquidity appears as follows:
- Level 1: $100.00 — $20,000 available
- Level 2: $100.50 — $30,000 available
- Level 3: $101.00 — $50,000 available
If the trader submits the $100,000 market buy order:
1. The first $20,000 executes at $100.00.
2. The next $30,000 sweeps through Level 2 at $100.50.
3. The remaining $50,000 fills at $101.00.
The average execution price for this trade is approximately $100.65, rather than the initial $100.00 spot price visible on the chart. The $0.65 difference represents the price impact caused by consuming all available liquidity across three distinct levels of depth.
Without reviewing market depth prior to execution, a trader might miscalculate their position size, entry cost, and risk-to-reward ratio.
---
### Visualizing Depth: The Market Depth Chart
Most trading platforms present market depth through a visual depth chart—a dual-sloped diagram with cumulative order volume on the vertical axis and price on the horizontal axis.
- **Green Slope (Bids):** Displays cumulative buy orders descending from the current market price. A steep upward slope indicates significant buying interest grouped near specific levels.
- **Red Slope (Asks):** Displays cumulative sell orders ascending from the current market price. A steep slope here indicates heavy overhead sell liquidity.
#### Identifying Support and Resistance Walls
When a massive concentration of limit orders exists at a specific price point, it creates a visual "wall" on the depth chart.
- A **Buy Wall** occurs when a large aggregate quantity of buy orders sits at a specific price. This can act as temporary support, as market sellers must exhaust that entire capital block before the price can move lower.
- A **Sell Wall** occurs when a large block of sell limit orders sits at a specific price, acting as temporary resistance.
However, interpreting depth walls requires caution, as liquidity in electronic markets is rarely static.
---
### Advanced Concepts: Deception and Phantom Liquidity
While market depth provides valuable insight, taking order book data at face value can be dangerous. Intermediate traders must recognize that visible depth does not always equal guaranteed liquidity.
#### 1. Order Spoofing
Spoofing is a manipulative tactic where traders (often high-frequency algorithms) place large limit orders without the intention of executing them. A large buy wall might be placed just below the current price to create an illusion of strong support, encouraging other market participants to buy. Once the price ticks upward, the large buy order is canceled instantly before it can be filled.
#### 2. Iceberg Orders
Institutional participants wishing to buy or sell large allocations without altering market behavior often use iceberg orders. An iceberg order splits a massive trade into small visible tranches while keeping the remainder hidden. A level might appear to have only a small amount of volume available, but as market orders consume it, the balance automatically replenishes.
#### 3. Algorithmic Cancellation
In modern electronic markets, a significant percentage of visible limit orders are managed by automated market-making algorithms. During periods of sharp market volatility, these algorithms may cancel their quotes simultaneously to limit their own risk. As a result, market depth can evaporate precisely when liquidity is needed most—a phenomenon known as liquidity illusion.
---
### How Intermediate Traders Can Utilize Market Depth
Integrating market depth into a trading framework involves combining qualitative observation with risk controls:
1. **Optimizing Order Types:** For large trades relative to an asset's average daily volume, utilizing limit orders, algorithmic execution (such as Time-Weighted Average Price), or OTC channels can prevent costly slippage.
2. **Evaluating Market Resilience:** Observing how fast the order book replenishes after a large market order sweeps through levels provides insight into real institutional demand. Rapid replenishment suggests strong underlying liquidity.
3. **Refining Stop-Loss Placement:** Placing stop-loss orders directly behind major, genuine liquidity walls can reduce the likelihood of getting caught in transient price spikes, provided the wall represents true resting interest.
---
### Limitations of Market Depth Analysis
While market depth offers essential clarity, it has structural limitations that traders must consider:
- **Off-Chain and Multi-Venue Fragmentation:** Liquidity in digital assets is fragmented across numerous centralized exchanges, decentralized pools, and off-exchange market makers. Looking at the order book of a single exchange provides only a partial view of global liquidity.
- **Latency:** High-frequency traders operate at microsecond speeds. By the time a manual trader observes a depth visual on a standard interface, the underlying book state may have already changed.
- **Derivatives vs. Spot Dynamics:** Spot market depth does not show positioning in perpetual futures, options, or debt markets, which frequently drive spot price direction through arbitrage engines.
---
### Final Thoughts
Market depth transforms an abstract price line into a transparent ecosystem of supply and demand. By understanding how limit and market orders interact, calculating potential price impact, and remaining aware of structural pitfalls like phantom liquidity, traders move away from superficial technical analysis toward a clearer understanding of market microstructures.
Rather than treating price as an isolated metric, viewing price as the clearing point of a dynamic, continuously shifting order book builds a far more resilient foundation for navigating digital asset markets.
#CryptoEducation #MarketDepth #TradingBasics
To understand the mechanics of price movement, traders must look beyond past transaction prices and examine market depth. Market depth offers a real-time window into institutional and retail interest, market liquidity, and potential execution costs. For intermediate traders looking to refine their execution strategies and risk management, mastering market depth is an essential step.
---
### What Is Market Depth?
At its core, market depth refers to a market’s capacity to sustain relatively large market orders without significantly impacting the asset's price. It is directly tied to the exchange's order book, which compiles all active, unexecuted limit orders submitted by market participants.
An order book consists of two main sides:
1. **The Bid Side (Buyers):** Represents participants offering to buy an asset at specific prices below the current market price.
2. **The Ask or Offer Side (Sellers):** Represents participants offering to sell an asset at specific prices above the current market price.
Market depth visualizes the cumulative volume of these bid and ask limit orders across various price levels. A "deep" market possesses a thick layer of limit orders on both sides of the book, absorbing large buying or selling pressure with minimal price fluctuation. Conversely, a "thin" market has sparse limit orders, meaning even modest trade sizes can cause dramatic price swings.
---
### The Architecture of the Order Book
To interpret depth accurately, it helps to understand how the order matching engine functions.
When a trader places a **limit order**, they specify the maximum price they are willing to pay (for a buy) or the minimum price they are willing to accept (for a sell). These orders sit in the order book, creating liquidity. They are non-executed promises waiting for a counterparty.
When a trader places a **market order**, they request an immediate execution at the best available current price. Market orders consume liquidity by matching against existing limit orders in the book.
The difference between the highest bid price and the lowest ask price is known as the **bid-ask spread**.
- In highly liquid environments, this spread is extremely tight (often fractions of a cent or a single basis point).
- In illiquid environments, the spread widens, increasing the cost of immediate entry and exit for market participants.
---
### Understanding Slippage and Price Impact
One of the most practical applications of market depth analysis is calculating and predicting **slippage**. Slippage occurs when a market order executes at a different price than expected due to insufficient depth at the top of the order book.
#### A Practical Example of Market Impact:
Imagine an asset trading at a current mid-market price of $100. A trader decides to place a market buy order worth $100,000.
Looking at the ask side of the order book, the available liquidity appears as follows:
- Level 1: $100.00 — $20,000 available
- Level 2: $100.50 — $30,000 available
- Level 3: $101.00 — $50,000 available
If the trader submits the $100,000 market buy order:
1. The first $20,000 executes at $100.00.
2. The next $30,000 sweeps through Level 2 at $100.50.
3. The remaining $50,000 fills at $101.00.
The average execution price for this trade is approximately $100.65, rather than the initial $100.00 spot price visible on the chart. The $0.65 difference represents the price impact caused by consuming all available liquidity across three distinct levels of depth.
Without reviewing market depth prior to execution, a trader might miscalculate their position size, entry cost, and risk-to-reward ratio.
---
### Visualizing Depth: The Market Depth Chart
Most trading platforms present market depth through a visual depth chart—a dual-sloped diagram with cumulative order volume on the vertical axis and price on the horizontal axis.
- **Green Slope (Bids):** Displays cumulative buy orders descending from the current market price. A steep upward slope indicates significant buying interest grouped near specific levels.
- **Red Slope (Asks):** Displays cumulative sell orders ascending from the current market price. A steep slope here indicates heavy overhead sell liquidity.
#### Identifying Support and Resistance Walls
When a massive concentration of limit orders exists at a specific price point, it creates a visual "wall" on the depth chart.
- A **Buy Wall** occurs when a large aggregate quantity of buy orders sits at a specific price. This can act as temporary support, as market sellers must exhaust that entire capital block before the price can move lower.
- A **Sell Wall** occurs when a large block of sell limit orders sits at a specific price, acting as temporary resistance.
However, interpreting depth walls requires caution, as liquidity in electronic markets is rarely static.
---
### Advanced Concepts: Deception and Phantom Liquidity
While market depth provides valuable insight, taking order book data at face value can be dangerous. Intermediate traders must recognize that visible depth does not always equal guaranteed liquidity.
#### 1. Order Spoofing
Spoofing is a manipulative tactic where traders (often high-frequency algorithms) place large limit orders without the intention of executing them. A large buy wall might be placed just below the current price to create an illusion of strong support, encouraging other market participants to buy. Once the price ticks upward, the large buy order is canceled instantly before it can be filled.
#### 2. Iceberg Orders
Institutional participants wishing to buy or sell large allocations without altering market behavior often use iceberg orders. An iceberg order splits a massive trade into small visible tranches while keeping the remainder hidden. A level might appear to have only a small amount of volume available, but as market orders consume it, the balance automatically replenishes.
#### 3. Algorithmic Cancellation
In modern electronic markets, a significant percentage of visible limit orders are managed by automated market-making algorithms. During periods of sharp market volatility, these algorithms may cancel their quotes simultaneously to limit their own risk. As a result, market depth can evaporate precisely when liquidity is needed most—a phenomenon known as liquidity illusion.
---
### How Intermediate Traders Can Utilize Market Depth
Integrating market depth into a trading framework involves combining qualitative observation with risk controls:
1. **Optimizing Order Types:** For large trades relative to an asset's average daily volume, utilizing limit orders, algorithmic execution (such as Time-Weighted Average Price), or OTC channels can prevent costly slippage.
2. **Evaluating Market Resilience:** Observing how fast the order book replenishes after a large market order sweeps through levels provides insight into real institutional demand. Rapid replenishment suggests strong underlying liquidity.
3. **Refining Stop-Loss Placement:** Placing stop-loss orders directly behind major, genuine liquidity walls can reduce the likelihood of getting caught in transient price spikes, provided the wall represents true resting interest.
---
### Limitations of Market Depth Analysis
While market depth offers essential clarity, it has structural limitations that traders must consider:
- **Off-Chain and Multi-Venue Fragmentation:** Liquidity in digital assets is fragmented across numerous centralized exchanges, decentralized pools, and off-exchange market makers. Looking at the order book of a single exchange provides only a partial view of global liquidity.
- **Latency:** High-frequency traders operate at microsecond speeds. By the time a manual trader observes a depth visual on a standard interface, the underlying book state may have already changed.
- **Derivatives vs. Spot Dynamics:** Spot market depth does not show positioning in perpetual futures, options, or debt markets, which frequently drive spot price direction through arbitrage engines.
---
### Final Thoughts
Market depth transforms an abstract price line into a transparent ecosystem of supply and demand. By understanding how limit and market orders interact, calculating potential price impact, and remaining aware of structural pitfalls like phantom liquidity, traders move away from superficial technical analysis toward a clearer understanding of market microstructures.
Rather than treating price as an isolated metric, viewing price as the clearing point of a dynamic, continuously shifting order book builds a far more resilient foundation for navigating digital asset markets.
#CryptoEducation #MarketDepth #TradingBasics
63
BTC/USDT TECHNICAL CHECK - 1H
Snapshot: 2026-11-13 20:21 UTC. Latest close: $69,082.17. RSI(14): 50.1. EMA20 is below EMA50 on this snapshot. This is a momentum observation, not a standalone buy or sell signal. RSI can remain elevated or depressed during strong trends; confirm with price structure and risk management.
$BTC #Bitcoin #TechnicalAnalysis
Educational commentary only; not financial advice.
BTC/USDT TECHNICAL CHECK - 1H
Snapshot: 2026-11-13 20:21 UTC. Latest close: $69,082.17. RSI(14): 50.1. EMA20 is below EMA50 on this snapshot. This is a momentum observation, not a standalone buy or sell signal. RSI can remain elevated or depressed during strong trends; confirm with price structure and risk management.
$BTC #Bitcoin #TechnicalAnalysis
Educational commentary only; not financial advice.
Snapshot: 2026-11-13 20:21 UTC. Latest close: $69,082.17. RSI(14): 50.1. EMA20 is below EMA50 on this snapshot. This is a momentum observation, not a standalone buy or sell signal. RSI can remain elevated or depressed during strong trends; confirm with price structure and risk management.
$BTC #Bitcoin #TechnicalAnalysis
Educational commentary only; not financial advice.
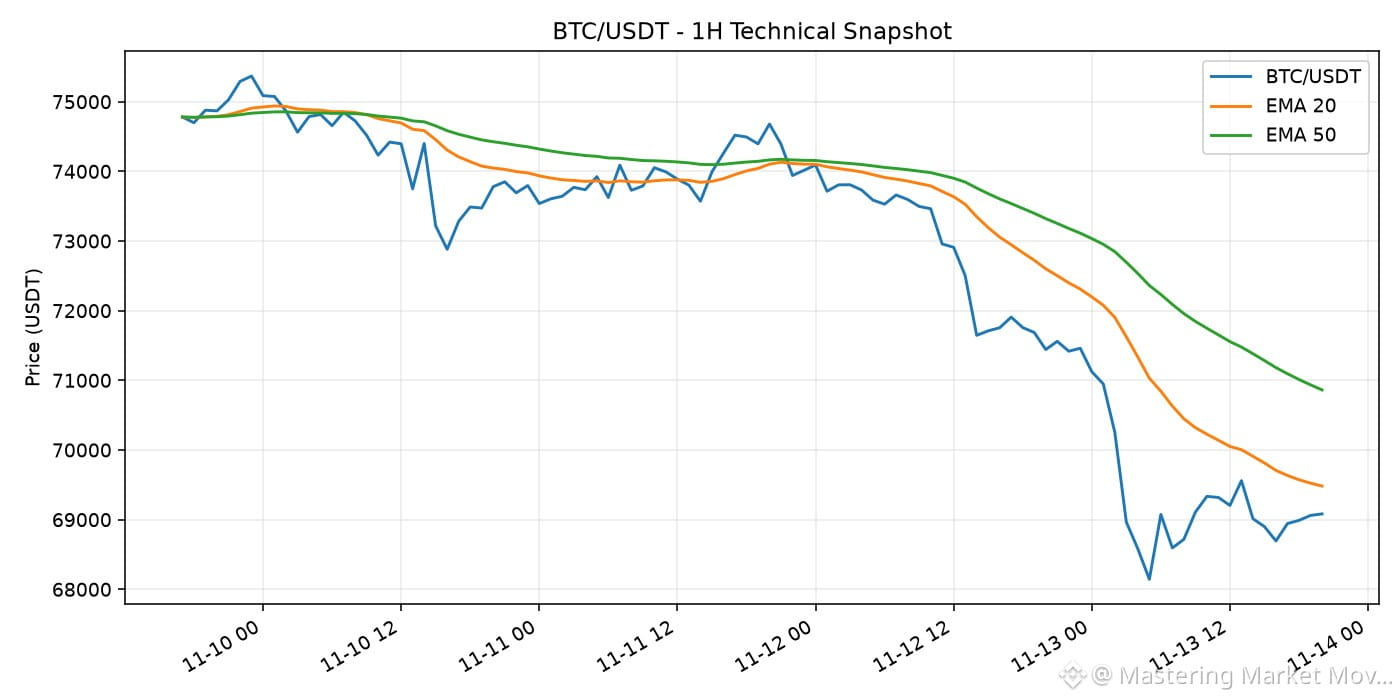
71
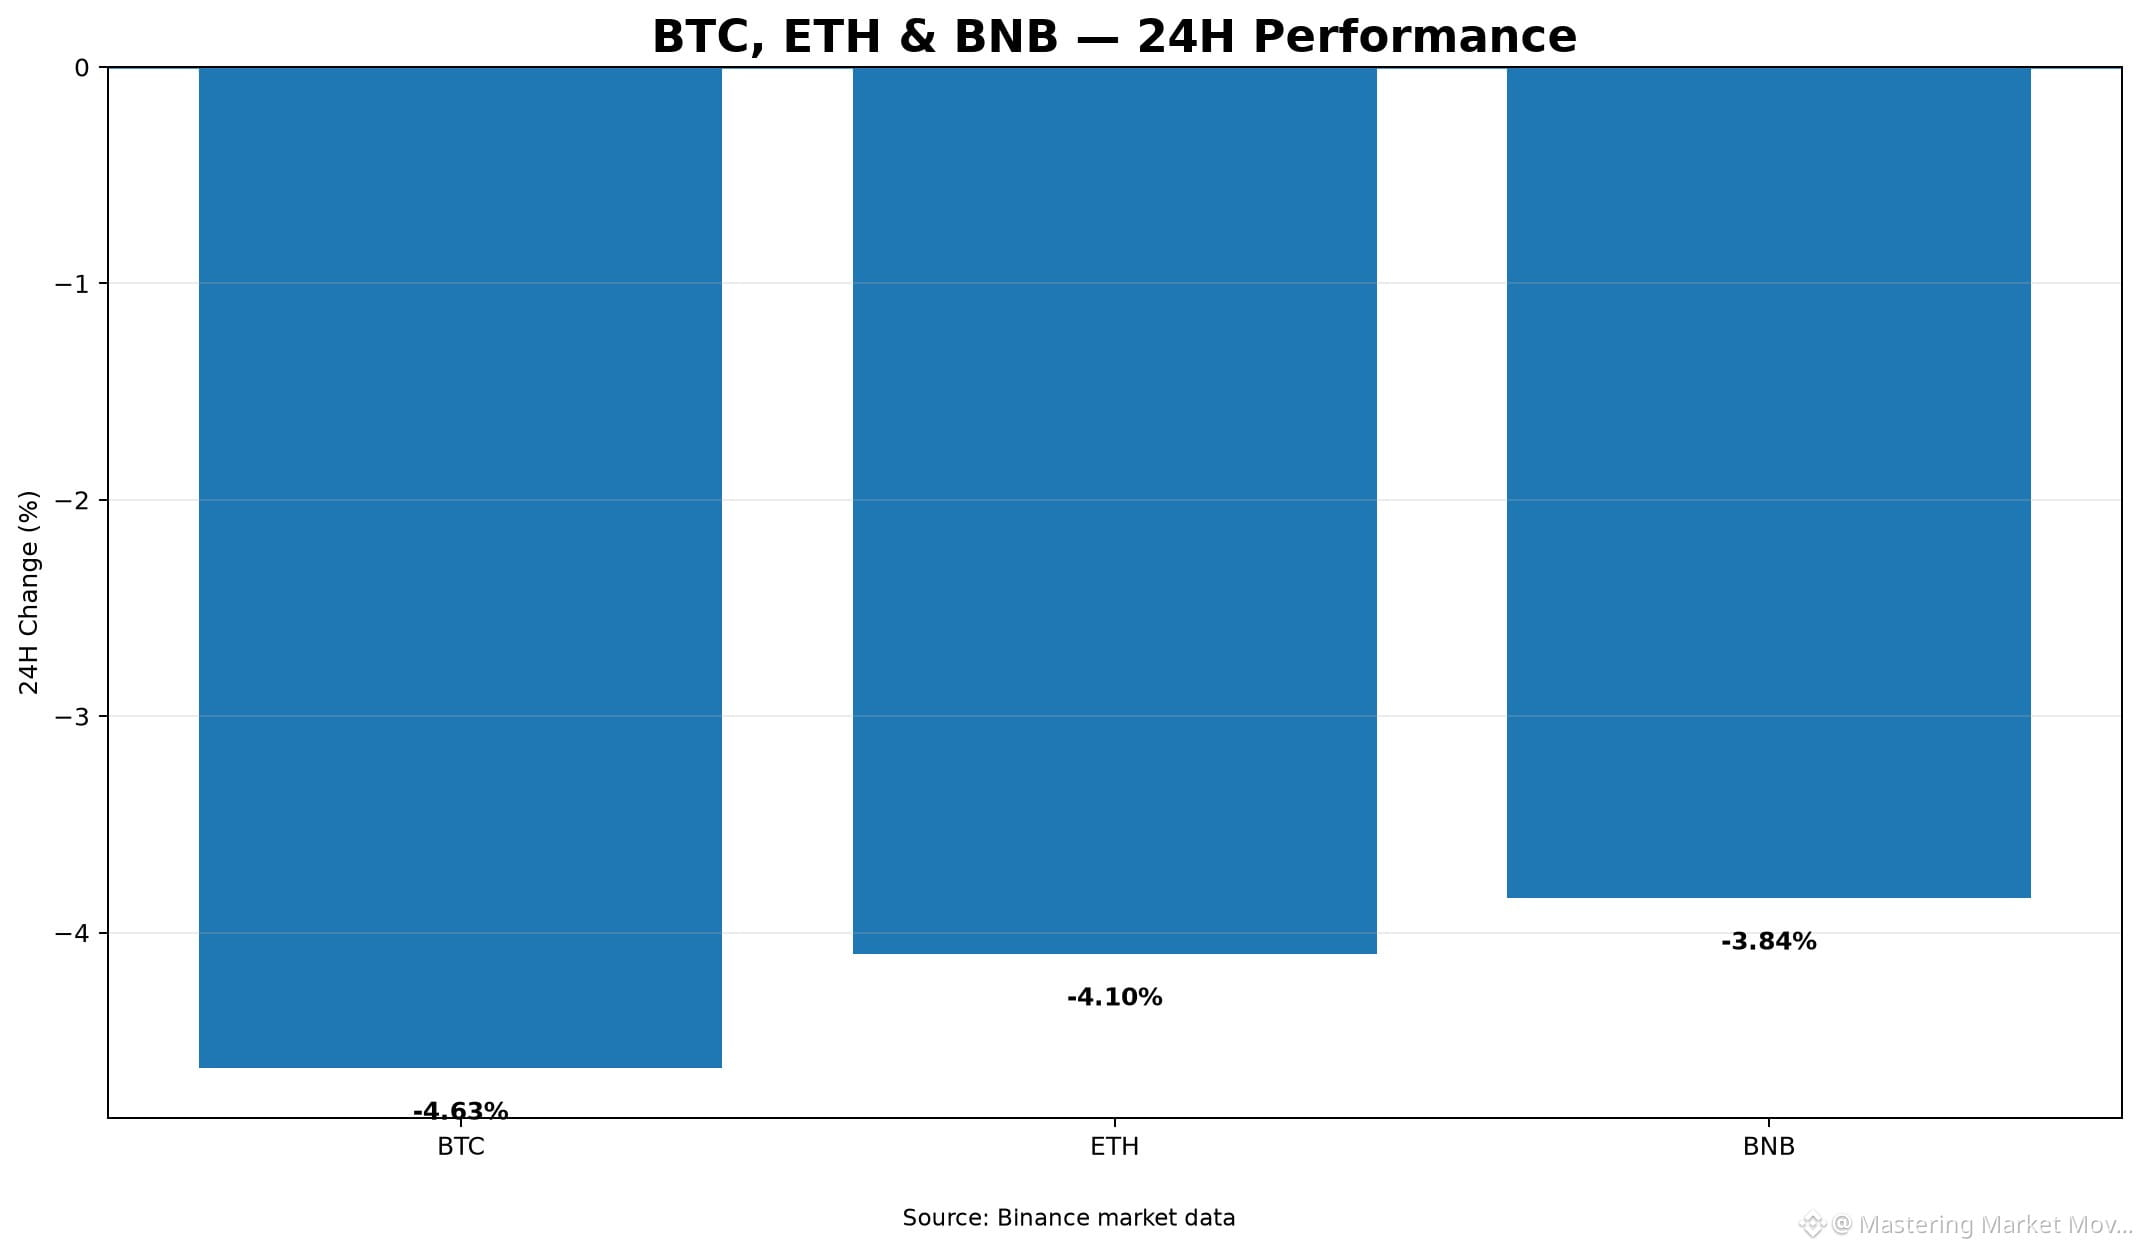
Статья
Daily Market Analysis: Top Assets Retrace Amid Increased VolatilityThe crypto market has experienced a broad pullback over the past 24 hours, with major assets facing downside pressure.
**Price Performance & Overview**
- $BTC is trading at $68,656.82, down 4.63% in the last 24 hours.
- $ETH dropped 4.10%, bringing its price to $1,930.65.
- $BNB declined by 3.84%, currently priced at $631.37.
**Volume & High/Low Ranges**
- Bitcoin moved between a 24h high of $72,076.98 and a low of $67,568.00, generating $2.04B in quote volume.
- Ethereum recorded a 24h high of $2,027.16 and a low of $1,895.95, with quote volume reaching $740.80M.
- BNB traded within a range of $622.41 to $658.65, logging a quote volume of $128.58M.
**Relative Strength & Volatility**
BNB showed slight relative strength during this dip with the lowest percentage decline (-3.84%), whereas Bitcoin saw the steepest drop (-4.63%). Intraday volatility is notably elevated, evidenced by wide intraday price spreads and robust trading volumes across all three assets.
**Market Scenarios**
- **Bullish Scenario:** A push above intraday highs ($72,076.98 for Bitcoin, $2,027.16 for Ethereum) could signal buyer strength returning to defend current levels.
- **Bearish Scenario:** If price breaks below recent 24-hour lows ($67,568.00 for Bitcoin, $1,895.95 for Ethereum), further momentum to the downside could develop.
**Risks & What to Watch**
High short-term volatility poses liquidity and slippage risks. Traders should monitor volume levels around key 24h support and resistance boundaries for signs of price stabilization.
#MarketAnalysis #CryptoMarket #BinanceSquare
Daily Market Analysis: Top Assets Retrace Amid Increased Volatility
The crypto market has experienced a broad pullback over the past 24 hours, with major assets facing downside pressure.
**Price Performance & Overview**
- $BTC is trading at $68,656.82, down 4.63% in the last 24 hours.
- $ETH dropped 4.10%, bringing its price to $1,930.65.
- $BNB declined by 3.84%, currently priced at $631.37.
**Volume & High/Low Ranges**
- Bitcoin moved between a 24h high of $72,076.98 and a low of $67,568.00, generating $2.04B in quote volume.
- Ethereum recorded a 24h high of $2,027.16 and a low of $1,895.95, with quote volume reaching $740.80M.
- BNB traded within a range of $622.41 to $658.65, logging a quote volume of $128.58M.
**Relative Strength & Volatility**
BNB showed slight relative strength during this dip with the lowest percentage decline (-3.84%), whereas Bitcoin saw the steepest drop (-4.63%). Intraday volatility is notably elevated, evidenced by wide intraday price spreads and robust trading volumes across all three assets.
**Market Scenarios**
- **Bullish Scenario:** A push above intraday highs ($72,076.98 for Bitcoin, $2,027.16 for Ethereum) could signal buyer strength returning to defend current levels.
- **Bearish Scenario:** If price breaks below recent 24-hour lows ($67,568.00 for Bitcoin, $1,895.95 for Ethereum), further momentum to the downside could develop.
**Risks & What to Watch**
High short-term volatility poses liquidity and slippage risks. Traders should monitor volume levels around key 24h support and resistance boundaries for signs of price stabilization.
#MarketAnalysis #CryptoMarket #BinanceSquare
**Price Performance & Overview**
- $BTC is trading at $68,656.82, down 4.63% in the last 24 hours.
- $ETH dropped 4.10%, bringing its price to $1,930.65.
- $BNB declined by 3.84%, currently priced at $631.37.
**Volume & High/Low Ranges**
- Bitcoin moved between a 24h high of $72,076.98 and a low of $67,568.00, generating $2.04B in quote volume.
- Ethereum recorded a 24h high of $2,027.16 and a low of $1,895.95, with quote volume reaching $740.80M.
- BNB traded within a range of $622.41 to $658.65, logging a quote volume of $128.58M.
**Relative Strength & Volatility**
BNB showed slight relative strength during this dip with the lowest percentage decline (-3.84%), whereas Bitcoin saw the steepest drop (-4.63%). Intraday volatility is notably elevated, evidenced by wide intraday price spreads and robust trading volumes across all three assets.
**Market Scenarios**
- **Bullish Scenario:** A push above intraday highs ($72,076.98 for Bitcoin, $2,027.16 for Ethereum) could signal buyer strength returning to defend current levels.
- **Bearish Scenario:** If price breaks below recent 24-hour lows ($67,568.00 for Bitcoin, $1,895.95 for Ethereum), further momentum to the downside could develop.
**Risks & What to Watch**
High short-term volatility poses liquidity and slippage risks. Traders should monitor volume levels around key 24h support and resistance boundaries for signs of price stabilization.
#MarketAnalysis #CryptoMarket #BinanceSquare
95
Crypto News Digest: FBI Recovers $1.2B Binance Funds, Bitcoin Drops Below $70KHere are the top stories in crypto today:
1. FBI Recovers Stolen Crypto
• What happened: The FBI recovered $1.2 billion in stolen cryptocurrency belonging to Binance.
• Why it matters: Marks one of the largest digital asset recoveries by law enforcement to date.
• Source: CBS News
2. Market Slide Triggers Mass Liquidations
• What happened: $BTC broke below $70,000 amid a broader market risk-off mood, leading to over $1 billion in market liquidations.
• Why it matters: Macro headwinds and tech market pullbacks continue to press crypto asset valuations lower.
• Source: Yahoo Finance / WSJ
3. Treasury Firm Sells Ether at a Loss
• What happened: Corporate treasury firm BTCS sold $ETH at a loss to protect its $64 million Aave loan from liquidation.
• Why it matters: Highlights the pressure on institutional holders managing leveraged positions during price declines.
• Source: CoinDesk
4. Legal Action Against Ethereum Foundation
• What happened: A former employee filed a lawsuit against the Ethereum Foundation alleging wrongful termination.
• Why it matters: Brings organizational and legal scrutiny to the governance of key crypto institutions.
• Source: Mashable
$BTC $ETH $BNB
#CryptoNews #Bitcoin #Ethereum
Crypto News Digest: FBI Recovers $1.2B Binance Funds, Bitcoin Drops Below $70K
Here are the top stories in crypto today:
1. FBI Recovers Stolen Crypto
• What happened: The FBI recovered $1.2 billion in stolen cryptocurrency belonging to Binance.
• Why it matters: Marks one of the largest digital asset recoveries by law enforcement to date.
• Source: CBS News
2. Market Slide Triggers Mass Liquidations
• What happened: $BTC broke below $70,000 amid a broader market risk-off mood, leading to over $1 billion in market liquidations.
• Why it matters: Macro headwinds and tech market pullbacks continue to press crypto asset valuations lower.
• Source: Yahoo Finance / WSJ
3. Treasury Firm Sells Ether at a Loss
• What happened: Corporate treasury firm BTCS sold $ETH at a loss to protect its $64 million Aave loan from liquidation.
• Why it matters: Highlights the pressure on institutional holders managing leveraged positions during price declines.
• Source: CoinDesk
4. Legal Action Against Ethereum Foundation
• What happened: A former employee filed a lawsuit against the Ethereum Foundation alleging wrongful termination.
• Why it matters: Brings organizational and legal scrutiny to the governance of key crypto institutions.
• Source: Mashable
$BTC $ETH $BNB
#CryptoNews #Bitcoin #Ethereum
1. FBI Recovers Stolen Crypto
• What happened: The FBI recovered $1.2 billion in stolen cryptocurrency belonging to Binance.
• Why it matters: Marks one of the largest digital asset recoveries by law enforcement to date.
• Source: CBS News
2. Market Slide Triggers Mass Liquidations
• What happened: $BTC broke below $70,000 amid a broader market risk-off mood, leading to over $1 billion in market liquidations.
• Why it matters: Macro headwinds and tech market pullbacks continue to press crypto asset valuations lower.
• Source: Yahoo Finance / WSJ
3. Treasury Firm Sells Ether at a Loss
• What happened: Corporate treasury firm BTCS sold $ETH at a loss to protect its $64 million Aave loan from liquidation.
• Why it matters: Highlights the pressure on institutional holders managing leveraged positions during price declines.
• Source: CoinDesk
4. Legal Action Against Ethereum Foundation
• What happened: A former employee filed a lawsuit against the Ethereum Foundation alleging wrongful termination.
• Why it matters: Brings organizational and legal scrutiny to the governance of key crypto institutions.
• Source: Mashable
$BTC $ETH $BNB
#CryptoNews #Bitcoin #Ethereum
115
Войдите, чтобы посмотреть больше материала
Присоединяйтесь к пользователям криптовалют по всему миру на Binance Square
⚡️ Получайте новейшую и полезную информацию о криптоактивах.
💬 Нам доверяет крупнейшая в мире криптобиржа.
👍 Получите достоверные аналитические данные от верифицированных создателей контента.
Эл. почта/номер телефона
В тренде
A Packed Week of Earnings and Data Tests Markets
Просмотров: 33,754
242 обсуждают
🚨🇺🇸 BIG WEEK AHEAD FOR THE MARKETS!
Markets are pricing in a Fed rate hike in December and $BTC could see some big moves next week.
Here's what's coming:
• Monday: Fed Chair Warsh speaks
• Tuesday: US Retail Sales + $NVDA earnings
• Wednesday: FOMC Minutes
• Thursday: Jobless Claims + Philly Fed Index
• Friday: Consumer Sentiment + Fed speeches
All eyes on $BTC as another important week begins.
#bitcoin
Mookie
·Лайков: 8
·Просмотров: 5k
AnthropicIPOTestsInvestorAppetiteForAI
Просмотров: 39,432
697 обсуждают
BitcoinExtendsLosingStreakToSixWeeks
Просмотров: 3,025
99 обсуждают